Abstract
Climate change is heavily altering plant distributions, posing significant challenges to conventional agricultural practices and ecological balance. Meanwhile, mixed species planting emerges as a potent strategy to enhance agricultural resilience, counteract climate change, preserve ecological balance, and provide a solution to economic instability. The MaxEnt model was used to predict the suitable area of Citrus reticulata under five climate scenarios and to explore affecting environmental factors. Litchi chinensis, Punica granatum, and Lycium chinense were selected as mixed species to analyze the spatial distribution and centroid migration trend of potentially suitable areas. The research results show the following: (1) The primary environmental factors impacting C. reticulata distribution are annual precipitation (1000–4000 mm), precipitation of driest quarter over 100 mm, and mean temperature of coldest quarter (12–28 °C). Crucially, the mixed species exhibited similar environmental sensitivities, indicating mutual mixing suitability. (2) Currently, the C. reticulata suitable area is of 240.21 × 10⁴ km2, primarily in South, East, Central, and Southwest China, with potential for expansion to 265.41 × 10⁴ km2 under the 2090s SSP1-2.6 scenario. (3) The geometric center of the moderately-to-highly suitable areas for C. reticulata is located in Hunan Province. Future scenarios show the C. reticulata’s centroid migrating northwest, with distances of less than 110 km. Mixed planting trends toward higher latitudes, fluctuating from 6 km to 210 km. (4) Mixed planting area planning: C. reticulata and L. chinensis are suitable for mixed planting in South China. C. reticulata and P. granatum, C. reticulata and L. chinense are suitable for mixed planting in most areas of Central, East, Southwest, and South China. This research presents a new perspective on using mixed design principles for ecological adaptation and the sustainable mixed planting of C. reticulata, in response to China’s changing climate. This approach is expected to help the economic fruit tree industry enhance ecological resilience and economic stability in the face of future climate change challenges.
1. Introduction
Continuing global climate change is affecting the habitats, morphological characteristics, and spatial distribution of tree species. Different species respond differently to climate change [1,2,3]. The geographical distribution of many species has shifted to higher latitudes and altitudes to avoid local or global mass extinctions [4,5]. As the climate warms, the area suitable for citrus cultivation also tends to move northwards [6]. Climate adaptive crops [7] and Climate-Smart Agriculture (CSA) [8,9] have been proposed as a means to respond to global climate change and ensure food security. The subtropics are a transitional zone between temperate and tropical climates, and subtropical climates under global climate change will undergo significant changes [10], which directly impact crop growth and horticultural development [11]. There is a famous saying in the ancient Chinese book “Yanzi Chunqiu”: “The orange grown in Huainan is an orange, but it becomes a hedge thorn in Huaibei”. Due to the different climatic conditions in Huainan and Huaibei, the oranges were caused to mutate in different environments. The role of the environment in shaping the biological characteristics of citrus is highlighted, highlighting the importance of environmental adaptation in plant growth. Our forefathers have long recognized the principle of adapting to local conditions and adopting appropriate cultivation methods and management strategies in response to changes in different environmental conditions. Against the backdrop of climate change, fruit growers are faced with the challenge of having to act ahead of time to ensure that Citrus reticulata trees come into production at the right time. At the same time, the scale of orchards is being expanded in suitable areas to improve the yield and quality of fruit trees.
At the same time, the disease-prone characteristics of C. reticulata (such as Huanglongbing, Carambola Rust, and Black Spot) have brought great troubles to fruit farmers [12,13,14]. Diseases may spread to other surrounding orchards and even other crops, affecting the balance of the entire agricultural ecosystem [13]. Chemical pesticides may be used excessively to cope with diseases, polluting the environment and upsetting the ecological balance [15,16]. According to the World Citrus Organization (https://worldcitrusorganisation.org/, accessed on 16 November 2023), China is the world’s largest producer of citrus, accounting for about 30% of the world’s annual citrus production, shouldering a rich agricultural resource and significant economic responsibility. Large-scale outbreaks of diseases can lead to a reduction in citrus production and quality. It even seriously affects local economic development, triggers social instability, and poses potential risks to the country’s ecological balance and economic security [17,18].
In addition, C. reticulata, as an important horticultural product in subtropical China, has become increasingly relevant to global climate change [19]. C. reticulata cultivation can play an active role in achieving peak carbon and carbon neutral targets and controlling global warming [20]. The Chinese government has announced initiatives to combat climate change, pegging the nation’s carbon emissions in 2030 and achieving carbon neutrality by 2060. Therefore, strengthening intergovernmental cooperation to achieve carbon neutrality, control global temperature rise [21,22], and proposing sustainable pathways under various carbon emission scenarios such as SSP1-2.6/SSP5-8.5, can benefit the production of high-quality fruits [23].
The choice of these fruit trees for mixing also takes into account their comparability in economic benefits. According to a report by the Food and Agriculture Organization of the United Nations (https://www.fao.org/, accessed on 25 November 2023), Chinese L. chinensis enjoys good prices on the international market, reaching USD 6–17 per kilogram. A report by the central government of the People’s Republic of China (https://www.gov.cn/, accessed on 25 November 2023) shows that P. granatum has now become a name card for the free trade driven by the Silk Road. P. granatum has become one of the most sought-after fruits in Xi’an, the provincial capital of Shaanxi Province in Northwest China. Countries along the Belt and Road are hoping to establish long-term partnerships with Chinese dealers. The Chinese Agricultural Product Price Survey Yearbook (2023) shows that the national agricultural product producer price index for 2022 indicates a price index of 91.85 for L. chinense and 111.33 for C. reticulata. This suggests that L. chinense and C. reticulata have similar economic benefits in the agricultural market over the same period. Therefore, mixing C. reticulata with L. chinensis, P. granatum and L. chinense can promote each other and form a complementary economic benefit.
The prediction of ecosystems using spatial distribution models (SDMs) is a hotspot for conservation in biogeography and ecological research [24,25,26]. The MaxEnt model is a machine learning model based on the maximum entropy theory. The model is based on the species distribution record data and relevant environmental factors to study the correlation between suitable habitats of species and environmental factors, and to predict the distribution probability of species in the study area by judging the ecological needs of species [27,28,29]. The MaxEnt model is widely used in ecological and agricultural research. It is known for its efficiency, accuracy, and ability to handle different types of input data [30]. The model performs well even with limited data and offers strong visualization capabilities [29]. However, its prediction results can be affected by several factors. For example, the completeness of species distribution records, insufficient spatial resolution, and improper selection of climate variables [31,32]. Currently, the MaxEnt model and GIS techniques are widely used in forest management decisions to select future tree species [33]. The MaxEnt model is indispensable for the sustainable development of forest resources as it can be used to analyze the suitable area of species based on their sample points and related environmental variables [34]. Studies on the suitable areas of C. reticulata are more mature, using species distribution modeling [6,23,35,36]. Numerous studies used species distribution models for predicting C. reticulata pests and diseases due to their severe impact [37,38,39]. Therefore, the use of the MaxEnt model to predict the suitable area for C. reticulata and other tree species has become an important process to study the mixing strategy of C. reticulata.
Mixed cultivation is not only an important way to improve the profitability of fruit farmers [40], but also a strategy for ecological adaptation [9,41]. Mixing helps to increase the profitability of fruit growers in economic terms, and also provides more flexible and diversified options in adapting to climate change. Creating stable mixed forests with synergistic plant combinations aids in diversifying agriculture, managing market volatility, and ensuring system stability for sustainable ecological gains [42]. There are many mixed forests studies [43,44]; however, no mixed design studies have been conducted on C. reticulata to improve its economic efficiency and ecological suitability.
This study aims to explore in depth the suitable growth range of C. reticulata and its influencing factors, with special attention to the potential impact of climate change on the C. reticulata industry, proposing mixed species as a forward-looking and feasible strategy. The objectives of this study are as follows: (1) To explore factors affecting the distribution of C. reticulata by studying the impact of global warming on the geographical distribution of C. reticulata, reasonably predicting the geographical distribution range of suitable habitats for C. reticulata, and providing a scientific basis for future afforestation and precise improvement in tree quality. (2) Deeply analyze the common suitable areas, migration directions of C. reticulata and Litchi chinensis, Punica granatum, Lycium chinense, and the important climate factors affecting their distribution. This may provide a reliable scientific basis for the demarcation of future mixing areas. Scientific mixed planting will help the C. reticulata industry meet climate challenges and ensure ecological adaptation and sustainable cultivation. The highlights of this article are as follows: (1) The ecological adaptability and economic sustainability of C. reticulata are explored, with Litchi chinensis, Punica granatum, and Lycium chinense identified as suitable species for mixed cultivation. (2) This article examines the impacts of future climate change on the distribution of these species and identifies the dominant factors influencing their distribution. (3) This research presents spatial and temporal patterns of potentially suitable areas for these species, providing insights into shared habitat areas and the process of centroid migration. (4) It proposes a design for the mixed cultivation area. Mixed cultivation is presented as an innovative strategy for ecological protection and economic adaptation.
2. Materials and Methods
2.1. Study Area
China is located in the east of Asia, on the west coast of the Pacific. The country is vast in territory, with a total land area of about 9.6 million km2. The vegetation and climate are diverse, with the eastern region characterized by monsoon climate, the northwest region having a temperate continental climate, and the high altitude and large area of the Qinghai–Tibet Plateau forming a unique high-cold climate. The precipitation in China shows an increasing trend from north to south and from west to east, with an average annual rainfall of 648 mm. The spatial distribution of rainfall shows a decreasing trend from the southeastern coast to the northwest inland. In the northwest region, precipitation is scarce, the climate is dry, and the temperature varies apparently, with cold winters and hot summers.
2.2. Data Collection and Screening
The distribution data of C. reticulata and L. chinensis, as well as P. granatum and L. chinense, were obtained from the data in Table 1. To avoid excessive weighting due to over-densification of data, wrong records of the geographic range of distribution points and duplicate data were excluded in ArcGIS, and finally, the number of valid geographic records of the four species was retained. We obtained 203 distribution points for C. reticulata, 62 for L. chinensis, 390 for P. granatum, and 369 for L. chinense (Figure 1). Overall, the distribution was dense in the central and southern regions and sparse in the western and northern regions.

Table 1.
Overview of data types and corresponding sources.
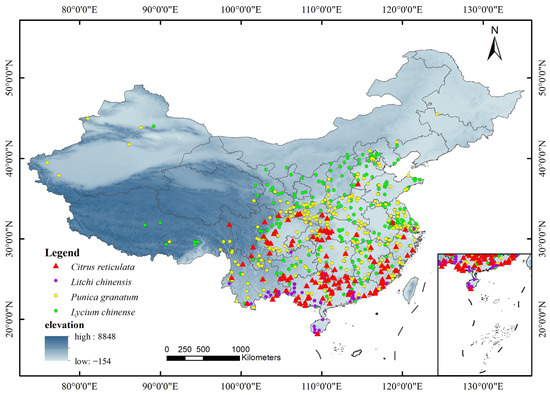
Figure 1.
Displaying the geographical distribution sample points of C. reticulata, L. chinensis, P. granatum, and L. chinense.
This study obtained data for 19 climate variables from the WorldClim database (https://worldclim.org/, accessed on 5 November 2023) (Table 2).
Table 2.
Climate environment variables.
The current climate data come from the 2.1 version (1970 to 2000) of 19 bioclimatic variables data from the World Climate Database (https://worldclim.org/, accessed on 5 November 2023), with a spatial resolution of 30″ (approximately 1 km2).
The future climate data are based on the sixth coupled model intercomparison project (CMIP6), using the historical laboratory and future shared socio-economic pathway (SSP) data simulations by the National Climatic Center’s new generation global model BCC-CSM2-MR to estimate future changes. To determine the future distribution of species under different climate trajectories, this paper adopts two different scenarios, namely SSP1-2.6 (sustainable low-development pathway) and SSP5-8.5 (fossil-fueled development pathway), to simulate the distribution of species suitability in the 2050s (2041~2060), and the 2090s (2081–2100). The data for the future under different climate scenarios have their spatial resolution resampled to 30” and raster data for the study area are extracted based on the vector boundary map of China.
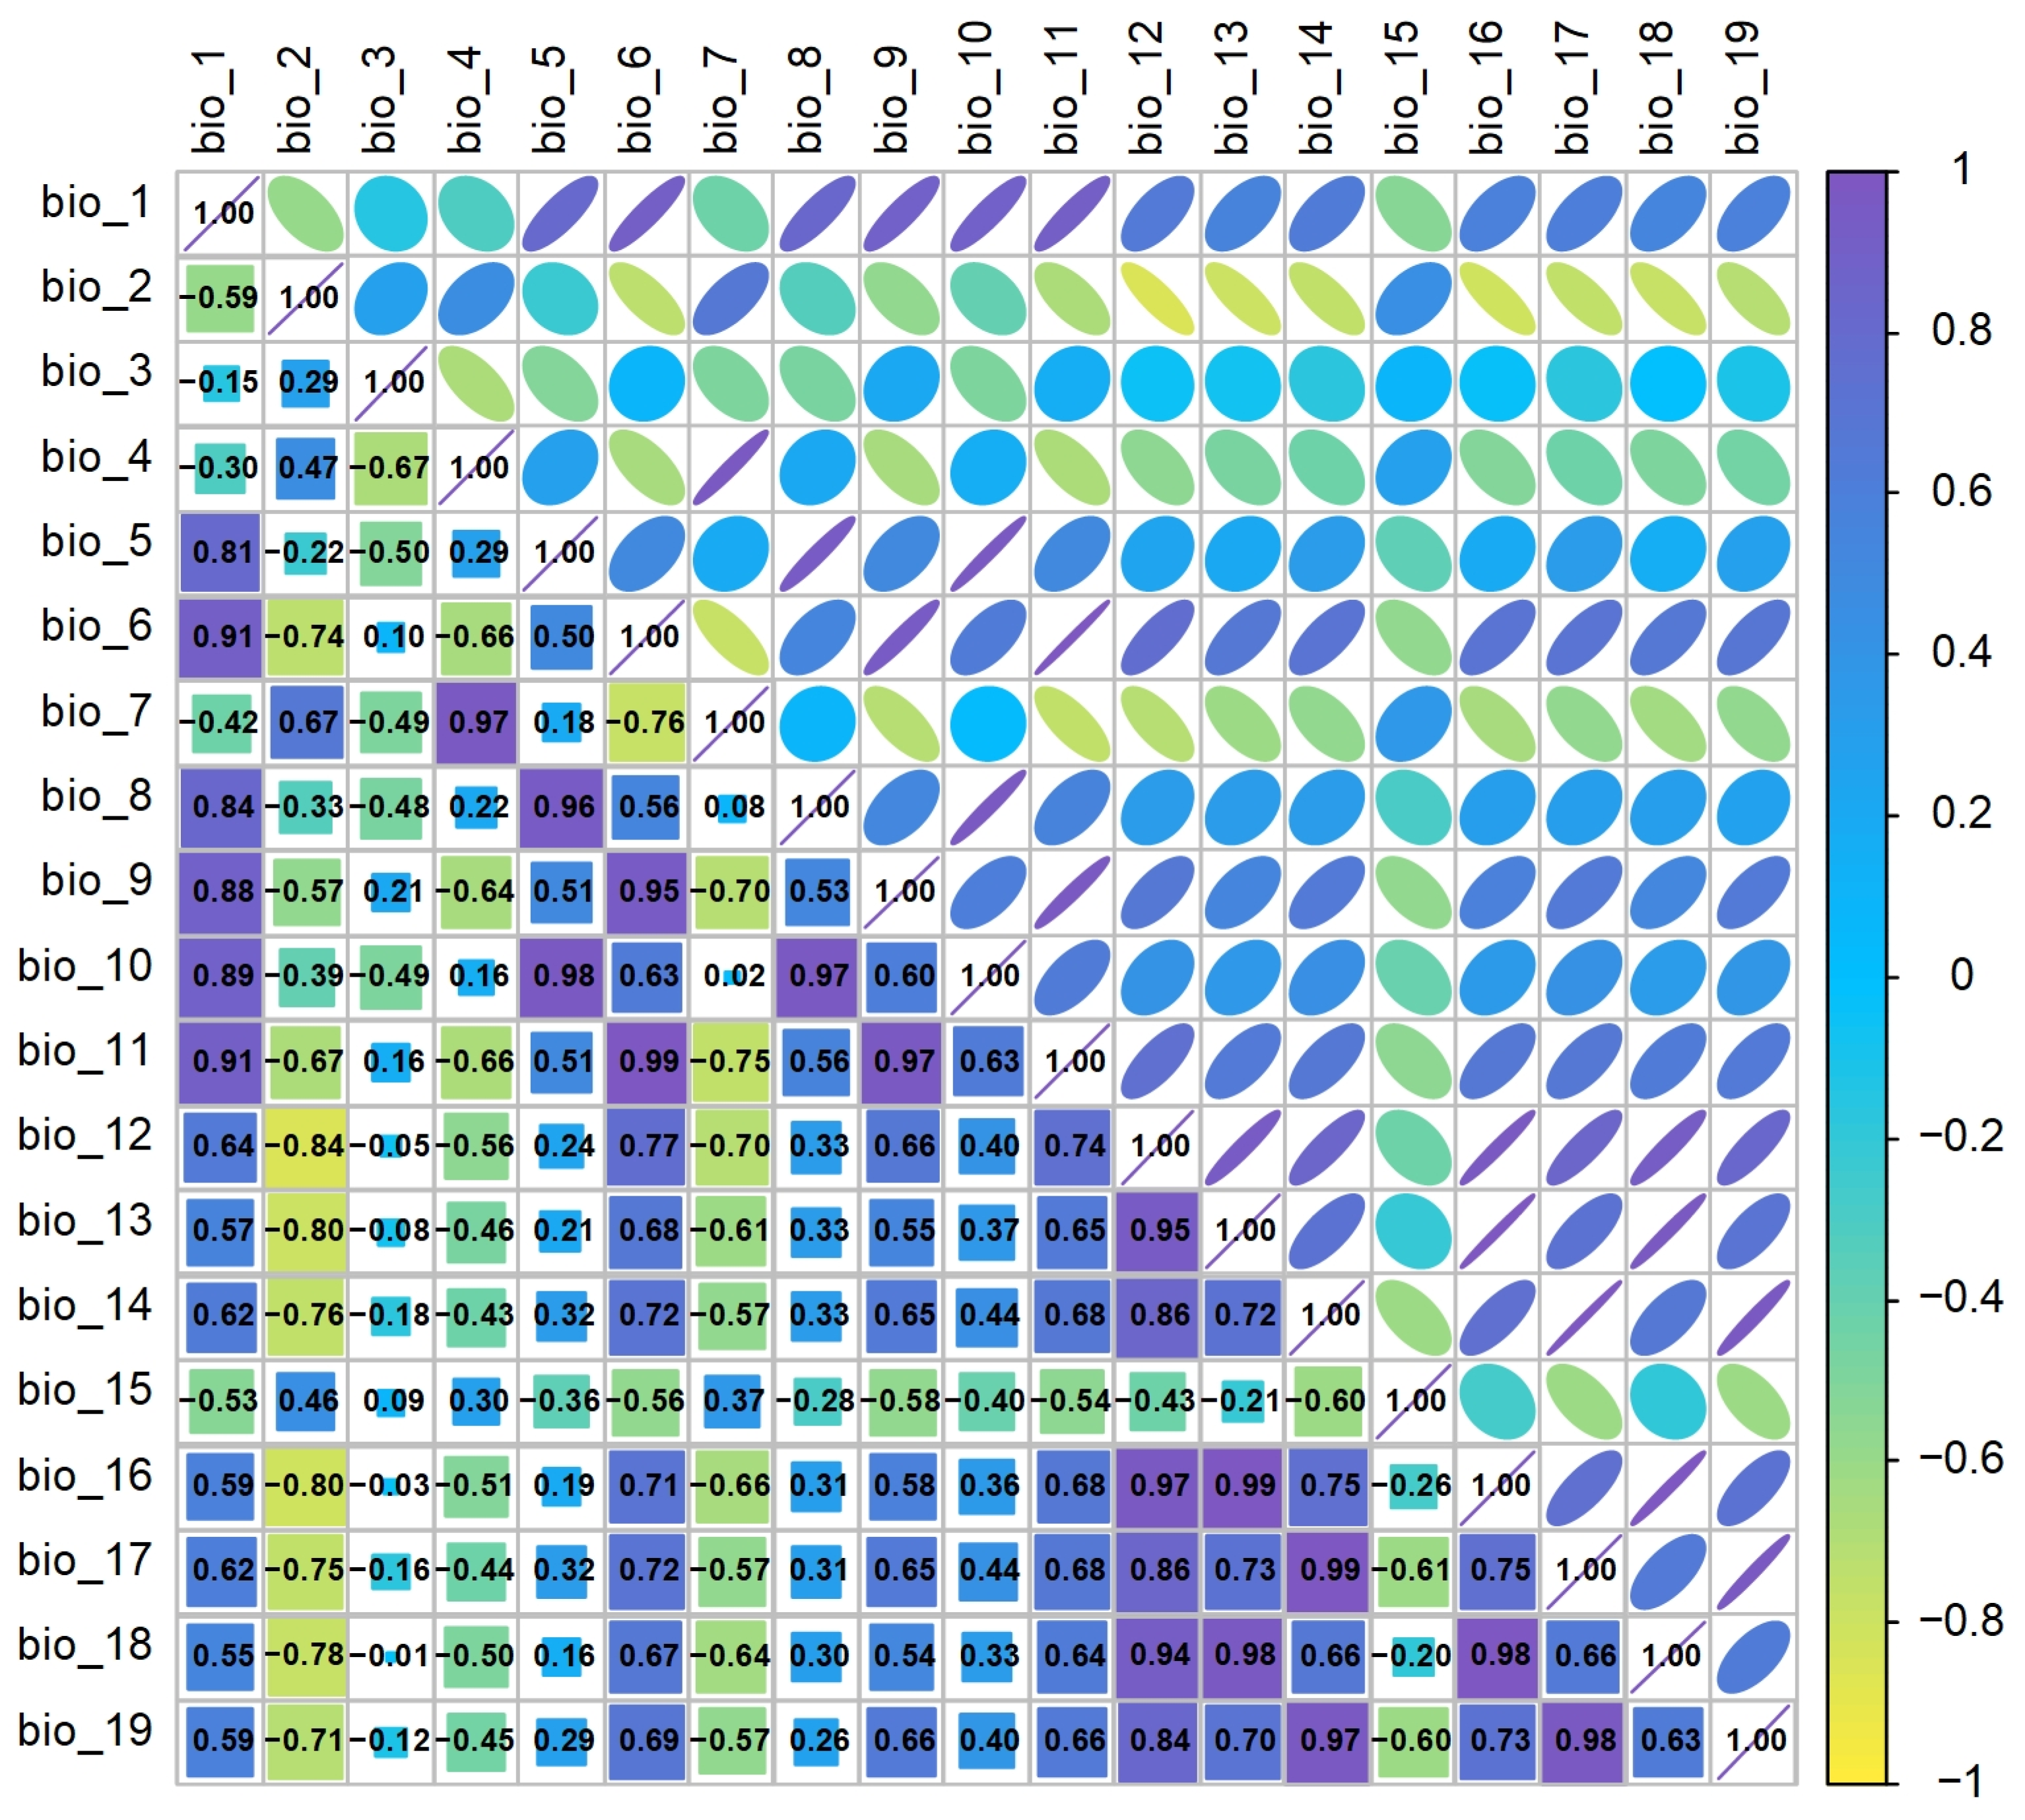
Additionally, to reduce the overfitting problem of the MaxEnt model caused by multicollinearity of climate variables, the data of 19 climate variables and the final distribution points were imported into ArcGIS 10.5 for band collection calculation, and a correlation matrix was analyzed between each factor (Figure 2). When the correlation coefficient |r| of two climate factors is ≥0.80, the principle of selecting only one of them is adopted. Finally, considering the model results of C. reticulata, L. chinensis, P. granatum, L. chinense, and actual real-world situations, 10 common climate variables were selected: bio_1, bio_3, bio_4, bio_5, bio_6, bio_8, bio_10, bio_11, bio_12, and bio_17.
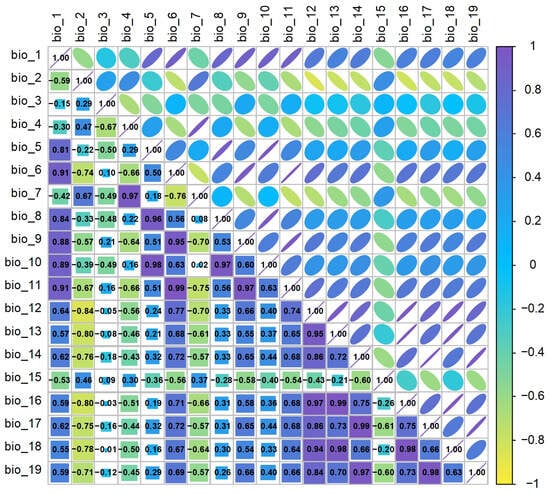
Figure 2.
Correlation analysis of climate environment variables.
2.3. Model Construction and Accuracy Evaluation
MaxEnt is one of the distribution models with the most accurate simulation results. Successful prediction of MaxEnt distribution requires the selection of accurate and appropriate sample distribution data, environmental factor data that accurately reflect the ecological characteristics of the species, and optimal model parameters [45]. The data of 10 selected environmental variables and ASCII files were input into the MaxEnt software.
During model simulation, 75% of the sample space points were selected as training data and the remaining 25% of the sample points were tested as a test dataset. The model was set for 1000 iterations, cross-validation was selected, the operation was repeated 10 times, the rest of the parameters were kept at default values, and the final output type was selected to be Logistic, which is the probability value of the existence of the distribution.
A receiver operating characteristic (ROC) curve was created by plotting sensitivity (True Positive Rate—TPR, on the vertical axis) against omission error (False Positive Rate—FPR, on the horizontal axis). Each unique threshold corresponds to a point on this curve, with the area under the ROC curve (AUC) serving as a performance metric for the MaxEnt model’s predictive power. The model performance was evaluated by the AUC that was bounded by the ROC curve, as well as the horizontal and vertical coordinate axes. An AUC in the range of 0.5–0.6 indicates very poor performance, 0.6–0.7 indicates poor performance, 0.7–0.8 suggests average performance, 0.8–0.9 denotes good performance, and 0.9–1 indicates excellent performance.
2.4. Changes in Potential Suitable Area and Centroid Migration
The suitable habitat range of different tree species can be visualized using ArcGIS software. Based on the prediction results of the MaxEnt model, the data from 10 replicates were selected, namely the threshold mean. The distribution probability (P) of different tree species was analyzed and the reclassify function was used to divide the suitable habitat of tree species. The grading criteria are as follows: high suitability range [0.66, 1), medium suitability range [0.33, 0.66), low suitability range [0.1, 0.33), and non-suitable range [0, 0.1).
Based on the moderately-to-highly suitable areas for C. reticulata, and the high suitability areas for L. chinensis, P. granatum, and L. chinense, an area overlay analysis was performed. These regions are considered suitable for mixed areas, and their common distribution areas were mapped. The mixed planting area was then calculated using the ArcGIS raster calculation tool. Similarly, the geometric center of the moderately-to-highly suitable areas for C. reticulata and the high suitability areas for L. chinensis, P. granatum, and L. chinense were determined. This geometric center was then used to simulate shifts in centroid migration under differing climate scenarios. The distance of centroid migration for C. reticulata and its mixed areas in different periods and under various climate scenarios was calculated.
2.5. Methodological Roadmap
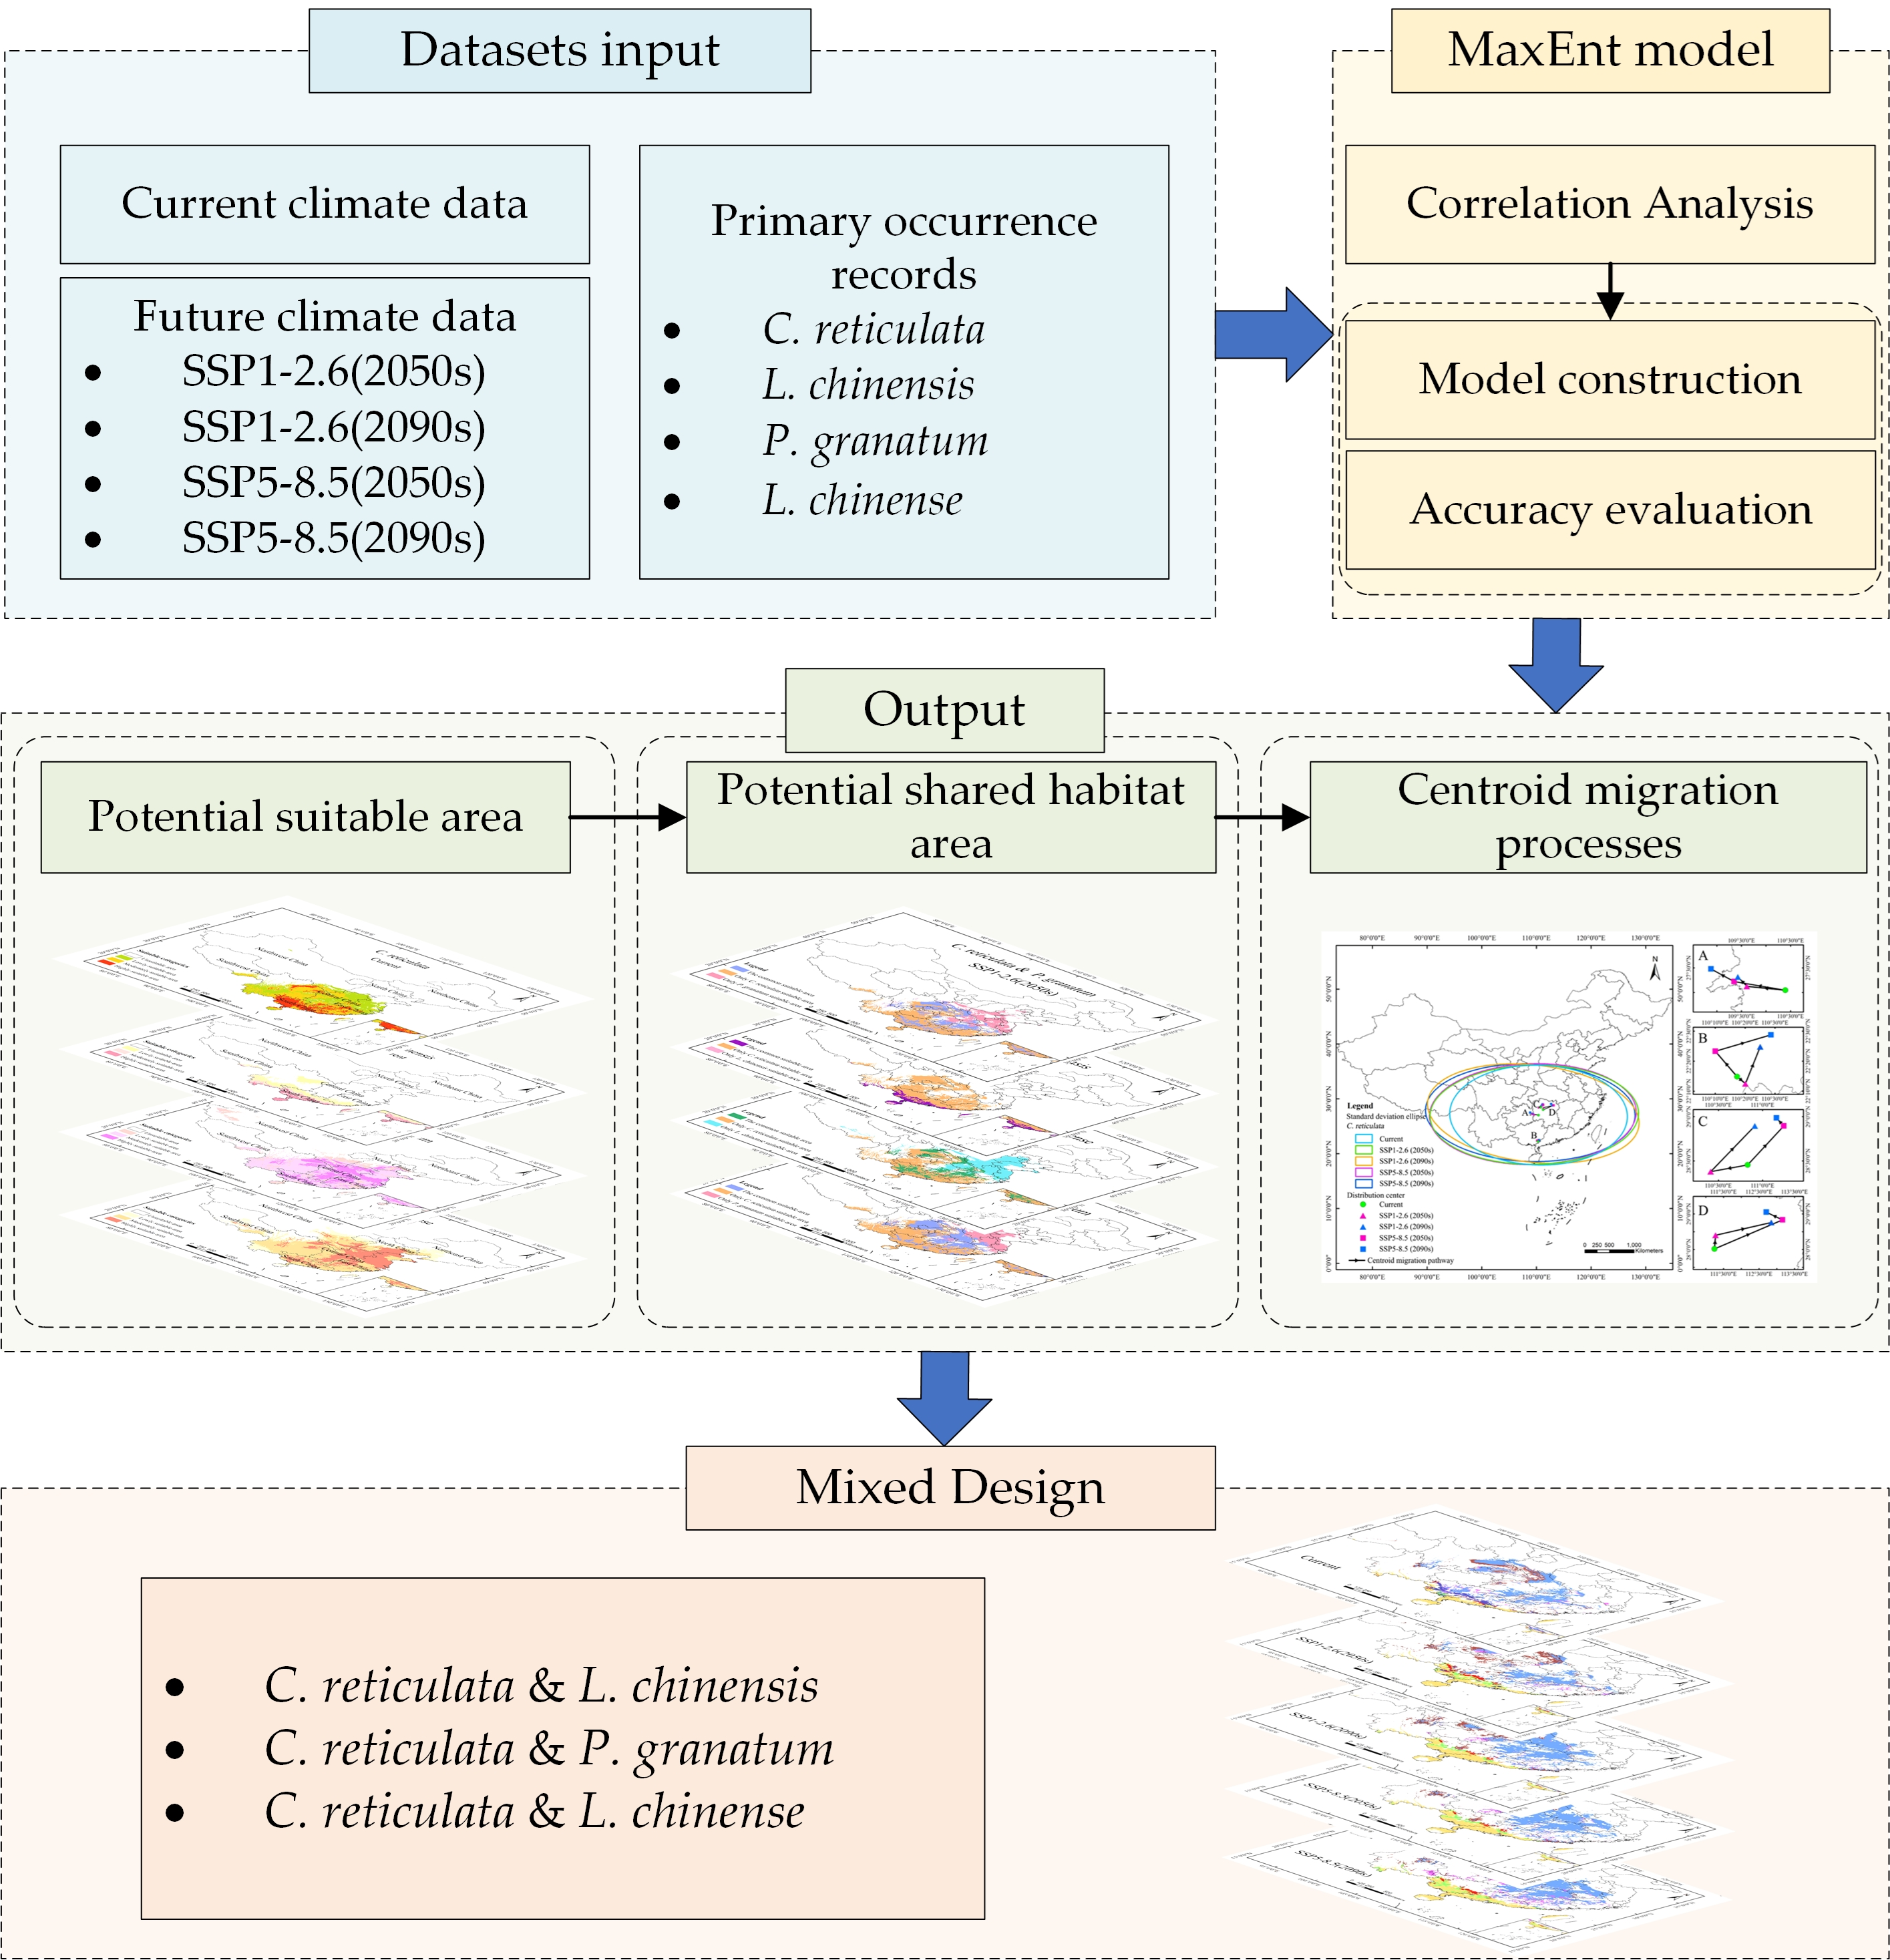
Figure 3 elaborates on the technical roadmap of this research. Firstly, input climate data and primary occurrence records of species. occurrence data were recorded. Then, a correlation analysis was conducted on the input climate data, so as to screen out the most relevant climate variables. Based on the screened variables, a MaxEnt model was built, and the accuracy of this model was assessed. The outputs of the model include potential suitable area under different climate scenarios, as well as potential shared area and the migration process of species distribution centroids. Finally, the principle of “mixed design” was introduced to plan the mixed planting of multiple species.

Figure 3.
Roadmap of methodology used in present study.
3. Results
3.1. Assessment of Model Accuracy
Table 3 shows that C. reticulata simulations resulted in a mean AUC of 0.933 for the repeated runs of the training set; the mean AUC for the test set was of 0.914. The average AUC for the training set of repeated runs of L. chinensis simulation results was of 0.973; the average AUC for the test set was of 0.969. The average AUC for the training set of repeated runs of P. granatum simulation results was of 0.892; the average AUC for the test set was of 0.894. L. chinense simulations resulted in a mean AUC of 0.870 for the repeated runs of the training set; the mean AUC for the test set was of 0.858. The average AUC of all models for the five climate scenarios was of 0.912, which is above 0.9, and the simulation results are at the “excellent” level. The results indicate that C. reticulata, L. chinensis, P. granatum, and L. chinense have good performance in predicting the potential suitability zones in China, with a high degree of fit.
Table 3.
Comparative analysis of the MaxEnt model performance: AUC metrics for both training and testing sets.
3.2. Dominant Variables Affecting the Potential Distribution of Contemporary C. reticulata, L. chinensis, P. granatum, and L. chinense
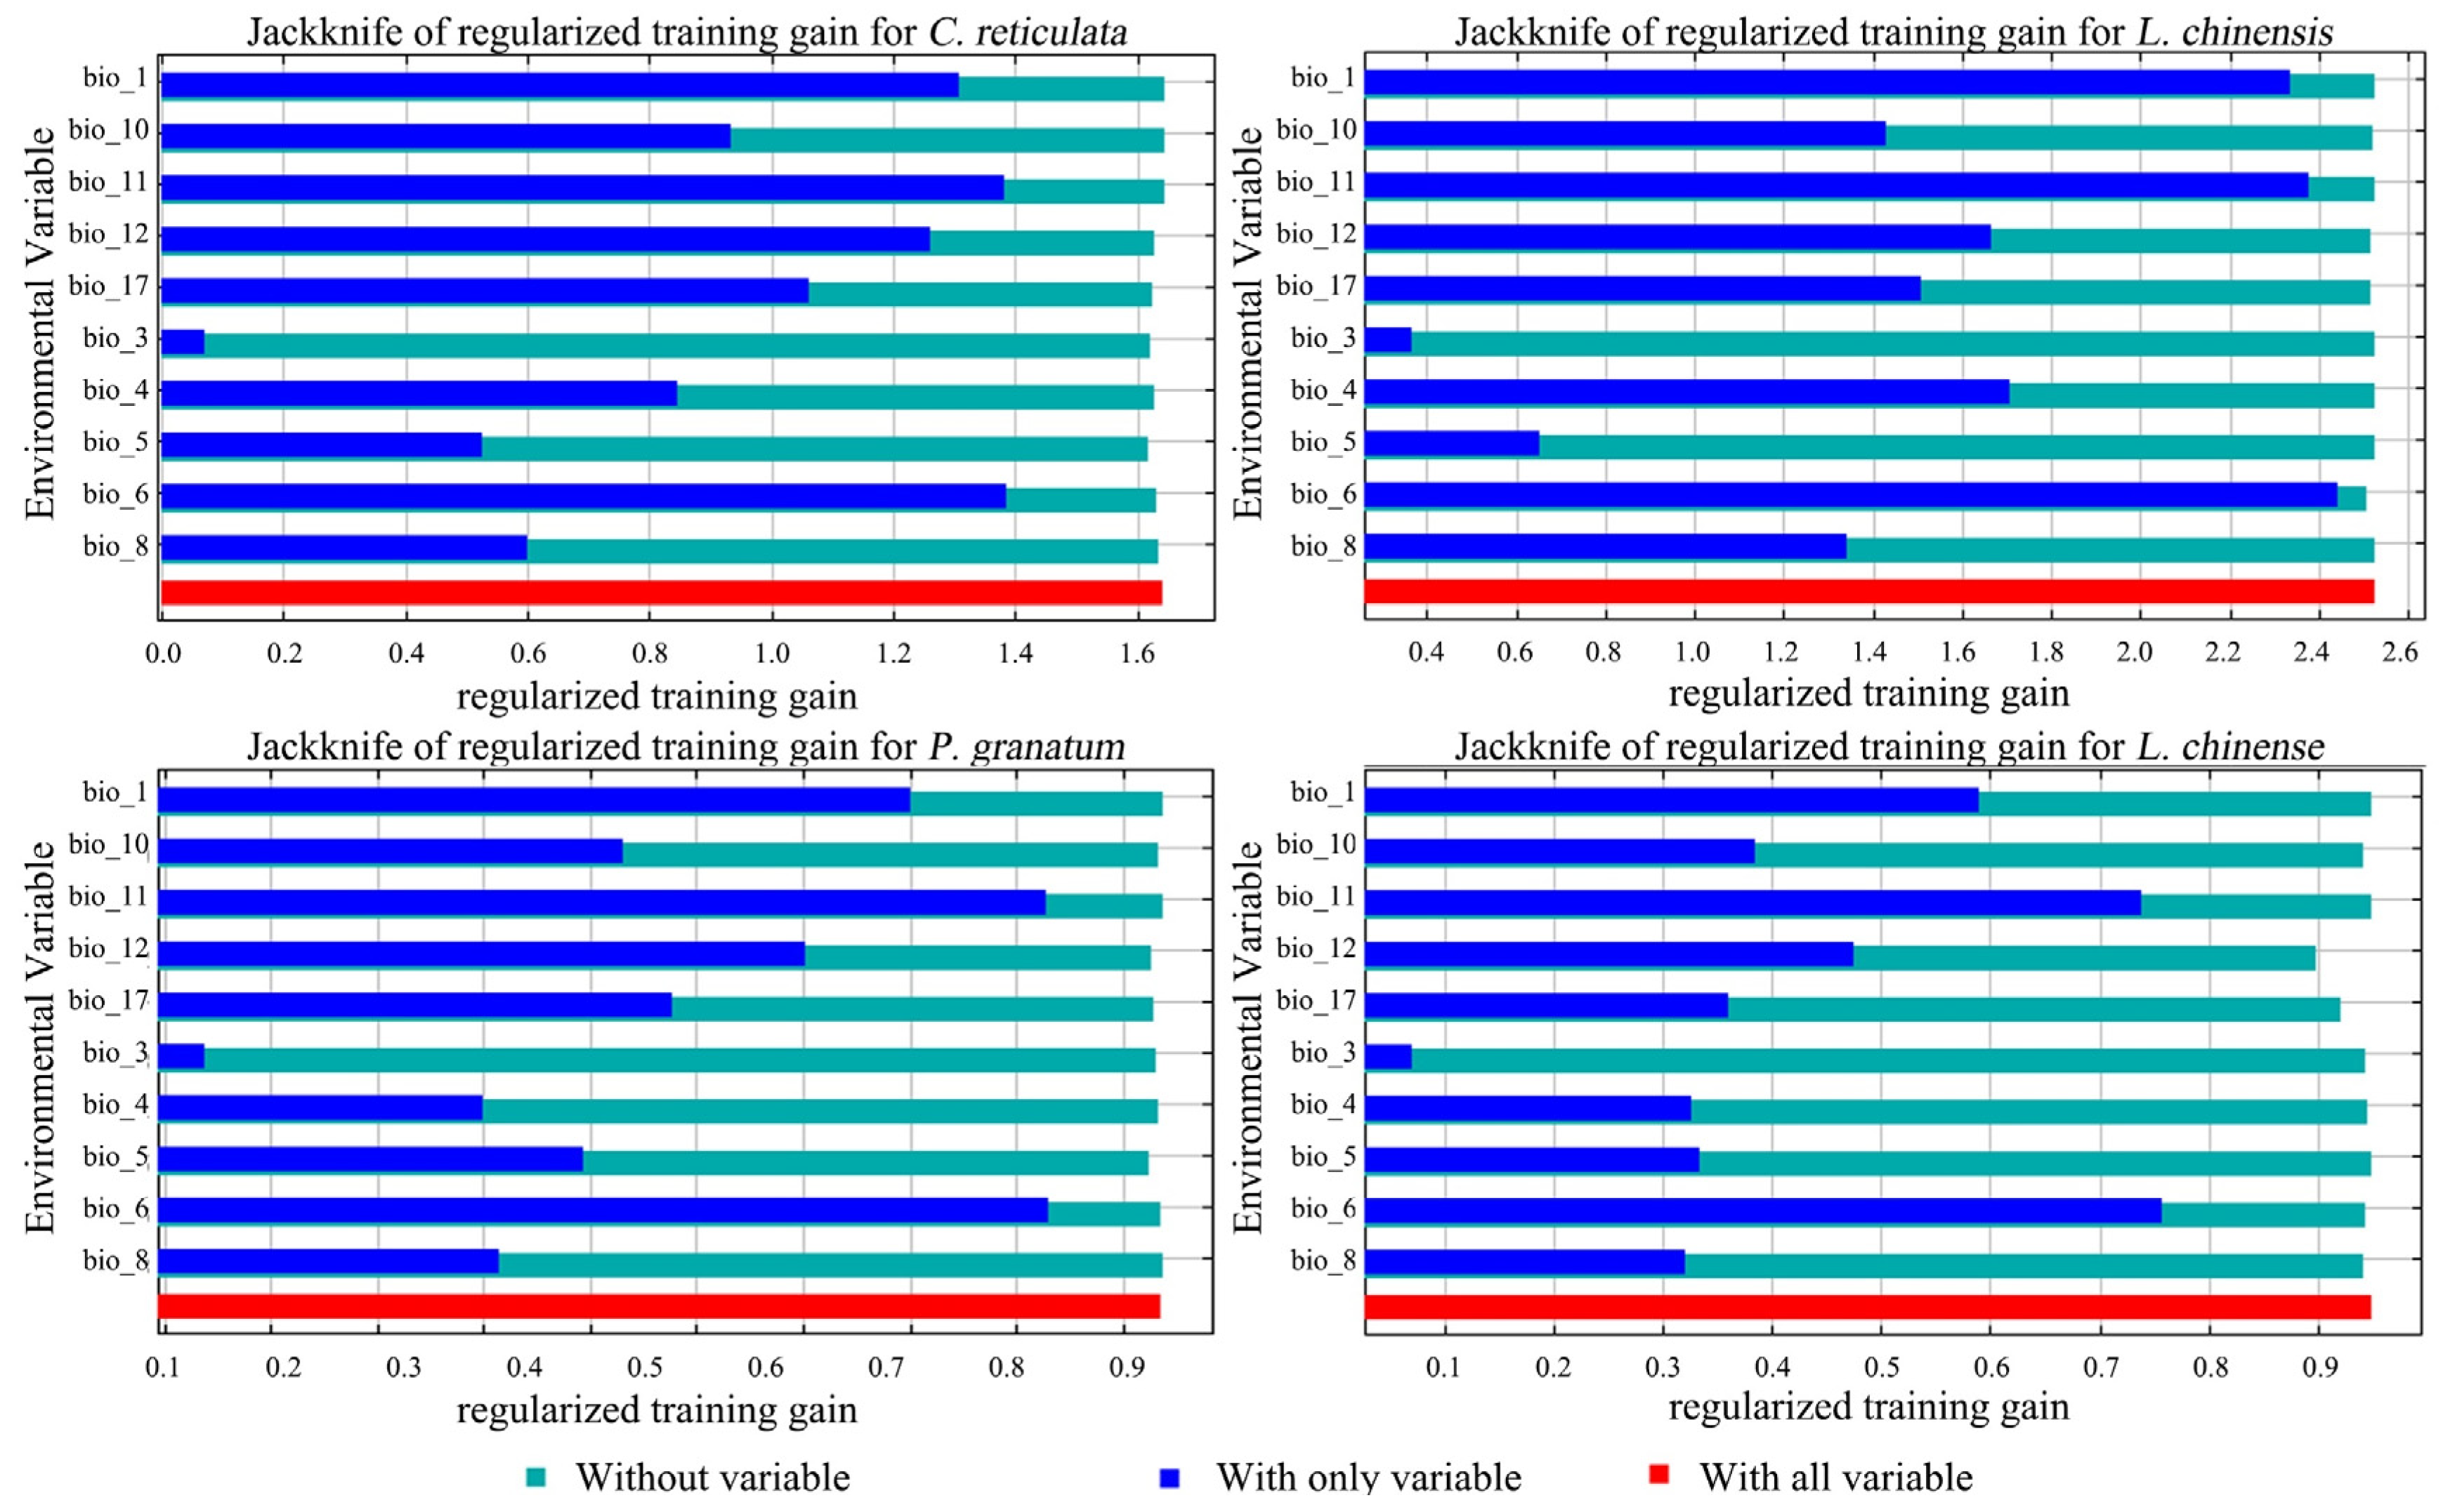
Among the environmental factor variables predicted by the model, C. reticulata had a cumulative 61.3% modelled contribution of annual precipitation (bio_12) and precipitation of driest quarter (bio_17) under the current climate scenario. The permutation importance of the min temperature of the coldest month (bio_6) reached 49.8% cumulatively (Table 4). The results of the knife-cut diagram show (Figure 4) that the environmental variable with highest gain when used in isolation is bio_6, containing most of the information, followed by mean temperature of the coldest quarter (bio_11). This indicates that these two variables have the highest model gain and have the greatest impact on the distribution of C. reticulata. Isothermality (bio_3) has the lowest regularized training gain value, indicating that it has the least effect on C. reticulata distribution.
Table 4.
Contribution and importance values of screened climate environment variables.

Figure 4.
Jackknife of regularized training gain for C. reticulata, L. chinensis, P. granatum, and L. chinense.
Combining the percent contribution (PC), permutation importance (PI), and the knife-cut test results, the dominant factors affecting the distribution of C. reticulata were annual precipitation (bio_12), precipitation of driest quarter (bio_17), mean temperature of coldest quarter (bio_11), and the min temperature of the coldest month (bio_6). The dominant factors affecting the distribution of L. chinensis were bio_6, bio_1, bio_17, and bio_11; the dominant factors affecting the distribution of P. granatum were bio_6, bio_11, bio_1, and bio_4; the dominant factors affecting the distribution of L. chinense were bio_6, bio_11, bio_1, and bio_12.
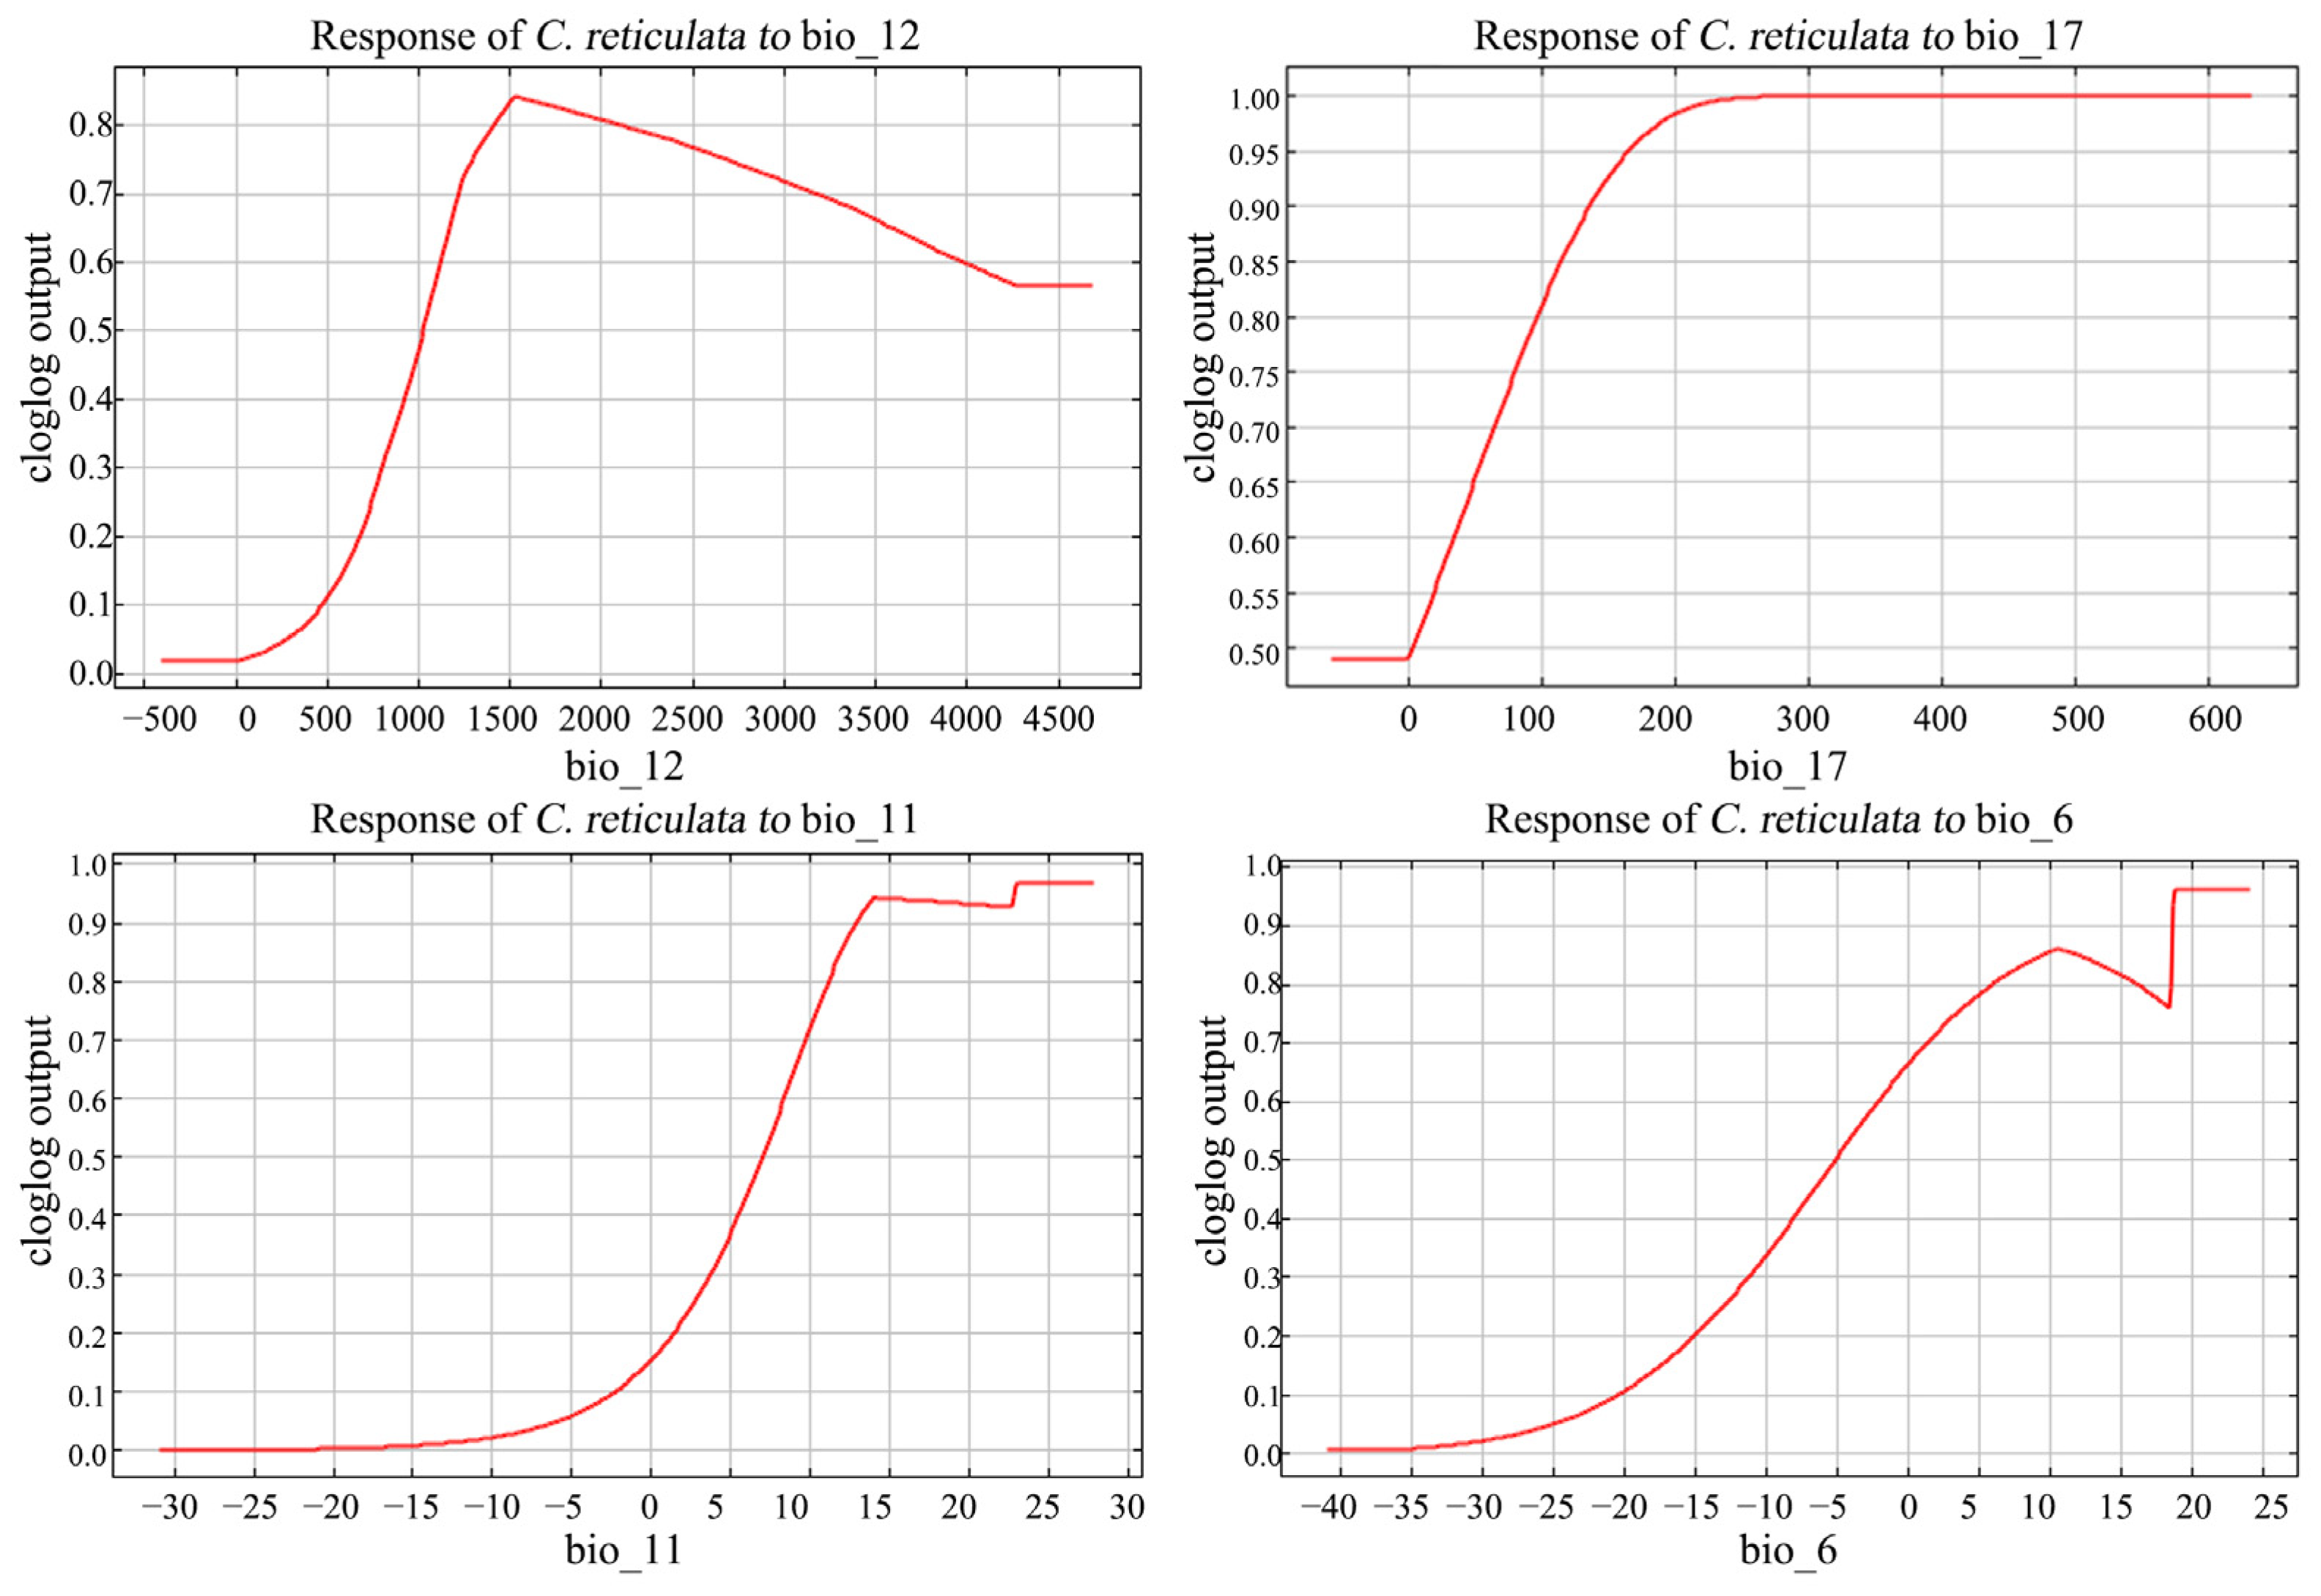
The response curves of environmental factors can determine the range of environmental suitability for C. reticulata growth (Figure 5). The official range of annual precipitation (bio_12) is of 1000–4000 mm. The distribution rate of C. reticulata increased with increasing annual water loss at annual precipitation <1500 mm; after reaching a maximum peak of 1500 mm, it decreased with increasing annual precipitation. The appropriate range of precipitation of the driest quarter (bio_17) was >100 mm, and the probability of C. reticulata presence increased with increasing coldest season precipitation, reaching the highest and constant distribution probability of 240 mm coldest season precipitation. The mean temperature of the coldest quarter (bio_11) stays between 12 and 28 degrees and the min temperature of the coldest month (bio_6) stays between 5 and 24 degrees, which is more suitable for C. reticulata growth.
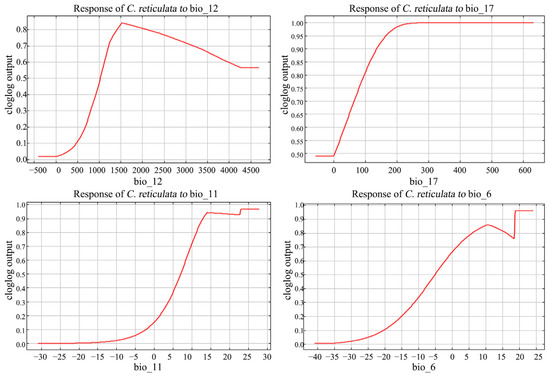
Figure 5.
Response curves to major environmental factors in C. reticulata.
3.3. Spatial and Temporal Patterns of Potential Suitable Area for C. reticulata, L. chinensis, P. granatum, and L. chinense
Under the current climatic scenario, the fertile area for C. reticulata is of 240.21 × 10⁴ km2 (Table 5). C. reticulata is commonly grown in the area south of the Qinling–Huaihe line, with the middle and upper reaches of the Yangtze River and the southeastern coast in particular as the main distribution areas (Figure 6). The moderately and highly suitable growth area of C. reticulata is mainly distributed in the South China region (Guangdong Province, Guangxi Zhuang Autonomous Region, Northern Hainan Province), East China region (Fujian Province, Jiangxi Province, Guizhou Province), Central China region (Hunan Province, Hubei Province), and Southwest region (Eastern and Southern Sichuan Province, Chongqing City). Among them, South China has the largest and most concentrated area of high suitability. C. reticulata also has some suitable areas in Yunnan, Henan, Jiangsu, Zhejiang, Anhui, Shanghai, Taiwan, southern Shaanxi, and the southern Tibet Autonomous Region. Under future climate scenario SSP1-2.6, C. reticulata has an additional 6.21 × 10⁴ km2 of suitable area during 2040–2060. The suitable area during the period 2060–2090 continued to increase by 18.99 × 10⁴ km2. Spatially, the high suitability area of C. reticulata showed an obvious increasing trend, expanding from South China to Central and East China, mainly in Guangdong Province, Guangxi Zhuang Autonomous Region, and Southeast coastal areas. There is also a tendency for the highly suitable area in the Sichuan Basin to expand outward. Meanwhile, new lowly suitable areas have been added in southern Shandong Province, southern Hebei Province, southeastern Shanxi Province, and southern Gansu Province. Under the future climate scenario SSP5-8.5, the highly suitable area for C. reticulata will peak and expand more rapidly from 2040 to 2060, with the highly suitable area increasing by 11.89 × 10⁴ km2; and the highly suitable area decreasing by 0.72 × 10⁴ km2 from 2060 to 2090. Geographically, the highly suitable area along the southeast coast increases, while the highly suitable areas in Anhui and Hubei provinces decrease.
Table 5.
Area distribution of C. reticulata, L. chinensis, P. granatum, and L. chinense in different climatic scenarios of suitable area (unit: ×104 km2).
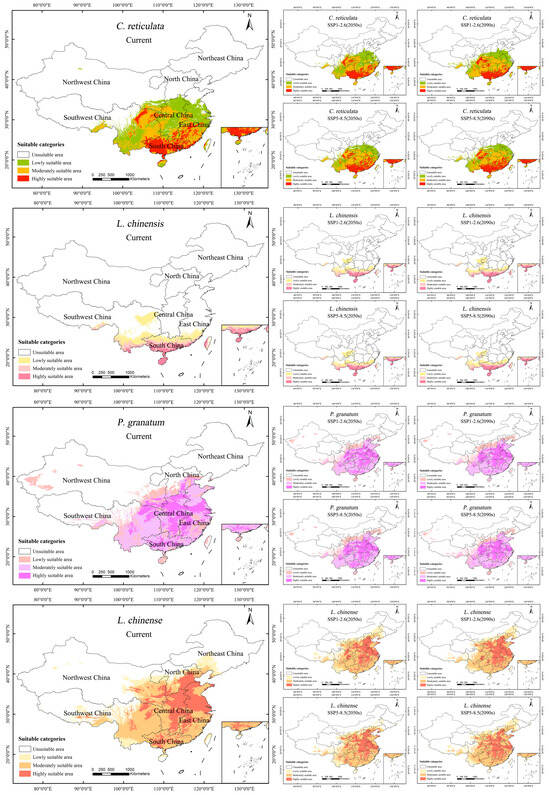
Figure 6.
Potential suitable areas of C. reticulata, L. chinensis, P. granatum, and L. chinense under different climatic scenarios.
Under the current climate scenario, the suitable area for L. chinensis is of 88 × 104 km2. L. chinensis is mainly distributed south of 30°N, in subtropical and tropical regions. The highly suitable areas for L. chinensis are found in Hainan Province, southern Guangdong Province, southern Guangxi Zhuang Autonomous Region, southern Yunnan Province, and eastern Taiwan Province. Inland areas such as eastern Sichuan Province and western Chongqing also have certain suitable areas. Under future climate scenario SSP11-2.6, between 2040 and 2090, the suitable area for L. chinensis will first decrease and then increase, totaling an increase of 4.62 × 10⁴ km2. Under future climate scenario SSP5-8.5, between 2040 and 2090, the suitable area for L. chinensis will continue to increase, totaling an increase of 8.68 × 10⁴ km2.
Under the current climatic scenario, the suitable area for P. granatum is of 318.1 × 10⁴ km2. P. granatum is mainly distributed in the central and southern regions of China, especially near the Yangtze River basin. The highly suitable areas for P. granatum are mainly concentrated in the Central China region (Hunan Province, Henan Province, Hubei Province) and East China region (Jiangxi Province, Anhui Province, Jiangsu Province). The suitable areas in South China are also fairly widespread. Under the future climatic scenario SSP1-2.6, between 2040 and 2090, the suitable area for P. granatum will increase by 24 × 104 km2. Under the future climatic scenario SSP5-8.5, between 2040 and 2090, the suitable area for P. granatum will first increase and then decrease, totaling an increase of 11.13 × 10⁴ km2. During the continuous development process, the highly suitable areas in Central and South China are gradually showing a trend of contiguous development.
Under the current climatic scenario, the suitable area for L. chinense is of 391.71 × 10⁴ km2. L. chinense has a broad distribution, primarily in North China, Central China, and East China, near the Yellow River and Yangtze River basins. The highly suitable areas for L. chinense are mainly in Hebei Province, Henan Province, Shandong Province, Jiangsu Province, Anhui Province, Hubei Province, Beijing, and Tianjin. In the northwest, Ningxia Hui Autonomous Region, Shaanxi Province, and the southern part of Gansu Province also have a broader distribution of medium-to-high suitability areas. Under the future climatic scenario SSP1-2.6, from 2040 to 2090, the change in the suitable area for L. chinense is slight, first increasing and then decreasing, totaling an increase of 3.63 × 10⁴ km2. Under the future climatic scenario SSP5-8.5, from 2040 to 2090, the suitable area for L. chinense first shrinks and then significantly increases, an increase of 13.15 × 10⁴ km2 compared to the 2050s. Under the SSP5-8.5 scenario (2090s), the highly suitable areas in Anhui Province and Shandong Province decrease extensively.
3.4. Potential Shared Habitat Area for C. reticulata, L. chinensis, P. granatum, and L. chinense under Different Climate Emission Scenarios
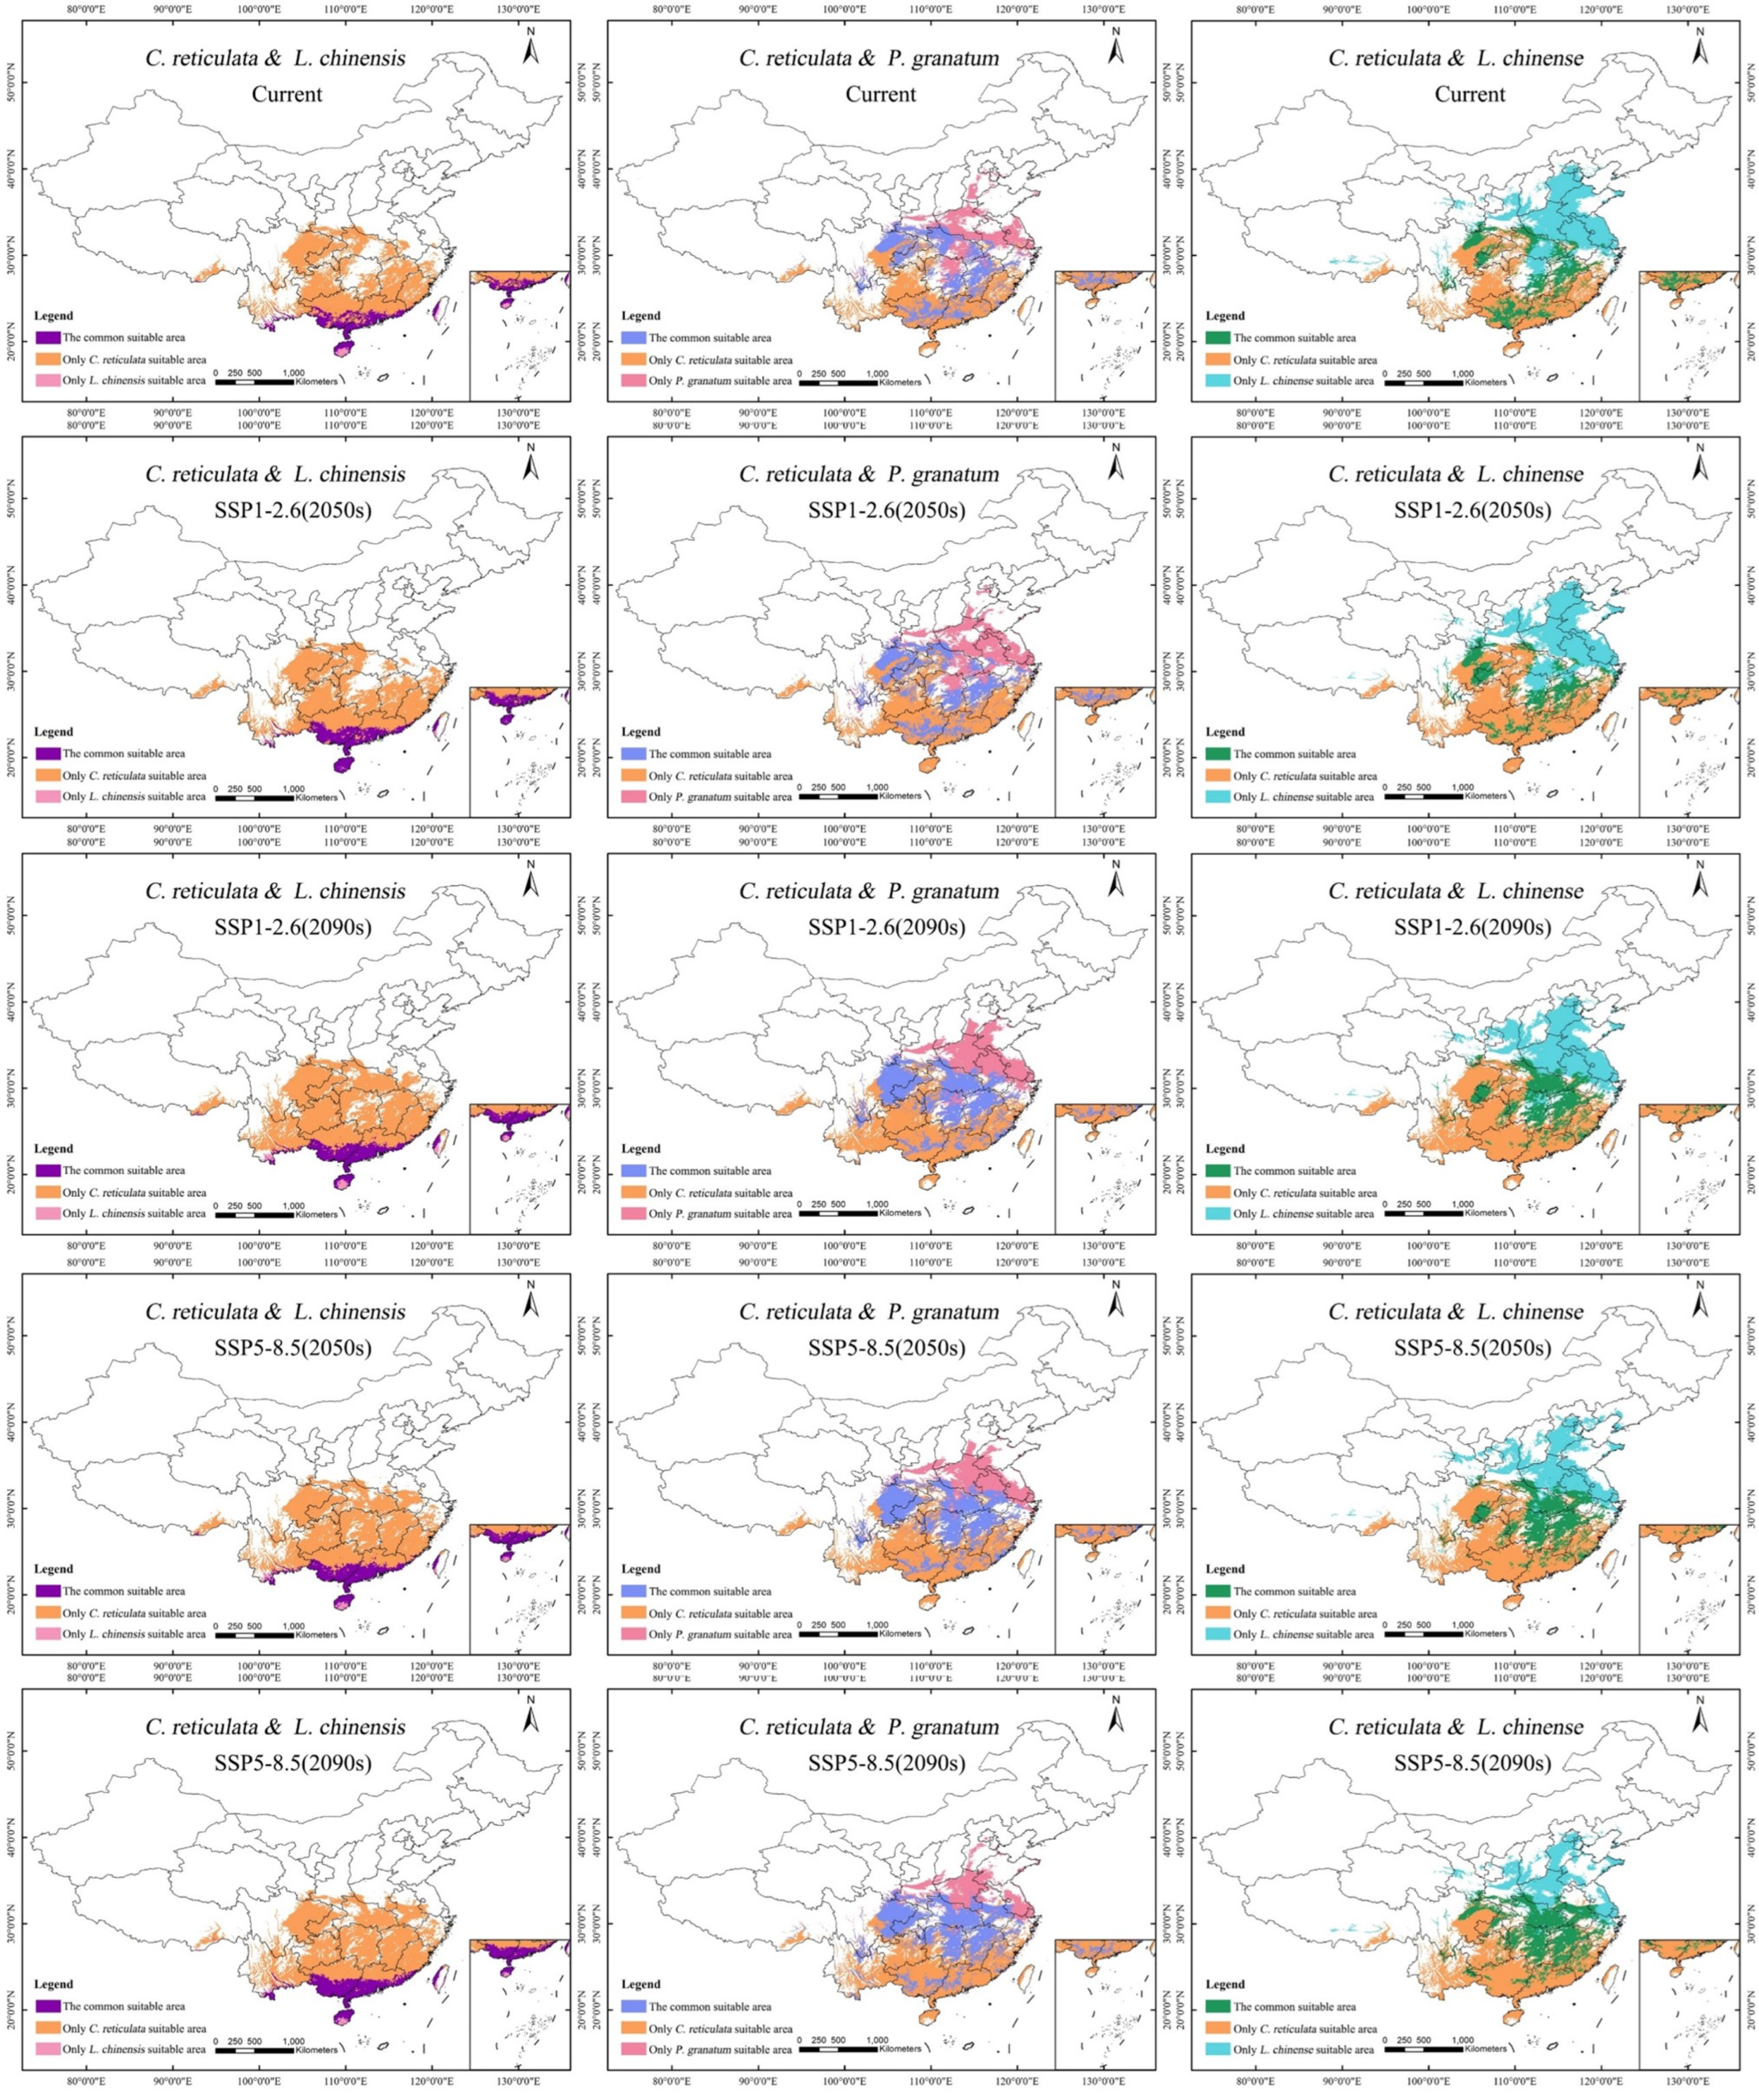
Based on the area overlay analysis of the moderately-to-highly suitable area for C. reticulata and the highly suitable area for L. chinensis, under the current climatic scenario, the potentially shared area is of 16.34 × 10⁴ km2, accounting for approximately 1.70% of China’s national area (Table 6). The potential shared suitable area is mainly distributed in South China and Southwest China: the southern part of Yunnan Province, the southern part of Guangxi Zhuang Autonomous Region, the southern part of Guangdong Province, the Hong Kong Special Administrative Region, the northern part of Hainan Province, and the eastern part of Taiwan Province (Figure 7). Under the four climate scenarios, the potential shared suitable area continues to increase, reaching its peak at 23.59 × 10⁴ km2 under the SSP5-8.5 (2050s) scenario. The potential shared suitable area gradually expands northward and southward within the range under the current climatic scenario.
Table 6.
The common suitable area of C. reticulata, L. chinensis, P. granatum, and L. chinense in different climatic scenarios (unit: ×104 km2).
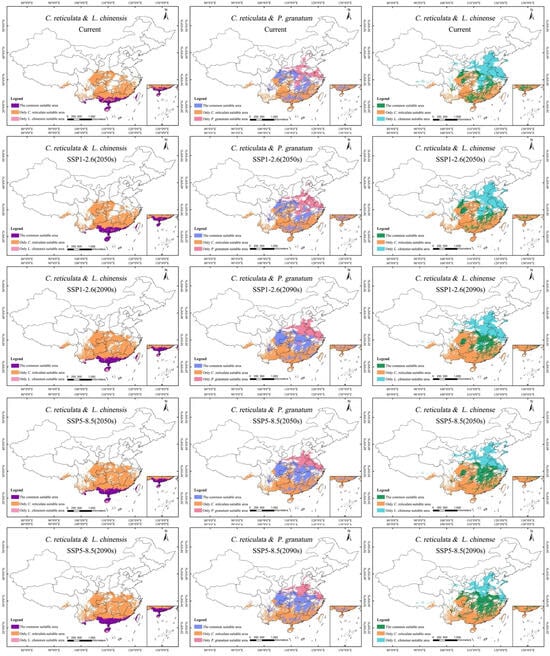
Figure 7.
Potential common habitat of C. reticulata, L. chinensis, P. granatum, and L. chinense under different climate scenarios.
Based on the area overlay analysis of the moderately-to-highly suitable area for C. reticulata and the highly suitable area for P. granatum, under the current climatic scenario, the potentially mixed area is of 49.56 × 10⁴ km2, accounting for approximately 5.50% of China’s national area. The potential shared suitable areas are mainly distributed in Central China (Hunan Province, Hubei Province), East China (Jiangxi Province), Southwest China (Chongqing City, Eastern Sichuan Province), and Southern China (Central Guangxi Zhuang Autonomous Region, Central Guangdong Province). Under the SSP1-2.6 climate scenario, the potential shared suitable area increases by 18.78 × 10⁴ km2. Under the SSP5-8.5 climate scenario, the potential shared suitable area increases by 23.48 × 10⁴ km2. Major new shared suitable areas have been added in Eastern Sichuan Province, Southeastern Hubei Province, and Northern Hunan Province.
Based on the area overlay analysis of the moderately-to-highly suitable area for C. reticulata and the highly suitable area for L. chinense, under the current climatic scenario, the potentially mixed area is of 41.52 × 10⁴ km2, accounting for approximately 4.32% of China’s national area. The potential shared suitable areas are mainly distributed in Jiangxi Province, Guangxi Zhuang Autonomous Region, Southeastern Hunan Province, Central Guangdong Province, Northern and Eastern Hubei Province, Northeastern Sichuan Province, and Southwestern Chongqing City. There are also scattered distributions of shared fitness areas in southern Shaanxi Province, southwestern Hebei Province, southeastern Anhui Province, and central Zhejiang Province. Under the future climate scenario of SSP1-2.6, between 2040 and 2090, the area of potential shared suitable areas first decreases and then increases, with a total increase of 5.59 × 10⁴ km2. Under the future climate scenario of SSP5-8.5, between 2040 and 2090, the area of potential shared suitable areas continues to increase rapidly, with a cumulative increase of 20.51 × 10⁴ km2. The shared suitable areas in Central and Northern Hunan Province, Central Hubei Province, Central Chongqing City, and Central Anhui Province have significantly increased.
3.5. Centroid Migration Processes in C. reticulata, L. chinensis, P. granatum, and L. chinense under Different Climate Scenarios
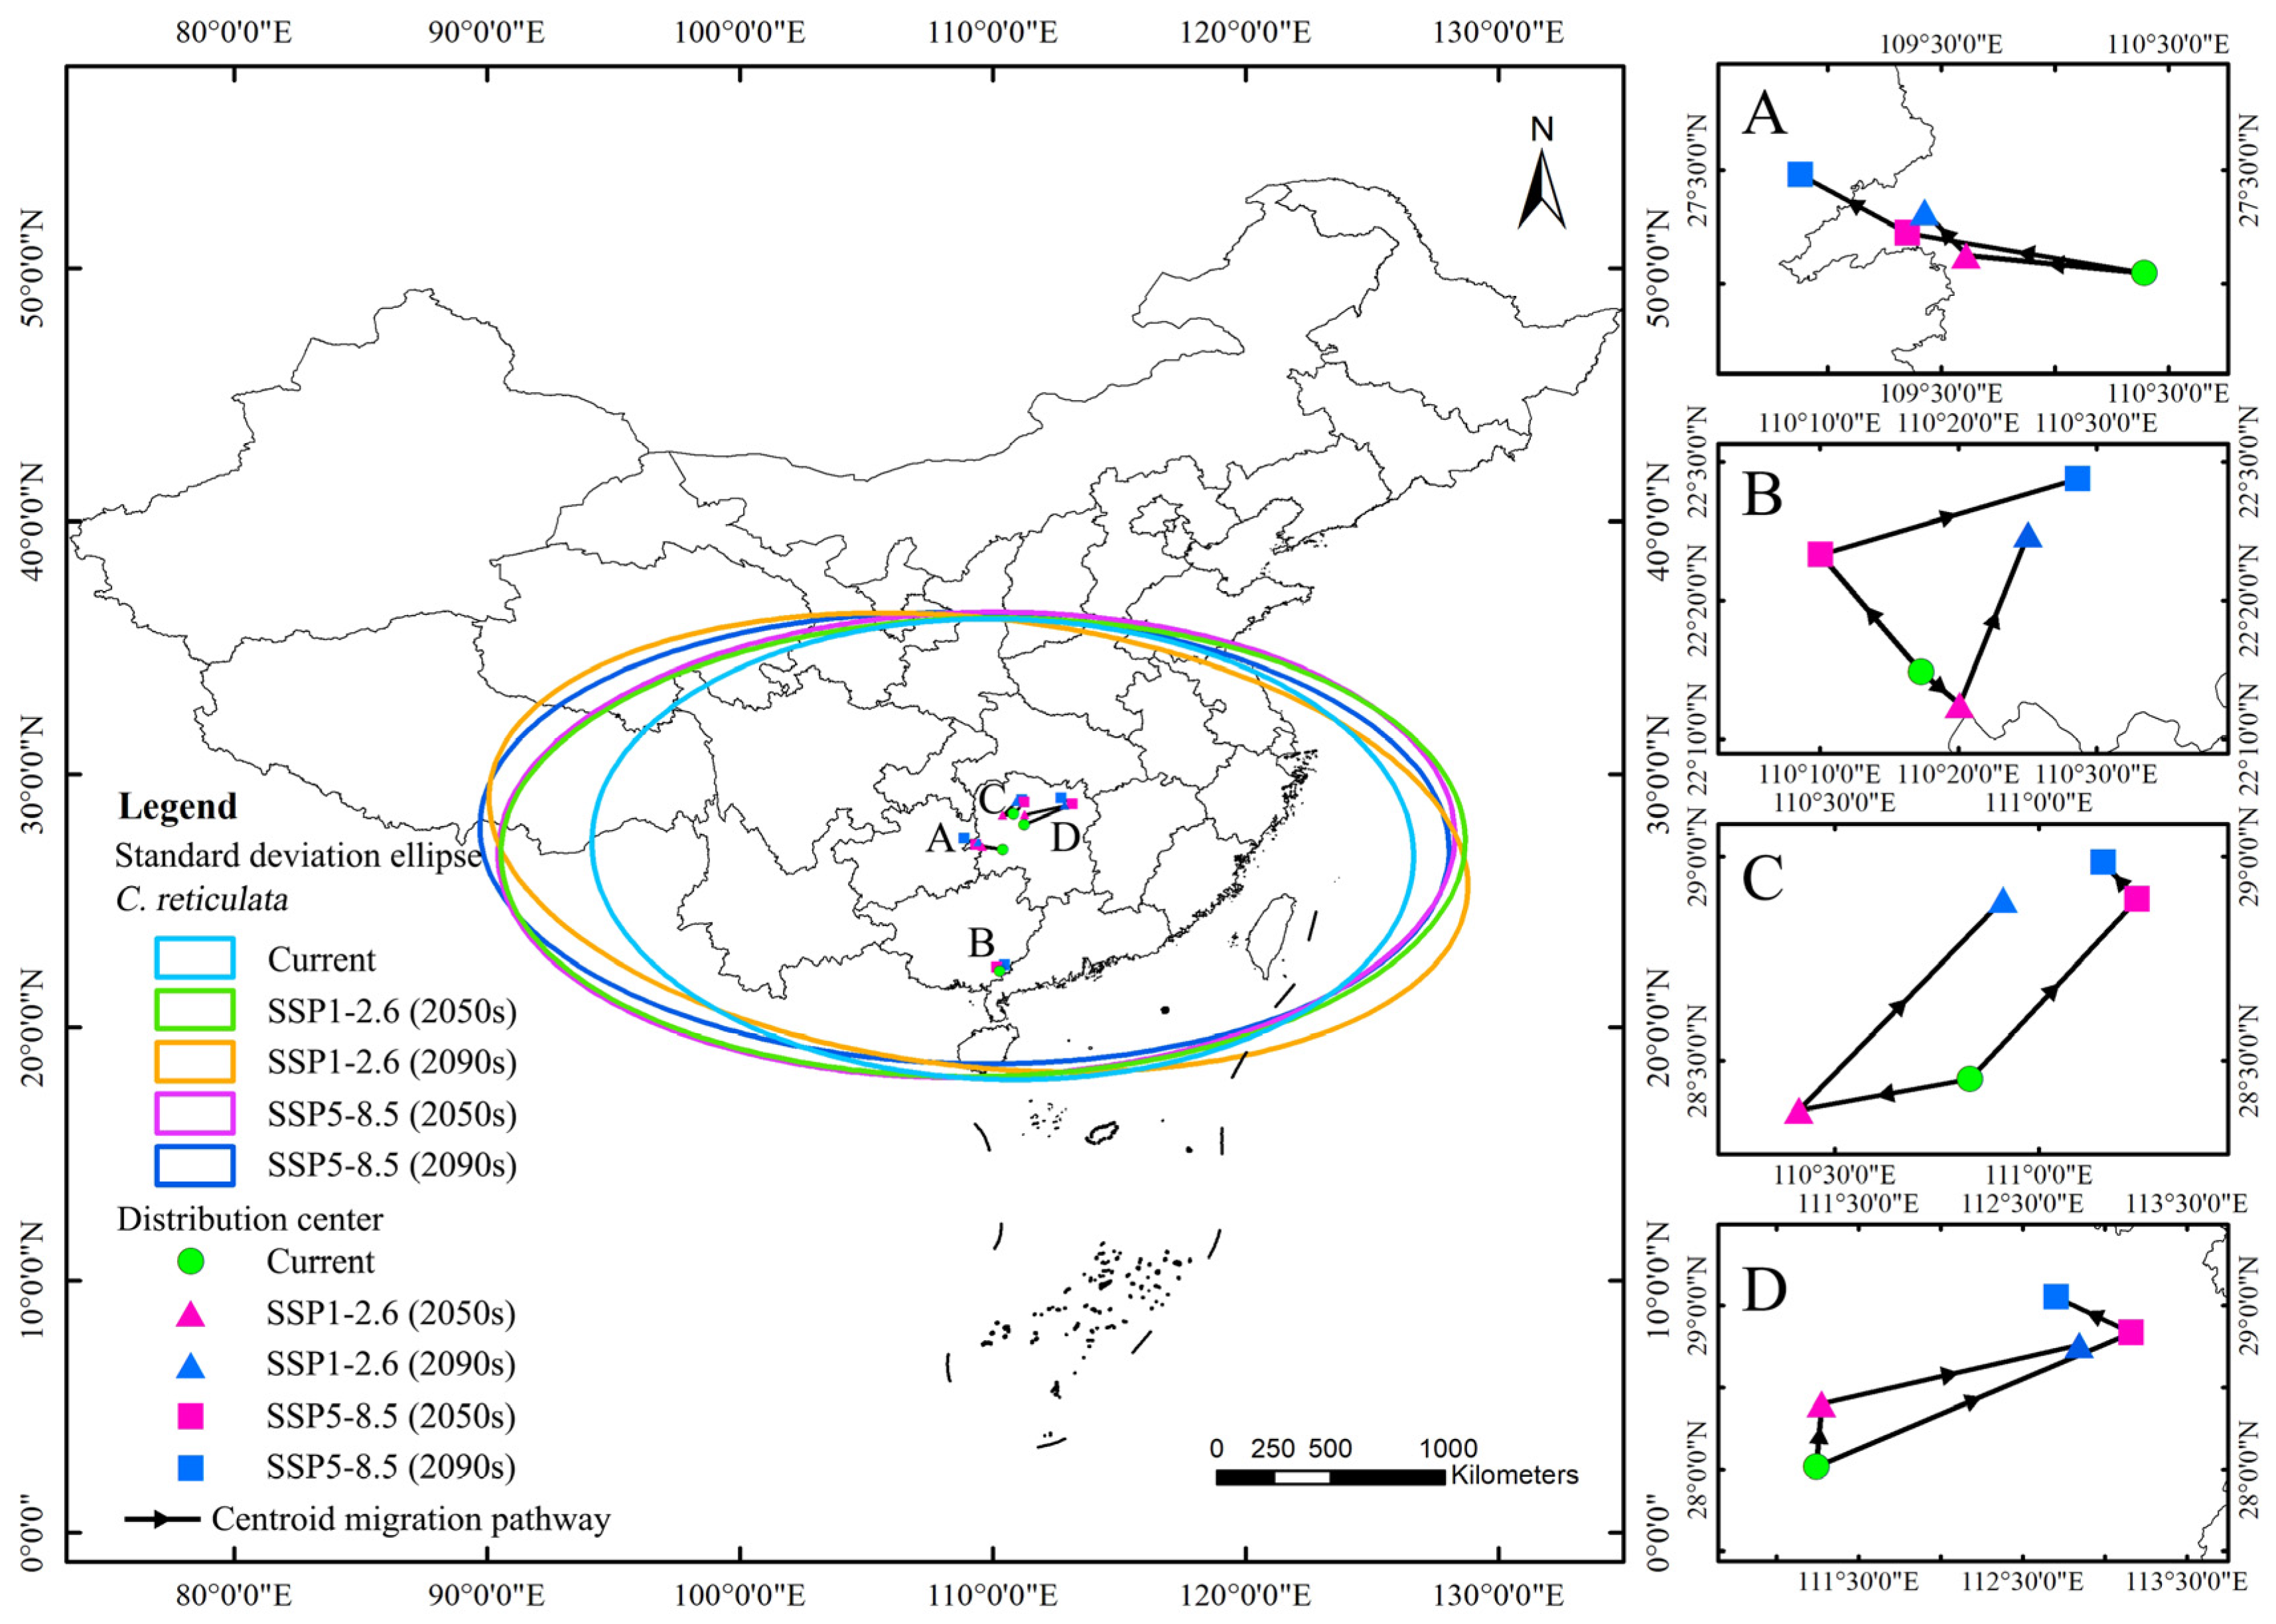
The results of the standard deviation ellipse of the distribution of suitable areas for C. reticulata habitats show (Figure 8) that the country covered is in the region of southern, central, and southern North China. Most of it is located south of the Qinling-Huai River. The azimuthal rotation of C. reticulata distribution under the five climatic conditions fluctuated in the range of 88°–96°, showing an east–west distribution pattern. The azimuthal rotation under the SSP1-2.6 (2090s) scenario was of 96.45°, with a tendency to shift to the northeast–southwest direction. The semi-minor axis mainly fluctuates within the 890–920 km range, while the semi-major axis overall shows an expansion trend, expanding from 1625 km to 1946 km. Under future climate scenarios, C. reticulata habitats are likely to expand in a north–east–south–west direction, increasing the area covered and showing a more dispersed distribution pattern, further exacerbating the fragmentation of the lower suitable area.
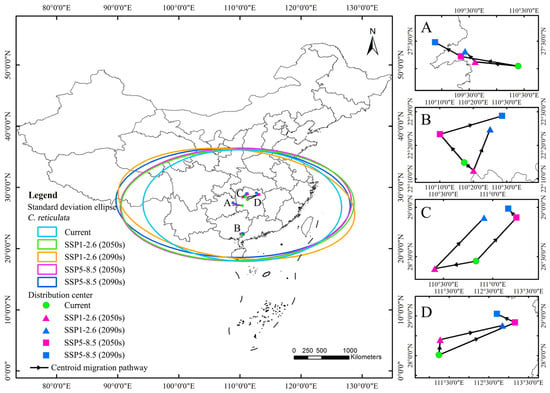
Figure 8.
Standard deviation ellipses and centroid migration processes under different climate scenarios. Note: (A): The centroid migration pathway of C. reticulata under five climate scenarios; (B): The centroid migration pathway of C. reticulata and L. chinensis under five climate scenarios; (C): The centroid migration pathway of C. reticulata and P. granatum under five climate scenarios; (D): The centroid migration pathway of C. reticulata and L. chinense under five climate scenarios.
This study defines the moderately-to-highly suitable area of C. reticulata with a geometric center point, using this method to simulate the changes in centroid migration under different climate scenarios. Under the current climate scenario, the centroid of C. reticulata distribution is located in Hunan Province (27.046°N, 110.394°E). Under the future SSP1-2.6 scenario, the centroid in the 2050s migrates to the northwest compared to the current centroid, with a migration distance of 78 km; the centroid in the 2090s continues to migrate to the northwest, with a migration distance of 28.135 km. Under the SSP5-8.5 scenario, the centroid in the 2050s rapidly migrates to the northwest compared to the current time, with a migration distance of 105.168 km; the centroid in the 2090s continues to migrate to the northwest to Guizhou Province, with a migration distance of 54.536 km.
Under the current climate scenario, the centroid of C. reticulata and L. chinensis distribution is located in Guangxi Zhuang Autonomous Region (22.247°N, 110.288°E). Under the future SSP1-2.6 scenario, the centroid in the 2050s migrates southeast compared to the current centroid, with a migration distance of 6.497 km. The centroid in the 2090s continues to migrate to the northeast, with a migration distance of 24.418 km. Under the SSP5-8.5 scenario, the centroid in the 2050s migrates northwest compared to the current time, with a migration distance of 20.106 km; the centroid in the 2090s continues to migrate to the northeast, with a migration distance of 33.430 km.
Under the current climate scenario, the centroid of C. reticulata and P. granatum distribution is located in Hunan Province (28.455°N, 110.831°E). Under the future SSP1-2.6 scenario, the centroid in the 2050s migrates southwest compared to the current centroid, with a migration distance of 41.743 km. The centroid in the 2090s continues to migrate to the northeast, with a migration distance of 75.342 km. Under the SSP5-8.5 scenario, the centroid in the 2050s migrates northeast compared to the current time, with a migration distance of 63.821 km; the centroid in the 2090s continues to migrate to the northwest, with a migration distance of 12.947 km.
Under the current climate scenario, the centroid of C. reticulata and L. chinense is located in Hunan Province (28.016°N, 111.240°E). Under the future SSP1-2.6 scenario, the centroid in the 2050s migrates northeast compared to the current centroid, with a migration distance of 43.036 km. The centroid in the 2090s continues to migrate to the northeast, with a migration distance of 158.507 km. Under the SSP5-8.5 scenario, the centroid in the 2050s migrates northeast compared to the current time, with a migration distance of 208.711 km; the centroid in the 2090s continues to migrate to the northwest, with a migration distance of 50.765 km.
4. Discussion
4.1. Advantages of the MaxEnt Model
The MaxEnt model (maximum entropy model) has been widely used in ecological and agricultural research due to its efficiency and accuracy, flexibility in handling different types of input data, strong performance under data scarcity, and visualization interpretation capabilities [46].
In particular, the MaxEnt model outputs in this study are highly interpretable. First, the MaxEnt model can explain the impact of each input variable on the model, helping to determine the suitable growth range for the species. Secondly, the probability maps of species distribution generated by the MaxEnt model are intuitive and easy to understand, enhancing our comprehension of the species distribution patterns. This enables the model to be directly used in explaining ecological issues and provides a basis for developing conservation strategies and management plans. This interpretability is especially important when conveying research results to non-professionals and decision-makers. Moreover, the visualization capabilities of the MaxEnt model provide strong technical support for identifying suitable planting areas and designing mixed cropping systems in this study.
4.2. Exploring Crucial Climatic Variables for Optimal Growth in Current C. reticulata, L. chinensis, P. granatum, and L. chinense
The choice to mix C. reticulata with L. chinensis, P. granatum, and L. chinense is based on their similarities in habitat conditions (Table 4). These fruit trees share similar characteristics in terms of their growing environment, soil type, and climatic adaptability, being more suitable for subtropics and tropics. This characteristic provides favorable conditions for them to coexist in the same mixed area. Additionally, L. chinensis is suitable for growing in lower latitudes, and P. granatum and L. chinense are suitable for growing in low-to-medium latitudes. A north–south pattern is formed in terms of latitude distribution. This provides fruit farmers at different latitudes with a wider range of mixing options, adding biodiversity to the orchard.
In this study, the selected climatic variables, min temperature of coldest month (bio_6) and mean temperature of coldest quarter (bio_11), have significant impacts on the growth of C. reticulata, L. chinensis, P. granatum, and L. chinense (Table 4, Figure 3). Bio_6 significantly affect the phenology and yield of various fruit crops [47]. Bio_11 influences their overall phenological development during colder periods. Research suggests that mean temperatures during the coldest months are vital for determining the suitable growth periods for subtropical crops [48]. Nevertheless, precipitation of the driest quarter (bio17) is particularly significant for C. reticulata and L. chinensis, highlighting their sensitivity to drought conditions and emphasizing the need for adequate water management strategies during dry seasons [49,50]. These results suggest that these four species show similar growth preferences under cold, variable temperatures and humid conditions. This aligns with the observations in [51] according to which many permanent fruit tree species tend to mix under the same climatic conditions, and climate change is a key driver of this trend. Bearing in mind the similar sensitivity of these species to temperature and precipitation, mixing them could potentially serve as an effective ecological management strategy [52], improving ecosystem diversity and stability. In scenarios wherein these species are mixed, they share similar environmental preferences and adaptability, such as the ability to adapt to temperature fluctuations and seasonal changes in precipitation, providing them with an ecosystem more adaptable to climate change [53].
4.3. Exploration of the Migration of C. reticulata, L. chinensis, P. granatum, and L. chinense to Suitable Area under Diverse Climatic Emission Scenarios
The suitable centroid for C. reticulata is located in Shaoyang City, Hunan Province. Hunan is one of the origins of C. reticulata in the world, and C. reticulata is also one of the main fruits in Hunan. The overall migration of the suitable centroid for C. reticulata is toward the northwest, which is basically consistent with this study [6]. However, the migration distance is greater under the SSP5-8.5 scenario. In the SSP5-8.5 scenario, the rapid migration of the centroid in the 2050s indicates that the intensity of climate change and carbon emissions may have more significant impacts on the distribution of C. reticulata. In the future 2090s, the centroid will continue to migrate to the northwest of Guizhou province, which may be due to its more suitable climate conditions, becoming the new centroid of the C. reticulata suitable area.
The centroid of the potentially suitable area after mixing showed an overall trend of moving toward higher latitudes. C. reticulata and L. chinensis demonstrated relatively lower migration intensity under different climate scenarios, with their mixed structure being the most stable. The migration of C. reticulata and P. granatum was more noticeable in the low emission scenario. C. reticulata and L. chinense generally showed a trend of migrating northeastward. Owing to the more drastic changes in its high suitability area, L. chinense experienced the greatest migration intensity and the longest distance. The geographic location of the mixed C. reticulata and L. chinense changed significantly, causing a relatively unstable ecological structure
Overall, the centroid of the potential suitable area for C. reticulata and its mixtures demonstrates directional and trending migration under different climate scenarios, but the overall range of movement is limited. This is likely significantly constrained by external environmental conditions, and relatively small range, directional evolution of the geographical distribution of C. reticulata, and its mixed varieties [6]. The limited migration capability of plants is mainly restricted by external environmental conditions, causing their geographical distribution to display a specific and smaller range of directional evolution [54]. Relevant research indicates that, under the backdrop of global warming, plant distribution shows a tendency to expand toward high-latitude and high-altitude areas [4,5], which aligns with the results of this study. The specific migration trend under the low concentration emissions scenario may be influenced by a combination of climate and topographical factors, whereas the overall migration trend under the high concentration emissions scenario may be associated with changes in plant-suitable areas caused by global warming [55]. These migration trends profoundly impact plant survival and their adaptation to climate change, further highlighting the importance or potential threat of climate change to ecosystems.
4.4. Design for the Mixed Planting Area of C. reticulata, L. chinensis, P. granatum, and L. chinense
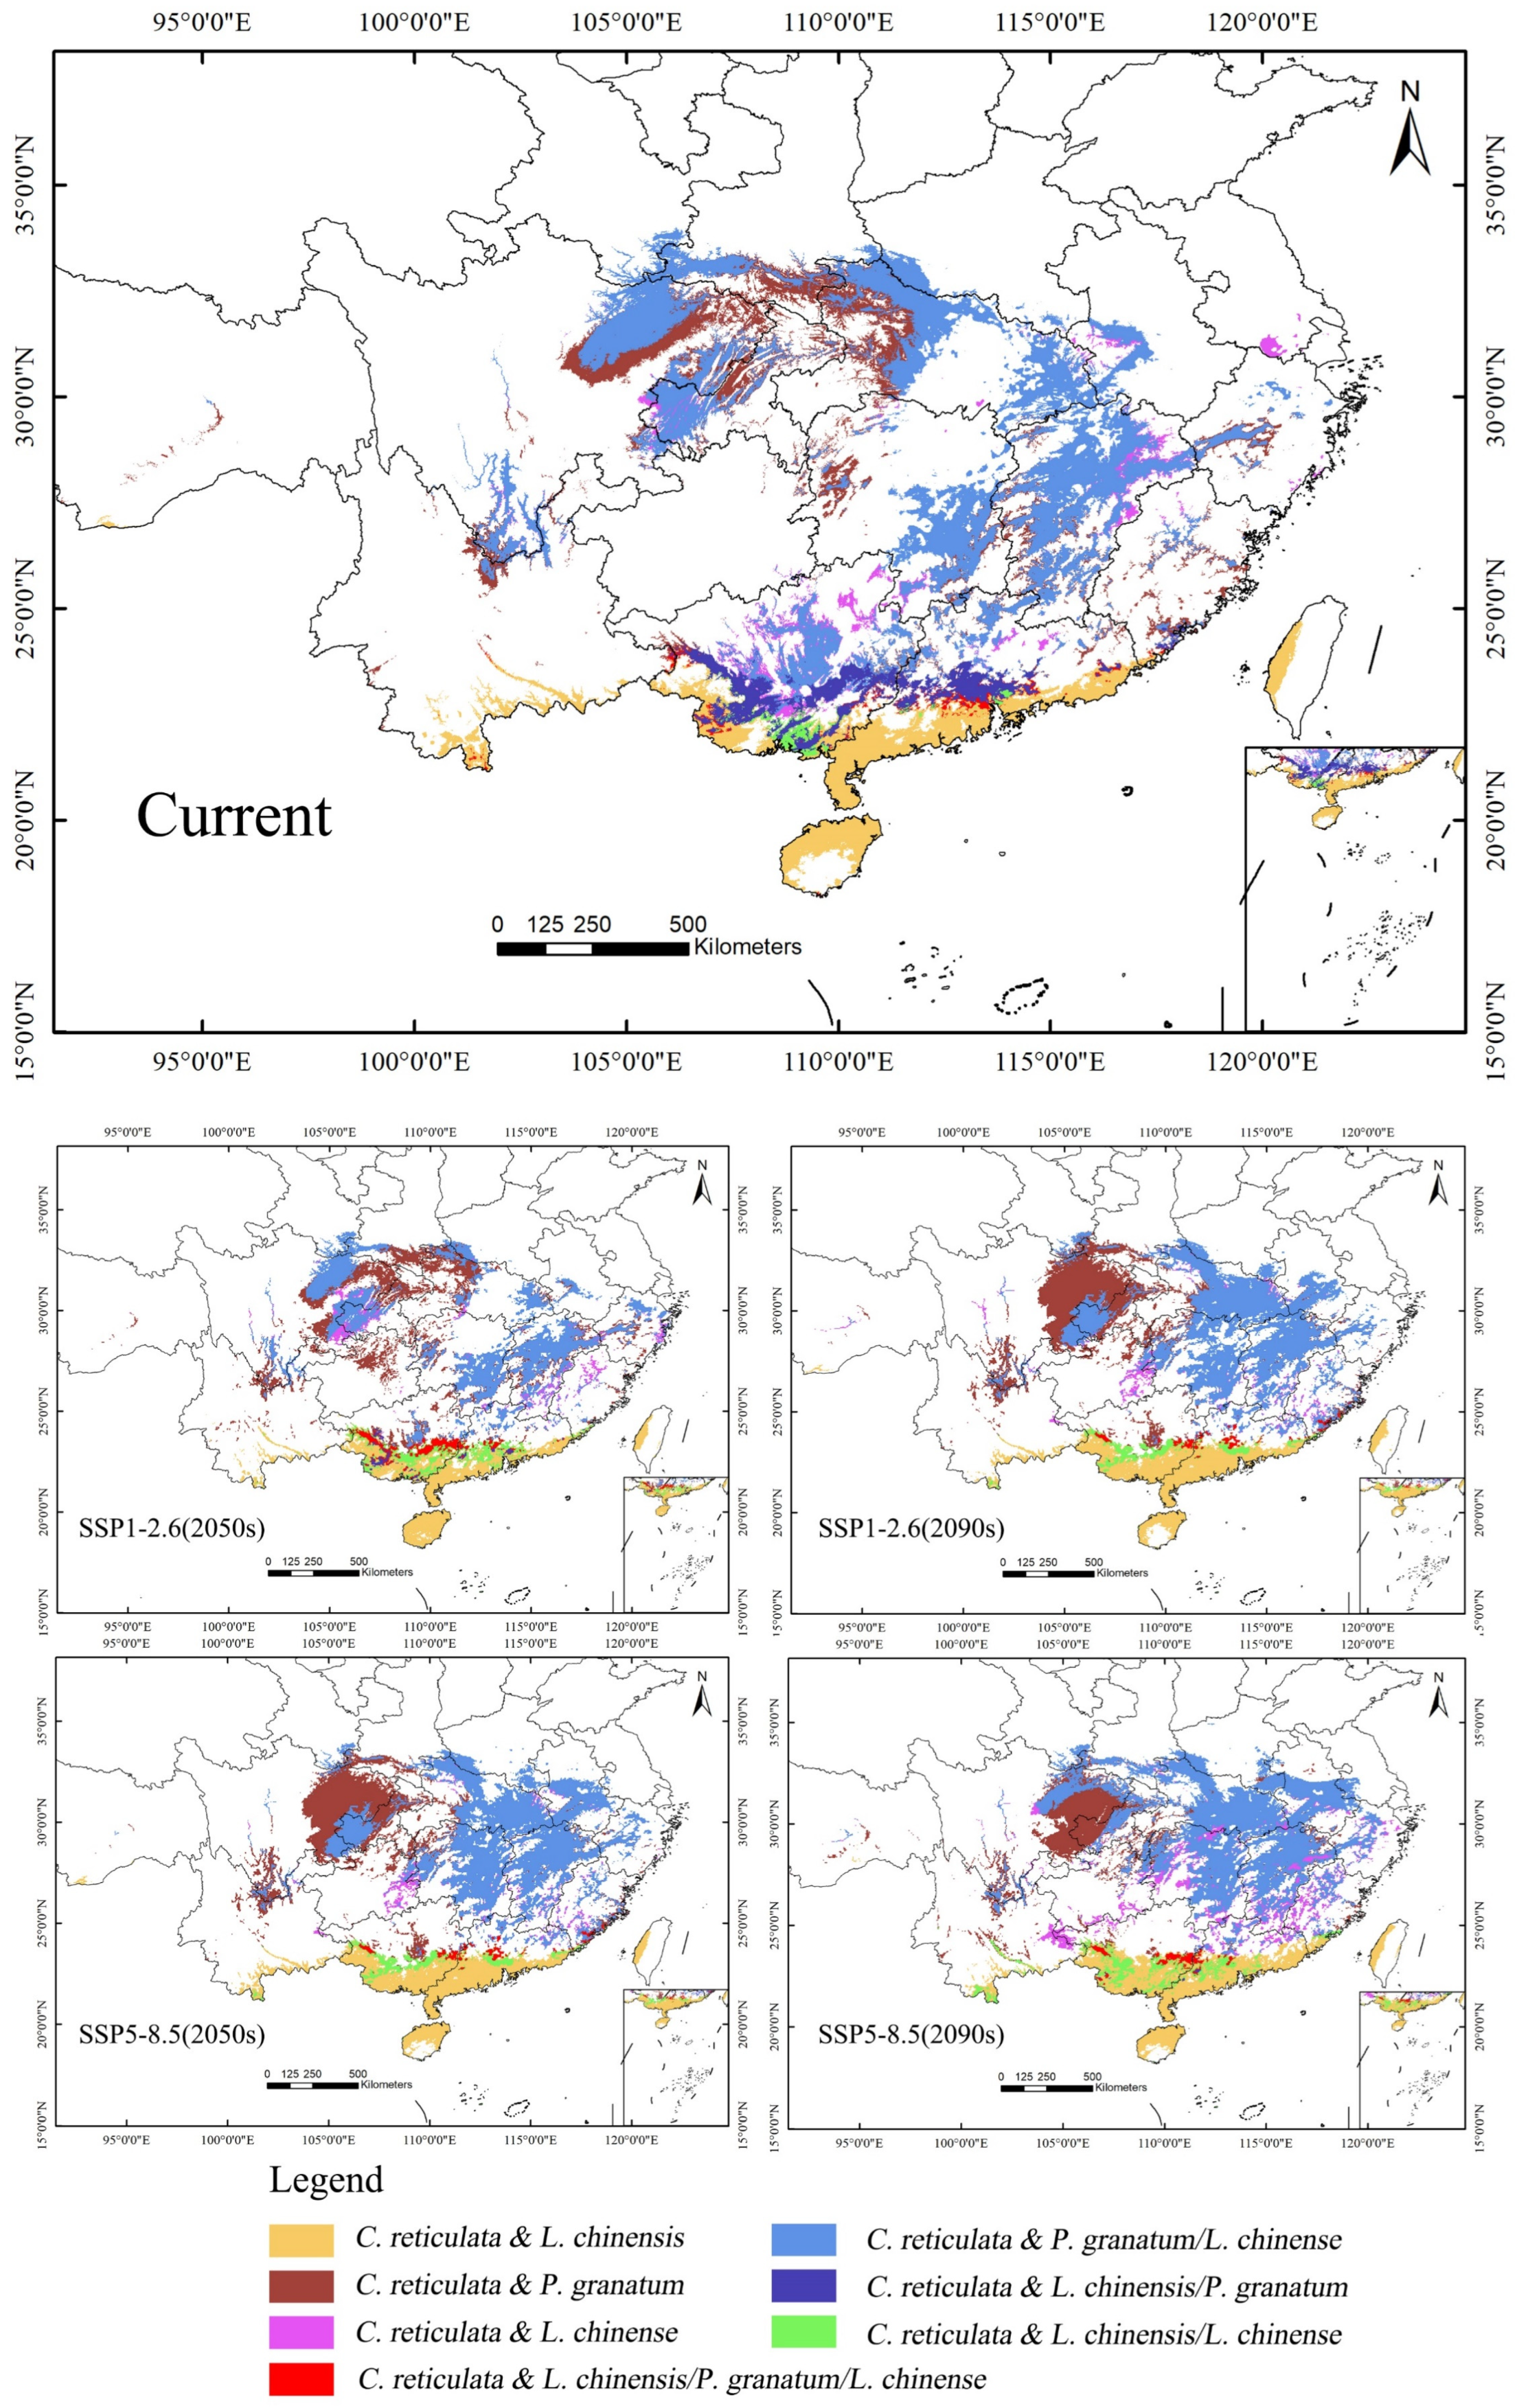
In the planning of mixed planting areas, it is crucial to pay attention to the current and future potential co-suitability areas [43]. These areas demonstrate high adaptability under different climate scenarios, making them ideal places to implement mixed planting to achieve the best ecological and economic returns.
There are certain differences in the suitable areas for different tree species, which need to be fully considered in the distribution of these areas during planning (Figure 9). Given the suitability of C. reticulata and L. chinensis in the South China region, they can be promoted as key mixed planting species. This helps to improve the stability and resilience of the ecosystem while reducing economic risks in market fluctuations. The co-suitability areas for C. reticulata and P. granatum, as well as C. reticulata and L. chinense, are remarkably similar, making them suitable for planting in most areas such as Central China, East China, Southwest China, and South China. This enables the possibility of large-scale mixed planting in these regions. Farmers can cleverly arrange mixed plantings according to local climate and market demand to reduce the risks brought about by economic singularity.
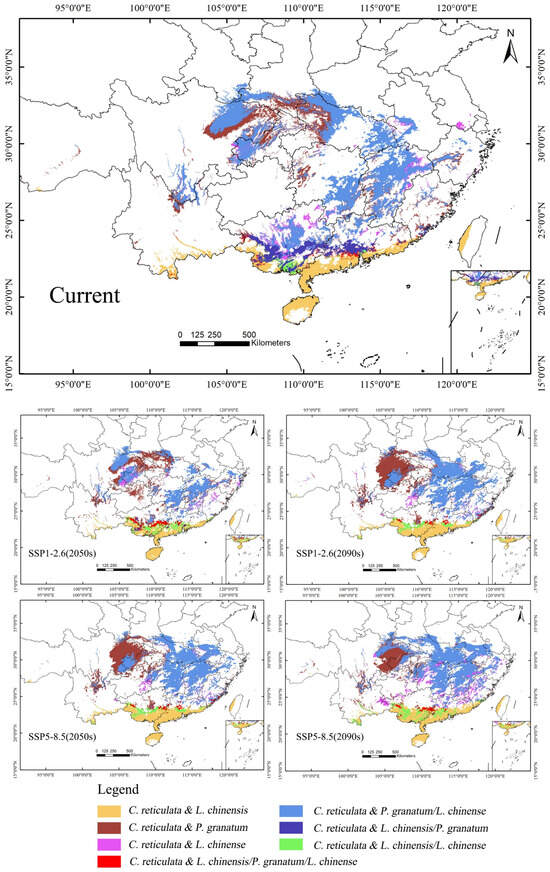
Figure 9.
Design of mixed planting zones for C. reticulata, L. chinensis, P. granatum, and L. chinense.
With the passage of time and the increase in carbon emission concentrations, the suitable mixed planting areas may change. Especially in the Guangxi Zhuang Autonomous Region and central Guangdong Province, the areas suitable for mixing C. reticulata with L. chinensis and P. granatum are gradually diminishing. Therefore, it is necessary to pay close attention to the changes in suitable areas and adjust mixed planting planning promptly. In the Guangxi Zhuang Autonomous Region and central Guangdong Province, the areas where C. reticulata, L. chinensis, P. granatum, and L. chinense can all be mixed planted are gradually moving north. This area has an outstanding ecological environment and low mixed planting risks, which is significant for ecological prevention and control, environmental protection, and economic growth. Therefore, the intensity of mixed planting in this area can be increased, making full use of its geographical advantages.
Taking into account all the factors and thoroughly studying the characteristics of each region, a flexible and feasible mixed planting plan has been formulated, which contributes to the sustainable development of the C. reticulata industry. In the formulation of mixed planting plans, it is necessary to strengthen cooperation with local governments, farmers, and scientific research institutions to form a multi-party participatory mixed planting development model. The policy support, technical guidance, and training from the government can promote the mixed planting plan to advance in the direction of sustainable development.
4.5. Mixed Cultivation: A Dual Strategy of Ecological Prevention and Economic Adaptation
The urgency of contemplating the future comes to the fore in the cultivation strategies of mixed C. reticulata in the face of climate change and the unpredictability of the future economic market. Simultaneously, by implementing ecological prevention measures, a more holistic solution is provided for the sustainable development of habitats and the economy. The research by [56] proposes coupling climate change adaptation and mitigation measures through agroforestry and ecological preservation. These proposals also suggest reducing the susceptibilities of underprivileged farmers to the effects of climate change and market volatility by diversifying income sources from tree or forest products.
In terms of habitat, mixed species populations are better adapted and their ecological benefits have been verified by numerous studies. Specifically in reducing environmental compatibility issues [41], biodiversity enhancement [57], effective control of pests and diseases [58], optimization of soil quality [59], improvements in water use efficiency [60], and increased resilience to disasters [61]. This largely contributes to the establishment of a healthy and stable ecosystem.
Economically, C. reticulata has a long growth cycle, from planting to the normal fruiting stage of the tree, which takes from 5 to 10 years or more [62]. Fruit growers can address the issue of early returns by planning a mixed cultivation program to rationalize the use of space and improve land utilization before going into production.
In general, mixed species planting effectively supports afforestation, climate adaptation, and pest control, while enhancing biodiversity and ecosystem stability [42]. Analysis of species’ suitable areas will optimize mixed cultivation and promote C. reticulata sustainable industry practices. Global cooperation for carbon neutrality and temperature control will boost eco-friendliness. China remains committed to offering quality fruits worldwide and actively pursuing carbon neutrality.
4.6. Future Research Perspectives
In response to global climate change, integrated multivariate analysis has become an important approach to study the ecological adaptation of crops. The application of a wide range of ecological data including essential climate variables (ECVs) [63] and essential biodiversity variables (EBVs) [64], as well as advanced machine learning techniques [65], will help to more accurately predict the impacts of climate on crops and to develop scientific adaptation strategies.
In future research, the analysis of additional variables can be incorporated. In recent years, there has been a growing focus on the study of biophysical parameters such as chlorophyll fluorescence [66], chlorophyll leaf content [67], and evapotranspiration [68]. These parameters are fundamentally linked to ecosystem services and the prerequisites for ecological development. They enable us to explore the correlations between ideal conditions for development and act as robust indicators for pinpointing potential new cultivation areas.
Secondly, more machine learning algorithms can be utilized to build upon the model in the future. The potential for the application of machine learning techniques to the analysis of complex ecological data is enormous [69]. By integrating environmental factors such as temperature, precipitation, and soil properties, machine learning models can more accurately predict the effects of climate change on species cultivation [70]. Studies have shown that using models such as random forests and support vector machines can forecast crop yields under climate change [71], crop type mapping [72], and optimize farming and management practices [73].
Thirdly, future research could study frequent extreme droughts in greater depth and thus propose ecological adaptation more effectively. The impact of such extreme drought events on agricultural production is significant and cannot be overlooked [74]. By utilizing meteorological data and satellite imagery to monitor drought areas, we can better assess the frequency and severity of droughts in these regions [75,76]. This approach may compensate for the limitations of SSP data, which do not adequately reflect extreme climate conditions.
In conclusion, by integrating multi-source data, conducting long-term series analysis, employing regional drought adaptation strategies, and utilizing advanced machine learning techniques, we can further enhance the scientific and practical value of the research. This will provide reliable scientific evidence and practical guidance for the ecological adaptability and sustainable cultivation of species.
5. Conclusions
In this study, we used the MaxeEnt model to simulate the potential suitability pattern of C. reticulata and its mixed forests for five different periods. These periods include the current, and the 2050s and 2090s, under two greenhouse gas emission scenarios (SSP1.26 and SSP5.85). By analyzing the suitable distribution pattern of C. reticulata and its mixed species L. chinensis, P. granatum, and L. chinense, we assessed the area of potential common habitats and explored the variation in suitable areas to support the planning of C. reticulata and mixed plantation areas. The strategy of introducing mixed species not only enhances the natural functions and adaptive capacity of forests, but also increases the potential of agriculture to provide economic benefits and diverse ecosystem services to society. It is expected to better meet the challenges of future climate change and to guarantee a more significant increase in the ecological resilience and economic sustainability of the C. reticulata industry.
Overall, this study emphasized the importance of agroecological strategies in the context of global climate change challenges and clarified the key role of tree species mixing in combating climate change, maintaining ecosystem balance, and regulating economic fluctuations. The fitness pattern of C. reticulata and its mixed forests was investigated through scientific methods, which provides a reference direction for future cultivation patterns.
Author Contributions
Conceptualization, X.Y., S.W. and Z.W.; methodology, X.Y. and S.W.; validation, X.Y.; formal analysis, X.Y.; investigation, X.Y.; resources, Z.F.; data curation, X.Y.; writing—original draft preparation, X.Y.; writing—review and editing, X.Y., S.W., D.L. and Y.S.; visualization, X.Y.; supervision, Z.F. and Z.W.; project administration, Z.F.; funding acquisition, Z.F. All authors have read and agreed to the published version of the manuscript.
Funding
This study was supported by 5·5 Engineering Research & Innovation Team Project of Beijing Forestry University (BLRC2023A03) and the Natural Science Foundation of Beijing (8232038, 8234065). National Natural Science Foundation of China (42330507) and the Key Research and Development Projects of Ningxia Hui Autonomous Region (2023BEG02050).
Data Availability Statement
The data used to support the findings of this study are available from the corresponding author upon request.
Conflicts of Interest
The authors declare that they have no known competing financial interests or personal relationships that could have appeared to influence the work reported in this paper.
References
- Fei, S.; Desprez, J.M.; Potter, K.M.; Jo, I.; Knott, J.A.; Oswalt, C.M. Divergence of species responses to climate change. Sci. Adv. 2017, 3, e1603055. [Google Scholar] [CrossRef]
- Menezes-Silva, P.E.; Loram-Lourenço, L.; Alves, R.D.F.B.; Sousa, L.F.; Almeida, S.E.d.S.; Farnese, F.S. Different ways to die in a changing world: Consequences of climate change for tree species performance and survival through an ecophysiological perspective. Ecol. Evol. 2019, 9, 11979–11999. [Google Scholar] [CrossRef]
- Benito Garzón, M.; Alía, R.; Robson, T.M.; Zavala, M.A. Intra-specific variability and plasticity influence potential tree species distributions under climate change. Glob. Ecol. Biogeogr. 2011, 20, 766–778. [Google Scholar] [CrossRef]
- Wiens, J.J. Climate-Related Local Extinctions Are Already Widespread among Plant and Animal Species. PLoS Biol. 2016, 14, e2001104. [Google Scholar] [CrossRef]
- Pauchard, A.; Milbau, A.; Albihn, A.; Alexander, J.; Burgess, T.; Daehler, C.; Englund, G.; Essl, F.; Evengård, B.; Greenwood, G.B.; et al. Non-native and native organisms moving into high elevation and high latitude ecosystems in an era of climate change: New challenges for ecology and conservation. Biol. Invasions 2016, 18, 345–353. [Google Scholar] [CrossRef]
- Wang, R.; Yang, H.; Wang, M.; Zhang, Z.; Huang, T.; Wen, G.; Li, Q. Predictions of potential geographical distribution of Diaphorina citri (Kuwayama) in China under climate change scenarios. Sci. Rep. 2020, 10, 9202. [Google Scholar] [CrossRef] [PubMed]
- Alam, K.F.; Ahamed, T. Climate-Adaptive Potential Crops Selection in Vulnerable Agricultural Lands Adjacent to the Jamuna River Basin of Bangladesh Using Remote Sensing and a Fuzzy Expert System. Remote Sens. 2023, 15, 2201. [Google Scholar] [CrossRef]
- Lipper, L.; Thornton, P.; Campbell, B.M.; Baedeker, T.; Braimoh, A.; Bwalya, M.; Caron, P.; Cattaneo, A.; Garrity, D.; Henry, K.; et al. Climate-smart agriculture for food security. Nat. Clim. Chang. 2014, 4, 1068–1072. [Google Scholar] [CrossRef]
- Tabe-Ojong, M.P., Jr.; Aihounton, G.B.D.; Lokossou, J.C. Climate-smart agriculture and food security: Cross-country evidence from West Africa. Glob. Environ. Chang. 2023, 81, 102697. [Google Scholar] [CrossRef]
- Cherchi, A.; Ambrizzi, T.; Behera, S.; Freitas, A.C.V.; Morioka, Y.; Zhou, T. The Response of Subtropical Highs to Climate Change. Curr. Clim. Chang. Rep. 2018, 4, 371–382. [Google Scholar] [CrossRef]
- Saqib, M.; Anjum, M.A.; Ali, M.; Ahmad, R.; Sohail, M.; Zakir, I.; Ahmad, S.; Hussain, S. Horticultural Crops as Affected by Climate Change. In Building Climate Resilience in Agriculture: Theory, Practice and Future Perspective; Jatoi, W.N., Mubeen, M., Ahmad, A., Cheema, M.A., Lin, Z., Hashmi, M.Z., Eds.; Springer International Publishing: Cham, Switzerland, 2022; pp. 95–109. [Google Scholar]
- Callaway, E. Bioterror: The green menace. Nature 2008, 452, 148–150. [Google Scholar] [CrossRef]
- Arutselvan, R.; Pati, K.; Dolatabadian, A.; Dutta, S.K. Citrus Diseases and Management. In Recent Advances in Citrus Fruits; Singh Purewal, S., Punia Bangar, S., Kaur, P., Eds.; Springer International Publishing: Cham, Switzerland, 2023; pp. 501–526. [Google Scholar]
- Khamsaw, P.; Sangta, J.; Chaiwan, P.; Rachtanapun, P.; Sirilun, S.; Sringarm, K.; Thanakkasaranee, S.; Sommano, S.R. Bio-Circular Perspective of Citrus Fruit Loss Caused by Pathogens: Occurrences, Active Ingredient Recovery and Applications. Horticulturae 2022, 8, 748. [Google Scholar] [CrossRef]
- Mahmood, I.; Imadi, S.R.; Shazadi, K.; Gul, A.; Hakeem, K.R. Effects of Pesticides on Environment. In Plant, Soil and Microbes: Volume 1: Implications in Crop Science; Hakeem, K.R., Akhtar, M.S., Abdullah, S.N.A., Eds.; Springer International Publishing: Cham, Switzerland, 2016; pp. 253–269. [Google Scholar]
- Wilson, C.; Tisdell, C. Why farmers continue to use pesticides despite environmental, health and sustainability costs. Ecol. Econ. 2001, 39, 449–462. [Google Scholar] [CrossRef]
- Ledford, H. Geneticists enlist engineered virus and CRISPR to battle citrus disease. Nature 2017, 545, 277–278. [Google Scholar] [CrossRef]
- Djeddour, D.; Pratt, C.; Constantine, K.; Rwomushana, I.; Day, R. The Asian Citrus Greening Disease (Huanglongbing): Evidence Note on Invasiveness and Potential Economic Impacts for East Africa; CABI: Wallingford, UK, 2021. [Google Scholar]
- Wang, S.; Xie, W.; Yan, X. Effects of Future Climate Change on Citrus Quality and Yield in China. Sustainability 2022, 14, 9366. [Google Scholar] [CrossRef]
- Waqar, S.; Summar, A.N.; Rizwana, M.; Muhammad Salman, H.; Muhammad Jafar, J.; Iqrar, A.K. Climate Change and Citrus. In Citrus; Muhammad Sarwar, K., Iqrar Ahmad, K., Eds.; IntechOpen: Rijeka, Croatia, 2021; Chapter 8. [Google Scholar]
- Tan, X.-C.; Wang, Y.; Gu, B.-H.; Kong, L.-S.; Zeng, A. Research on the national climate governance system toward carbon neutrality—A critical literature review. Fundam. Res. 2022, 2, 384–391. [Google Scholar] [CrossRef]
- Chen, L.; Msigwa, G.; Yang, M.; Osman, A.I.; Fawzy, S.; Rooney, D.W.; Yap, P.-S. Strategies to achieve a carbon neutral society: A review. Environ. Chem. Lett. 2022, 20, 2277–2310. [Google Scholar] [CrossRef]
- Xian, Y.; Liu, G.; Zhong, L. Will citrus geographical indications face different climate change challenges in China? J. Clean. Prod. 2022, 356, 131885. [Google Scholar] [CrossRef]
- Fois, M.; Cuena-Lombraña, A.; Fenu, G.; Bacchetta, G. Using species distribution models at local scale to guide the search of poorly known species: Review, methodological issues and future directions. Ecol. Model. 2018, 385, 124–132. [Google Scholar] [CrossRef]
- Gomes, V.H.F.; Ijff, S.D. Species Distribution Modelling: Contrasting presence-only models with plot abundance data. Sci. Rep. 2018, 8, 1003. [Google Scholar] [CrossRef]
- Zhang, M.-G.; Slik, J.W.F.; Ma, K.-P. Using species distribution modeling to delineate the botanical richness patterns and phytogeographical regions of China. Sci. Rep. 2016, 6, 22400. [Google Scholar] [CrossRef]
- Bradie, J.; Leung, B. A quantitative synthesis of the importance of variables used in MaxEnt species distribution models. J. Biogeogr. 2017, 44, 1344–1361. [Google Scholar] [CrossRef]
- Phillips, S.J.; Anderson, R.P.; Dudík, M.; Schapire, R.E.; Blair, M.E. Opening the black box: An open-source release of Maxent. Ecography 2017, 40, 887–893. [Google Scholar] [CrossRef]
- Phillips, S.J.; Anderson, R.P.; Schapire, R.E. Maximum entropy modeling of species geographic distributions. Ecol. Model. 2006, 190, 231–259. [Google Scholar] [CrossRef]
- Merow, C.; Smith, M.J.; Silander, J.A., Jr. A practical guide to MaxEnt for modeling species’ distributions: What it does, and why inputs and settings matter. Ecography 2013, 36, 1058–1069. [Google Scholar] [CrossRef]
- Franklin, J. Mapping Species Distributions: Spatial Inference and Prediction; Cambridge University Press: Cambridge, UK, 2010. [Google Scholar]
- Elith, J.H.; Graham, C.P.H.; Anderson, R.P.; Dudík, M.; Ferrier, S.; Guisan, A.; Hijmans, R.J.; Huettmann, F.; Leathwick, J.R.; Lehmann, A.; et al. Novel methods improve prediction of species’ distributions from occurrence data. Ecography 2006, 29, 129–151. [Google Scholar] [CrossRef]
- Pecchi, M.; Marchi, M.; Burton, V.; Giannetti, F.; Moriondo, M.; Bernetti, I.; Bindi, M.; Chirici, G. Species distribution modelling to support forest management. A literature review. Ecol. Model. 2019, 411, 108817. [Google Scholar] [CrossRef]
- Liu, D.; Lei, X.; Gao, W.; Guo, H.; Xie, Y.; Fu, L.; Lei, Y.; Li, Y.; Zhang, Z.; Tang, S. Mapping the potential distribution suitability of 16 tree species under climate change in northeastern China using Maxent modelling. J. For. Res. 2022, 33, 1739–1750. [Google Scholar] [CrossRef]
- Orhan, O. Land suitability determination for citrus cultivation using a GIS-based multi-criteria analysis in Mersin, Turkey. Comput. Electron. Agric. 2021, 190, 106433. [Google Scholar] [CrossRef]
- Huang, Z.; Li, Z.; Yao, L.; Yuan, Y.; Hong, Z.; Huang, S.; Wang, Y.; Ye, J.; Zhang, L.; Ding, J. Geographical distribution and potential distribution prediction of thirteen species of Citrus L. in China. Environ. Sci. Pollut. Res. 2024, 31, 6558–6571. [Google Scholar] [CrossRef]
- Narouei-Khandan, H.A.; Halbert, S.E.; Worner, S.P.; van Bruggen, A.H.C. Global climate suitability of citrus huanglongbing and its vector, the Asian citrus psyllid, using two correlative species distribution modeling approaches, with emphasis on the USA. Eur. J. Plant Pathol. 2016, 144, 655–670. [Google Scholar] [CrossRef]
- Ajene, I.J.; Khamis, F.; van Asch, B.; Pietersen, G.; Rasowo, B.A.; Ekesi, S.; Mohammed, S. Habitat suitability and distribution potential of Liberibacter species (“Candidatus Liberibacter asiaticus” and “Candidatus Liberibacter africanus”) associated with citrus greening disease. Divers. Distrib. 2020, 26, 575–588. [Google Scholar] [CrossRef]
- Godefroid, M. Species distribution models predicting climate suitability for the psyllid Trioza erytreae, vector of citrus greening disease. Crop Prot. 2023, 168, 106228. [Google Scholar] [CrossRef]
- Kabir, M.J.; Alauddin, M.; Crimp, S. Farm-level adaptation to climate change in Western Bangladesh: An analysis of adaptation dynamics, profitability and risks. Land Use Policy 2017, 64, 212–224. [Google Scholar] [CrossRef]
- Lesica, P.; Allendorf, F.W. Ecological Genetics and the Restoration of Plant Communities: Mix or Match? Restor. Ecol. 1999, 7, 42–50. [Google Scholar] [CrossRef]
- Steckel, M.; del Río, M.; Heym, M.; Aldea, J.; Bielak, K.; Brazaitis, G.; Černý, J.; Coll, L.; Collet, C.; Ehbrecht, M.; et al. Species mixing reduces drought susceptibility of Scots pine (Pinus sylvestris L.) and oak (Quercus robur L., Quercus petraea (Matt.) Liebl.)—Site water supply and fertility modify the mixing effect. For. Ecol. Manag. 2020, 461, 117908. [Google Scholar] [CrossRef]
- Wen, G.; Ye, X.; Lai, W.; Shi, C.; Huang, Q.; Ye, L.; Zhang, G. Dynamic analysis of mixed forest species under climate change scenarios. Ecol. Indic. 2021, 133, 108350. [Google Scholar] [CrossRef]
- Li, M.; Zhang, J.; Liu, S.; Ashraf, U.; Zhao, B.; Qiu, S. Mixed-cropping systems of different rice cultivars have grain yield and quality advantages over mono-cropping systems. J. Sci. Food Agric. 2019, 99, 3326–3334. [Google Scholar] [CrossRef]
- Yan, H.; Feng, L.; Zhao, Y.; Feng, L.; Wu, D.; Zhu, C. Prediction of the spatial distribution of Alternanthera philoxeroides in China based on ArcGIS and MaxEnt. Glob. Ecol. Conserv. 2020, 21, e00856. [Google Scholar] [CrossRef]
- Elith, J.; Phillips, S.J.; Hastie, T.; Dudík, M.; Chee, Y.E.; Yates, C.J. A statistical explanation of MaxEnt for ecologists. Divers. Distrib. 2011, 17, 43–57. [Google Scholar] [CrossRef]
- Luedeling, E.; Girvetz, E.H.; Semenov, M.A.; Brown, P.H. Climate Change Affects Winter Chill for Temperate Fruit and Nut Trees. PLoS ONE 2011, 6, e20155. [Google Scholar] [CrossRef]
- Salama, A.-M.; Ezzat, A.; El-Ramady, H.; Alam-Eldein, S.M.; Okba, S.K.; Elmenofy, H.M.; Hassan, I.F.; Illés, A.; Holb, I.J. Temperate Fruit Trees under Climate Change: Challenges for Dormancy and Chilling Requirements in Warm Winter Regions. Horticulturae 2021, 7, 86. [Google Scholar] [CrossRef]
- Sato, K. Influence of Drought and High Temperature on Citrus. In Abiotic Stress Biology in Horticultural Plants; Kanayama, Y., Kochetov, A., Eds.; Springer: Tokyo, Japan, 2015; pp. 77–86. [Google Scholar]
- Raza, A.; Razzaq, A.; Mehmood, S.S.; Zou, X.; Zhang, X.; Lv, Y.; Xu, J. Impact of Climate Change on Crops Adaptation and Strategies to Tackle Its Outcome: A Review. Plants 2019, 8, 34. [Google Scholar] [CrossRef]
- Miller, A.J.; Gross, B.L. From forest to field: Perennial fruit crop domestication. Am. J. Bot. 2011, 98, 1389–1414. [Google Scholar] [CrossRef]
- Reddy, P.P. Climate Change Adaptation. In Climate Resilient Agriculture for Ensuring Food Security; Springer: New Delhi, India, 2015; pp. 223–272. [Google Scholar]
- Nair, P.K.R. Climate Change Mitigation: A Low-Hanging Fruit of Agroforestry. In Agroforestry—The Future of Global Land Use; Nair, P.K.R., Garrity, D., Eds.; Springer: Dordrecht, The Netherlands, 2012; pp. 31–67. [Google Scholar]
- Christmas, M.J.; Breed, M.F.; Lowe, A.J. Constraints to and conservation implications for climate change adaptation in plants. Conserv. Genet. 2016, 17, 305–320. [Google Scholar] [CrossRef]
- Pecl, G.T.; Araújo, M.B.; Bell, J.D.; Blanchard, J.; Bonebrake, T.C.; Chen, I.-C.; Clark, T.D.; Colwell, R.K.; Danielsen, F.; Evengård, B.; et al. Biodiversity redistribution under climate change: Impacts on ecosystems and human well-being. Science 2017, 355, eaai9214. [Google Scholar] [CrossRef]
- Matocha, J.; Schroth, G.; Hills, T.; Hole, D. Integrating Climate Change Adaptation and Mitigation Through Agroforestry and Ecosystem Conservation. In Agroforestry—The Future of Global Land Use; Nair, P.K.R., Garrity, D., Eds.; Springer: Dordrecht, The Netherlands, 2012; pp. 105–126. [Google Scholar]
- Brooker, R.W.; George, T.S.; Homulle, Z.; Karley, A.J.; Newton, A.C.; Pakeman, R.J.; Schöb, C. Facilitation and biodiversity–ecosystem function relationships in crop production systems and their role in sustainable farming. J. Ecol. 2021, 109, 2054–2067. [Google Scholar] [CrossRef]
- Malézieux, E.; Crozat, Y.; Dupraz, C.; Laurans, M.; Makowski, D.; Ozier-Lafontaine, H.; Rapidel, B.; de Tourdonnet, S.; Valantin-Morison, M. Mixing Plant Species in Cropping Systems: Concepts, Tools and Models: A Review. In Sustainable Agriculture; Lichtfouse, E., Navarrete, M., Debaeke, P., Véronique, S., Alberola, C., Eds.; Springer: Dordrecht, The Netherlands, 2009; pp. 329–353. [Google Scholar]
- Hei, Z.; Xiang, H.; Zhang, J.; Liang, K.; Zhong, J.; Li, M.; Ren, X. Mix-cropping of rice and water mimosa (Neptunia oleracea Lour.) increases rice photosynthetic efficiency, yield, grain quality and soil available nutrients. J. Sci. Food Agric. 2022, 102, 3972–3982. [Google Scholar] [CrossRef]
- Gaba, S.; Lescourret, F.; Boudsocq, S.; Enjalbert, J.; Hinsinger, P.; Journet, E.-P.; Navas, M.-L.; Wery, J.; Louarn, G.; Malézieux, E.; et al. Multiple cropping systems as drivers for providing multiple ecosystem services: From concepts to design. Agron. Sustain. Dev. 2015, 35, 607–623. [Google Scholar] [CrossRef]
- Altieri, M.A.; Nicholls, C.I.; Henao, A.; Lana, M.A. Agroecology and the design of climate change-resilient farming systems. Agron. Sustain. Dev. 2015, 35, 869–890. [Google Scholar] [CrossRef]
- Zamski, E.; Schaffer, A.A. Photoassimilate Distribution in Plants and Crops: Source-Sink Relationships; Routledge: New York, NY, USA, 1996. [Google Scholar]
- Bojinski, S.; Verstraete, M.; Peterson, T.C.; Richter, C.; Simmons, A.; Zemp, M. The Concept of Essential Climate Variables in Support of Climate Research, Applications, and Policy. Bull. Am. Meteorol. Soc. 2014, 95, 1431–1443. [Google Scholar] [CrossRef]
- Reddy, C.S.; Satish, K.V.; Saranya, K.R.L.; Sri Surya, N.N.; Neha, P.A.; Rajashekar, G. Harnessing essential biodiversity variables and remote sensing of earth observations—Synthesizing biodiversity insights. Spat. Inf. Res. 2024, 32, 265–276. [Google Scholar] [CrossRef]
- Sharma, A.; Jain, A.; Gupta, P.; Chowdary, V. Machine Learning Applications for Precision Agriculture: A Comprehensive Review. IEEE Access 2021, 9, 4843–4873. [Google Scholar] [CrossRef]
- Bartold, M.; Kluczek, M. A Machine Learning Approach for Mapping Chlorophyll Fluorescence at Inland Wetlands. Remote Sens. 2023, 15, 2392. [Google Scholar] [CrossRef]
- Qian, X.; Liu, L.; Chen, X.; Zhang, X.; Chen, S.; Sun, Q. Global Leaf Chlorophyll Content Dataset (GLCC) from 2003–2012 to 2018–2020 Derived from MERIS and OLCI Satellite Data: Algorithm and Validation. Remote Sens. 2023, 15, 700. [Google Scholar] [CrossRef]
- Chatterjee, S.; Kandiah, R.; Watts, D.; Sritharan, S.; Osterberg, J. Estimating Completely Remote Sensing-Based Evapotranspiration for Salt Cedar (Tamarix ramosissima), in the Southwestern United States, Using Machine Learning Algorithms. Remote Sens. 2023, 15, 5021. [Google Scholar] [CrossRef]
- Tuia, D.; Kellenberger, B.; Beery, S.; Costelloe, B.R.; Zuffi, S.; Risse, B.; Mathis, A.; Mathis, M.W.; van Langevelde, F.; Burghardt, T.; et al. Perspectives in machine learning for wildlife conservation. Nat. Commun. 2022, 13, 792. [Google Scholar] [CrossRef] [PubMed]
- Singh, S.; Babu, K.V.S.; Singh, S. Chapter 15—Machine learning approach for climate change impact assessment in agricultural production. In Visualization Techniques for Climate Change with Machine Learning and Artificial Intelligence; Srivastav, A., Dubey, A., Kumar, A., Kumar Narang, S., Ali Khan, M., Eds.; Elsevier: Amsterdam, The Netherlands, 2023; pp. 317–335. [Google Scholar]
- Dhillon, R.; Takoo, G.; Sharma, V.; Nagle, M. Utilizing Machine Learning Framework to Evaluate the Effect of Climate Change on Maize and Soybean Yield. Comput. Electron. Agric. 2024, 221, 108982. [Google Scholar] [CrossRef]
- Wang, S.; Azzari, G.; Lobell, D.B. Crop type mapping without field-level labels: Random forest transfer and unsupervised clustering techniques. Remote Sens. Environ. 2019, 222, 303–317. [Google Scholar] [CrossRef]
- Kok, Z.H.; Mohamed Shariff, A.R.; Alfatni, M.S.M.; Khairunniza-Bejo, S. Support Vector Machine in Precision Agriculture: A review. Comput. Electron. Agric. 2021, 191, 106546. [Google Scholar] [CrossRef]
- Huang, F.; Liu, L.; Gao, J.; Yin, Z.; Zhang, Y.; Jiang, Y.; Zuo, L.; Fang, W. Effects of extreme drought events on vegetation activity from the perspectives of meteorological and soil droughts in southwestern China. Sci. Total Environ. 2023, 903, 166562. [Google Scholar] [CrossRef] [PubMed]
- Dabrowska-Zielinska, K.; Bochenek, Z.; Malinska, A.; Bartold, M.; Gurdak, R.; Lagiewska, M.; Paradowski, K. Drought Assessment Applying Joined Meteorological and Satellite Data. In Proceedings of the 2021 IEEE International Geoscience and Remote Sensing Symposium IGARSS, Brussels, Belgium, 11–16 July 2021; pp. 6591–6594. [Google Scholar]
- Dąbrowska-Zielińska, K.; Ciołkosz, A.; Malińska, A.; Bartold, M. Monitoring of Agricultural Drought in Poland Using Data Derived from Environmental Satellite Images; Instytut Geodezji i Kartografii: Warszawa, Poland, 2011. [Google Scholar]


Disclaimer/Publisher’s Note: The statements, opinions and data contained in all publications are solely those of the individual author(s) and contributor(s) and not of MDPI and/or the editor(s). MDPI and/or the editor(s) disclaim responsibility for any injury to people or property resulting from any ideas, methods, instructions or products referred to in the content. |
© 2024 by the authors. Licensee MDPI, Basel, Switzerland. This article is an open access article distributed under the terms and conditions of the Creative Commons Attribution (CC BY) license (https://creativecommons.org/licenses/by/4.0/).