Article

Generation of High-Resolution Blending Data Using Gridded Visibility Data and GK2A Fog Product

1
Department of Atmospheric Science, Kongju National University, 56, Gongjudaehak-ro, Gongju-si 32588, Republic of Korea
2
Air Force Weather Group, Republic of Korea Air Force, Gyeryong-si 32801, Republic of Korea
*
Author to whom correspondence should be addressed.
Remote Sens. 2024, 16(13), 2350; https://doi.org/10.3390/rs16132350
Submission received: 16 May 2024 / Revised: 18 June 2024 / Accepted: 24 June 2024 / Published: 27 June 2024

Abstract

:
In this study, 10 min and 2 km high-resolution blended fog data (HRBFD) were generated using grid visibility data (GVD) and data from a GK2A (GEO-KOMPSAT-2A) fog product (GKFP) in Korea. As the blending method, the decision tree method (DTM) was used to consider the different characteristics of the two-input data (categorical data and continuity data). The blending of the two datasets was performed according to the presence or absence of the input data and considered the spatial representation of the GVD and the accuracy of the GKFP. The quality of the HRBFD was evaluated through visual comparison using GVD, GKFP, and visible images of the GK2A. The HRBFD seems to have partly solved the problem of fog detection in areas where visibility meters are rare or absent through the detection of fog occurring in the sea or mountain areas. In addition, the critical problem of the GKFP, which has limitations in detecting fog occurring under clouds, has been mostly overcome. Using the DTM, we generated 23 fog cases of 10 min and 2 km HRBFD. The results confirmed that detailed spatiotemporal characteristics of fog in Korea can be analyzed if such HRBFD is generated for a long time.

1. Introduction

Fog is a meteorological phenomenon in which horizontal visibility is reduced to less than 1 km due to minute water droplets or ice crystals floating near the surface [1,2,3,4,5]. The extreme reduction in visibility when fog occurs not only causes obstacles to the operation of all transportation systems but inhibits the spread of pollutants and causes the corrosion of cultural assets [6,7,8,9,10,11,12]. In addition, the fatality rate of traffic accidents due to fog is 3.9 per 100 cases, which is higher than other meteorological phenomena [13]. Therefore, to reduce the damage caused by fog, it is primarily necessary to accurately detect (or observe) the fog occurrence area [14].
There are two methods for detecting fog: a method of naked-eye observation, or using a visibility meter in the field, and a method using satellite data. There are advantages and disadvantages to detecting fog using visibility meters and using satellite data. The visibility meter objectively measures visibility by using the properties of fog that affect light dissipation [15,16]. The visibility meter has the advantage of a short observation period (1 min) and relatively high accuracy [16,17]. However, due to the nature of the measurement method, spatial representation is basically low, and the detection accuracy varies greatly depending on the visibility meter model. In addition, most visibility meters are installed in urban areas where installation and operation are easy, so there are relatively few observation points in the sea or in mountain areas. On the other hand, satellites have the advantage of being able to observe both land and sea with high spatiotemporal resolution (10 min and 2 km (daytime 500 m)) [18,19,20]. However, fog cannot be detected in the presence of clouds because satellites cannot obtain information near the ground, and there is a problem with relatively low accuracy compared to field observation.
Various meteorological phenomena occur continuously over time and space, but the observation systems currently in operation have limitations in observing their temporal and spatial variability. Therefore, attempts are being made to blend various types of observation data (e.g., ground/aerological observation, radar, and satellite) and numerical model data to produce data suitable for analyzing the temporal and spatial characteristics of various meteorological phenomena. Among them, studies have been actively conducted to produce high-resolution grid data on major climate elements such as precipitation, temperature, and aerosols [21,22,23,24,25,26,27]. Lee et al. [22] and Jang et al. [23] used a synthesis method of the weighted average of satellite data and radar data to produce high-quality grid-type precipitation data. Lee et al. [26] blended the two datasets using the optimal interpolation (OI) method using the Kalman filter to use the ground observation data and the satellite data as the initial field of the model. Lim et al. [24] used a method of blending three satellite datasets to produce aerosol optical thickness data with high spatial-temporal continuity and high accuracy. In addition, Egli et al. [28] attempted to blend the cloud mask data of the satellite and the cloud base altitude (CBA) among ground observation data to use it as input data for a fog detection algorithm using a random forest. Until recently, however, few studies have been conducted to blend data on visibility, and in Korea, there is no research on the blending of available data to produce high-resolution grid-type visibility or fog data. Therefore, considering the strong locality and temporal variability of fog, decision tree techniques were used to generate gridded fog data by considering the different nature of the two datasets.

2. Materials and Methods

2.1. Materials

To generate high-resolution grid-type fog monitoring data, we utilized the grid-type visibility data (GVD) from Kang and Suh [29], the GK2A fog products (GKFP), and the land–sea mask data from Han et al. [30]. Table 1 summarizes the characteristics of the data used in this study. The GVD is data obtained by interpolating the visibility data using the inverse distance weighting (IDW) method and is a continuous variable whose unit is km. The GVD includes inland and some coastal areas in South Korea, with a period of 10 min and a spatial resolution of 2 km. The final output of the GK2A fog detection algorithm is a categorical variable indicating the presence of fog (1–7) and quality (0–15) for each pixel as the fog detection result and quality data. The GKFP is data with a spatial resolution of 2 km for the East Asian region every 10 min. To use the accurate GKFP, only high-quality pixels (QC flag = 0) among the fog detection results were used in this study. In addition, 23 fog cases presented in Table 2 were used to construct the blended grid-type fog data and to analyze the characteristics of fog occurrence in South Korea.
Figure 1 shows the region of high-resolution blended fog data (HRBFD) generated by blending the GVD and the GKFP with visibility data. This region includes South Korea’s inland and coastal areas, Jeju Island, and its surrounding sea. To analyze the characteristics of fog occurrence in the inland area and surrounding coastal areas in South Korea using the HRBFD, the land–sea mask data of GK2A provided by the National Meteorological Satellite Center (NMSC) was reclassified into the land, coast, and sea (Figure 1). Additionally, altitude data provided by the NMSC was used to analyze the fog occurrence characteristics according to altitude.

2.2. Methods

The GVD is a continuous variable with a range of 0–20 km, and the GKFP is a categorical variable indicating the presence or absence of fog. Because the variable characteristics of the two datasets are different, it is difficult to use techniques such as average, ensemble, and data assimilation. Therefore, in this study, the two datasets were blended using the decision tree method (DTM) that can be applied to categorical variables. The DTM is one of the machine-learning methods. First developed by Leo Brayman and colleagues in 1984, the DTM is a flexible and automated technique for learning the relationship rules between predictor and outcome variables [32]. In addition, the learning and reasoning speed is fast, and the relationship between predictor variables can be easily interpreted [32,33]. However, due to its sensitivity to thresholds, it may suffer from overfitting in certain cases. To solve this problem, a random forest model employing multiple decision trees has been developed. Unlike the DTM, this model is not possible for intuitive interpretability [32]. Therefore, in this study, we developed a technique that combines the GVD with the GKFPs using the DTM, which has a fast calculation speed and is capable of physical analysis.
Figure 2 illustrates the method of blending GVD and GKFPs, which can be categorized into three types based on the presence of data: when both GVD and GKFP data exist, when only GVD exists, and when only GKFP data exists. First, when both datasets are normally present, pixels with the same result in the two datasets were classified as fog (Both fog, Code 1) or non-fog (Both non-fog, Code 4 and 5). At this time, in order to solve the data smoothing problem that occurs when calculating GVD, among pixels with grid-type visibility of 1 km or more (non-fog pixels), the cases where the average visibility of the surrounding 3 × 3 pixels is less than 2 km were reclassified as a probable fog pixel (Prob_fog, Code 4). Here, the threshold value of average visibility of 2 km was taken into consideration, considering the locality of the fog, the limit of IDW, and the limitation of the visibility meter. Non-fog in the GKFP includes not only non-fog pixels but also middle-high clouds over the fog, localized fog with sub-pixel size, edges of fog, etc. Also, in the case of GVD, when the visibility of nearby observation points is high, it is difficult to estimate the visibility of less than 1 km due to the nature of the interpolation method. Therefore, when there is a disparity between the two datasets—if only the GVD indicates fog (Vis_Only_fog; visibility < 1 km, Code 2) or only the GKFP indicates fog (GK2A_Only_fog, Code 3)—the grid is classified as fog to address the limitations of both datasets.
Second, the accuracy of the GKFP is low due to the absence of GK2A data (e.g., wheel off-loading, albedo monitoring, visible channel test, etc.) and the quality deterioration of Level 1B (L1B) or Level 2 (L2) data from the GK2A. That is, in the case where only GVD exists, according to the meteorological definition of fog, pixels with grid visibility of less than 1 km are fog pixels (Vis_Only_fog, Code 6), and non-fog pixels with an average visibility of the surrounding 3 × 3 pixels of less than 2 km are probably fog pixels (Prob_fog, Code 7). The remaining pixels are classified as non-fog pixels (Code 8).
Third, there is no GVD, which is a typical case in the sea area where there is no ground observation data. In this case, since we have no choice but to rely on the satellite’s fog detection data, it was classified into fog (Code 9) or non-fog (Code 10) according to the GKFPs.
Finally, HRBFD was generated at intervals of 2 km every 10 min for the area shown in Figure 1. Like the GKFP, the product is categorical data classified from 1 to 10, and the value description is summarized in Table 3.

3. Results

3.1. Qualitative Analysis

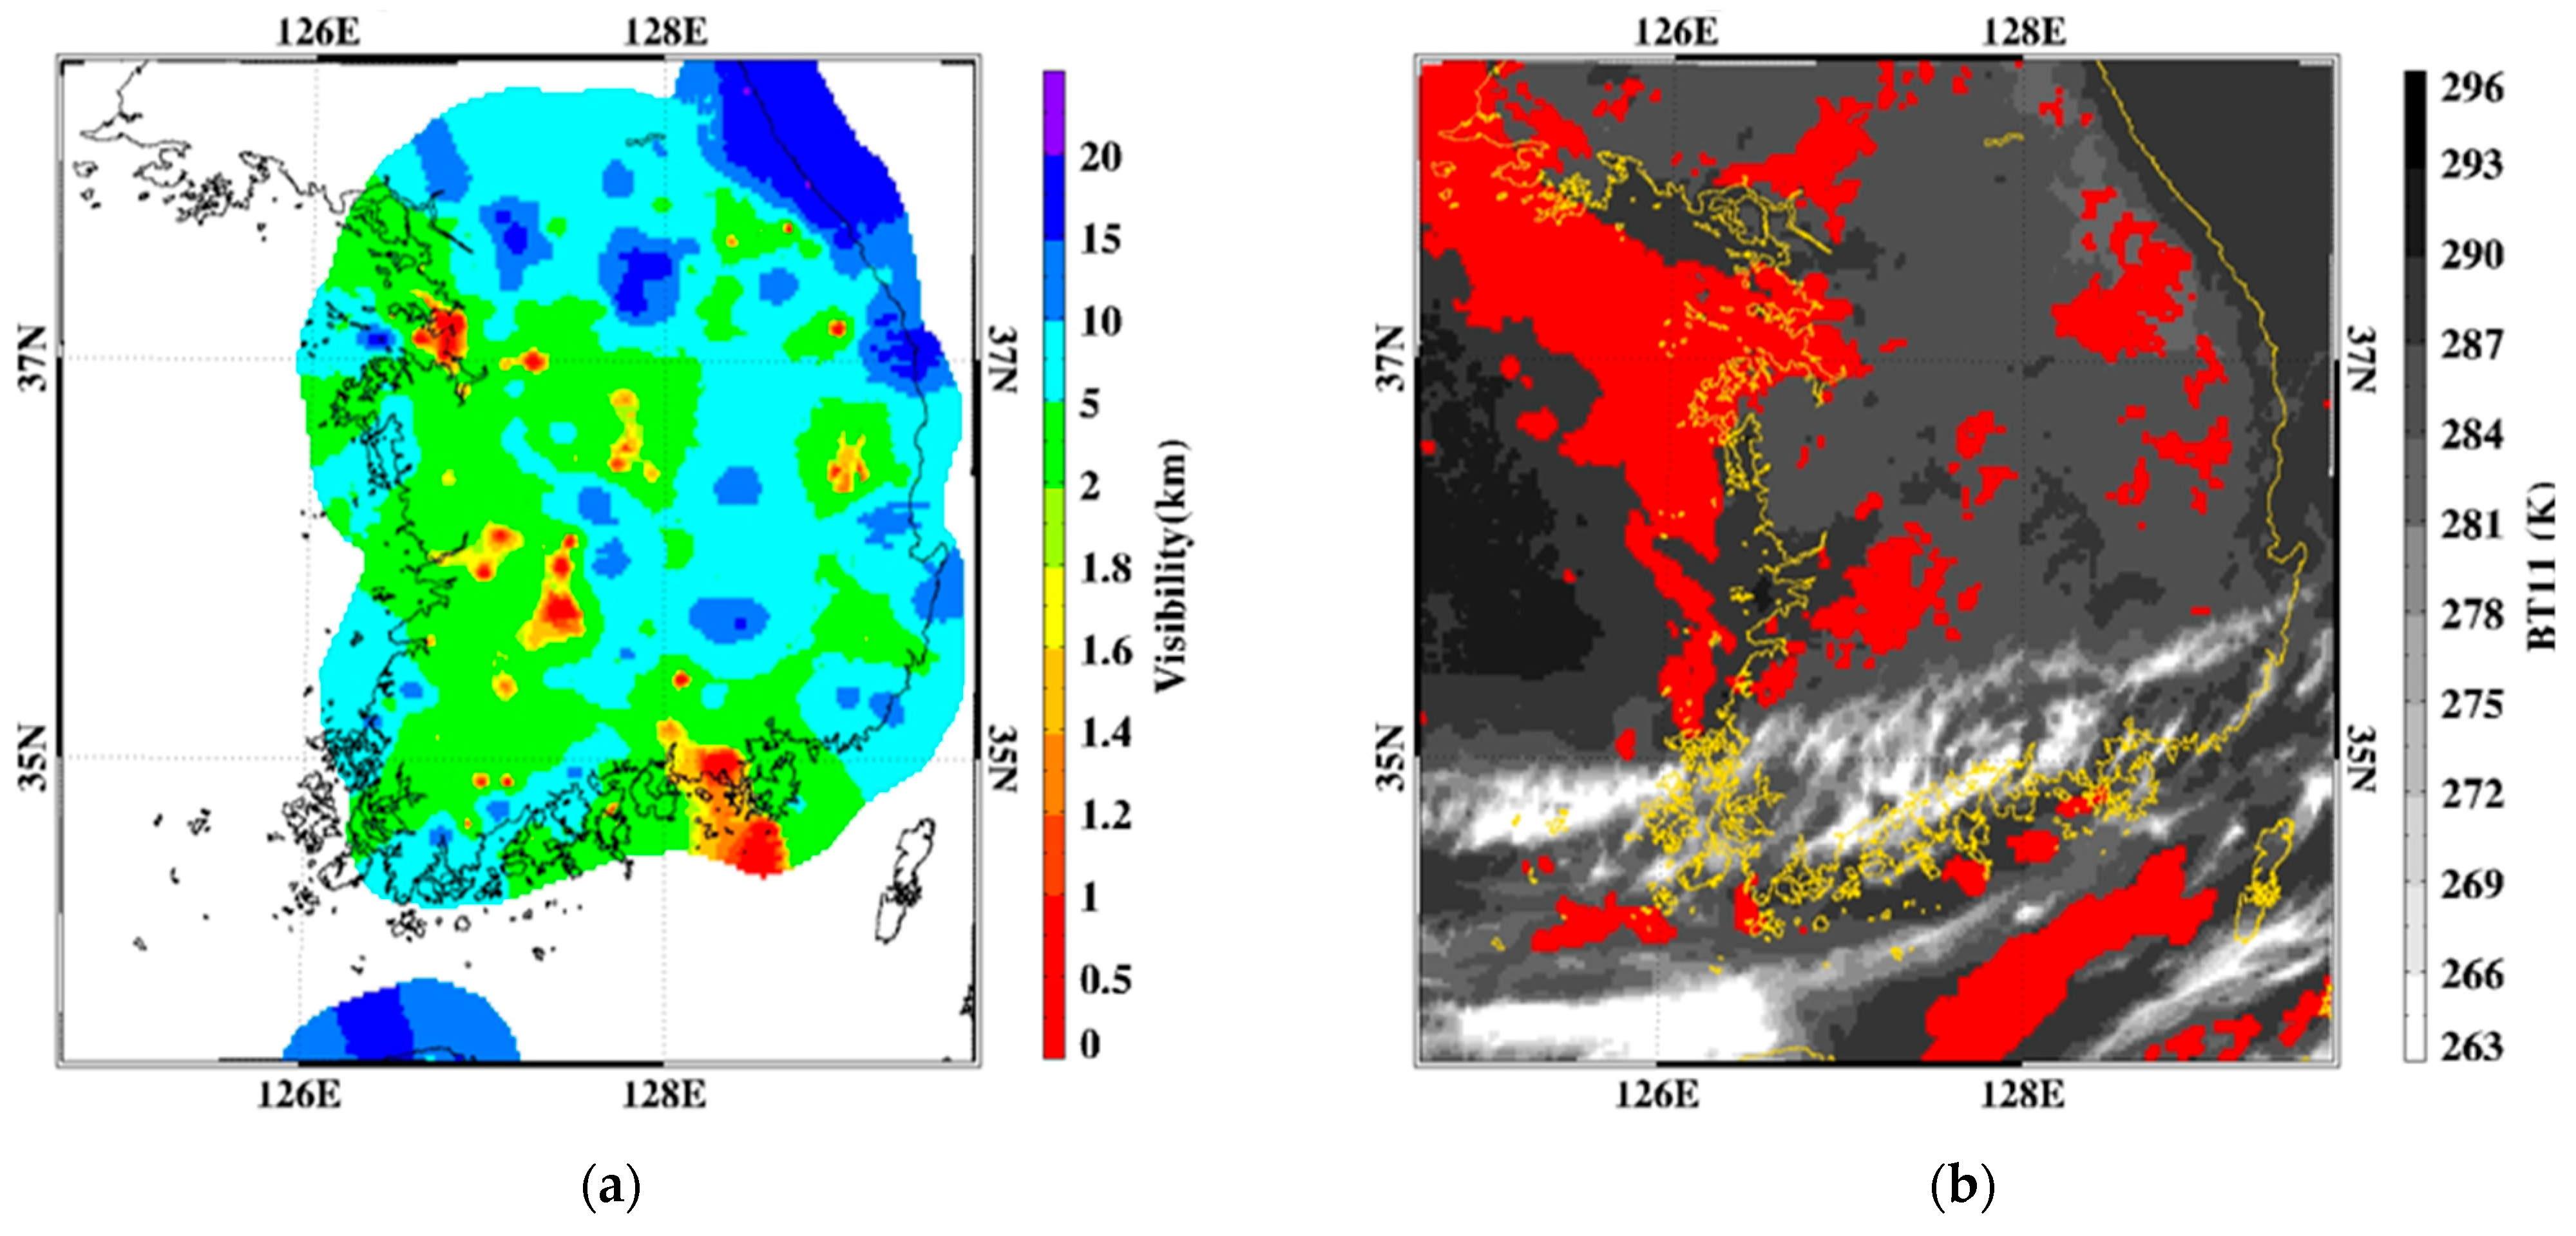
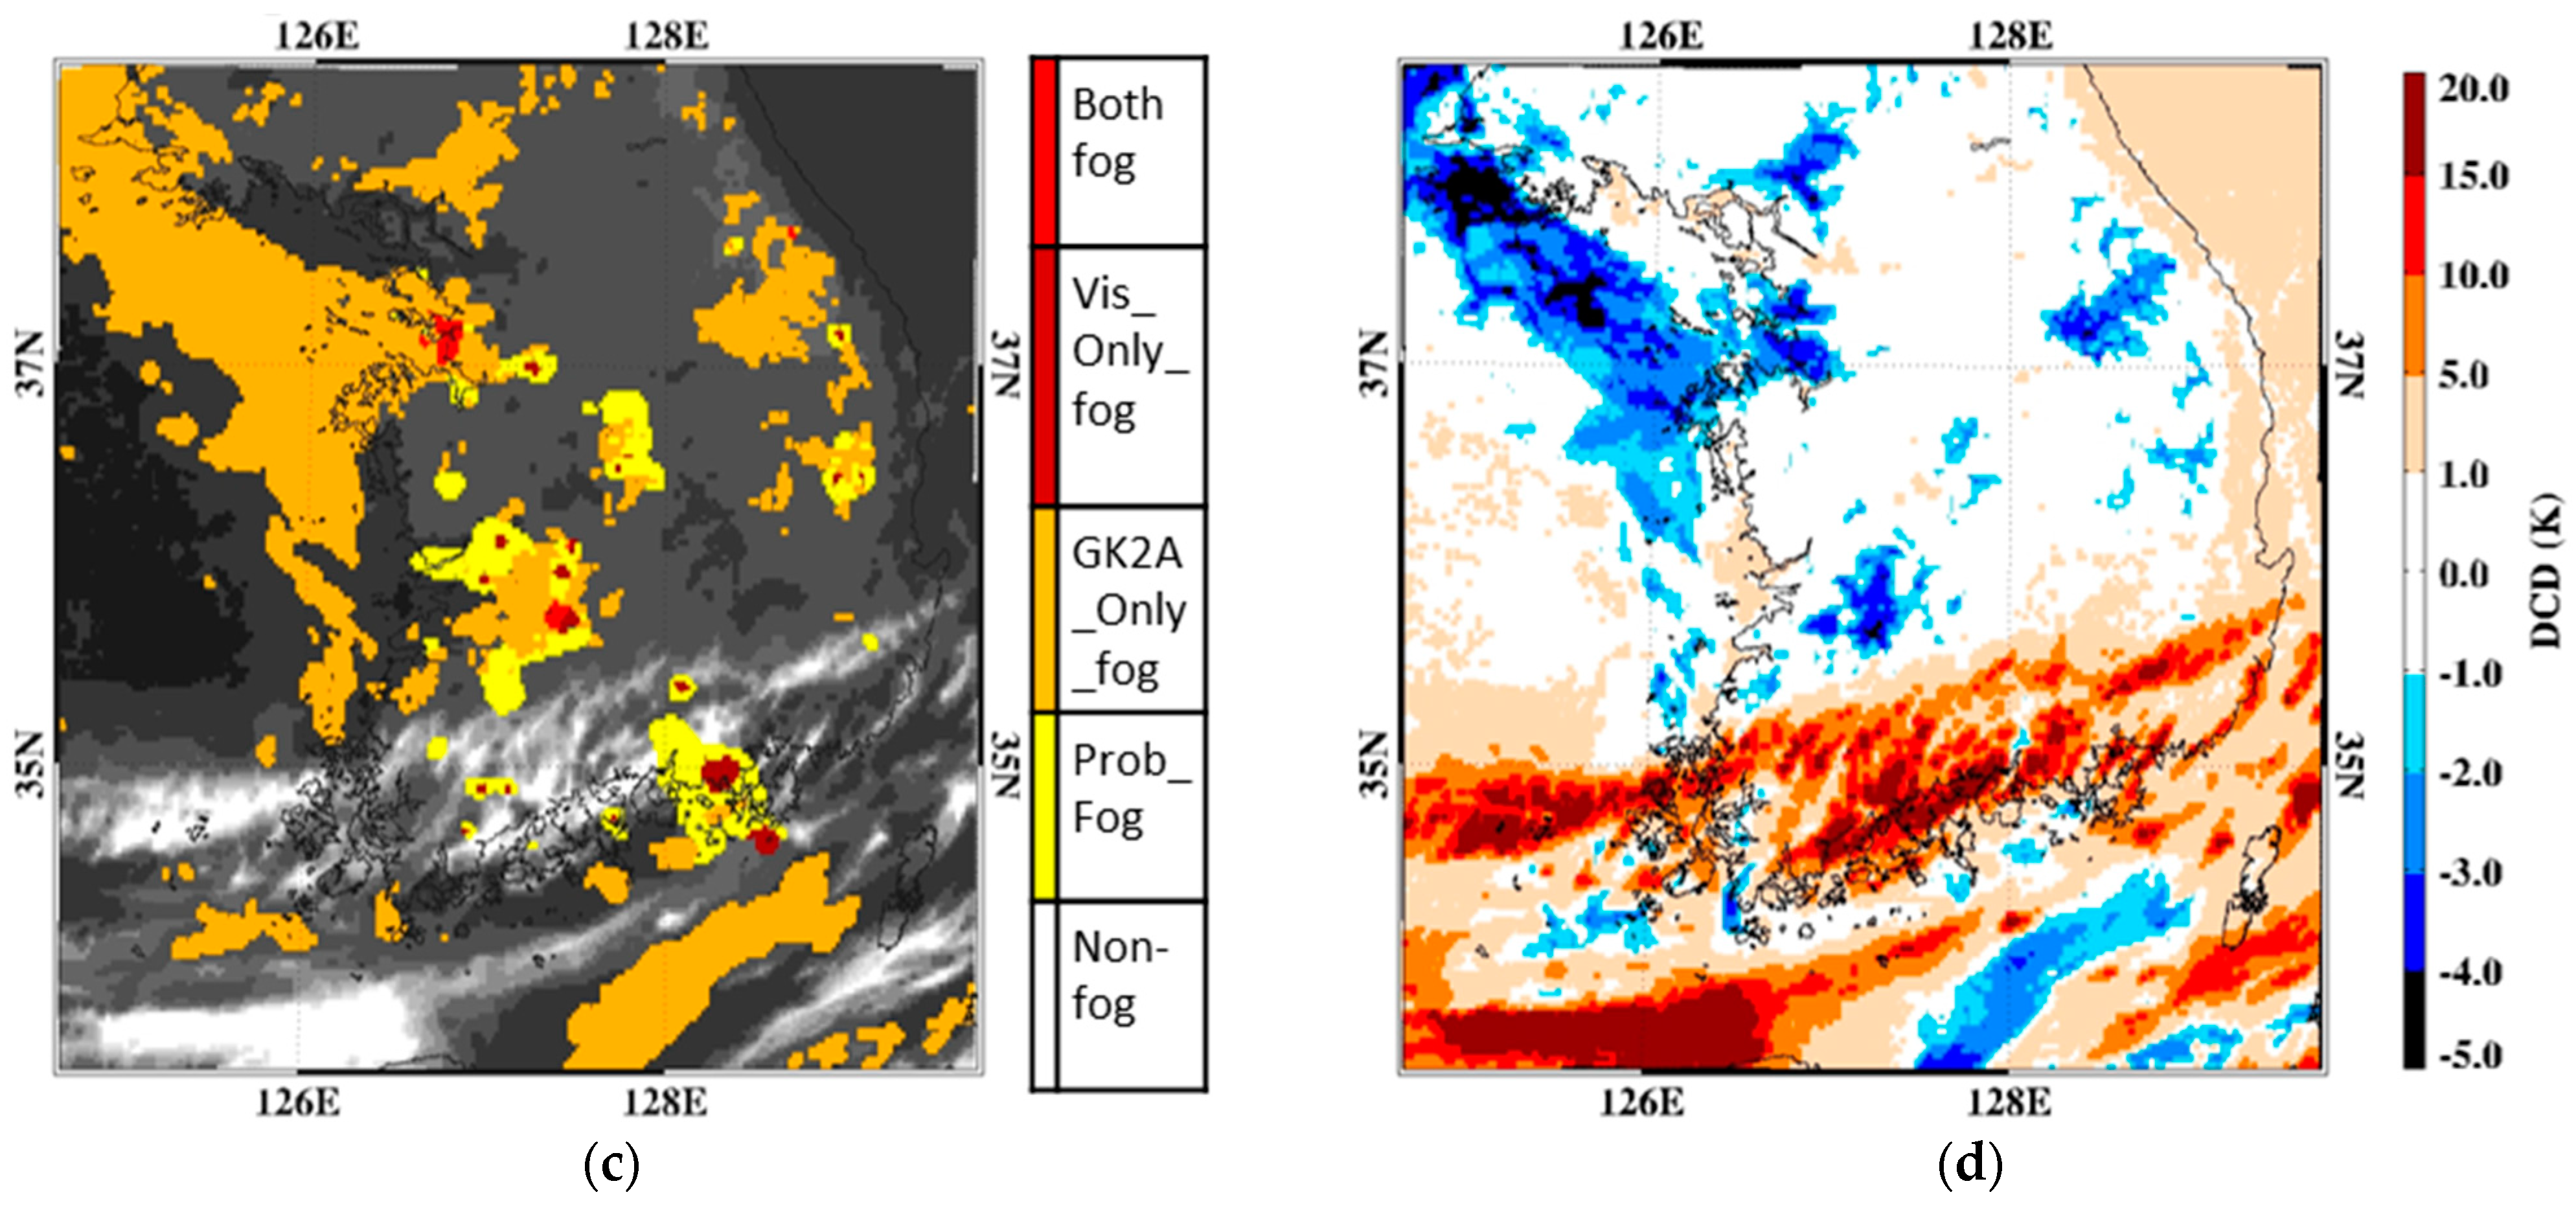
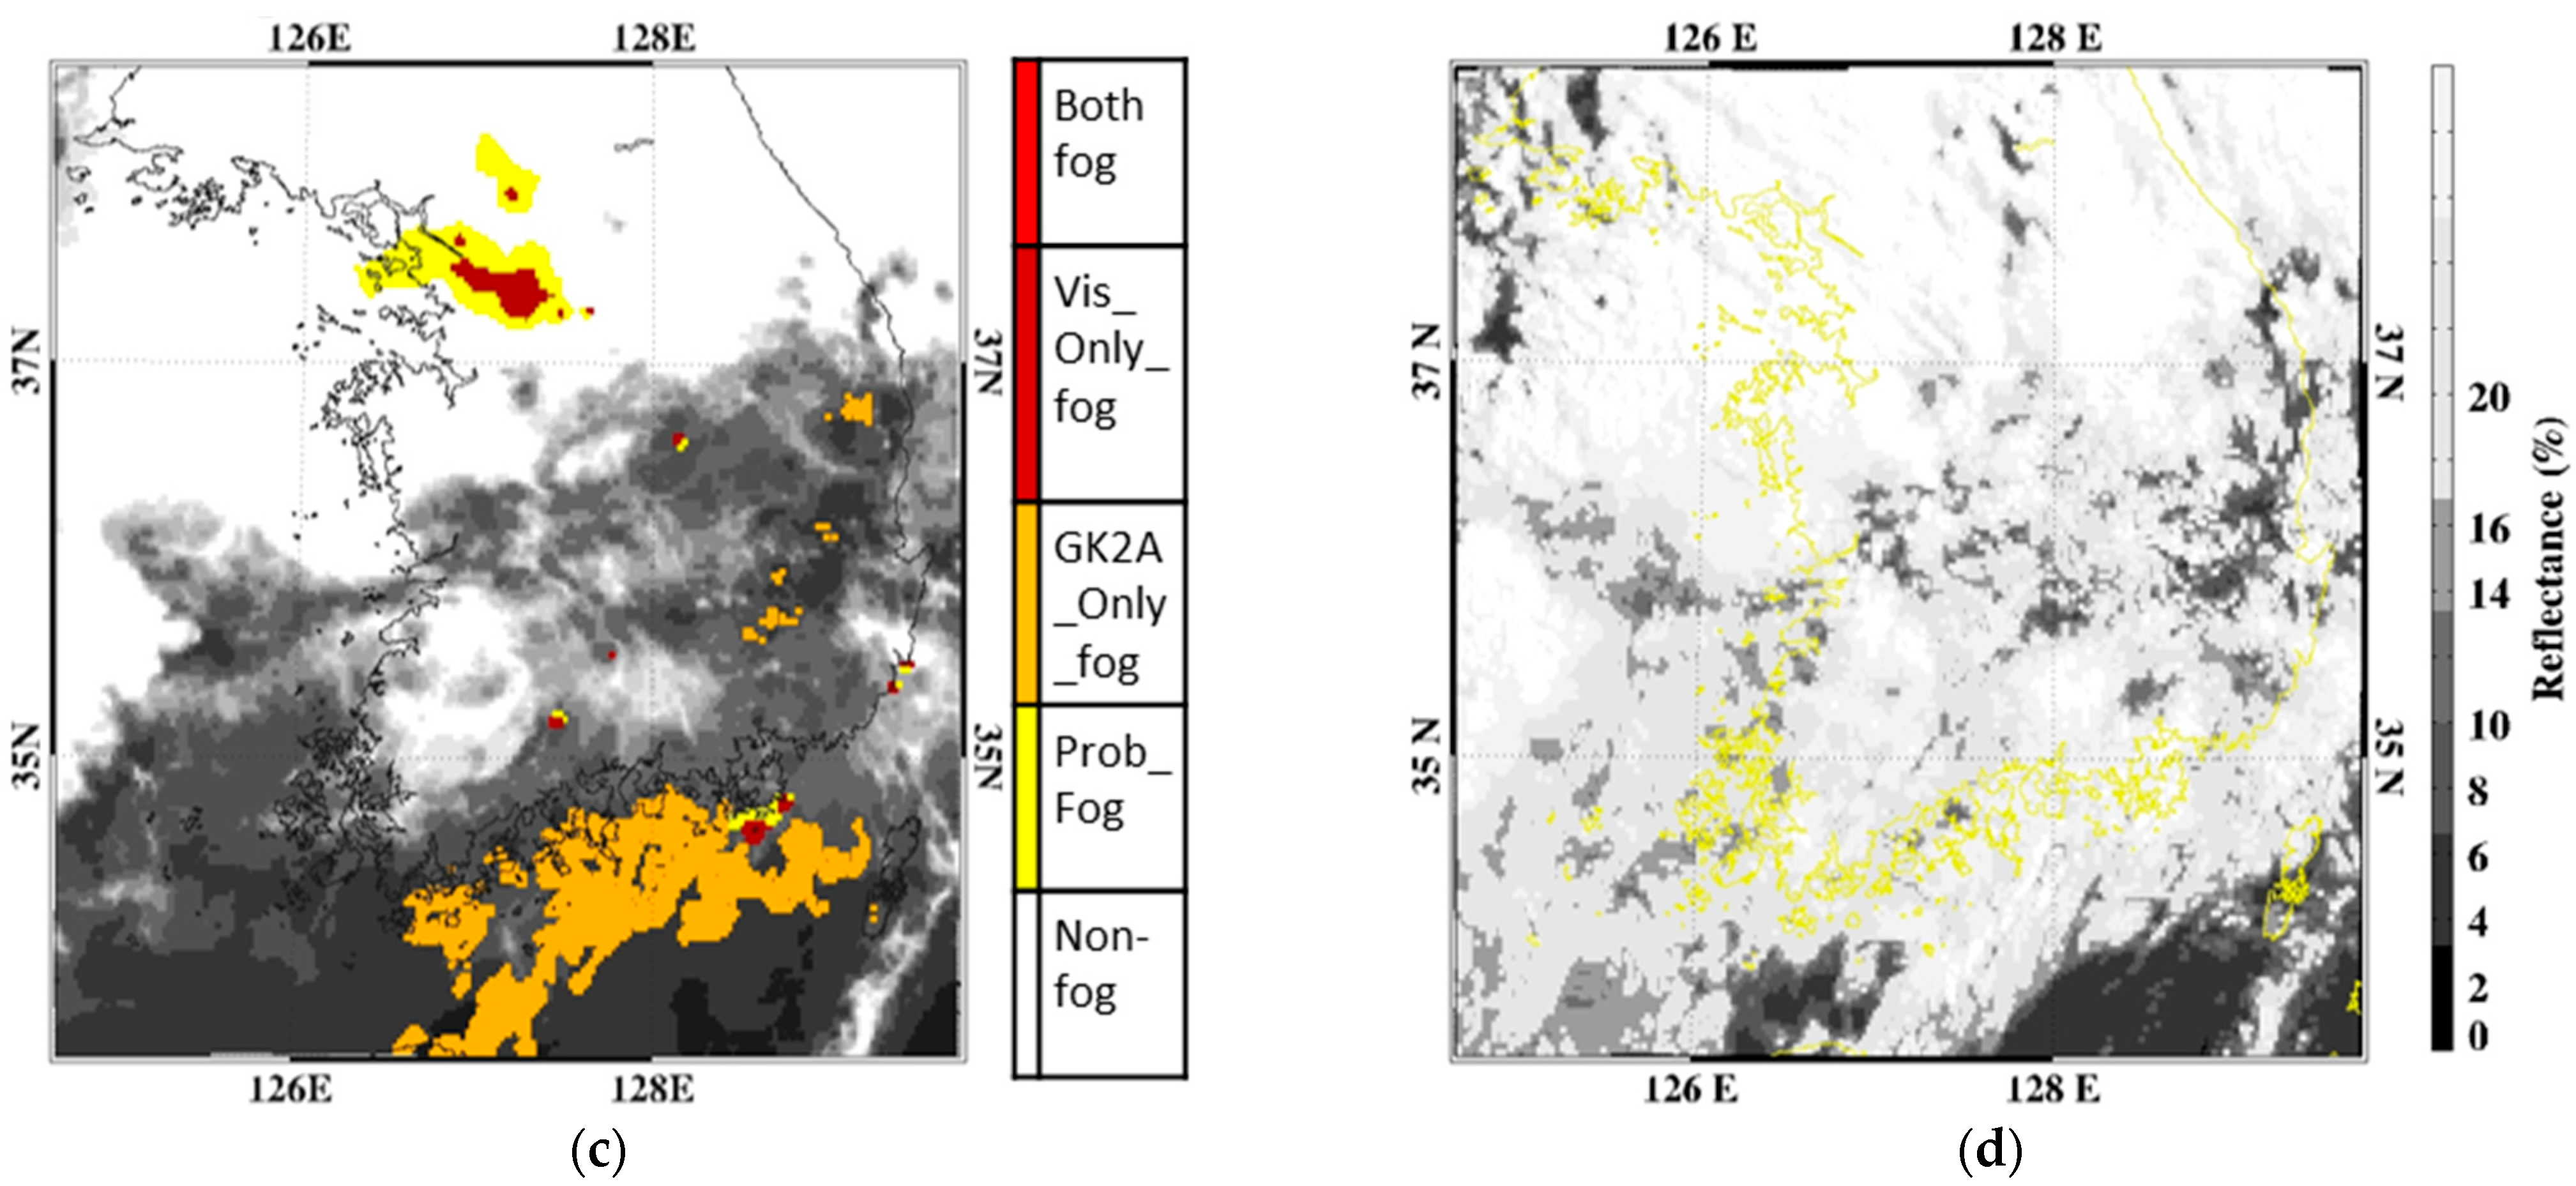
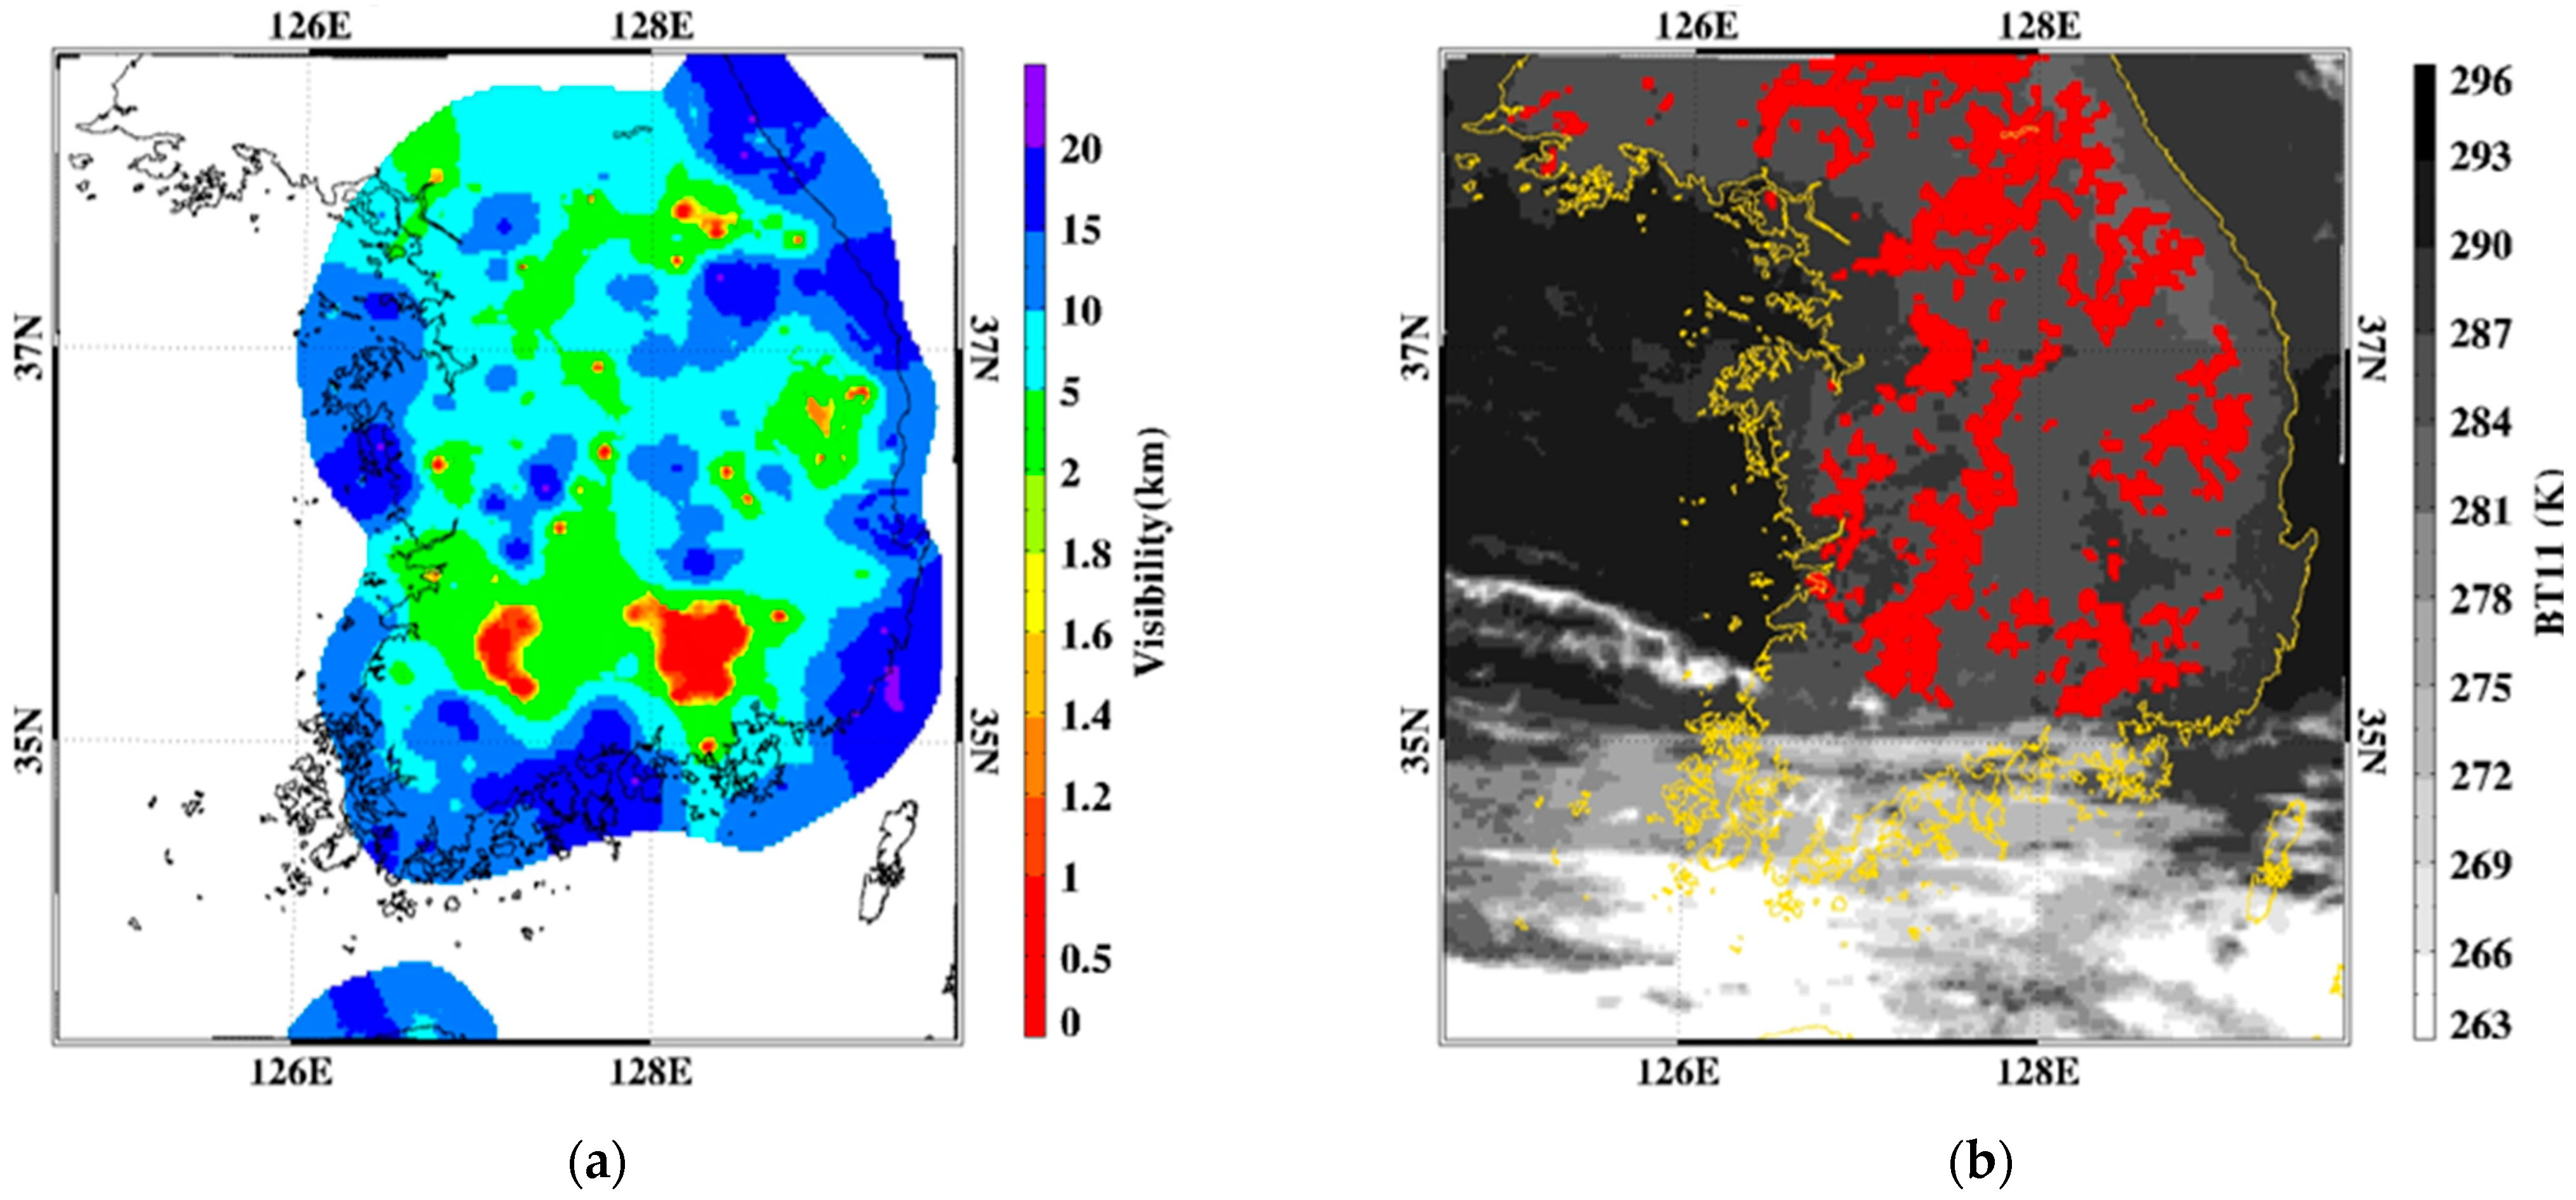
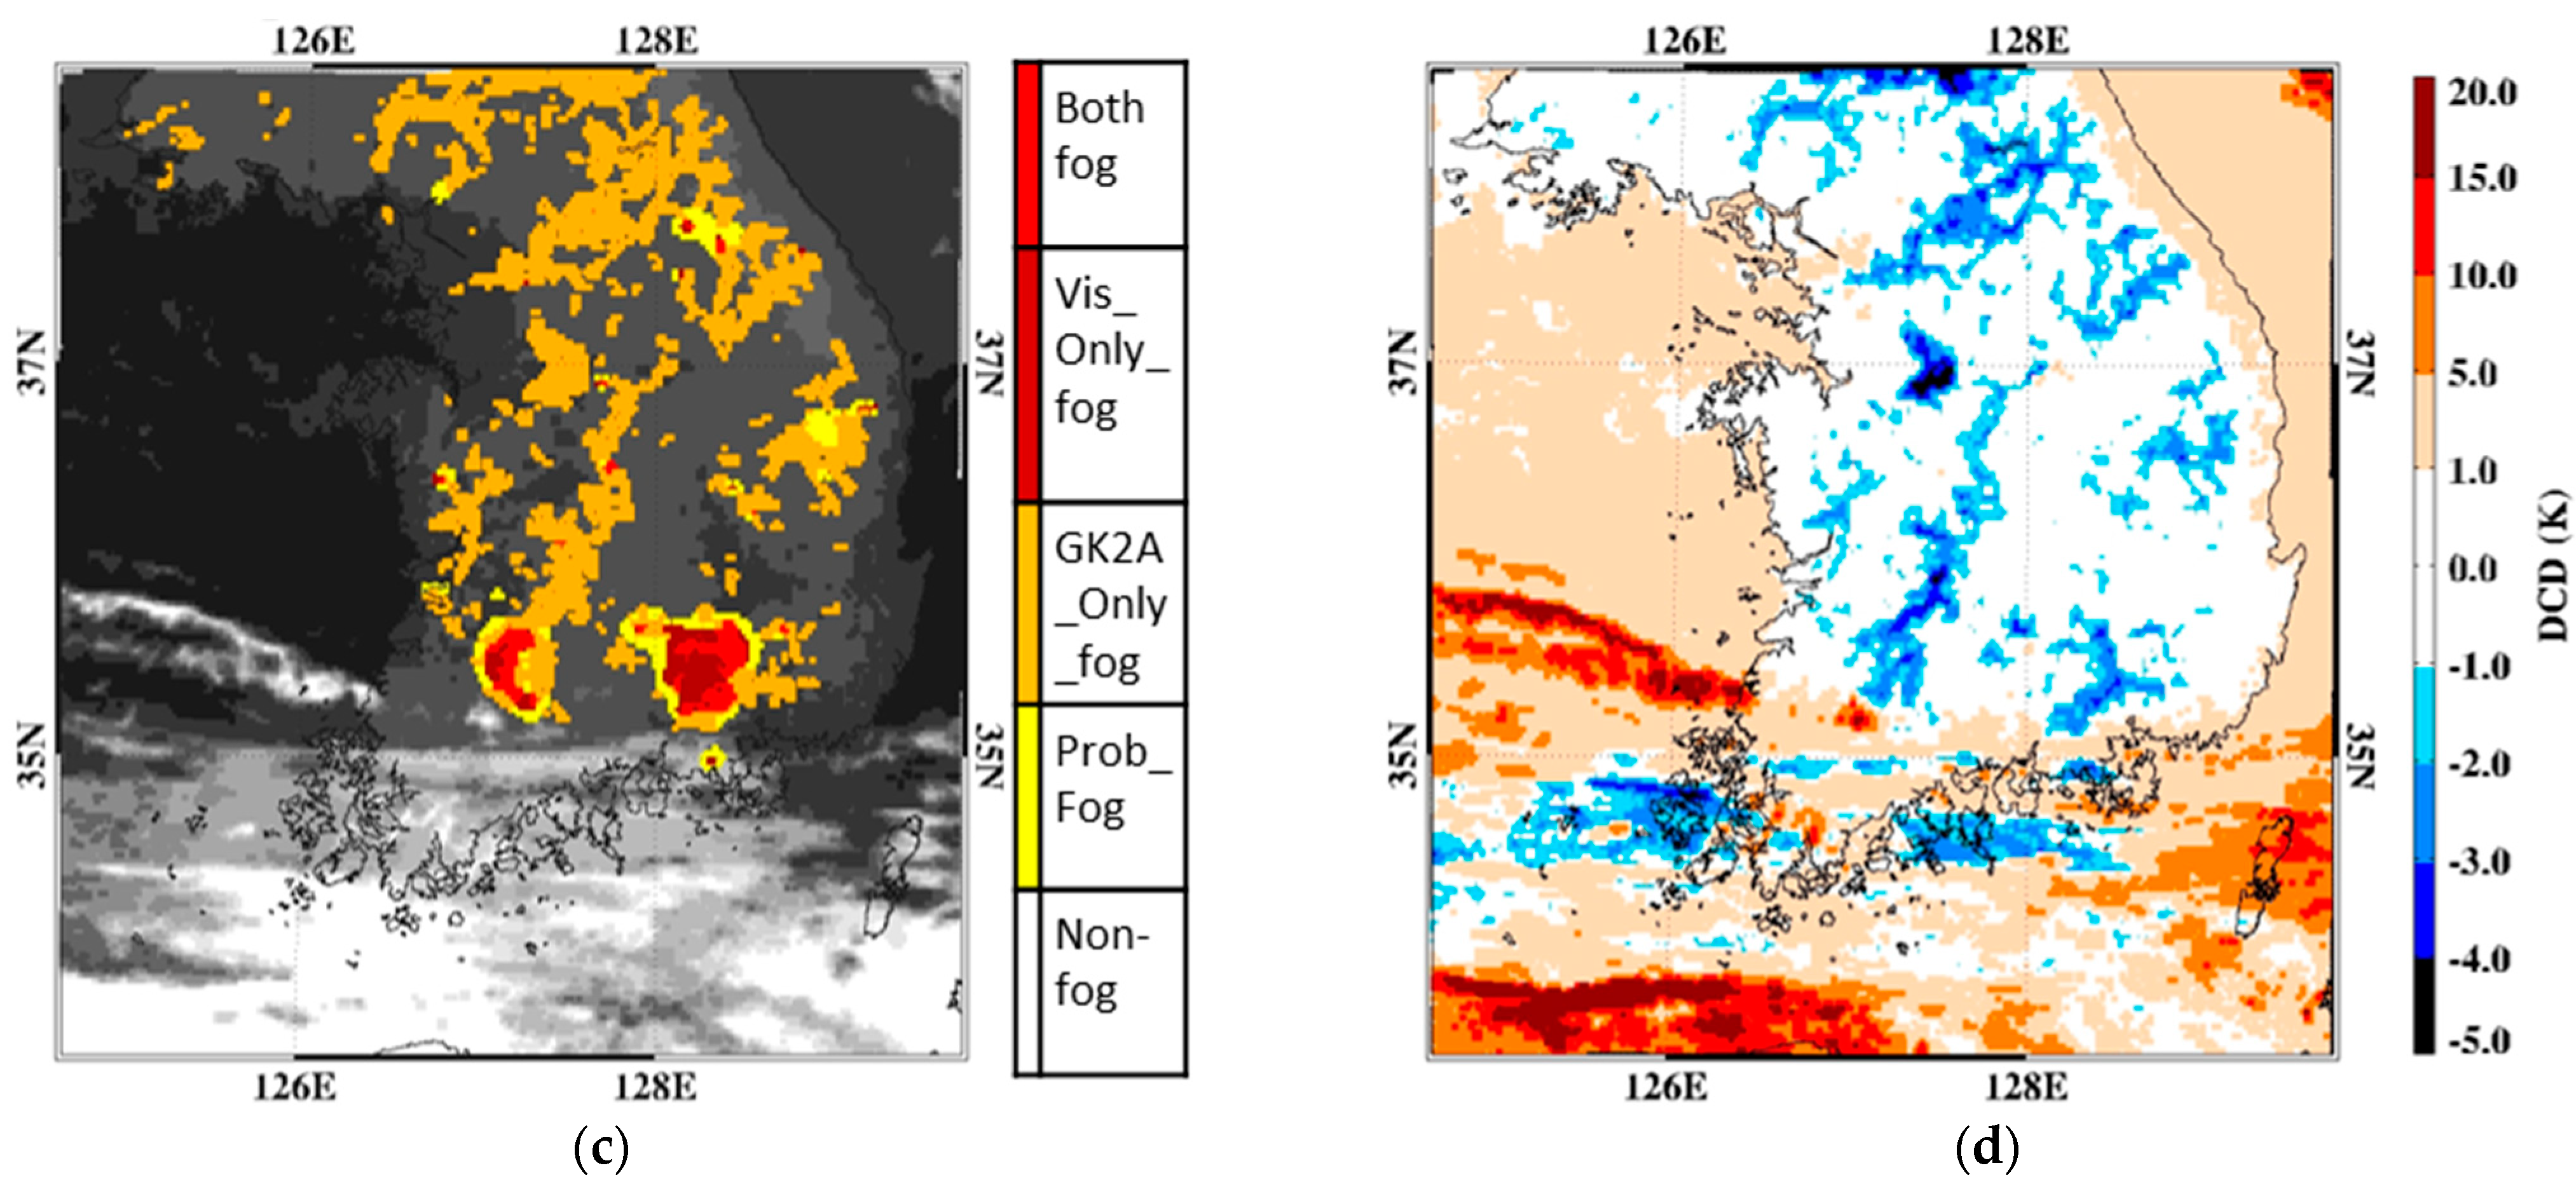
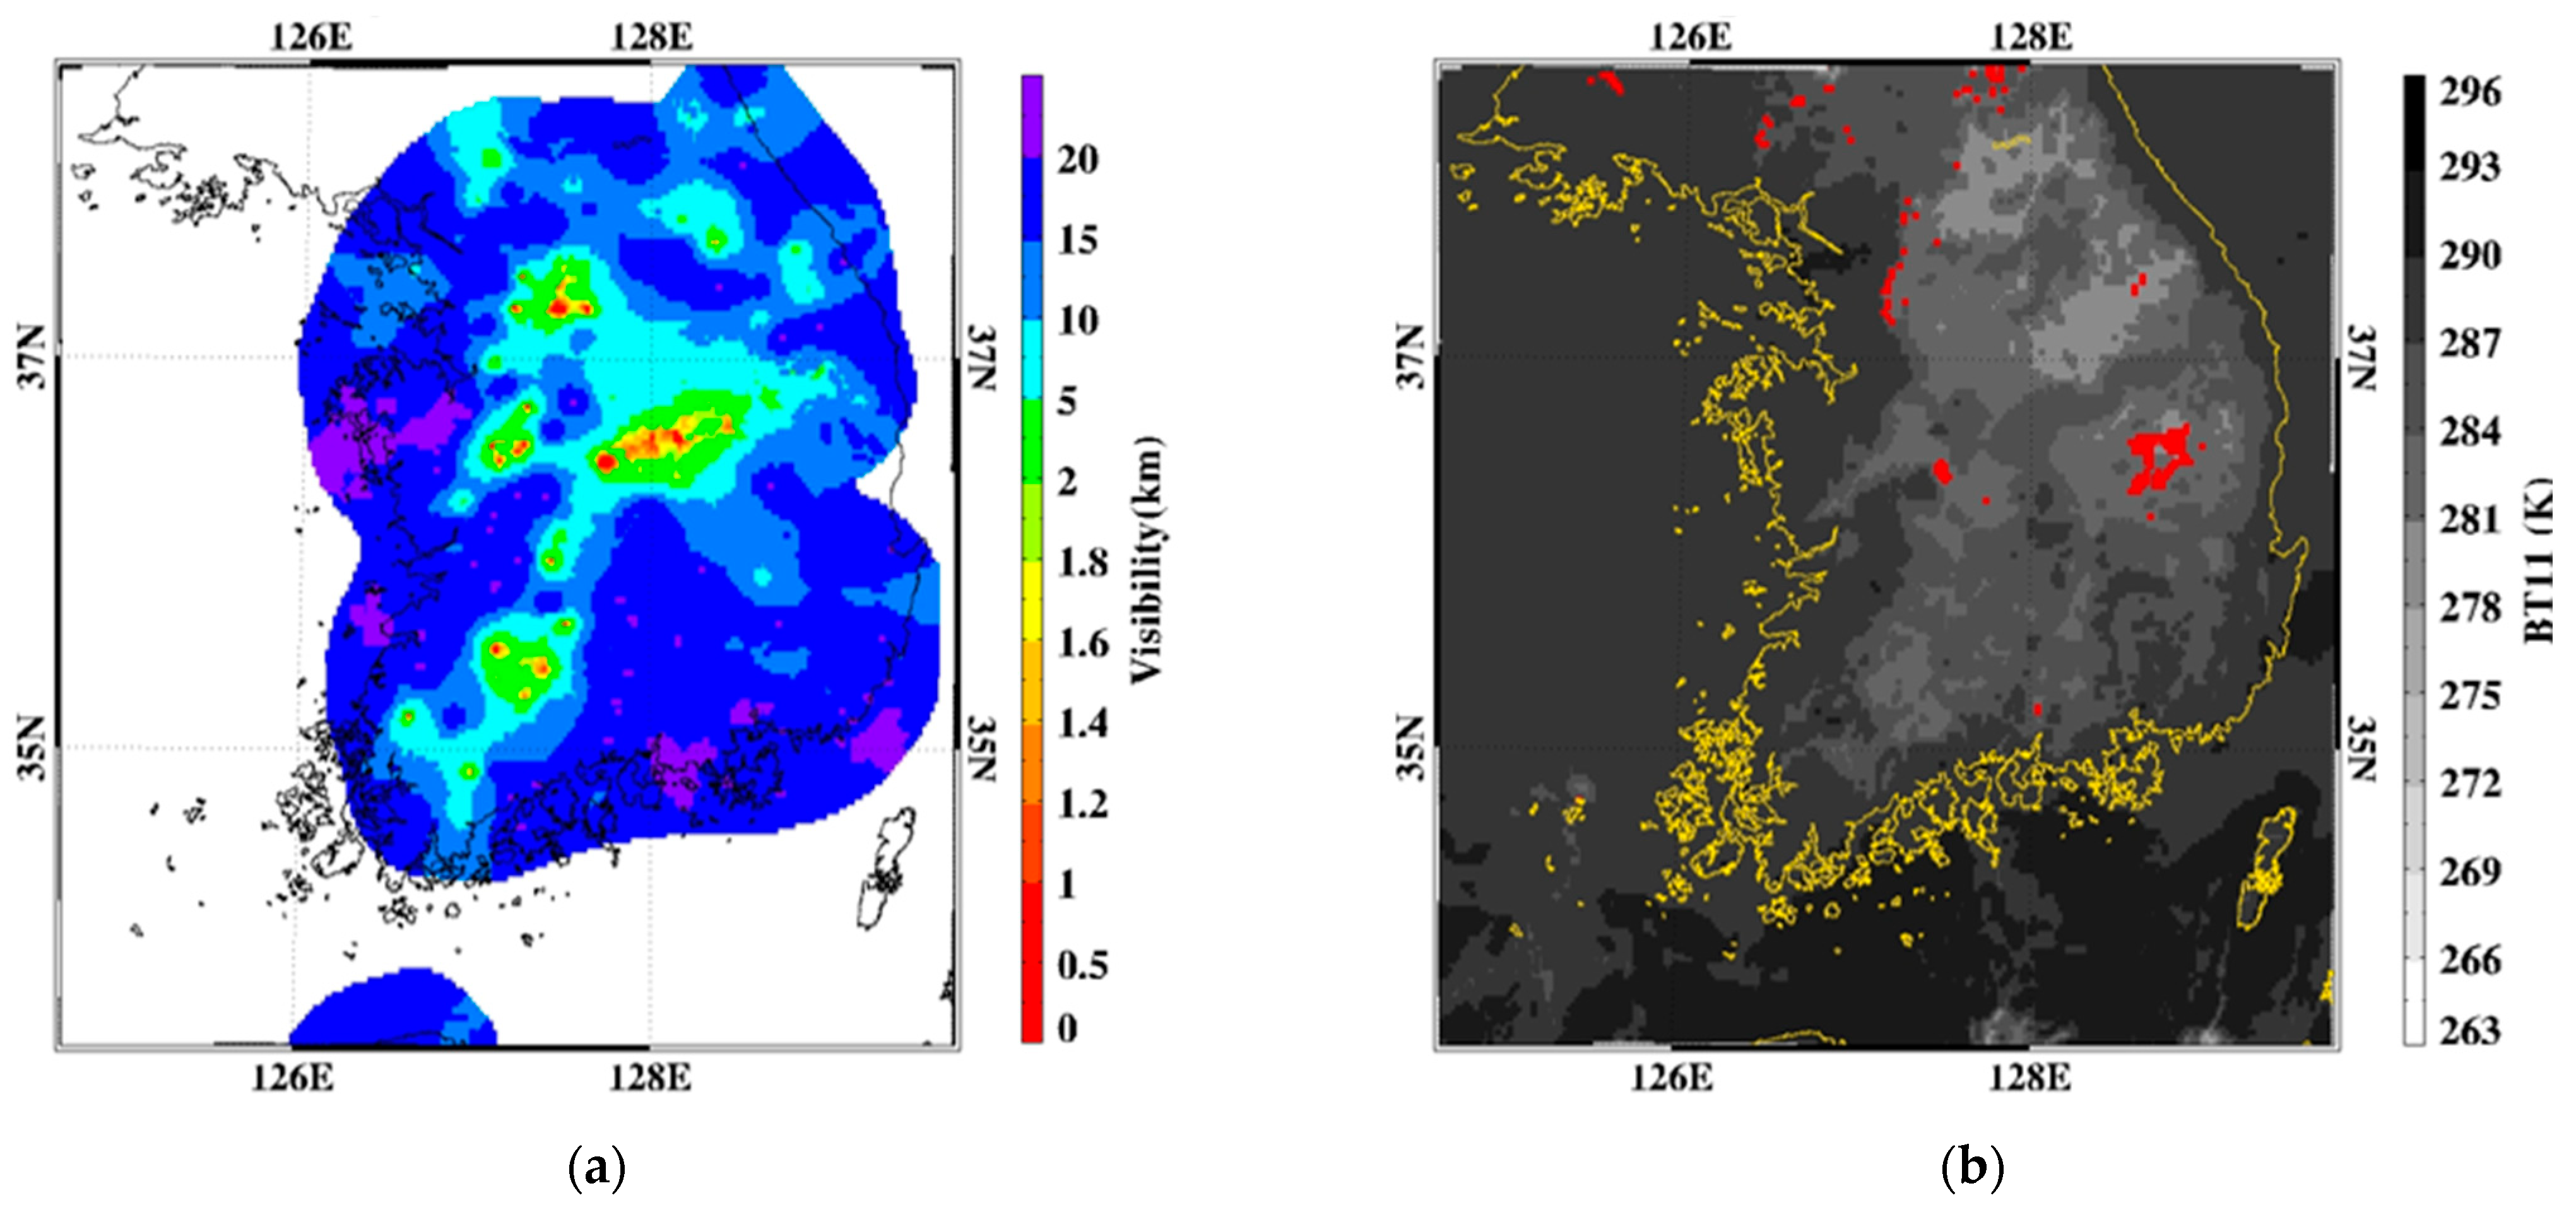
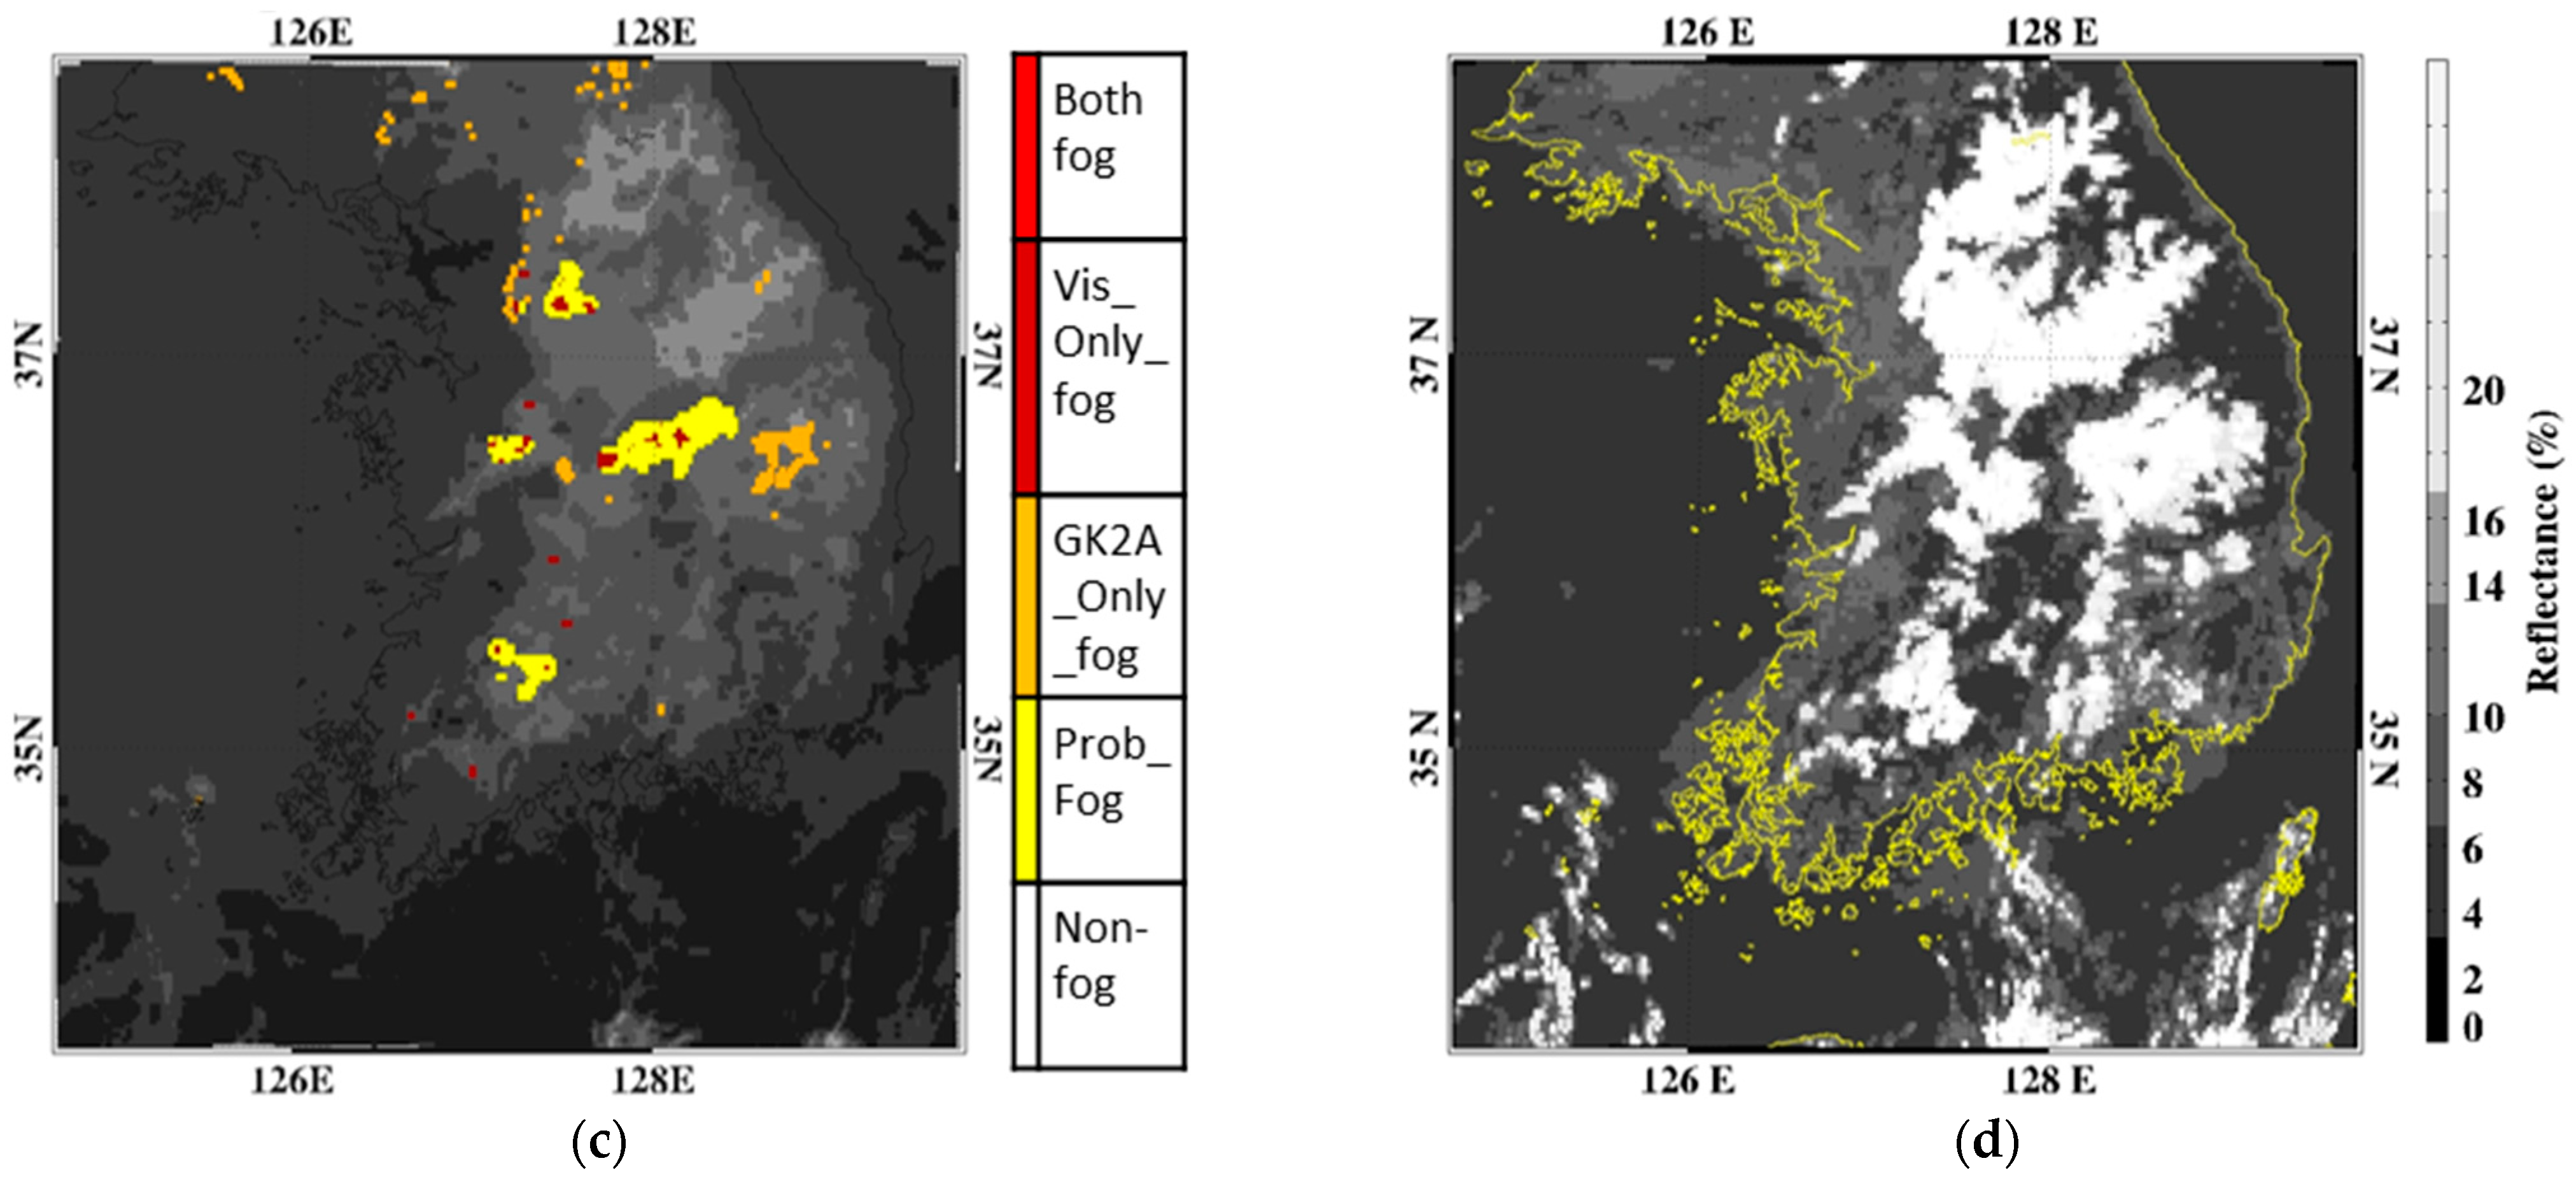
To qualitatively analyze the output level of the HRBFD, we visually compared and analyzed the GVD, the GKFPs, the DCD (Dual Channel Difference: BT3.9 − BT11) image of GK2A, and the visible image of GK2A (Figure 3, Figure 4, Figure 5 and Figure 6). To analyze the qualitative level of HRBFD according to the type and intensity of fog and the presence or absence of clouds, we analyzed the case where sea fog and land fog occurred simultaneously (Figure 3) and the case where fog occurred under the middle-high cloud (Figure 4). In addition, dawn (Figure 5) and early morning (Figure 6) time zones were selected and analyzed for radiation fog cases.
Figure 3 shows a case where radiation fog that occurred in the inland area of South Korea and sea fog that occurred widely in the West Sea existed simultaneously on 4 July 2019. Middle-high clouds, including semi-transparent cirrus clouds, are distributed in the east–west direction along the coast of the South Sea (Figure 3d). In the grid-type visibility image, fog and low visibility were widely observed mainly in Gyeonggi-do and Gyeonggi Bay, Chungcheongbuk-do and Jeollabuk-do, the south coast, and parts of Gyeongsangbuk-do and Gangwon-do (Figure 3a). However, in the GKFP, fog was mainly detected in the West Sea (including Gyeonggi Bay), Jeollabuk-do, the North Gyeonggi region, and in the mountainous regions of Gangwon (Figure 3b). There are areas where the detection results of the two datasets match, such as Gyeonggi Bay and Jeollabuk-do, but there are also areas where the detection results do not match, such as the west coast, south coast, and Gangwon-do. In the HRBFD, which is a blending of the two grid-type datasets, sea fog that did not exist in the GVD was detected well (Figure 3c). It also detects the fog that occurs widely in Gangwon-do, which is under-detected in the GVD. The widespread occurrence of undetected fog in the GVD derived from the visibility meter is probably because the visibility meter is rarely installed in Gangwon-do, where there are many mountainous areas (Figure 1). In addition, the HRBFD detects the fog that occurred on the south coast, which was impossible to detect in the GKFP due to middle-high clouds, and some localized fogs in Jeollabuk-do, which were not detected in the GKFP.
Figure 4 shows a case where localized fog occurred in Seoul, Gyeonggi-do, Chungcheongbuk-do, the south coast, all over the inland area (Figure 4a), and most of the Gyeongsang region (Gyeongsangbuk-do and Gyeongsangnam-do) except for some areas, and where the south coast was extensively clouded (Figure 4a,d). In the GVD, the fog that occurred locally in the inland area of South Korea was observed well regardless of the clouds, whereas in the GKFP, the fog was not detected due to the middle-high clouds that occurred above the fog (Figure 4a,b). In the HRBFD, localized fog in areas with clouds is well detected along with sea fog on the south coast (Figure 4c). However, when compared with the GK2A visible image, the cloud edges and low clouds seen in some areas of the Gyeongsang region and the south coast of the South Sea were falsely detected as fog (Figure 4c,d). This appears to be a false detection due to an error in the clear sky radiance data used to distinguish between low clouds and fog in the GK2A fog detection algorithm, and it is considered to be a problem that will be resolved if the accuracy of the GK2A fog detection algorithm is improved [30].
As shown in the GVD, Figure 5 shows the dawn (06:00 KST) when the fog was strongly generated as a case of radiation fog that occurred strongly throughout the inland area of South Korea. The fog was mainly generated in Jeollanam-do and Gyeongsangnam-do, and it can be seen that localized fog occurred in some areas of northern South Korea (Figure 5a). The GKFP detects fog in Jeollanam-do and Gyeongsangnam-do but not localized fog (Figure 5b). Even in the HRBFD, fog that occurred in southern South Korea was detected well with the fog pixel (Both_fog) in both datasets (Figure 5c). In addition, the HRBFD detects the fog that occurred widely in northern South Korea, which was not detected by the GVD, and it also detects the very localized fog well. When visually compared with the DCD image of GK2A, it can be confirmed that the HRBFD detected the fog strongly generated throughout the inland area of South Korea (Figure 5d).
Figure 6 shows the result of the early morning (09:00 KST) during which the radiation fog that occurred strongly inland on 24 September 2019 dissipated after sunrise. Both the GVD and the GKFP detect locally generated fog (Figure 6a,b). In addition, the HRBFD also detects localized fog well (Figure 6c). However, compared with the visible image of GK2A, all three datasets detect only localized fog, unlike the visible image (Figure 6d). To investigate the cause of the large difference between the visible image and the fog detection images, the GVD and the visible image of the GK2A were animated. The difference in fog detection between the two datasets was not significant before sunrise. However, the difference started to increase after sunrise, and it was confirmed that the difference increased as the fog dissipated. Therefore, this is due to the problem that the GK2A falsely detects fog as the visibility is restored on the ground as it is heated from the ground when the radiation fog is dissipated by sunrise. Still, the upper part of the fog remains as a low cloud.

3.2. Analysis of Fog Occurrence Characteristics

The average, standard deviation (SD), and maximum frequency were analyzed to analyze the average characteristics of the fog that occurred inland and in the surrounding seas of South Korea using HRBFD for 23 cases (Figure 7). Since the occurrence time and area are different according to the fog cases, the average, SD, and maximum frequency for 23 cases were analyzed after normalizing the fog occurrence frequency for each pixel by day, as shown in Equation (1). The results analyzed here differ from the climatological characteristics of fog occurrence because only 23 fog cases were used.
NFF(i, j) = # of fog at pixel(i, j)/(24 h × 6 scenes/h),
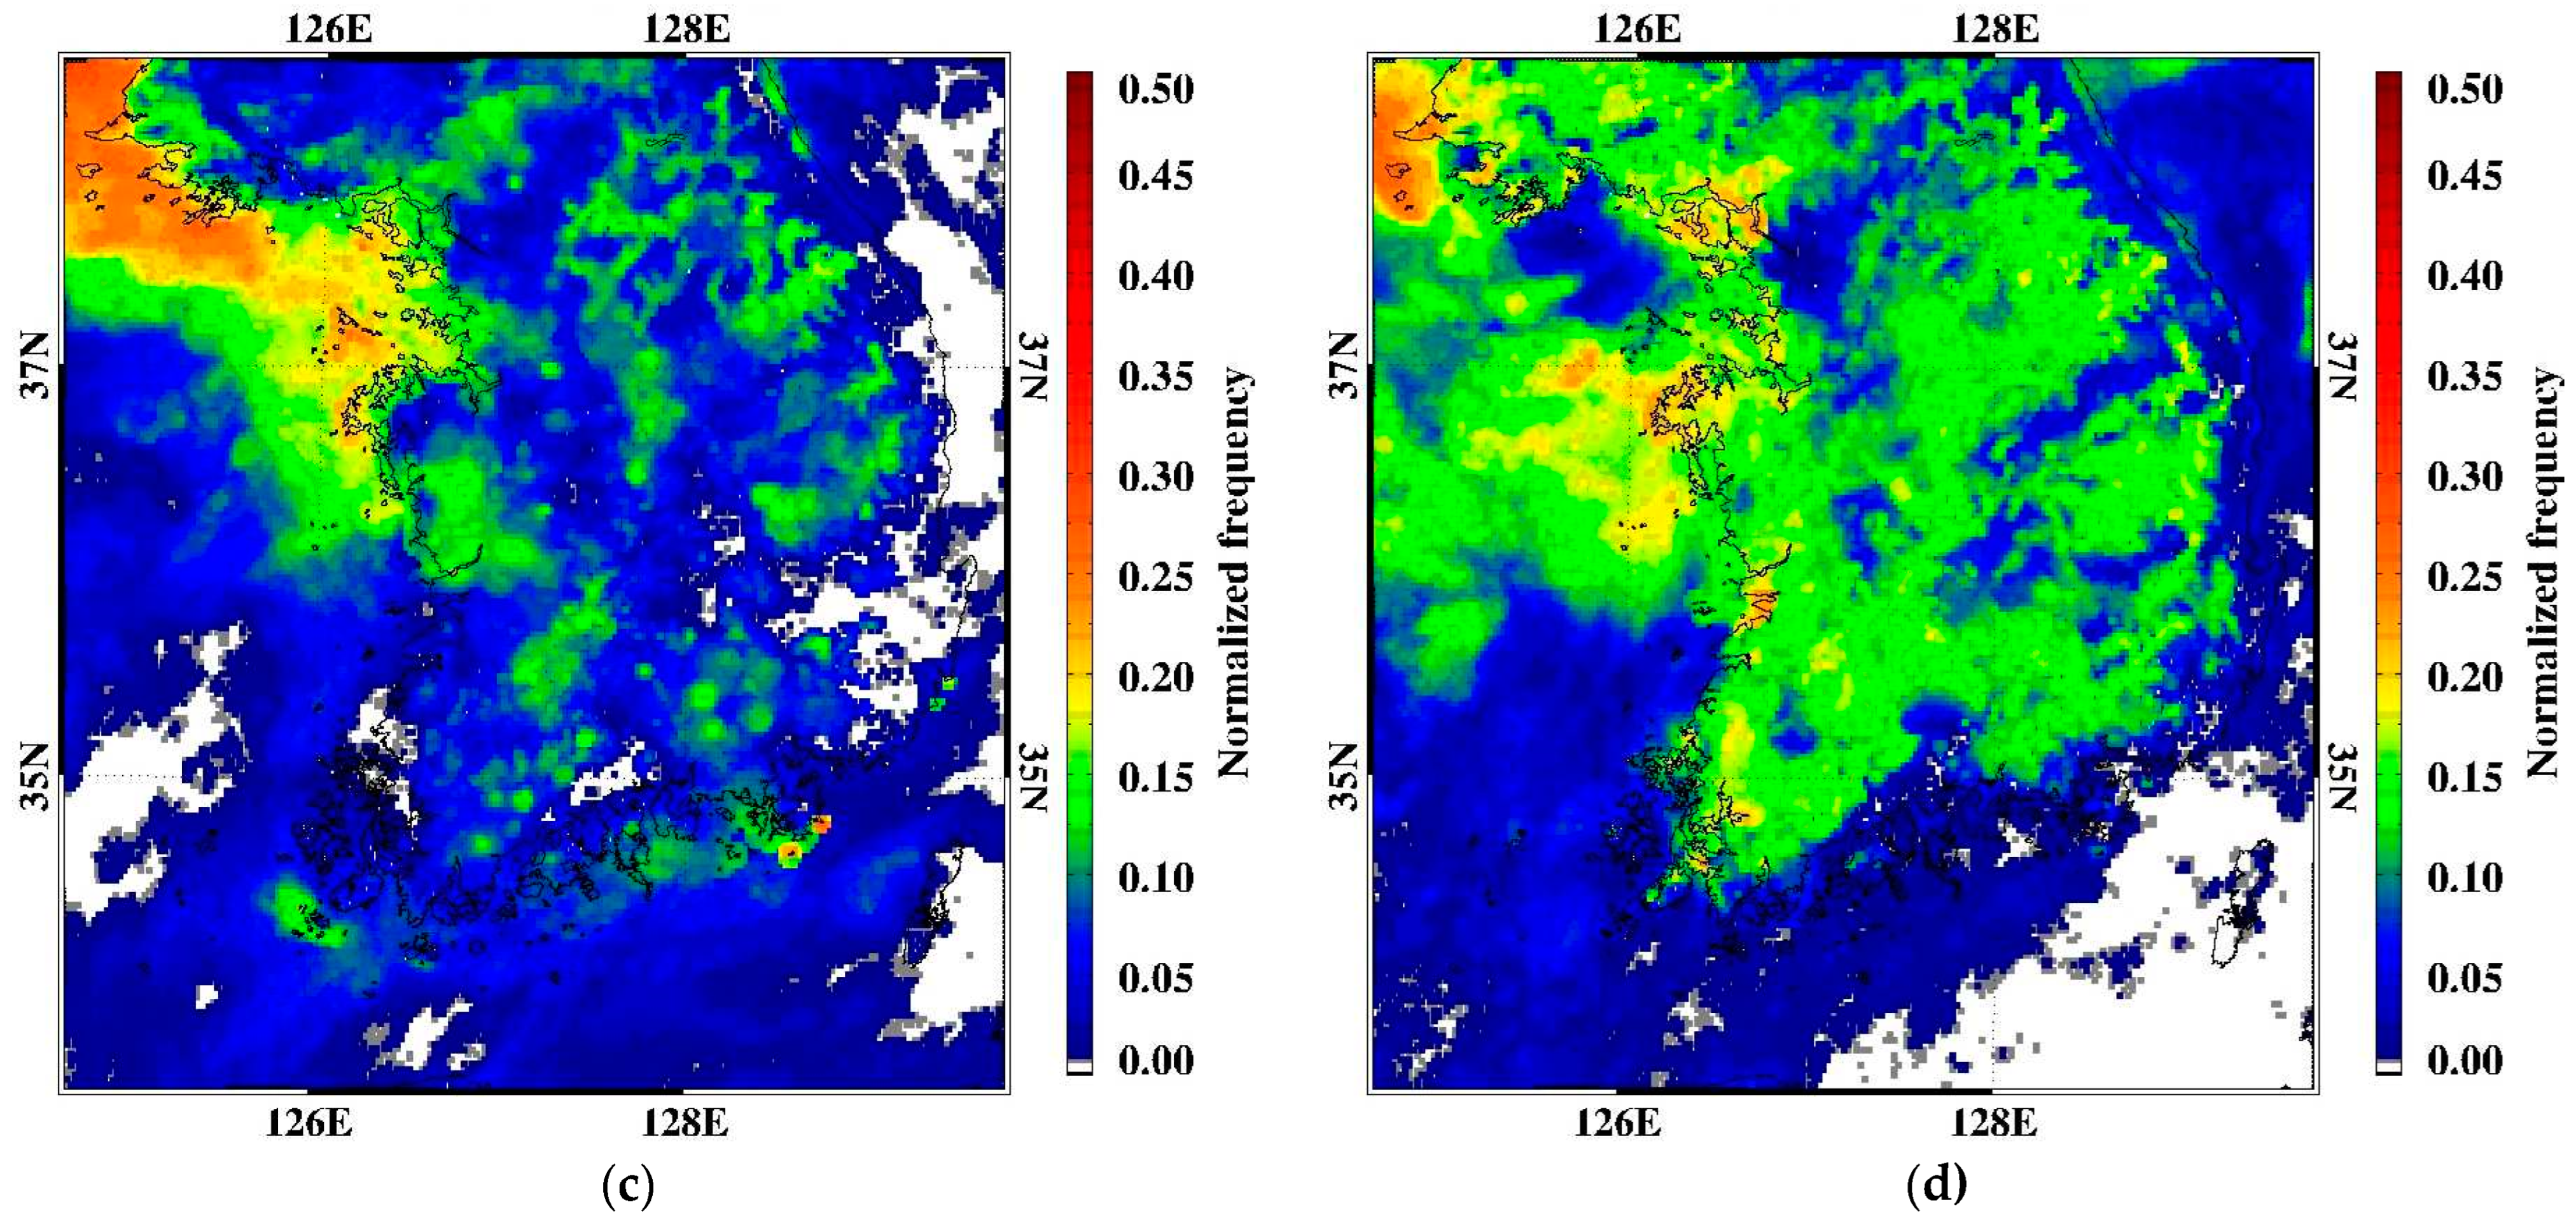
Here, NFF is the normalized fog frequency for each pixel. The average NFF for 23 cases occurred inland and on the west coast, and the average value was high, especially in the vicinity of Cheongyang and Gunsan, with an average value of 0.20 or higher (Figure 7a). On the other hand, the average of NFF is low in Gyeongsangnam-do Province, Seoul, and the mountainous regions near the East Sea. In particular, as in Kang and Suh [34], when examining the average NFF for seven major cities in South Korea, the average NFF in six cities (the except being Incheon) is 0.03 or less, which is very low. On the other hand, the average NFF in Incheon is 0.09, which is relatively higher than in the other cities. As mentioned by Kang and Suh [34], this phenomenon appears to result from urban heat islands and changes in surface characteristics. The SD of the fog occurrence frequency in the inland area is similar to the average NFF. However, the SD is high in the surrounding seas including the west coast (Figure 7b). This is considered to be a problem caused by the small number of sea fog cases among the 23 cases used in this study. Figure 7c shows the maximum value for each pixel in the NFF values of 23 cases. In the surrounding seas, including the west coast, the maximum value of NFF is higher than 0.5. This high NFF means fog at the pixels appears for up to 12 h or more. Overall, the maximum value of NFF appears to be higher in the sea than inland, which seems to be due to the characteristic that the duration of sea fog is longer than that of radiation fog.
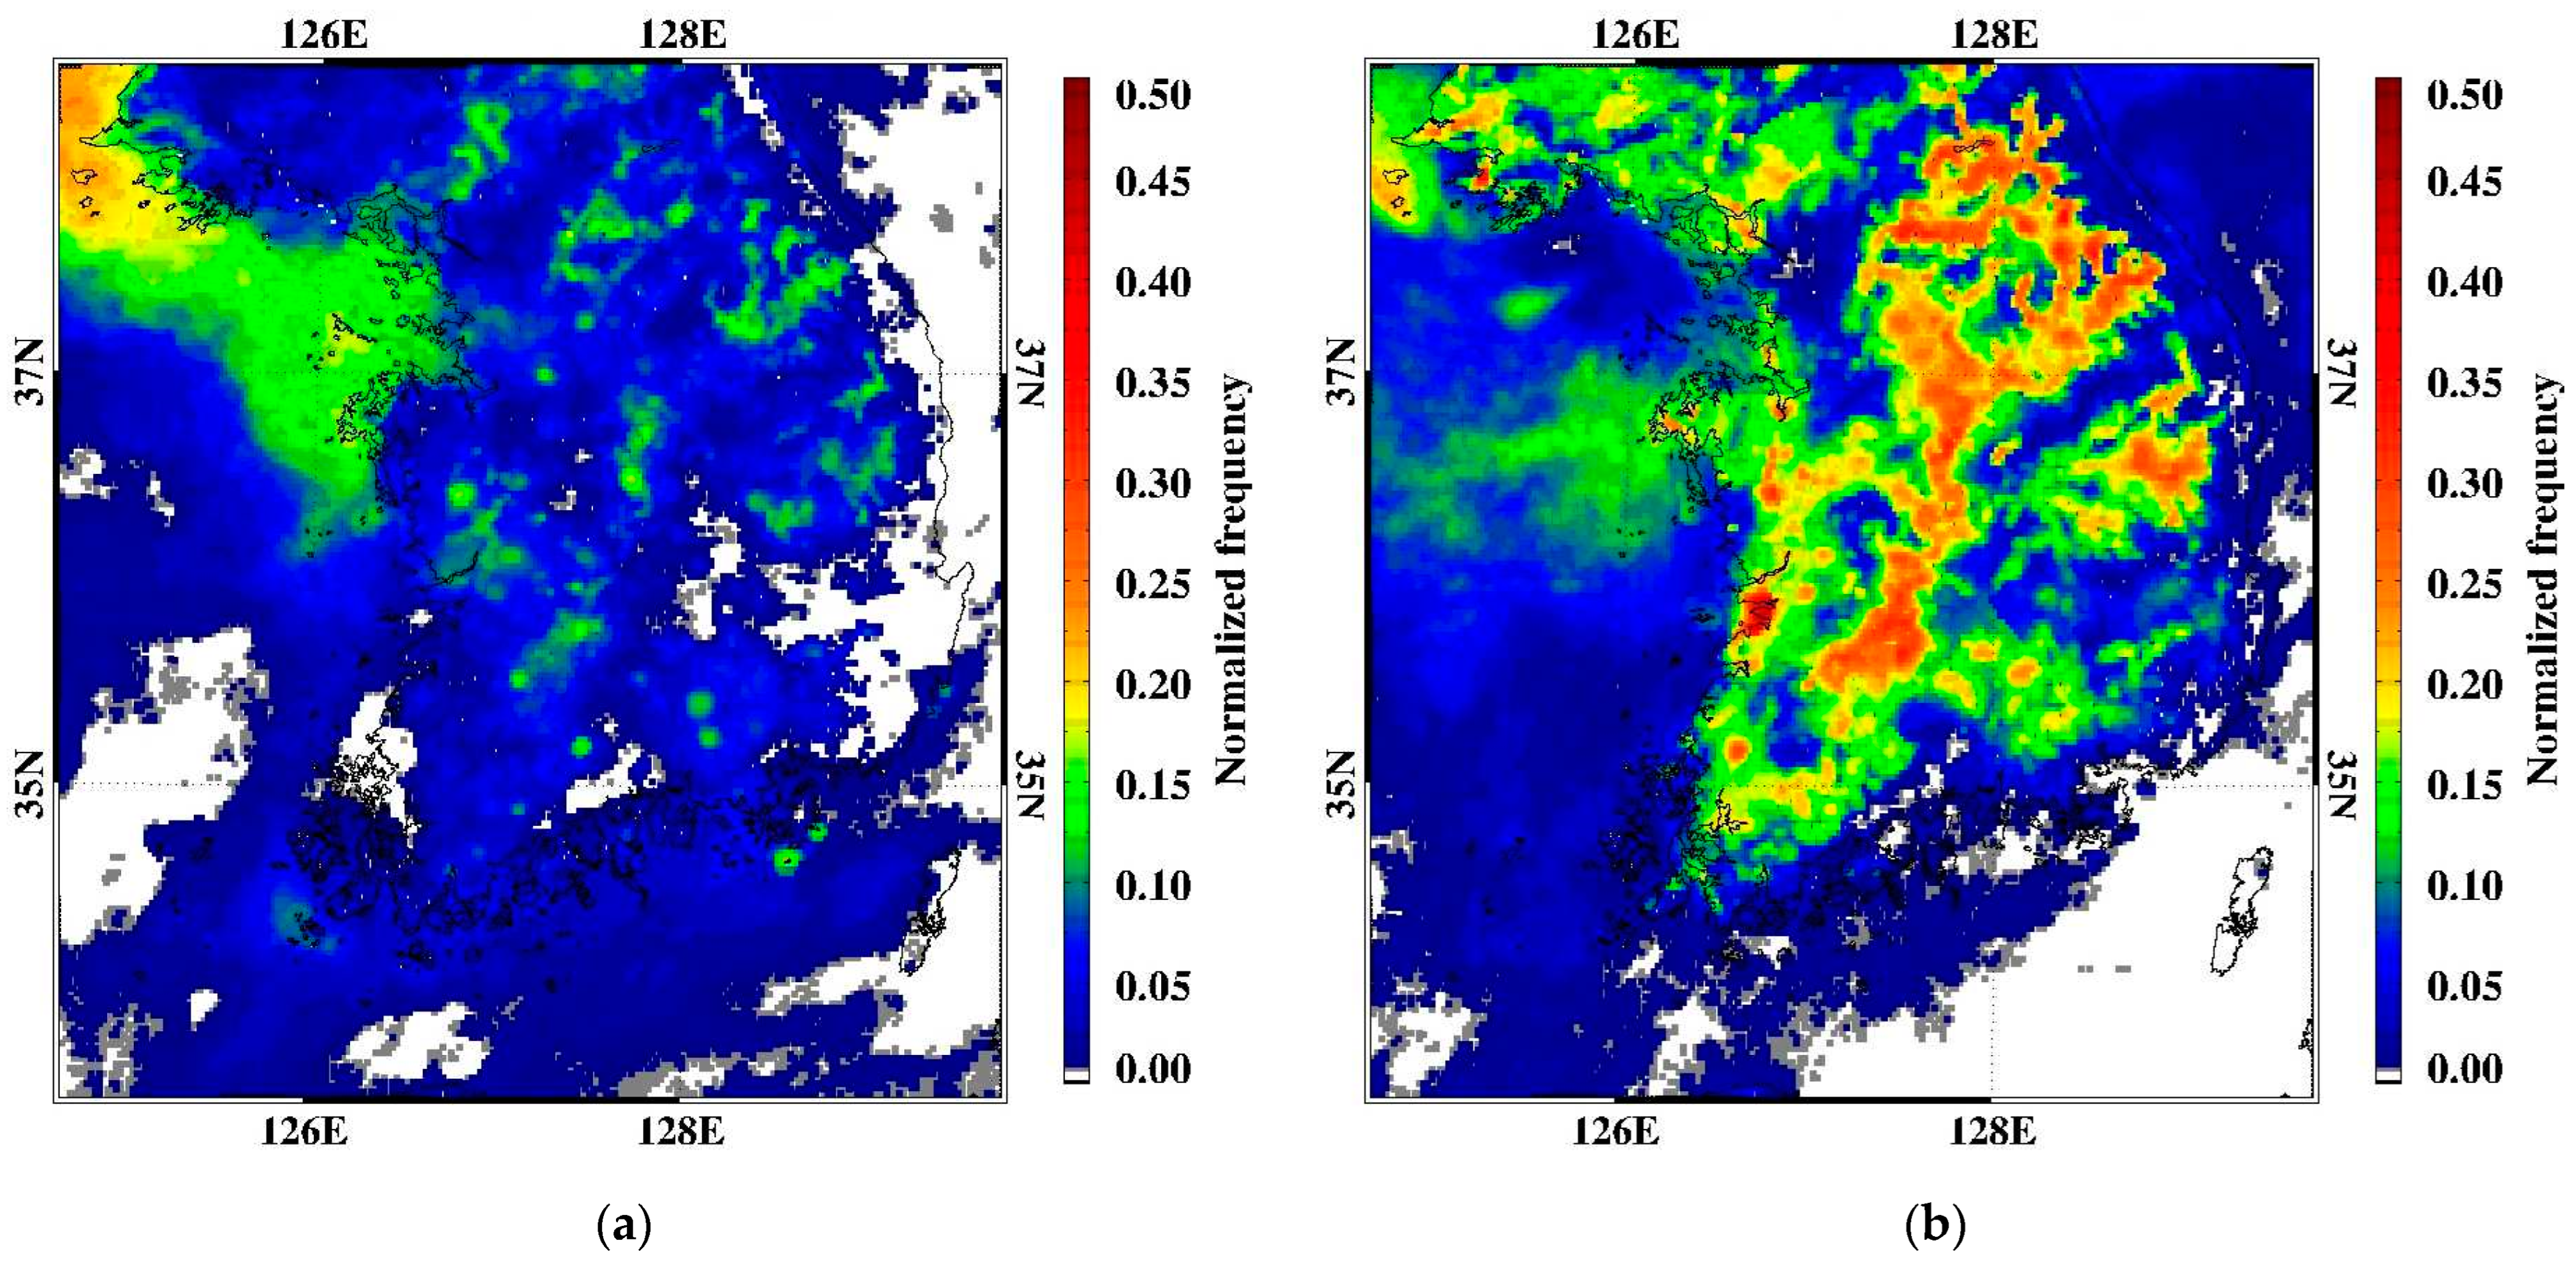
According to Lee and Ahn [35], the average number of fog days in Korea appears in the order of summer-autumn-spring-winter. Although it is a limited case, here again, in order to examine the seasonal characteristics of the fog occurrence frequency, we analyzed summer and autumn, when the average number of fog days is high (Figure 8). The mean values of NFF in summer and autumn showed distinctly different spatial distributions (Figure 8a,b). In summer, a lot of sea fog occurs, mainly on the west coast and in the West Sea, but there is a characteristic that there is less fog inland (Figure 8a). On the other hand, there is a characteristic that radiation fog frequently occurs inland in autumn (Figure 8b). The standard deviation for NFF is large mainly in the pixels with high NFF in the West Sea in summer and mainly in the west coast in autumn (Figure 8c,d). Unlike Lee and Ahn [35], who analyzed a continuous 20-year period, fog frequency analysis of 23 fog cases shows a higher fog occurrence frequency in autumn compared to summer. This discrepancy is due to the difference in the number of samples for fall and summer fog (# of fog in autumn is 22,480 (10 fog cases), and # of fog in summer is 6090 (8 fog cases)).
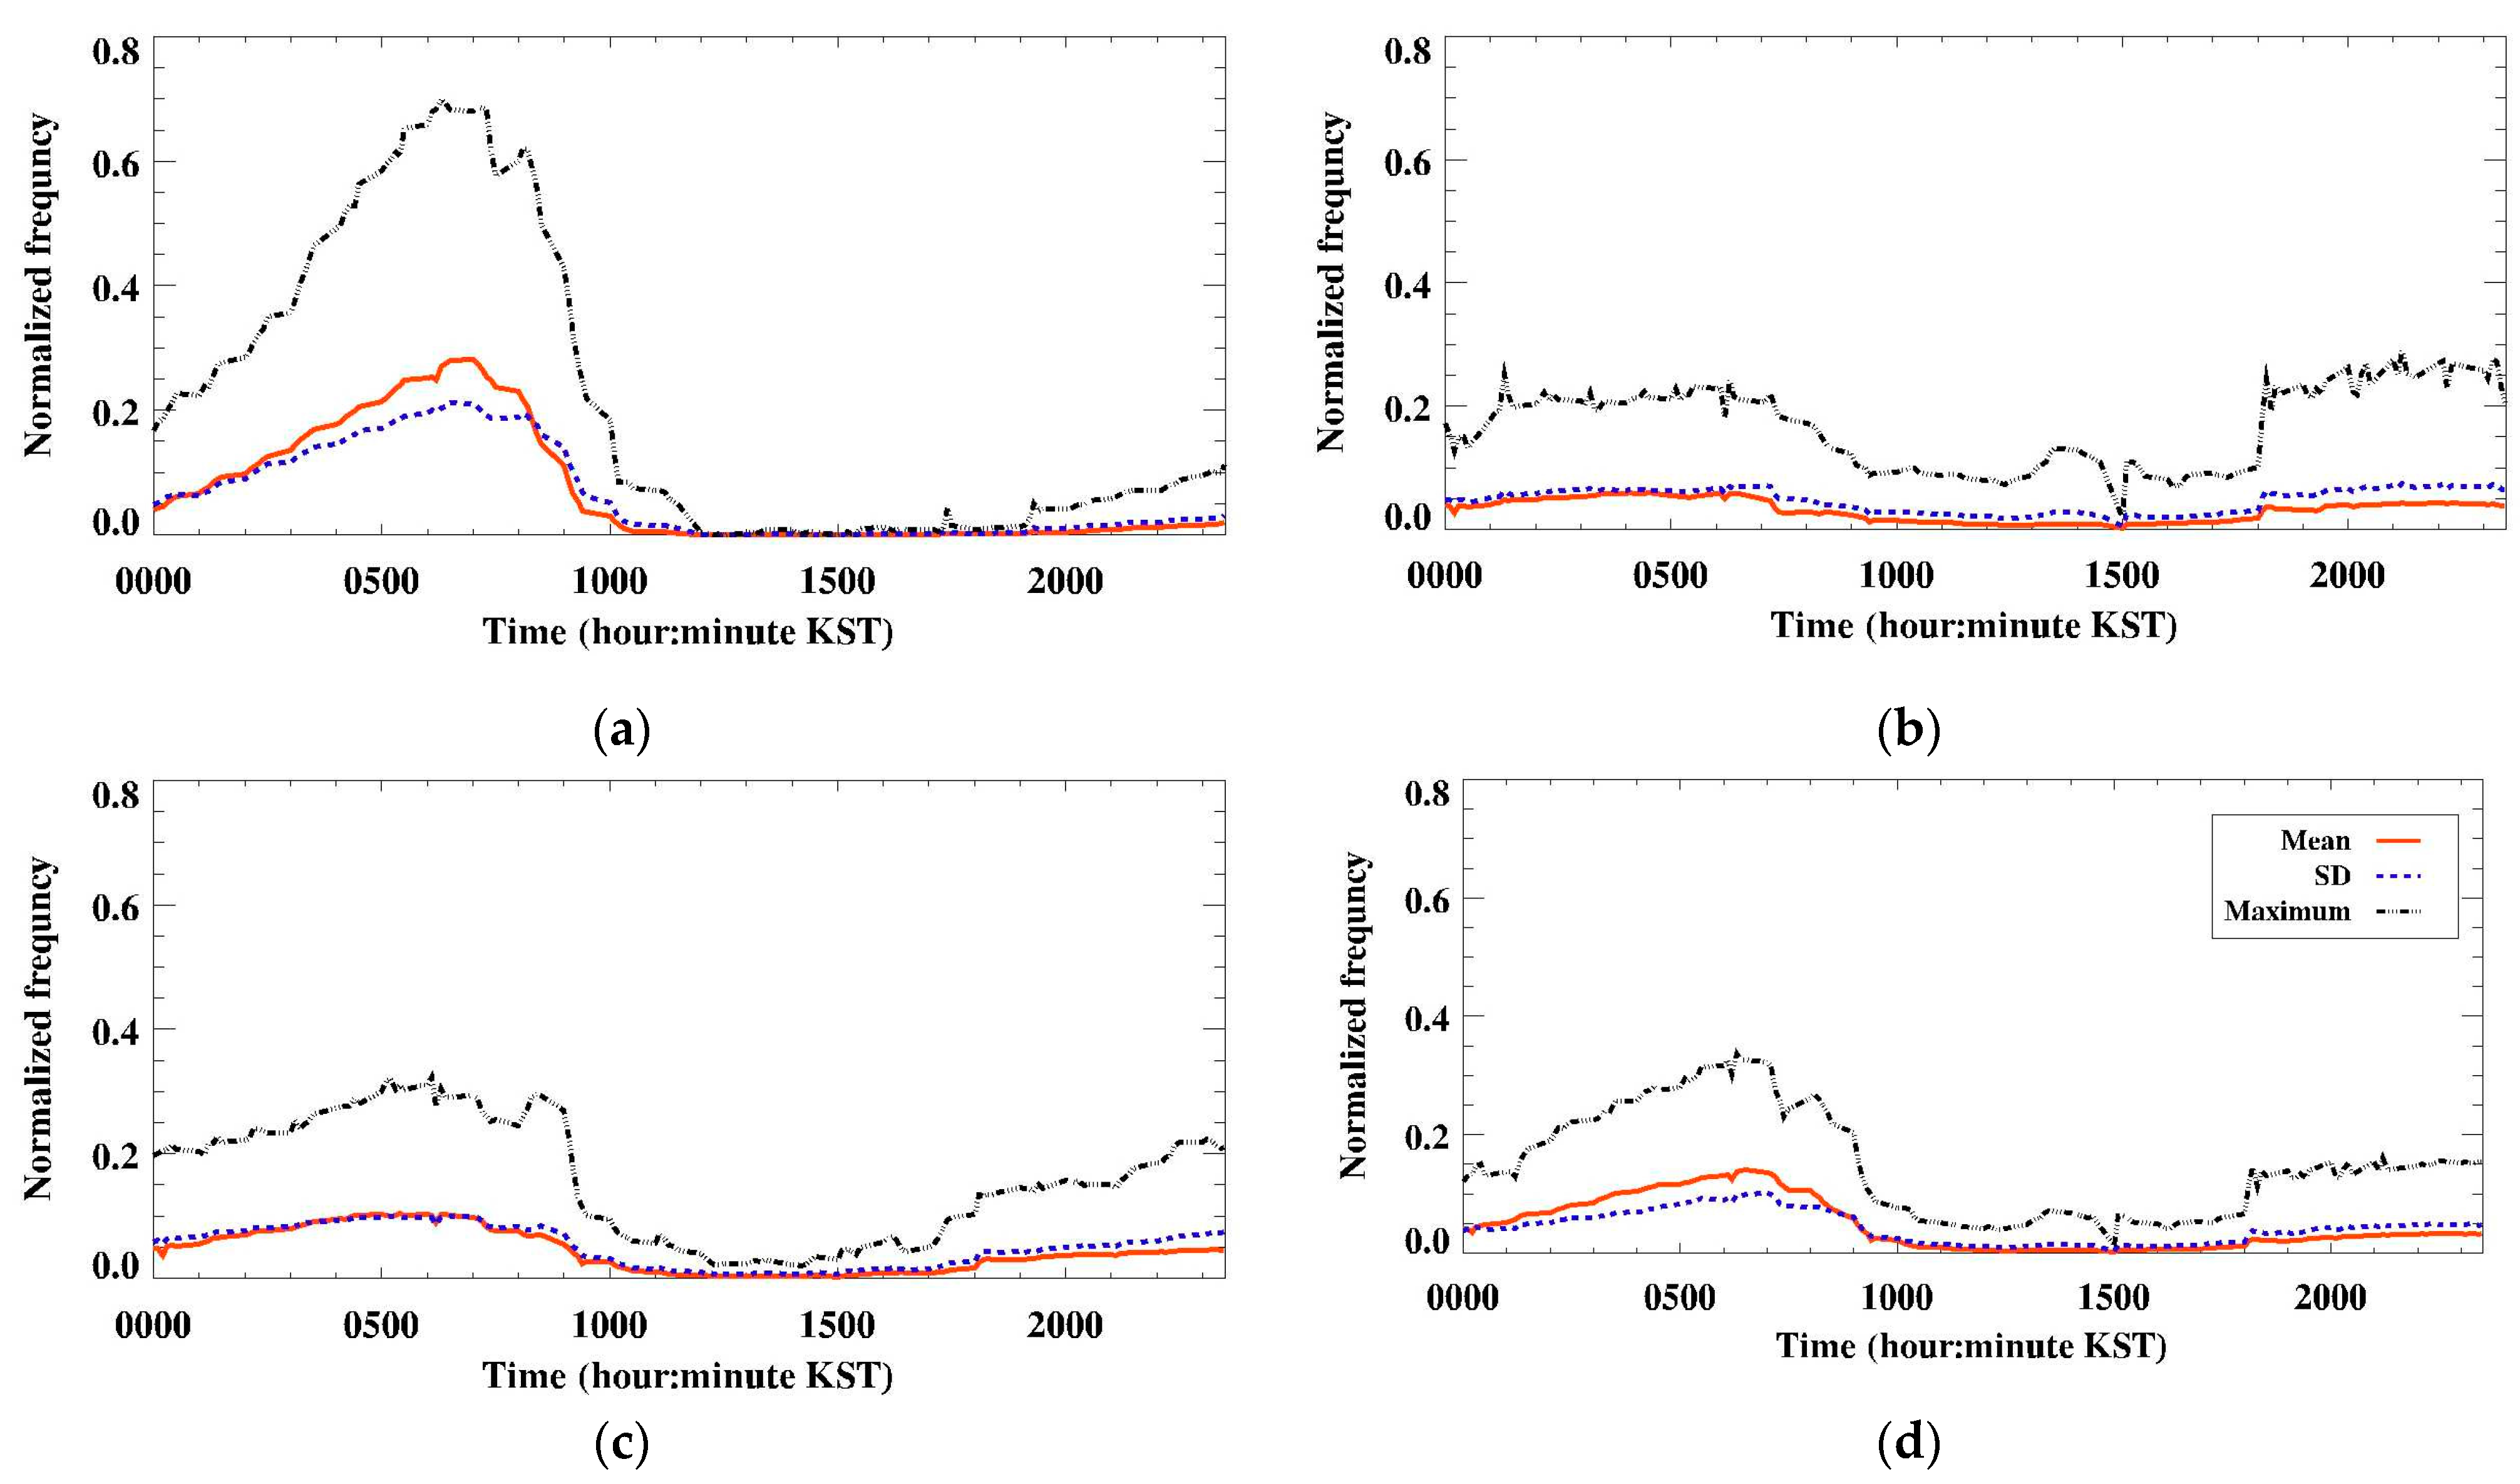
Using the land–sea mask data of GK2A, the diurnal characteristics of fog occurrence frequency according to geographic location were analyzed (Figure 9). At this time, since the total number of pixels is different according to the geographic location, the normalized fog occurrence frequency for each case was used, as shown in Equation (2), and the average, SD, and maximum frequency for 23 cases were analyzed.
NFFL(k, t) = # of fog pixels(k, t)/total pixels for surface type (k)
In Equation (2), NFFL is normalized fog frequency (k, t) by location, k is the ground cover type (k = 1: land, k = 2: sea, k = 3: coast, k = 4: total), and t stands for time. The total number of pixels according to geographic location is inland (18,307), sea (26,980), coast (7613), and total output area (52,900 = 230 (nx) × 230 (ny)).
The temporal variation of the average NFFL(1, t) of 23 cases suggests that fog begins to occur before dawn inland and occurs most at dawn (06:00–08:00 KST) and that fog rarely occurs after 10:00 KST (Figure 9a). In particular, from 10:00 KST to 19:00 KST, the maximum value of NFFL(1, t) also has a value close to 0, so it can be seen that almost no fog occurs. In other words, in the inland area of South Korea, the univariate characteristic of radiation fog is prominent. The sea average NFFL(2, t) of 23 cases was relatively high between 00:00–07:00 KST and 18:00–23:00 KST compared to other times of day but showed an almost constant fog generation frequency regardless of time (Figure 9b). Although the coastal areas show relatively stronger diurnal variation than the sea, even after sunrise, the maximum value of NFFL(3, t) is 0.1 or higher, indicating that fog occurs during the daytime in some areas (Figure 9c). This is because the characteristics of radiation fog and sea fog appear complexly in the coastal area. Although the fog is dissipated after sunrise, it can be seen that the sea fog advected to the coastal area still exists. Despite the use of only 23 cases in this study, these results are in good agreement with the statistical analysis of past fog [17,34].

4. Discussion

In precipitation, AOD, etc., the fusion of satellites and various observation data (or simulation data by various numerical models) has been actively progressing [21,22,24,25,27]. However, there is still no fusion of data for fog. Considering the locality of fog and the impact of fog on traffic, health, and the radiation budget, high-resolution fog data are needed in terms of space–time. In South Korea, visibility data are provided every 1 min in more than 250 observation stations, and fog product with high resolution in space (2 km) and time (10 min) is provided in real-time from GK2A. Therefore, if these datasets are properly fused, it will be possible to produce 2 km resolution fog data for the inland area and nearby seas of South Korea at least every 10 min. In this study, we first tried to fuse the GVD generated by IDW method at 10 min intervals with the GKFP. As suggested in the space–time characterization analysis of fog generation using HRBFD data, the fused data of the GVD and GKFP can compensate for the shortcomings of the visibility data and satellite fog product.
Using the HRBFD data, it will be possible to analyze the characteristics of fog generation in South Korea, including sea and mountain areas where there are few or no observation stations and where the limited visibility allows for low detail in terms of space and time. For GVD, the spatial distribution analysis showed that the local characteristics of fog were well preserved without significant attenuation. Additionally, quantitative validation results indicated a low root mean square error (RMSE), averaging around 140 m, which supports the reliability of the data [29]. Regarding GKFP, the average POD is above 0.80, and the average FAR is below 0.37. Han et al. [30] suggested that compared to previous studies from the past five years, GKFP’s fog detection performance is similar to or better than those studies. Based on this evidence, we assume GKFP to be a reliable dataset. Thus, in the fusion process of GVD and GKFP, it is basically assumed that the quality of both datasets is reliable.
However, in the case of GVD, there are two problems. One is that the accuracy and spatial representativeness of the observed visibility data have limitations. The other is that the change in visibility is not simply inversely proportional to distance. In some cases, visibility changes abruptly in urban areas and at the edges of fog. In addition, GKFP has four main problems. The first is that the fog detection level is low in some cases. The second is that there is a temporal discontinuity in the fog detection results due to the difference in the available satellite channels depending on the day and night. The third is that there is spatial discontinuity due to the difference in surface characteristics at the land–sea boundary. And the fourth is that fog cannot be detected if there are clouds over the fog.
Therefore, here, fusion is performed based on the pixel value of a specific period. In the future, it is necessary to improve temporal continuity by using data from the previous time of fusion (10–30 min) and spatial continuity by comprehensively using data from 3 × 3 or 5 × 5 pixels.

5. Conclusions

As high-resolution fog monitoring data for locally occurring fog was required, this study tried to blend the GVD [29] with the GKFP [30]. The GVD is constructed through the IDW method using the visibility data of about 250 points located in South Korea. The GKFP is the fog data detected using the GK2A/AMI and numerical model data. GK2A land–sea mask data are used to analyze fog occurrence characteristics according to geographical location.
As a blending method of GVD and GKFP, the DTM, which can quickly and accurately blend, was used in order to consider the different characteristics of the two-input data (categorical data and continuity data). The blending was categorized into three types according to the presence of fog data: when both data exist, when only GVD exists, and when only the GKFP data exists. The spatiotemporal resolution of HRBFD is a 2 km grid and 10 min. And the area covers South Korea, including Jeju Island and the surrounding seas. The data are categorized into ten types depending on the existence and characteristics of the two datasets.
The GVD, the GKFP, the DCD, and visible images from the GK2A satellite were visually compared to analyze the quality of the HRBFD. The HRBFD shows the fogs that occurred in the sea or mountain area and that occurred locally. In particular, it seems to have improved the level of fog detection in mountainous areas and seas where visibility, which is a limitation of GVD, is rare or absent. In addition, it seems to solve to some extent the problem of non-detected fog that occurred under the cloud and the low detection level of localized fog. However, the HRBFD includes the problems that the GK2A fog detection algorithm over-detects and shows an inability to detect fog when there are clouds in the sea. These are considered to be problems to be solved when the accuracy of the GK2A fog detection algorithm is improved.
The analysis results of the 23 fog cases of HRBFD showed that the characteristics of fog occurrence in South Korea differ according to geographic location and time. The fog occurs mainly in the inland area and west coast of South Korea, whereas the occurrence of fog is low in Gyeongsangnam-do, the mountainous regions near the East Sea, and in six large cities (but not in Incheon). The duration of fog is longer in sea fog than inland fog. And the sea fog and inland fog occur mainly in summer and autumn, respectively. Also, in the inland area, fog appears in the form of typical radiation fog that occurs at dawn and dissipates after sunrise. On the other hand, in the sea, the frequency of occurrence is almost constant regardless of time. In the coastal areas, the diurnal variation pattern is similar to that of sea fog.
The 10 min and 2 km resolution of the HRBFD data produced in this study showed that it was possible to detect locally occurring fog and fog that occurred in the mountains and seas. Therefore, if such HRBFD is produced for a long period of time, it will be possible to analyze the climatic characteristics of fog occurrence in South Korea and to verify the accuracy of fog forecasting in detail. Since the currently produced HRBFD data is categorical data, the intensity of fog cannot be analyzed. To improve this problem, it is necessary to include fog intensity information in the HRBFD product.

Author Contributions

Conceptualization, M.-S.S.; methodology, M.-S.S. and J.-H.H.; software, J.-H.H. and T.-H.K.; validation, J.-H.H., H.-Y.Y. and T.-H.K.; formal analysis, M.-S.S., J.-H.H., H.-Y.Y. and T.-H.K.; investigation, J.-H.H. and H.-Y.Y.; resources, M.-S.S.; data curation, J.-H.H., H.-Y.Y. and T.-H.K.; writing—original draft preparation, M.-S.S.; writing—review and editing, J.-H.H. and T.-H.K.; visualization, J.-H.H., H.-Y.Y. and T.-H.K.; supervision, M.-S.S.; project administration, M.-S.S.; funding acquisition, M.-S.S. All authors have read and agreed to the published version of the manuscript.

Funding

This research was supported by the Specialized university program for confluence analysis of Weather and Climate Data of the Korea Meteorological Institute (KMI) funded by the Korean government (KMA).

Data Availability Statement

Data from GK2A/AMI are freely available to registered users on the NMSC/KMA web portal: https://datasvc.nmsc.kma.go.kr/datasvc/html/main/main.do?lang=en accessed on 31 January 2022. The visibility data are available from the KMA API Hub (https://apihub.kma.go.kr/) accessed on 31 January 2023.

Acknowledgments

We would like to express our gratitude to the National Meteorological Satellite Center for providing the valuable data used in this study. Also, we would like to express my gratitude to the reviewers for their insightful feedback, which greatly improved the quality of our paper.

Conflicts of Interest

The authors declare no conflicts of interest.

References

  1. Eyre, J.R.; Brownscombe, J.L.; Allam, R.J. Detection of fog at night using Advanced Very High Resolution Radiometer (AVHRR) imagery. Meteorol. Mag. 1984, 113, 266–271. [Google Scholar]
  2. Ellrod, G.P.; Gultepe, I. Inferring low cloud base heights at night for aviation using satellite infrared and surface temperature data. Pure Appl. Geophys. 2007, 164, 1193–1205. [Google Scholar] [CrossRef]
  3. Gultepe, I.; Pagowski, M.; Reid, J. A satellite-based fog detection scheme using screen air temperature. Weather Forecast. 2007, 22, 444–456. [Google Scholar] [CrossRef]
  4. Gultepe, I.; Tardif, R.; Michaelides, S.C.; Cermak, J.; Bott, A.; Bendix, J.; Müller, M.D.; Pagowski, M.; Hansen, B.; Ellrod, G.; et al. Fog research: A review of past achievements and future perspectives. Pure Appl. Geophys. 2007, 164, 1121. [Google Scholar] [CrossRef]
  5. Koracin, D.; Dorman, C.E.; Lewis, J.M.; Hudson, J.G.; Wilcox, E.M.A. Torregrosa, Marine fog: A review. Atoms. Res. 2014, 143, 142–175. [Google Scholar] [CrossRef]
  6. Jhun, J.G.; Lee, E.J.; Ryu, S.A.; Yoo, S.H. Characteristics of regional fog occurrence and its relation to concentration of air pollutants in South Korea. Asia Pac. J. Atmos. Sci. 1998, 23, 103–112. [Google Scholar]
  7. Bendix, J. A satellite-based climatology of fog and low-level stratus in Germany and adjacent areas. Atmos. Res. 2002, 64, 3–18. [Google Scholar] [CrossRef]
  8. Underwood, S.J.; Ellrod, G.P.; Kuhnert, A.L. A multiple-case analysis of nocturnal radiation-fog development in the central valley of California utilizing the GOES nighttime fog product. J. Appl. Meteorol. 2004, 43, 297–311. [Google Scholar] [CrossRef]
  9. Cermak, J. SOFOS—A New Satellite-Based Operational Fog Observation Scheme. Ph.D. Thesis, Phillipps-University, Marburg, Germany, July 2006. [Google Scholar]
  10. Yi, L.; Thies, B.; Zhang, S.; Shi, X.; Bendix, J. Optical thickness and effective radius retrievals of low stratus and fog from MTSAT daytime data as a prerequisite for Yellow Sea fog detection. Remote Sens. 2015, 8, 8. [Google Scholar] [CrossRef]
  11. Suh, M.S.; Lee, S.J.; Kim, S.H.; Han, J.H.; Seo, E.K. Development of land fog detection algorithm based on the optical and textural properties of fog using COMS Data. Korean J. Remote Sens. 2017, 33, 359–375. [Google Scholar] [CrossRef]
  12. Han, J.H.; Suh, M.S.; Kim, S.H. Development of day fog detection algorithm based on the optical and textural characteristics using Himawari-8 data. Korean J. Remote Sens. 2019, 35, 117–136. [Google Scholar] [CrossRef]
  13. KoROAD: Traffic Accident Analysis System. Available online: http://taas.koroad.or.kr/web/bdm/srs/selectStaticalReportsDetail (accessed on 2 May 2020).
  14. Lee, S.J. Development of fog Detection Algorithm Based on the Optical and Textural Properties of Fog Using COMS Data. Master’s Thesis, Gongju National University, Gongju, Korea, February 2016. [Google Scholar]
  15. Lee, Y.S.; Choi, R.K.Y.; Kim, K.H.; Park, S.H.; Nam, H.J.; Kim, S.B. Improvement of automatic present weather observation with in situ visibility and humidity measurements. Atmosphere 2019, 29, 439–450. [Google Scholar] [CrossRef]
  16. Oh, Y.J.; Suh, M.S. Development of Quality Control Method for Visibility Data Based on the Characteristics of Visibility Data. Korean J. Remote Sens. 2020, 36, 707–723. [Google Scholar] [CrossRef]
  17. Lee, H.K.; Suh, M.S. Objective Classification of Fog Type and Analysis of Fog Characteristics Using Visibility Meter and Satellite Observation Data over South Korea. Atmosphere 2019, 29, 639–658. [Google Scholar] [CrossRef]
  18. Lee, J.R.; Chung, C.Y.; Ou, M.L. Fog detection using geostationary satellite data: Temporally continuous algorithm. Asia Pac. J. Atmos. Sci. 2011, 47, 113–122. [Google Scholar] [CrossRef]
  19. Shin, D.G.; Park, H.M.; Kim, J.H. Analysis of the fog detection algorithm of DCD method with SST and CALIPSO data. Atmosphere 2013, 23, 471–483. [Google Scholar] [CrossRef]
  20. Shin, D.G.; Kim, J.H. A new application of unsupervised learning to nighttime sea fog detection. Asia Pac. J. Atmos. Sci. 2018, 54, 527–544. [Google Scholar] [CrossRef]
  21. Castanedo, F. A Review of Data Fusion Techniques. Sci. World J. 2013, 2013, 704504. [Google Scholar] [CrossRef]
  22. Lee, Y.R.; Shin, D.B.; Kim, J.H.; Park, H.S. Precipitation estimation over radar gap areas based on satellite and adjacent radar observations. Atmos. Meas. Tech. 2015, 8, 719–728. [Google Scholar] [CrossRef]
  23. Jang, S.M.; Park, K.Y.; Yoon, S.K. A Multi-sensor based very short-term rainfall forecasting using radar and satellite data—A Case Study of the Busan and Gyeongnam Extreme Rainfall in August, 2014. Korean J. Remote Sens. 2016, 32, 155–169. [Google Scholar] [CrossRef]
  24. Lim, H.; Choi, M.; Kim, M.; Kim, J.; Go, S.; Lee, S. Intercomparing the aerosol optical depth using the geostationary satellite sensors (AHI, GOCI and MI) from Yonsei AErosol Retrieval (YAER) algorithm. J. Korean Earth Sci. Soc. 2018, 39, 119–130. [Google Scholar] [CrossRef]
  25. Ehsan Bhuiyan, M.A.E.; Nikolopoulos, E.I.; Anagnostou, E.N. Machine learning–based blending of satellite and reanalysis precipitation datasets: A Multiregional Tropical Complex Terrain Evaluation. J. Hydrometeorol. 2019, 20, 2147–2161. [Google Scholar] [CrossRef]
  26. Lee, K.; Yu, J.; Lee, S.; Park, M.; Hong, H.; Park, S.Y.; Choi, M.; Kim, J.; Kim, Y.; Woo, J.H.; et al. Development of Korean Air Quality Prediction System version 1 (KAQPS v1) with focuses on practical issues. Geosci. Model Dev. 2020, 13, 1055–1073. [Google Scholar] [CrossRef]
  27. Yu, J.; Li, X.F.; Lewis, E.; Blenkinsop, S.; Fowler, H.J. UKGrsHP: A UK high-resolution gauge–radar–satellite merged hourly precipitation analysis dataset. Clim. Dyn. 2020, 54, 2919–2940. [Google Scholar] [CrossRef]
  28. Egli, S.; Thies, B.; Bendix, J. A Hybrid Approach for Fog Retrieval Based on a Combination of Satellite and Ground Truth Data. Remote Sens. 2018, 10, 628. [Google Scholar] [CrossRef]
  29. Kang, T.; Suh, M.S. Retrieval of high-resolution grid type visibility data in South Korea using inverse distance weighting and kriging. Korean J. Remote Sens. 2021, 37, 97–110. [Google Scholar] [CrossRef]
  30. Han, J.H.; Suh, M.S.; Yu, H.Y.; Roh, N.Y. Development of fog detection algorithm using GK2A/AMI and ground data. Remote Sens. 2020, 12, 3181. [Google Scholar] [CrossRef]
  31. NMSC: GK2A AMI Algorithm Theoretical Basis Document (ATBD). Available online: http://nmsc.kma.go.kr/homepage/html/base/cmm/selectPage.do?page=static.edu.atbdGk2a (accessed on 7 January 2021).
  32. Bruce, P.; Bruce, A. Practical Statistics for Data Scientists, 1st ed.; O’Reilly Media: Sebastopol, CA, USA, 2017; pp. 277–287. [Google Scholar]
  33. Kim, D.H.; Park, M.S.; Park, Y.J.; Kim, W.K. Geostationary Ocean Color Imager (GOCI) marine fog detection in combination with Himawari-8 based on the decision tree. Remote Sens. 2020, 12, 149. [Google Scholar] [CrossRef]
  34. Kang, T.H.; Suh, M.S. Detailed characteristics of fog occurrence in South Korea by geographic location and season—Based on the recent three years (2016–2018) visibility data. J. Clim. Res. 2019, 14, 221–244. [Google Scholar] [CrossRef]
  35. Lee, H.D.; Ahn, J.B. Study on classification of fog type based on its generation mechanism and fog predictability using empirical method. Atmosphere 2013, 23, 103–112. [Google Scholar] [CrossRef]
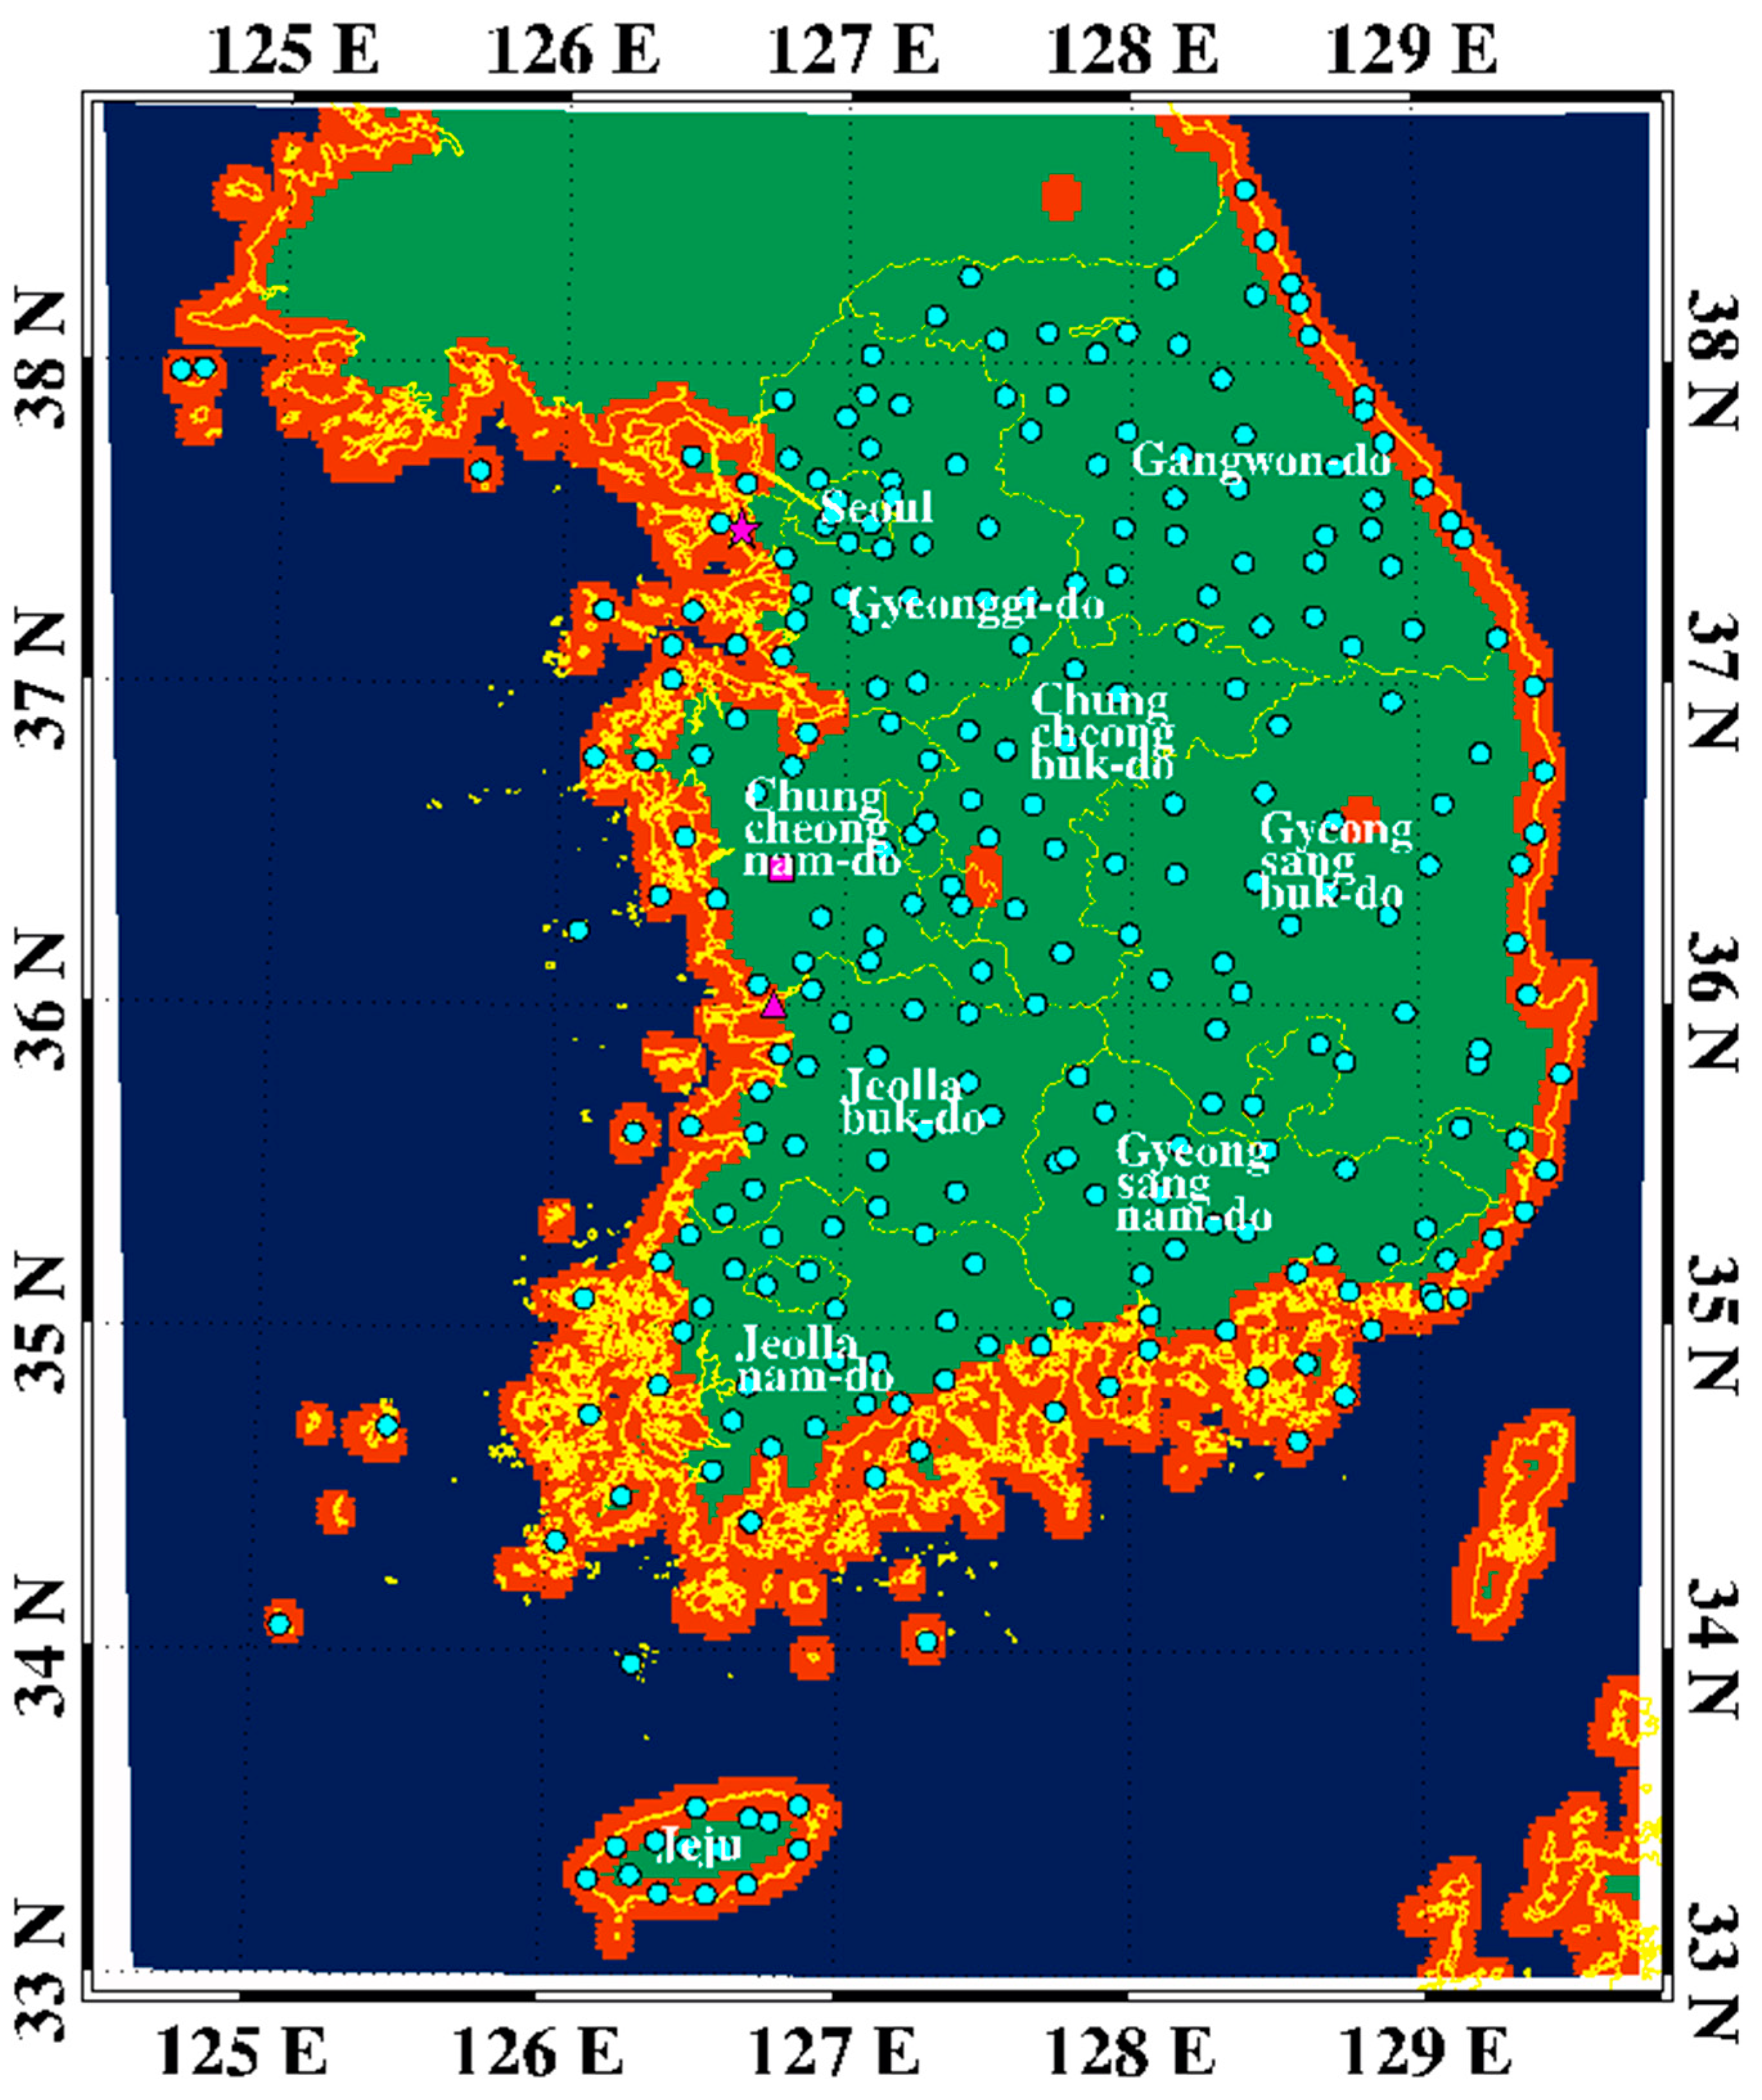
Figure 1. Spatial distribution of classified land–sea mask for the domain used in this study with visibility meter. The yellow line represents the coastal line. The blue, red, and green shaded pixels represent sea, coast, and land, respectively. The sky-blue dots represent the station of the visibility meter. The pink star, square, and triangle represent the Incheon, Cheongyang, and Gunsan regions, respectively.
Remotesensing 16 02350 g001
Figure 2. Flow chart for the blending of gridded visibility data and satellite fog product data. The number in parentheses means the code number that matches Table 3. Both fog is expressed in red, fog only in GVD is expressed in deep red, and fog only in GKFP is expressed in orange. Pixels with a possibility of fog and no fog are expressed in yellow and colorless, respectively.
Remotesensing 16 02350 g002
Figure 3. Sample image of blending results of the gridded visibility and the GK2A fog product for the case of 04:00 KST on 4 July 2019. (a) Image of gridded visibility, (b,c) fog image of GK2A and image of blending result with brightness temperature, respectively, and (d) image of dual channel difference (DCD). The red color in (b) indicates foggy pixels.
Remotesensing 16 02350 g003aRemotesensing 16 02350 g003b
Figure 4. Sample image of blending results of the gridded visibility and the GK2A fog product for the case of 07:00 KST on 26 July 2019. (a) Image of gridded visibility, (b,c) fog image of GK2A and image of blending result with brightness temperature, respectively, and (d) reflectivity of a visible channel. The red color in (b) indicates foggy pixels.
Remotesensing 16 02350 g004aRemotesensing 16 02350 g004b
Figure 5. Sample image of blending results of the gridded visibility and the GK2A fog product for the case of 06:00 KST on 26 August 2019. (a) Image of gridded visibility, (b,c) fog image of GK2A and image of blending result with brightness temperature, respectively, and (d) image of dual channel difference (DCD). The red color in (b) indicates foggy pixels.
Remotesensing 16 02350 g005aRemotesensing 16 02350 g005b
Figure 6. Sample image of blending results of the gridded visibility and the GK2A fog product for the case of 09:00 KST on 24 September 2019. (a) Image of gridded visibility, (b,c) fog image of GK2A and image of blending result with brightness temperature, respectively, and (d) reflectivity of a visible channel. The red color in (b) indicates foggy pixels.
Remotesensing 16 02350 g006aRemotesensing 16 02350 g006b
Figure 7. Spatial distribution of normalized fog occurrence frequency for 23 fog cases. (a) Average frequency, (b) standard deviation (SD) of average frequency, and (c) maximum frequency.
Remotesensing 16 02350 g007
Figure 8. Spatial distribution of normalized fog occurrence frequency according to season (JJA: (a,c), SON: (b,d)). (a,b) indicate mean frequency, (c,d) indicate standard deviation of mean frequency, respectively.
Remotesensing 16 02350 g008aRemotesensing 16 02350 g008b
Figure 9. Diurnal variation of normalized fog occurrence frequency according to the geographic location ((a) land, (b) sea, (c) coast, and (d) total). The red solid line, blue dashed line, and black dash-dot line indicate mean, SD, and maximum value, respectively.
Remotesensing 16 02350 g009
Table 1. Summary of input data used in this study. Detailed explanations of gridded visibility data (GVD) are provided in Kang and Suh [29], and those of satellite fog (GKFP) are provided in Han et al. [30] and NMSC [31].
CharacteristicsGridded Vis.Sat. Fog Product
Frequency10 min10 min
Spatial resolution2 km2 km
DomainSouth Korea (only land)East Asia
Retrieval methodIDW methodDecision tree method
Initial dataVisibility meterGK2A/AMI
Unitskm
(fog: <1 km)
Category (1–7)
Range of valid values0–20 km1: Clear
2: Middle or High Cloud
3: Unknown
4: Probably Fog
5: Fog
6: Snow
7: Desert or Semi-desert
Table 2. Summary of the fog cases used in this study. The number (#) of fog indicates the number of visibility meters, showing a visibility of less than 1 km.
Case #Date# of Fog
14 July 20191244
214 July 2019774
324 July 2019320
426 July 2019676
525 August 2019570
626 August 2019815
730 August 20191464
831 August 2019227
917 September 2019525
1024 September 20192483
1129 September 20192286
1230 September 20192011
131 October 2019719
144 October 20192385
1520 October 20193823
165 November 20192995
176 November 20193360
1812 November 20191893
198 December 2019696
2019 December 201976
2110 February 202072
2211 February 2020151
231 March 20201277
Total28,570
Table 3. Summary of gridded fog product retrieved from the blending method developed in this study.
GVDGKFPProduct NameCodeColorComments
FogFogBoth fog1RedBoth data are fog
Non-fogVis_Only_fog2Deep redVisibility < 1 km
No dataVis_Only_fog6Deep redOnly gridded visibility data
Non-fogFogGK2A_Only_fog3OrangeGK2A fog value is fog
Non-fogProb_fog4Yellow1 km ≤ ave. 3 × 3 < 2 km
Non-fog5-Both data are non-fog
No dataProb_fog7Yellow1 km ≤ ave. 3 × 3 < 2 km
Non-fog8-Only gridded visibility data
No dataFogGK2A_only_fog9OrangeOnly satellite fog data
Non-fogNon-fog10-Only satellite fog data
No dataMissing−999-Both data are missing
Disclaimer/Publisher’s Note: The statements, opinions and data contained in all publications are solely those of the individual author(s) and contributor(s) and not of MDPI and/or the editor(s). MDPI and/or the editor(s) disclaim responsibility for any injury to people or property resulting from any ideas, methods, instructions or products referred to in the content.