Abstract
The suddenness of landslide disasters often causes significant loss of life and property. Accurate assessment of landslide disaster susceptibility is of great significance in enhancing the ability of accurate disaster prevention. To address the problems of strong subjectivity in the selection of assessment indicators and low efficiency of the assessment process caused by the insufficient application of a priori knowledge in landslide susceptibility assessment, in this paper, we propose a novel landslide susceptibility assessment framework by combing domain knowledge graph and machine learning algorithms. Firstly, we combine unstructured data, extract priori knowledge based on the Unified Structure Generation for Universal Information Extraction Pre-trained model (UIE) fine-tuned with a small amount of labeled data to construct a landslide susceptibility knowledge graph. We use Paired Relation Vectors (PairRE) to characterize the knowledge graph, then construct a target area characterization factor recommendation model by calculating spatial correlation, attribute similarity, Term Frequency–Inverse Document Frequency (TF-IDF) metrics. We select the optimal model and optimal feature combination among six typical machine learning (ML) models to construct interpretable landslide disaster susceptibility assessment mapping. Experimental validation and analysis are carried out on the three gorges area (TGA), and the results show the effectiveness of the feature factors recommended by the knowledge graph characterization learning, with the overall accuracy of the model after adding associated disaster factors reaching 87.2%. The methodology proposed in this research is a better contribution to the knowledge and data-driven assessment of landslide disaster susceptibility.
1. Introduction
The intricate geological landscape of China, characterized by its diverse geomorphological features and frequent tectonic movements, engenders a propensity for a multitude of disasters. The unpredictable nature and sudden onset of these calamities contribute significantly to the substantial loss of both human life and property. According to the disaster statistics released (https://www.stats.gov.cn/ accessed date: 1 May 2024), a total of 21,939 geologic disasters occurred in China from 2020 to 2023, and the rate of landslide disasters was 54.67%. Landslide is a cascading landslide geological disaster, which manifests itself as a natural phenomenon of rock and soil on slopes sliding downward under the action of gravity, and it is an internal driving force for the evolution of landscape patterns [1,2,3]. Therefore, it is of great significance to utilize efficient and accurate evaluation techniques for landslide susceptibility evaluation and the identification of high-risk and high-incidence areas of landslide geohazards to improve the level of geological disaster forecasting, and regional geological disaster prevention and mitigation work.
Landslide susceptibility assessment usually combines historical disaster inventories with manually selected characterization factor data, and the assessment models are mainly categorized into physical models, expert models, statistical models, and machine learning models [4,5,6,7]. Each susceptibility model has its own advantages and disadvantages in different scenarios. Physical-based models provide the highest assessment accuracy at small spatial scales and with large amounts of exploration data, but it is due to these two types of characteristics that physical-based models do not achieve better assessment results at wide-area scales and with sparse data [8]. Expert-based models rely on expert experience combined with subject matter expertise, and the subjective quantitative setting of landslide condition factor weights, to classify the sensitivity level. However, expert-based models are highly subjective, making it difficult to obtain objective and quantitative assessment results [9]. Statistically based models select and handle a large number of landslide condition factors, and the model constructs mathematical methods to mine the relationship between the factors to divide the landslide susceptibility. But there are some limitations of statistically based models when facing the nonlinear and complex relationship between the factors [10]. Machine learning models do not rely on the function of rules and a priori knowledge too much. Machine learning models select relevant conditioning factors and adjust parameters by learning the training data to minimize the mathematical function of the error between the predicted output and the true label [11,12,13]. Recently, machine learning models have been widely used for landslide susceptibility assessment, such as logistic regression [14], artificial neural network [15], support vector machine [16], decision tree [17], random forest [18], plain Bayes [19], gradient boosting tree [20] and so on. However, the feature factors selected by the above methods have the following problems. Firstly, the time of historical landslide data varies, but most research ignores the problem of temporal matching such as rainfall, meteorology, and human activities, etc. Secondly, there has been more research to carry out the optimal assessment factors of landslide susceptibility for different regions, utilize the landside domain knowledge, and reduce the inefficiency caused by repetitive research in overlapping regions is an urgent problem to be solved. Thus, there is an urgent need to establish a generalized, computable and reasoned-feature-factor intelligent recommendation model, so as to improve assessment accuracy and efficiency.
A knowledge graph, a kind of semantic network, uses graph models to describe complex knowledge and model associations in the world. A knowledge graph has significant advantages in the organizational integration of domain knowledge and implicit relationship mining. To a certain extent, in makes up for the feature selection being more subjective, the low utilization of knowledge, and the insufficiency of implicit relationship mining [21,22,23]. Current research on the knowledge graph in the disaster domain mainly focuses on constructing a single disaster scenario model, decomposing and disaggregating the identification of disaster scenarios, and analyzing the temporal evolution and association relationship of disasters [24,25]. In addition, around the temporal and spatial evolutionary characteristics of the disaster chain, we analyze and excavate the relationship between disasters, the environment and the objects [26,27,28]; we construct disaster events and emergency responses, and through embedded modeling, assess disaster losses and reason about the disaster emergency response and process [29,30,31]. Nevertheless, the burgeoning corpus of research on landslide susceptibility assessment, encompassing case studies and related investigations, has yielded a reservoir of invaluable information that remains largely untapped. This is often accompanied by a large amount of redundant, spatially low correlation or even invalid data, which greatly increases the complexity of selecting valid information in the landslide susceptibility evaluation factors; these lead to a growing gap between the ability to acquire knowledge and the ability to apply it intelligently. There is an urgent need to develop methods for landslide susceptibility assessment indicator selection at the semantic level through the knowledge graph, to push the highly relevant and most effective selection methods to the assessment task, and to improve the efficiency and accuracy of identification.
This paper focuses on the low utilization of landslide disaster-prone knowledge and the subjective nature of indicator selection. Firstly, we combined scientific literature, landslide disaster reports, online encyclopedia and other Internet unstructured texts to extract knowledge, and construct a landslide disaster knowledge graph using a fine-tuned UIE model. Secondly, we constructed a feature factor recommendation model for knowledge association and discovery based on the knowledge graph. By calculating the similarity of association and attributes, we selected the area with high association in TGA. By eliminating characterization factors with high similarity, we determined base landslide susceptibility assessment factors for TGA, and mined the associated disaster factors for inclusion in evaluation factors through TF-IDF. Thirdly, we selected logistic regression (LR), support vector machine (SVM), random forest (RF), gradient boosted decision tree (GBDT), extreme gradient boosted tree (XGBoost), and categorical gradient boosted tree (CatBoost) ML models for landslide susceptibility assessment, and we utilized the SHAP algorithm to output the decision genesis of the prediction results so as to realize the automatic interpretable landslide susceptibility assessment integrating a priori knowledge and ML.
The main contributions of this research are as follows.
(1) Knowledge extraction for landslide susceptibility assessment is carried out using a fine-tuned UIE model to construct a knowledge graph. Through the threshold constraint space, attribute semantic correlation, the landslide susceptibility assessment feature factor is selected, and the companion hazard factor is mined through knowledge discovery to join the assessment feature.
(2) The factor recommendation model constructs different degrees of enhancement optimization in the accuracy, precision, recall and F1-score of RF, GBDT, XGBoost and CatBoost, and the associated disaster factors can significantly improve the landslide disaster susceptibility assessment results.
(3) Through hyper-parameter optimization and optimal feature combination selection, the probability of landslide occurrence in TGA is classified using RF identification, and the interpretability of each factor is calculated through the SHAP algorithm.
2. Study Area and Data Sources
2.1. Study Area
The three gorges area (TGA) and its bordering counties (see Figure 1) span 105.182°E–112.077°E, 27.953°N–32.204°N, and are located at the boundary between the middle and lower reaches of the Yangtze River Plain and the Sichuan Basin, with a total length of the Yangtze River channel of more than 600 km within TGA. In order to verify the validity of the selection of feature indicators based on knowledge mapping, this study includes neighboring county-level administrative districts on the basis of the traditional Three Gorges Reservoir, which involves two counties in the Guizhou Province, 12 counties in the Sichuan Province, 33 counties in the Chongqing Municipality, and 16 counties in the Hubei Province. The topography of TGA is undulating, mainly mountains and hills, with a maximum slope of 40°. The stratigraphy is mainly Jurassic and Permian, with sandstone, siltstone, marl, mudstone and shale of varying thicknesses, and soft rock and soft–hard interbedded rock layers. The interlocking layout of soft and hard rock layers increases the instability of the strata, and the soft and hard rock layers may be misaligned or slipped under the influence of external forces such as earthquakes or hydrological changes, thus triggering landslides. In addition, cyclic changes in regional water levels can lead to the periodic alternation of saturation and the drying of slopes, which reduces the shear strength of slopes, and thus, increases the probability of landslide disasters. In addition, the increase in the intensity of human activities will significantly change the regional topography and hydrological conditions, which will further lead to the weakening of the support of the natural slope, or change the direction of the original water flow, resulting in the pooling of water in local areas, which will increase the erosion of the slope surface and the water pressure, and thus, trigger landslides.
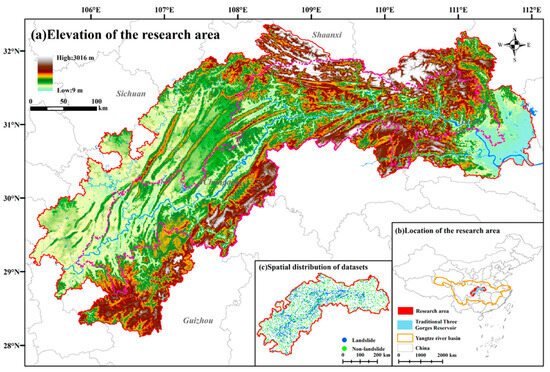
Figure 1.
Overview of the TGA ((a) shows the elevation distribution of the TGA and the rivers in the region; (b) shows the location of the TGA; (c) shows the spatial distribution of the landslide datasets, the blue points represent historical landsides, the green points represent the sample points where landslides have not occurred).
2.2. Data Sources
2.2.1. Landslide Datasets
Producing an accurate landslide dataset is critical to assessment accuracy. As a point or polygon element, landslide datasets not only include the geospatial location of the landslide, but also need to include other relevant features such as geologic conditions and the time of occurrence. In this research, landslide data were primarily obtained from the National Disaster Reduction Official Website (https://www.ndrcc.org.cn/sjcx/index.jhtml accessed date: 1 October 2023), NASA Landslide Viewer (https://maps.nccs.nasa.gov/ accessed date: 1 October 2023), Resource and Environmental Science Data Platform (https://www.resdc.cn/data.aspx?DATAID=290 accessed date: 1 October 2023), and related online news; 2748 landslide data were formed after data cleaning, attribute screening, and other preprocessing. The landslide surface data are based on existing methods [32,33,34], which take the geographic point location of the landslide initiation area as the landslide point location, and ultimately form 2748 spatial point data. For the purpose of machine learning training and simulation, it is also necessary to produce non-landslide data, which according to the first law of geography [35], state that areas close to landslides are more prone to landslides and vice versa. Therefore, when producing the non-landslide samples, a buffer of 500 m was set as the constraint distance, and 2696 well-distributed random non-landslide points were generated in Geographic Information System (GIS). The combined landslide point data and non-landslide point data are used for ML models development and evaluated according to 70% (3811) for training and 30% (1633) for test data.
2.2.2. Knowledge Graph Modeling Data
The data sources for constructing the knowledge graph of landslide susceptibility characteristics are mainly selected from domestic and foreign related literature, landslide geological disaster reports and other ubiquitous Internet text resources. The Chinese literature is mainly from the Zhi.com database (https://www.cnki.net/ accessed date: 10 December 2023), with “landslide susceptibility assessment” as the keyword, and 361 articles meet the requirements. In English, the web of science database platform (http://webofscience.com accessed date: 10 December 2023) was used as the main document, and 3054 results were found with the keyword “landslide susceptibility assessment”. Geological disaster reports were selected from the national geological data library (http://ngac.org.cn/s4/Index.aspx accessed date: 10 December 2023), with a total of 427 reports, and other reports were selected from the Internet platforms, such as the landslide event encyclopedia, landslide news report, and disaster notices of the national news releasing platform, etc. The collected text data were converted to PDF format, and the text was normalized by replacing pronouns with specific references, deactivating word filtering, and eliminating invalid information. After pre-processing, a total of 3918 text articles remained, about 278,000 words.
3. The Proposed Methodology
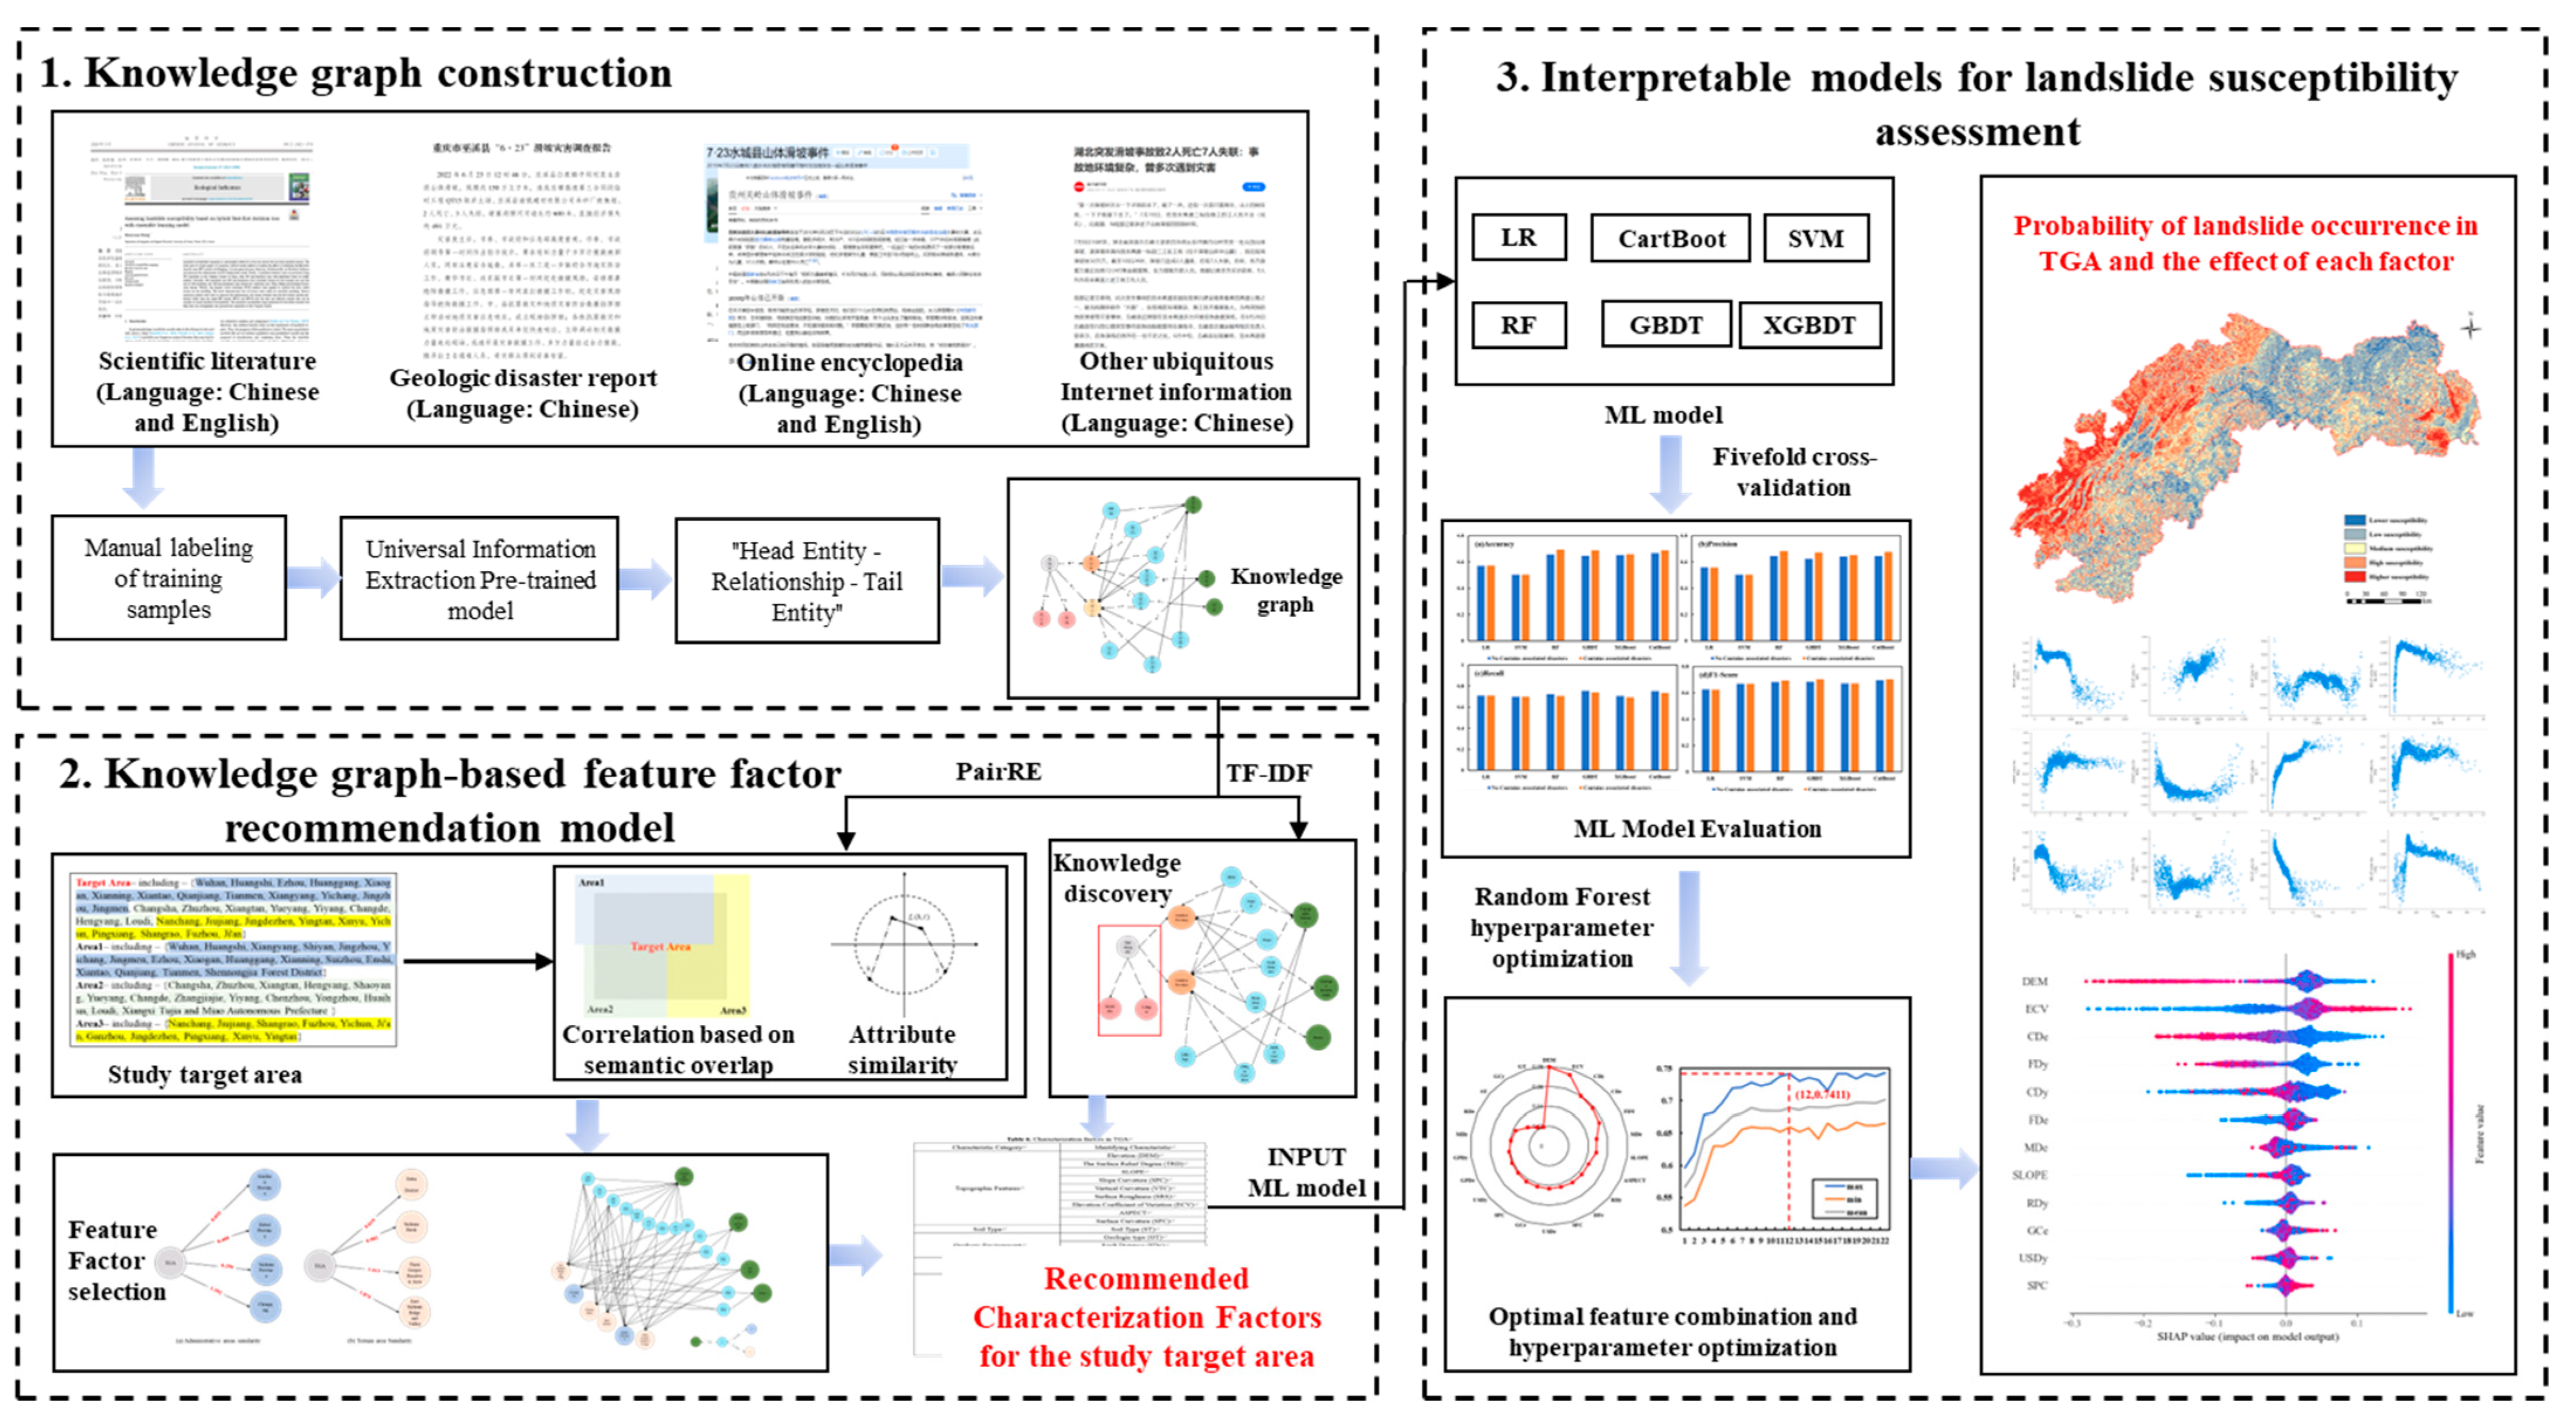
This research is divided into three main parts, and the framework is shown in Figure 2. Firstly, training samples from landslide-related multi-source unstructured texts (scientific literatures, disaster reports, and other ubiquitous Internet texts) are manually annotated to fine-tune the UIE model for knowledge extraction and structured representation and construct a knowledge graph of landslide disasters. Secondly, a feature factor recommendation model based on the knowledge graph is constructed to construct knowledge associations and discovery by calculating the similarity between the associations and attributes. The basic landslide susceptibility assessment factors for TGA are determined. Thirdly, six ML models are selected for landslide susceptibility assessment, and the nonlinear features and feature importance of the feature factors are output using the SHAP algorithm.
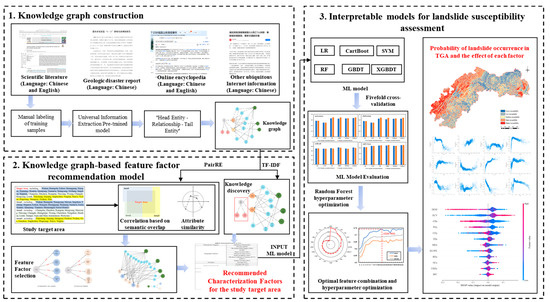
Figure 2.
The overall framework of this paper. Step 1: Knowledge graph construction; Step 2: Knowledge graph-based feature factor recommendation model (Yellow, blue and green represent different administrative districts); Step 3: Interpretable models for landslide susceptibility assessment.
3.1. Knowledge Graph Construction
3.1.1. UIE Model
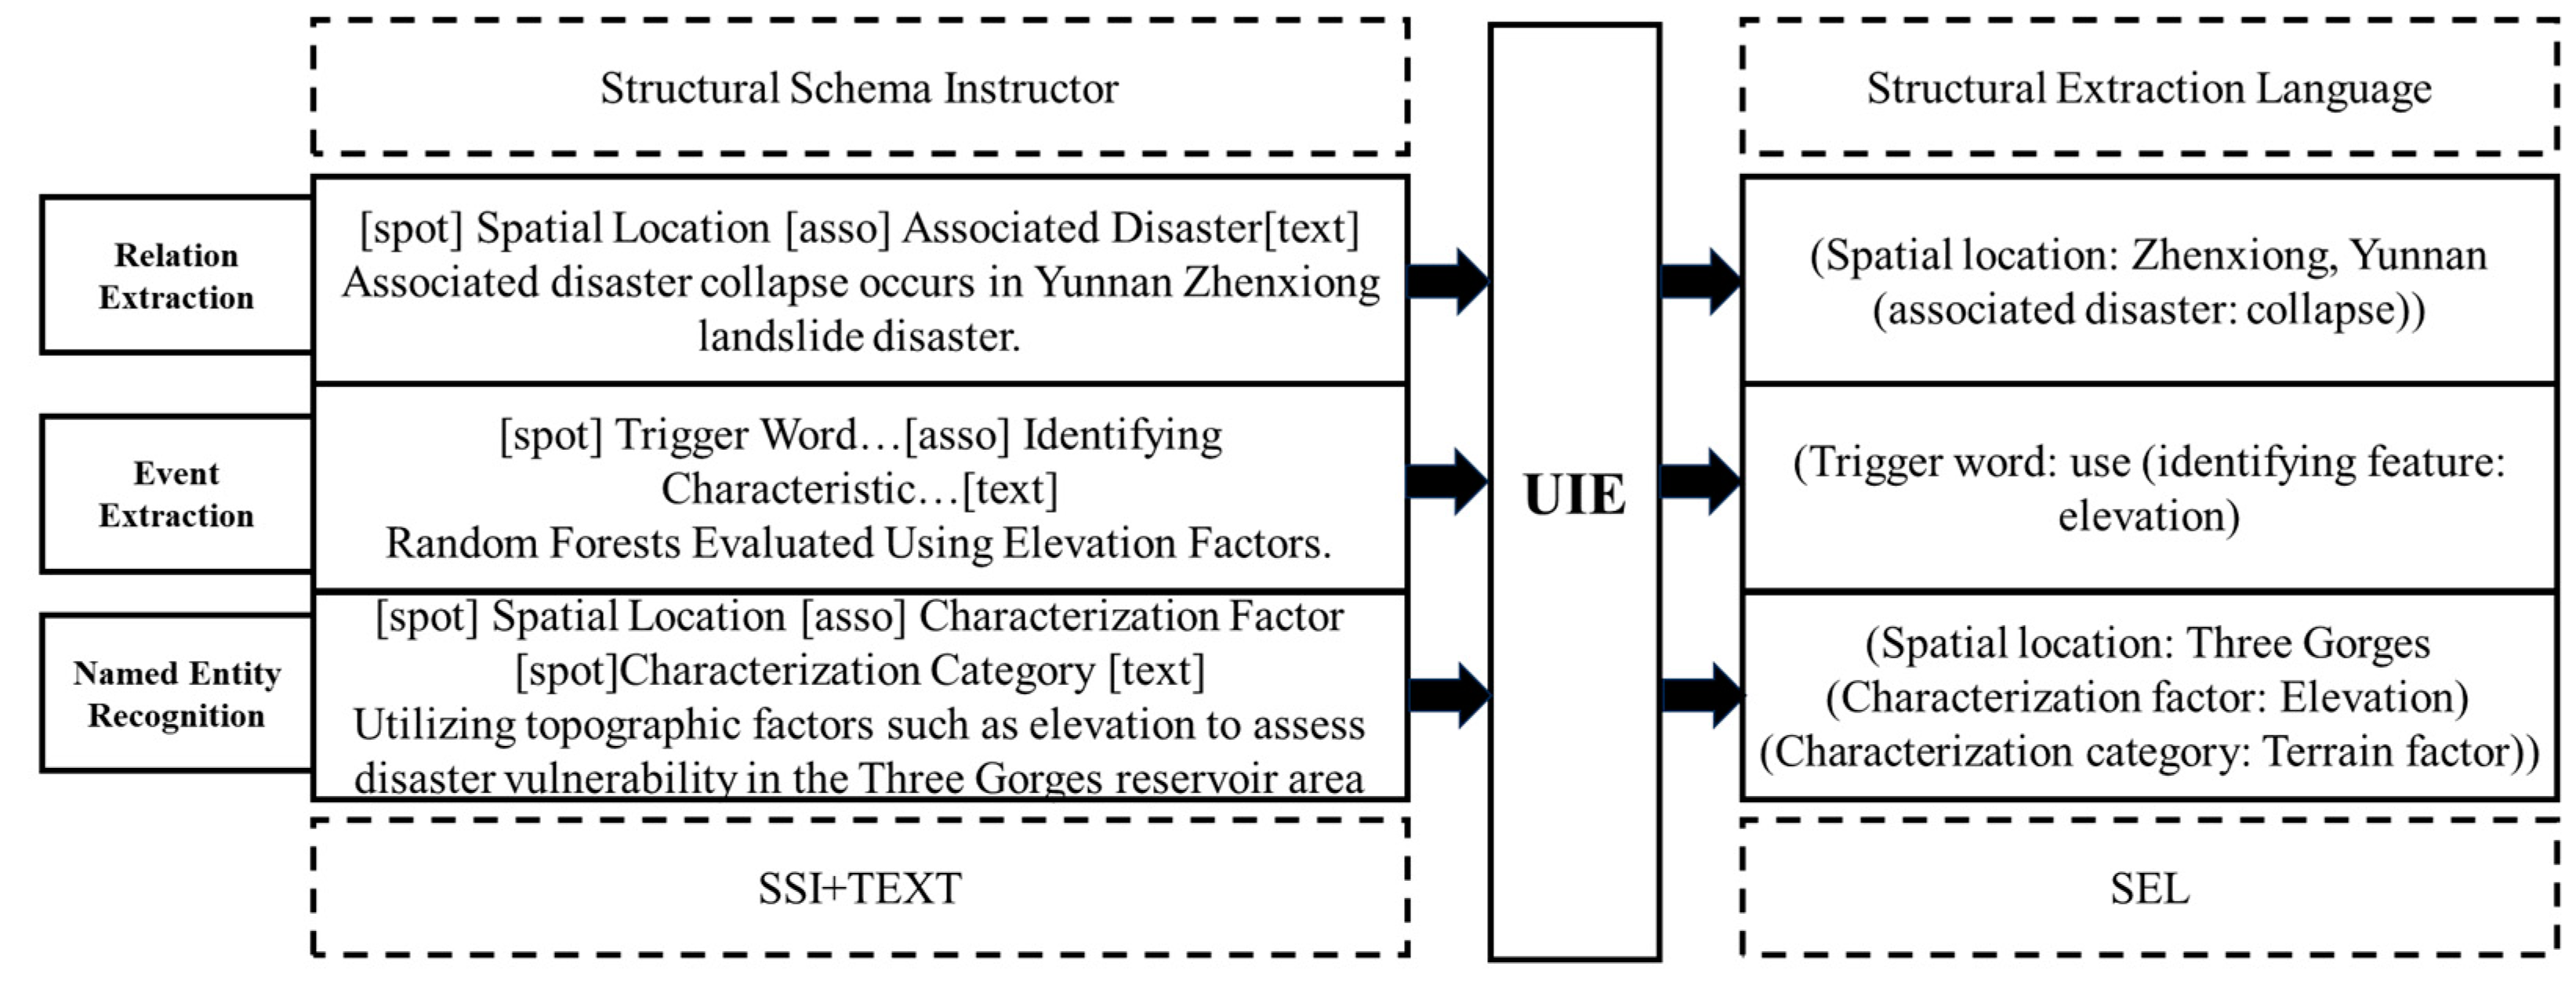
The UIE model solves the information extraction tasks of entities, relationships, and events simultaneously using only one model [36]. The framework splits the information extraction task into two elements, spotting and associating, and the prompt constructed based on spotting and associating is called the Structural Schema Instructor (SSI), which is connected to the experimental text. After the sequence of SSI and experimental text is input into the UIE model, the output is obtained as the Structured Extraction Language (SEL), so that various complex information extraction tasks for large-scale text can be modeled in a unified way, and the UIE model framework is shown in Figure 3. The UIE model learns a language model of the text’s own probability and uses this probability to predict the output entities and relationships, thus reducing the need for large-scale supervised text extraction and the need for a large-scale supervised text extraction, thus reducing the need for large, supervised datasets. In this research, by fine-tuning the UIE model for joint entity–relationship extraction, the efficiency of knowledge extraction is greatly improved.

Figure 3.
UIE model framework.
3.1.2. Knowledge Graph Construction Process
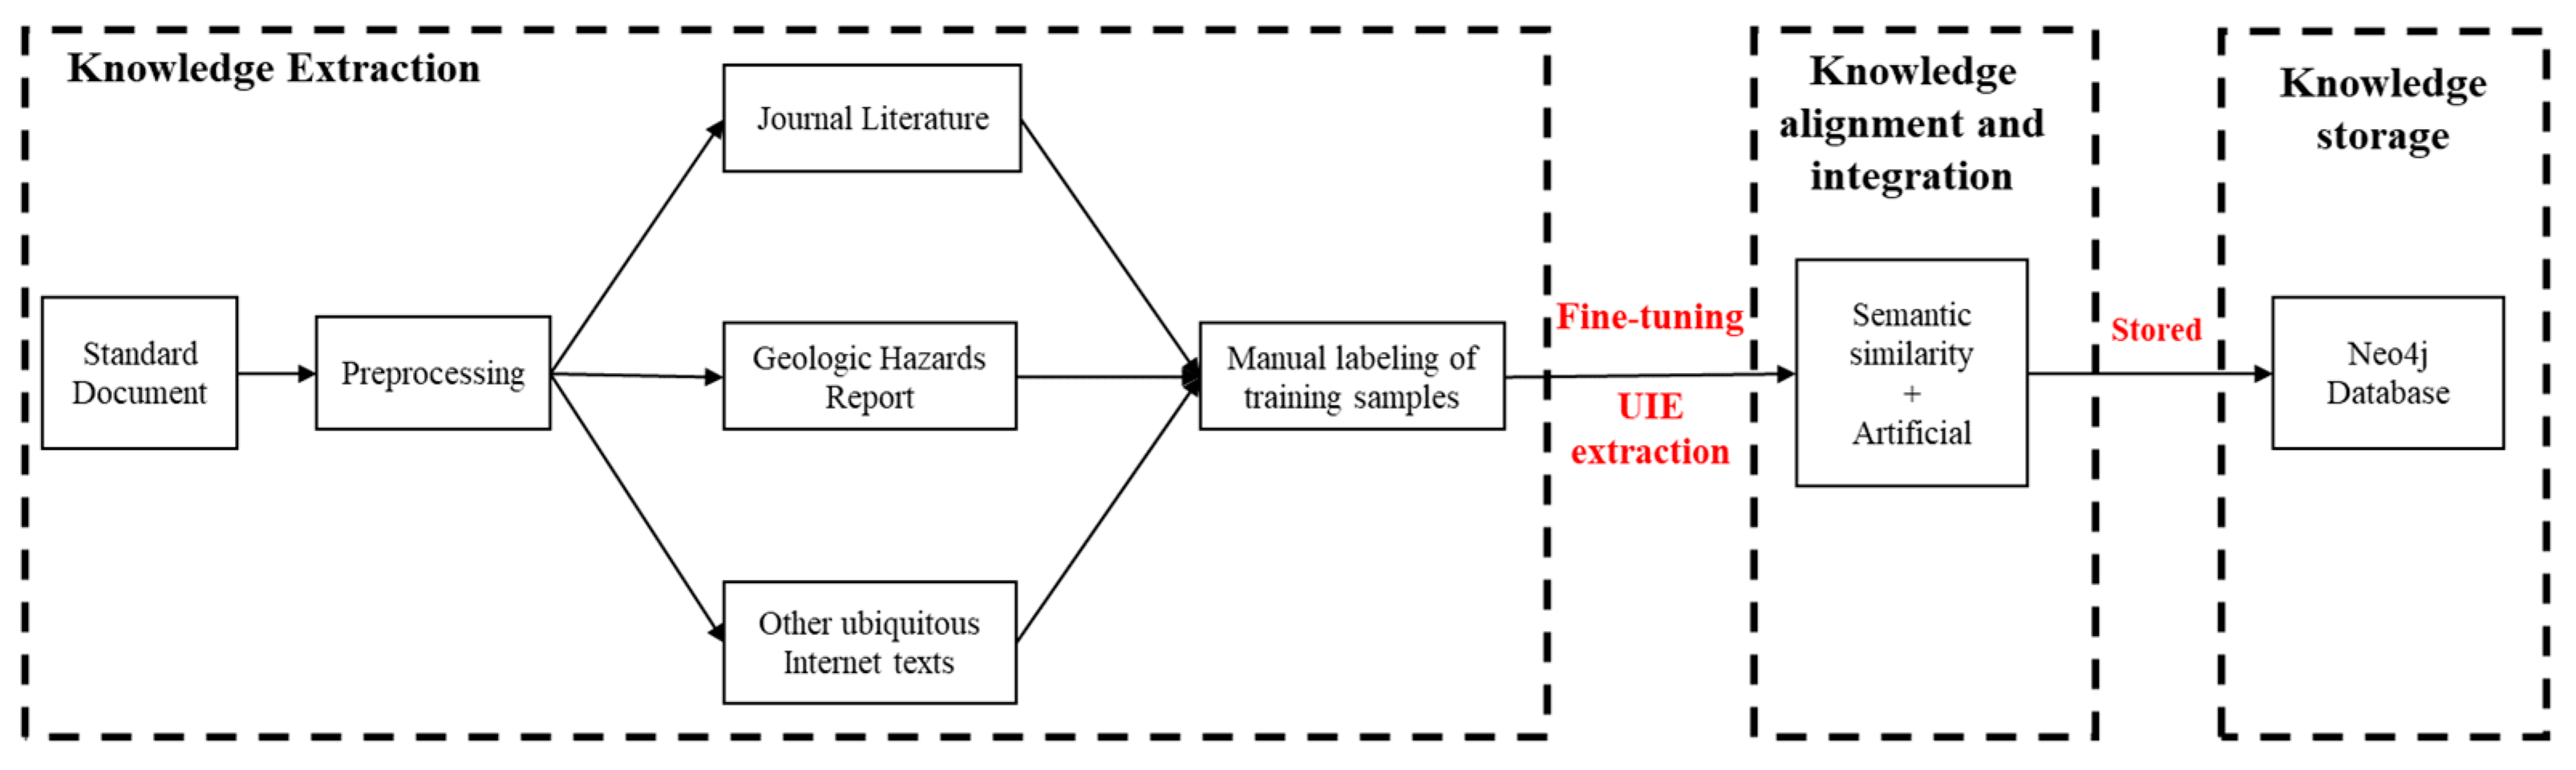
The knowledge graph construction process is shown in Figure 4. Firstly, the knowledge graph ontology layer is constructed based on “landslide disaster examples” and “landslide disaster assessment”. Secondly, the pre-processed PDF text is extracted based on the fine-tuned UIE model. Due to the existence of two kinds of text data in Chinese and English, this research paper manually constructs an entity–relationship Chinese–English comparison library to unify the extracted entity–relationships into English expressions. Thirdly, the extracted knowledge is stored in the form of a graph database based on semantic similarity. Because of the small scale of the knowledge graph constructed, the knowledge is aligned and fused manually with the aid of semantic similarity. Finally, the extracted knowledge is stored in the form of a Neo4j graph database.
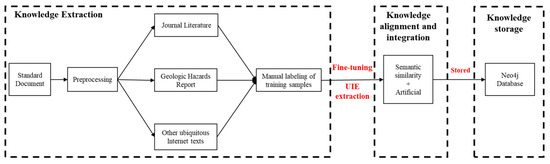
Figure 4.
Knowledge graph construction process.
3.2. Knowledge Graph-Based Feature Factor Recommendation Model
The landslide knowledge graph consists of three main parts, namely the characterization factors selected for landslide susceptibility assessment in different regions under existing researches, the relevant features of historical landslide events, and the manually set terrain areas and administrative areas. In the knowledge graph-based feature factor recommendation mode, firstly, the PairRE is used to carry out the characterization learning, and the area with high relevance to the target area is selected through the regional spatial similarity calculation; the landslide susceptibility assessment factors of this area are taken as the alternative factor set. The attribute similarity is calculated, and the high similarity factor is eliminated to realize the alternative factor set to reduce the redundancy, and to realize the selection of the evaluation indexes of landslide disaster assessment.
3.2.1. Landslide Knowledge Graph Representation Learning
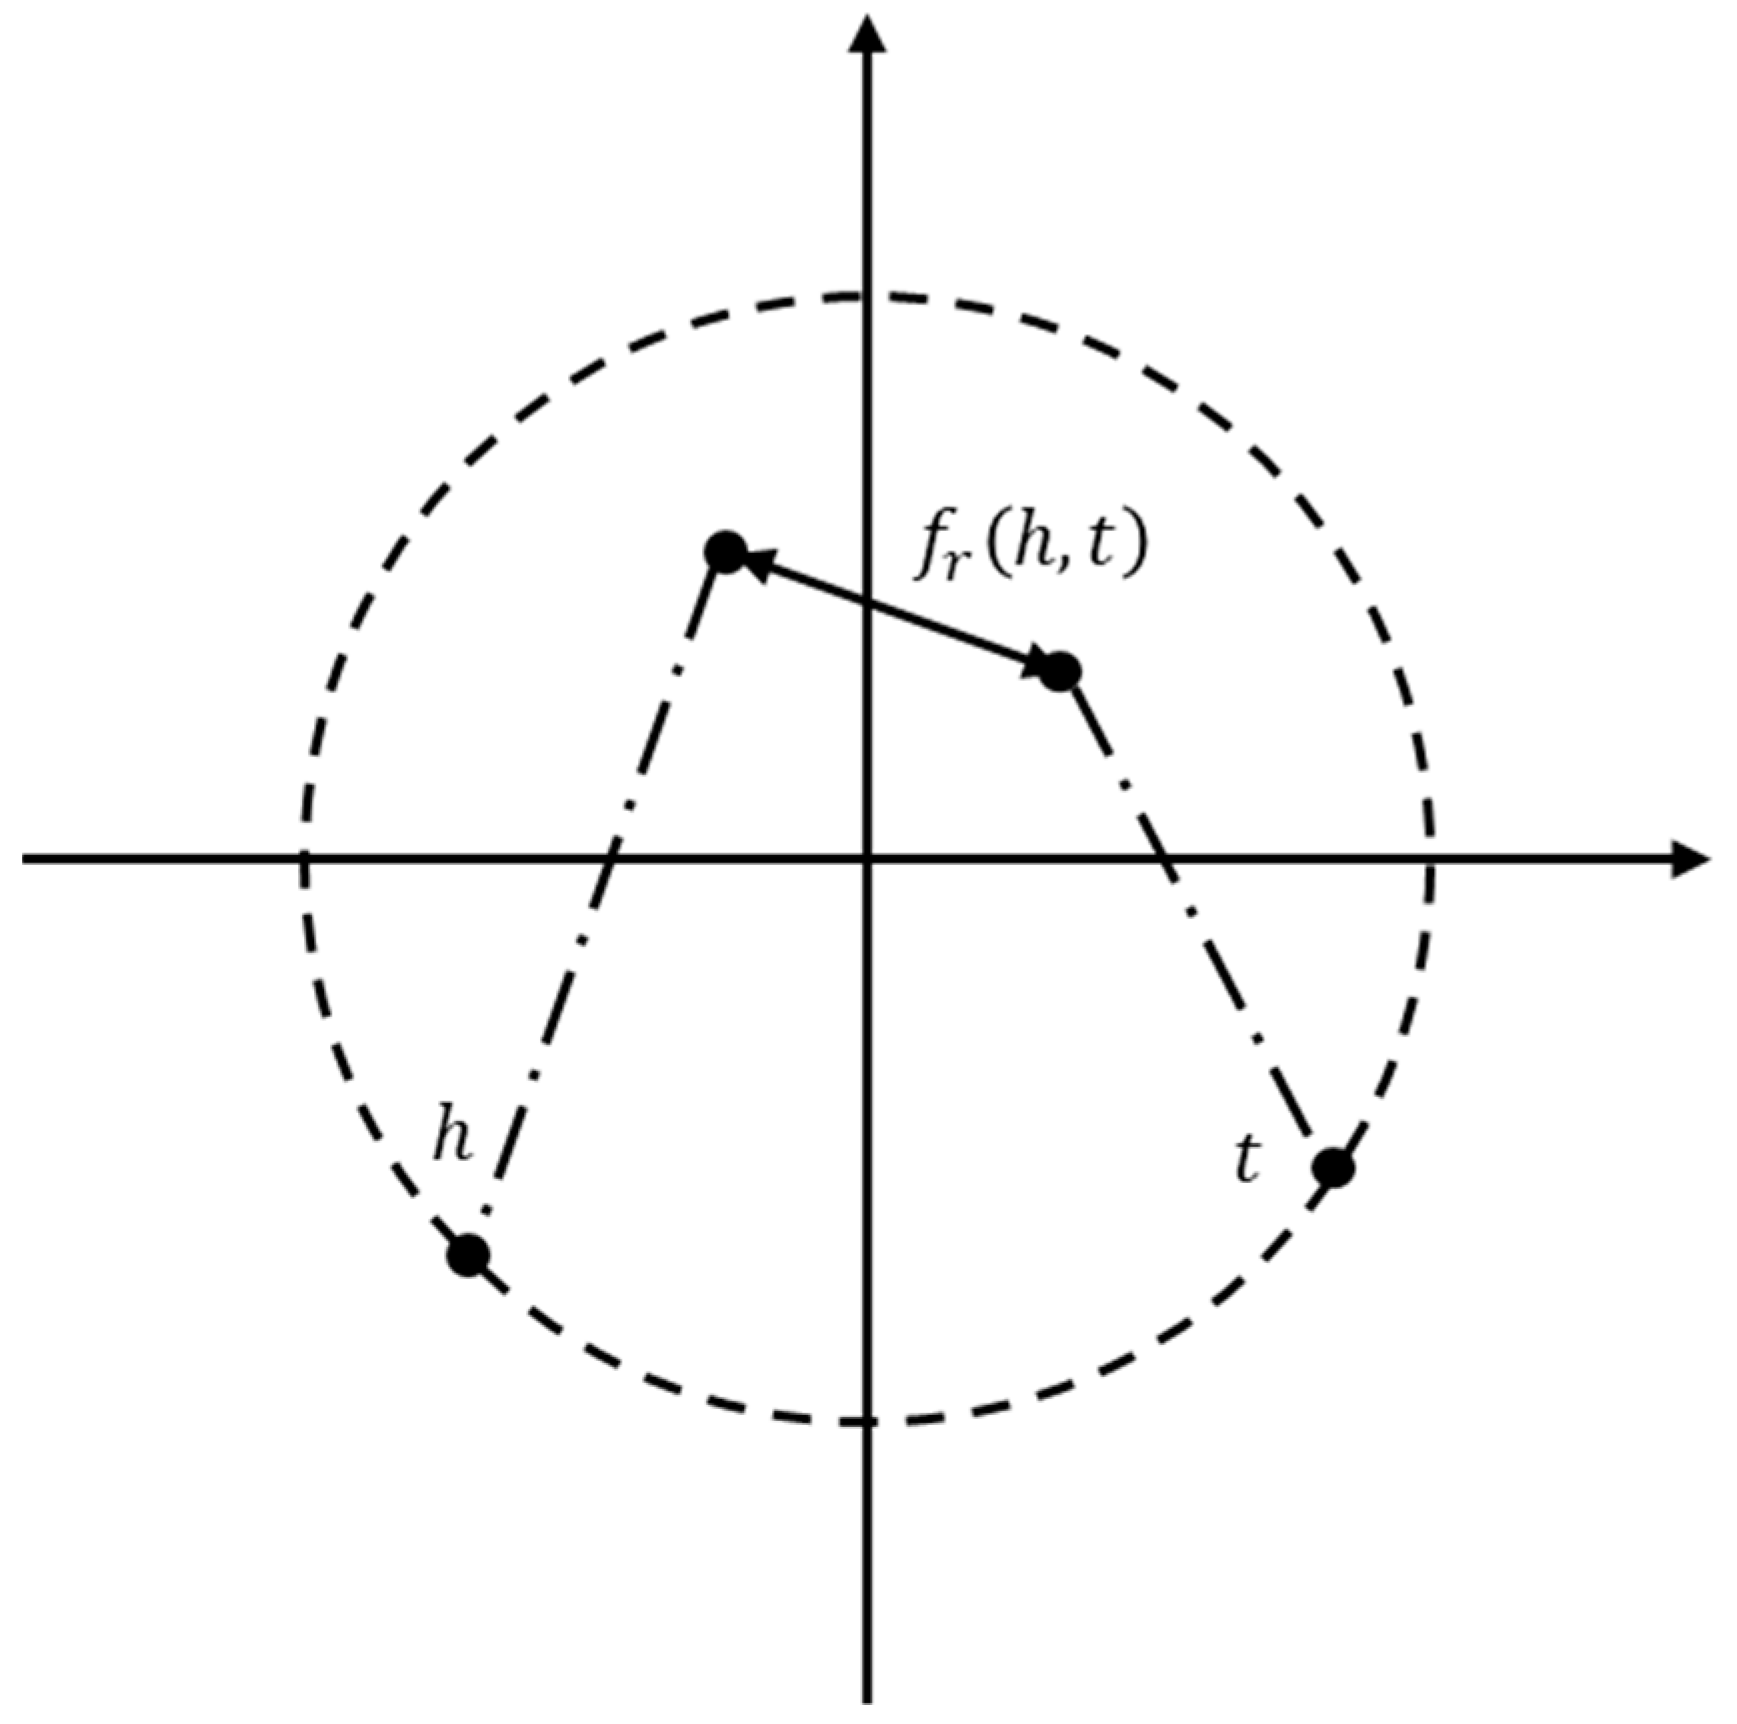
Entity relationships in the landslide knowledge graph are more complex, with one-to-one, one-to-many, and many-to-many relationships. In this research, we use the PairRE for knowledge graph representation learning [37], which is able to adequately capture the semantic links between entities. Specifically, for a given triple, the PairRE embeds the relations in the graph as two vectors, and , which project the head entity and the tail entity into the Euclidean space, i.e., the PairRE allows an entity to have a distributed representation in different relations. The projection operation is performed using the Hadmard (). PairRE ultimately determines whether the embedding representation of each ternary is justified by calculating the distance between the two vectors after projection. Intuitively, all embedded representations in PairRE are on a hypersphere (see Figure 5).
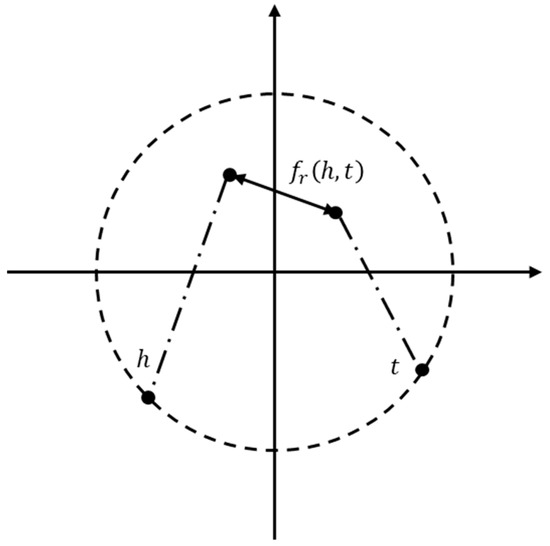
Figure 5.
Spatial mapping of the PairRE model.
The formal representation of the objective function of PairRE is as follows:
where , , , and , are the parameters of the vector, which represent the “length” of the vector.
3.2.2. Correlation Calculation Based on Semantic Overlap
The relationship metrics involved are mainly the correlation relationship between the administrative areas and terrain areas belonging to the spatial location and the target area. In the calculation of the overlap degree based on the knowledge graph, only the overlap degree between the set of administrative regions, the set of terrain regions and the target area need to be considered. The calculation formula is as follows:
where is the set of knowledge graph candidates, is the set of administrative/terrain areas in the knowledge graph, and is the set of target area; represents the number of intersections of two sets.
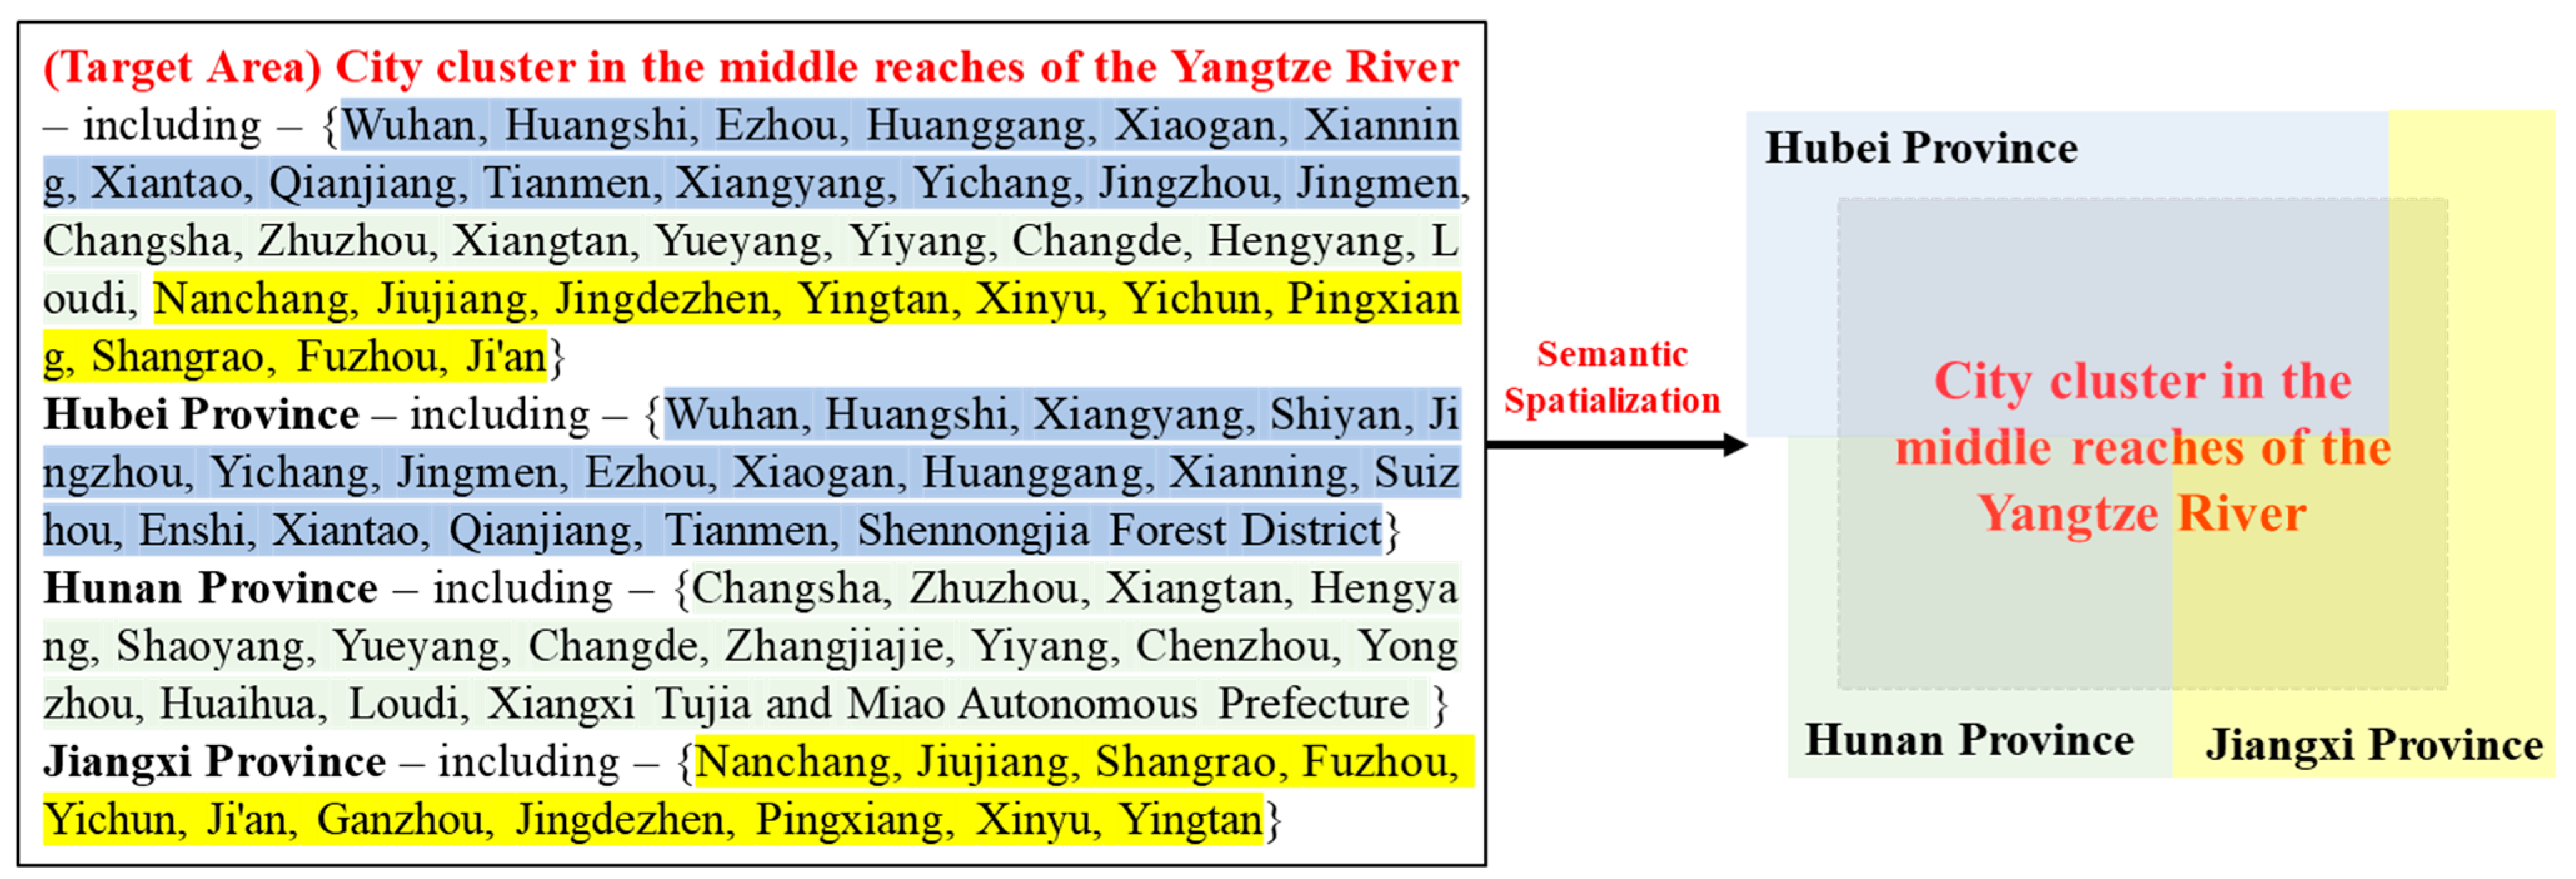
As shown in the case of Figure 6, the target area (CJZY) involves three sub-regions (Hubei Province, Hunan Province, and Jiangxi Province).
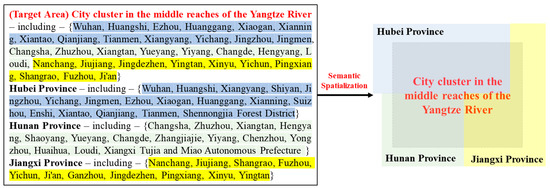
Figure 6.
Example of correlation based on semantic overlap (different colors represent different regions).
For example, Hubei Province contains 17 administrative districts, and among the 31 administrative districts included in the middle reaches of the Yangtze River, there are 13 administrative districts in Hubei, so the weight of Hubei Province in the study area is .
From the perspective of correlation, the correlation results between the target area and the three sub-regions are shown in Table 1. Then, the selection of subregions is determined by setting the threshold value to realize the selection of subregions with high spatial region overlap.

Table 1.
Spatial location correlation.
3.2.3. Attribute Similarity
Redundant information indicates the repeated information generated by multiple records in all the data to be selected [38], which is expressed in the knowledge graph for the repeated characterization factors selected in the landslide susceptibility assessment of all the regions to be selected, and this information is often highly correlated. For example, elevation is selected as a characterization factor for both the Guizhou Province and the Sichuan Province, and in the selection of the indicator, elevation is recorded twice; at this time, the information produces redundancy phenomenon. This research is based on vector operations, using the knowledge graph characterization of the distributed low-dimensional vectors of each feature factor obtained after learning as a numerical value, using cosine similarity to calculate the similarity of the attributes of the high redundant information removal. The similarity formula is as follows:
where and represent the selected characteristic factor vectors for each region in the existing studies, respectively, and represents the cosine similarity between the characteristic factor vectors; is the parameter of the vector, which represents the “length” of the vector.
3.3. Knowledge Discovery of Landslides Based on Knowledge Graph
Word frequency statistics based on the knowledge graph can reflect the attention of entities in the text, and in this research, TF-IDF is calculated to assess the important information in landslide-related information [39,40]. It usually indicates that the times an entity appears in the landslide event graph (landslide event graph constructed by extracting from disaster reports, encyclopedia entries), and TF-IDF is a statistical method for assessing the importance of a word to a corpus. The importance of a word increases proportionally with the number of times it appears in a document, but decreases inversely with the frequency of its appearance in the corpus. The TF-IDF is categorized into TF and IDF, and is calculated by the following formulas:
where denotes the number of times entity appears in landslide event graph , and denotes the frequency of entity appearing in the landslide event graph ; denotes the number of entities in all knowledge graphs, and denotes the number of landslide event graphs containing entity .
3.4. Machine Learning Models
In this research, LR, SVM, RF, GBDT, XGBoost, and CatBoost were selected as models for landslide susceptibility assessment. We used fivefold cross-validation based on training samples for preliminary machine learning model evaluation, and selected the optimal model for the analytical mapping of hyperparameter optimization and landslide susceptibility assessment.
3.4.1. Logistic Regression
LR is a statistical learning method used to solve classification problems; the basic idea is to use a linear combination of one or more independent variables to estimate the probability of an event occurring [41,42]. The LR model describes the relationship between a binary dependent variable (whether a landslide occurs or not) and an independent variable, which can be either continuous or discrete, and does not need to satisfy a normal distribution, with the following expression:
where is the intercept constant term; , …, are the regression coefficients corresponding to the respective variables; and , , …, are the values of the indicators for each landslide factor.
3.4.2. Support Vector Machine
SVM essentially lies in constructing an optimal decision boundary or hyperplane by finding the support vectors in the dataset to maximize the spacing between different classes for classification [43,44]. SVM is widely used to solve many complex classification and regression problems due to their effectiveness in solving finite-sample, nonlinear high-dimensional pattern recognition problems.
In general, the input variables are mapped in a higher dimensional feature space from a relatively low feature space by the kernel function of the SVM model. There are three parameters that need to be determined appropriately in the SVM model. These parameters are named as the penalty degree , the non-sensitive loss function , and the kernel function parameter . In this study, the cross-validation stage method is adopted to determine the optimal parameter combination of , and γ.
3.4.3. Random Forest
RF utilizes random features that bag and generate decision trees to form forests of uncorrelated trees. As a result, each decision tree is a randomly given subset of features, leading to better predictive performance of RF models than decision trees [45,46]. During training, RF generates a large number of trees and trains each tree based on a random subset of input variables. During testing, each tree has its own decision, and the final decision is determined by an unweighted majority vote of all decision trees. RF is the most popular classification model due to its high accuracy and computational speed. RF has been used in landslide susceptibility assessment studies with high prediction accuracy.
RF is a combinatorial classification model which consists of multiple decision trees . The parameter set comprises independent and identically distributed random vectors, and the optimal classification result is voted by each decision tree model given the independent variable . The optimal classification result is the result of the decision tree model.
3.4.4. Gradient Boosting Decision Tree
GBDT is a method for generating integrated classifiers for training weak learners to become strong models in a sequential and adaptive manner; it possesses strong generalization ability, and can be used in both classification and regression problems, as well as regular functions to improve the training results and to reduce the overfitting of the model [47,48]. GBDT generates a weak classifier through multiple iterations, and each classifier is trained based on the residuals of the last iteration of the classifier. In each iteration, the weak classifiers are weighted and summed to obtain the final result [49].
3.4.5. Extreme Gradient Boost
XGBoost is a machine learning framework based on gradient boosting decision trees [50], which also belongs to the category of integrated learning, which improves on the conventional GBDT model while utilizing first-order and second-order derivative information, which allows for the automatic use of multi-threaded parallel computation with CPUs during training [51]. In addition, regularization and rank sampling are used to prevent overfitting [52]. XGBoost is scalable in all scenarios and is a tree learning algorithm that can be used to process sparse data. XGBoost pushes the extremes of machine computation limitations in order to provide scalable, portable, and accurate libraries, with the advantage of being less computationally resourceful and efficiently flexible and easy to run [53].
3.4.6. Classification Boosting Decision Tree
CatBoost is a machine learning algorithm based on the boosting strategy [54]. Similar to other boosting algorithms, CatBoost strives to minimize a given loss function , where is the true label and is the prediction of the model. CatBoost computes the first-order and second-order derivatives of the loss function with respect to the prediction at each step of the update, i.e., the gradient and the Hessian matrix .
3.5. Model Accuracy Evaluation and Characterization Factor Interpretation
3.5.1. Model Accuracy Evaluation
, , , and the were used to evaluate model performance and precision [55,56]. The formula for each index is calculated as follows:
where true positive () is when both actual and predicted values are positive; true negative () is when the model correctly predicts a negative category sample as a negative category; false positive () is when the model incorrectly predicts a negative category sample as a positive category; and false negative () is when the model incorrectly predicts a positive category sample as a negative category.
3.5.2. Shapley Additive Explanations (SHAP)
The main idea of SHAP is cooperative game theory, which is used in this research to quantify the contribution value of each potential disaster-causing factor in a single evaluation unit to the landslide susceptibility evaluation results, and SHAP interprets the predicted value of the landslide susceptibility evaluation model as the sum of the contribution value of each input feature [57,58,59], calculated by the following formula:
where is the explanatory model; is whether the corresponding feature can be observed; is the baseline value of the model’s prediction for the evaluation unit, i.e., the predicted mean value of all training samples; and is the contribution value of each feature. Therefore, the output of the model for any evaluation unit can be expressed as the sum of the predicted expectation and the contribution values of all features of that evaluation unit. Meanwhile, the SHAP algorithm provides a preliminary treatment of the potential probability of landslide occurrence in the local interpretation:
where is the processed value and is the probability that the model predicts the potential occurrence of a landslide.
4. Experimental Results and Analysis
4.1. Landslide Susceptibility Assessment Knowledge Graph Construction
4.1.1. Knowledge Modeling
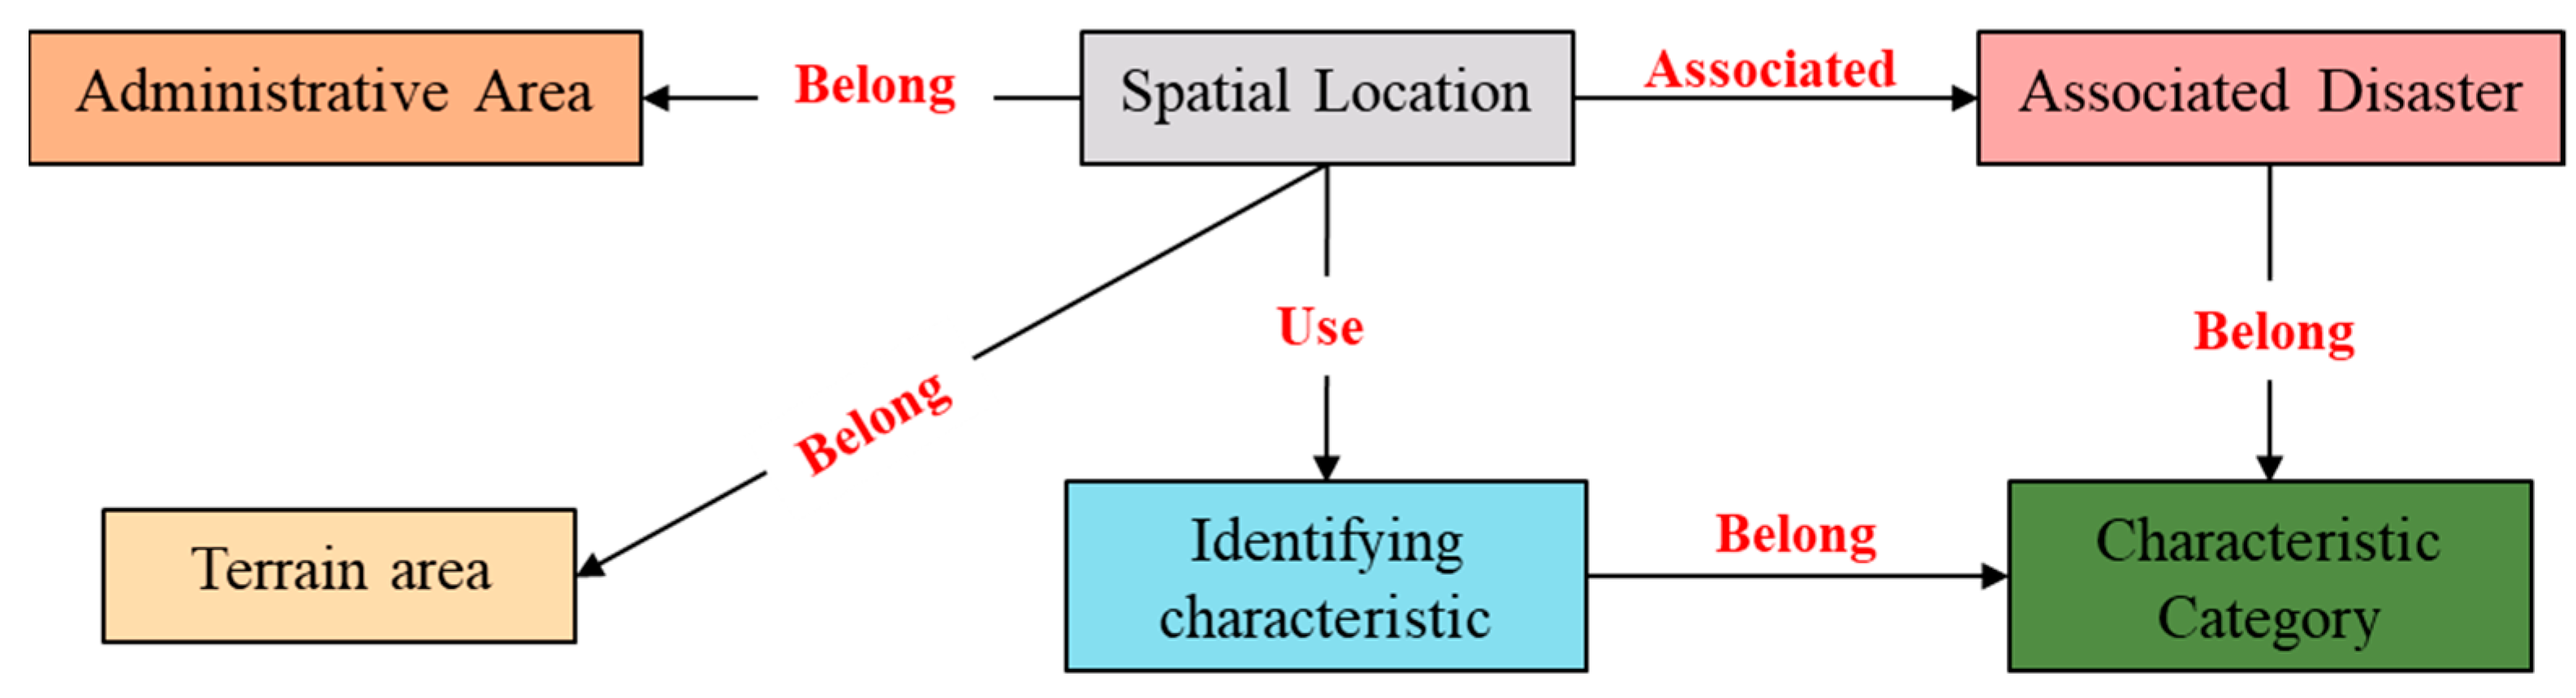
Combined with the needs of landslide susceptibility assessment and identification, the initial knowledge framework system centered on landslide disaster are summarized. The entity types include spatial location, topographic area, administrative area, identification features, feature categories, and associated disaster (e.g., Figure 7). Among them, the spatial location refers to the spatial location where the historical landslide events occurred, such as the Three Gorges Reservoir Area, Zigui County, etc.; the terrain area and administrative area represent the topography and administrative area belonging to the spatial location where the historical landslide events took place, respectively, such as Shui Cheng County, Liupanshui City, which is located in a topographic region of the Southwest China Mountainous Region, and an administrative area of the Guizhou Province. The identifying characteristics indicate the characteristic factors selected for assessing landslide susceptibility in the current research, such as elevation, slope, faults, etc.; feature category indicates the category to which the identifying feature belongs, e.g., elevation, slope for topographic features, fault density, and the type of geologic body for geologic environment. The associated disaster is another type of geologic disaster occurring in the area where landslides occur, e.g., avalanche, mudslide, etc.
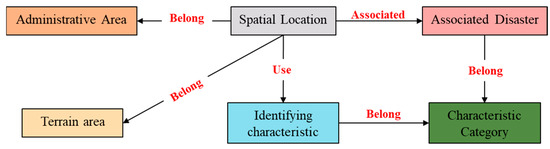
Figure 7.
Landslide knowledge graph entity types and relationship.
In this research, due to the existence of two kinds of text data in Chinese and English, this research paper manually constructs an entity–relationship Chinese–English comparison library to unify the extracted entity–relationships into English expressions.
4.1.2. Data Labeling
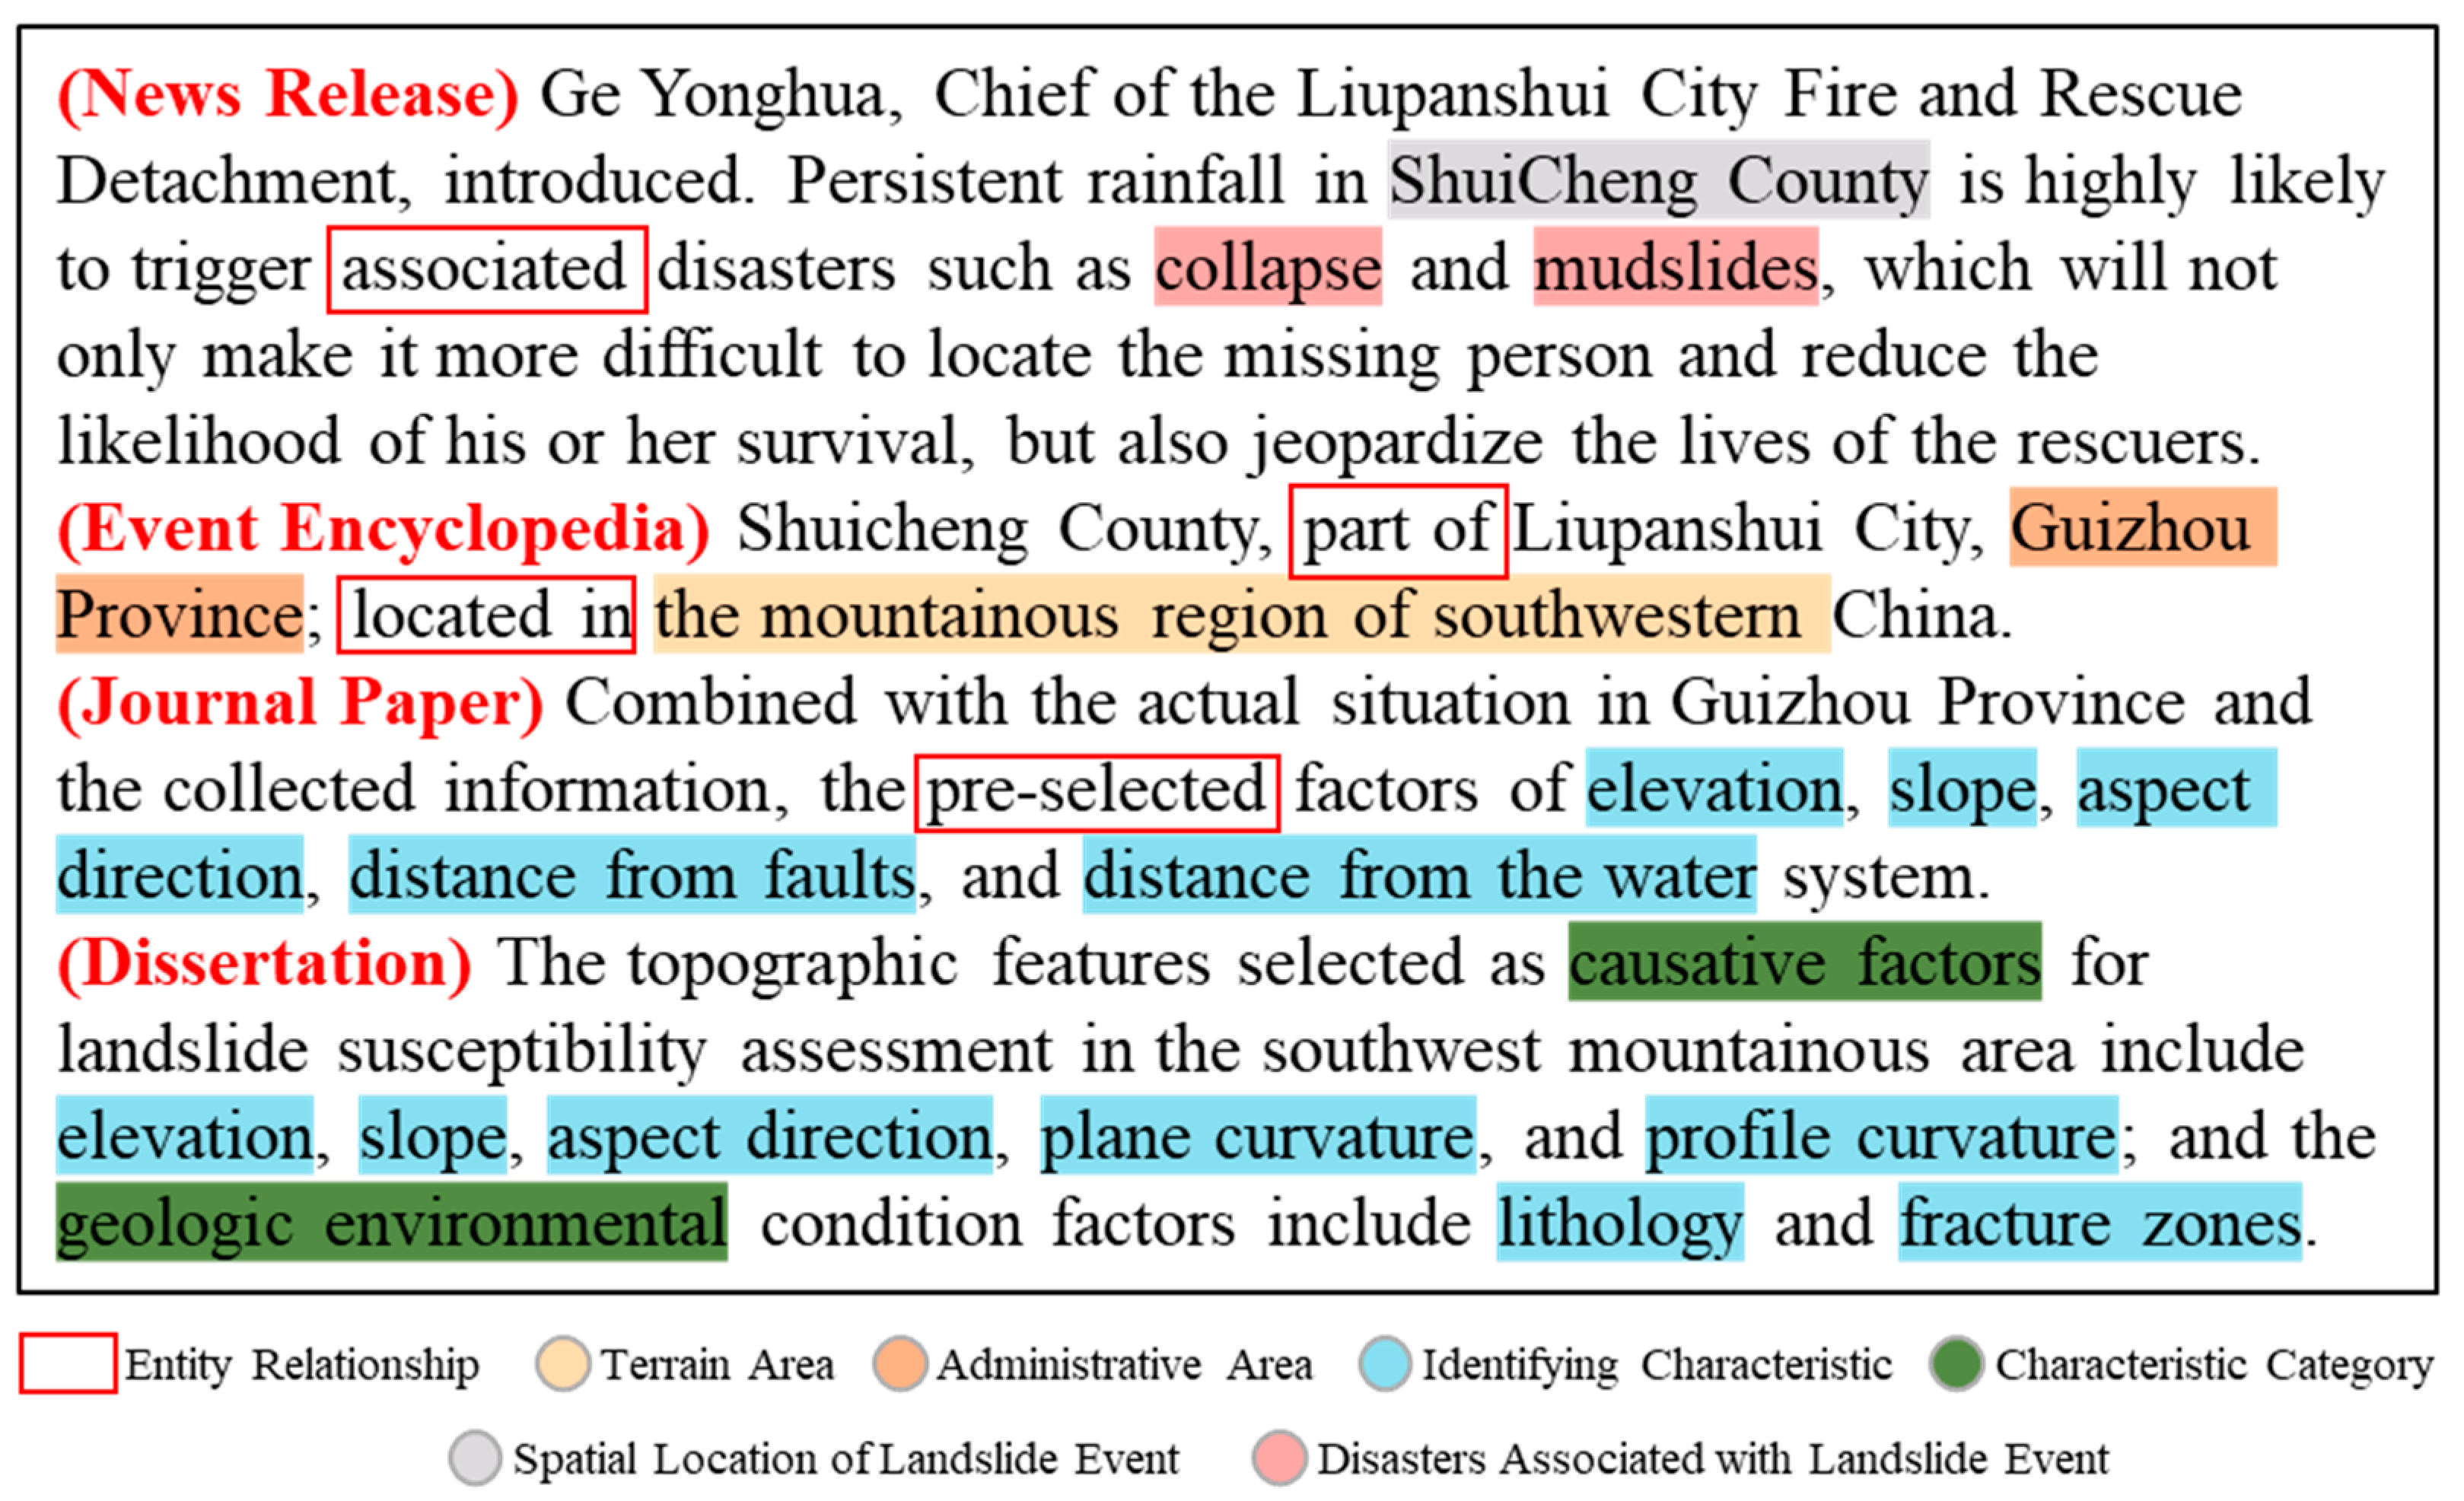
This research adopts a fine-tuning modeling strategy based on ERNIE-UIE, so a small amount of labeled data is required. This utilizes the open-source annotation tool “Doccano” to extract 100 texts from the original data for annotation (an example of annotation is shown in Figure 8). The initial labeled data is converted into data with Prompt, and the specific text of all tail entities is stored in “result_list”, while the head entities are combined with relationship types to form a specific “prompt”.
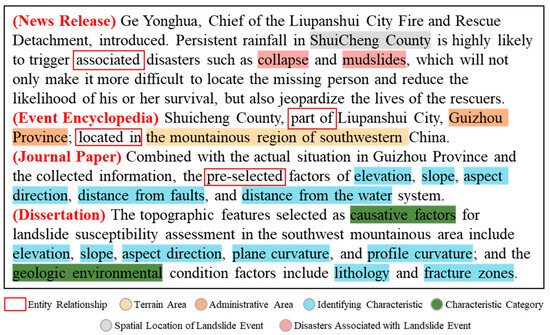
Figure 8.
Example of entity–relationship text labeling.
4.1.3. Model Fine-Tuning and Knowledge Extraction
Since the results returned from the joint extraction of entity relationships using the UIE do not contain tail entities, the relationship settings between the entities of the knowledge framework need to be formulated to specify the unique head entity type and tail entity type corresponding to each relationship, in addition to conforming to the actual relationship situation. Table 2 shows the specific entity relationship types.
Table 2.
Table of entity relationship types.
Based on the pre-processed text data, the experimental training set and test set are divided according to the ratio of 8:2, using paddle version 2.4.2, PaddleNLP version 2.6.0rc, and GPU with 16 GB memory, and based on the “uie-base” pre-training model for model fine-tuning. After training, the learning rate is set to 1 × 10⁻⁵, batch size is 18, the number of epochs is 20; the results are evaluated in three dimensions, , , and the , and the final results of each part are shown in Table 3 and Table 4.
Table 3.
Entity extraction accuracy.
Table 4.
Relationship extraction accuracy.
Although some types of entities and relationships have poor performance, as represented by the extraction results of “Identifying Characteristic” and “Belong” entities and relationships, it may be due to the fact that in the constructed paper library, some of the papers are not mentioned for the category of the feature factor, so when training with the pre-trained model, the category to which this part of the feature factor belongs cannot be captured, resulting in low training accuracy. It may be because the text only selects the identification features, but does not describe the category to which the features belong, so there is a missing problem; or it may be that, although the identification features are categorized in the text, they are displayed in multimodal forms such as graphs and tables, and the method selected in this research is not designed to extract the information of the other modal forms. In order to improve the accuracy of entity extraction, the research uses manual classification methods to reclassify the recognition features. According to the entity relationship in Table 1, the mapping table is constructed and mapped to get the entity type label of the tail entity. The final processing results are de-emphasized and corrected to obtain a total of 2167 entities and 2352 entity relationship triples.
4.1.4. Knowledge Storage
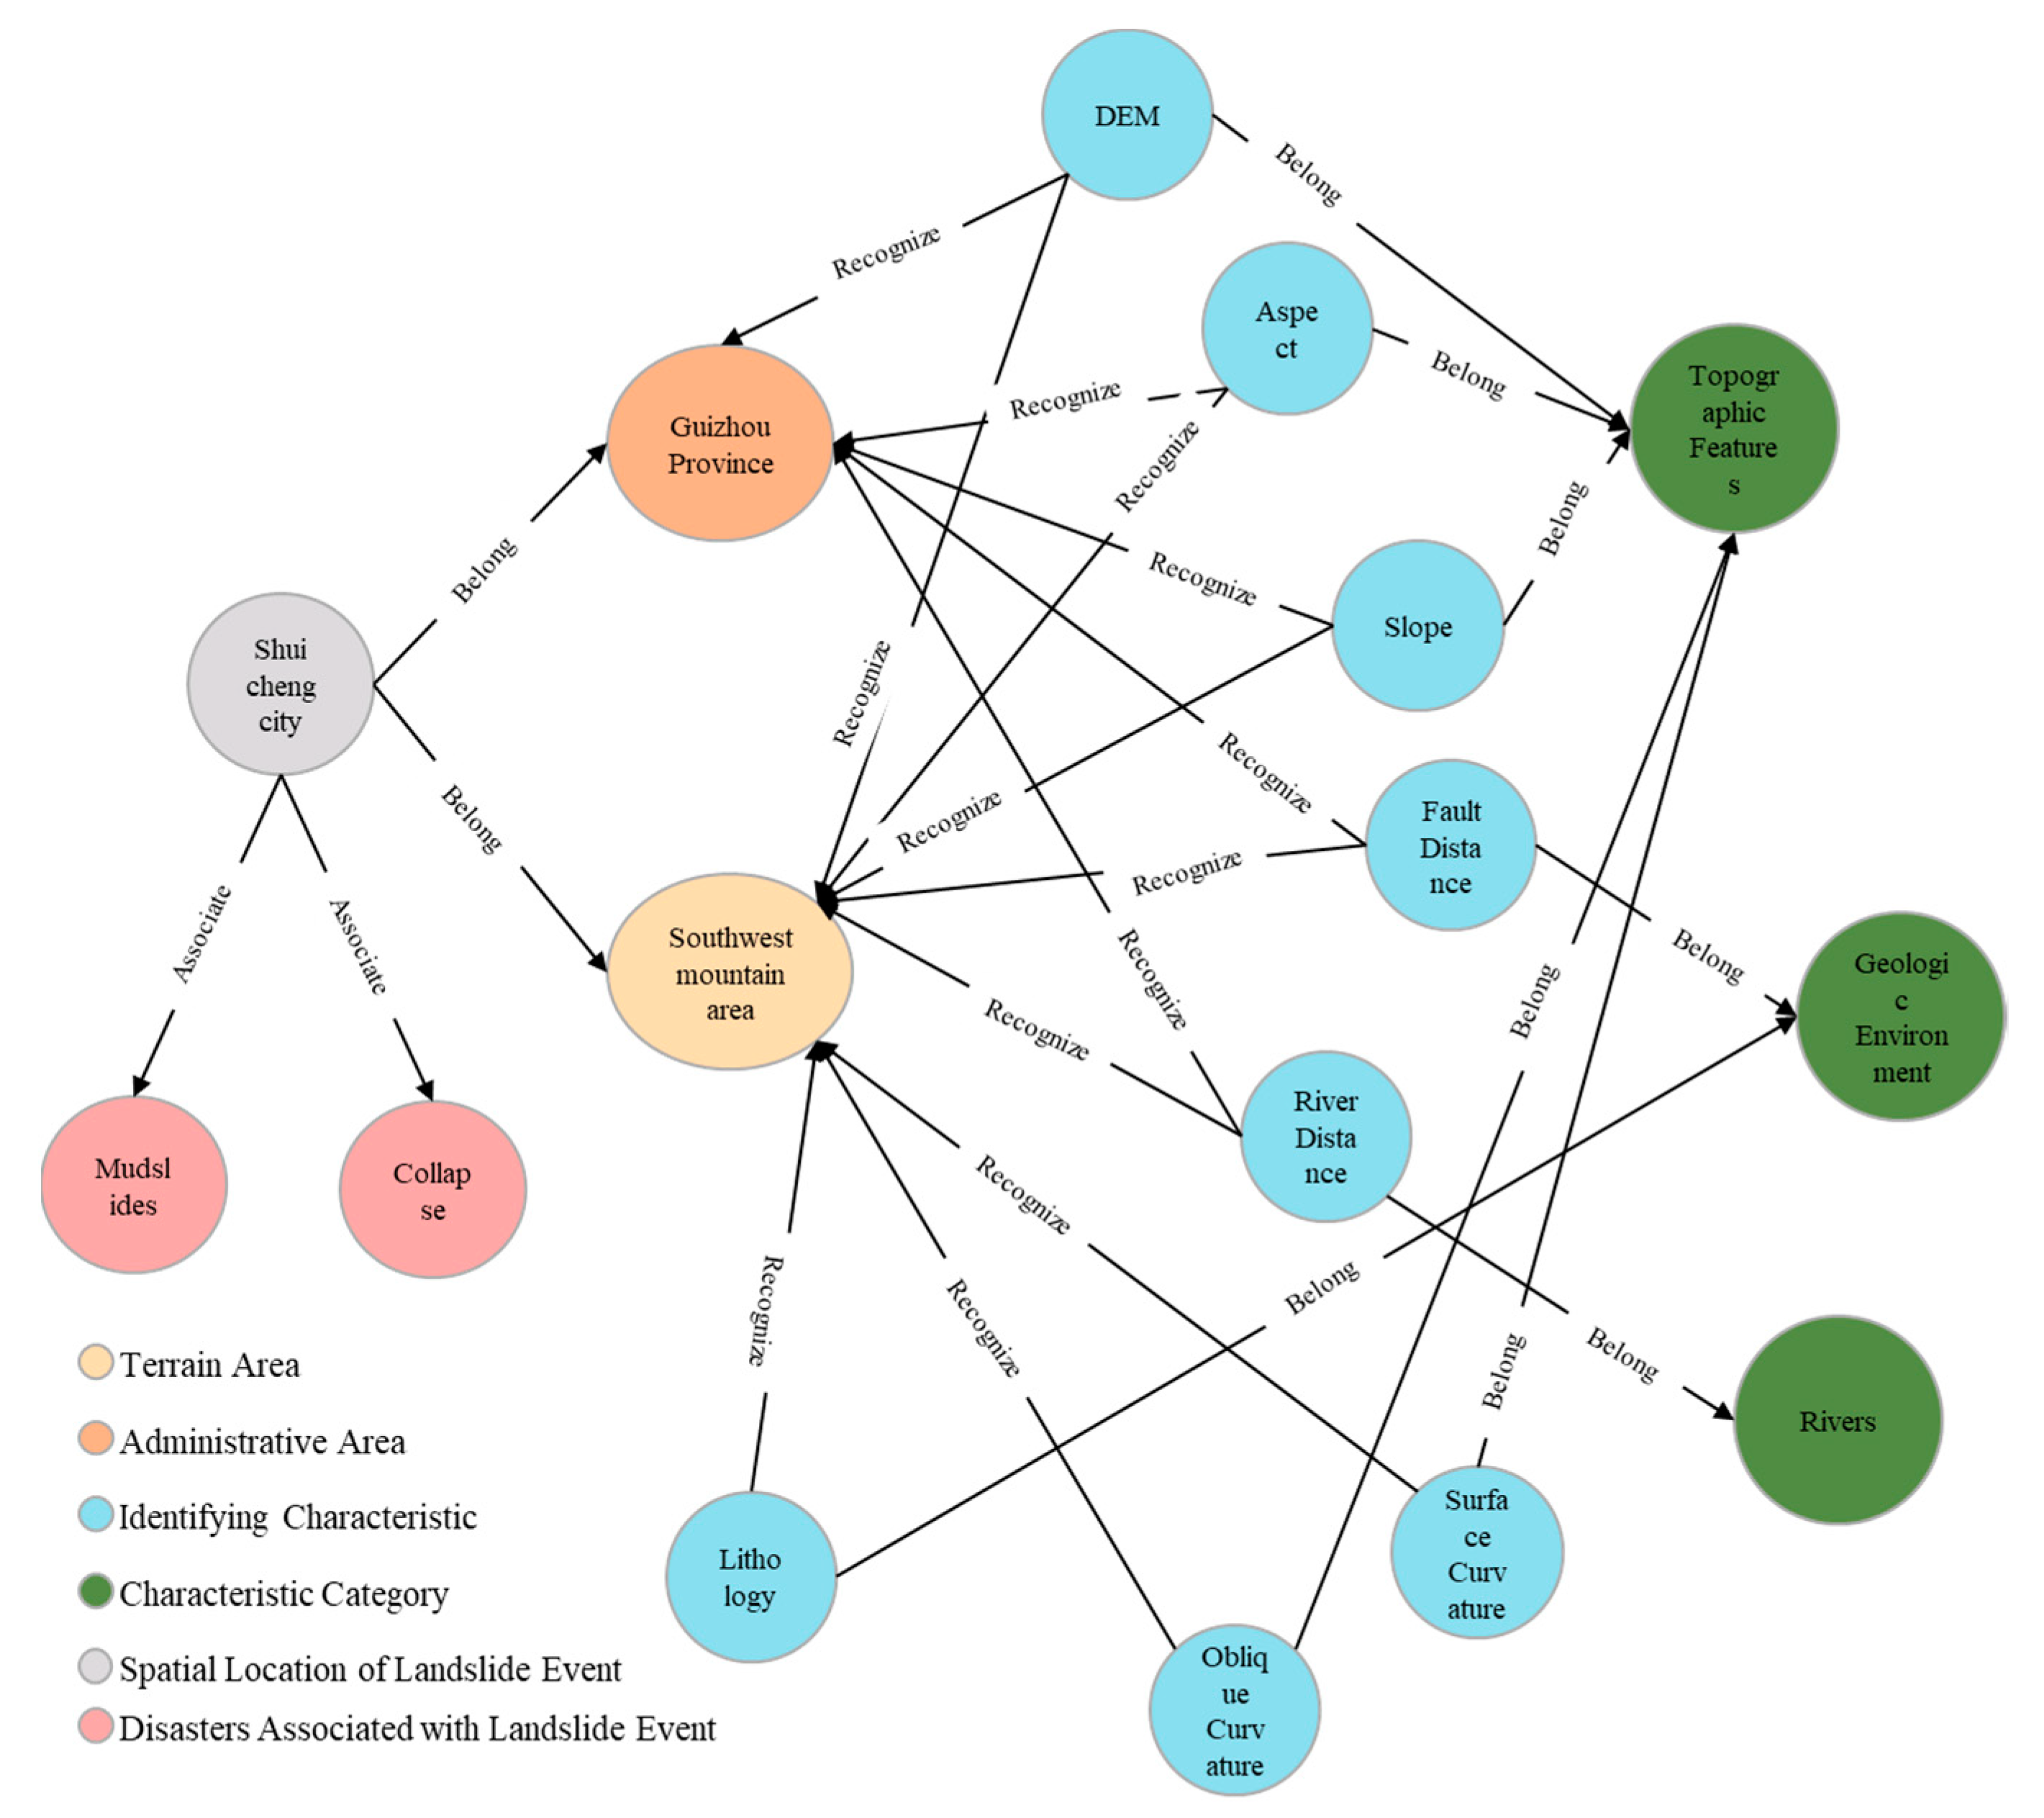
The Neo4j graph database is adopted to store the data and visualize the knowledge graph. Using the Py2neo library, the previously processed data are batch imported into the Neo4j graph database to obtain the “knowledge graph of landslide disaster susceptibility assessment” (part of the results are shown in Figure 9).
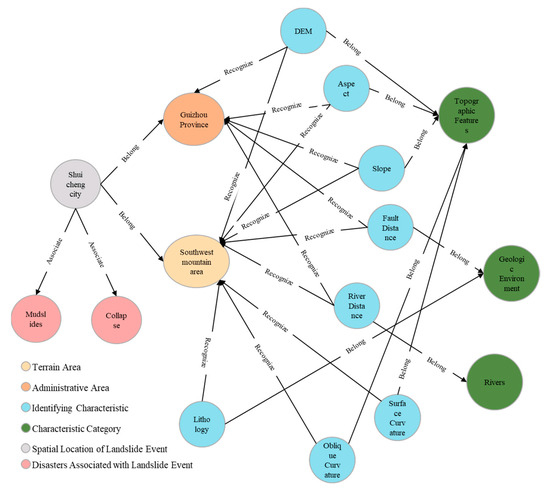
Figure 9.
Knowledge graph for landslide disaster susceptibility assessment (“7–23 Shuicheng County landslide incident” as an example).
4.2. Recommendation of Characteristic Factors for Landslide Susceptibility Assessment in TGA Based on Knowledge Graph
4.2.1. Semantic Correlation in the TGA
In order to verify the effectiveness of the recommendation model proposed, the delineated study area increased the neighboring counties (districts) compared to the traditional Three Gorges Reservoir area. According to the correlation calculation based on the overlap degree proposed in this paper (as shown in Figure 10), the threshold value of 0.5 is set, and the characterization factors are selected for the relevant studies of Chongqing Municipality and Hubei Province in the administrative area; the four regions of Three Gorges Reservoir Area, Daba Mountainous Region, Sichuan Basin, and Chuandong Ridge and Valley are selected for the terrain area.
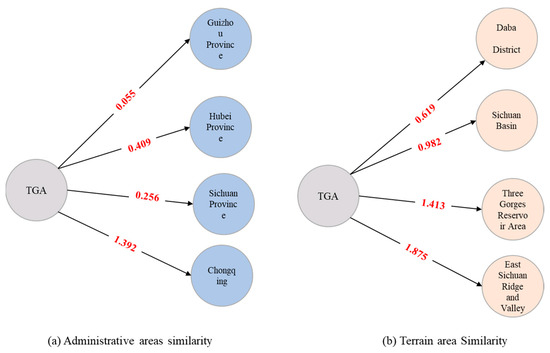
Figure 10.
Results of the correlation between the administrative area (a) and terrain area (b) of TGA based on the knowledge graph.
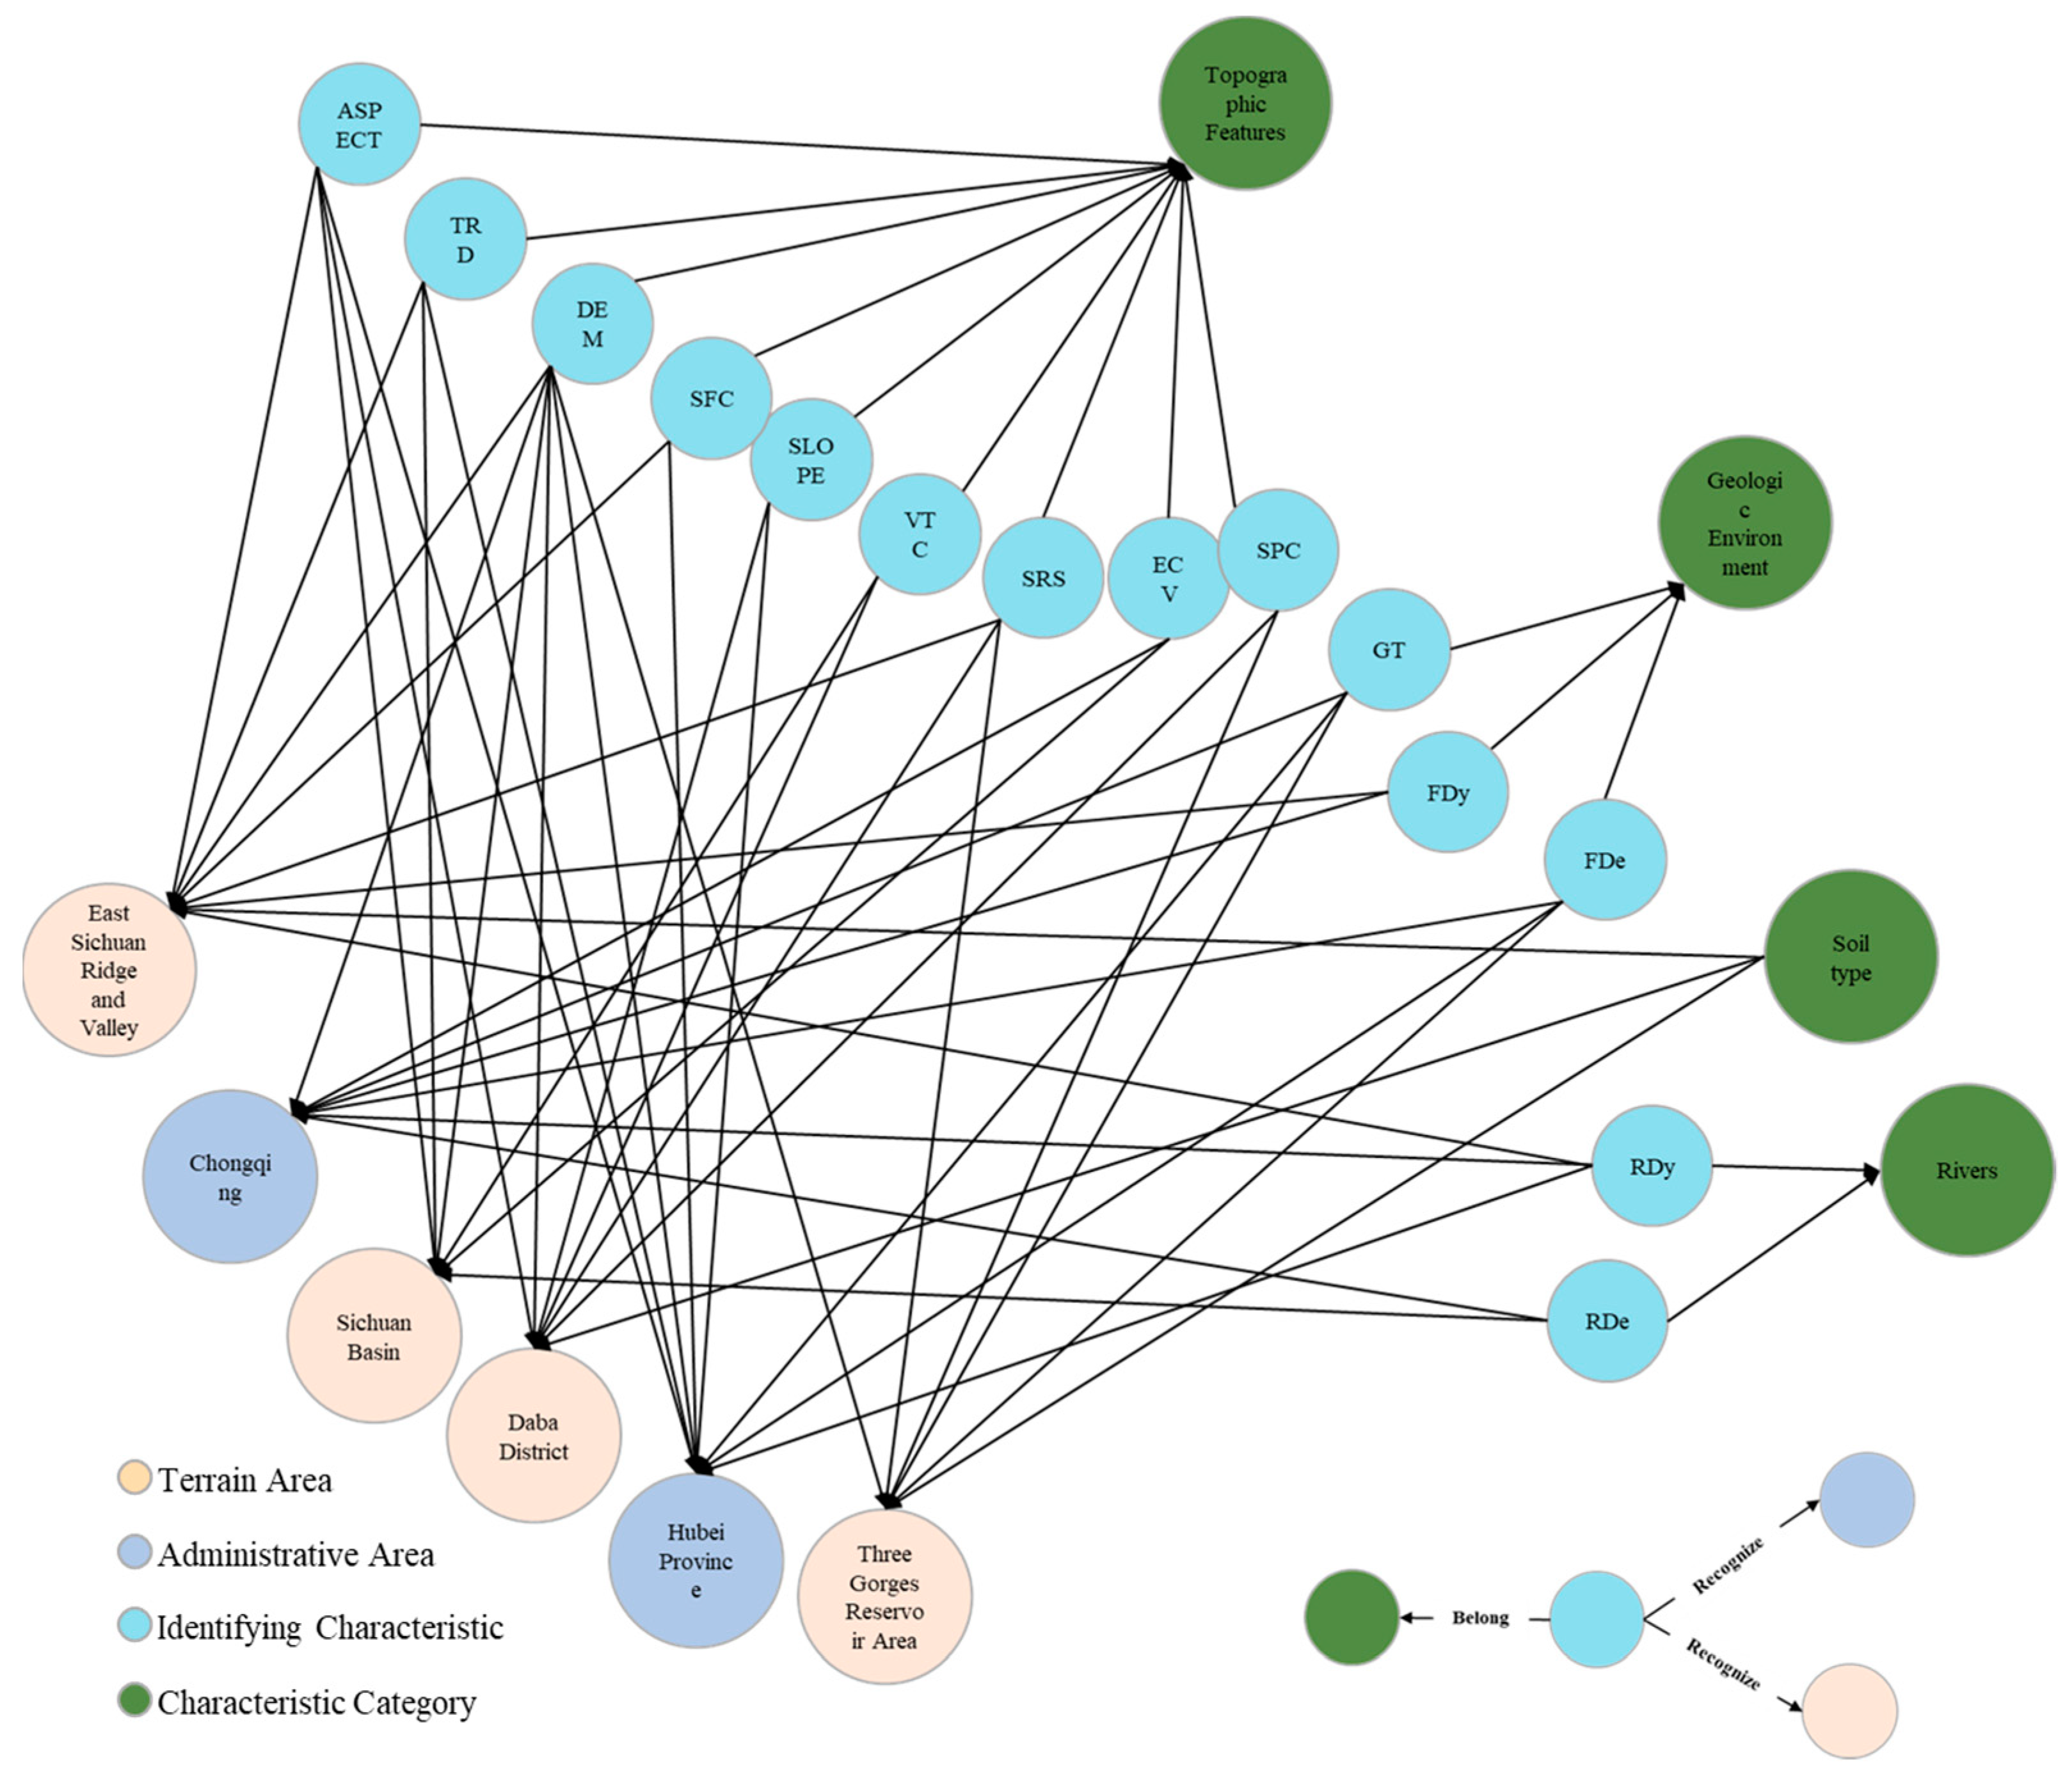
Due to the long time span and inconsistent time accuracy of the landslide data obtained in this paper, the time data for the meteorological, NDVI and other time data in-volved are not included in the characterization factor system of this research. According to the selected region’s feature factor indicators, integrated as a collection of alternative indicators as shown in Figure 11, by calculating the cosine similarity between the feature factors, the similarity is close to 1, which means higher semantic similarity; therefore, a threshold of 0.8 is set to exclude the feature factors with higher similarity, forming the collection of feature factors used to assess TGA, as shown in Table 5.
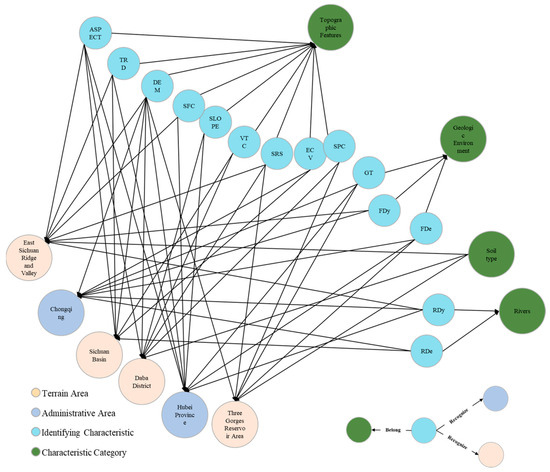
Figure 11.
Characterization factors for landslide susceptibility assessment in TGA based on the knowledge graph recommendation.
Table 5.
Characteristic factors for landslide susceptibility assessment in TGA.
4.2.2. Feature Factor Knowledge Discovery
The relevant part of landslide disaster examples in the knowledge graph is located, and the TF-IDF value of landslide disaster events in the Collapse > Mudslide > Unstable slope > Ground crack > Ground collapse is calculated. Therefore, this paper calculates the density and Euclidean distance of historical geologic disaster in ArcMap 10.8 to join the landslide disaster evaluation factors, and finally forms the landslide evaluation index of TGA. Among them, nine types of topographic features, three types of geological environment, two types of rivers, the density and Euclidean distance of Collapse, Mudslide, Unstable slope, Ground crack, and Ground collapse, were selected as the associated disaster, and a total of 25 evaluation indexes were used for subsequent calculations, as shown in Table 6.
Table 6.
Characterization factors in TGA.
4.3. Landslide Susceptibility Assessment
4.3.1. Feature Construction
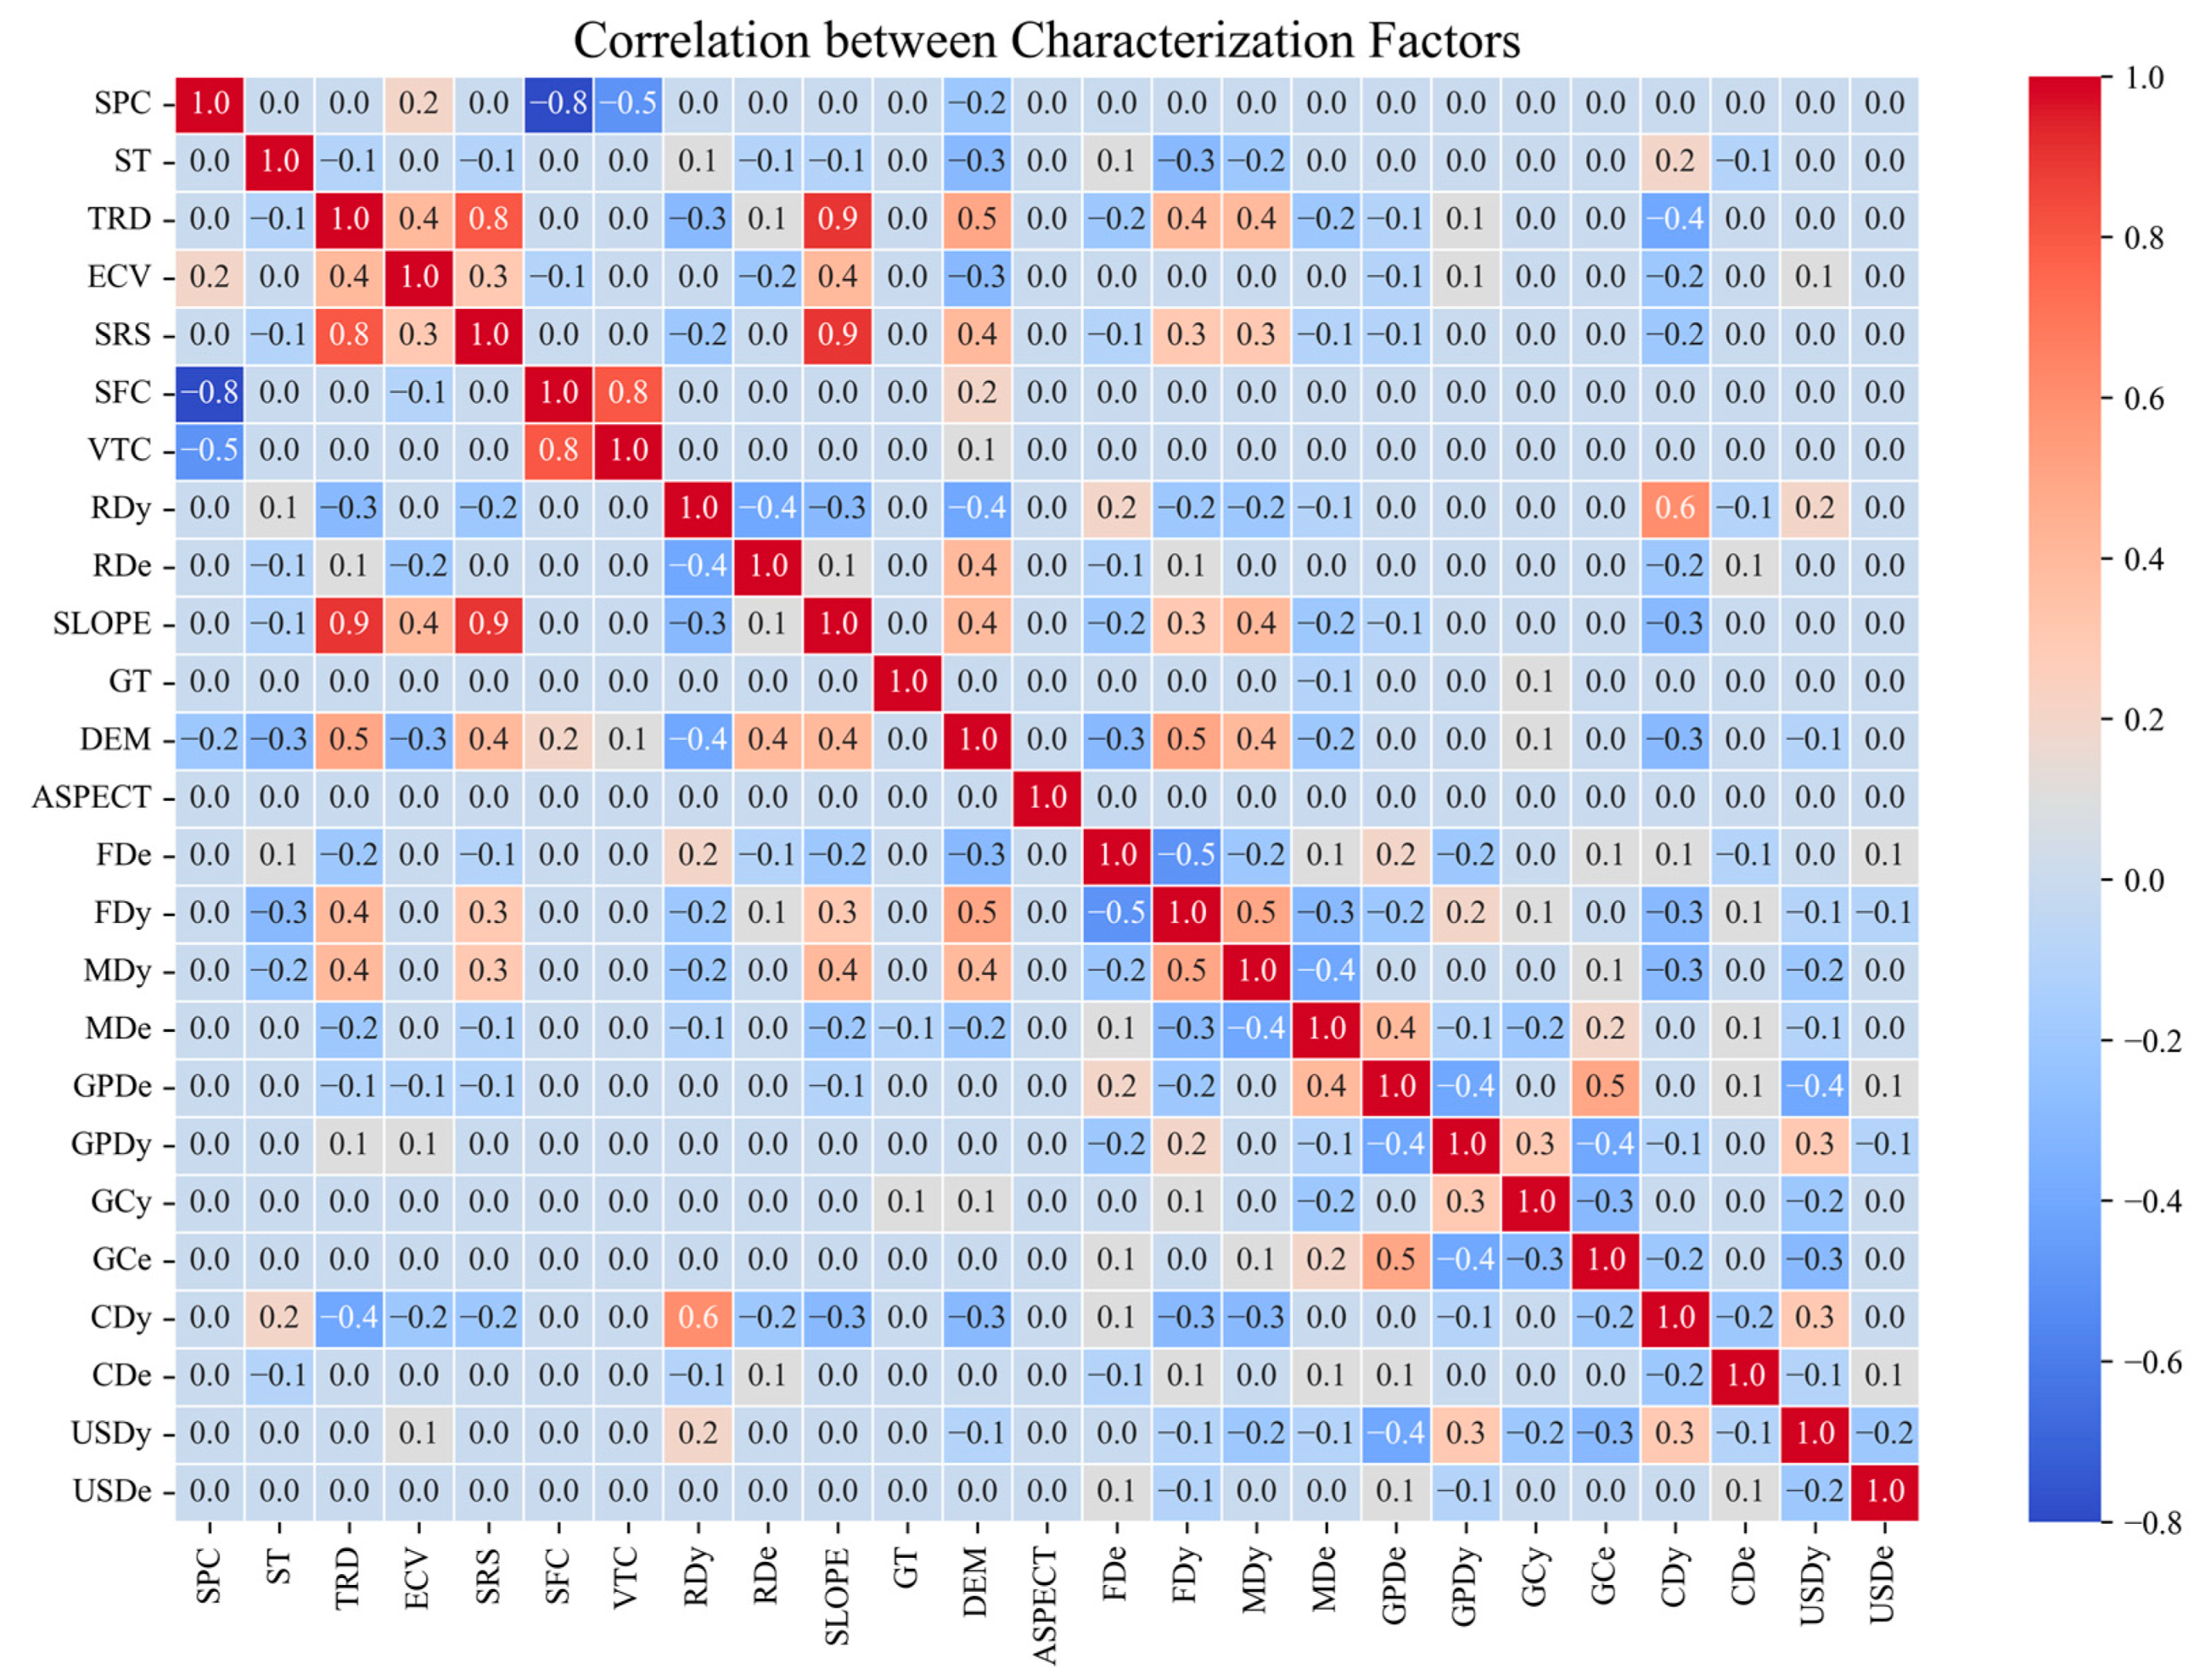
Correlation analysis of feature factors is needed before landslide susceptibility modeling to eliminate strongly correlated factors to reduce model redundancy and improve model prediction accuracy. In this research, the Pearson correlation coefficient is used to measure the correlation between the evaluation factors, and a Pearson coefficient greater than 0.7 may lead to the problem of multicollinearity. As shown in Figure 12, “surface curvature” and “vertical curvature”, “slope”, “surface relief degree”, “surface roughness” have strong correlation. Therefore, the vertical curvature, surface relief degree, and surface roughness were excluded from the evaluation factor system, and the remaining 16 evaluation factors were used for subsequent susceptibility modeling to reduce model redundancy. A total of 22 evaluation factors were finally formed, as shown in Table 7.
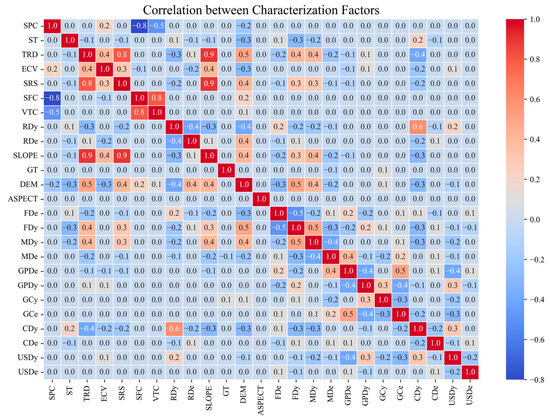
Figure 12.
Characterization factor correlation.
Table 7.
Characteristic factors for landslide susceptibility assessment in TGA.
4.3.2. Comparison of Results from Different Machine Learning Model Approaches
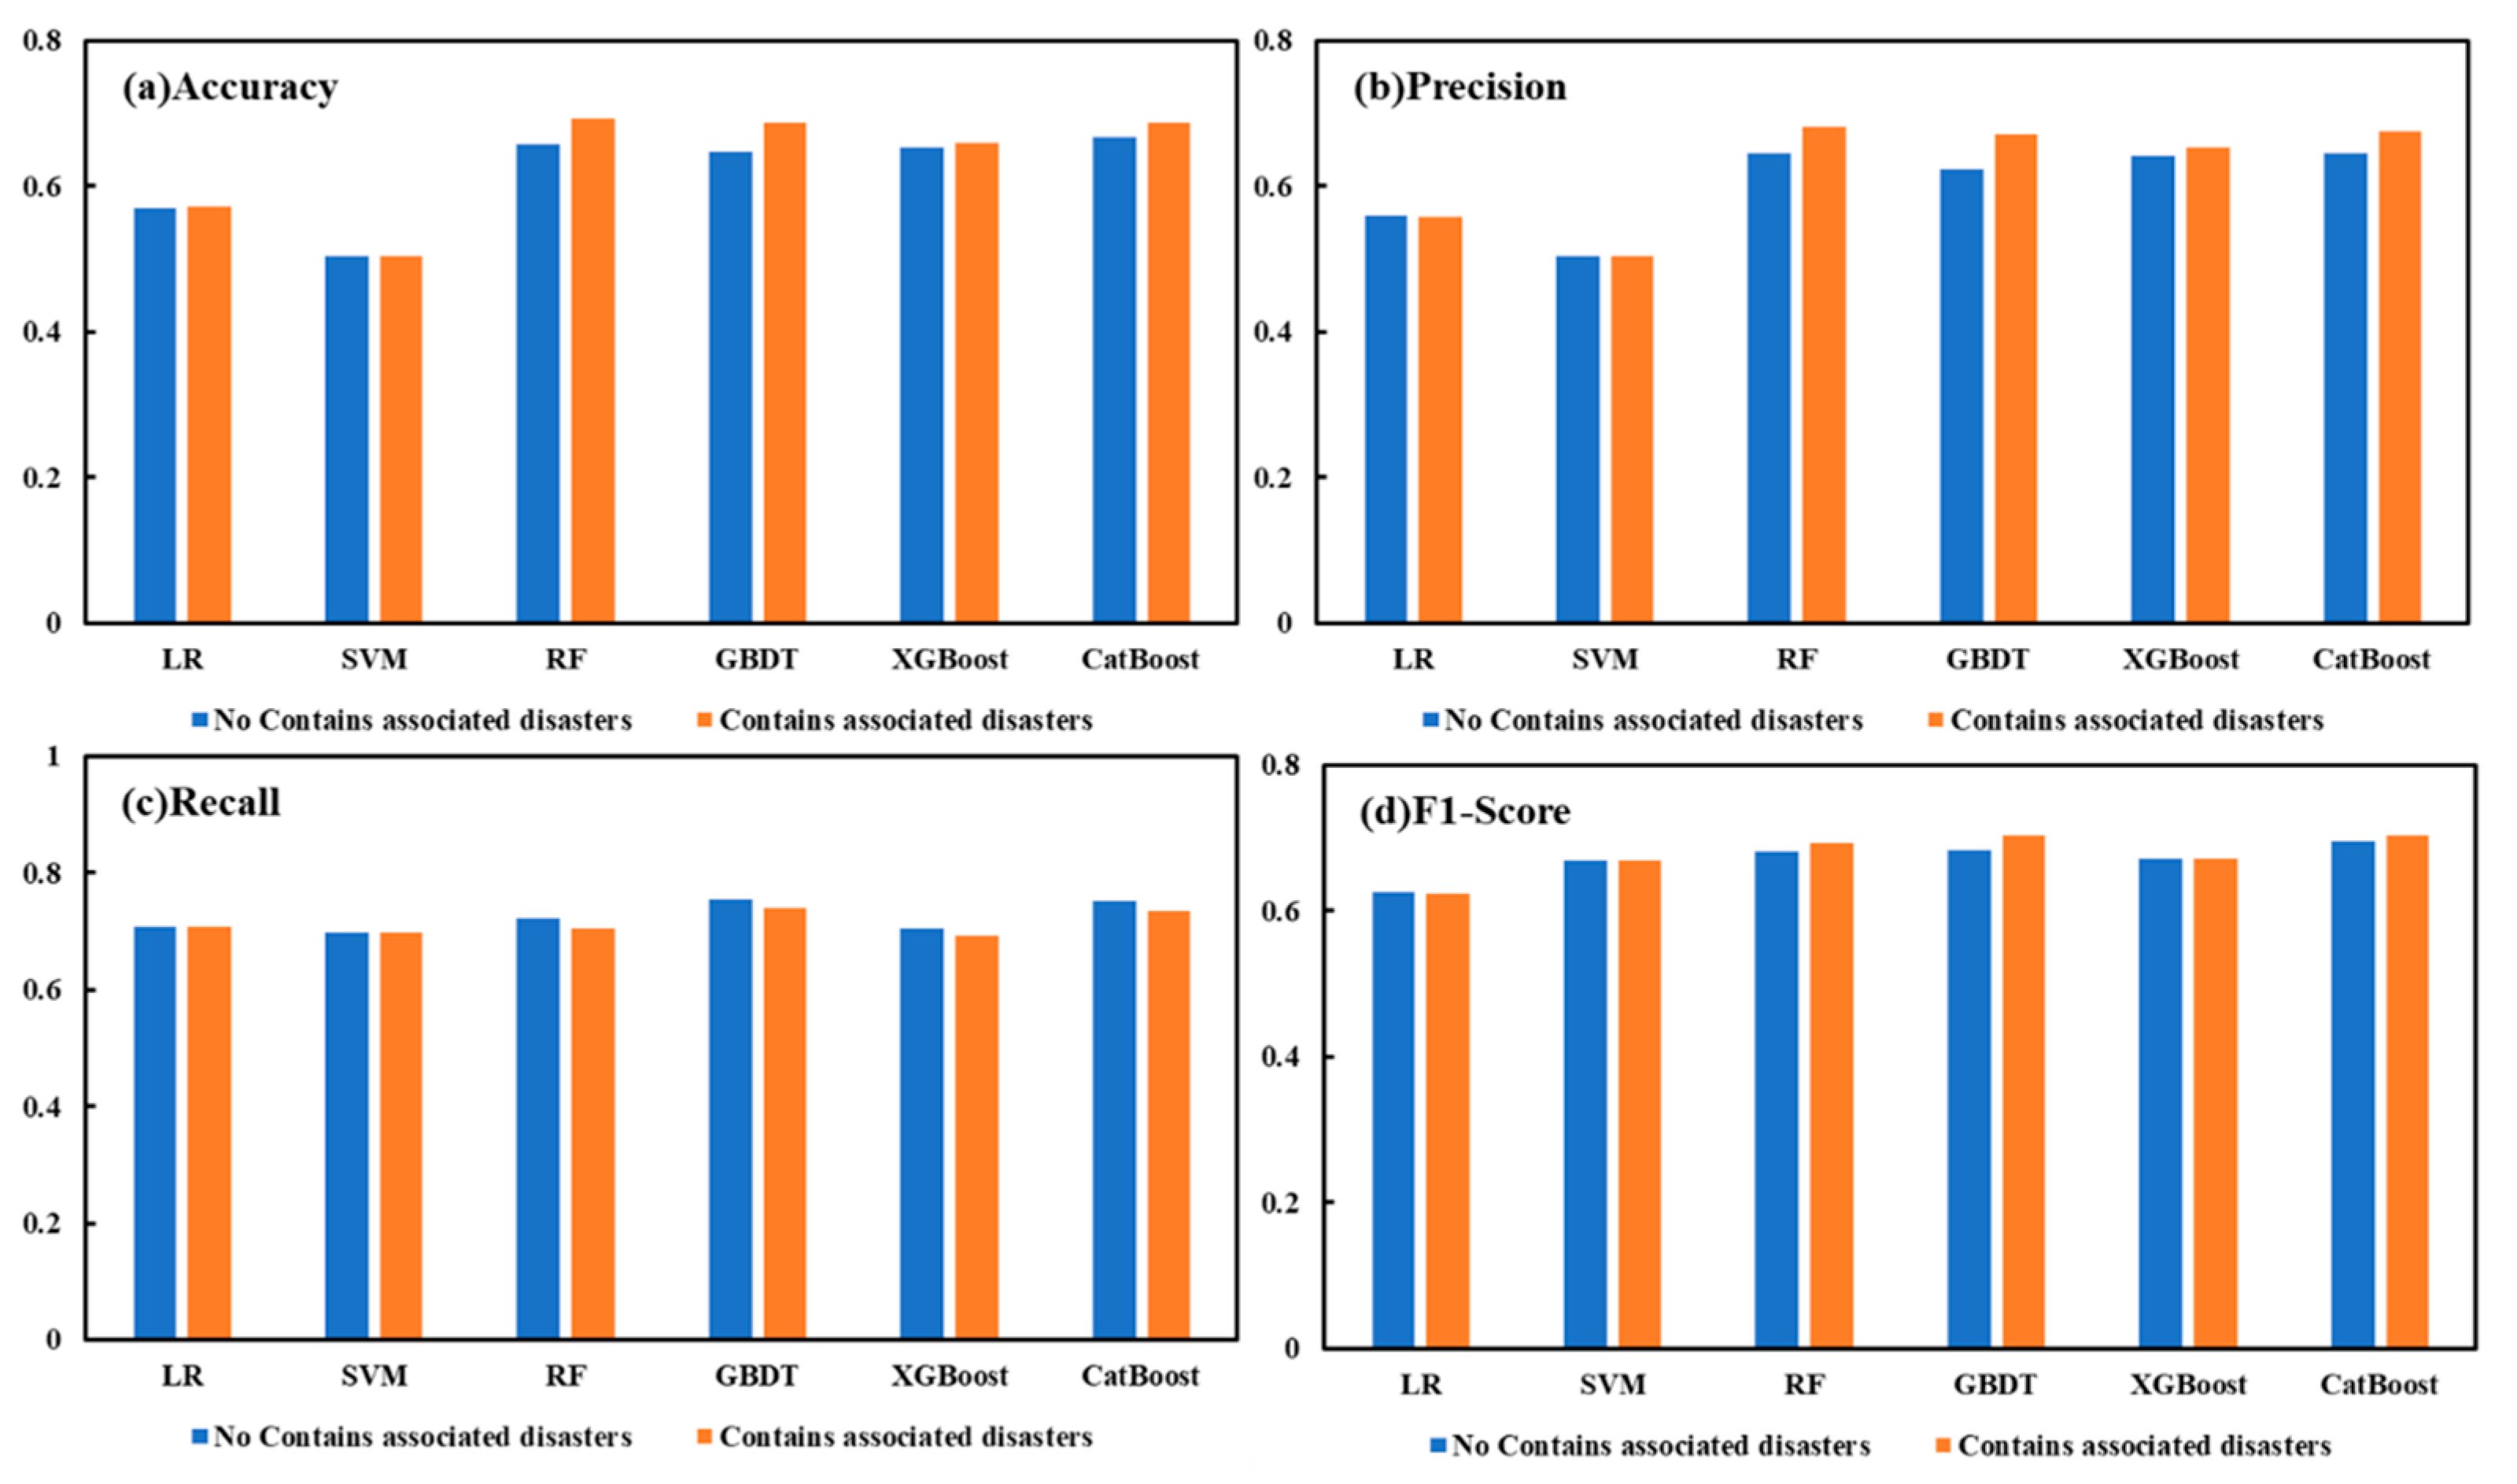
Figure 13 shows the accuracy, precision, recall, and F1-Score of the six ML models without parameterization. In analyzing the performance of the machine learning models with and without associated disaster data included, it can be seen that the inclusion of the associated disaster as a variable has a significant effect on model performance.
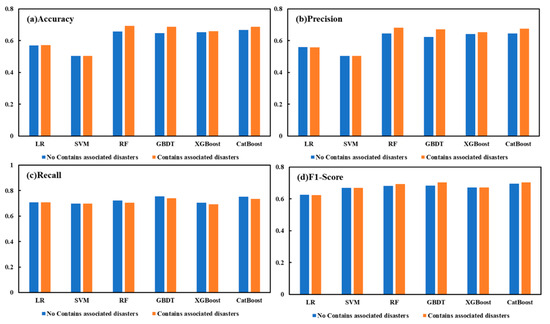
Figure 13.
Evaluation metrics for different types of machine learning algorithms with different combinations of features.
When the selected feature factor does not include the concomitant factors, LR and SVM perform poorly, with their accuracy below 60%, while the RF, GBDT, XGBoost, and CatBoost accuracies are all above 65%. When the factors related to the associated disaster are included, the accuracy of RF, GBDT, and CatBoost are all above 68% accuracy, which is an improvement of 3%, and the F1-score is above 0.7, with an average improvement of 0.1. Therefore, by evaluating the associated disaster before and after inclusion in the six machine learning models, we can demonstrate the validity of the three types of factor classifications screened in landslide disaster knowledge graph, as well as minine the large connection between the associated disaster and landslides. The most effective RF is selected, and the factors related to the associated disaster are included for landslide susceptibility assessment.
4.3.3. Landslide Susceptibility Assessment Based on RF
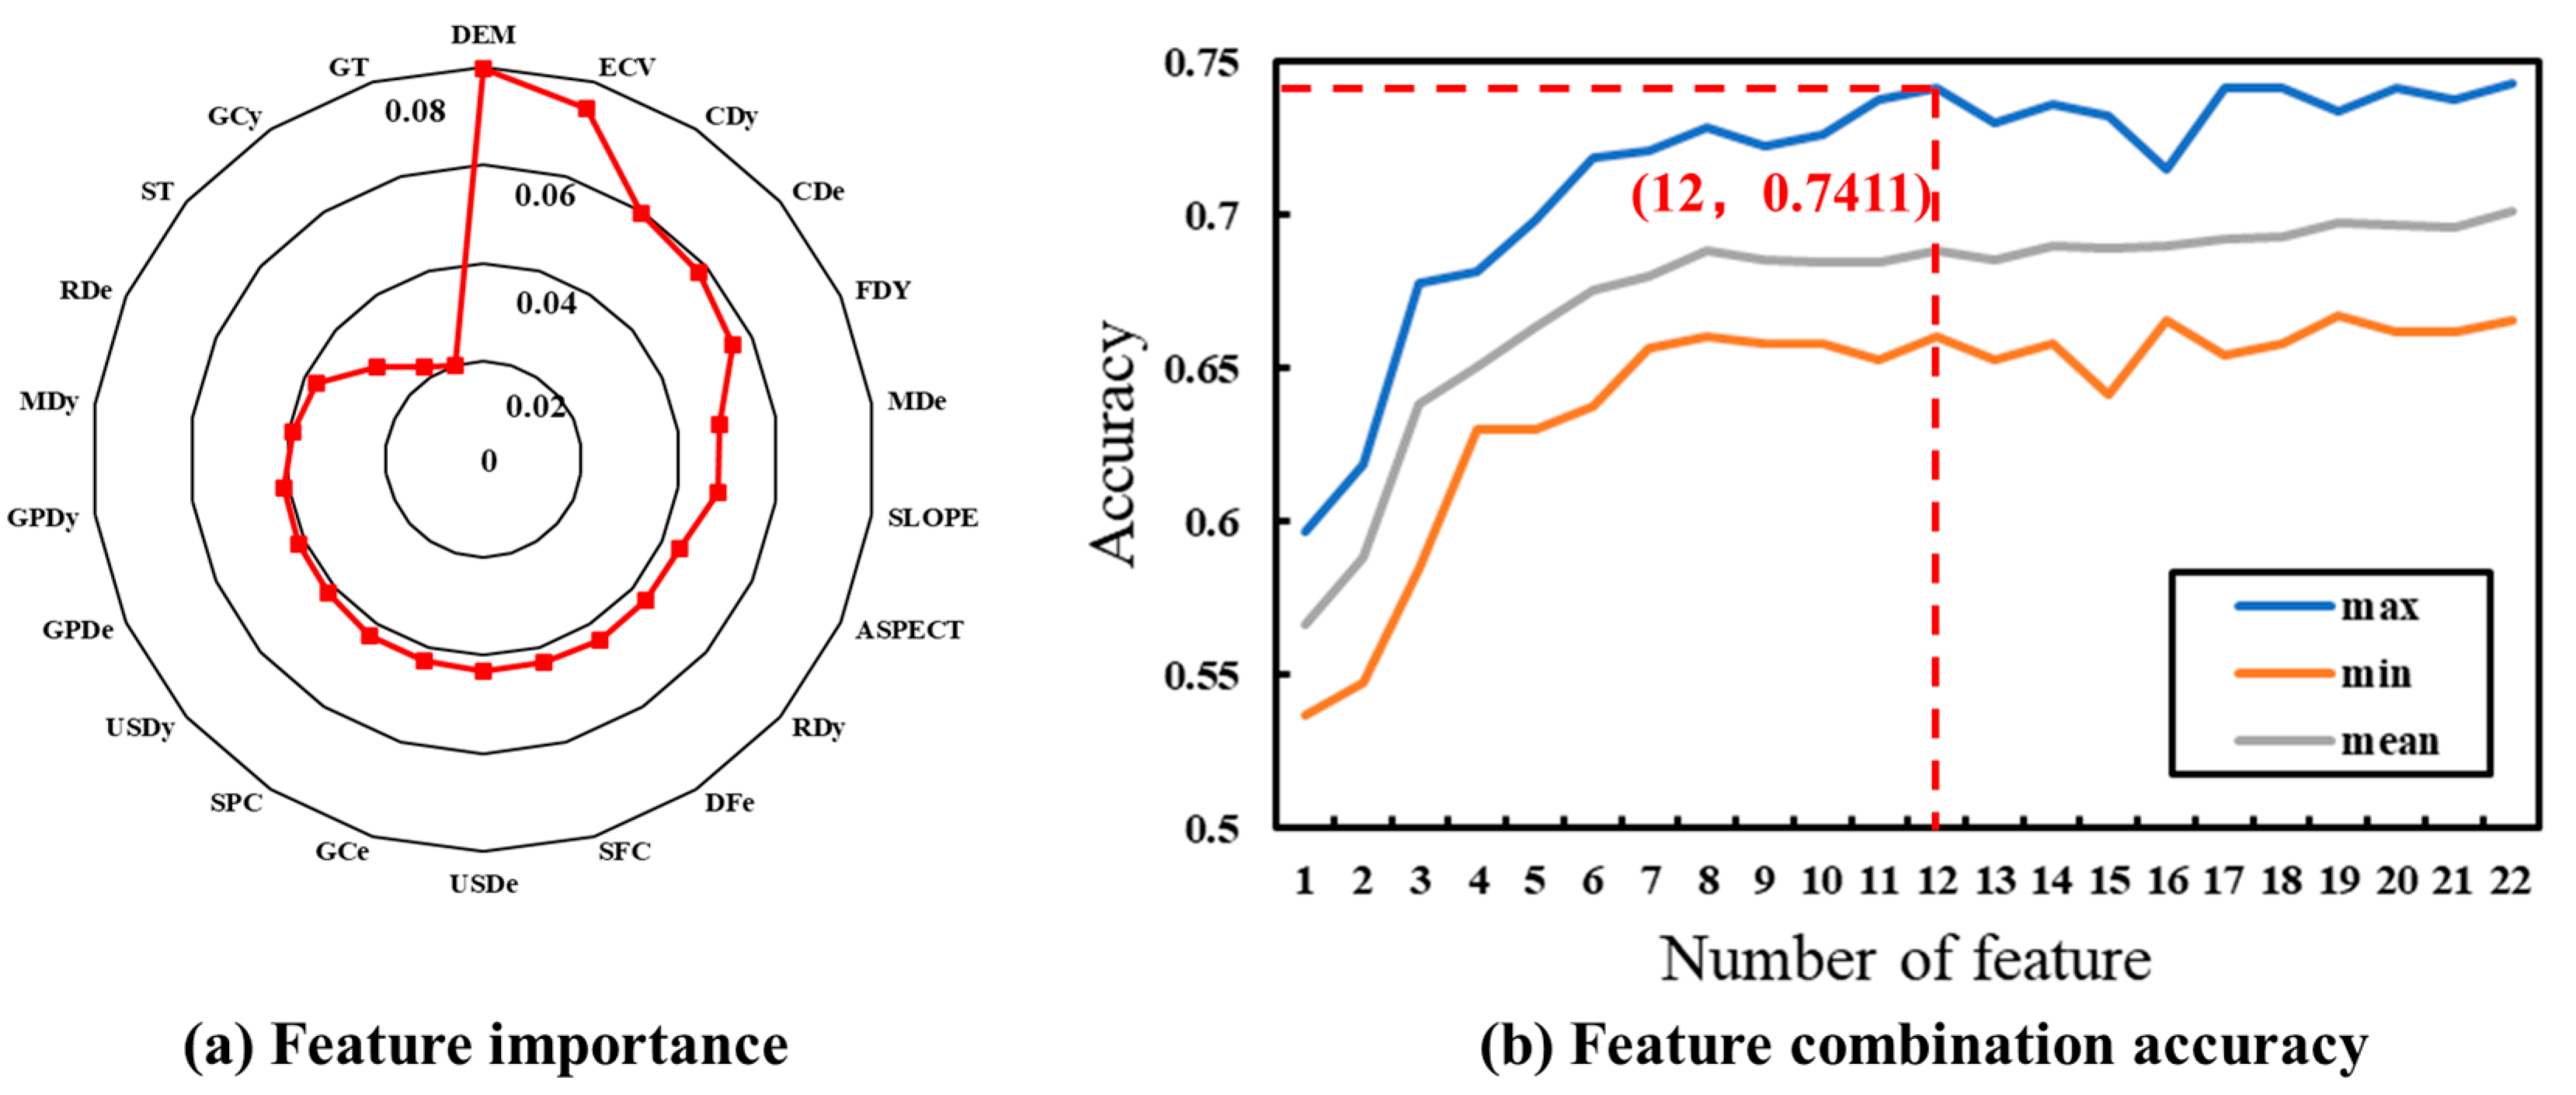
Combining 22 feature variables such as terrain features, geological environment, soil, river, and the associated disaster into the RF, the score of the magnitude of its contribution to the RF is calculated according to the function. The RF is randomized, so different feature importance scores are obtained from each calculation. In order to avoid errors caused by randomness, the feature importance calculations are performed for five iterations, ranked and selected by the average importance score of the feature variables. A clear difference in the feature importance scores of the different feature variables can be seen (Figure 14a). Elevation is the most important feature variable with an importance score of 0.079. ECV is the second most important feature with a score of 0.074, and the geologic body type has the lowest importance score of 0.02. It can be seen that among the topographic features, the order of the importance of each topographic variable is DEM > ECV > SLOPE > ASPECT > SFC > SPC, and among the geologic environmental factors, the order of importance of each variable is FDy > FDe > GT; in the river factor, the importance of RDy > RDe, and in the factor related to associated disaster, the order of importance of each variable is CDy > CDe > MDe > USDe > GCe > USDy > GPDe > GPDy > MDy > GCy.
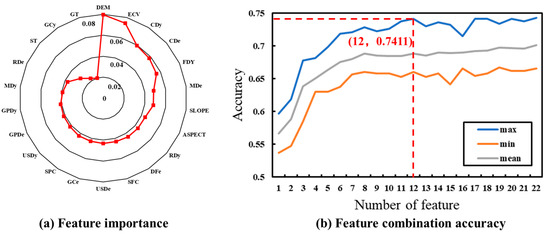
Figure 14.
Feature importance and feature combination accuracy.
Each feature variable is ranked according to the average score of feature importance, and 22 feature variables are added from largest to smallest in the random forest classification; the relationship between the number of features and classification accuracy is determined by calculating the overall classification accuracy. Figure 14b shows the relationship between the number of features and accuracy based on feature importance scores under random forest classification. The analysis shows that as the number of feature variables increases, there is a small fluctuation in the classification accuracy, and the overall change shows a tendency of first increasing and then fluctuating to stabilize. As the number of feature variables increases, the amount of categorization information develops from insufficient to gradually sufficient, and the categorization accuracy gradually improves. However, with the continuous addition of feature variables with lower feature importance scores, the phenomenon of information redundancy begins to appear, which affects the improvement of accuracy to a certain extent and leads to a downward trend in accuracy. When the number of features reaches 12, the classification accuracy reaches a maximum value of 74.11%. This indicates that the random forest classification method is insensitive to changes in the number of features, has high robustness, and is not prone to cause overfitting even when the number of features is large. When the number of feature variables is small, the random forest method can also achieve high classification accuracy. Therefore, the classification combination of “DEM, ECV, CDy, FDy, CDe, SLOPE, MDe, GCe, FDe, SPC, USDy, RDy” is the optimal feature combination.
After determining the most feature combinations, using the GridSearchCV method, it was determined that the classification was optimal when the classification accuracy was 87.20%, at which point the RF parameters are shown in Table 8.
Table 8.
RF optimization parameters.
The optimal feature combinations and optimal parameters were input into the RF classifier to assess the landslide susceptibility of TGA based on the sample data, as shown in Figure 15, which was divided into five categories according to the natural discontinuities, namely, lower susceptibility zone, low susceptibility zone, medium susceptibility zone, high susceptibility zone, and higher susceptibility zone. In terms of the number of each category, the area below the low susceptibility zone accounts for 43.50% of the total area of the region and is mainly distributed in the central region, while the risk area above the high susceptibility zone accounts for 37.15% and is mainly distributed in the western and eastern fringe areas of TGA.
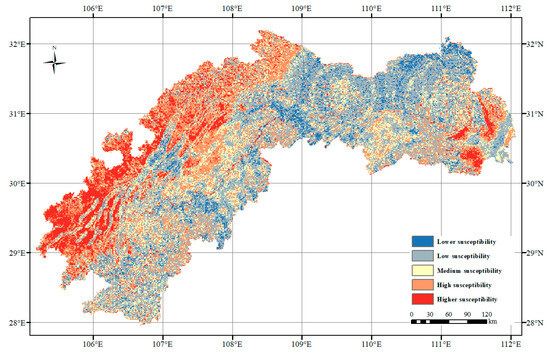
Figure 15.
Spatial distribution of landslide susceptibility in TGA.
4.3.4. Influence of Characterization Factors on Landslide Susceptibility
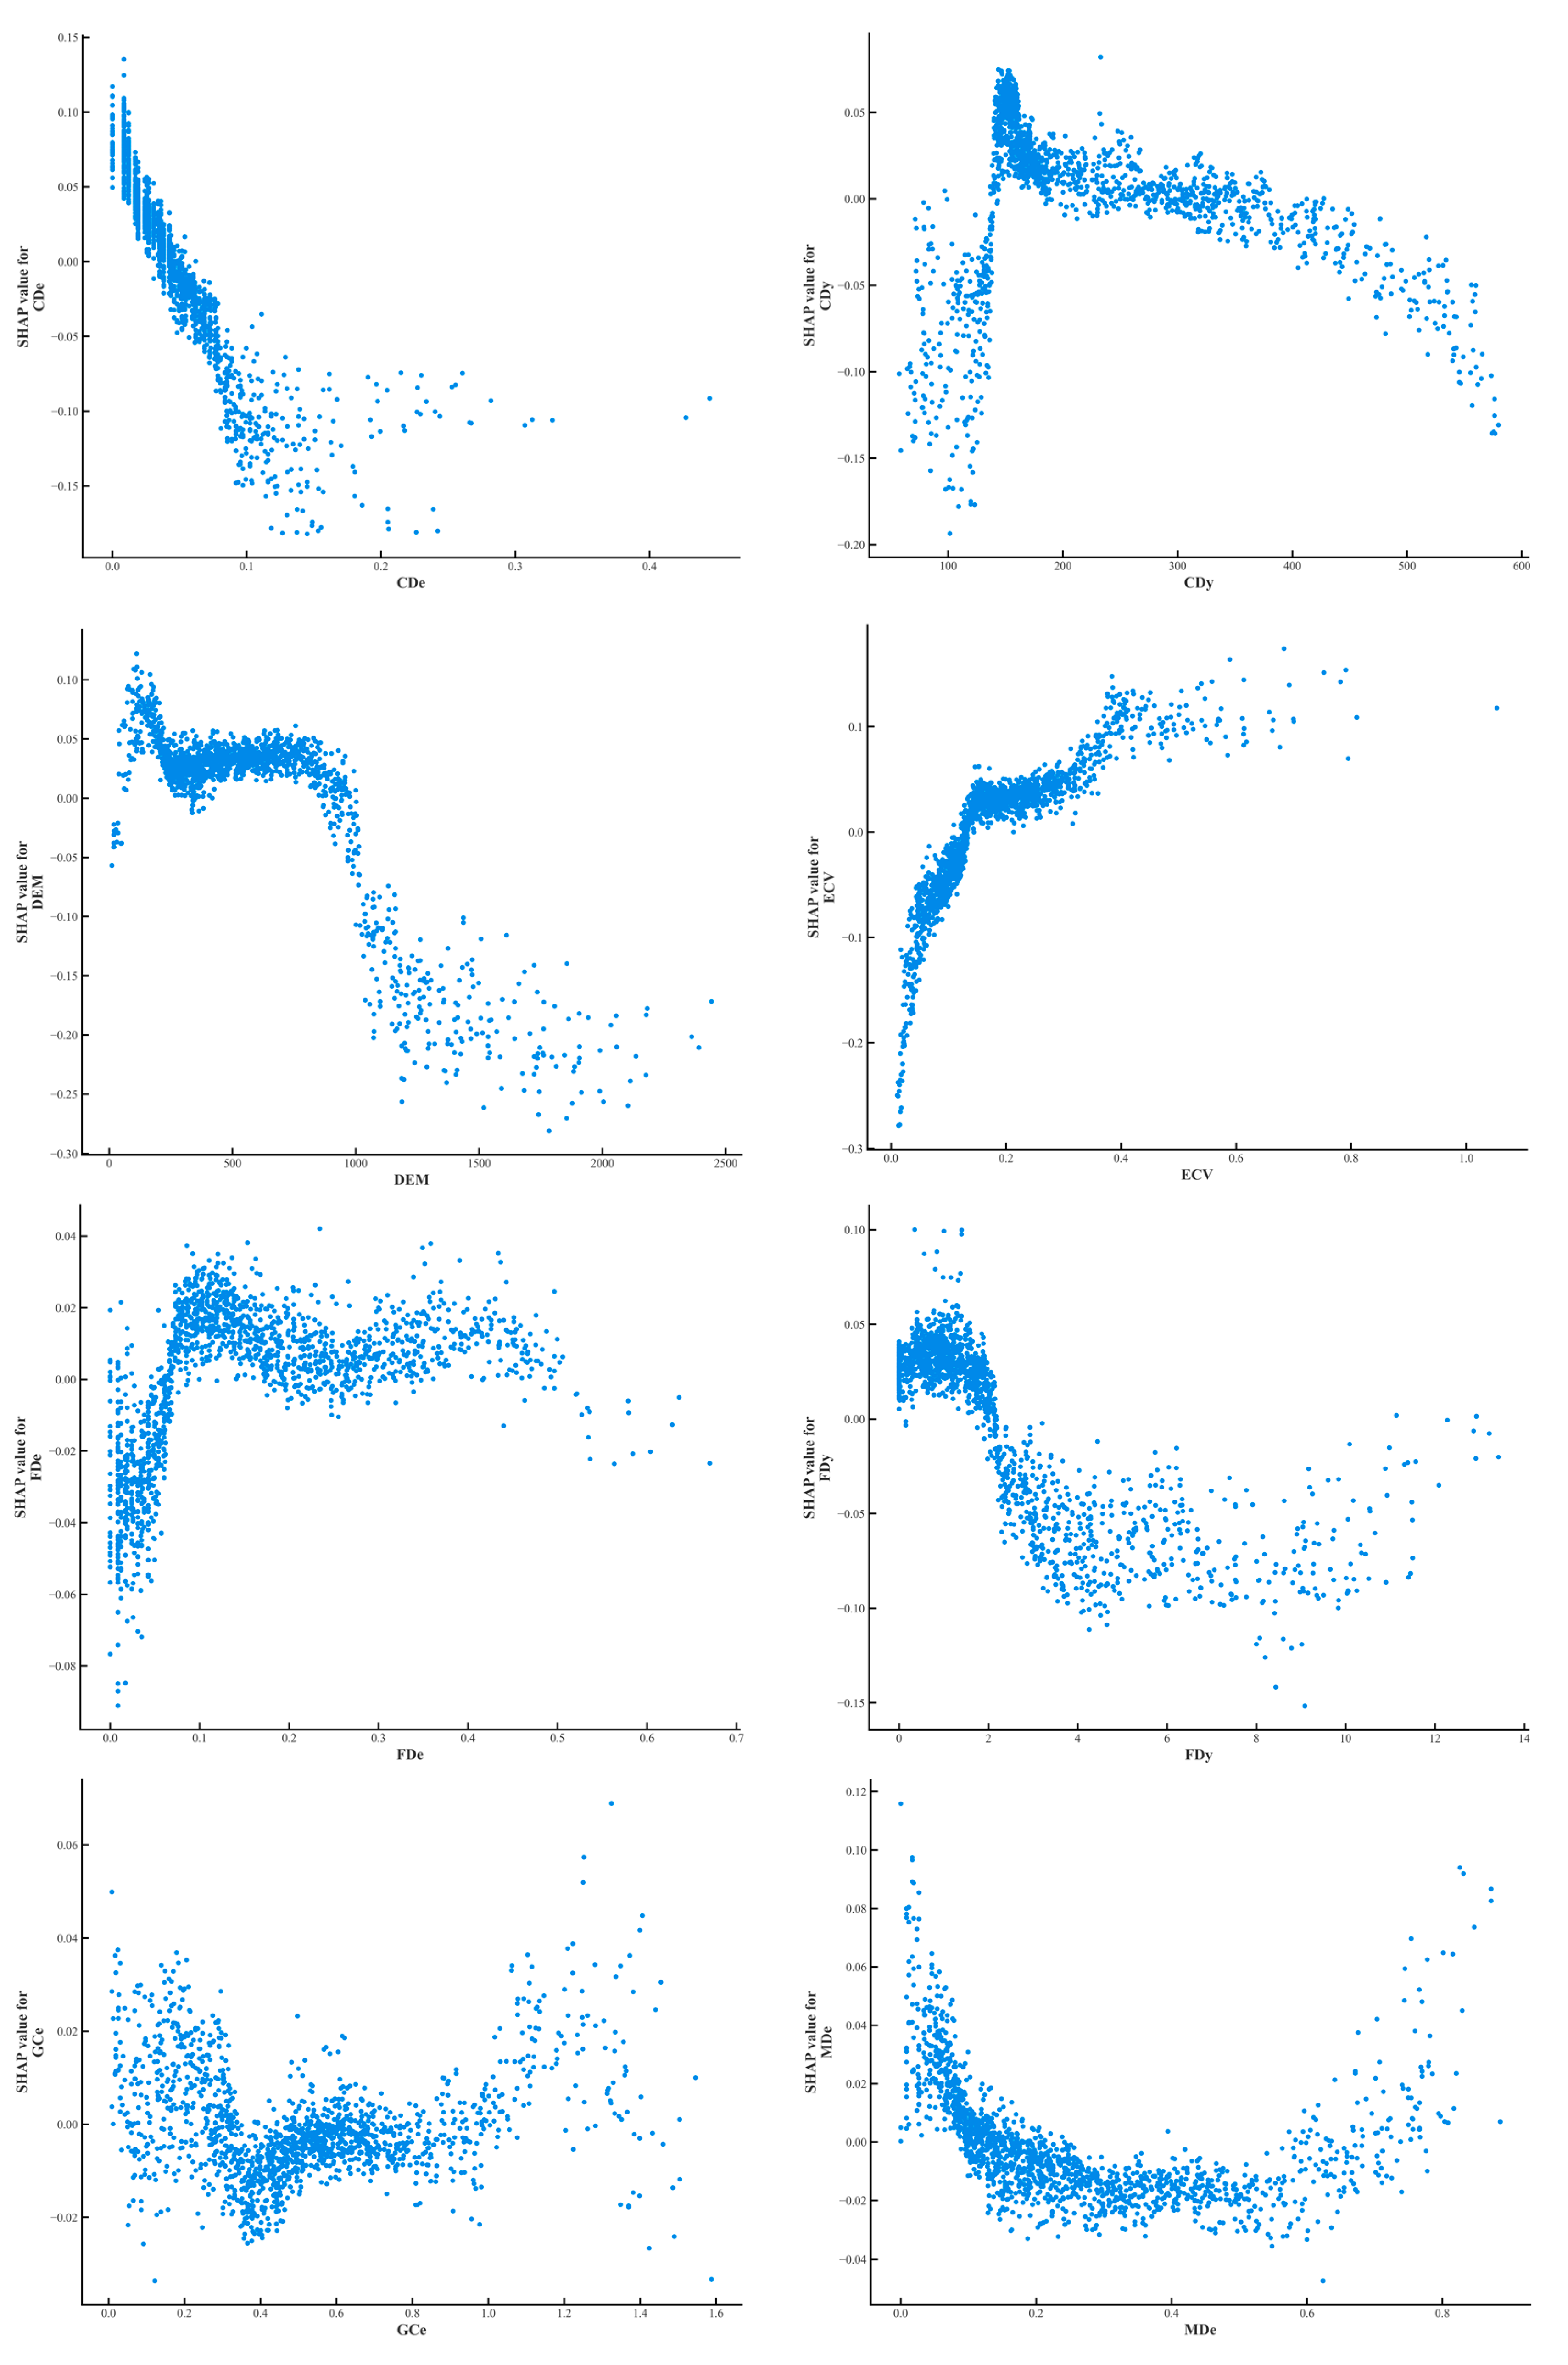
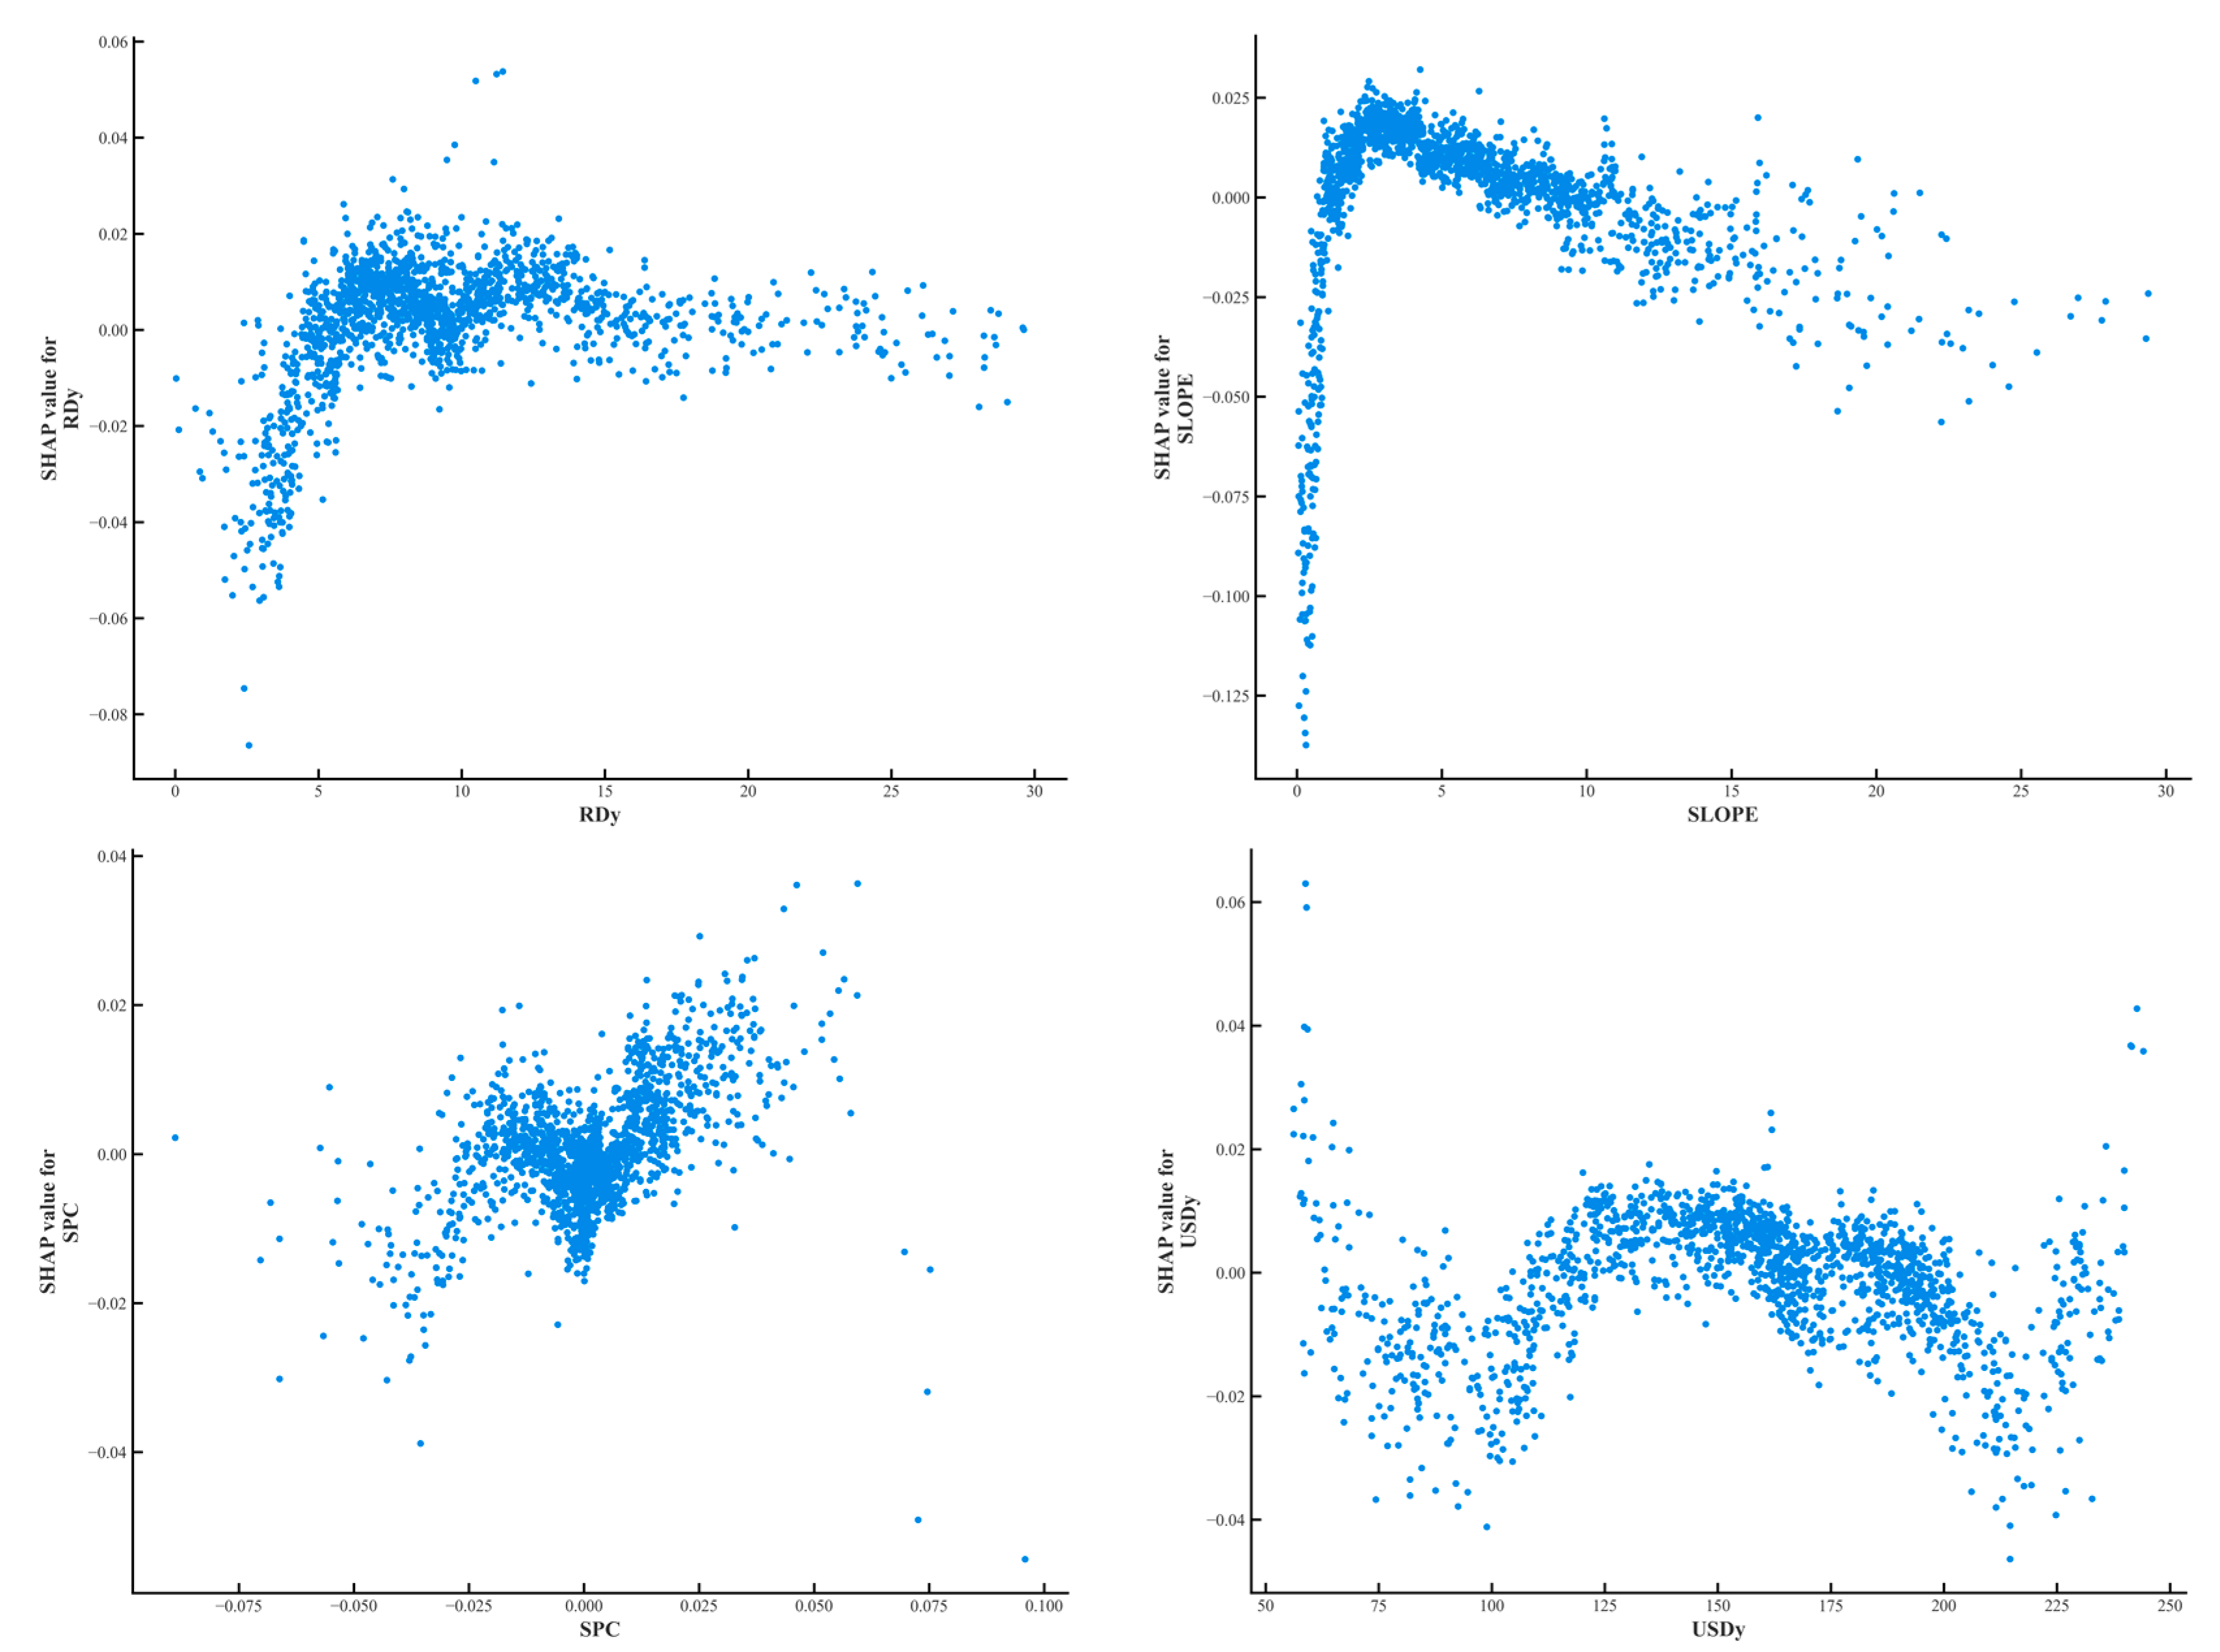
The influence of each factor on the susceptibility to landslide disasters can be further explained through the individual factor dependency graphs. As shown in Figure 16, the x-axis of the graph indicates the factor specific values, and the y-axis indicates the influence factor SHAP values. According to the single factor dependency plot, it can be seen that the probability of landslide susceptibility decreases as the Mudslide distance (MDe) and the Collapse distance (CDe) increase, which further proves that the further away from the source areas of mudslides and collapses, the better the ground stability of the area. Staying away from these high-risk areas can significantly reduce landslide events caused by sudden ground loosening or water scouring. The SHAP values of DEM, SLOPE, Fault Density (FDy), and Collapse density (CDy) first increase and then decrease as they are worth to increase, and the probability of landslide occurrence decreases after elevation (DEM) > 250 m, SLOPE > 5°, Fault Density (FDy) > 2, and Collapse density (CDy) > 180. Higher topographic elevation usually implies that the geologic structure is more solid and rock hardness is higher, which makes landslides less likely in these areas, and while high fault densities may, at first glance, seem to be associated with a high risk of landslides, in practice, these areas tend to receive more attention in terms of geologic investigations and stabilization measures, which reduces the likelihood of landslides. Geologic activity in faulted areas may have been appropriately managed, reducing the risk of untreated geology. In addition, high topography may also mean less erosion and better channelization of water flow, further reducing the risk of landslides. Fault Distance (FDe), Slope Curvature (SPC), Unstable slope density (USDy), and Ground crack distance (GCe) show fluctuating changes with increasing values. The Elevation Coefficient of Variation (ECV) and River Density (RDy) show a sharp increase in the probability of landslide occurrence with increasing values. This may be caused by the increase in ECV and RDy, which leads to an increase in terrain instability. The increase in ECV implies greater topographic relief, which may lead to unpredictable water flow behavior and increased risk of soil erosion and ground loosening. An increase in the density of the river network, on the other hand, implies that more water flow may erode the foundations, especially under high rainfall conditions, increasing the probability of landslides.
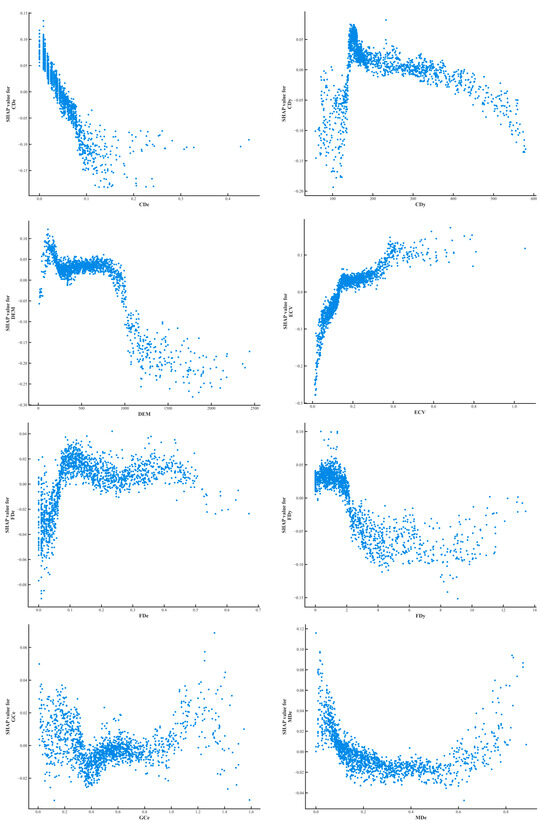

Figure 16.
Characteristic factor dependency graph.
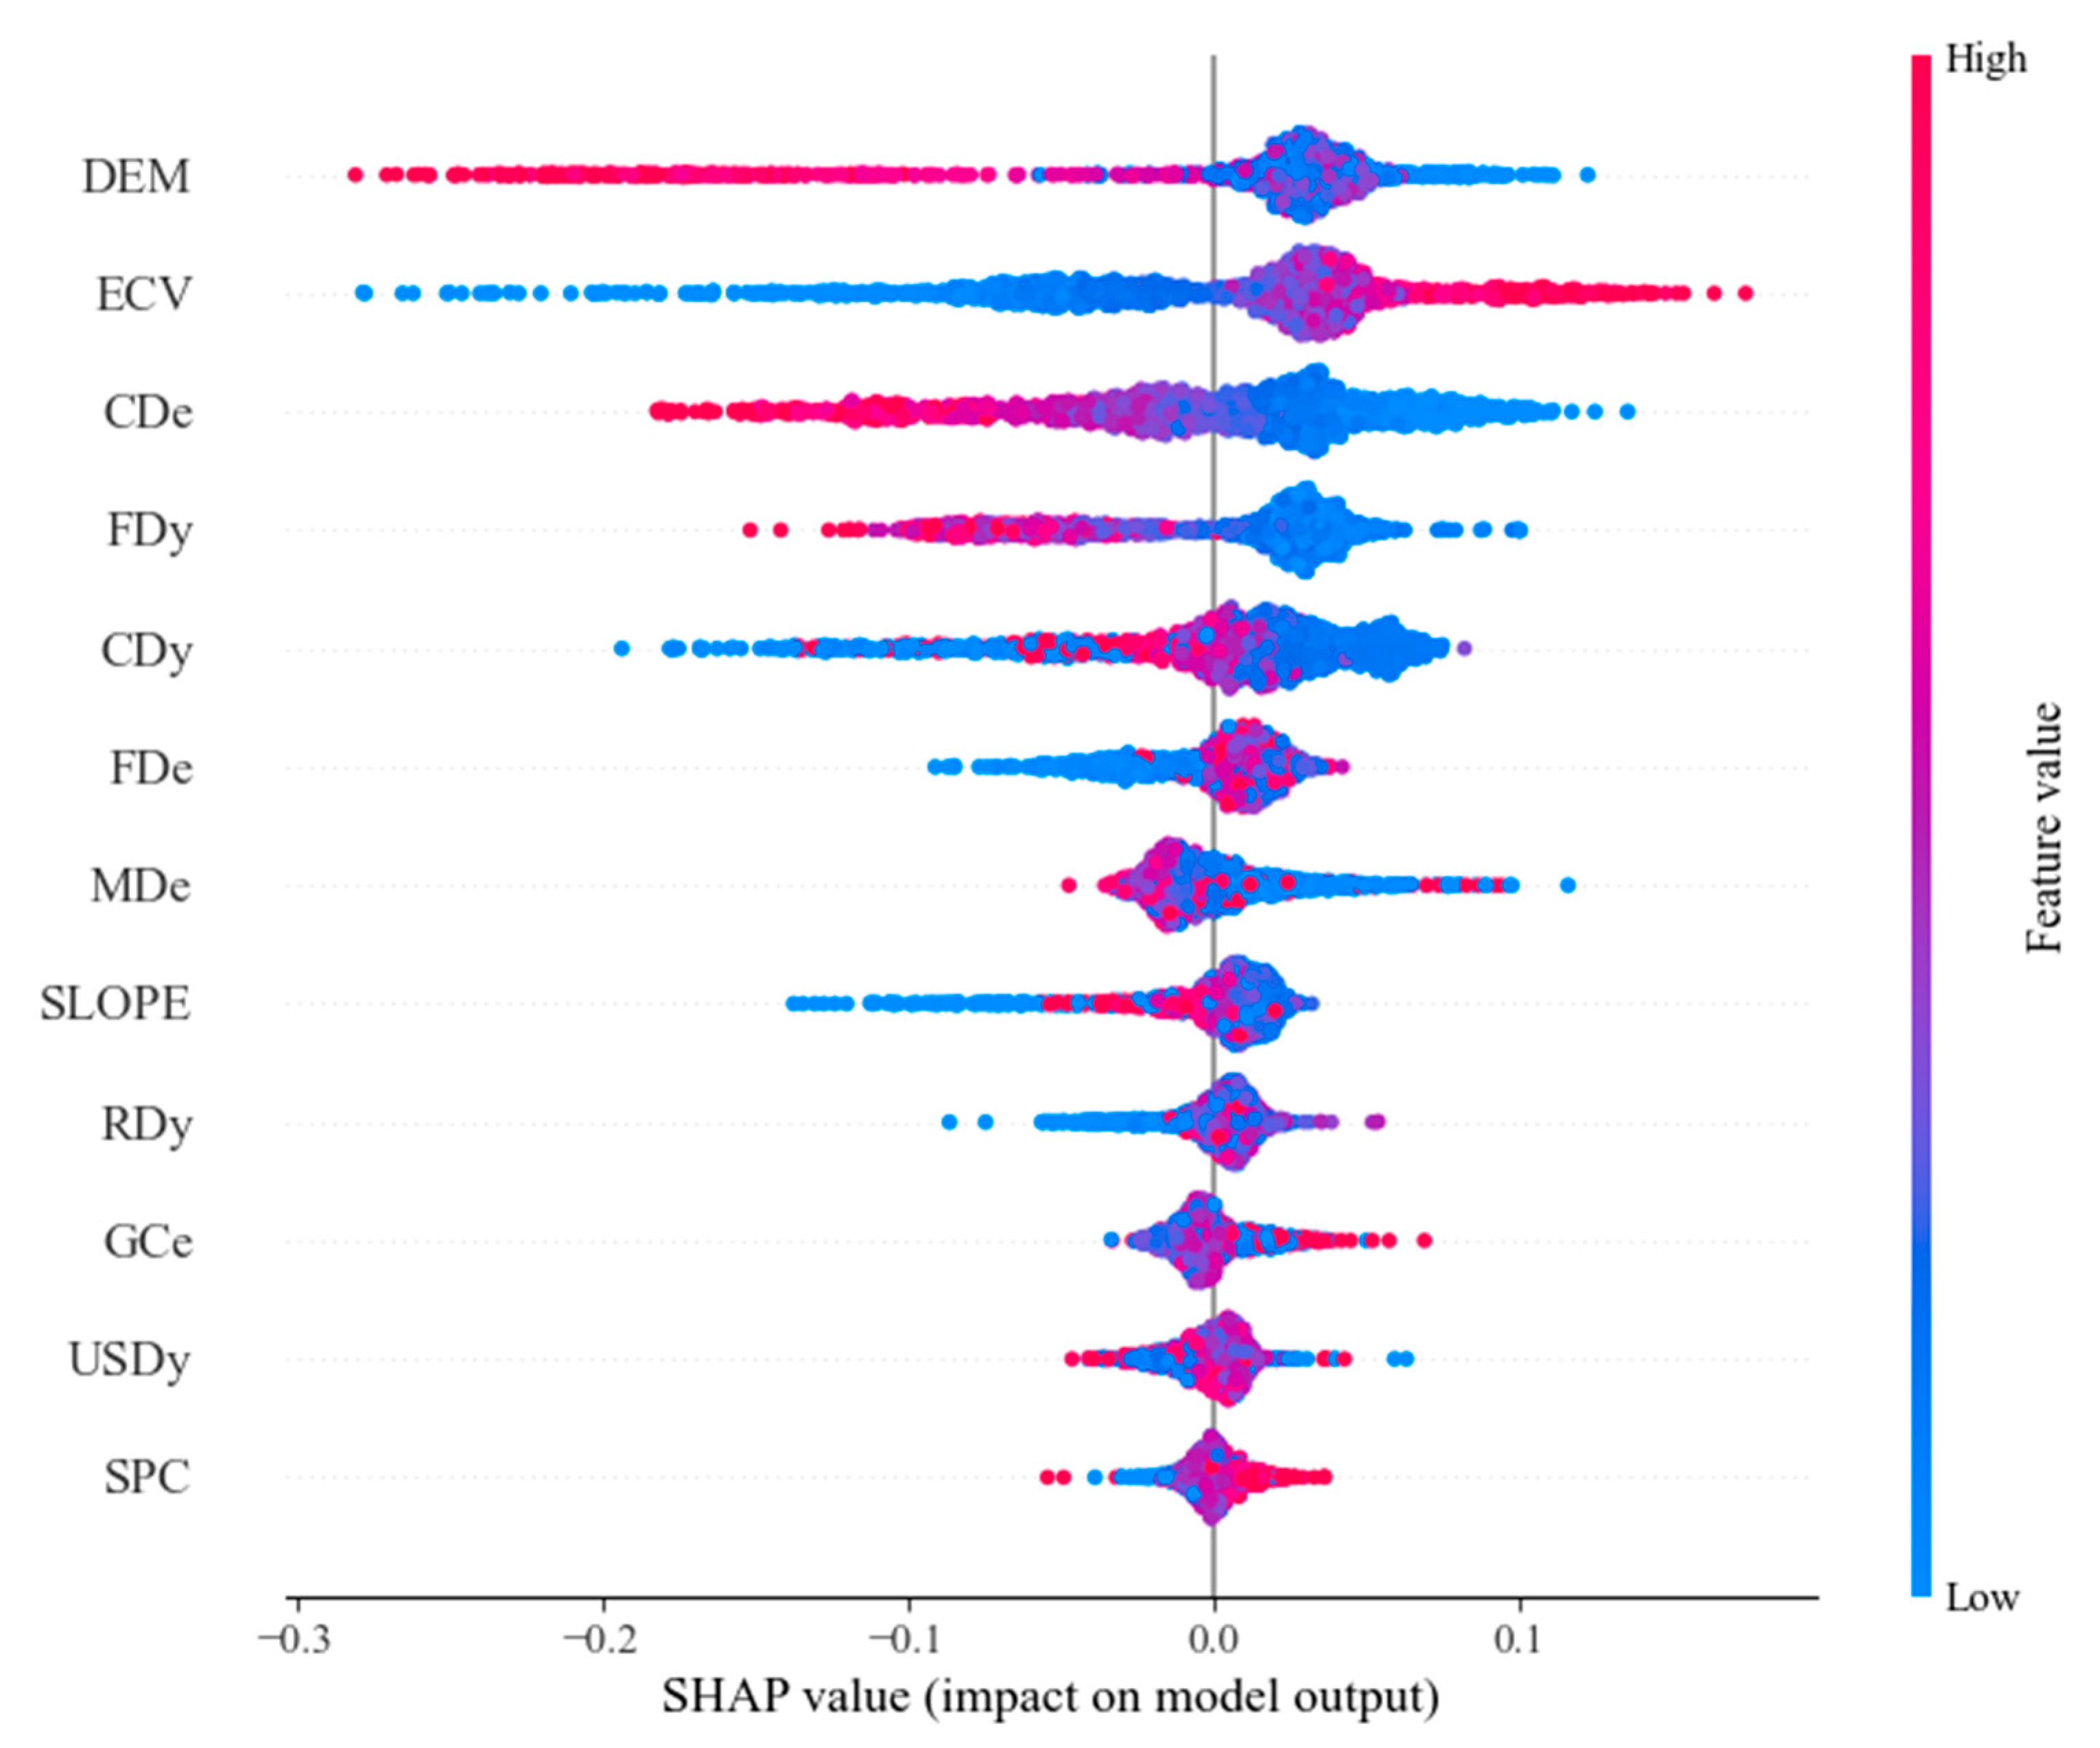
As shown in Figure 17, the elevation (DEM) SHAP values are widely distributed and the color transition is uniform, indicating that different elevations have a significant effect on the prediction results. Secondly, Elevation Coefficients of Variation (ECV) are mainly distributed in the middle region, indicating that the Elevation Coefficient of Variation has less influence on the model prediction results. The SHAP values of Fault Density (FDy), Fault Distance (FDe), Collapse distance (CDe), Collapse density (CDy), and Mudslide distance (MDe) are widely distributed, and the color distribution is uniform, indicating that the associated disaster indicators have significant and obvious positive and negative effects on model prediction accuracy. The SHAP values of SLOPE are more uniformly distributed, which indicates that slope has a moderate effect on the prediction results, and color distribution is relatively uniform, which indicates that the changes in slope values between high and low levels have relatively balanced effects on the results. The distribution of such SHAP values for River Density (RDy), Ground crack distance (GCe), and Unstable slope density (USDy) is concentrated near 0 and the colors are more concentrated, indicating that these features have less influence on model prediction. The distribution of Slope Curvature (SPC) SHAP values is more concentrated, and the colors are varied, indicating that this feature has some influence on the prediction results, but the range of influence is narrow.

Figure 17.
SHAP Global Swarm Map for Random Forest Models. Color of points indicates the magnitude of the feature value; the color varies from blue (low value) to red (high value). Distribution of dots for each feature along the x-axis shows how much the feature positively or negatively influences the model’s predictions.
In general, the elevation (DEM), Collapse distance (CDe), Fault Density (FDy), Collapse density (CDy), Fault Distance (FDe), and Mudslide distance (MDe) have a greater influence on the prediction of landslide susceptibility. River Density (RDy), Ground crack distance (GCe), Unstable slope density (USDy), and the elevation coefficients of variation (ECV) have a smaller influence on the prediction of landslide susceptibility.
5. Discussion
With the increase in landslide-related research, it is an important task to integrate a priori knowledge in the landslide domain and mine implicit correlations to support high-precision and high-efficiency landslide disaster susceptibility assessment. Although many studies have been conducted on landslide susceptibility modeling under multi-model and multi-feature, for the selection of feature indicators, due to the varying time of the occurrence of disasters in landslide inventories, which leads to the problem of temporal matching of, e.g., NDVI and meteorological rainfall is not fully considered, it is necessary to design suitable feature factor recommendation models to achieve equivalent or efficient assessment effects. In addition, much landslide-related information contained in landslide disaster reports and landslide event encyclopedias has not been effectively utilized, such as the concomitant disaster density and Euclidean distance factor found in this paper through the landslide knowledge graph, and the integration of the existing methodology and technology to mine the implicit relationships in the unstructured data, which is of scientific significance to improve the accuracy of the assessment.
In order to verify the effectiveness of the spatial correlation and attribute similarity in this paper, the study area selected in this paper is not the Three Gorges Reservoir Area in the traditional sense, but the adjacent area is added on the basis of the Three Gorges Reservoir Area. Compared to existing research on the traditional Three Gorges Reservoir area., Fang et al. (2021) [60], Song et al. (2024) [61], and Yu et al. (2024) [62] utilized historical landslide data by selecting 20, 12, and 15 feature factors such as NDVI, climate and meteorology, road data, and land cover under the current timestamp, respectively, to compare different machine learning models trained on landslide susceptibility in TGA, while the average accuracies of randomized forest assessment in the research were 80%, 84.05%, and 79.6%. Through the knowledge graph of landslide susceptibility assessment constructed in this paper, combined with the feature factor recommendation model, a total of 12 types of evaluation indexes are selected from five categories of Topographic Features, Geologic Environment, Soil Type, Rivers and Associated Disaster, and combined with the random forest model with hyperparameter optimization, the susceptibility assessment of TGA is carried out, and the optimal accuracy reaches 87.20%, which proves the superiority of the selection of feature indexes based on the knowledge graph established in this paper.
In this paper, non-landslide sample points are currently selected only in accordance with existing studies and the first law of geography; future research needs to consider more constraints to improve the production of non-landslide data in order to improve prediction accuracy. In addition, this study only utilizes single-modal unstructured text for knowledge mining. Future work should extract and mine multimodal landslide information, for example, through optical remote sensing imagery combined with deep learning to comprehensively recognize the surface geological environment [63,64,65], or use image segmentation technology for the segmentation and data mining of planar raster map data to expand the knowledge map in the field of landslides, improve spatial correlation and attribute similarity, and mine more implicit relationships so as to provide a more complete system of feature factors for landslide recognition [66,67]. The aim is to provide a more complete feature factor system for landslide identification.
6. Conclusions
Landslide, as a major geological disaster, is of great significance to timely and accurately delineate landslide-prone areas for disaster defense and policy formulation. This research aims to construct a feature factor selection model under a priori knowledge, combined with a knowledge discovery algorithm to mine the highly correlated but underutilized factors in historical landslide disasters and construct a feature factor recommendation model. With the selected TGA as a study case, we evaluated six machine learning algorithms, and selected the better-performing random forest model for hyper-parameter optimization, constructing an interpretable landslide susceptibility assessment model.
In this study, the UIE model is used and fine-tuned with a small amount of labeled data to construct mapping relationships to realize the knowledge graph of landslide disaster for text data. The obtained knowledge graph contains 2167 entities and 2352 relationships. Based on the similarity calculation and knowledge discovery of the knowledge graph, this paper constructs a feature combination containing relevant disaster factors. With six ML models, it is effectively proved that the inclusion of landslide disaster associated factors contributes to the optimization of classification results. The RF accuracy after combining the optimal feature combination and hyper-parameter optimization reaches 87.20%, indicating that the model constructed in this paper has high credibility. The spatial distribution of susceptibility shows that the high-risk areas of TGA are located in the western and eastern edge areas. Quantitative analysis of the relationship between the characteristic factors and the probability of landslide occurrence shows that the probability of landslides occurring is smaller as the Mudslide distance and Collapse distance increase; and as the DEM, SLOPE, Fault Density, Collapse density increase with the value, the probability of landslide susceptibility first increases and then decreases. The Elevation Coefficient of Variation and River Density increase with the value as the probability of landslide susceptibility increases sharply.
Author Contributions
Conceptualization, Q.W. and Q.Q.; methodology, Q.W., Z.X. and Q.Q.; validation, M.T.; formal analysis, J.C. and L.T.; writing—original draft preparation, Q.W. and Y.Z.; writing—review and editing, M.T., Q.Q. and L.T.; supervision, J.C.; funding acquisition, Q.Q. All authors have read and agreed to the published version of the manuscript.
Funding
This research was funded by the Natural Science Foundation of China (No. 42301492), the National Key Research and Development Program (No. 2022YFB3904200, 2022YFF0801201, 2023YFC2906404), the Major Special Project of Xinjiang (2022A03009-3),the Open Fund of Key Laboratory of Urban Land Resources Monitoring and Simulation, Ministry of Natural Resources (No. KF-2022-07-014), and the Opening Fund of Key Laboratory of Geological Survey and Evaluation of Ministry of Education (No. GLAB 2023ZR01) and the Fundamental Research Funds for the Central Universities.
Data Availability Statement
Data available on request in order to protect research participants’ privacy.
Acknowledgments
We are grateful to the anonymous reviewers whose constructive suggestions have improved the quality of this study.
Conflicts of Interest
The authors declare no conflicts of interest.
References
- Gorum, T.; Fan, X.; van Westen, C.J.; Huang, R.Q.; Xu, Q.; Tang, C.; Wang, G. Distribution pattern of earthquake-induced landslides triggered by the 12 May 2008 Wenchuan earthquake. Geomorphology 2011, 133, 152–167. [Google Scholar] [CrossRef]
- Malone, A.; Santi, P.; Cabana, Y.C.; Smith, N.M.; Manning, J.; Zeballos, E.Z.; Zhou, W. Cross-validation as a step toward the integration of local and scientific knowledge of geologic hazards in rural Peru. Int. J. Disaster Risk Reduct. 2022, 67, 102682. [Google Scholar] [CrossRef]
- Jurchescu, M.; Kucsicsa, G.; Micu, M.; Bălteanu, D.; Sima, M.; Popovici, E.-A. Implications of future land-use/cover pattern change on landslide susceptibility at a national level: A scenario-based analysis in Romania. Catena 2023, 231, 107330. [Google Scholar] [CrossRef]
- Chang, Z.; Catani, F.; Huang, F.; Liu, G.; Meena, S.R.; Huang, J.; Zhou, C. Landslide susceptibility prediction using slope unit-based machine learning models considering the heterogeneity of conditioning factors. J. Rock Mech. Geotech. Eng. 2023, 15, 1127–1143. [Google Scholar] [CrossRef]
- Das, J.; Saha, P.; Mitra, R.; Alam, A.; Kamruzzaman, M. GIS-based data-driven bivariate statistical models for landslide susceptibility prediction in Upper Tista Basin, India. Heliyon 2023, 9, e16186. [Google Scholar] [CrossRef] [PubMed]
- Wei, X.; Zhang, L.; Gardoni, P.; Chen, Y.; Tan, L.; Liu, D.; Du, C.; Li, H. Comparison of hybrid data-driven and physical models for landslide susceptibility mapping at regional scales. Acta Geotech. 2023, 18, 4453–4476. [Google Scholar] [CrossRef]
- Polykretis, C. Comparison of “subjectivity” and “objectivity” in expert-based landslide susceptibility modeling. In Geoinformatics for Geosciences; Elsevier: Amsterdam, The Netherlands, 2023; pp. 281–308. [Google Scholar]
- Whiteley, J.S.; Watlet, A.; Kendall, J.M.; Chambers, J.E. Brief communication: The role of geophysical imaging in local landslide early warning systems. Nat. Hazards Earth Syst. Sci. 2021, 21, 3863–3871. [Google Scholar] [CrossRef]
- Chen, X.; Chen, W. GIS-based landslide susceptibility assessment using optimized hybrid machine learning methods. Catena 2021, 196, 104833. [Google Scholar] [CrossRef]
- Pham, B.T.; Jaafari, A.; Prakash, I.; Bui, D.T. A novel hybrid intelligent model of support vector machines and the MultiBoost ensemble for landslide susceptibility modeling. Bull. Eng. Geol. Environ. 2019, 78, 2865–2886. [Google Scholar] [CrossRef]
- Han, W.; Zhang, X.; Wang, Y.; Wang, L.; Huang, X.; Li, J.; Wang, S.; Chen, W.; Li, X.; Feng, R.; et al. A survey of machine learning and deep learning in remote sensing of geological environment: Challenges, advances, and opportunities. ISPRS J. Photogramm. Remote Sens. 2023, 202, 87–113. [Google Scholar] [CrossRef]
- Wang, S.; Han, W.; Zhang, X.; Li, J.; Wang, L. Geospatial remote sensing interpretation: From perception to cognition. Innov. Geosci. 2024, 2, 100056-1–100056-2. [Google Scholar] [CrossRef]
- Wang, S.; Han, W.; Huang, X.; Zhang, X.; Wang, L.; Li, J. Trustworthy remote sensing interpretation: Concepts, technologies, and applications. ISPRS J. Photogramm. Remote Sens. 2024, 209, 150–172. [Google Scholar] [CrossRef]
- Nwazelibe, V.E.; Unigwe, C.O.; Egbueri, J.C. Integration and comparison of algorithmic weight of evidence and logistic regression in landslide susceptibility mapping of the Orumba North erosion-prone region, Nigeria. Model. Earth Syst. Environ. 2023, 9, 967–986. [Google Scholar] [CrossRef]
- Wang, J.; Wang, Y.; Li, C.; Li, Y.; Qi, H. Landslide susceptibility evaluation based on landslide classification and ANN-NFR modelling in the Three Gorges Reservoir area, China. Ecol. Indic. 2024, 160, 111920. [Google Scholar] [CrossRef]
- Chang, Z.; Huang, F.; Huang, J.; Jiang, S.-H.; Liu, Y.; Meena, S.R.; Catani, F. An updating of landslide susceptibility prediction from the perspective of space and time. Geosci. Front. 2023, 14, 101619. [Google Scholar] [CrossRef]
- Hong, H. Assessing landslide susceptibility based on hybrid Best-first decision tree with ensemble learning model. Ecol. Indic. 2023, 147, 109968. [Google Scholar] [CrossRef]
- Xu, K.; Zhao, Z.; Chen, W.; Ma, J.; Liu, F.; Zhang, Y.; Ren, Z. Comparative study on landslide susceptibility mapping based on different ratios of training samples and testing samples by using RF and FR-RF models. Nat. Hazards Res. 2024, 4, 62–74. [Google Scholar] [CrossRef]
- Khabiri, S.; Crawford, M.M.; Koch, H.J.; Haneberg, W.C.; Zhu, Y. An Assessment of Negative Samples and Model Structures in Landslide Susceptibility Characterization Based on Bayesian Network Models. Remote Sens. 2023, 15, 3200. [Google Scholar] [CrossRef]
- Zeng, T.; Jin, B.; Glade, T.; Xie, Y.; Li, Y.; Zhu, Y.; Yin, K. Assessing the imperative of conditioning factor grading in machine learning-based landslide susceptibility modeling: A critical inquiry. Catena 2024, 236, 107732. [Google Scholar] [CrossRef]
- Daher, J.B.; Huygue, T.; Stolf, P.; Hernandez, N. An Ontology and a reasoning approach for Evacuation in Flood Disaster Response. J. Inf. Knowl. Manag. 2023, 22, 2350042. [Google Scholar] [CrossRef]
- Qiu, Q.; Xie, Z.; Zhang, D.; Ma, K.; Tao, L.; Tan, Y.; Zhang, Z.; Jiang, B. Knowledge graph for identifying geological disasters by integrating computer vision with ontology. J. Earth Sci. 2023, 34, 1418–1432. [Google Scholar] [CrossRef]
- Wang, J.; Cao, W. A Novel Approach for Mining Spatiotemporal Explicit and Implicit Information in Multiscale Spatiotemporal Data. ISPRS Int. J. Geo-Inf. 2023, 12, 261. [Google Scholar] [CrossRef]
- Guo, Y.; Zhu, J.; You, J.; Pirasteh, S.; Li, W.; Wu, J.; Lai, J.; Dang, P. A dynamic visualization based on conceptual graphs to capture the knowledge for disaster education on floods. Nat. Hazards 2023, 119, 203–220. [Google Scholar] [CrossRef]
- Wen, M.; Qiu, Q.; Zheng, S.; Ma, K.; Zheng, S.; Xie, Z.; Tao, L. Construction and application of a multilevel geohazard domain ontology: A case study of landslide geohazards. Appl. Comput. Geosci. 2023, 20, 100134. [Google Scholar] [CrossRef]
- Zhang, J. Characteristics Cognition of Typical Surface Geohazards Scene in Mining Areas and Representation of Geo-Infographics Spectrum. ISPRS Ann. Photogramm. Remote Sens. Spat. Inf. Sci. 2022, 4, 25–31. [Google Scholar] [CrossRef]
- Qinjun, Q.; Liang, W.; Kai, M. A Knowledge Graph Construction Method for Geohazard Chain for Disaster Emergency Response. Earth Sci. 2023, 48, 1875–1891. [Google Scholar]
- Huang, Z.; Peng, L.; Li, S.; Wu, W.; Liu, F. Determining geo-disaster chains probabilities and disaster mitigation mode: A meta-analytical perspective. Ecol. Indic. 2024, 163, 112074. [Google Scholar] [CrossRef]
- Du, Z.; Li, Y.; Zhang, Y.; Tan, Y.; Zhao, W. Knowledge graph construction method on natural disaster emergency. Geomat. Inf. Sci. Wuhan Univ. 2020, 45, 1344–1355. [Google Scholar]
- Ghosh, S.; Maji, S.; Desarkar, M.S. Unsupervised Domain Adaptation With Global and Local Graph Neural Networks under Limited Supervision and Its Application to Disaster Response. IEEE Trans. Comput. Soc. Syst. 2022, 10, 551–562. [Google Scholar] [CrossRef]
- Jiao, Y.; You, S. Rescue decision via earthquake disaster knowledge graph reasoning. Multimed. Syst. 2023, 29, 605–614. [Google Scholar] [CrossRef]
- Goetz, J.N.; Brenning, A.; Petschko, H.; Leopold, P. Evaluating machine learning and statistical prediction techniques for landslide susceptibility modeling. Comput. Geosci. 2015, 81, 1–11. [Google Scholar] [CrossRef]
- Kadavi, P.R.; Lee, C.W.; Lee, S. Application of ensemble-based machine learning models to landslide susceptibility mapping. Remote Sens. 2018, 10, 1252. [Google Scholar] [CrossRef]
- Youssef, A.M.; Pourghasemi, H.R. Landslide susceptibility mapping using machine learning algorithms and comparison of their performance at Abha Basin, Asir Region, Saudi Arabia. Geosci. Front. 2021, 12, 639–655. [Google Scholar] [CrossRef]
- Tobler, W.R. A computer movie simulating urban growth in the Detroit region. Econ. Geogr. 1970, 46 (Suppl. S1), 234–240. [Google Scholar] [CrossRef]
- Lu, Y.; Liu, Q.; Dai, D.; Xiao, X.; Lin, H.; Han, X.; Sun, L.; Wu, H. Unified structure generation for universal information extraction. In Proceedings of the 60th Annual Meeting of the Association for Computational Linguistics, Dublin, Ireland, 22–27 May 2022; pp. 5755–5772. [Google Scholar]
- Wang, X.; Huang, T.; Wang, D.; Yuan, Y.; Liu, Z.; He, X.; Chua, T.S. Learning Intents Behind Interactions with Knowledge Graph for Recommendation. In Proceedings of the Web Conference 2021, Ljubljana Slovenia, 19–23 April 2021; Association for Computing Machinery: New York, NY, USA, 2021; pp. 878–887. [Google Scholar]
- Portisch, J.; Heist, N.; Pauiheim, H. Knowledge graph embedding for data mining vs. knowledge graph embedding for link prediction-two sides of the same coin? Semant. Web 2022, 13, 399–422. [Google Scholar] [CrossRef]
- Qaiser, S.; Ali, R. Text mining: Use of TF-IDF to examine the relevance of words to documents. Int. J. Comput. Appl. 2018, 181, 25–29. [Google Scholar] [CrossRef]
- Li, L.; Wang, P.; Yan, J.; Wang, Y.; Li, S.; Jiang, J.; Sun, Z.; Tang, B.; Chang, T.-H.; Wang, S.; et al. Real-world data medical knowledge graph: Construction and applications. Artif. Intell. Med. 2020, 103, 101817. [Google Scholar] [CrossRef] [PubMed]
- LaValley, M.P. Logistic regression. Circulation 2008, 117, 2395–2399. [Google Scholar] [CrossRef] [PubMed]
- Ghosh, D.; Saha, S. Identifying River bank erosion potential zones through geo-spatial and binary logistic regression modeling approach: A case study of river Ganga in Malda district (India). Model. Earth Syst. Environ. 2024, 10, 81–98. [Google Scholar] [CrossRef]
- Hearst, M.A.; Dumais, S.T.; Osuna, E.; Platt, J.; Scholkopf, B. Support vector machines. IEEE Intell. Syst. Their Appl. 1998, 13, 18–28. [Google Scholar] [CrossRef]
- Roy, A.; Chakraborty, S. Support vector machine in structural reliability analysis: A review. Reliab. Eng. Syst. Saf. 2023, 233, 109126. [Google Scholar] [CrossRef]
- Breiman, L. Random forests. Mach. Learn. 2001, 45, 5–32. [Google Scholar] [CrossRef]
- Hu, J.; Szymczak, S. A review on longitudinal data analysis with random forest. Brief. Bioinform. 2023, 24, bbad002. [Google Scholar] [CrossRef] [PubMed]
- Ke, G.; Meng, Q.; Finley, T.; Wang, T.; Chen, W.; Ma, W.; Ye, Q.; Liu, T.Y. LightGBM: A highly efficient gradient boosting decision tree. Adv. Neural Inf. Process. Syst. 2017, 30, 52. [Google Scholar]
- Li, T.; Xia, Q.; Ouyang, Y.; Zeng, R.; Liu, Q.; Li, T. Prospectivity and Uncertainty Analysis of Tungsten Polymetallogenic Mineral Resources in the Nanling Metallogenic Belt, South China: A Comparative Study of AdaBoost, GBDT, and XgBoost Algorithms. Nat. Resour. Res. 2024, 33, 1049–1071. [Google Scholar] [CrossRef]
- Dang, B.L.; Nguyen-Xuan, H.; Wahab, M.A. An effective approach for VARANS-VOF modelling interactions of wave and perforated breakwater using gradient boosting decision tree algorithm. Ocean Eng. 2023, 268, 113398. [Google Scholar] [CrossRef]
- Zhang, J.; Ma, X.; Zhang, J.; Sun, D.; Zhou, X.; Mi, C.; Wen, H. Insights into geospatial heterogeneity of landslide susceptibility based on the SHAP-XGBoost model. J. Environ. Manag. 2023, 332, 117357. [Google Scholar] [CrossRef] [PubMed]
- Friedman, J. Greedy function approximation: A gradient boosting machine. Ann. Stat. 2001, 29, 1189–1232. [Google Scholar] [CrossRef]
- Chen Tianqi Guestrin, C. Xgboost: A scalable tree boosting system. In Proceedings of the 22nd ACM Sigkdd International Conference on Knowledge Discovery and Data Mining, San Francisco, CA, USA, 13–17 August 2016; pp. 785–794. [Google Scholar]
- Friedman, J.H. Stochastic gradient boosting. Comput. Stat. Data Anal. 2022, 38, 367–378. [Google Scholar] [CrossRef]
- Qian, L.; Chen, Z.; Huang, Y.; Stanford, R.J. Employing categorical boosting (CatBoost) and meta-heuristic algorithms for predicting the urban gas consumption. Urban Clim. 2023, 51, 101647. [Google Scholar] [CrossRef]
- Yin, M.; Wortman Vaughan, J.; Wallach, H. Understanding the effect of accuracy on trust in machine learning models. In Proceedings of the 2019 CHI Conference on Human Factors in Computing Systems, Glasgow, UK, 4–9 May 2019; pp. 1–12. [Google Scholar]
- Jiang, Z.; Wang, M.; Liu, K. Comparisons of convolutional neural network and other machine learning methods in landslide susceptibility assessment: A case study in Pingwu. Remote Sens. 2023, 15, 798. [Google Scholar] [CrossRef]
- Mangalathu, S.; Hwang, S.H.; Jeon, J.S. Failure mode and effects analysis of RC members based on machine-learning-based SHapley Additive exPlanations (SHAP) approach. Eng. Struct. 2020, 219, 110927. [Google Scholar] [CrossRef]
- Su, C.; Wang, B.; Lv, Y.; Zhang, M.; Peng, D.; Bate, B.; Zhang, S. Improved landslide susceptibility mapping using unsupervised and supervised collaborative machine learning models. Georisk Assess. Manag. Risk Eng. Syst. Geohazards 2023, 17, 387–405. [Google Scholar] [CrossRef]
- Shapley, L.S. 17. A value for n-person games. In Contributions to the Theory of Games (AM-28); Princeton University Press: Princeton, NJ, USA, 1953; Volume 2, p. 307. [Google Scholar]
- Fang, Z.; Wang, Y.; Duan, G.; Peng, L. Landslide susceptibility mapping using rotation forest ensemble technique with different decision trees in the Three Gorges Reservoir area, China. Remote Sens. 2021, 13, 238. [Google Scholar] [CrossRef]
- Song, Y.; Li, Y.; Zou, Y.; Wang, R.; Liang, Y.; Xu, S.; He, Y.; Yu, X.; Wu, W. Synergizing multiple machine learning techniques and remote sensing for advanced landslide susceptibility assessment: A case study in the Three Gorges Reservoir Area. Environ. Earth Sci. 2024, 83, 227. [Google Scholar] [CrossRef]
- Yu, L.; Wang, Y.; Pradhan, B. Enhancing landslide susceptibility mapping incorporating landslide typology via stacking ensemble machine learning in Three Gorges Reservoir, China. Geosci. Front. 2024, 15, 101802. [Google Scholar] [CrossRef]
- Wang, L.; Zuo, B.; Le, Y.; Chen, Y.; Li, J. Penetrating remote sensing: Next-generation remote sensing for transparent earth. Innovation 2023, 4, 100519. [Google Scholar] [CrossRef] [PubMed]
- Han, W.; Chen, J.; Wang, L.; Feng, R.; Li, F.; Wu, L.; Tian, T.; Yan, J. Methods for small, weak object detection in optical high-resolution remote sensing images: A survey of advances and challenges. IEEE Geosci. Remote Sens. Mag. 2021, 9, 8–34. [Google Scholar] [CrossRef]
- Wang, S.; Huang, X.; Han, W.; Li, J.; Zhang, X.; Wang, L. Lithological mapping of geological remote sensing via adversarial semi-supervised segmentation network. Int. J. Appl. Earth Obs. Geoinf. 2023, 125, 103536. [Google Scholar] [CrossRef]
- Qiu, Q.; Tian, M.; Huang, Z.; Xie, Z.; Ma, K.; Tao, L.; Xu, D. Chinese engineering geological named entity recognition by fusing multi-features and data enhancement using deep learning. Expert Syst. Appl. 2024, 238, 121925. [Google Scholar] [CrossRef]
- Tian, M.; Ma, K.; Wu, Q.; Qiu, Q.; Tao, L.; Xie, Z. Joint extraction of entity relations from geological reports based on a novel relation graph convolutional network. Comput. Geosci. 2024, 187, 105571. [Google Scholar] [CrossRef]


Disclaimer/Publisher’s Note: The statements, opinions and data contained in all publications are solely those of the individual author(s) and contributor(s) and not of MDPI and/or the editor(s). MDPI and/or the editor(s) disclaim responsibility for any injury to people or property resulting from any ideas, methods, instructions or products referred to in the content. |
© 2024 by the authors. Licensee MDPI, Basel, Switzerland. This article is an open access article distributed under the terms and conditions of the Creative Commons Attribution (CC BY) license (https://creativecommons.org/licenses/by/4.0/).