Article

AIRS and MODIS Satellite-Based Assessment of Air Pollution in Southwestern China: Impact of Stratospheric Intrusions and Cross-Border Transport of Biomass Burning

1
School of Environment and Energy, South China University of Technology, Guangzhou 510006, China
2
Yunnan Key Laboratory of Meteorological Disasters and Climate Resources in the Greater Mekong Subregion, Yunnan University, Kunming 650091, China
*
Author to whom correspondence should be addressed.
Remote Sens. 2024, 16(13), 2409; https://doi.org/10.3390/rs16132409 (registering DOI)
Submission received: 15 April 2024 / Revised: 26 June 2024 / Accepted: 26 June 2024 / Published: 1 July 2024
(This article belongs to the Special Issue Application of Satellite Aerosol Remote Sensing in Air Quality)

Abstract

:
The exacerbation of air pollution during spring in Yunnan province, China, has attracted widespread attention. However, many studies have focused solely on the impacts of anthropogenic emissions while ignoring the role of natural processes. This study used satellite data spanning 21 years from the Moderate Resolution Imaging Spectroradiometer (MODIS) and the Atmospheric Infrared Sounder (AIRS) to reveal two natural processes closely related to springtime ozone (O3) and PM2.5 pollution: stratospheric intrusions (SIs) and cross-border transport of biomass burning (BB). We aimed to assess the mechanisms through which SIs and cross-border BB transport influence O3 and PM2.5 pollution in Southwestern China during the spring. The unique geographical conditions and prevalent southwest winds are considered the key driving factors for SIs and cross-border BB transport. Frequent tropopause folding provides favorable dynamic conditions for SIs in the upper troposphere. In the lower troposphere, the distribution patterns of O3 and stratospheric O3 tracer (O3S) are similar to the terrain, indicating that O3 is more likely to reach the surface with increasing altitude. Using stratospheric tracer tagging methods, we quantified the contributions of SIs to surface O3, ranging from 6 to 31 ppbv and accounting for 10–38% of surface O3 levels. Additionally, as Yunnan is located downwind of Myanmar and has complex terrain, it provides favorable conditions for PM2.5 and O3 generation from cross-border BB transport. The decreasing terrain distribution from north to south in Yunnan facilitates PM2.5 transport to lower-elevation border cities, whereas higher-elevation cities hinder PM2.5 transport, leading to spatial heterogeneity in PM2.5. This study provides scientific support for elucidating the two key processes governing springtime PM2.5 and O3 pollution in Yunnan, SIs and cross-border BB transport, and can assist policymakers in formulating optimal emission reduction strategies.

1. Introduction

Elevated amounts of PM2.5 (particulate matter with an aerodynamic equivalent diameter of 2.5 μm or less) and ozone (O3) are currently the two major bottleneck issues constraining the continuous improvement of air quality in China. The complexity of their source mechanisms has brought enormous challenges to the prevention and control of air pollution. Although implementing the Air Pollution Prevention and Control Action Plan (APPCAP) has effectively controlled PM2.5 pollution in most parts of China, the emphasis on reducing PM2.5 emissions has led to a continuous increase in O3 concentrations. In some areas, this has resulted in combined pollution from PM2.5 and O3 [1,2]. Owing to its harmful impact on human health, vegetation growth, and climate change [3,4], the synergistic control of O3 and PM2.5 constitutes a critical priority in China’s long-term air quality management agenda.
The main sources of PM2.5 depend on local primary emissions, secondary photochemical reactions, and regional transport. Industrial, traffic, and residential sources can directly emit PM2.5 [5]. Meanwhile, these sources also release other pollutants, which undergo various chemical and physical processes to transform into sulfate, nitrate, and secondary organic aerosols, constituting fine particulate matter [6,7]. Numerous studies have used source apportionment, numerical simulations, and other methods to quantify the contributions of primary emissions and secondary generation to PM2.5 during high-pollution events [8,9,10,11]. Apart from local sources, regional transport is another significant contributor to local PM2.5 pollution, and it can directly carry large amounts of pollutants from other areas, exacerbating local air pollution [12,13,14]. Under specific meteorological conditions, regional transport plays a dominant role in PM2.5 pollution events in regions such as the North China Plain (NCP), the Sichuan Basin (SCB), and the Yunnan Plateau (YP), with contribution rates reaching exceptionally high levels [12,15,16]. Zhang et al. [17] investigated the difference in PM2.5 transport flux between NCP and SCB in autumn and winter. They observed that NCP was controlled by a cold front weather system and transported PM2.5 to surrounding areas. In contrast, PM2.5 in SCB was affected by interbasin transport because of the complex terrain that hindered horizontal diffusion. Unlike the other two regions, PM2.5 in YP was found to be influenced by biomass burning (BB) in the Indo-China Peninsula during spring, a source of cross-border BB transport [16,18].
Unlike PM2.5 pollution, O3 is a secondary pollutant primarily formed through local photochemical reactions. These reactions involve interactions between precursor pollutants, such as nitrogen oxides (NOx) and volatile organic compounds (VOCs), in the presence of solar radiation. Influenced by anthropogenic and natural emissions, the local photochemical environment plays an important role in shaping O3 concentrations [19,20]. Additionally, regional transport from neighboring areas and stratospheric intrusions (SIs) are also important O3 budget sources [21]. Regional transport is a driving factor behind surface O3 pollution in regions like Beijing–Tianjin–Hebei (BTH), the Yangtze River Delta (YRD), and the Pearl River Delta (PRD) [15,22,23]. SIs involve the downward transport of O3 from the stratosphere to the troposphere and even the surface, under the influence of physical mechanisms such as tropopause folding, cut-off lows, subtropical jet streams, and wave breaking [24,25,26,27]. Under specific meteorological conditions such as typhoons, tropical cyclones, and subtropical highs, local circulation intensifies, leading to enhanced regional transport and SIs, impacting the near-surface O3 concentration [28,29,30].
Compared with plains such as the BTH, the YRD, and the PRD, Yunnan boasts a unique and complex topography as a high-altitude plateau with substantial elevation variations among its cities. While Yunnan’s overall altitude is relatively high, a considerable difference in elevation exists among its cities, creating a topographical landscape with higher elevations in the northwest and lower elevations in the southeast, resulting in a stair-step descent from south to north. Additionally, the climate of Yunnan is characterized by its complexity in both the horizontal and vertical dimensions, featuring a combination of boreal, temperate, and tropical climates, and temperature variations are notably influenced by changes in elevation. In contrast to the other major city clusters, such as BTH, the YRD, and the PRD, where PM2.5 pollution is concentrated in winter and O3 pollution is concentrated in summer [12,20,31], Yunnan experiences PM2.5 and O3 pollution primarily during spring. High-frequency tropopause folding provides favorable dynamic conditions for the downward transport of O3-rich air mass from the stratosphere to the troposphere during springtime, influencing near-surface O3 concentrations [25,30,32]. Additionally, BB is active in the spring over the Indo-China Peninsula (ICP), and the prevailing westerly winds transport BB-generated PM2.5 and O3 to Yunnan [33,34]. Numerous studies of pollution cases have confirmed the existence of transport channels between Yunnan and the ICP [16,18]. Given the unique topographic conditions and geographical location of Yunnan, these two distinct transport processes, SIs and cross-border BB transport, exert a more profound impact on PM2.5 and O3 pollution in Yunnan during the spring. However, current emission reduction policymaking has predominantly focused on reducing local anthropogenic sources, and there remains a notable lack of research on the impact of these two natural sources on the mechanism of springtime O3 pollution in Yunnan.
Satellite remote sensing technology can provide vertical profile data, real-time observations, and extensive spatiotemporal coverage, which can help to better understand the mechanisms governing PM2.5 and O3 pollution [35,36,37]. Instruments such as the Moderate Resolution Imaging Spectroradiometer (MODIS), the Ozone Monitoring Instrument (OMI), and Cloud–Aerosol Lidar and Infrared Satellite Observations (CALIPSO) have been widely used to retrieve the spatiotemporal distribution of Aerosol Optical Depth (AOD), which quantifies the solar attenuation caused by aerosols [38,39,40]. Shaik et al. [41] and others have confirmed the accuracy of MODIS-derived AOD by comparing it to ground-based AOD, showing strong agreement with a correlation coefficient (R) of 0.86 and a root mean square error (RMSE) of 0.14. Additionally, satellite-based AOD has been instrumental in revealing the impact of BB on the optical properties and vertical structure of aerosols [35,42]. Satellite-based vertical profiles of O3, obtained from instruments like the Atmospheric Infrared Sounder (AIRS), are crucial for investigating SIs [43,44]. Ma et al. [45] used vertical AIRS profiles of O3 to provide evidence of SIs in cities such as Chaoyang, Shijiazhuang, and Hangzhou during the spring and summer of 2019. By characterizing the three-dimensional spatiotemporal distribution of pollutants, satellite observations can significantly enhance our understanding of pollutant transport processes and largely compensate for a lack of vertical observation data.
To study and quantify the impact of SIs and cross-border BB transport on O3 and PM2.5 concentrations in Yunnan province during spring, 21-year satellite observations from MODIS and AIRS were used to investigate the spatial and temporal variations in O3 and PM2.5. The Whole Atmosphere Community Climate Model (WACCM) dataset was used to quantify the contributions of SIs and cross-border BB transport to O3 and PM2.5 concentrations under complex topographic conditions. Finally, the sources of PM2.5 and O3 in Yunnan during spring were determined by using the Hybrid Single Particle Lagrangian Integrated Trajectory (HYSPLIT) model to simulate air mass trajectories. The objectives of this study are to: (1) analyze the general characteristics of O3 and AOD; (2) explain the mechanisms of SIs and cross-border BB transport; and (3) investigate the influence of SIs and cross-border BB transport on O3 and PM2.5 under complex topographic conditions.

2. Materials and Methods
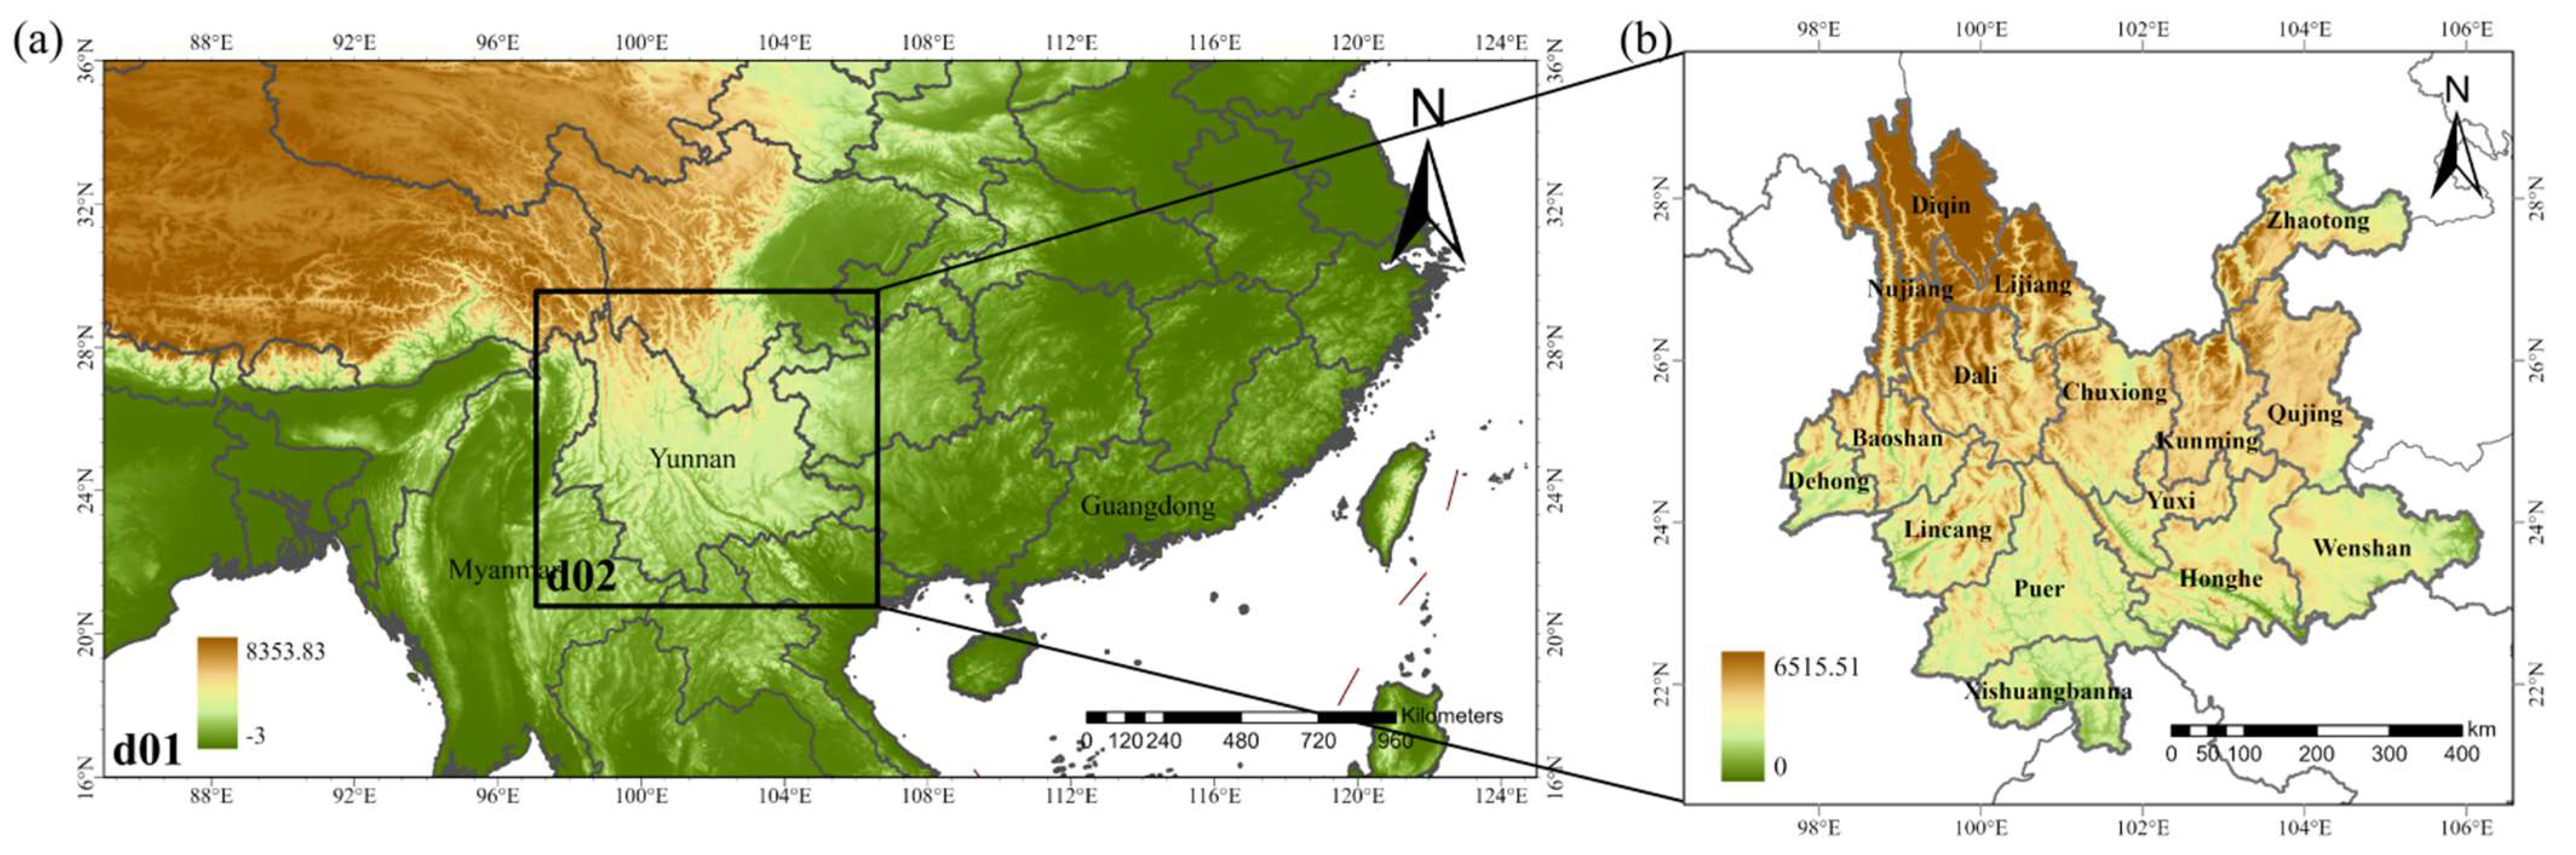
2.1. Studied Area

Two nested domains were used in this study: the 16°–36°N, 85°–125°E region, and Yunnan province (Figure 1). Previous studies indicate that the westerly jet stream is an important midlatitude circulation in region d01 during the spring [33]. This area is known for frequent tropopause folding and is also a hotspot for BB during the spring [32].

2.2. Satellite Datasets

We used two types of satellite datasets from different instruments, MODIS and AIRS. Table 1 and Table 2, respectively, present their instrument specifications and the attributes of their corresponding datasets.

2.2.1. MODIS

MODIS is part of the National Aeronautics and Space Administration (NASA) and is deployed on two satellites, Aqua and Terra, which are in near-polar orbits. This positioning allows for global observations multiple times a day. MODIS captures data in 36 inter-aligned spectral bands ranging from 0.4 µm to 14.4 µm and acquires them at three spatial resolutions: 250 m, 500 m, and 1000 m, providing global data over a wide range. The daily level 2 Collection 6.1 AOD dataset (MYD04_L2) is used to provide AOD data, which are available from the website: https://ladsweb.modaps.eosdis.nasa.gov/, accessed on 3 November 2023. Each file in this dataset corresponds to a 5-min MODIS orbital fragment with a spatial resolution of 10 × 10 km, containing a total of 203 × 135 pixels. The MODIS retrieval algorithm for aerosol properties is divided into the Dark Target (DT) and Deep Blue (DB) algorithms. The DT algorithm is used for retrieving AOD over the ocean and vegetated land, while the DB algorithm is designed for bright surfaces, like deserts and urban areas, and dark surfaces, including vegetated regions. The latest MODIS product merges the strengths of the DT and DB algorithms into a new combined dataset that relies on the Normalized Difference Vegetation Index (NDVI). The combined dataset is generated as follows: (1) if NDVI > 0.3, DT retrievals are used; (2) if NDVI < 0.2, DB retrievals are used; (3) if 0.2 ≤ NDVI ≤ 0.3, the average of the DT and DB retrievals is used, or the one with the recommended quality assurance (QA = 3 for DT and QA ≥ 2 for DB) is selected. This approach enhances spatial coverage over land, particularly in transitional regions with low vegetation that are dark enough for the DT algorithm to be applicable [49]. Consequently, we used the combined dataset to analyze the general characteristics of AOD, namely, “AOD_550_Dark_Target_Deep_Blue_ Combined”.

2.2.2. AIRS

AIRS was launched with the Aqua satellite on 4 May 2002, as part of NASA. This sensor is specifically designed to obtain infrared spectral information in the atmosphere; it has a high spectral resolution and provides all-day vertical profile observations. Furthermore, the AIRS and MODIS instruments are concurrently deployed on the Aqua satellite, establishing a dual-satellite configuration that comprehensively analyzes both surface and atmospheric data. In this study, the AIRS Version 7 Level 3 standard product with 1° × 1° spatial resolution and monthly temporal resolution was used to investigate the spatiotemporal distribution of O3. The vertical profile data are divided into 24 pressure levels, from 1000 hPa to 1 hPa, and can be obtained from the website: https://airs.jpl.nasa.gov/data/get-data/standard-data/, accessed on 3 November 2023.

2.3. WACCM Simulation

2.3.1. WACCM Datasets

The WACCM is a global climate model developed by the National Center for Atmospheric Research (NCAR), falling under the Atmospheric Chemistry-Climate Model (AOGCM) category. This model aims to simulate and study physical and chemical processes in the atmosphere, covering entire pressure levels from the surface to the top of the atmosphere. This model uses anthropogenic emissions from the latest Copernicus Atmosphere Monitoring Service (CAMS) inventory. Open-flame emissions are derived from FINN-v1. The spatial resolution of the datasets is 0.9° × 1.25°, and the vertical profile is divided into 88 levels, which can be obtained from the website: https://www.acom.ucar.edu/waccm/download.shtml, accessed on 3 November 2023. The stratospheric O3 tracer (O3S) and the CO tracer (CO01) represent the contribution of SIs to tropospheric O3 and the impact of global BB emissions on local CO.

2.3.2. Model Evaluation

O3 and PM2.5 observations from site data and AOD observations from the MODIS dataset are performed to assess the performance of the WACCM dataset at eight sites in Yunnan from 2020 to 2023. The hourly O3 and PM2.5 data from 2020 to 2023 used in this study were obtained from the China Environmental Monitoring Center’s national urban air quality real-time release platform (https://air.cnemc.cn:18007/, accessed on 3 November 2023). Figure S1 and Table S1 show that the WACCM dataset had good performance for O3, PM2.5, and AOD, with averaged R of 0.86, 0.88, and 0.67, respectively. The averaged RMSEs are 14.21 μg/m3, 23.17 μg/m3, and 0.21, and the mean biases (MBs) are 11.27 μg/m3, 12.29 μg/m3, and 0.14, respectively. Overall, the above discussion can prove the reliability of WACCM data and support the subsequent analysis of our study objectives.

2.4. HYSPLIT Model

The HYSPLIT model is a Lagrangian trajectory model developed by the National Oceanic and Atmospheric Administration (NOAA) to calculate simple air parcel trajectories as well as complex simulations for transportation, dispersion, chemical transformation, and deposition. The HYSPLIT model has been widely used to track aerosol sources and identify BB emission smoke delivery routes [18,35]. The Global Data Assimilation System (GDAS) from the National Centers for Environmental Prediction (NCEP) is used to generate meteorological conditions at an interval of 6 h with 1° horizontal resolution and 23 vertical levels from 1000 hPa to 20 hPa, and its data can be obtained from the website: https://www.ready.noaa.gov/data/archives/gdas1/, accessed on 3 November 2023. Two representative cities, Kunming (25.04°N, 102.66°E) and Xishuangbanna (22.02°N, 100.80°E), were selected as the model-simulated trajectory termination or particle receiving points. The starting height was set to 500 m above ground level, and simulations were conducted at 00:00, 06:00, 12:00, and 18:00 UTC during spring from 2020 to 2023 for 72 h backward in time. After running the HYSPLIT model, we obtained trajectory information, including the number of trajectories and endpoints within each grid cell that the trajectory passed through.
Potential Source Contribution Function (PSCF) analysis is widely used to identify spatial patterns in pollution sources and quantitatively estimate the relative contribution strengths of different source areas [18,31,50]. To assess the pollution levels in the study region from various source areas, it was essential to establish threshold values for PM2.5. According to the daily average primary limit of the Ambient Air Quality Standards of China (GB 3095-2012) [51], the PM2.5 threshold value was set to 35 μg/m3. The position where each trajectory endpoint falls is recorded as (i, j). Mij represents the number of trajectory endpoints where the measured PM2.5 parameter exceeds the threshold value within the ij-th grid cell, and Nij represents the total number of trajectory endpoints within the ij-th grid cell. The PSCF value of each grid cell in the study area was determined by calculating the ratio of Mij and Nij, as shown in Equation (1):
P i j = M i j N i j
When Nij is small, the uncertainty of the conditional probability Pij increases. To reduce this uncertainty, we referred to the study by Polissar [50] and introduced a weight function, Wij, which is multiplied by Pij, as follows:
W i j = 1.00 0.70 0.42 0.17 .... 150 < N i j 15 < N i j 150 5 < N i j 15 N i j 5
W P S C F = W i j × P i j
Concentration-Weighted Trajectory (CWT) analysis was employed to determine the potential source area contributions of PM2.5. PM2.5 concentrations in the target cities can be obtained from the China Environmental Monitoring Center’s national urban air quality real-time release platform (https://air.cnemc.cn:18007/, accessed on 3 November 2023). The CWT value of each grid cell in the study area was obtained by calculating the weighted value of pollutant concentration in different trajectories, as shown in Equation (4):
C i j = 1 l = 1 M T i j l l = 1 M C l T i j l
where: Cij represents the average weighted PM2.5 concentration of the ij-th grid cell (μg/m3); l is the number of trajectories; M is the total number of trajectories; Cl represents the pollutant concentration along trajectory l; and Tijl represents the time spent by trajectory l in the ij-th grid cell. Similar to Pij, we used Wij to decrease the error in Cij, as follows:
W C W T = W i j × C i j

3. Results

3.1. General Characteristics of AOD and O3

To compare the difference in the effects of cross-border BB transport and SIs on PM2.5 and O3 in Yunnan and the entire region, this section analyzes satellite observations from MODIS and AIRS in d01 and d02, as shown in Figure 1.
We analyzed the seasonal variation characteristics of AOD using MODIS satellite observations from 2003 to 2023, aiming to indirectly obtain the variation characteristics of PM2.5 from an observational perspective. Figure 2 depicts the seasonally averaged AOD over Yunnan province from 2003 to 2023. In the Yunnan region, AOD exhibits distinctive characteristics, with its peak occurring during the spring season. This feature contrasts notably with other regions, such as BTH and the YRD, where the maximum AOD can be observed during the summer season [52,53]. The average AOD during spring has consistently exceeded the 21-year mean value, with 16 years recording maximum AOD values in spring surpassing 0.8 and even reaching 1.1. This phenomenon became more pronounced after 2015, with AOD values in spring significantly surpassing those of other seasons. Notably, the high AOD values during spring in Yunnan are more pronounced compared with the overall region, with the average falling within a range of 0.35–0.47.
Additionally, PM2.5, PM10, and O3 and AOD exhibit similar seasonal variation characteristics, with their peak values appearing in spring. However, there are significant differences in the annual variation trends of these elements in Yunnan province between 2015 and 2023, with PM2.5 and PM10 decreasing by 4 μg/m3 and 12 μg/m3, respectively, and O3 increasing by 13 μg/m3. The APPCAP plan’s implementation in 2013 is responsible for these variations. Reductions in anthropogenic emissions have led to a sustained decrease in PM2.5 and PM10 emissions. Besides the increase in radiative flux due to the decrease in PM2.5 exacerbating O3 pollution, the change in pollutant emission structure caused by China’s PM2.5 control-focused emission reduction measures may be a significant reason for the recent continuous rise in O3 pollution [54]. Meanwhile, AOD did not change significantly, fluctuating around a value of 1. Previous studies have shown that PM2.5 and PM10 contribute to the total aerosol load, thus affecting AOD in the atmosphere [55,56,57]. Figure S3 shows that there is a positive relationship between PM2.5, PM10, and AOD in spring and summer over Yunnan, with an R ranging from 0.56 to 0.75, indicating that PM2.5 and PM10 significantly contribute to springtime and summertime AOD in Yunnan. However, the correlations between PM2.5, PM10, and AOD are low in autumn and winter, which are attributed to various meteorological factors such as humidity, wind speed, and atmospheric stability. For instance, high humidity can cause hygroscopic particle growth, increasing AOD, but this does not necessarily indicate a proportional increase in surface PM2.5 or PM10. Additionally, AOD signifies the cumulative extinction capacity of all aerosol particles within the vertical atmospheric column. However, PM2.5 and PM10 site observations can only reflect surface pollution levels. The differences mentioned above can lead to variations in the correlation between satellite observations of AOD and surface observations of PM2.5 or PM10 in different seasons.
In the context of significant annual reductions in PM2.5 and PM10 pollution, the consistently high levels of PM2.5 in spring are particularly notable. Consequently, the impact of cross-border BB transport occurring during spring has been further amplified. Furthermore, the overall increase in spring AOD in Yunnan and the entire region confirms the homogeneity of AOD sources in these two areas.
Figure 3 depicts the spatiotemporal distribution of O3 in Yunnan and the entire region. A tongue-shaped plume of high O3 can be seen extending from 100 hPa downward to the lower troposphere, with O3 concentrations higher than 80.0 ppbv. The downward transport of stratospheric O3-enriched air accumulates at the top of the boundary layer owing to the blocking effect of that layer, forming an area of high O3 values. Previous studies have proved that similar phenomena can indicate the occurrence of SIs [21,25]. The latitude cross-section also further supports that SIs transport O3-enriched air from the stratosphere to the troposphere, forming a tropospheric O3 hotspot above 500 hPa (Figure 4a).
Figure 4b shows a band of O3-enriched air extending from Northern India to Yunnan above 500 hPa, possibly indicating that cross-border BB transport exacerbates O3 pollution in the lower troposphere. Figure 5d–f depicts the spatial distribution of O3 and wind fields at altitudes of 303 hPa, 512 hPa, and 713 hPa, confirming the existence of the hotspot above 500 hPa. The strong westerly jet at 313 hPa and 512 hPa provides favorable meteorological conditions for the horizontal transport of pollutants from the source area in Myanmar to Yunnan, indirectly supporting the possibility that cross-border BB transport affects the formation of O3 hotspots (Figure 5e,f). Figure S4 shows that Kunming and Xishuangbanna’s five and four major pathways have been identified. The trajectories from central Myanmar have the highest proportion, accounting for 58.98% in Kunming and 38% in Xishuangbanna, further indicating the influence of cross-border BB on pollutants in Yunnan. Consequently, cross-border BB transport in the lower troposphere may further exacerbate tropospheric O3 pollution.
The higher O3 concentrations in the lower troposphere of Yunnan may also be attributable to the region’s topographical conditions, as its elevated altitude facilitates the transport of stratospheric O3 closer to the surface layer. A comprehensive analysis of satellite data has revealed that SIs and cross-border BB transport are two significant sources influencing air quality in the Yunnan region. However, there are still large uncertainties in studies of the quantitative regulation mechanism of springtime O3 pollution over Yunnan.

3.2. Occurrence of SIs and the Cross-Border BB Transport in Yunnan

Satellite observations have confirmed the significant impact of SIs and cross-border BB transport on air quality during spring in Yunnan. However, the specific mechanisms and quantifications of each process have not been thoroughly investigated. This knowledge gap undermines the effectiveness of strategies aimed at reducing anthropogenic emissions. Many studies have demonstrated the accuracy of WACCM simulations and their applications in research related to O3 and CO pollution [58,59,60]. WACCM simulations were performed to investigate the governing dynamic mechanisms of SIs and cross-border BB transport from 2020 to 2023.
In Figure 6, noticeable seasonal characteristics were observed for PM2.5, CO, and CO01 concentrations in both Yunnan and Myanmar, where high values all occurred in later winter and early spring (February–April). In comparison, the high PM2.5 and CO values in Yunnan are primarily concentrated between 800 hPa and the surface layer, while pollutants in Myanmar accumulate closer to the ground. Additionally, the maximum PM2.5 and CO concentrations in Myanmar can reach 191 μg/m3 and 1768 ppbv, whereas in Yunnan, these values reach 73 μg/m3 and 679 ppbv (Figure 6). This indicates that Yunnan is situated downwind from Myanmar and is significantly influenced by cross-border BB transport. The vertical distribution characteristics of CO01 further confirm this inference. Many previous studies have demonstrated that the prevailing southwest winds in spring over ICP transport PM2.5 to Yunnan, which is located downwind [16,18]. A hotspot of PM2.5, CO, and CO01 concentrations was noticed between 700 and 800 hPa over Guangdong (Figure 6c,f,i), which indicated the important role of BB in air quality in that area [35].
Figure 7 further provides a time–height cross-section plot of monthly mean O3 and O3S profiles for Yunnan, Myanmar, India, and Guangdong from 2020 to 2023. A tongue-shaped plume of high O3 exceeding 108 ppbv is transported downward to 500 hPa. A pool of O3 with concentrations higher than 90 ppbv appears above the boundary layer. However, the vertical distribution characteristics of O3S indicate that SIs have a relatively limited impact on the high concentrations of lower tropospheric O3 in Yunnan and Myanmar. In comparison with the distribution of PM2.5 and CO, both CO01 and O3 in Yunnan exhibit high-value areas at 900 hPa, indicating that BB also plays a significant role in the accumulation of pollutants in this layer (Figure 6a,e). In Guangdong, the intensity of SIs is relatively weak, with less than 30 ppbv O3S transported to the troposphere. In addition, topography may be another factor influencing the contribution of SIs in Yunnan. The higher altitude facilitates the transport of stratospheric O3 to the surface layer.
Notably, unlike the vertical distribution of pollutants in Yunnan and Myanmar, the pollutant hotspots in Guangdong were elevated in altitude but did not extend to the ground. Many studies have shown that there are two main reasons why these pollutant hotspots are elevated in altitude in Guangdong: the long-range horizontal transport of pollutants generated from BB in ICP and cross-latitudinal SI transport [26,35,61,62]. In our previous study, a strong inversion layer observed above the ABL blocked O3 from penetrating the boundary layer in Hong Kong. Under favorable atmospheric circulation conditions (i.e., Saddle Point or Col), O3 plumes can penetrate the boundary layer and affect the near-surface [21,26]. The differences between the WACCM-modeled O3 concentration and the AIRS measurements are primarily due to inaccuracies in the WACCM simulations and AIRS measurements. Firstly, limitations in the vertical resolution of the WACCM simulations and parameterization schemes hinder accurate depictions of atmospheric layer variations, leading to inaccuracies [63]. Secondly, the vertical satellite data are derived from O3 column concentrations, which may introduce errors during the inversion process. Therefore, more vertical observations need to be conducted to assess the WACCM simulation results and AIRS satellite data in the future [64].
Overall, our results indicate that SIs and cross-border BB transport are two major key mechanisms for determining spatiotemporal variations in PM2.5 and O3 in Yunnan during spring.

3.3. Mechanisms of SIs and Cross-Border BB Transport

Surface PM2.5 reaches its maximum in Xishuangbanna, Eastern Myanmar, Northern Laos, and Northwestern Vietnam and gradually decreases along the northeastern direction, as shown in Figure 5. As altitude increases, PM2.5 and O3 concentrations exhibit opposite trends. Owing to topographical effects, the influence of cross-border BB transport is limited in higher-altitude areas. Conversely, the vertical downward transport of O3 from the stratosphere is more likely to reach the surface layer in higher-altitude regions, resulting in an increase in O3 concentrations with elevation. As mentioned in the previous section, cross-border BB transport may exacerbate PM2.5 pollution in Yunnan during the spring.
Figure 8 shows pressure–longitude cross-sections along 23°N and 26°N for averaged PM2.5 and vertical circulation in spring from 2020 to 2023. Owing to the impact of BB, high PM2.5 concentrates on the surface of Myanmar, with a value of 150 μg/m3. In Yunnan, the wind speed and elevation gradually increase from south to north. Vertically, surface PM2.5 concentrations decrease with increasing elevation. A stronger westerly jet transports PM2.5 to the downstream area, and the towering, mountainous terrain hinders further byproduct transport from BB. Therefore, Xishuangbanna, which has the lowest elevation in Yunnan and is closest to Myanmar, faces severe PM2.5 pollution challenges.
To further track potential sources of PM2.5 pollution in Yunnan, the PSCF and CWT approaches embedded in the HYSPLIT model were used to track air pollutant source areas for the target cities, Kunming and Xishuangbanna. A higher WPSCF value indicates a higher likelihood of the region being a potential PM2.5 source area. Figure 9a shows that, for Xishuangbanna, regions with WPSCF values greater than 0.4 are primarily located in Myanmar, covering nearly half of the country’s area. Additionally, in the central part of Myanmar, the WPSCF value exceeds 0.6. This suggests that Myanmar is a substantial potential source area for PM2.5 in Xishuangbanna, confirming the significant impact of cross-border BB transport on PM2.5. Compared with Xishuangbanna, the impact of cross-border BB transport on Kunming is much smaller. The high-WPSCF-value areas for Kunming are mainly located in the southwestern region of Yunnan province (Figure 9b). Figure 9c,d show that the high-value WCWT areas are consistent with those for WPSCF. In spring, Myanmar serves as a potential source area for Xishuangbanna, with PM2.5 contributions reaching 40–55 μg/m3. Meanwhile, the PM2.5 contribution to Kunming mainly falls within a range of 20–40 μg/m3, with high-value areas primarily located in the southwestern region of Yunnan province and at the southwestern border of Yunnan with Myanmar. The spatial heterogeneity of WPSCF and WCWT between Xishuangbanna and Kunming is essentially driven by the difference in elevation (1.1 km for Xishuangbanna and 2.0 km for Kunming).
To further evaluate the relative SI contribution, we analyzed the horizontal distribution characteristics of the O3S/O3 ratio at different altitudes, which is used to describe the percentage of O3 transported from the stratosphere to different levels. At a certain level, a higher ratio value of O3S/O3 signifies the greater impact of SI on O3 concentrations at this level. Figure 10 shows that the O3S/O3 ratio increases with altitude, which is consistent with the SI characteristics. At 713 hPa and 512 hPa, an O3S/O3 hotspot can be seen over Northwest Yunnan, which agrees with the topographic feature, as shown in Figure 1b. In the higher troposphere (i.e., 303 hPa), the ratio exhibits a zonal distribution, increasing with higher latitudes. On the one hand, the tropopause height decreases with increasing latitude. On the other hand, the tropopause folding frequency demonstrates a similar zonal distribution, which provides favorable dynamic conditions for SIs (Figure S5). Owing to the significant influence of the Qinghai–Tibet Plateau’s topography, hot spots are centered in the northwest part of Yunnan. Therefore, the complex terrain of the Yunnan region will have a significant impact on pollutant transport, exerting opposing effects on SIs and cross-border BB transport.

3.4. Relationships between Topography and Air Pollutants

As discussed above, topography has a significant impact on pollutant transport in Yunnan. Thus, we expect that topography has a close relationship with O3 and PM2.5, which are examined in this section.
To explore the influence of topography, we analyzed the relationships between altitude and anomalous values of individual pollutant values during various months (February–May) over Yunnan and Myanmar. The altitudes in Yunnan and Myanmar vary significantly. Yunnan has an average elevation of 2.3 km and a diverse internal topography, while Myanmar features predominantly gentle terrain, with most areas situated at elevations below 1 km. Figure 11 shows a strong negative relationship between altitude and anomalous PM2.5 in Yunnan with an R higher than 0.67, which indicates that the effect of cross-border transport is gradually weakened by increasing altitude. In comparison, the connection between altitude and the cross-border transport impacts of BB in Myanmar is not prominently evident. This is primarily due to the lower altitudes in Myanmar and the predominantly local sources of BB. The significant negative correlation between CO (CO01) and altitude further substantiates the substantial impact of cross-border BB transport on air quality in Yunnan (Figure S6). The significant positive correlation between O3S and altitude in Yunnan indicates that stratospheric O3-enriched air is more readily transported downward to reach high-altitude cities. At the same time, the differences in R and slope between different months also prove the varying intensity of the influence of SIs and cross-border BB transport on PM2.5 and O3 at different altitudes. Areas at lower altitudes are more susceptible to PM2.5 impacts from horizontal transport because of BB, while higher-altitude regions are more influenced by vertical O3 transport from SIs.
Owing to the severe polluted status in March–April, we calculated the averaged March–April PM2.5, O3, and O3S concentrations from 2020 to 2023 for 16 cities in Yunnan. We then sorted them by altitude, from highest to lowest (Figure 12). A close link between O3, O3S, PM2.5, and topography was found. As the altitude decreases, there is a significant increase in PM2.5 concentration and a decrease in the proportion of O3S. Under the influence of topography, SIs can contribute 8–31 ppbv to surface O3 in these cities. Notably, Xishuangbanna, the closest city in Yunnan to BB sites, has a further higher PM2.5 (close to 300 μg/m3) than other cities (100–200 μg/m3), resulting from cross-border BB transport.
It should be noted that the WACCM products cannot directly track the impact of cross-border BB transport on O3. Therefore, it is not possible to calculate the quantitative contribution of cross-border BB transport using WACCM data. Furthermore, the less significant trends observed in O3 and O3S can be attributed to the absence of constraints on surface O3 and O3S in the simulation results. As a workaround, O3 and O3S from levels close to surface pressure were used as substitutes for surface concentrations.

4. Discussion

Currently, Yunnan province faces severe PM2.5 and O3 pollution in the spring. A comprehensive analysis of MODIS and AIRS satellite data over the past 21 years has revealed the presence of two atmospheric pollutant transport processes associated with springtime in Yunnan, specifically SIs and BB. The implementation of APCAAP in 2013 led to a reduction in local emissions, amplifying the relative contribution of two unique transport processes during springtime.
In this study, we focused on assessing the impact of SIs and BB on O3 and PM2.5 during the spring season in Yunnan. Two factors affecting SIs and cross-border BB transport were identified: the prevalent southwest winds and complex topographical conditions. Yunnan is situated in the downwind region of Myanmar and features complex terrain. This unique geographical position provides an ideal environment for SIs and the cross-border transport of BB emissions, allowing PM2.5 and O3 from Myanmar to be transported to Yunnan. The complex topography within Yunnan, with higher elevations in the north and lower elevations in the south, facilitates the easier transport of PM2.5 to border cities with lower elevations, such as Xishuangbanna. Cities farther from Myanmar, owing to higher elevations, obstruct some PM2.5 transport, weakening cross-border BB transport and resulting in the spatial distribution of PM2.5 concentrations decreasing with elevation.
High-frequency tropopause folding in Yunnan provides favorable dynamic conditions for SIs. The distribution of O3 and O3S exhibits a northwest-southeast trend similar to the terrain. This can be partly attributed to the higher tropopause folding frequency in the northwest, influenced by the Qinghai–Tibet Plateau, as well as the high-altitude terrain in the northwest, which facilitates the transport of stratospheric O3 to the surface. The contribution of SIs to surface O3 in Yunnan’s cities ranges from 6 to 31 ppbv, accounting for 10% to 38% of surface O3.
Notably, these two unique natural processes in Yunnan contribute differently to surface O3 and PM2.5 concentrations during springtime. SIs are solely responsible for the downward transport of stratospheric O3, thereby contributing to surface O3 pollution. High-altitude sites are more susceptible to the effects of SIs, as evidenced by the positive correlation between O3S and altitude. Conversely, the cross-border BB transport affects both O3 and PM2.5 concentrations through the transport of PM2.5, O3, and O3 precursors. The impact of cross-border BB transport on O3 and PM2.5 decreases with increasing altitude owing to topographic obstruction, as indicated by the negative correlation between altitude and O3 as well as PM2.5. Moreover, it should be noted that in addition to the processes mentioned above (see also [65]), the temporal evolution of the tropopause height (e.g., foldings) exhibits persistent behavior (memory effect). This means that a small fluctuation in the past is followed by a drastically enhanced fluctuation in the future. The response time varies from 4 months to 6 years [66]. This behavior has also been found in surface O3, PM2.5, and AOD [67].
This study underscores the significant regulatory role of SIs and cross-border BB transport as non-local emissions on local PM2.5 and O3 pollution in Yunnan, which will pose a substantial challenge for policymakers in the future. Hence, we recommend that the impact of these two distinct natural transport processes be taken into consideration when formulating local emission reduction strategies. It is essential to comprehensively consider the influence of terrain conditions on pollutant transport in cities at different altitudes.

Supplementary Materials

The following supporting information can be downloaded at: https://www.mdpi.com/article/10.3390/rs16132409/s1, Figure S1: Time series of modeled and observed O3 (ppbv), PM2.5 (μg/m3) and AOD in various cities across Yunnan province; Figure S2: Box plots of observed (a) PM2.5 (μg/m3), (b) PM10 (μg/m3), (c) O3 (μg/m3) and (d) 550 nm AOD in different seasons from 2015 to 2023. The red lines depict the change in the annual mean of PM2.5, PM10 and AOD from 2015 to 2023; Figure S3: Scatter plots and linear fitting lines between AOD and (a) PM2.5 (μg/m3), (b) PM10 (μg/m3) in various seasons from 2015 to 2023 in Yunnan; Figure S4: Backward trajectory clusters identified by HYSPLIT simulations in different target cities: (a) Xishuangbanna and (b) Kunming in spring from 2020 to 2023; Figure S5: Spatial distribution of tropopause folding frequency in spring from 2001 to 2019; Figure S6: Scatter plots and liner fitting lines between (a,c) CO (ppbv) and (b,d) CO01 (ppbv) from February to May in (a,b) Yunnan and (c,d) Myanmar; Table S1: Statistical evaluation of monthly averaged O3, PM2.5 and AOD concentration.

Author Contributions

Conceptualization, P.L. and K.Z.; methodology, P.L.; software, P.L.; validation, K.Z.; formal analysis, P.L. and K.Z.; investigation, P.L. and K.Z.; resources, P.L.; data curation, P.L.; writing—original draft preparation, P.L.; writing—review and editing, K.Z. and Z.Y.; visualization, Z.Y.; supervision, Z.Y.; project administration, K.Z.; funding acquisition, Z.Y. and K.Z. All authors have read and agreed to the published version of the manuscript.

Funding

This research was funded by National Natural Science Foundation of China, grant number 42105164; The Key-Area Research and Development Program of Guangdong Province, grant number 2020B1111360003; The Open Research Fund Program of Plateau Atmosphere and Environment Key Laboratory of Sichuan Province, grant number PAEKL-2024-K01; Yunnan Science and Technology Department Youth Project 202401AU070202; Guangdong Basic and Applied Basic Research Foundation, grant number 2022A1515011078; Xianyang key research and development program, grant number L2022ZDYFSF040.

Data Availability Statement

The original contributions presented in the study are included in the article and supplementary material, further inquiries can be directed to the corresponding author.

Acknowledgments

We thank NASA for providing datasets of MODIS and AIRS. We also thank NCAR for providing datasets of WACCM.

Conflicts of Interest

The authors declare no conflicts of interest. The funders had no role in the design of the study; in the collection, analyses, or interpretation of data; in the writing of the manuscript; or in the decision to publish the results.

References

  1. Shao, T.; Wang, P.; Yu, W.; Gao, Y.; Zhu, S.; Zhang, Y.; Hu, D.; Zhang, B.; Zhang, H. Drivers of alleviated PM2.5 and O3 concentrations in China from 2013 to 2020. Resour. Conserv. Recycl. 2023, 197, 107110. [Google Scholar] [CrossRef]
  2. Wang, N.; Lyu, X.; Deng, X.; Huang, X.; Jiang, F.; Ding, A. Aggravating O(3) pollution due to NO(x) emission control in eastern China. Sci. Total Environ. 2019, 677, 732–744. [Google Scholar] [CrossRef] [PubMed]
  3. van Zelm, R.; Preiss, P.; van Goethem, T.; Van Dingenen, R.; Huijbregts, M. Regionalized life cycle impact assessment of air pollution on the global scale: Damage to human health and vegetation. Atmos. Environ. 2016, 134, 129–137. [Google Scholar] [CrossRef]
  4. Belis, C.A.; Van Dingenen, R.; Klimont, Z.; Dentener, F. Scenario analysis of PM(2.5) and ozone impacts on health, crops and climate with TM5-FASST: A case study in the Western Balkans. J. Environ. Manag. 2022, 319, 115738. [Google Scholar] [CrossRef] [PubMed]
  5. Zhang, Y.; Yang, Y.; Zhang, L.; Xu, H.; Sun, J.; Wang, T.; Li, F.; Chang, X.; Ho, S.S.H.; Li, B.; et al. Insight into the contributions of primary emissions of sulfate, nitrate, and ammonium from residential solid fuels to ambient PM2.5. Atmos. Res. 2023, 290, 106790. [Google Scholar] [CrossRef]
  6. Yu, X.; Zhang, Y.; Liu, N.; Yang, S. Characteristics of Secondary PM2.5 Under Different Photochemical Reactivity Backgrounds in the Pearl River Delta Region. Front. Environ. Sci. 2022, 10, 837158. [Google Scholar] [CrossRef]
  7. Hughes, D.D.; Christiansen, M.B.; Milani, A.; Vermeuel, M.P.; Novak, G.A.; Alwe, H.D.; Dickens, A.F.; Pierce, R.B.; Millet, D.B.; Bertram, T.H.; et al. PM2.5 chemistry, organosulfates, and secondary organic aerosol during the 2017 Lake Michigan Ozone Study. Atmos. Environ. 2021, 244, 117939. [Google Scholar] [CrossRef]
  8. Xie, Y.; Liu, Z.; Wen, T.; Huang, X.; Liu, J.; Tang, G.; Yang, Y.; Li, X.; Shen, R.; Hu, B.; et al. Characteristics of chemical composition and seasonal variations of PM(2.5) in Shijiazhuang, China: Impact of primary emissions and secondary formation. Sci. Total Environ. 2019, 677, 215–229. [Google Scholar] [CrossRef] [PubMed]
  9. Yang, W.; Chen, H.; Wu, J.; Wang, W.; Zheng, J.; Chen, D.; Li, J.; Tang, X.; Wang, Z.; Zhu, L.; et al. Characteristics of the source apportionment of primary and secondary inorganic PM(2.5) in the Pearl River Delta region during 2015 by numerical modeling. Environ. Pollut. 2020, 267, 115418. [Google Scholar] [CrossRef] [PubMed]
  10. Song, X.; Jia, J.; Wu, F.; Niu, H.; Ma, Q.; Guo, B.; Shao, L.; Zhang, D. Local emissions and secondary pollutants cause severe PM(2.5) elevation in urban air at the south edge of the North China Plain: Results from winter haze of 2017-2018 at a mega city. Sci. Total Environ. 2022, 802, 149630. [Google Scholar] [CrossRef] [PubMed]
  11. Chen, C.; Qiu, Y.; Xu, W.; He, Y.; Li, Z.; Sun, J.; Ma, N.; Xu, W.; Pan, X.; Fu, P.; et al. Primary Emissions and Secondary Aerosol Processing During Wintertime in Rural Area of North China Plain. J. Geophys. Res. Atmos. 2022, 127, e2021JD035430. [Google Scholar] [CrossRef]
  12. Jin, X.; Cai, X.; Yu, M.; Song, Y.; Wang, X.; Kang, L.; Zhang, H. Diagnostic analysis of wintertime PM2.5 pollution in the North China Plain: The impacts of regional transport and atmospheric boundary layer variation. Atmos. Environ. 2020, 224, 117346. [Google Scholar] [CrossRef]
  13. Xiao, Z.; Miao, Y.; Du, X.; Tang, W.; Yu, Y.; Zhang, X.; Che, H. Impacts of regional transport and boundary layer structure on the PM2.5 pollution in Wuhan, Central China. Atmos. Environ. 2020, 230, 117508. [Google Scholar] [CrossRef]
  14. Shan, M.; Wang, Y.; Lu, Y.; Liang, C.; Wang, T.; Li, L.; Li, R.Y.-M. Uncovering PM2.5 transport trajectories and sources at district within city scale. J. Cleaner Prod. 2023, 423, 138608. [Google Scholar] [CrossRef]
  15. Zhao, S.; Yu, Y.; Qin, D.; Yin, D.; Dong, L.; He, J. Analyses of regional pollution and transportation of PM2.5 and ozone in the city clusters of Sichuan Basin, China. Atmos. Pollut. Res. 2019, 10, 374–385. [Google Scholar] [CrossRef]
  16. Yang, Q.; Zhao, T.; Tian, Z.; Kumar, K.R.; Chang, J.; Hu, W.; Shu, Z.; Hu, J. The Cross-Border Transport of PM2.5 from the Southeast Asian Biomass Burning Emissions and Its Impact on Air Pollution in Yunnan Plateau, Southwest China. Remote Sens. 2022, 14, 1886. [Google Scholar] [CrossRef]
  17. Zhang, Z.; Wang, X.; Cheng, S.; Guan, P.; Zhang, H.; Shan, C.; Fu, Y. Investigation on the difference of PM2.5 transport flux between the North China Plain and the Sichuan Basin. Atmos. Environ. 2022, 271, 118922. [Google Scholar] [CrossRef]
  18. Luo, Y.; Wei, H.; Yang, K. The impact of biomass burning occurred in the Indo-China Peninsula on PM2.5 and its spatiotemporal characteristics over Yunnan Province. Sci. Total Environ. 2024, 908, 168185. [Google Scholar] [CrossRef] [PubMed]
  19. Lupaşcu, A.; Otero, N.; Minkos, A.; Butler, T. Attribution of surface ozone to NOx and volatile organic compound sources during two different high ozone events. Atmos. Chem. Phys. 2022, 22, 11675–11699. [Google Scholar] [CrossRef]
  20. Kang, M.; Zhang, H.; Ying, Q. Enhanced summertime background ozone by anthropogenic emissions—Implications on ozone control policy and health risk assessment. Atmos. Environ. 2023, 314, 120116. [Google Scholar] [CrossRef]
  21. Zhao, K.; Huang, J.; Wu, Y.; Yuan, Z.; Wang, Y.; Li, Y.; Ma, X.; Liu, X.; Ma, W.; Wang, Y.; et al. Impact of Stratospheric Intrusions on Ozone Enhancement in the Lower Troposphere and Implication to Air Quality in Hong Kong and Other South China Regions. J. Geophys. Res. Atmos. 2021, 126, e2020JD033955. [Google Scholar] [CrossRef]
  22. Hu, F.; Xie, P.; Tian, X.; Xu, J.; Li, A.; Lupascu, A.; Butler, T.; Hu, Z.; Lv, Y.; Zhang, Z.; et al. Integrated analysis of the transport process and source attribution of an extreme ozone pollution event in Hefei at different vertical heights: A case of study. Sci. Total Environ. 2024, 906, 167237. [Google Scholar] [CrossRef] [PubMed]
  23. Wang, X.; Zhang, H.; Hong, X.; Xiang, Y.; Wang, S.; Zhang, T.; Qin, Z.; Ou, J. Vertical profiles and regional transport of ozone in typical area of Yangtze-Huaihe River Basin during the autumn base on multiple lidars. Atmos. Pollut. Res. 2024, 15, 101983. [Google Scholar] [CrossRef]
  24. Li, D.; Bian, J.; Fan, Q. A deep stratospheric intrusion associated with an intense cut-off low event over East Asia. Sci. China Earth Sci. 2014, 58, 116–128. [Google Scholar] [CrossRef]
  25. Bartusek, S.; Wu, Y.; Ting, M.; Zheng, C.; Fiore, A.; Sprenger, M.; Flemming, J. Higher-Resolution Tropopause Folding Accounts for More Stratospheric Ozone Intrusions. Geophys. Res. Lett. 2023, 50, e2022GL101690. [Google Scholar] [CrossRef]
  26. Zhao, K.; Hu, C.; Yuan, Z.; Xu, D.; Zhang, S.; Luo, H.; Wang, J.; Jiang, R. A modeling study of the impact of stratospheric intrusion on ozone enhancement in the lower troposphere over the Hong Kong regions, China. Atmos. Res. 2021, 247, 105158. [Google Scholar] [CrossRef]
  27. Phanikumar, D.V.; Niranjan Kumar, K.; Bhattacharjee, S.; Naja, M.; Girach, I.A.; Nair, P.R.; Kumari, S. Unusual enhancement in tropospheric and surface ozone due to orography induced gravity waves. Remote Sens. Environ. 2017, 199, 256–264. [Google Scholar] [CrossRef]
  28. Liu, C.; He, C.; Wang, Y.; He, G.; Liu, N.; Miao, S.; Wang, H.; Lu, X.; Fan, S. Characteristics and mechanism of a persistent ozone pollution event in Pearl River Delta induced by typhoon and subtropical high. Atmos. Environ. 2023, 310, 119964. [Google Scholar] [CrossRef]
  29. Ding, H.; Kong, L.; You, Y.; Mao, J.; Chen, W.; Chen, D.; Chang, M.; Wang, X. Effects of tropical cyclones with different tracks on ozone pollution over the Pearl River Delta region. Atmos. Res. 2023, 286, 106680. [Google Scholar] [CrossRef]
  30. Shu, Z.; Zhao, T.; Chen, Y.; Liu, Y.; Yang, F.; Jiang, Y.; He, G.; Yang, Q.; Zhang, Y. Terrain effect on atmospheric process in seasonal ozone variation over the Sichuan Basin, Southwest China. Environ. Pollut. 2023, 338, 122622. [Google Scholar] [CrossRef]
  31. Ali, M.A.; Huang, Z.; Bilal, M.; Assiri, M.E.; Mhawish, A.; Nichol, J.E.; de Leeuw, G.; Almazroui, M.; Wang, Y.; Alsubhi, Y. Long-term PM(2.5) pollution over China: Identification of PM(2.5) pollution hotspots and source contributions. Sci. Total Environ. 2023, 893, 164871. [Google Scholar] [CrossRef] [PubMed]
  32. Van Haver, P.; De Muer, D.; Beekmann, M.; Mancier, C. Climatology of tropopause folds at midlatitudes. Geophys. Res. Lett. 1996, 23, 1033–1036. [Google Scholar] [CrossRef]
  33. Zhu, J.; Xia, X.; Che, H.; Wang, J.; Zhang, J.; Duan, Y. Study of aerosol optical properties at Kunming in southwest China and long-range transport of biomass burning aerosols from North Burma. Atmos. Res. 2016, 169, 237–247. [Google Scholar] [CrossRef]
  34. Lin, C.-Y.; Hsu, H.-m.; Lee, Y.H.; Kuo, C.H.; Sheng, Y.-F.; Chu, D.A. A new transport mechanism of biomass burning from Indochina as identified by modeling studies. Atmos. Chem. Phys. 2009, 9, 7901–7911. [Google Scholar] [CrossRef]
  35. Zeng, X.; Li, S.; Xing, J.; Yang, J.; Wang, Q.; Song, G.; Teng, M.; Zhou, D.; Lu, J. CALIPSO-observed Southeast Asia biomass-burning influences on aerosol vertical structure in Guangdong-Hong Kong-Macao Greater Bay Area. Atmos. Res. 2023, 289, 106755. [Google Scholar] [CrossRef]
  36. Engel-Cox, J.A.; Holloman, C.H.; Coutant, B.W.; Hoff, R.M. Qualitative and quantitative evaluation of MODIS satellite sensor data for regional and urban scale air quality. Atmos. Environ. 2004, 38, 2495–2509. [Google Scholar] [CrossRef]
  37. Jin, X.; Holloway, T. Spatial and temporal variability of ozone sensitivity over China observed from the Ozone Monitoring Instrument. J. Geophys. Res. Atmos. 2015, 120, 7229–7246. [Google Scholar] [CrossRef]
  38. Midhuna, T.M.; Gharai, B.; Jose, S.; Rao, P.V.N. Study on Regional Variations of Aerosol Loading Using Long Term Satellite Data Over Indian Region. J. Indian Soc. Remote Sens. 2016, 45, 685–697. [Google Scholar] [CrossRef]
  39. Lee, E.; Županski, M.; Županski, D.; Park, S.K. Impact of the OMI aerosol optical depth on analysis increments through coupled meteorology–aerosol data assimilation for an Asian dust storm. Remote Sens. Environ. 2017, 193, 38–53. [Google Scholar] [CrossRef]
  40. Zhang, M.; Su, B.; Bilal, M.; Atique, L.; Usman, M.; Qiu, Z.; Ali, M.A.; Han, G. An Investigation of Vertically Distributed Aerosol Optical Properties over Pakistan Using CALIPSO Satellite Data. Remote Sens. 2020, 12, 2183. [Google Scholar] [CrossRef]
  41. Shaik, D.S.; Kant, Y.; Mitra, D.; Singh, A.; Chandola, H.C.; Sateesh, M.; Babu, S.S.; Chauhan, P. Impact of biomass burning on regional aerosol optical properties: A case study over northern India. J. Environ. Manag. 2019, 244, 328–343. [Google Scholar] [CrossRef] [PubMed]
  42. Stachlewska, I.; Samson, M.; Zawadzka, O.; Harenda, K.; Janicka, L.; Poczta, P.; Szczepanik, D.; Heese, B.; Wang, D.; Borek, K.; et al. Modification of Local Urban Aerosol Properties by Long-Range Transport of Biomass Burning Aerosol. Remote Sens. 2018, 10, 412. [Google Scholar] [CrossRef]
  43. Xiong, X.; Liu, X.; Wu, W.; Knowland, K.E.; Yang, Q.; Welsh, J.; Zhou, D.K. Satellite observation of stratospheric intrusions and ozone transport using CrIS on SNPP. Atmos. Environ. 2022, 273, 118956. [Google Scholar] [CrossRef]
  44. Liu, J.; Wang, S.; Yuan, Q.; Zhang, F.; Zhu, L. Vertical Profile of Ozone Derived from Combined MLS and TES Satellite Observations. Remote Sens. 2022, 14, 1588. [Google Scholar] [CrossRef]
  45. Ma, P.; Mao, H.; Zhang, J.; Yang, X.; Zhao, S.; Wang, Z.; Li, Q.; Wang, Y.; Chen, C. Satellite monitoring of stratospheric ozone intrusion exceptional events—A typical case of China in 2019. Atmos. Pollut. Res. 2022, 13, 101297. [Google Scholar] [CrossRef]
  46. Levy, R.C.; Mattoo, S.; Munchak, L.A.; Remer, L.A.; Sayer, A.M.; Patadia, F.; Hsu, N.C. The Collection 6 MODIS aerosol products over land and ocean. Atmos. Meas. Tech. 2013, 6, 2989–3034. [Google Scholar] [CrossRef]
  47. Sayer, A.M.; Hsu, N.C.; Bettenhausen, C.; Jeong, M.J.; Meister, G. Effect of MODIS Terra radiometric calibration improvements on Collection 6 Deep Blue aerosol products: Validation and Terra/Aqua consistency. J. Geophys. Res. Atmos. 2015, 120, 12157–12174. [Google Scholar] [CrossRef]
  48. Aumann, H.H.; Chahine, M.T.; Gautier, C.; Goldberg, M.D.; Kalnay, E.; McMillin, L.M.; Revercomb, H.; Rosenkranz, P.W.; Smith, W.L.; Staelin, D.H.; et al. AIRS/AMSU/HSB on the Aqua Mission: Design, Science Objectives, Data Products, and Processing Systems. IEEE Trans. Geosci. Remote Sens. 2003, 41, 253–264. [Google Scholar] [CrossRef]
  49. Wei, J.; Li, Z.; Peng, Y.; Sun, L. MODIS Collection 6.1 aerosol optical depth products over land and ocean: Validation and comparison. Atmos. Environ. 2019, 201, 428–440. [Google Scholar] [CrossRef]
  50. Polissar, A.V.; Hopke, P.K.; Harris, J.M. Source Regions for Atmospheric Aerosol Measured at Barrow, Alaska. Environ. Sci. Technol. 2001, 35, 4214–4226. [Google Scholar] [CrossRef] [PubMed]
  51. Ambient Air Quality Standards: GB 3095-2012; General Administration of Quality Supervision, Inspection and Quarantine of the People’s Republic of China, Standardization Administration of China. China Standards Press: Beijing, China, 2012.
  52. Chen, Y.; Li, D.; Karimian, H.; Wang, S.; Fang, S. The relationship between air quality and MODIS aerosol optical depth in major cities of the Yangtze River Delta. Chemosphere 2022, 308, 136301. [Google Scholar] [CrossRef] [PubMed]
  53. Jia, C.; Sun, L.; Zhang, X.; Wang, Y. Verification of Mcd19a2 Data and Study of Aerosol Characteristics in Beijing-Tianjin-Hebei Region. ISPRS Ann. Photogramm. Remote Sens. Spat. Inf. Sci. 2020, 3, 675–679. [Google Scholar] [CrossRef]
  54. Wang, J.; Zhao, B.; Wang, S.; Yang, F.; Xing, J.; Morawska, L.; Ding, A.; Kulmala, M.; Kerminen, V.M.; Kujansuu, J.; et al. Particulate matter pollution over China and the effects of control policies. Sci. Total Environ. 2017, 584–585, 426–447. [Google Scholar] [CrossRef] [PubMed]
  55. Kong, L.; Xin, J.; Zhang, W.; Wang, Y. The empirical correlations between PM2.5, PM10 and AOD in the Beijing metropolitan region and the PM2.5, PM10 distributions retrieved by MODIS. Environ. Pollut. 2016, 216, 350–360. [Google Scholar] [CrossRef]
  56. Xu, J.; Han, F.; Li, M.; Zhang, Z.; Du, X.; Wei, P. On the opposite seasonality of MODIS AOD and surface PM2.5 over the Northern China plain. Atmos. Environ. 2019, 215, 116909. [Google Scholar] [CrossRef]
  57. Chen, J.; Xin, J.; An, J.; Wang, Y.; Liu, Z.; Chao, N.; Meng, Z. Observation of aerosol optical properties and particulate pollution at background station in the Pearl River Delta region. Atmos. Res. 2014, 143, 216–227. [Google Scholar] [CrossRef]
  58. Weimer, M.; Kinnison, D.E.; Wilka, C.; Solomon, S. Effects of denitrification on the distributions of trace gas abundances in the polar regions: A comparison of WACCM with observations. Atmos. Chem. Phys. 2023, 23, 6849–6861. [Google Scholar] [CrossRef]
  59. Dong, J.; Zhang, X.; Zhan, N. Satellite-based estimates of high-resolution CO concentrations at ground level in the Yangtze River Economic Belt of China. Atmos. Environ. 2023, 312, 120018. [Google Scholar] [CrossRef]
  60. Liang, T.; Luo, J.; Zhang, C.; Tian, H.; Bai, Z.; Bian, J.; Wang, Z.; Luo, F.; Zhu, F.; Mao, L.; et al. The impact of tropopause fold event on surface ozone concentration over Tibetan Plateau in July. Atmos. Res. 2024, 298, 107156. [Google Scholar] [CrossRef]
  61. Jian, Y.; Fu, T.M. Injection heights of springtime biomass-burning plumes over peninsular Southeast Asia and their impacts on long-range pollutant transport. Atmos. Chem. Phys. 2014, 14, 3977–3989. [Google Scholar] [CrossRef]
  62. Zhao, K.; Chen, Y.; Lian, P.; Li, W.; Yang, F.; Zhang, X.; Yang, R. Impact of stratospheric intrusions on surface ozone enhancement in Hong Kong in the lower troposphere: Implications for ozone control strategy. Atmos. Environ. 2024, 329, 120539. [Google Scholar] [CrossRef]
  63. Lamarque, J.-F.; Kinnison, D.E.; Mills, M.J.; Marsh, D.R.; Calvo, N.; Polvani, L.M. Climate Change from 1850 to 2005 Simulated in CESM1(WACCM). J. Clim. 2013, 26, 7372–7391. [Google Scholar] [CrossRef]
  64. Rawat, P.; Naja, M.; Fishbein, E.; Thapliyal, P.K.; Kumar, R.; Bhardwaj, P.; Jaiswal, A.; Tiwari, S.N.; Venkataramani, S.; Lal, S. Performance of AIRS ozone retrieval over the central Himalayas: Use of ozonesonde and other satellite datasets. Atmos. Meas. Tech. 2023, 16, 889–909. [Google Scholar] [CrossRef]
  65. Varotsos, C.; Ondov, J.; Tzanis, C.; Öztürk, F.; Nelson, M.; Ke, H.; Christodoulakis, J. An observational study of the atmospheric ultra-fine particle dynamics. Atmos. Environ. 2012, 59, 312–319. [Google Scholar] [CrossRef]
  66. Varotsos, C.; Efstathiou, M.; Tzanis, C. Scaling behaviour of the global tropopause. Atmos. Chem. Phys. 2009, 9, 677–683. [Google Scholar] [CrossRef]
  67. Varotsos, C.; Efstathiou, M.; Tzanis, C.; Deligiorgi, D. On the limits of the air pollution predictability: The case of the surface ozone at Athens, Greece. Environ. Sci. Pollut. Res. Int. 2012, 19, 295–300. [Google Scholar] [CrossRef] [PubMed]
Figure 1. Elevation map of studied area: (a) the 16°–36°N, 85°–125°E region, (b) Yunnan province.
Remotesensing 16 02409 g001
Figure 2. MODIS satellite retrieval of 550 nm AOD over (a) Yunnan province and (b) the 16°–36°N, 85°–125°E region from 2003 to 2023. The red lines depict the change in the annual mean of AOD from 2003 to 2023. The black-dashed lines depict the average AOD from 2003 to 2023.
Remotesensing 16 02409 g002
Figure 3. AIRS satellite retrieval of averaged O3 (ppbv) vertical profiles for different months (spring: MAM, summer: JJA, autumn: SON, and winter: DJF) over (a) Yunnan province and (b) the 16°–36°N, 85°–125°E region from 2003 to 2023.
Remotesensing 16 02409 g003
Figure 4. (a) Pressure–longitude cross-sections across the range of latitudes within Yunnan and (b) pressure-latitude cross-sections across the range of longitudes within Yunnan for averaged O3 (ppbv) using data from the AIRS satellite dataset in spring from 2003 to 2023. The black boxes denote the location of Yunnan.
Remotesensing 16 02409 g004
Figure 5. Spatial distribution of averaged PM2.5 (μg/m3) at (a) surface, (b) 810 hPa, and (c) 713 hPa, and O3 (ppbv) at (d) 713 hPa, (e) 512 hPa, and (f) 303 hPa using data from WACCM over Yunnan in spring from 2020 to 2023.
Remotesensing 16 02409 g005
Figure 6. Temporal vertical profiles of averaged (ac) PM2.5 (μg/m3), (df) CO, and (gi) CO01 (ppbv) using data from WACCM over (a,d,g) Yunnan, (b,e,h) Myanmar, and (c,f,i) Guangdong from 2020 to 2023.
Remotesensing 16 02409 g006
Figure 7. Temporal vertical profiles of averaged (ac) O3 (ppbv) and (df) O3S (ppbv) using data from WACCM over (a,d) Yunnan, (b,e) Myanmar, and (c,f) Guangdong from 2020 to 2023.
Remotesensing 16 02409 g007
Figure 8. Pressure–longitude cross-sections along (a) 26°N and (b) 23°N for averaged PM2.5 (μg/m3) and vertical circulation using data from WACCM in spring from 2020 to 2023. The grey areas represent the altitude. The black boxes denote the location of Yunnan.
Remotesensing 16 02409 g008
Figure 9. (a,b) Analysis of potential PM2.5 source area from the surface in spring from 2020 to 2023 in different target cities: (a) Xishuangbanna; (b) Kunming. (c,d) Weight analysis of PM2.5 concentrations (μg/m3) in spring from 2020 to 2023 in different target cities: (c) Xishuangbanna; (d) Kunming.
Remotesensing 16 02409 g009
Figure 10. Spatial distribution of averaged O3S/O3 (%) using data from WACCM at (a) 713 hPa, (b) 512 hPa, and (c) 303 hPa over Yunnan in spring from 2020 to 2023.
Remotesensing 16 02409 g010
Figure 11. Scatter plots and linear fitting lines between altitude and (a,d) PM2.5 (μg/m3), (b,e) O3 (ppbv), (c,f) O3S (ppbv) from February to May in (ac) Yunnan and (df) Myanmar.
Remotesensing 16 02409 g011
Figure 12. Averaged PM2.5 (μg/m3), O3 (ppbv), and O3S (ppbv) concentrations of 16 cities in Yunnan from March to April.
Remotesensing 16 02409 g012
Table 1. Specifications of MODIS and AIRS instruments.
Instrument/
Satellite
Wavelength BandsNumber of BandsSpectral ResolutionsTemporal ResolutionSpatial Resolution
MODIS/Aqua0.4–14.4 µmBands 1–19 and 260.4 µm to 2.2 µmMultiple times daily250 m, 500 m and 1000 m
Bands 20–25 and 27–363.66 µm to 14.4 µm
AIRS/Aqua0.4–15.4 µm2378 infrared channels649 to 1136 cm−1 (longwave)
1213 to 1613 cm−1 (midwave)
2181 to 2665 cm−1 (shortwave)
Twice daily1° × 1°
4 visible/near-infrared channels0.4 µm to 0.94 µm
Table 2. Attributes of the satellite datasets used in this study.
Instrument/
Satellite
Data ProviderData ProductTemporal ResolutionSpatial ResolutionParameters UsedReference
MODIS/AquaLAADSMYD04_L2Daily
(2003–2023)
10 km × 10 kmAOD
(550 nm)
(Levy et al., Sayer et al.) [46,47]
AIRS/AquaGESDISCAIRS3STM 7.0Monthly
(2003–2023)
1° × 1°O3 profile(Aumann et al.) [48]
Disclaimer/Publisher’s Note: The statements, opinions and data contained in all publications are solely those of the individual author(s) and contributor(s) and not of MDPI and/or the editor(s). MDPI and/or the editor(s) disclaim responsibility for any injury to people or property resulting from any ideas, methods, instructions or products referred to in the content.

