Abstract
The monitoring of Poyang Lake water area and storage changes using remote sensing and satellite gravimetry techniques is valuable for maintaining regional water resource security and addressing the challenges of global climate change. In this study, remote sensing datasets from Landsat images (Landsat 5, 7, 8 and 9) and three Gravity Recovery and Climate Experiment (GRACE) and Gravity Follow-on (GRACE-FO) mascon solutions were jointly used to evaluate the water area and storage changes in response to global and regional climate changes. The results showed that seasonal characteristics existed in the terrestrial water storage (TWS) and water area changes of Poyang Lake, with nearly no significant long-term trend, for the period from April 2002 to December 2022. Poyang Lake exhibited the largest water area in June and July every year and then demonstrated a downward trend, with relatively smaller water areas in January and November, confirmed by the estimated TWS changes. For the flood (August 2010) and drought (September 2022) events, the water area changes are 3032 km2 and 813.18 km2, with those estimated TWS changes 17.37 cm and −17.46 cm, respectively. The maximum and minimum Poyang Lake area differences exceeded 2700 km2. The estimated terrestrial water storage changes in Poyang Lake derived from the three GRACE/GRACE-FO mascon solutions agreed well, with all correlation coefficients higher than 0.92. There was a significant positive correlation higher than 0.75 between the area and TWS changes derived from the two independent monitoring techniques. Therefore, it is reasonable to conclude that combined remote sensing with satellite gravimetric techniques can better interpret the response of Poyang Lake to climate change from the aspects of water area and TWS changes more efficiently.
1. Introduction
As the largest freshwater lake in China, Poyang Lake plays an important role in regulating the water level of the Yangtze River and maintaining the ecological balance in the surrounding areas [1,2,3]. In recent years, the receding time of Poyang Lake has advanced and the water level has remained low for many years, which has caused problems such as water environment and water ecology deterioration [4,5,6]. In particular, a severe drought occurred in Jiangxi Province in 2022, the water level of Poyang Lake decreased due to drought, and parts of Poyang Lake became sandy. Poyang Lake has experienced frequent flooding in recent decades, with corresponding difficulty in predicting future floods. Thus, monitoring the dynamic changes in the water area and storage of Poyang Lake is important for evaluating the water body and the development and evolution of the environment and the quality of lives and property of people [7].
The monitoring of Poyang Lake water resource changes provides a sensitive indicator of global climate change, can help scientists better understand the impact of climate change on the hydrological cycle and provide valuable data for global climate change research. Various monitoring techniques, such as Landsat images [7,8,9], water level monitoring stations [7,10,11,12] and satellite gravimetry techniques [13,14], have been developed and used to study the water resources of Poyang Lake in terms of the water area, surface water level height and terrestrial water storage. At the early stages, multiple water level heights from monitoring stations were commonly used for the dynamic monitoring of Poyang Lake. For example, a severe prolonged drought occurred in 2006, when the water level at Duchang station remained below the historical minimum, while in 2023, the water level at Xingzi station in Poyang Lake once again decreased below the extremely low water level. Many scholars have employed water level data to analyze Poyang Lake water body changes, but this method cannot reveal the specific spatial location of water body changes and water level data are difficult to obtain.
With the rapid development of remote sensing technologies and the free availability of open-access satellite datasets, satellite imagery has provided a superior solution to traditional methods for monitoring surface water areas. Water body extraction from remote sensing images mainly depends on the spectral differences between water bodies and other features in different bands. Regarding water body extraction, there are many methods and scholars have widely conducted classification. Based on optical images, water body extraction methods can normally be divided into three categories: thresholding methods, classifier methods and automatic methods. Threshold segmentation is mainly based on the spectral characteristics of water. Frazier et al. [15] used a single band threshold to extract water bodies.
In addition, the development of satellite gravity technology such as Gravity Recovery and Climate Experiment (GRACE) and its successor, GRACE Follow-on (GRACE-FO) [16,17,18], have provided a new way to directly monitor the water mass changes related to changes in the Poyang Lake area to validate the estimated results derived from remote sensing images. By leveraging Landsat imagery and GRACE/GRACE-FO solutions, researchers can obtain a holistic understanding of the complex dynamics affecting Poyang Lake over two decades [19]. In this contribution, we monitored changes in the Poyang Lake area based on Landsat images together with GRACE/GRACE-FO solutions over the period from April 2002 to December 2022, which is valuable for sustainable water resource management and conservation efforts in the face of global environmental changes. The remainder of this paper is organized as follows: the study area, adopted datasets and processing methods are briefly described in Section 2. The results and analysis are presented in Section 3. Concluding remarks are outlined in Section 4.
2. Study Area, Employed Datasets and Processing Methods
2.1. Study Area
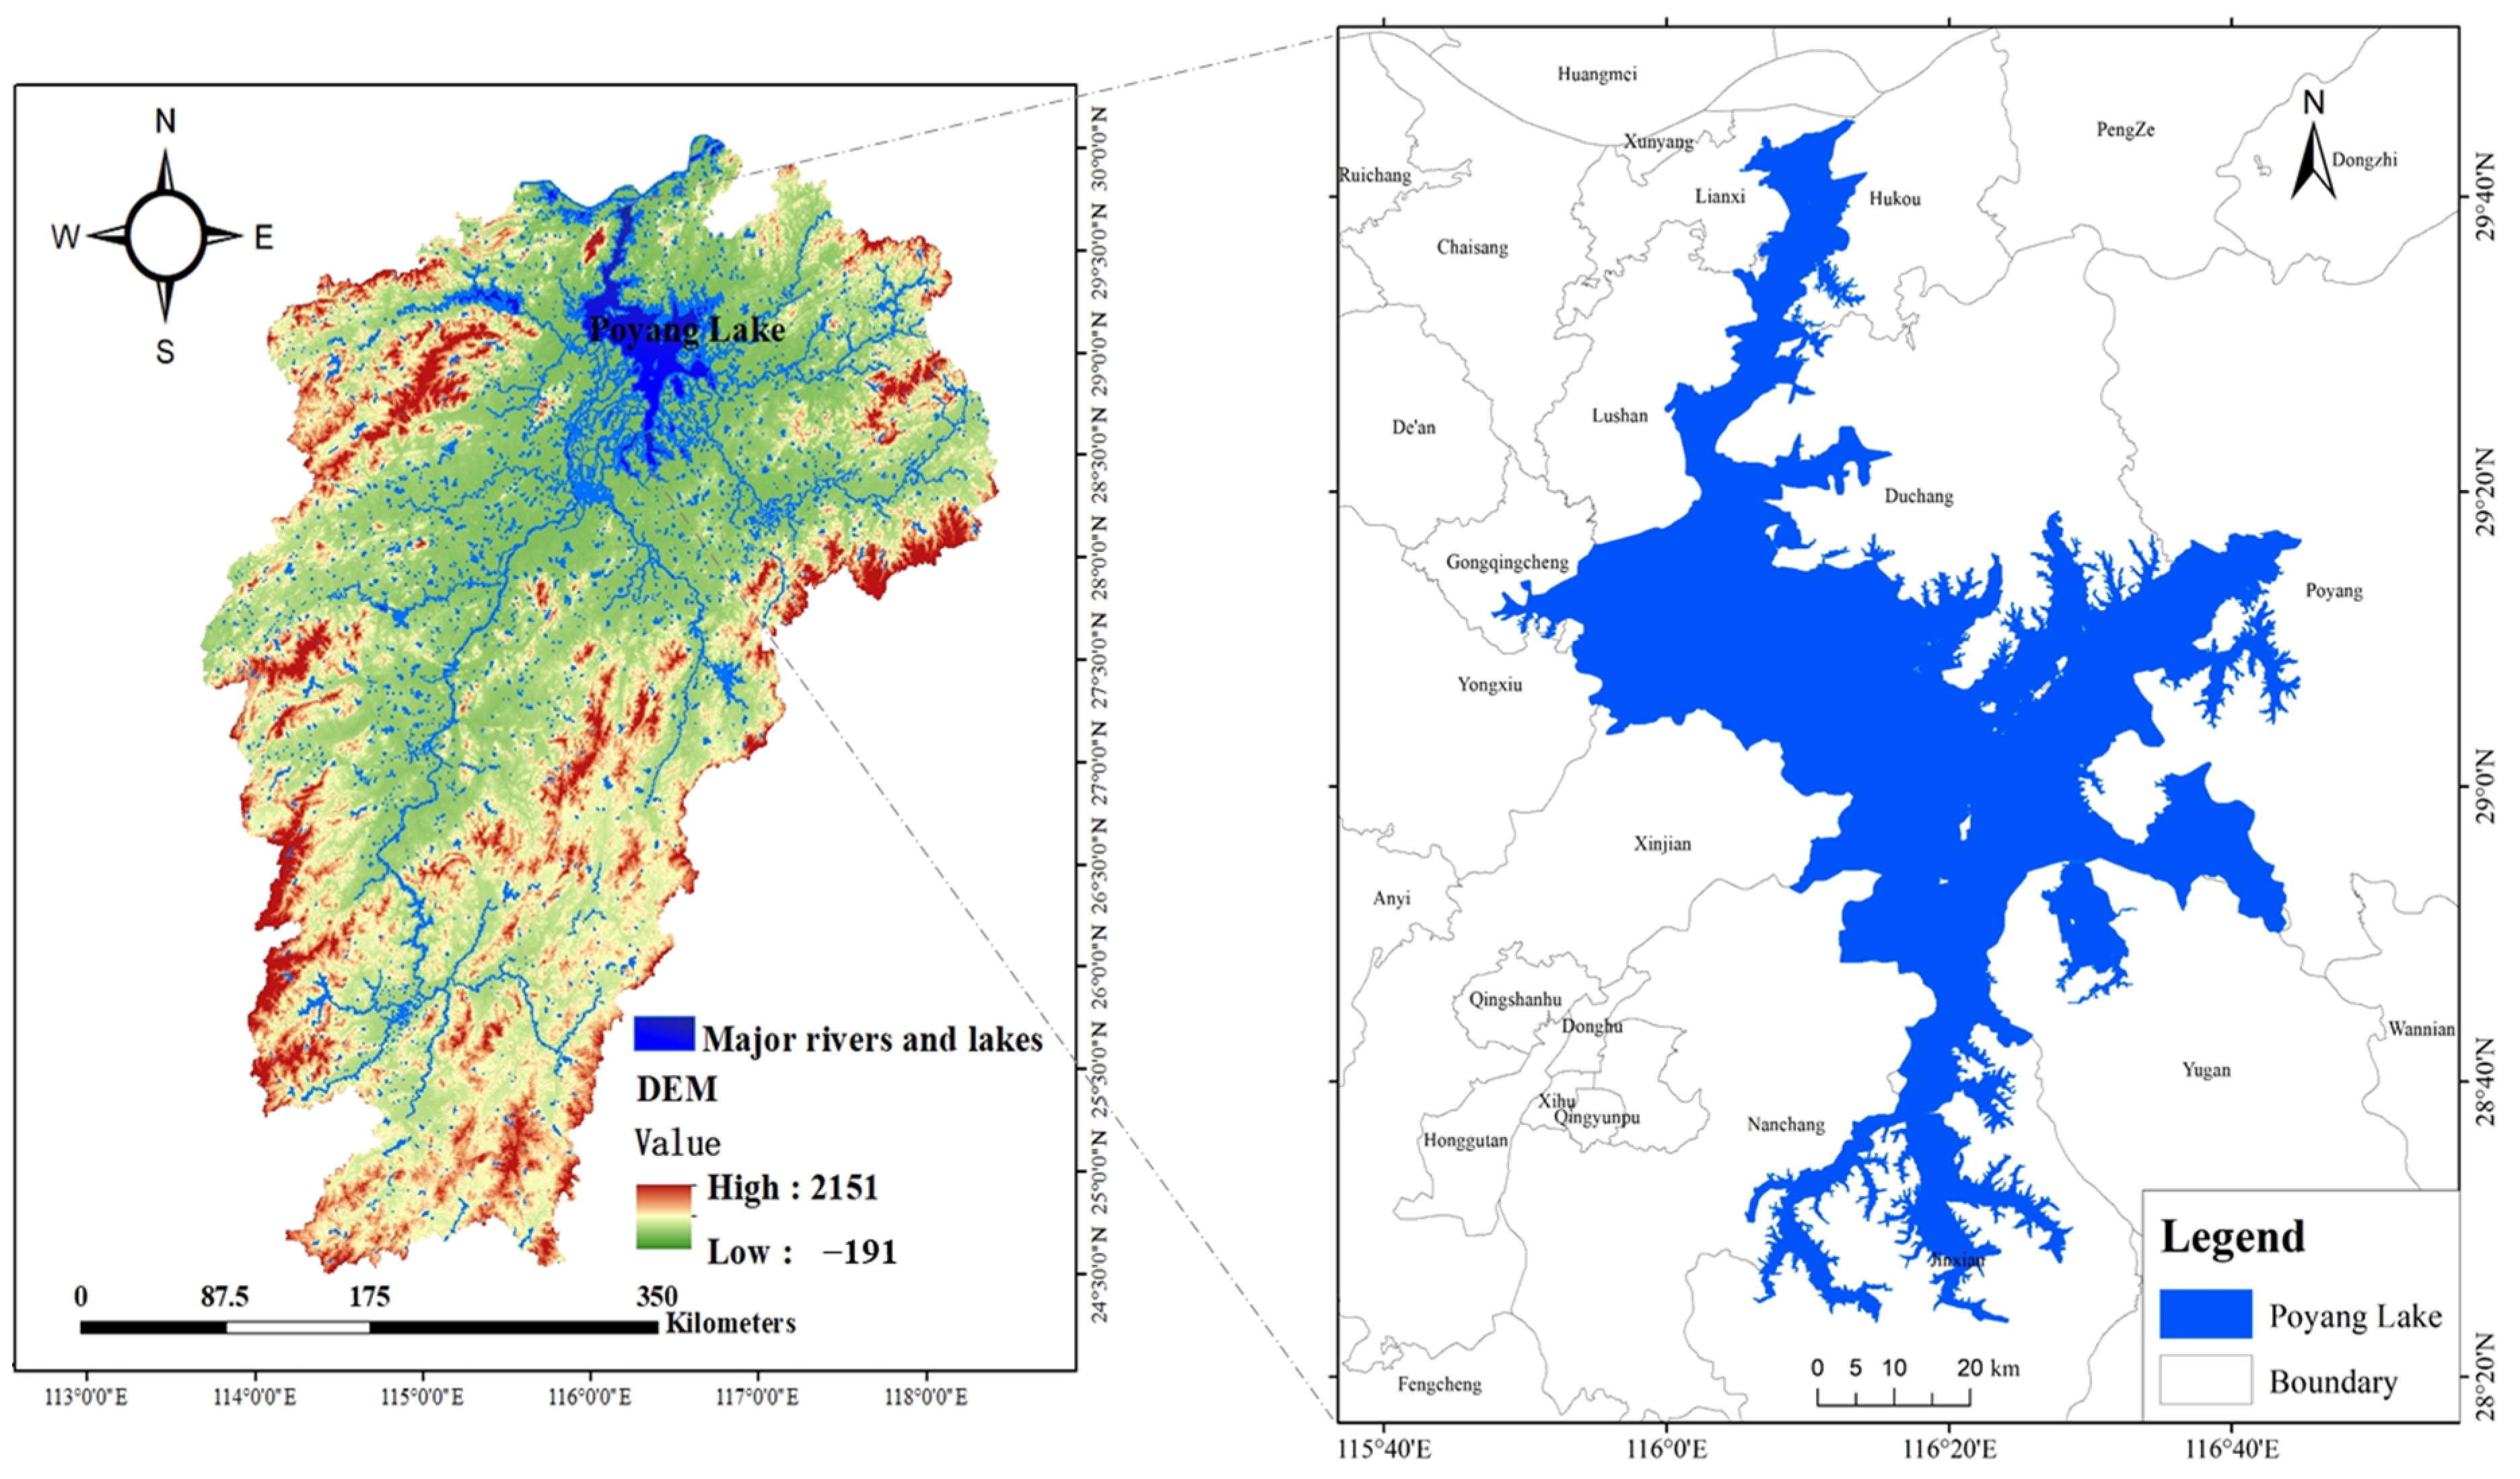
Poyang Lake is located in the northern part of Jiangxi Province (28°38′N~29°19′N and 115°43′E~116°29′E) on the southern bank of the middle and lower reaches of the Yangtze River (Figure 1). It is a typical river-connected lake, and the water body of the lake experiences remarkable seasonal variations due to the influence of the regional monsoon climate, which plays an important role in regulating the water level of the Yangtze River and maintaining the ecological balance in the surrounding areas. In recent years, Poyang Lake has experienced earlier recessions, prolonged low water levels and deterioration in the water environment and aquatic ecology. Therefore, monitoring the dynamic changes in the surface water area of Poyang Lake is important for determining the development and evolution of the water body and environment, as well as for ensuring the safety of the lives and property of people.

Figure 1.
Study region of Poyang Lake (revised from Huan et al. [20]).
2.2. Landsat Imagery and Processing Methods
The National Aeronautics and Space Administration (NASA, Washington, DC, USA) launched the first Landsat satellite in 1972 and, since then, eight satellites have been successfully launched. The Landsat 1–3 satellites are equipped with sensors such as the Multispectral Scanner (MSS), which records data across four spectral bands; the Landsat 4–7 satellites carry either Thematic Mapper (TM) or Enhanced Thematic Mapper (ETM+) sensors, which feature finer spatial resolution and increased radiometric resolution than those of the MSS; and the Landsat 8–9 satellites are equipped with the Operational Land Imager (OLI) or Operational Land Imager-2 (OLI-2) sensors, which augment the spectral resolution of the TM group with the addition of deep blue and Cirrus bands. This group also contains thermal infrared (TIRS) or thermal infrared-2 (TIRS-2) sensors on board, which serve as a second thermal band. To extract the water body data for Poyang Lake and monitor the dynamics in the study area over the past 20 years, Landsat images were downloaded from AI Earth (https://engine-aiearth.aliyun.com/ (accessed on 20 December 2023)) and the geospatial data cloud (http://www.gscloud.cn/search (accessed on 20 December 2023)) (Table 1).

Table 1.
Details of the employed datasets involved in the study.
The data preprocessing steps mainly included cutting the study area, performing radiometric correction and conducting atmospheric correction. The values in Landsat images are stored as digital numbers (DNs), which represent the electromagnetic radiation captured by their respective satellite sensors. Radiometric correction aims to convert the gray value of the image brightness into the absolute radiation brightness, which can be compared to that of images that have been subjected to the same level of correction across time or sensors. Atmospheric correction suggests that the total radiation brightness of the ground target measured by the sensor is not the true reflectance of the surface, which includes the radiation amount error caused by atmospheric absorption, especially scattering. Atmospheric correction is the process of eliminating the radiation errors caused by atmospheric influences and inverting the real surface reflectance of ground objects. Data preprocessing was conducted using ENVI 5.3 software.
2.3. GRACE and GRACE-FO Mascon Solutions
To improve the accuracy of GRACE/GRACE-FO observed mass change and reduce the land–ocean signal leakage, the GRACE (2002.4–2017.6) and GRACE-FO (2018.6–2022.12) RL06 mascon solutions from the CSR [21,22], the Jet Propulsion Laboratory (JPL) [23,24] and the Goddard Space Flight Center (GSFC) [25] were jointly used to estimate the change in terrestrial water storage (TWS) in Poyang Lake from April 2002 to December 2022. The degree-2 order-0 (C20) coefficients were all replaced with C20 solutions from GRACE/GRACE-FO Technical Note 14 [25]. Notably, degree-1 coefficient (Geocenter) corrections were added back using the estimates in GRACE/GRACE-FO Technical Note 13 [26]. All CSR, JPL and GSFC mascons values were corrected for the GIA using the ICE6G-D model [27]. Note that all the employed mascon datasets were interpolated to the same grid size and a 0.25° spatial resolution to better distinguish the boundaries and centered with the mean-field for this period. For the estimated regional mean TWS changes from three GRACE/GRACE-FO solutions and the water area change of Poyang Lake, the amplitudes of the annual and semiannual components and linear trends were coestimated by using the least-squares fitting approach; the corresponding uncertainties represent the least-squares fitting errors (1 sigma for the amplitudes, phases and linear trends).
3. Results and Analysis
3.1. Changes in the Water Area of Poyang Lake
Luminous blue variable (LBV) transformation is a universal optical remote sensing data transformation method proposed by Zeng [28]. Zhang et al. [7] introduced a new surface water extraction method, namely, the water extraction LBV (WE-LBV) method, in which the B and V bands are utilized to separate water from non-watery pixels and the B value of water pixels is far above the V value. The tasselled cap transformation (TCT) is a useful tool for compressing spectral data into a few bands with minimal information loss while still maintaining the associations with scene characteristics. Three axes, namely, brightness, greenness and wetness, were generated. According to the physical meaning of the TCT, the greenness and wetness components were characterized by the surface water content. The more water contained on the surface, the greater the wetness and the lower the greenness are. The wetness value of the water pixels is greater than the greenness value.
In this paper, first, we used the WE-LBV method to extract water bodies, and it was found that some paddy fields were extracted as water bodies. Therefore, we adopted a decision-tree-based water body detection method. Pixels meeting the following criteria were classified as water: brightness (B) > vegetation (V) and wetness > greenness. Moreover, the normalized difference water index (NDWI), modified normalized difference water index (MNDWI) and automated water extraction index (AWEI) were compared. The NDWI, proposed by Mcfeeters [29], is based on the normalized ratio index for the green and near-infrared bands and is generally employed to extract information on the water bodies in images [30]. Based on NDWI analysis, an improved normalized difference water index, namely, the MNDWI, was proposed to distinguish between shadows and water bodies, which overcomes the difficulty of eliminating shadows during water extraction [31,32]. The automated water extraction index is a multiple band index that suppresses the classification noise resulting from shadows and other non-water dark surfaces. Calculation equations are provided in Table 2.
Table 2.
Water body indices used for water feature extraction.
Since the data types employed in this paper include Landsat 5, 7, 8 and 9 data, each one was selected and used in performance analysis. To evaluate the performance of the four water extraction methods, first, unsupervised classification was conducted according to the Iterative Self-Organizing Data (ISODATA) analysis technique method and training samples were randomly generated according to the obviously correct classification of ground objects. In the unclassified areas, some training samples were manually selected and combined with Google Earth historical high-definition images. The overall accuracy (OA), omission rate (OR), commission rate (CR) and kappa coefficient (KC) were used for accuracy assessment (Table 3).
Table 3.
Statistical results of the overall accuracy (OA), omission rate (OR), commission rate (CR) and kappa coefficient (KC).
According to Table 3, the accuracy remained relatively stable among the various techniques and all the water extraction methods could achieve an overall water extraction accuracy greater than 90%. The kappa coefficient of the four methods was greater than 0.8. For all the image data, the decision tree method attained a greater overall accuracy and kappa coefficient than the other three methods, and it does not require a manually selected threshold, thus avoiding the effect of subjective human factors. Therefore, the decision tree method was chosen as the extraction method for the water body area of Poyang Lake over the period from April 2002 to December 2022.
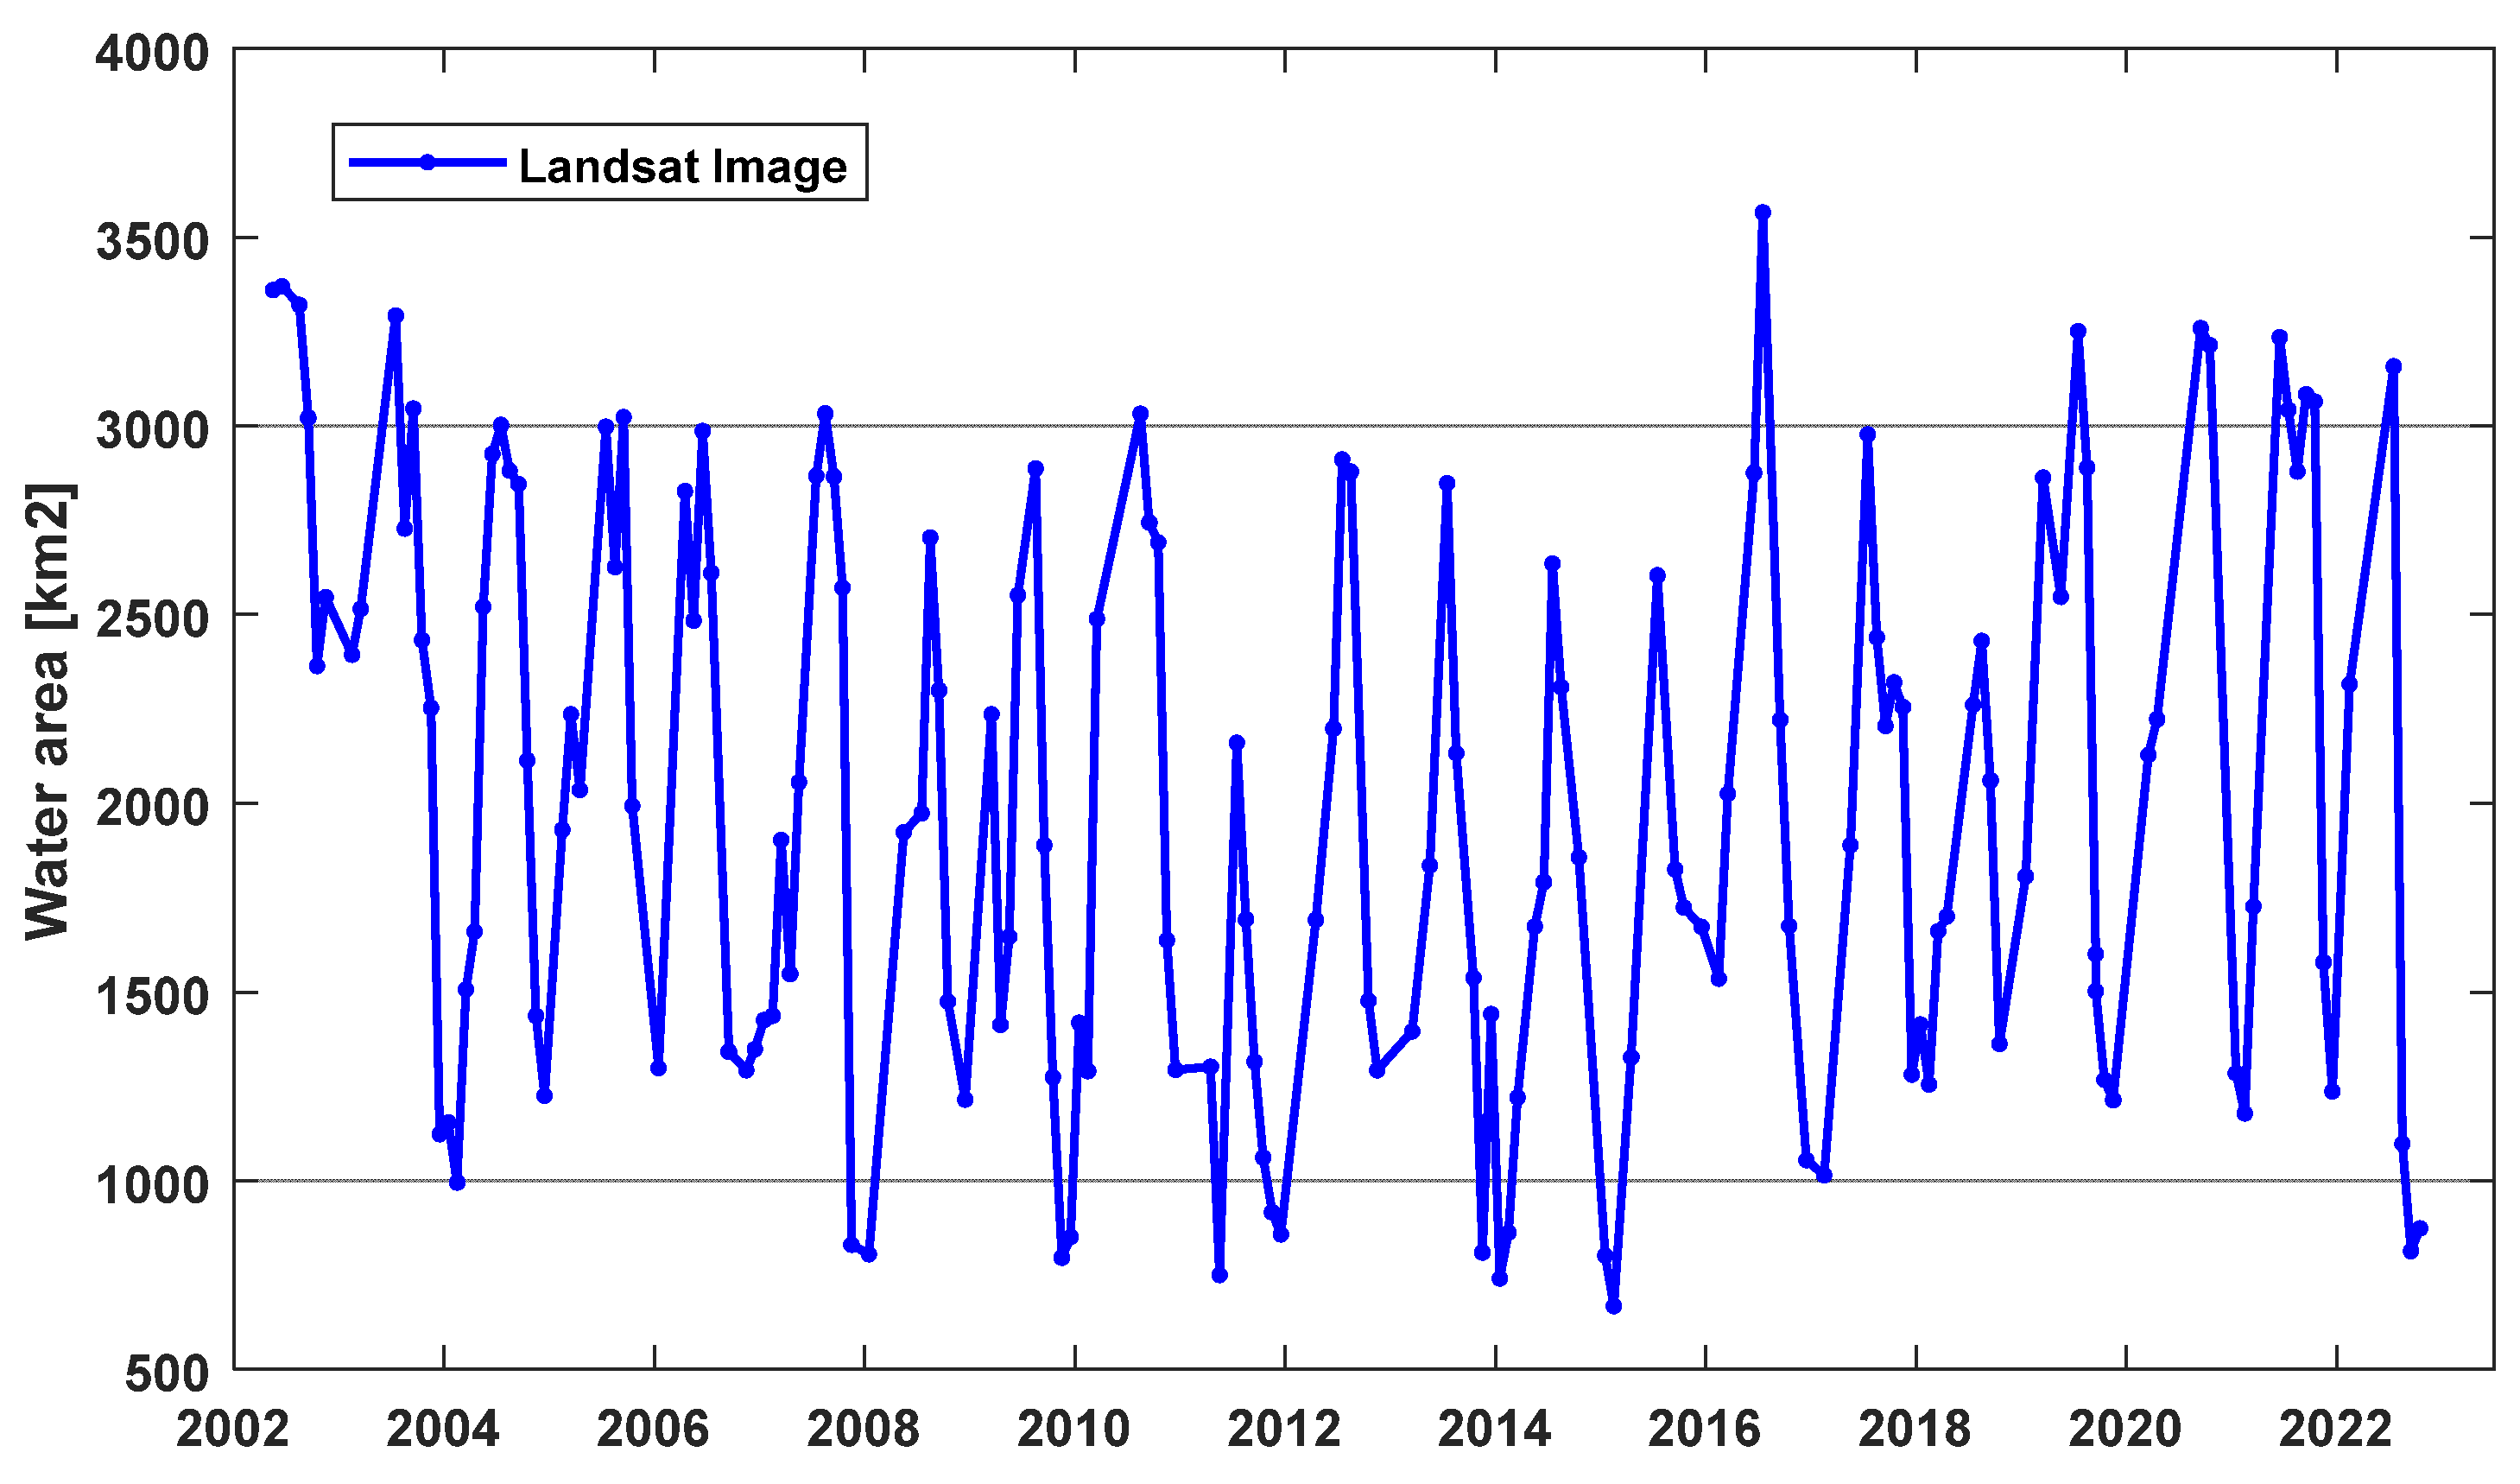
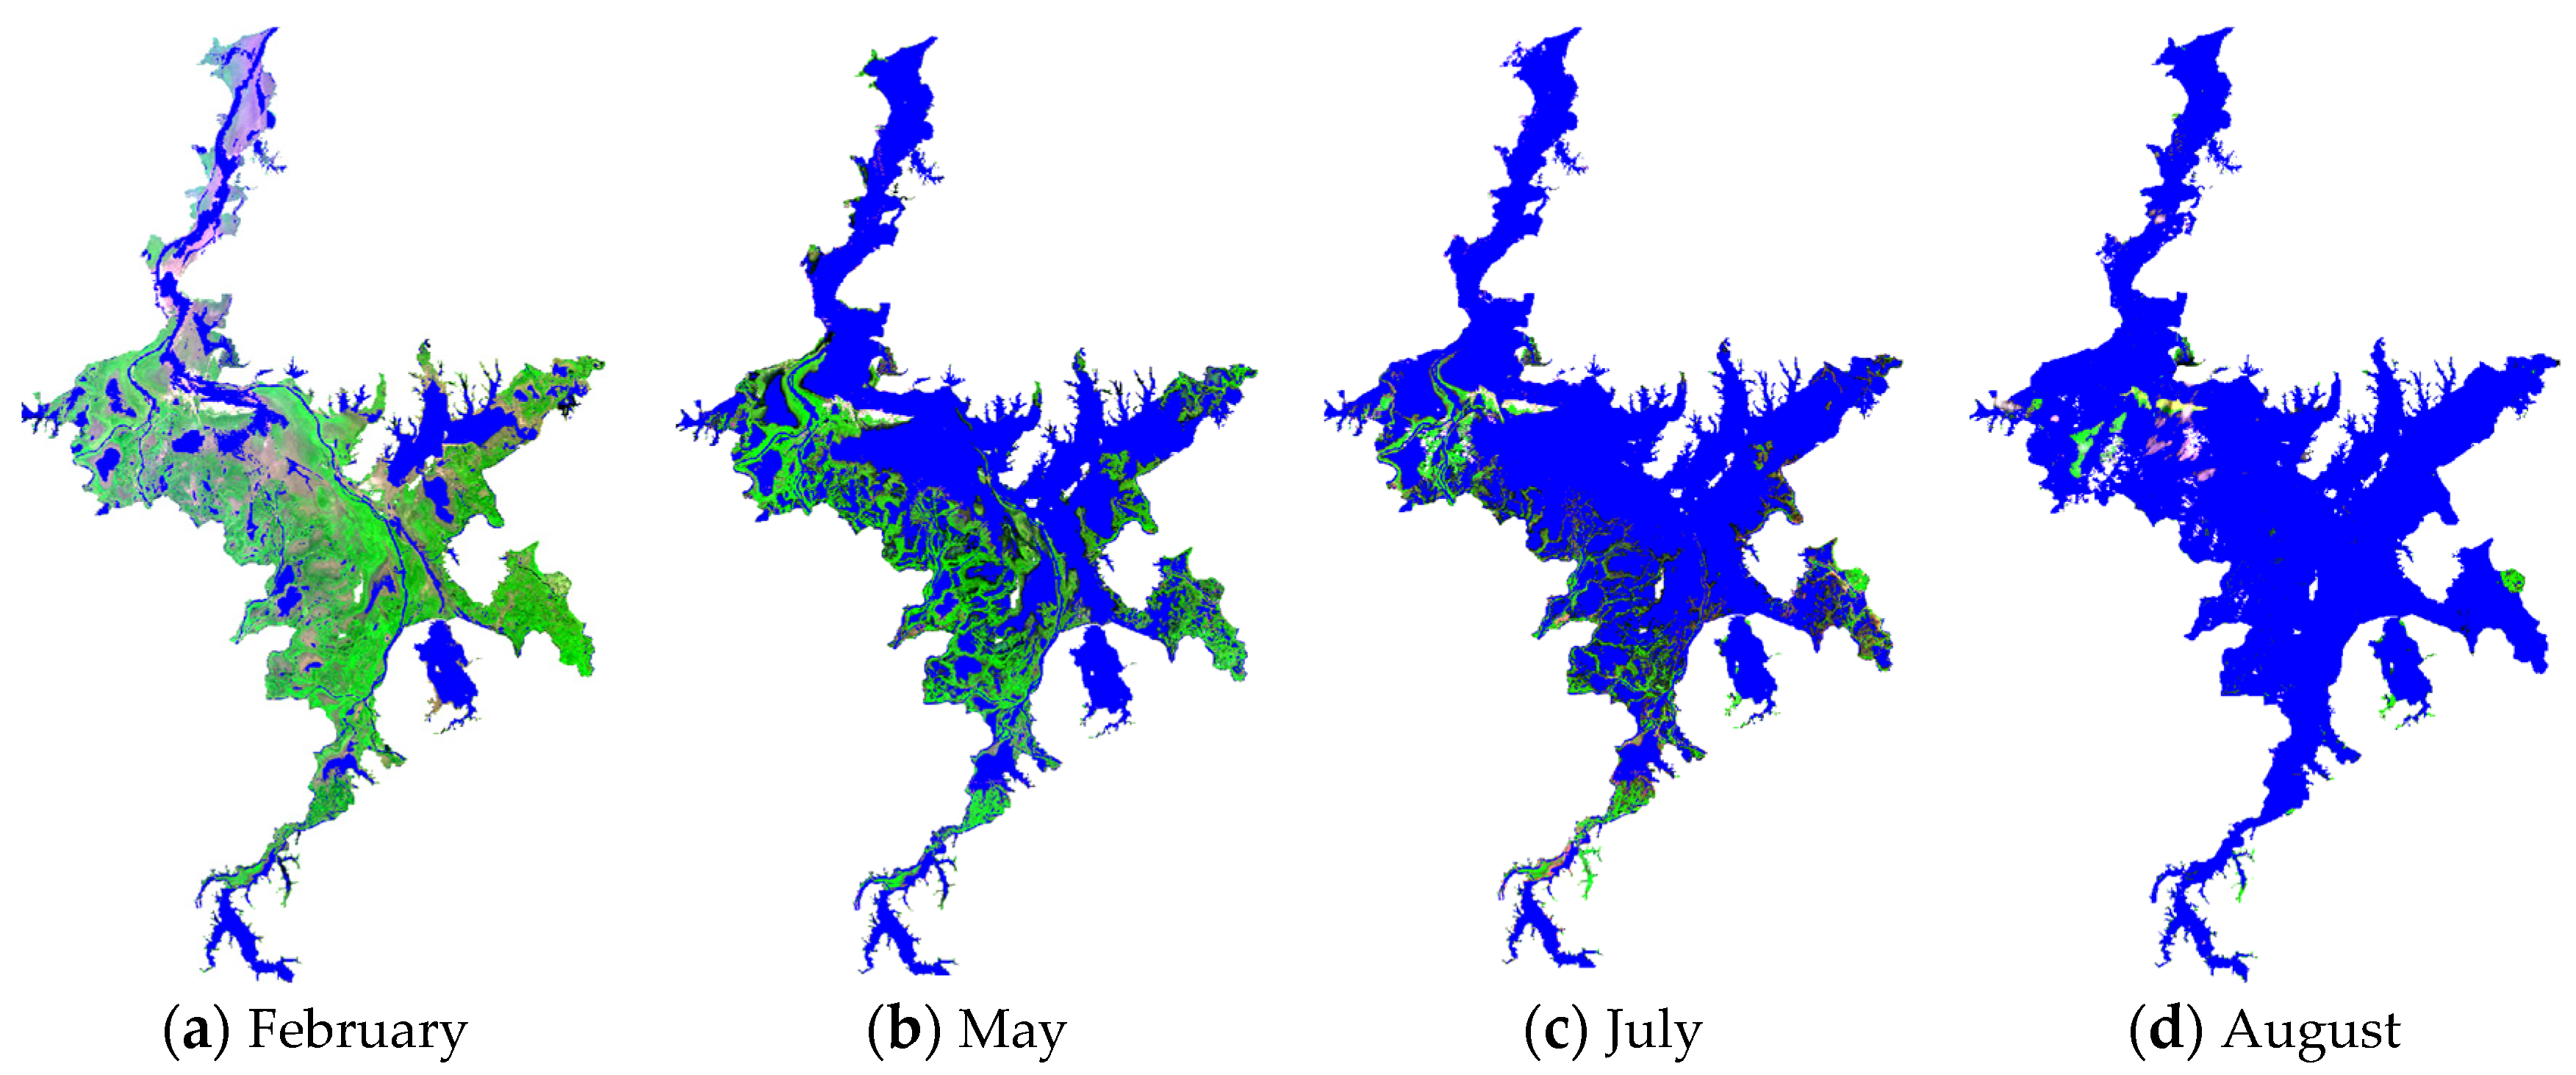
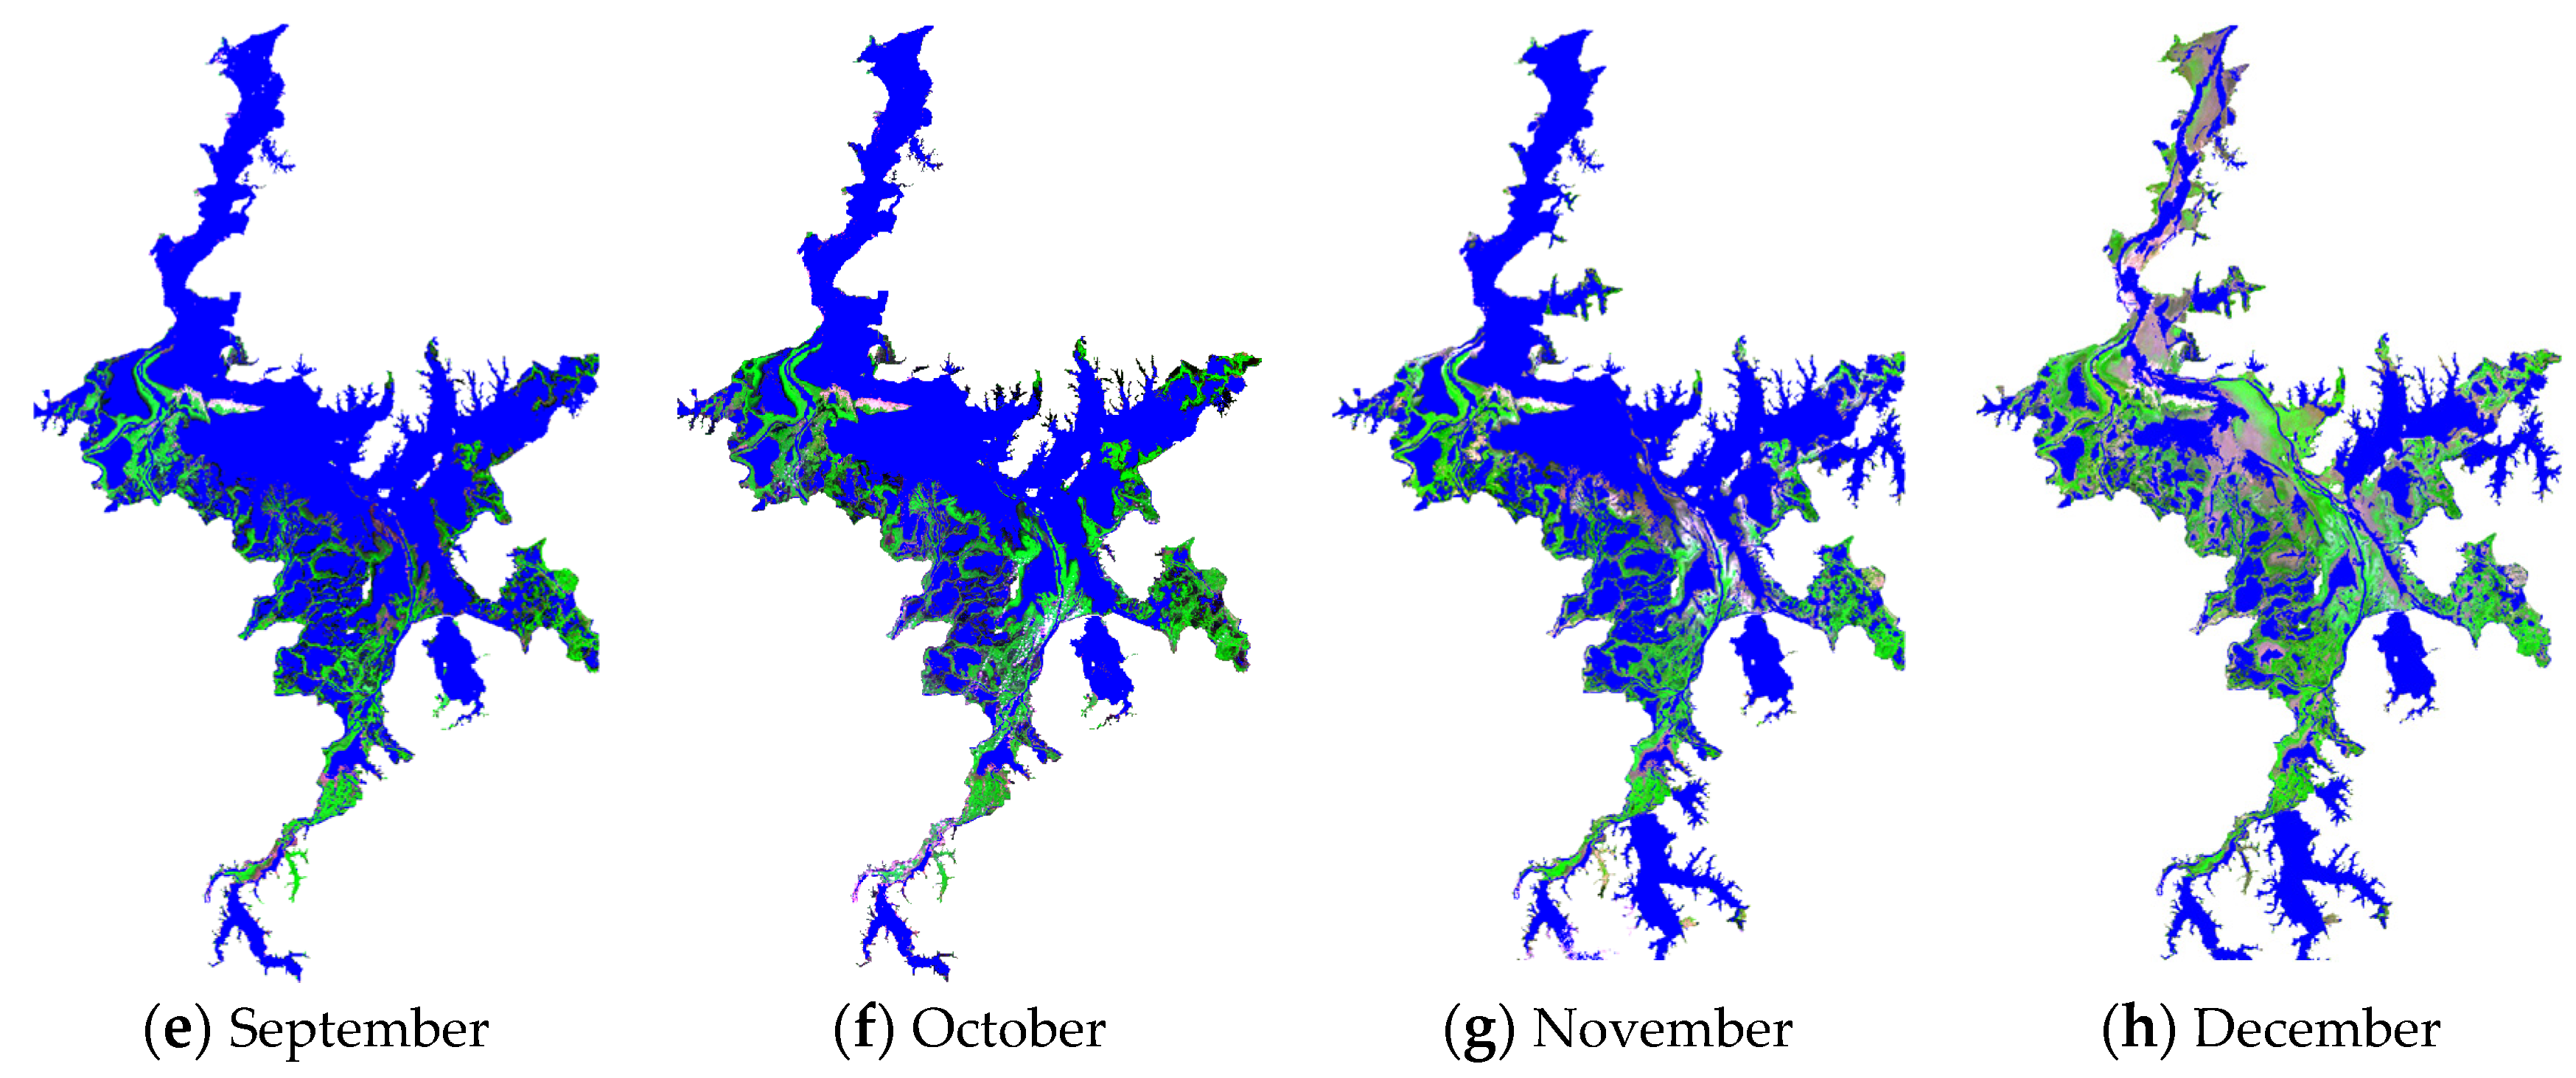
Figure 2 shows the water area changes in Poyang Lake derived from Landsat (5, 7, 8 and 9) by the decision tree method for the period from 2002 to 2022. Notably, the water area change series exhibited significant seasonal variation characteristics and nearly no significant trend, with a small rate of −16.5 ± 3.6 km2. Poyang Lake exhibited the largest water area in June and July every year, which was approximately 3000 km2. After July, the water area showed a downward trend, possibly due to severe drought, and the water area of Poyang Lake in November and December was the smallest (Figure 2). In addition, to better present the water area changes in Poyang Lake, various months in 2017, including February, May, July, August, September, October, November and December, were chosen as an example. The extracted water area of Poyang Lake is shown in Figure 3. In August 2017, Poyang Lake demonstrated the largest water area, and the water area decreased from August to December, which could be attributed to regional climate change in Jiangxi Province.
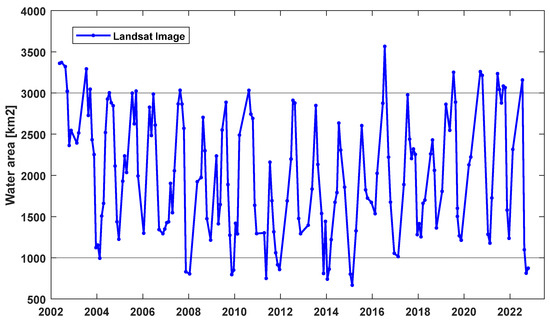
Figure 2.
Changes in the water area of Poyang Lake from April 2002 to December 2022.


Figure 3.
Water area of Poyang Lake extracted by the decision tree method for 2017.
3.2. Changes in the Terrestrial Water Storage of Poyang Lake
To verify the reliability of the estimated Poyang Lake water area changes, the water area changes obtained from Landsat images were compared with the TWS changes derived from the GRACE/GRACE-FO mascon solutions. Considering the relatively small area of Poyang Lake, the regional mean TWS changes within the rectangular area (28°N~30°N and 115°E~117°E) were estimated from the three GRACE/GRACE-FO mascon solutions (CSR, JPL and GSFC) for the period from April 2002 to December 2022.
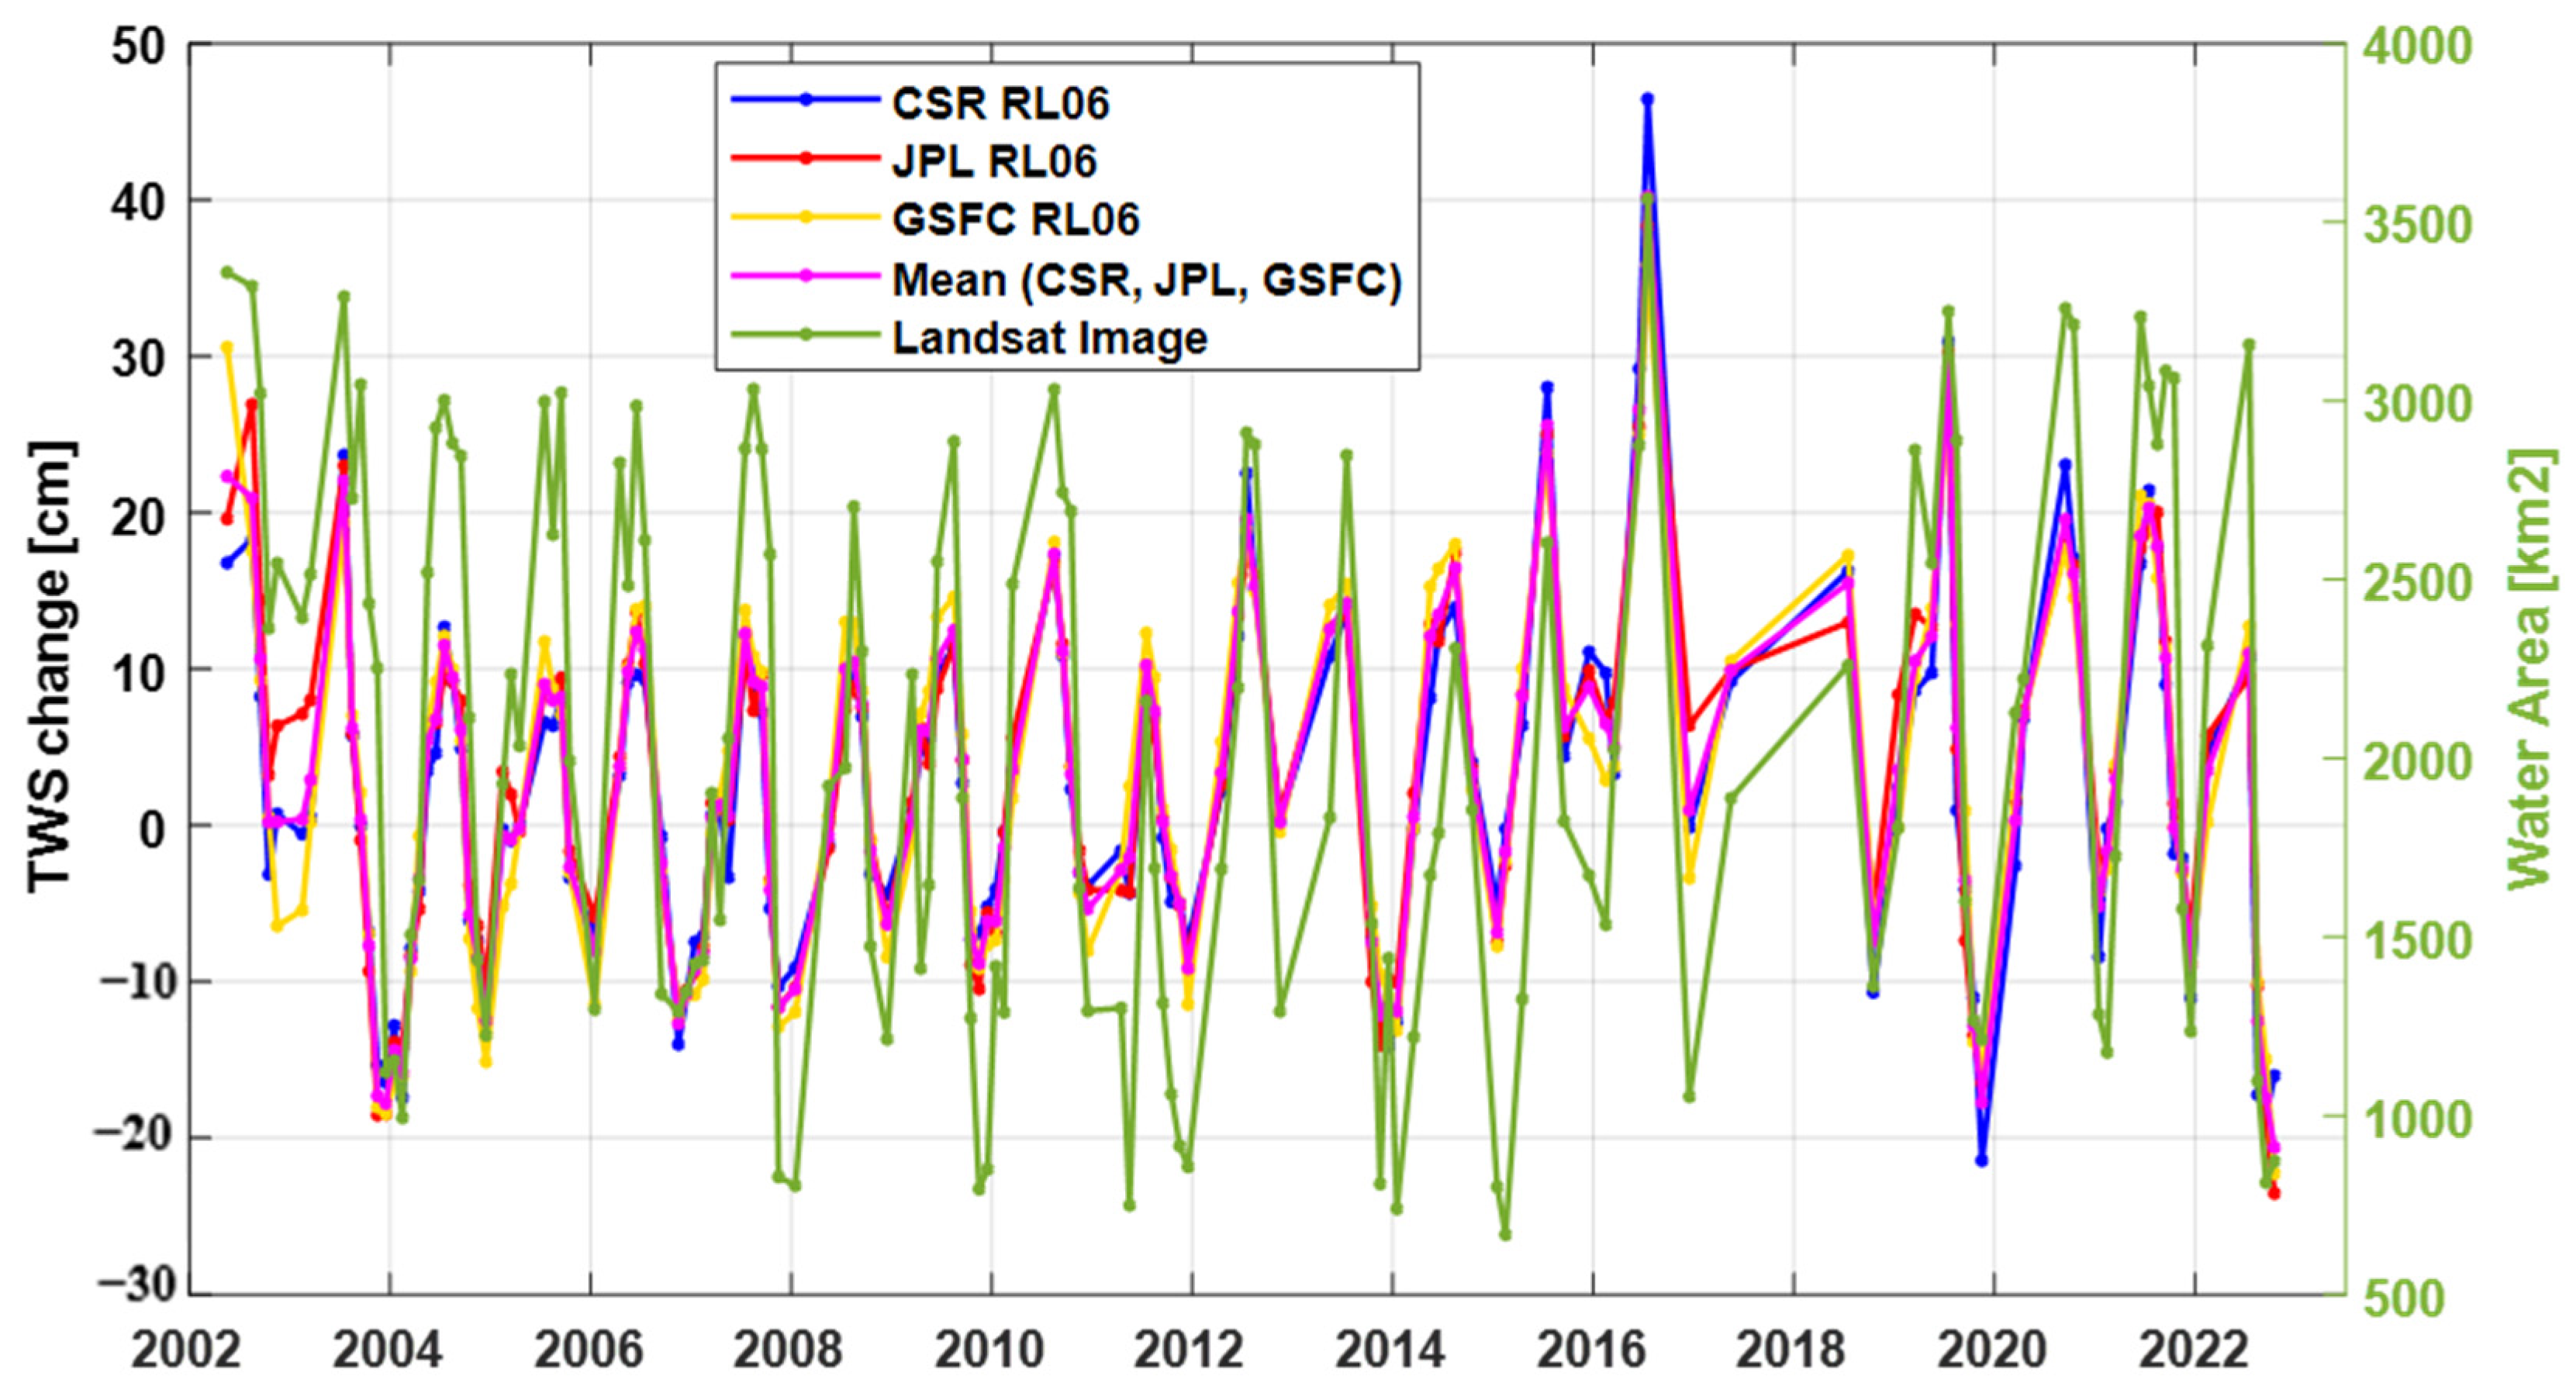
Figure 4 shows the TWS changes estimated from the three GRACE/GRACE-FO mascon solutions and the water area changes derived from Landsat images over the period from April 2002 to December 2022. To compare the estimated TWS changes and the water area changes derived from two independent monitoring techniques, the correlation coefficients were computed using the overlapping months of the Landsat images and GRACE/GRACE-FO mascon solutions during the period from April 2002 to December 2022. The amplitudes of annual and semiannual components and linear trends of TWS changes from three GRACE/GRACE-FO mascon solutions for the period April 2002 to December 2022 are presented in Table 4. The results showed that there exist significant seasonal changes in the TWS and water area, with a relatively small trend of 0.19 ± 0.05 cm/year for the TWS change. Moreover, all the correlation coefficients among the three GRACE/GRACE-FO algorithms reached 0.94, indicating that the estimated TWS changes from the three mascon solutions were highly consistent. However, the correlation coefficients between the water area changes from the Landsat images and the CSR-, JPL- and GSFC-estimated TWS changes were 0.75, 0.78 and 0.76, respectively. The statistical results are provided in Table 5. Considering that there were some missing months in the GRACE/GRACE-FO mascon solutions and remote sensing images from April 2002 to December 2020, the same overlapped months were used to compute the correlation coefficients between the estimated TWS changes and Poyang Lake area change to maintain consistency and facilitate comparison. It is reasonable to conclude that both Landsat images and GRACE/GRACE-FO techniques can be employed to efficiently monitor the water storage changes in Poyang Lake, and the estimates derived from the two independent methods agreed well.
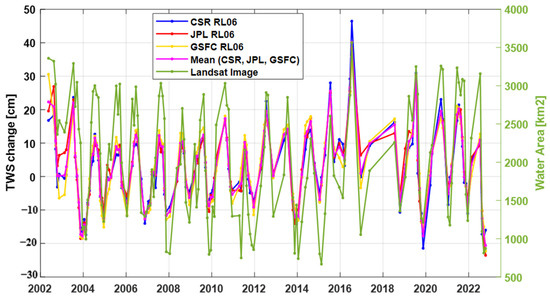
Figure 4.
TWS changes estimated from the three GRACE/GRACE-FO mascon solutions and the water area changes derived from Landsat images for the overlapped months over the period from April 2002 to December 2022. Note: water area changes derived from Landsat images; TWS changes derived from the three GRACE/GRACE-FO mascon solutions.
Table 4.
Amplitudes of annual and semiannual components and linear trends of TWS changes from three GRACE/GRACE-FO mascon solutions for the period April 2002 to December 2022.
Table 5.
Correlation coefficients between the estimated water area changes derived from Landsat images and the TWS changes derived from the CSR, JPL and GSFC mascon solutions.
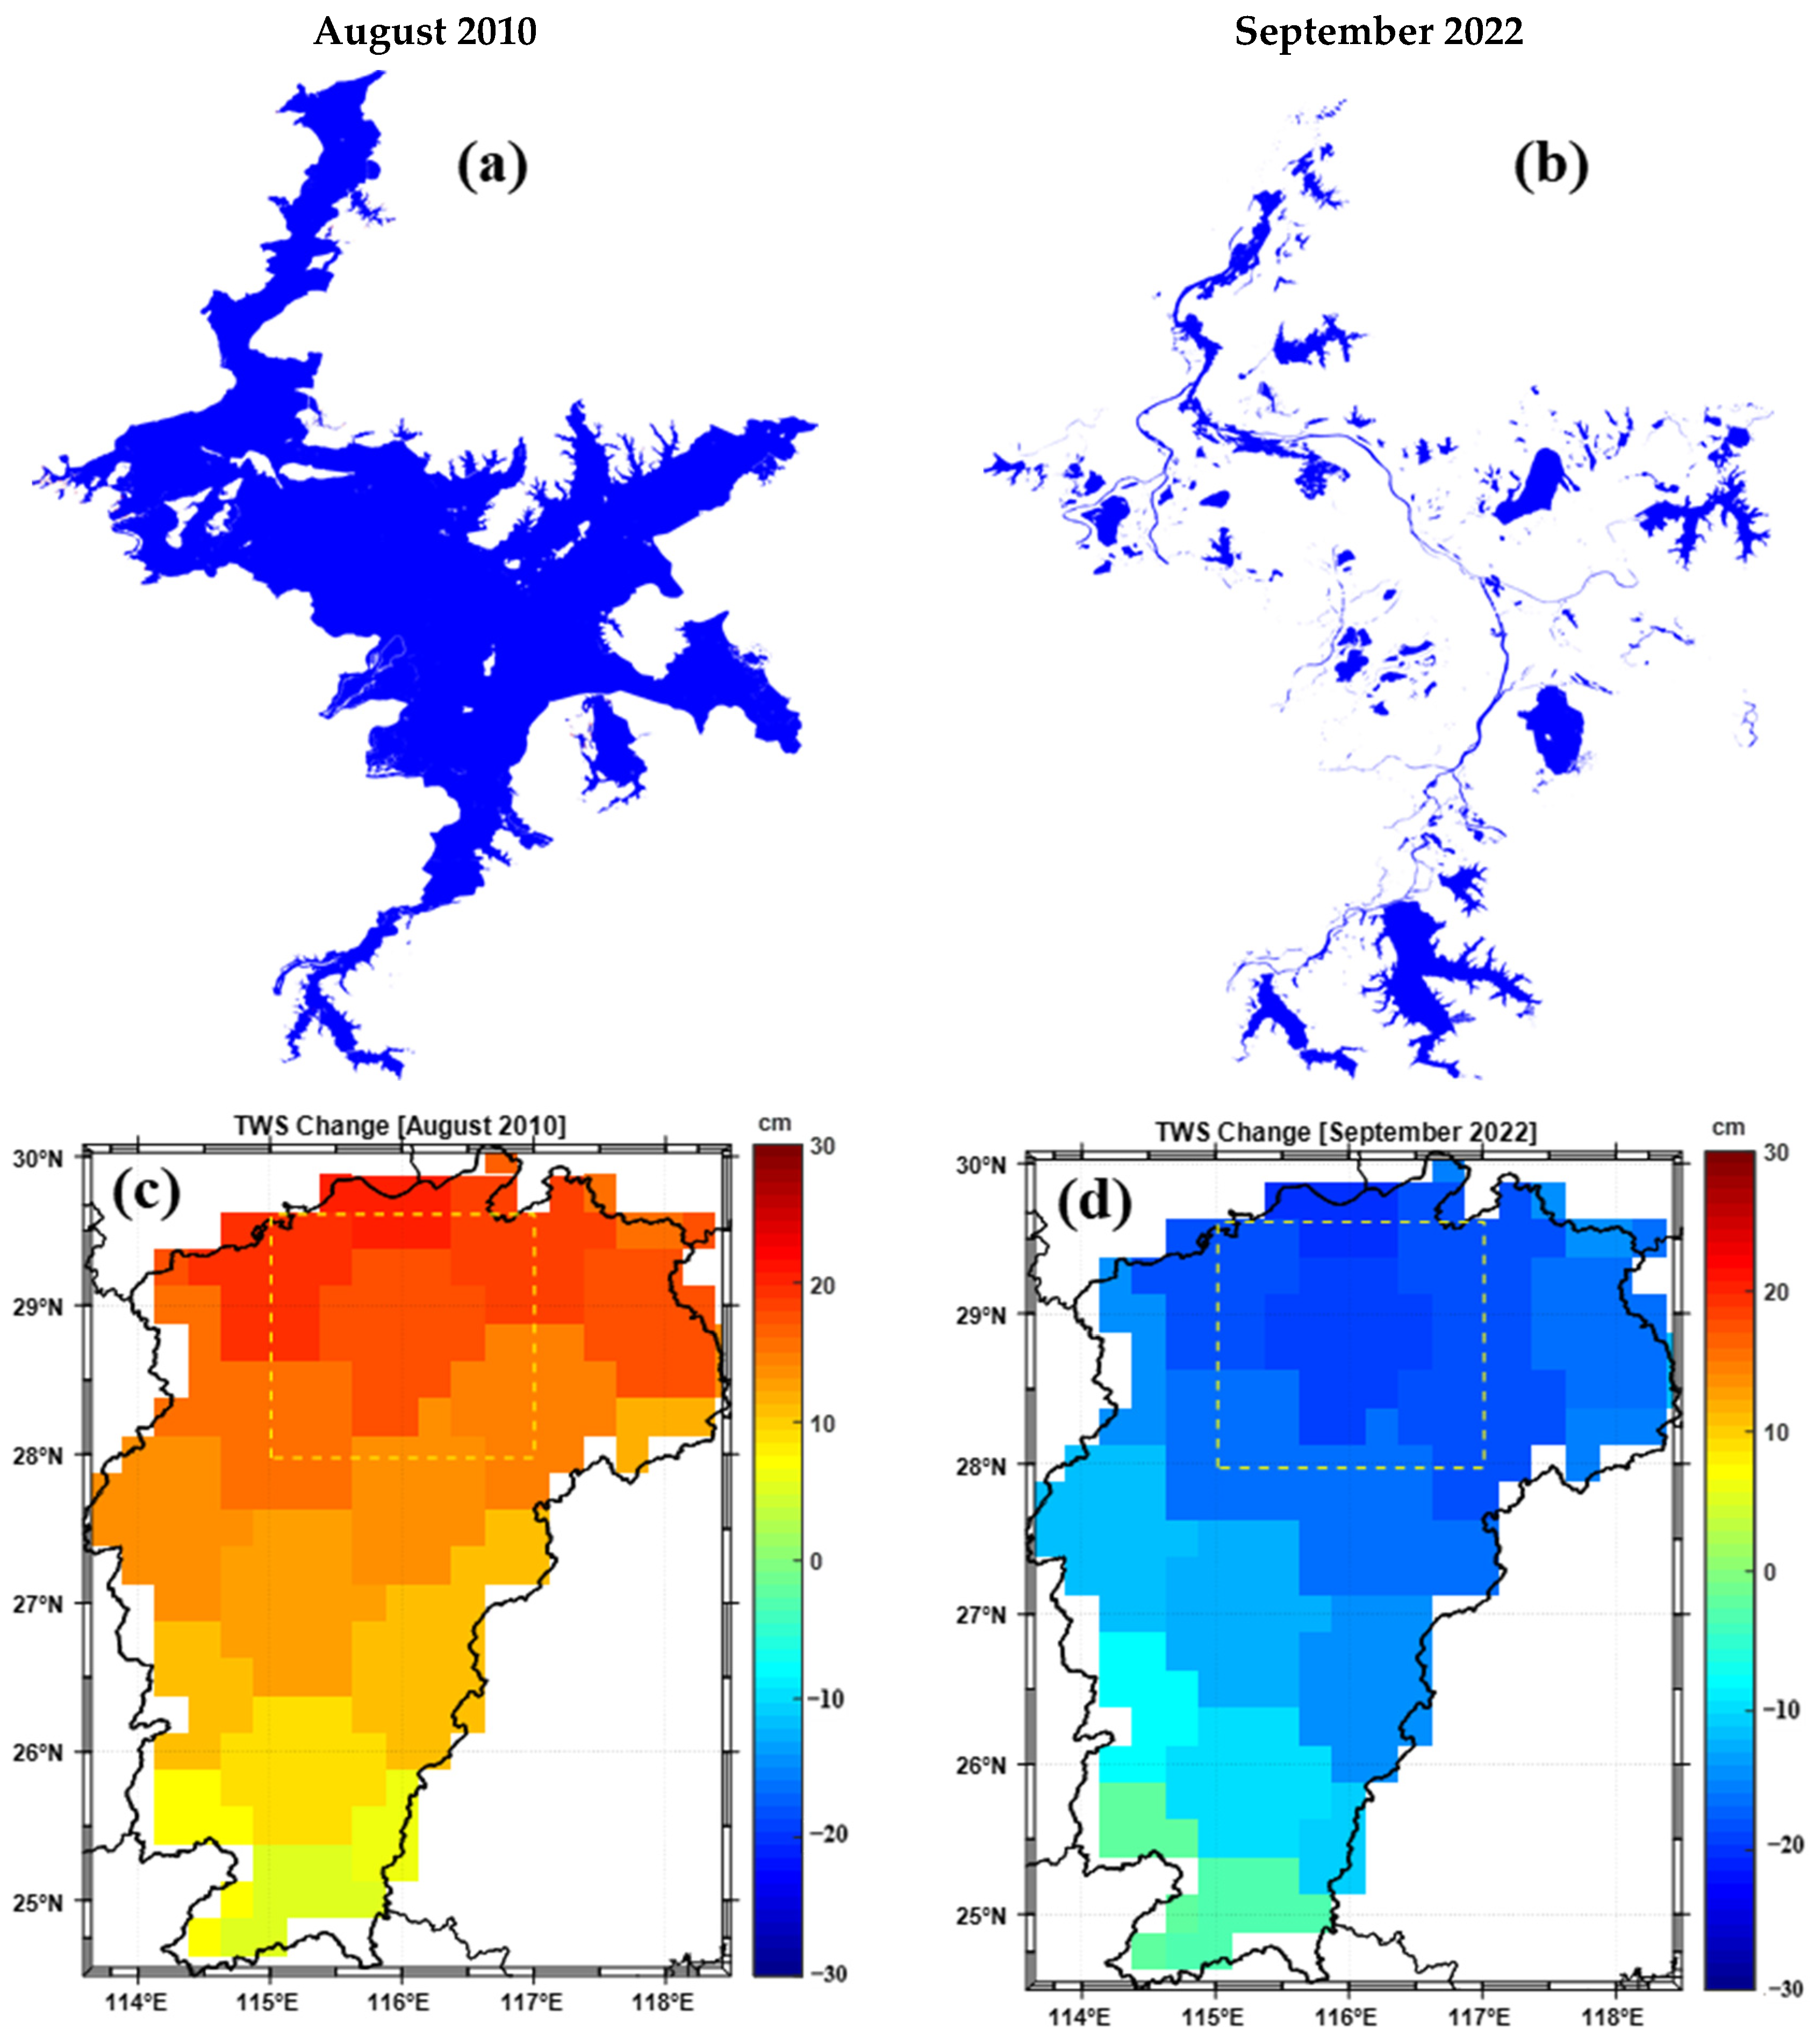
According to historical data, the Yangtze River Basin flood in 2010 caused a relatively high water level in Poyang Lake, with a corresponding large water area of 3032 km2 (August 2010). However, in 2022, a rare meteorological drought in Jiangxi exceeded historical records and the water area of Poyang Lake repeatedly hit new lows, reducing to as low as 813.18 km2 (September 2022). To compare the consistencies of the corresponding estimates from Landsat images and GRACE/GRACE-FO mascon solutions, August 2010 and September 2022 were chosen as examples. Note that all three employed GRACE/GRACE-FO mascon solutions were interpolated to the same grid size and a 0.25° spatial resolution to better distinguish the boundaries. Figure 5 shows the extracted water area of Poyang Lake from Landsat images for August 2010 and September 2022 and the corresponding TWS changes derived from the mean grid data of the three GRACE/GRACE-FO mascon solutions. The water area of Poyang Lake was large in August 2010 (3032 km2) and small in September 2022 (813.18 km2), which is consistent with the corresponding TWS changes (17.37 cm and −17.46 cm) and can be confirmed by historical extreme drought and flood events. Note that the TWS change is estimated relative to the mean background of all available months. Additionally, it is important to mention that the TWS changes are estimated from a rectangular area bounded by 28°N~30°N latitude and 115°N~117°E longitude, which does not exactly align with the boundaries of Poyang Lake. This discrepancy may introduce slight differences in the estimates obtained from the two independent methods.
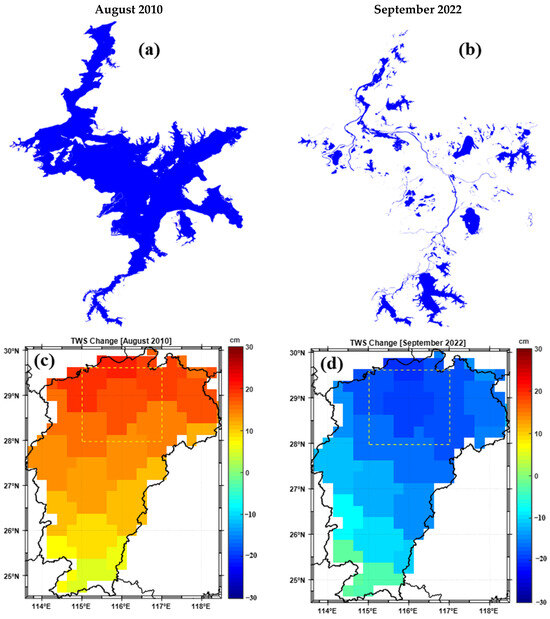
Figure 5.
Water area changes (a) and (b) in Poyang Lake and the corresponding TWS changes (c) and (d) for August 2010 and September 2022 derived from Landsat images and GRACE/GRACE-FO solutions. Note that the dashed box represents Poyang Lake when estimating TWS changes from the GRACE/GRACE-FO mascon solutions.
4. Conclusions
In this study, we combined satellite gravimetry and remote sensing techniques to dynamically monitor the water storage and area changes in Poyang Lake from April 2002 to December 2022. Multisource datasets, including Landsat 5, 7, 8 and 9 satellite images and three GRACE/GRACE-FO (CSR, JPL and GSFC) mascon solutions were adopted. Four water extraction methods (decision tree, NDWI, MNDWI and AWEI) were investigated, and the highly suitable decision tree method was selected to extract the water area of Poyang Lake. By using the decision tree method, the water area changes in Poyang Lake were estimated from the Landsat 5, 7, 8 and 9 satellite images. The results showed that the water area was largest in June and July and smaller in January and November. The TWS changes in Poyang Lake were consistent among the three mascon solutions. The correlation coefficients between the area changes from remote sensing data and TWS changes derived from the CSR, JPL and GSFC mascon solutions were 0.75, 0.78 and 0.76, respectively, indicating the reliability of the Poyang Lake water area and storage changes obtained by the two independent monitoring techniques, indicating that the TWS and water area changes respond to climate change efficiently.
Author Contributions
Conceptualization, F.W.; methodology, F.W. and Q.Z.; validation, F.W. and Y.W.; investigation, H.G. and Y.W.; resources, Y.W.; writing—original draft preparation, F.W.; writing—review and editing, F.W. and S.Z.; supervision, S.Z.; funding acquisition, F.W. and Y.W. All authors have read and agreed to the published version of the manuscript.
Funding
This work is funded by the Shanghai Sheshan National Geophysical Observatory (SSKP202201) and Natural Science Foundation of China (42374017).
Data Availability Statement
The three GRACE/GRACE-FO (i.e., CSR, JPL and GSFC) mascon solutions are available at the following websites: https://doi.org/10.15781/cgq9-nh24, https://podaactools.jpl.nasa.gov/drive/files/allData/tellus/L3/mascon/RL06 and https://earth.gsfc.nasa.gov/geo/data/grace-mascons (accessed on 20 December 2023), respectively. The Landsat images can be directly downloaded from AI Earth (https://engine-aiearth.aliyun.com/ (accessed on 20 December 2023)) and the Geospatial data cloud (http://www.gscloud.cn/search (accessed on 20 December 2023)).
Acknowledgments
We acknowledge the CSR, JPL and GSFC for providing the mascon solutions, and the AI Earth provides Landsat images. The authors appreciate the contributions and suggestions made by the editor and four anonymous reviewers, which have considerably improved the quality of the manuscript.
Conflicts of Interest
The authors declare no conflicts of interest.
References
- Balsamo, G.; Salgado, R.; Dutra, E.; Boussetta, S.; Stockdale, T.; Potes, M. On the contribution of lakes in predicting near-surface temperature in a global weather forecasting model. Tellus A Dyn. Meteorol. Oceanogr. 2012, 64, 15829. [Google Scholar] [CrossRef]
- Long, Z.; Perrie, W.; Gyakum, J.; Caya, D.; Laprise, R. Northern Lake impacts on local seasonal climate. J. Hydrometeorol. 2007, 8, 881–896. [Google Scholar] [CrossRef]
- Zan, Y.; Gao, Y.; Jiang, Y.; Pan, Y.; Li, X.; Su, P. The Effects of Lake Level and Area Changes of Poyang Lake on the Local Weather. Atmosphere 2022, 13, 1490. [Google Scholar] [CrossRef]
- Rosenberry, D.O.; Lewandowski, J.; Meinikmann, K.; Nützmann, G. Groundwater–the Disregarded Component in Lake Water and Nutrient Budgets. Part 1: Effects of Groundwater on Hydrology. Hydrol. Process. 2015, 29, 2895–2921. [Google Scholar] [CrossRef]
- Lima-Quispe, N.; Escobar, M.; Wickel, A.J.; von Kaenel, M.; Purkey, D. Untangling the Effects of Climate Variability and Irrigation Management on Water Levels in Lakes Titicaca and Poopó. J. Hydrol. Reg. Stud. 2021, 37, 100927. [Google Scholar] [CrossRef]
- Vaheddoost, B.; Aksoy, H. Interaction of Groundwater with Lake Urmia in Iran. Hydrol. Process. 2018, 32, 3283–3295. [Google Scholar] [CrossRef]
- Zhang, T.; Ren, H.; Qin, Q.; Zhang, C.; Sun, Y. Surface Water Extraction from Landsat 8 OLI Imagery Using the LBV Transformation. IEEE J. Sel. Top. Appl. Earth Obs. Remote Sens. 2017, 10, 4417–4429. [Google Scholar] [CrossRef]
- Tian, B.; Gao, P.; Mu, X.; Zhao, G. Water Area Variation and River–Lake Interactions in the Poyang Lake from 1977–2021. Remote Sens. 2023, 15, 600. [Google Scholar] [CrossRef]
- Zuo, J.; Jiang, W.; Li, Q.; Du, Y. Remote sensing dynamic monitoring of the flood season area of Poyang Lake over the past two decades. In Natural Hazards Research; Elsevier: Amsterdam, The Netherlands, 2024. [Google Scholar] [CrossRef]
- Min, Q.; Zhan, L. Characteristics of Low-Water Level Changes in Lake Poyang during 1952–2011. J. Lake Sci. 2012, 24, 675–678. [Google Scholar]
- Ye, X.; Li, Y.; Li, X.; Zhang, Q. Factors Influencing Water Level Changes in China’s Largest Freshwater Lake, Poyang Lake, in the Past 50 Years. Water Int. 2014, 39, 983–999. [Google Scholar] [CrossRef]
- Li, H.; Zhang, H.; Yu, L.; Cao, K.; Wang, D.; Duan, X.; Ding, F.; Mao, Z.; Wang, K.; Liu, S.; et al. Managing Water Level for Large Migratory Fish at the Poyang Lake Outlet: Implications Based on Habitat Suitability and Connectivity. Water 2022, 14, 2076. [Google Scholar] [CrossRef]
- Cai, X.; Feng, L.; Wang, Y.; Chen, X. Influence of the three gorges project on the water resource components of Poyang lake watershed: Observations from TRMM and grace. In Advances in Meteorology; Wiley Online Library: Hoboken, NJ, USA, 2015. [Google Scholar] [CrossRef]
- Chen, Y.; Huang, Y.; Guo, R.; Zhong, X. Based on TM image monitoring the Area of Poyang Lake Changed Dynamically in 2013-2016. Comput. Eng. Softw. 2019, 40, 179–184. (In Chinese) [Google Scholar]
- Frazier, P.S.; Page, K.J. Water body detection and delineation with Landsat TM data. Photogramm. Eng. Remote Sens. 2000, 66, 1461–1467. [Google Scholar]
- Tapley, B.; Bettadpur, S.; Ries, J.; Thompson, P.; Watkins, M. GRACE measurements of mass variability in the Earth system. Science 2004, 305, 503–505. [Google Scholar] [CrossRef] [PubMed]
- Tapley, B.D.; Watkins, M.M.; Flechtner, F.; Reigber, C.; Bettadpur, S.; Rodell, M.; Sasgen, I.; Famiglietti, J.S.; Landerer, F.W.; Chambers, D.P.; et al. Contributions of GRACE to understanding climate change. Nat. Clim. Change 2019, 9, 358–369. [Google Scholar] [CrossRef] [PubMed]
- Landerer, F.; Flechtner, F.; Save, H.; Webb, F.H.; Bandikova, T.; Bertiger, W.I.; Bettadpur, S.V.; Byun, S.H.; Dahle, C.; Dobslaw, H.; et al. Extending the global mass change data record: GRACE Follow-On in-strument and science data performance. Geophys. Res. Lett. 2020, 47, e2020GL088306. [Google Scholar] [CrossRef]
- Xu, Y.; Li, J.; Wang, J.; Chen, J.; Liu, Y.; Ni, S.; Zhang, Z.; Ke, C. Assessing water storage changes of Lake Poyang from multi-mission satellite data and hydrological models. J. Hydrol. 2020, 590, 125229. [Google Scholar] [CrossRef]
- Huan, C.; Lu, T.; Zhou, S.; Wang, F.; Wu, Z. Monitoring terrestrial water storage changes and drought in Jiangxi Province using GRACE and GRACE Follow-on data. Acta Geodyn. Geomater. 2023, 20, 111–120. [Google Scholar] [CrossRef]
- Save, H. CSR GRACE and GRACE-FO RL06 Mascon Solutions v02. 2020. Available online: https://www2.csr.utexas.edu/grace/RL06_mascons.html (accessed on 20 April 2024).
- Save, H.; Bettadpur, S.; Tapley, B.D. High resolution CSR GRACE RL05 mascons. J. Geophys. Res. Solid Earth 2016, 121, 7547–7569. [Google Scholar] [CrossRef]
- Watkins, M.M.; Wiese, D.N.; Yuan, D.-N.; Boening, C.; Landerer, F.W. Improved methods for observing Earth’s time variable mass distribution with GRACE using spherical cap mascons. J. Geophys. Res. Solid Earth 2015, 120, 2648–2671. [Google Scholar] [CrossRef]
- Wiese, D.N.; Landerer, F.W.; Watkins, M.M. Quantifying and reducing leakage errors in the JPL RL05M GRACE mascon solution. Water Resour. Res. 2016, 52, 7490–7502. [Google Scholar] [CrossRef]
- Loomis, B.D.; Luthcke, S.B.; Sabaka, T.J. Regularization and error characterization of GRACE mascons. J. Geod. 2019, 93, 1381–1398. [Google Scholar] [CrossRef] [PubMed]
- Landerer, F. Monthly Estimates of Degree-1 (geocenter) Gravity Coefficients, Generated from GRACE (04-2002-06/2017) and GRACE-FO (06/2018 Onward) RL06 Solutions, GRACE Technical Note 13, The GRACE Project, NASA Jet Propulsion Labor-atory. Available online: https://podaac-tools.jpl.nasa.gov/drive/files/allData/grace/docs (accessed on 20 April 2024).
- Peltier, R.W.; Argus, D.F.; Drummond, R. Comment on “an assessment of the ICE-6G_C (VM5a) glacial isostatic adjustment model” by Purcell et al. J. Geophys. Res. Solid Earth 2018, 123, 2019–2028. [Google Scholar] [CrossRef]
- Zeng, Z.Y. A new method of data transformation for satellite images: I. Methodology and transformation equations for TM images. Int. J. Remote Sens. 2007, 28, 4095–4124. [Google Scholar] [CrossRef]
- McFeeters, S.K. The Use of the Normalized Difference Water Index (NDWI) in the delineation of open water features. Int. J. Remote Sens. 1996, 17, 1425–1432. [Google Scholar] [CrossRef]
- Xu, H. Modification of Normalised Difference Water Index (NDWI) to enhance open water features in remotely sensed imagery. Int. J. Remote Sens. 2006, 27, 3025–3033. [Google Scholar] [CrossRef]
- Tri, D.A.; Dong, H.L.; In, T.Y.; Jae, K.L. Identification of Water Bodies in a Landsat 8 OLI Image Using a J48 Decision Tree. Sensors 2016, 16, 1075. [Google Scholar] [CrossRef]
- Kareem, H.; Attaee, M.; Omran, A. Estimation the Water Ratio Index (WRI) and Automated Water Extraction Index (AWEI) of Bath in The United Kingdom Using Remote Sensing Technology of The Multispectral Data of Landsat 8-Oli. Water Conserv. Manag. 2024, 8, 125–132. [Google Scholar]
Disclaimer/Publisher’s Note: The statements, opinions and data contained in all publications are solely those of the individual author(s) and contributor(s) and not of MDPI and/or the editor(s). MDPI and/or the editor(s) disclaim responsibility for any injury to people or property resulting from any ideas, methods, instructions or products referred to in the content. |
© 2024 by the authors. Licensee MDPI, Basel, Switzerland. This article is an open access article distributed under the terms and conditions of the Creative Commons Attribution (CC BY) license (https://creativecommons.org/licenses/by/4.0/).