Article

Distinguishing the Multifactorial Impacts on Ecosystem Services under the Long-Term Ecological Restoration in the Gonghe Basin of China

by
Hong Jia
1,2,3,
Siqi Yang
4,
Lianyou Liu
1,2,3,
Rui Wang
1,2,3,
Zeshi Li
1,2,3,
Hang Li
1,2,3 and
Jifu Liu
1,2,3,*
1
Key Laboratory of Environmental Change and Natural Disaster, Ministry of Education, Beijing Normal University, Beijing 100875, China
2
Engineering Research Center of Desertification and Blown-Sand Control, Ministry of Education, Beijing Normal University, Beijing 100875, China
3
Faculty of Geographical Science, Academy of Disaster Reduction and Emergency Management, Beijing Normal University, Beijing 100875, China
4
School of Water Resources and Environment, China University of Geosciences, Beijing 100083, China
*
Author to whom correspondence should be addressed.
Remote Sens. 2024, 16(13), 2460; https://doi.org/10.3390/rs16132460
Submission received: 23 April 2024 / Revised: 2 July 2024 / Accepted: 2 July 2024 / Published: 4 July 2024

Abstract

:
The ongoing shifts in climate, coupled with human activities, are leading to significant land desertification; thus, understanding the long-term variations in ecosystem services as well as the driving factors has a significant value for ensuring ecological security in ecologically fragile arid regions. In this study, we used the RUSLE, RWEQ, CASA, and InVEST models to evaluate five typical ecosystem services (ESs) from 1990 to 2020 in the Gonghe Basin, including soil conservation, sand fixation, carbon sequestration, water yield, and habitat quality. Then, we analyzed the trade-offs between ESs and proposed scientific indications. Finally, we identified the driving mechanisms of ES spatiotemporal variations. The results showed that (1) the ecosystem services in the Gonghe Basin have, overall, improved over the past 30 years. Soil conservation, sand fixation, carbon sequestration, and water yield showed upward trends, while habitat quality showed a downward trend. (2) The relationships between ESs in the Gonghe Basin were characterized by strong synergies and weak trade-offs, with significant spatial heterogeneity in terms of the trade-off intensity. In addition, the implementation of ecological engineering may strengthen the intensity of the trade-offs. (3) Among all the factors (temperature, precipitation, wind speed, NDVI, land use type, slope, DEM and soil type) that affected ESs, NDVI had the greatest impact, and the explanatory power was 49%, followed by soil type. The explanatory power of the interactions between each factor was higher than that of a single factor, and the interaction between NDVI and soil type had the greatest impact. ESs increased by 12% mainly due to the implementation of ecological engineering projects and natural factors. The most suitable area for ESs was the southeastern edge of the Gonghe Basin. Our study will enrich the understanding of the mechanisms of ecosystem services in drylands and provide a scientific basis for the future implementation of ecological engineering on the Qinghai Tibet Plateau.

1. Introduction

Ecosystem services (ESs) are defined as the benefits people directly or indirectly gain from natural ecosystems [1], which are conducive to human development, including support, provision, and regulatory and cultural services [2]. In recent years, ecosystem services have been destroyed at an unprecedented rate on a global scale, prompting people to explore the mechanisms behind ES changes [3,4]. Climate change and human activities are generally identified as the main drivers of changes in ESs. Human activities, including deforestation, overgrazing, and urbanization, along with climate change, such as alterations in temperature, precipitation, and wind speed [5], can damage the structure and function of ecosystems, leading to land degradation, reduction in biodiversity, and ES declines [6,7].
Drylands are regions where the aridity index (the ratio of precipitation to potential evapotranspiration) is less than 0.65 [8,9]. Covering approximately 45% of the Earth’s land surface, drylands are inhabited by around 40% of the global population [10]. These ecosystems provide various ecosystem services, including soil conservation, sand fixation, and carbon storage [11,12]. However, research on dryland ecosystem services remains scarce due to the harsh environmental conditions and insufficient data. Drylands are highly sensitive to global climate change, with 10–20% of drylands worldwide already degraded due to climate change and intensified human activities [9], leading to ecosystem degradation and severe land desertification. Land desertification is particularly serious in China. Research indicates that by 2014, the desertified land in China had reached 2.61 million km2, accounting for 27.2% of the national land area, primarily situated in the drylands of northern China [13]. The Gonghe Basin is one of the highest-altitude sandy lands in north China; severe desertification directly impacts the provision of local ecosystem services and livelihoods [14,15,16], posing a significant threat to the ecological security of the Longyangxia Reservoir and its surrounding regions [17]. Since 2000, the Chinese government has implemented ecological restoration projects to combat desertification, including the Three-North Shelter Project, the Beijing–Tianjin Sandstorm Source Treatment Project, and the Grain for Green Project [18]. However, whether dryland ecosystems have been restored remains unclear.
There exists significant evidence demonstrating that ecological engineering has an important impact on drylands. Most studies focused on ecological engineering leading to desertification reversal in arid regions, mainly using remote sensing image interpretation or related remote sensing indicators to evaluate changes in desertification levels. For example, Zhang et al. [19,20] demonstrated that large ecological restoration projects are the main driving force of the reversal of desertification on the Qinghai–Tibet Plateau; similar conclusions have also been drawn in the Horqin sandy land [21], the source area of the Yellow River [22], and the surrounding areas of Qinghai Lake [23]. However, for dryland ecosystem services, a range of studies have examined the improvement in vegetation conditions and enhancement of individual ecosystem services through desertification control [24,25,26,27,28]. Only a few studies have been conducted on the comprehensive evaluation of dryland ESs after implementing ecological policies. For instance, Zhao et al. [29] evaluated the impact of policy on the ecological environment by comparing differences in the ecosystem services value before and after the implementation of ecological policy in Inner Mongolia. Jiang et al. [30] quantified the ecosystem services changes in the Beijing–Tianjin Sandstorm Source Region (BTSSR) after the enforcement of ecological engineering projects. Liu et al. [16] assessed the influence of ecological restoration policies on improving the Hunshandake sandy land ecosystem services over a long-term time series. Xu et al. [31] analyzed the influences of ecological engineering on the main ecosystem services of northern China, eliminating the effects of climate change. Overall, most relevant studies only compare the ESs spatiotemporal variations after the implementation of ecological engineering, lacking a quantitative explanation of the mechanism of dryland ESs [32,33]. Additionally, previous studies have mainly shown large spatial scales and lower resolutions, and there is relatively little research on the trade-offs and synergies of ecosystem services in drylands. So far, significant progress has been made in sand prevention and control in the Gonghe Basin [15]. We are still unclear about the impact of ecological engineering on ecosystem services and their interrelationships in the Gonghe Basin, and there is relatively little research on the changes in ecosystem services in the Gonghe Basin [34,35].
In order to gain a deeper understanding of the long-term and high-precision ES changes in the Gonghe Basin, this study focuses on the Gonghe Basin as its research area, evaluating the spatiotemporal trends and interrelationships of ecosystem services from 1990 to 2020 and exploring the driving mechanisms behind various ecosystem services using the Geodetector model. Thus, this research aims to (1) evaluate the spatiotemporal evolution trends in ecosystem services in the Gonghe Basin from 1990 to 2020; (2) analyze the trade-offs and synergies of ecosystem service functions in the Gonghe Basin, as well as the spatial distribution characteristics of trade-offs; and (3) identify the key driving factors of ecosystem services in the Gonghe Basin and analyze the interactions among these driving factors. These research results could provide significant support for the sustainable utilization of land resources and the restoration of the ecological environment in the region.

2. Materials and Methods

2.1. Study Area

The Gonghe Basin (35°27′–36°56′N, 98°46′–101°22′E), situated in the northeastern part of the Tibetan Plateau (Figure 1), acts as a transitional zone between the Kunlun and Qinling mountain ranges. The topography widens from west to east, shaped by the Yellow River’s segmentation from southwest to northeast, resulting in an external drainage basin [36]. The total area is approximately 25,500 km2, with altitudes ranging from 2871 to 3870 m. It encompasses Gonghe, Guinan, and Wulan counties within Qinghai Province. It is located within a semiarid desertification area of the upper Yellow River basin, with the Talatan and Mugetan plains predominantly consisting of sandy lands [37]. The average annual temperature is 0.86 °C, annual precipitation ranges from 311 to 402 mm, annual evaporation rates between 1528 and 1937 mm, and average annual wind speed is about 1.3 m/s. It is characterized by intense aeolian activity, with a cold and dry climate, typifying a high-altitude arid and semiarid continental climate [38]. The region’s primary land uses include grassland and barren land, providing various ecosystem products and services.

2.2. Data Sources

The dataset used in this research for calculating ecosystem services and analysis of forcing mechanisms is summarized in Table 1. The climate data (including temperature, precipitation, and wind speed) from 42 stations surrounding the Gonghe Basin were collected from the China Meteorological Centre (https://data.cma.cn/ accessed on 7 October 2023) and spatially interpolated using the ANUSPLIN 4.2 version. The NDVI data from the GIMMS-NDVI3g and MOD13Q1 database (http://modis.gsfc.nasa.gov/, accessed on 3 January 2024) were synthesized using the maximum value composite (MVC) method. This method was used to eliminate the influence of clouds and atmosphere and better reflect the vegetation cover condition. The land use data from 1990 to 2020 were collected from China’s land cover dataset, including cropland, forestland, grassland, water bodies, construction land, and unused land (sandy land, Gobi, saline-alkali land, barren land, and everglade) (http://www.resdc.cn/, accessed on 3 January 2024), with a spatial resolution of 30 m. And the unused land types in the Gonghe Basin were mainly barren land. Soil data were acquired from the World Soil Database (http://www.fao.org/soils-portal/data-hub, accessed on 5 January 2024). Every data were converted into the UTM coordinate system for projection purposes, and the raster data were reconfigured to a spatial resolution of 30 m due to the small spatial scale of the research area [34].

2.3. Methods

Among the four types of ESs, supporting services and regulating services can best reflect the properties of dryland ecosystems, and considering the correlation with the study area, data availability, and reference to previous research [16,30], we finally chose five ES functions (soil conservation, sand fixation, carbon sequestration, water yield, and habitat quality) from the two types of ESs for assessment in this study. The specific calculation methods for each ecosystem service are described below and in the Supplementary Materials.

2.3.1. Soil Conservation (SC)

Soil conservation (SC) refers to the disparity between actual soil erosion and potential soil erosion [39]. It is an important regulatory function for dryland ecosystem services. In the semiarid and arid regions, the RUSLE model has been widely used for soil erosion research [40,41]. The structure is as follows:
S C = R × K × L S × ( 1 C × P )
where SC represents soil conservation (t hm−2 yr−1), R represents the rainfall erosivity factor, K represents the soil erosion factor, LS represents the topography factor, C represents the vegetation cover factor, and P represents the support routine factor. R represents the potential ability of rainfall to cause soil erosion [39]. In this study, R was calculated using the empirical formula for monthly precipitation proposed by Prasannakumaret et al. [42]. Its formula is as follows:
R = i = 1 12 1.735 × 10 [ 1.5 × log 10 ( P i 2 / P ) 0.08188 ]
where R is the rainfall erosivity factor, Pi is the total monthly rainfall (mm), P is the annual rainfall (mm), and i is the month in a year.
K represents the susceptibility of different soil types to erosion, essentially reflecting the difficulty of hydraulic separation and transportation of soil particles of different types, and the strength of soil resistance to erosion [43,44]. In this study, K was calculated using the Erosion Productivity Impact Calculator (EPIC) model [45], and its formula is as follows:
K = { 0.2 + 0.3 exp [ 0.0256 S A N ( 1 S I L 100 ) ] } × ( S I L C L A + S I L ) 0.3 × [ 1.0 0.25 C C + exp ( 3.72 2.95 C ) ] × [ 1.0 0.7 S N I S N I + exp ( 5.51 + 22.9 S N I ) ] × 0.1317
where K represents the soil erosion factor; SAN, SIL, and CLA are the sand fraction (%), silt fraction (%), and clay fraction (%), respectively; C is the soil organic carbon content (%); SNI = 1 − SAN/100.
LS represents the impact of terrain on soil erosion, and the slope length (L) and slope steepness (S) factors reflect the impact of slope length and slope on soil erosion in geomorphic types. In this study, LS was calculated based on the research of McCool et al. [46] and Liu et al. [47], and its formulas are as follows:
L = ( α / 22.13 ) [ β / ( β + 1 ) ]
β = ( sin θ 0.0896 ) / [ 3.0 × ( sin θ ) 0.8 + 0.56 ]
S = { 10.8 sin θ + 0.03 16.8 sin θ 0.5 21.91 sin θ 0.96 θ < 5 ° 5 ° θ < 10 ° θ 10 °
where α is the slope length, β is the slope length exponent, and θ is the slope steepness (°).
C represents the ability of vegetation canopy and ground covers to protect the soil surface by dissipating the kinetic energy of the raindrops. The C factor was calculated using the method proposed by Cai et al. [48]. The formulas are expressed as follows:
C = { 1 0.6508 0.3436 lg ( f ) 0 f = 0 0 < f 78.3 % f > 78.3 %
f = N D V I N D V I m i n N D V I m a x N D V I m i n
where f is the vegetation coverage (%); NDVImin and NDVImax refer to the regional minimum and maximum NDVI, respectively.
P refers to the ratio of soil loss with specific soil conservation practices to the soil loss without any protective measures, with values ranging between 0 and 1 [31]. The value of P was determined based on land use type according to previous studies [49,50]. The P of the forest, grassland, and unused land was 1; the P of cropland was 0.4; and the P of water and construction land was 0.

2.3.2. Sand Fixation (SF)

Sand fixation is generally obtained by calculating the difference between the actual and potential actual wind erosion amounts [51]. In the Gonghe Basin, the sand fixation of ecosystem services was estimated using the revised wind erosion equation (RWEQ), considering various factors such as climate, soil, vegetation, and topography [52]. The equations are as follows:
S F = S L r S L
S L r = 2 z S r 2 Q r m a x e ( z S r ) 2
S L = 2 z S 2 Q r m a x e ( z S ) 2
Q r m a x = 109.8 ( W F E F S C F K )
S r = 150.71 ( W F E F S C F K ) 0.3711
Q m a x = 109.8 ( W F E F S C F K C )
S = 150.71 ( W F E F S C F K C ) 0.3711
where SF is the amount of sand fixation (kg m−2 yr−1), SLr represents potential wind erosion (kg m−2 yr−1), SL is actual wind erosion (kg m−2 yr−1), Z represents the length of the maximum wind erosion occurring from the downwind direction (m), Qrmax is the potential transport capacity (kg m−1), Qmax is the highest transport capacity (kg m−1), S is the length of the critical field (m), WF and EF represent the weather factor and soil erodibility factor, respectively, SCF is the soil crust factor, K′ is soil roughness, and C is the vegetation factor.
WF represents the combined effect of all meteorological factors on wind erosion. The wind is the basic driving force for wind erosion. As the wind speed increases, the quantity of soil that can be transported increases. Soil water increases the adhesive force between soil particles, which influences the threshold velocity needed for particle movement [53]. In addition, snow cover prevents the wind from directly blowing the soil, resulting in a decrease in soil erosion. WF was calculated as follows:
W F = W f × ρ g × S W × S D
W f = i = 1 N W S 2 ( W S 2 W S t ) 2 × N d N
ρ = 348.0 ( 1.013 0.1183 D E + 0.0048 D E 2 T )
S W = E T P ( R + I ) R d N d E T P
S D = 1 P ( s n o w c o v e r > 25.4   mm )
where Wf is the wind factor (m−3 s−3), ρ is the air density (kg m−3), g is the acceleration of gravity (usually 9.8 m s−2), SW is the soil wetness factor; and SD is the snow cover factor. WS2 is the wind speed at a height of 2 m (m s−1), WSt is the threshold wind speed at 2 m (assumed 5 m s−1), Nd is the number of observation days, and N is the number of wind speed observations. DE is the altitude (km); T is the absolute temperature (K). ETP is potential evaporation (mm), R is rainfall (mm), I is the amount of irrigation (mm), which was set to 0 in this study, and Rd is the number of rainy days. P is the probability that the depth of snow cover is greater than 25.4 mm.
EF refers to the proportion of surface soil aggregates with a diameter of less than 0.84 mm. EF was calculated using the method proposed by Fryrear et al. [54] based on the relationship between EF and soil physical and chemical properties. The formula is as follows:
E F = 29.09 + 0.31 S a + 0.17 S i + 0.33 S a / C l 2.59 O M 0.95 C a C O 3 100
where Sa, Si, Cl, OM, and CaCO3 are the content of sand, silt, clay, organic matter, and calcium carbonate (%), respectively.
SCF is used to estimate the effect of a crust on the susceptibility of soil to wind erosion, and the strength of a crust depends on soil properties [55]. It has been found that some crusts formed on silt loam and clay soils can be much more effective at reducing wind erosion [56]. The formula is as follows:
S C F = 1 1 + 0.0066 ( C l ) 2 + 0.021 ( O M ) 2
where Cl and OM are the content of clay and organic matter (%), respectively.
K′ represents the effect of soil roughness on wind erosion, including both oriented and random roughness effects [57]. In a field scale, K′ can be measured using a roller chain method [58]. When upscaling to a region, roughness caused by topography will replace soil roughness. The formula is expressed as follows:
K = cos α
where α is the slope gradient (°).
C is used to quantify the weakened effects of vegetation on wind erosion. Generally, soil loss decreased exponentially with increasing surface cover [59]. Its formula is as follows:
C = e 0.0438 F V C
where FVC is the vegetation coverage (%).

2.3.3. Carbon Sequestration (CS)

NPP (Net Primary Production) is defined as the discrepancy between the amount of organic matter generated through photosynthesis and the quantity consumed through respiration, which can represent the mass of carbon sequestration in vegetation [60]. This study used the CASA (Carnegie–Ames–Stanford Approach) model to estimate NPP based on the light efficiency theory [61]. The CASA model has been widely used to calculate vegetation NPP in China with high accuracy [62,63]. The equations of the CASA model are as follows:
N P P ( x , t ) = A P A R ( x , t ) × ε ( x , t )
where NPP(x, t) is the NPP of a pixel at location x and time t (gC m−2 yr−1), APAR is the actual photosynthetically active radiation (PAR) that vegetation absorbs (MJ m−2), and ε is the actual light utilization efficiency (g MJ−1).
A P A R ( x , t ) = S O L ( x , t ) × F P A R ( x , t ) × 0.5
ε ( x , t ) = T ε 1 ( x , t ) × T ε 2 ( x , t ) × W ε ( x , t ) × ε m a x
where SOL is total solar radiation (MJ m−2), FPAR is the proportion of absorbed solar radiation, Tε1, Tε2, and Wε refer to the temperature and moisture stressing coefficients of maximum temperature, minimum temperature, and water on the light-use efficiency, respectively, and εmax is the maximum light-use efficiency of vegetation in ideal conditions [63].
F P A R ( x , t ) = m i n [ S R S R m i n S R m a x S R m i n , 0.95 ]
S R = 1 + N D V I 1 N D V I
where SR is an NDVI-based simple ratio; SRmax and SRmin are the maximum and minimum values of SR, respectively. Independent of vegetation type, SRmax is set between 4.14 and 6.17 [62], and SRmin is set to 1.05 for all grid cells [61].

2.3.4. Water Yield (WY)

In this research, the annual water yield method from the InVEST model was applied to calculate water yield (WY) in the Gonghe Basin. The theoretical basis of this model is the principle of water balance, which subtracts the actual evapotranspiration from the precipitation of each grid unit to obtain the WY of the grid [64]:
W Y x = ( 1 A E T x P x ) × P x
where WYx refers to the annual water yield (mm), Px represents annual precipitation (mm), and AETx represents annual evaporation (mm).
A E T x P x = 1 + P E T x P x [ ( 1 + P E T x P x ) W x ] 1 W x
P E T x = K c x + E T o x
W x = A W C x P x Z + 1.25
A W C x = m i n ( s o i l _ d e p t h , r o o t _ d e p t h ) × P A W C
P A W C = 54.509 0.132 s a n d % 0.003 ( s a n d % ) 2 0.055 s i l t % 0.006 ( s i l t ) 2 0.738 c l a y % + 0.007 ( c l a y ) 2 2.688 O M % + 0.501 ( O M % ) 2
where PETx is the potential evapotranspiration (mm), Wx is the ratio of available water content of vegetation to annual precipitation, Kcx is the evapotranspiration coefficient for each vegetation type, ETox is the reference evapotranspiration, Z denotes empirical factors [65], AWCx is the available water content of plants, soil-depth and root-depth are the root restricting layer and vegetation rooting depths, respectively, PAWC is the plant available water capacity, and sand, silt, clay, and OM are the proportions of clay, sand, silt, and organic matter in the soil, respectively.

2.3.5. Habitat Quality (HQ)

The habitat quality module of the InVEST model establishes a relationship between land use and threat factors. It quantifies the distribution and degradation of habitats under various land use types based on their response to these threats. The results can indicate the biodiversity within the region, thereby determining the impact of land use changes on habitat quality [66,67]. The formulas are as follows:
Q x j = H j [ 1 ( D x j z D x j z + K z ) ]
D x j = r = 1 R y = 1 Y r ( W r r = 1 R W r ) S j r i r x y β x r y
where Qxj is the habitat quality of land use j in grid cell x, Hj is the habitat suitability of land use type j, Dxj is the habitat degradation degree in grid x of land cover type j, K is the half-saturation constant, usually taken as 0.5, Z is the default parameter for the model, r is the threat factor, R is the total amount of threat factors, Y is a single grid in grid r with threat factors, Yr is the total number of grid cells in grid r with threat factors, Yr is the number of grid cells in grid r, Wr is the normalized threat factor weight, ry is the value of the threat factor in grid y, irxy is the threat level of ry to grid x, βx is the accessibility level of the threat source to grid x, and Sjr is the sensitivity of land use type j to threat factors. Supplementary Materials present the weights of the threat factors and the sensitivity of the habitats.

2.3.6. Overall Benefit of Ecosystem Services (OB)

The overall benefits of ecosystem services represent a comprehensive indicator of the quality of various ecosystem services [31]. Due to significant differences in the quantity of ecosystem services, direct comparative analysis cannot be conducted, and it is crucial to standardize the functions of different ecosystem services:
E S b z = E S i E S m i n E S m a x E S m i n
O B = 1 n i = 1 n E S b z
where ESbz refers to the standardized ecosystem value, ESbz and ESi refer to the i-th ecosystem service function value, ESmax is the maximum value for the i-th ecosystem service, ESmin is the minimum value for the i-th ecosystem service, and OB refers to the comprehensive benefit of the n ecosystem services.

2.3.7. Measures of ES Trade-Offs

This study used Pearson analysis to examine the trade-offs and synergies between five ecosystem service functions. If the correlation coefficient between the two ecosystem services is negative and passes the significance test, there is a trade-off relationship between the two, while if the correlation coefficient is positive and passes the significance test, there is a synergistic relationship.
To further quantify the spatial distribution of the trade-offs, this study used RMSD to measure the intensity of the trade-offs among five ecosystem services [68]. Root mean square deviation (RMSD) is a simple and effective way to quantify the trade-off between two or more ecosystem services, with higher RMSD values indicating higher trade-offs [69,70].
R M S D = 1 n 1 i = 1 n ( E S i E S e x p ) 2
where ESi is the standardized ecosystem service values, ESexp is the mean ecosystem services value, and n is the number of ecosystem services.

2.3.8. Geographical Detector

The Geodetector is a statistical method used for detecting spatial heterogeneity and revealing its underlying driving mechanism. The geographical detector is used to detect the spatial heterogeneity of individual factors and reveal potential causal relationships between two factors through an analysis of their spatial distribution consistency [71]. The Geodetector consists of four parts: factor detector, risk detector, interaction detector, and ecological detector. The factor detector uses the q statistic value to assess the explanatory power of independent variables on the spatial differentiation of dependent variables. The formulas are as follows:
S S W = h = 1 L N h σ h 2 ,   S S T = N σ 2
q = 1 h = 1 L N h σ h 2 N σ 2 = 1 S S W S S T
where h = 1, 2, …, L is the stratification of the independent variable; Nh and N are the number of units within layer h and the whole area, respectively; σh2 and σ2 are the discrete variances of layer h and the entire region, respectively; SSW is the sum of intralayer variances; SST is the regional total discrete variance; and q refers to the explanatory power of the independent variable to the dependent variable—the range of q is between 0 and 1, and a larger q value represents the stronger explanatory power of the independent variable to the dependent variable.
Interaction detection is used to detect whether interaction between two factors can increase the explanatory power of the dependent variable or whether the impact of these factors on the dependent variable is independent. The risk detector serves to identify the suitable influence range or type of various impact factors on the dependent variable.
In this research, the overall benefit of ecosystem services (OB) from 1990 to 2020 was selected as the dependent variable, and the independent variables included annual precipitation, annual average temperature, wind speed, NDVI, land use type, DEM, slope, and soil type. Due to their small interannual variation, DEM, slope, and soil type used the same values during the study period. The geographical detector demands that its input variables be presented as categorical data, thereby requiring the transformation of continuous variables into discrete formats [40,71]. We classified the land use type into 6 categories: cropland, forest, grassland, water, construction land, and unused land. The temperature, precipitation, wind speed, and NDVI data were classified into 9 classes. The slope was classified into 9 classes, and DEM was divided into 8 classes using the natural break method. We classified the soil type into 25 classes according to the original soil type.

3. Results

3.1. Spatiotemporal Dynamics of Ecosystem Services

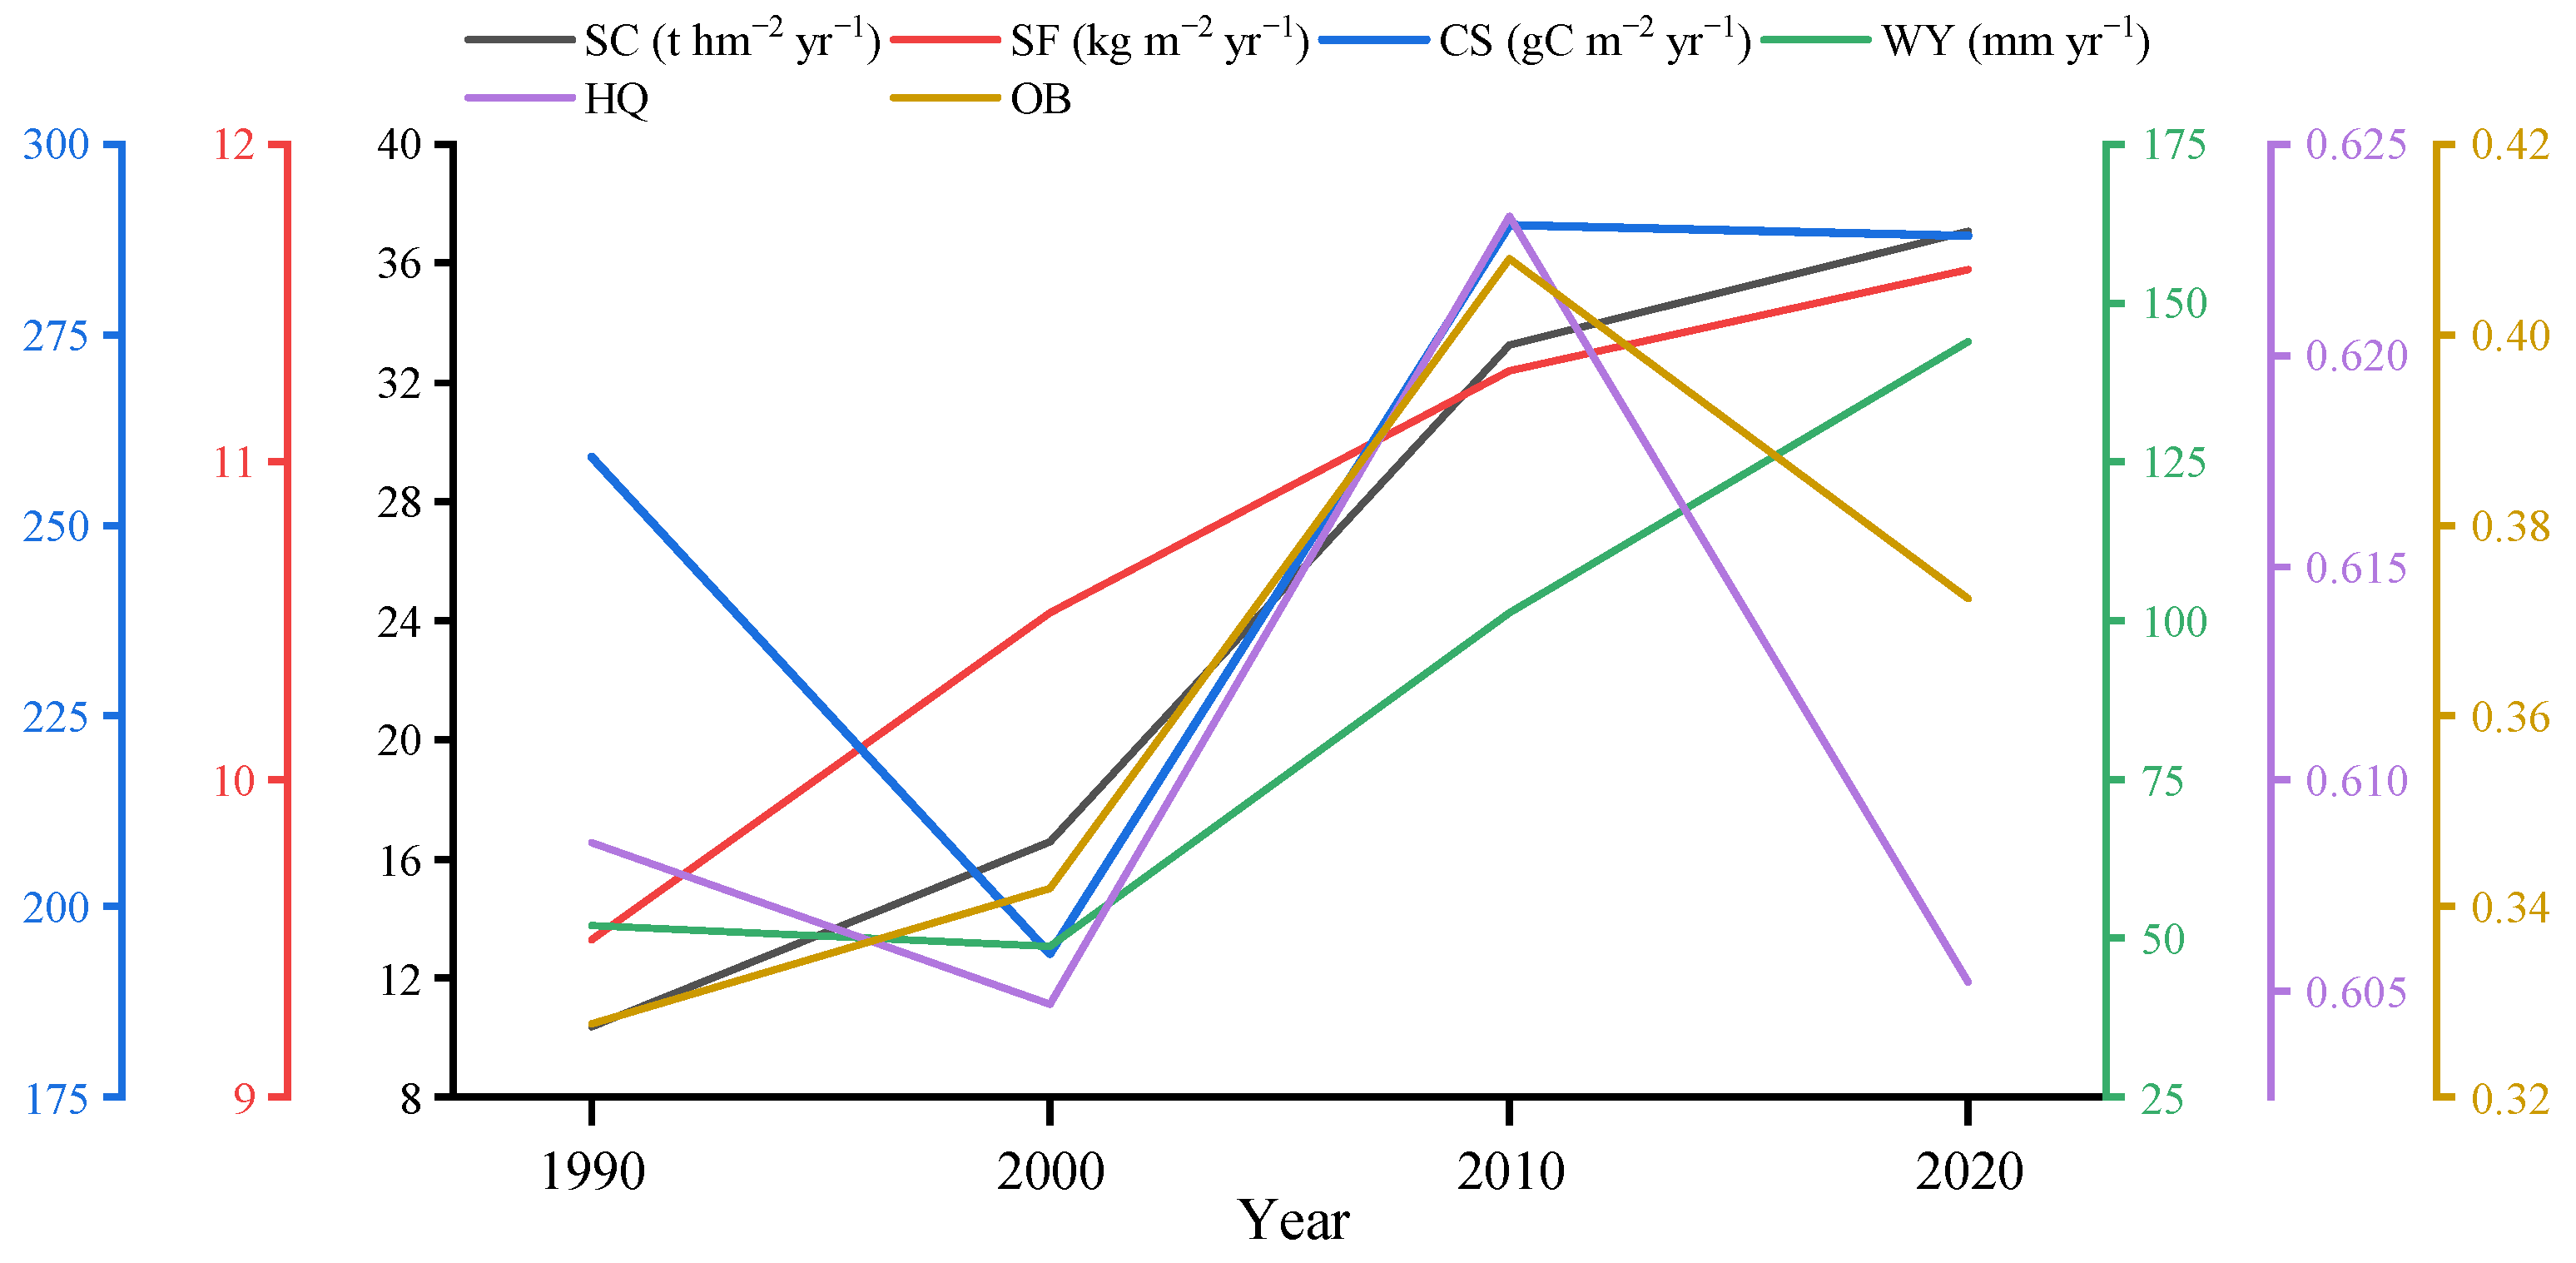
3.1.1. Temporal Variations in Ecosystem Services

The ecosystem services in the Gonghe Basin had overall improved over the past 30 years (Figure 2). Four ecosystem services (SC, SF, CS, WY) in the Gonghe Basin had shown varying degrees of improvement since 1990, and the habitat quality had decreased. From 1990 to 2020, there was a noticeable uptrend in soil conservation, sand fixation, and water yield, which increased by 26.71 t hm−2 yr−1, 2.11 kg m−2 yr−1, and 91.94 mm yr−1, respectively. Carbon sequestration showed a decline trend from 1990 to 2000, a significant upward trend from 2000 to 2010, and a slight decrease from 2010 to 2020, consistent with the change in habitat quality. Carbon sequestration had increased by 11%, and habitat quality decreased by 0.5% over the past 30 years. The overall benefit of the ecosystem services (OB) of the Gonghe Basin increased from 1990 to 2020 by 12%. On the whole, there was an obvious increase in ecosystem services from 2000 to 2010, while in 2010–2020, there had not been much change in ecosystem services, and some ecosystem services even decreased. The results of the five ecosystem services in this study were similar to previous research (Table S6 in Supplementary Materials), indicating that the model evaluation was relatively reliable [72,73,74,75,76,77,78,79,80,81,82,83].

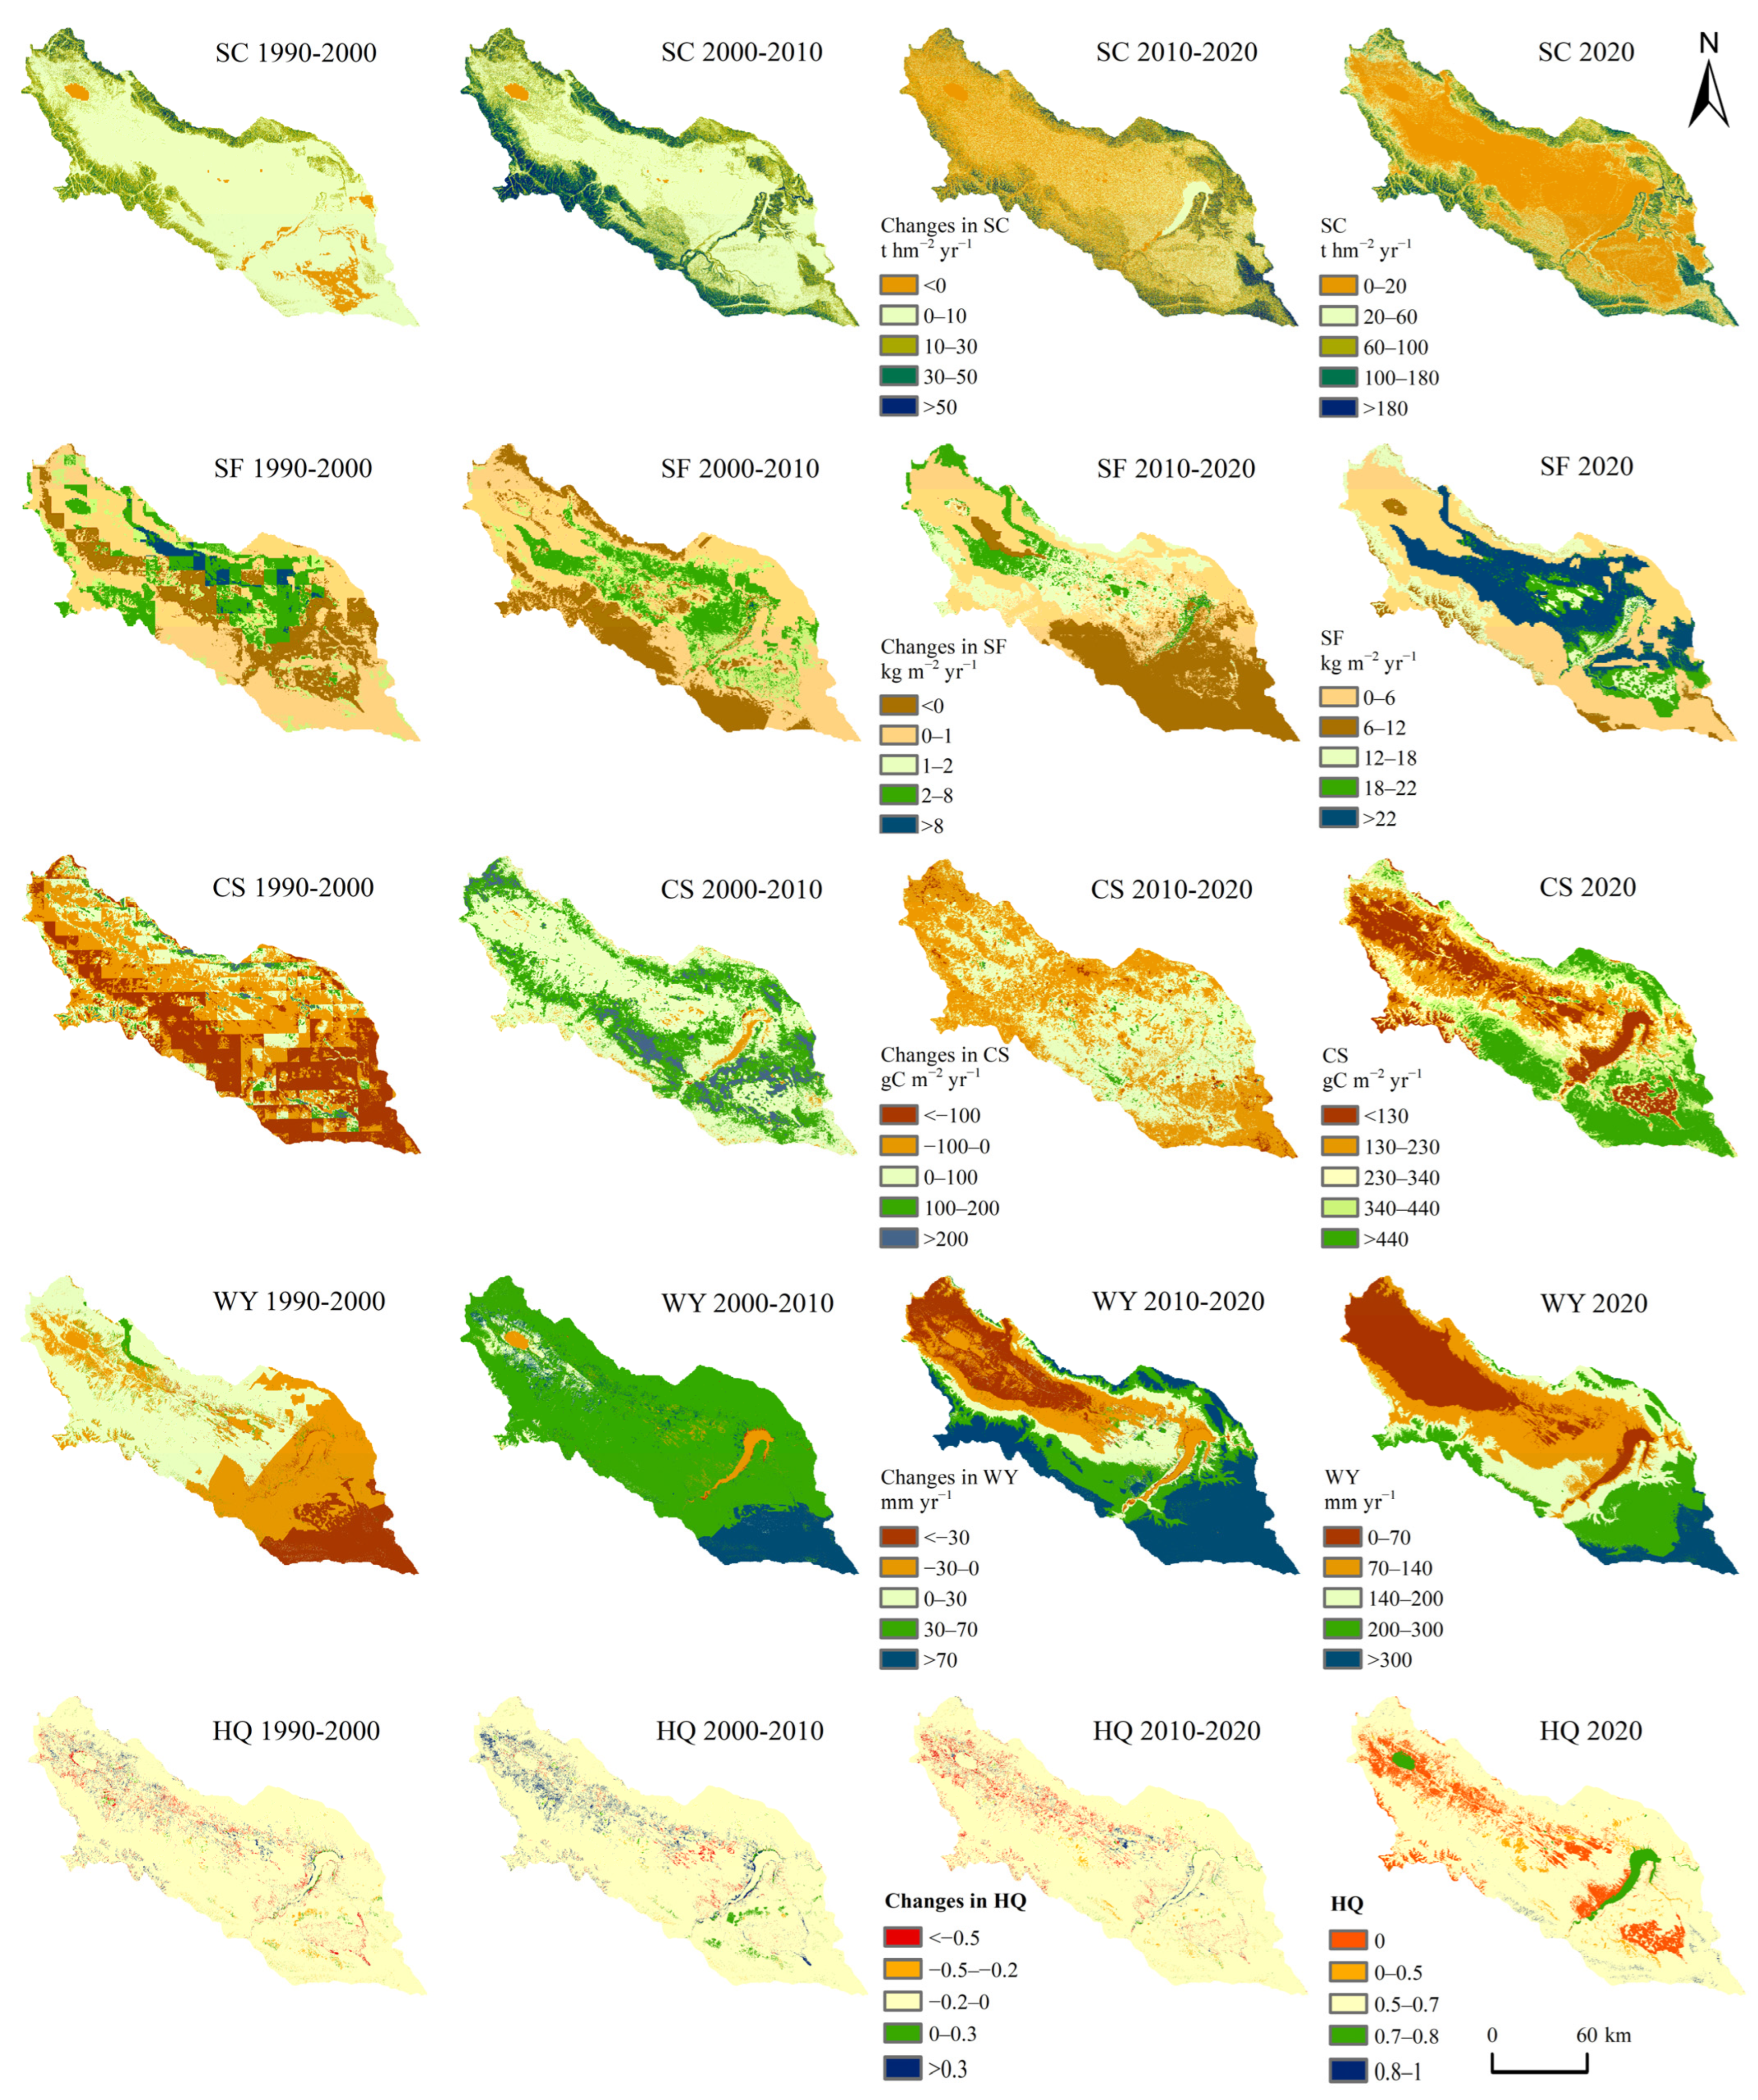
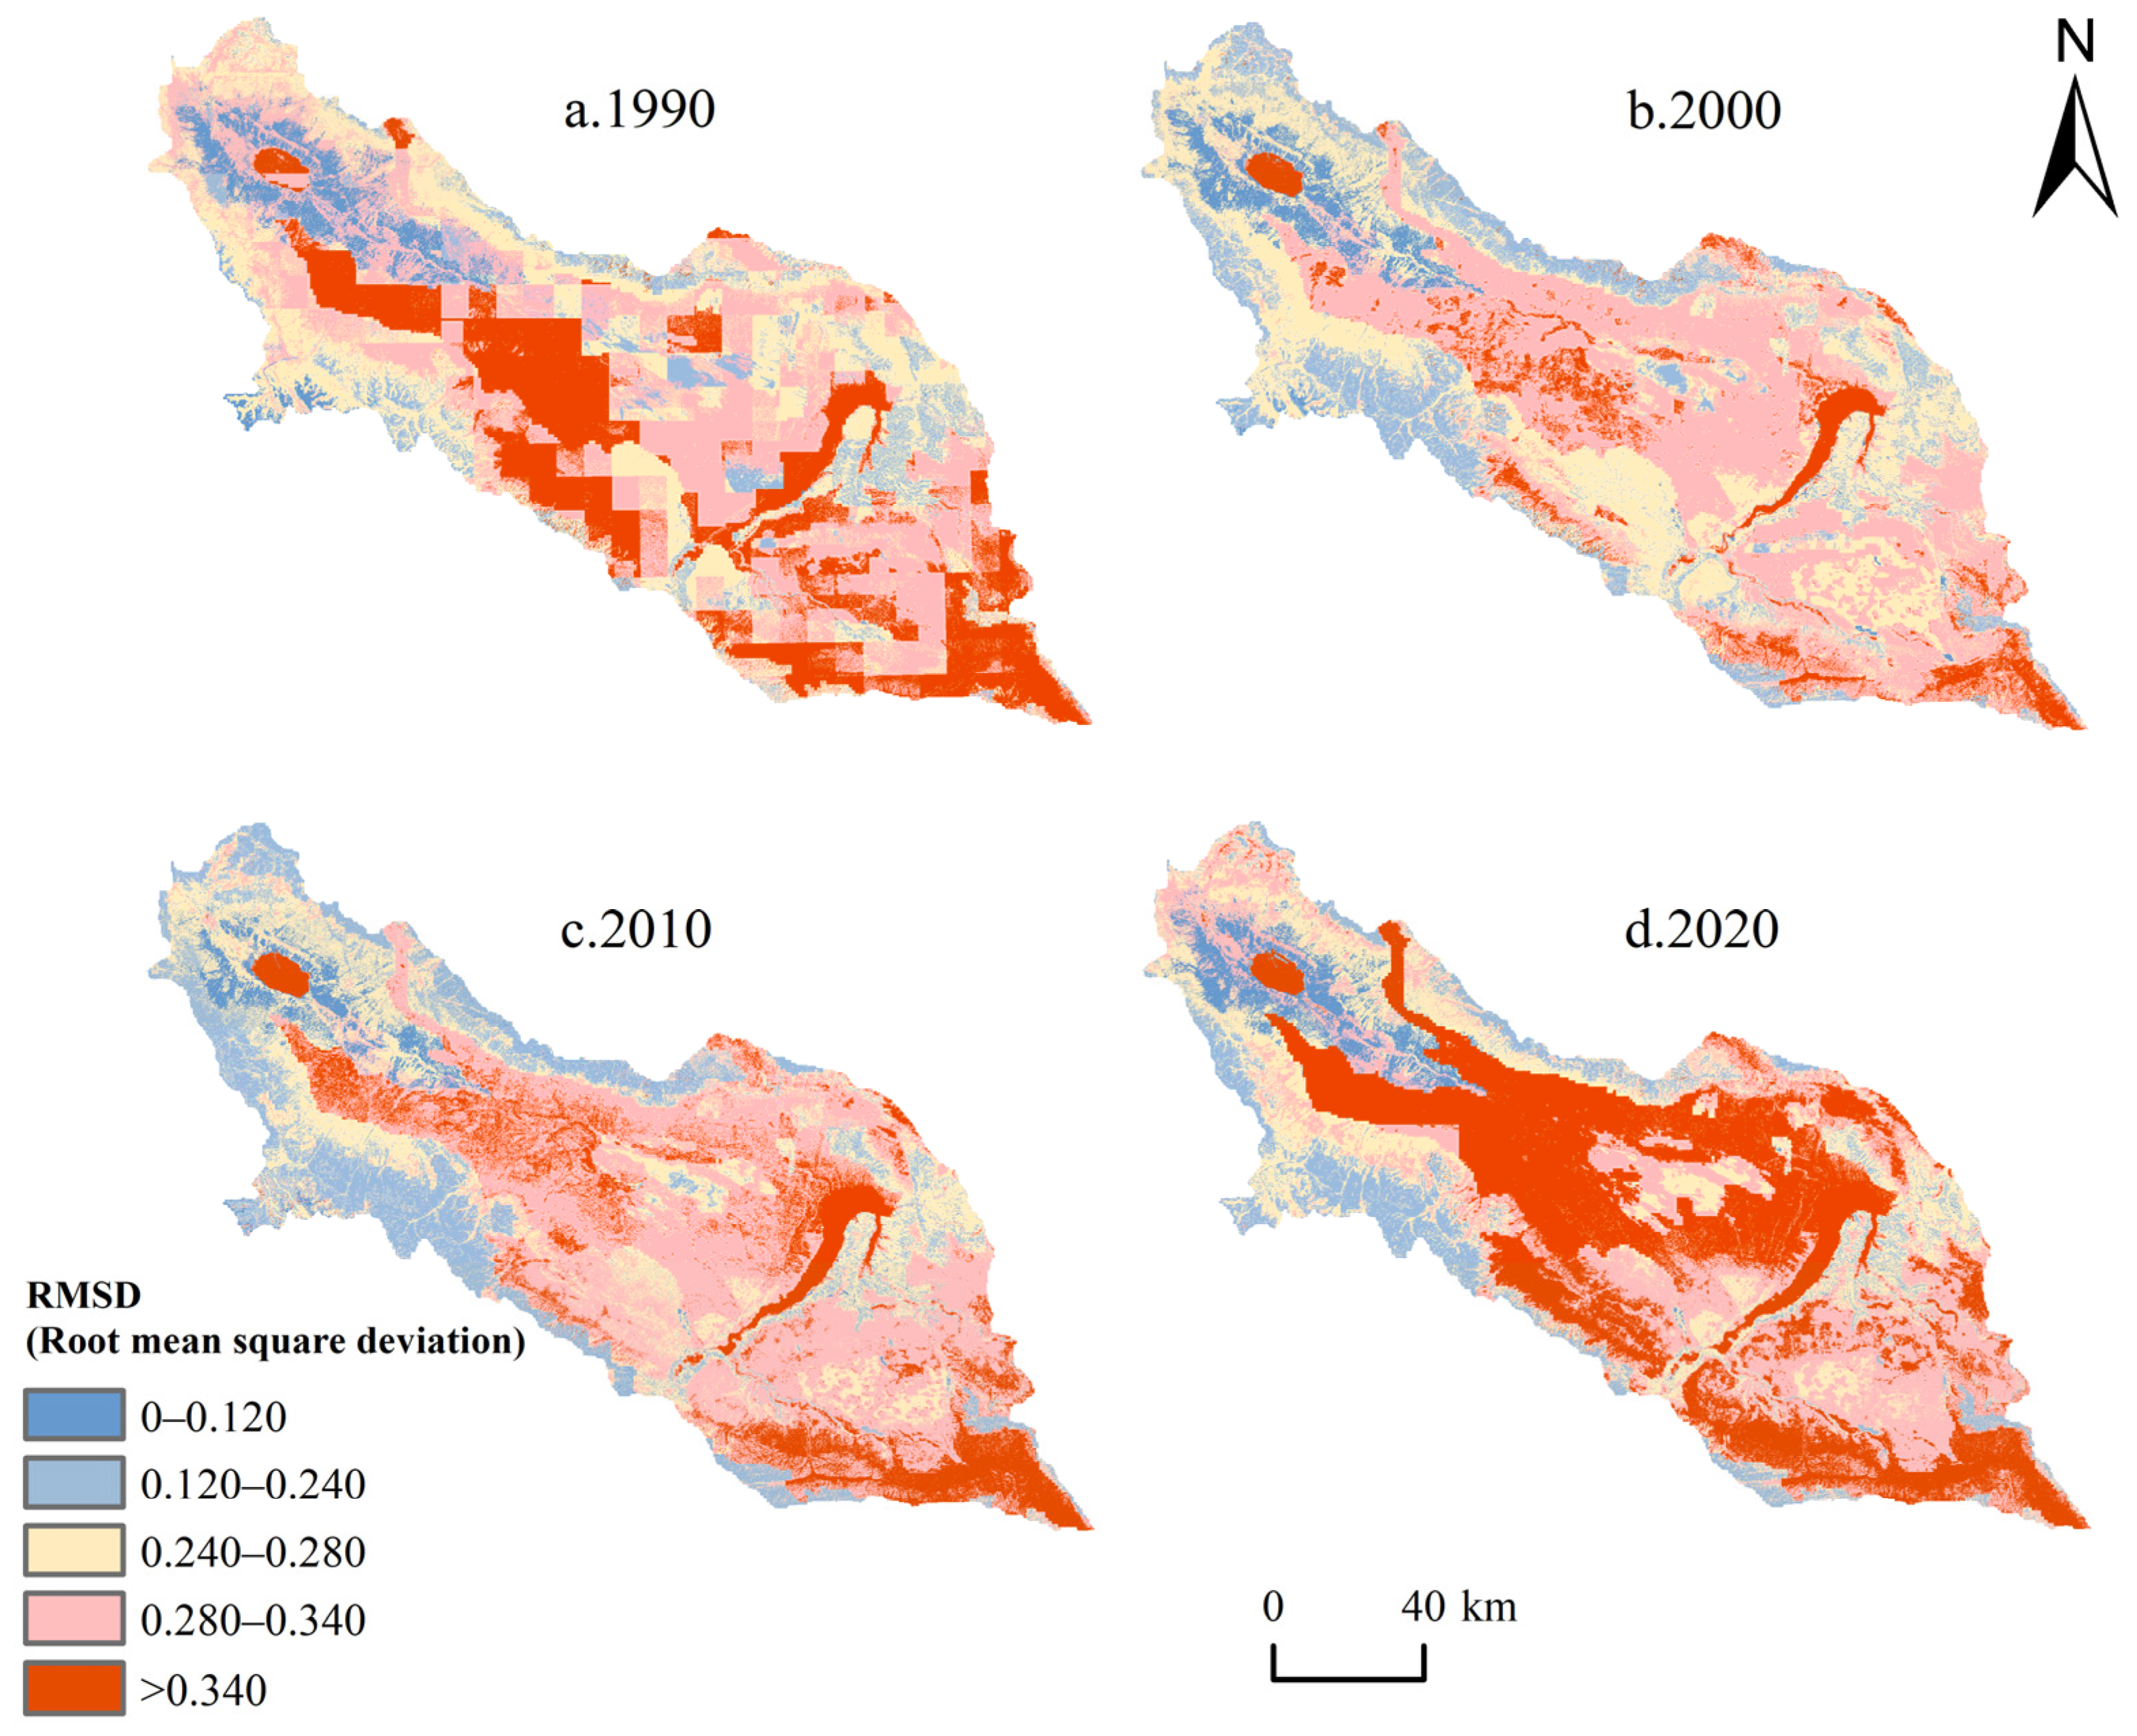
3.1.2. Spatial Variations in Ecosystem Services

The spatial pattern of ecosystem services in the study area represented significant spatial heterogeneity. The spatial distribution of soil conservation, carbon sequestration, water yield, and habitat quality in the Gonghe Basin generally showed an increasing trend from the central region to the surrounding areas, while the sand fixation effect was the opposite (Figure 3). From 1990 to 2000, the areas of increased soil conservation, sand fixation, and water yield were mainly concentrated in the central and western parts of the Gonghe Basin. The carbon sequestration in the entire region exhibited a decreasing trend, while there had been no significant changes in habitat quality. From 2000 to 2010, all five ecosystem services in the study area remarkably increased, with areas of increased soil conservation, carbon sequestration, and water yield covering almost the entire region. The increase in sand fixation was mainly distributed in the central part of the Gonghe Basin, including the moving dunes and fixed dunes, while the edges showed a decreasing trend. Habitat quality was mainly manifested as sporadic increases in the central and western parts of the basin and the Mugetan plain. From 2010 to 2020, the soil sequestration showed a slight decline throughout the region. The decline in sand fixation was mainly distributed in the southeast of the basin, while carbon sequestration decreased significantly in the southeast and west of the region. The decreases in water yield and habitat quality were concentrated in the western region.

3.2. Trade-Offs and Synergies among Ecosystem Services

In order to better understand the relationships among ESs, we explored the relationships between the ESs of the Gonghe Basin in this study, which will provide more targeted suggestions for ecological restoration and promote human well-being.

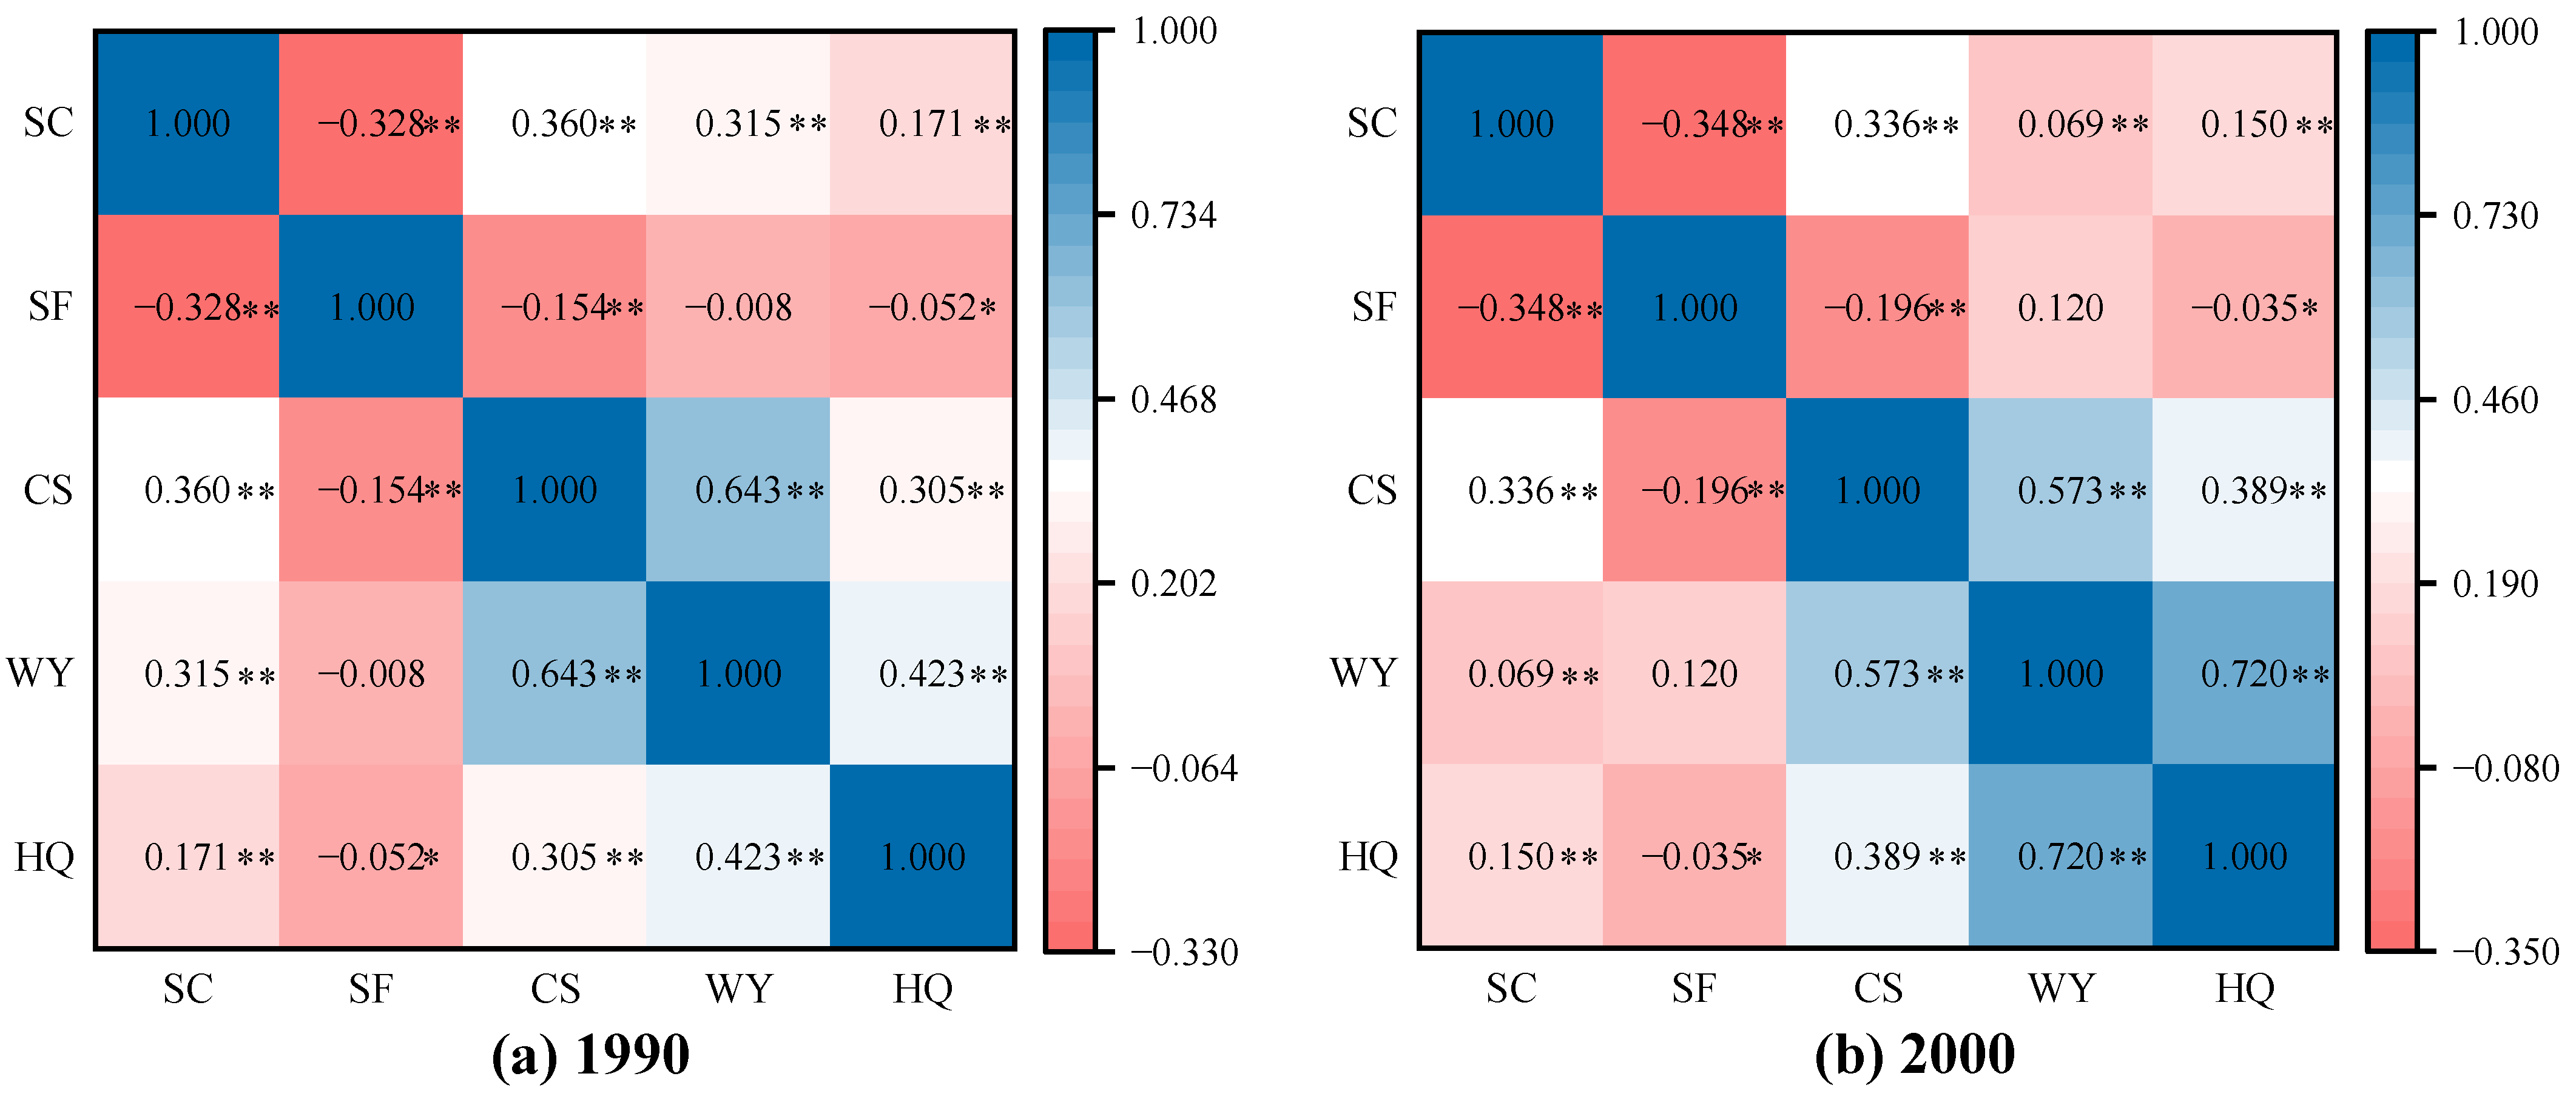
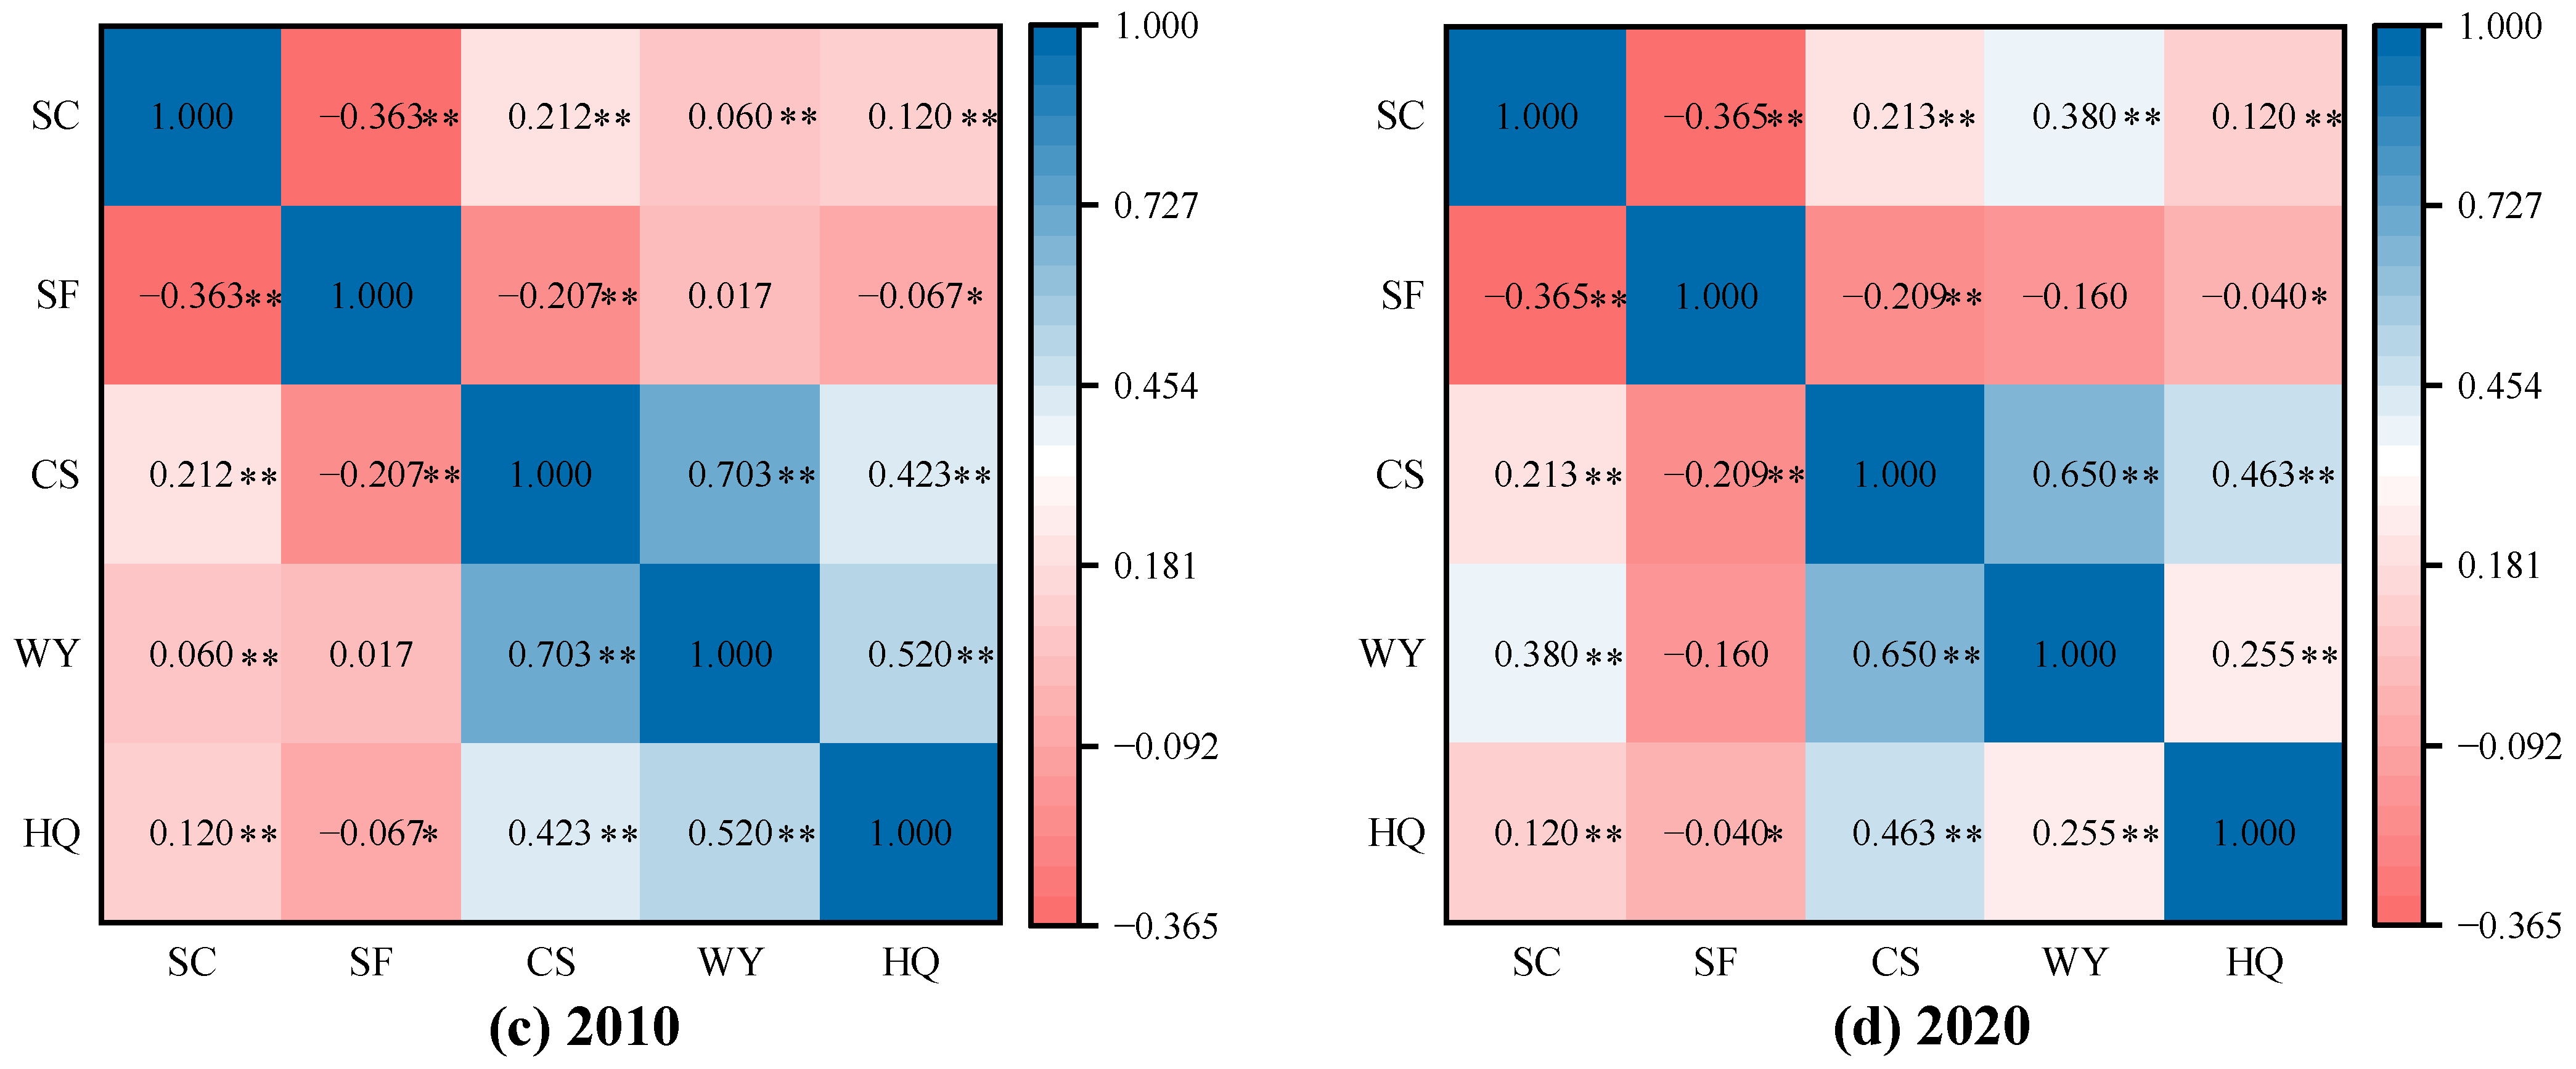
3.2.1. Trade-Offs and Synergies at the Regional Scale

The relationships between ESs in the Gonghe Basin were characterized by strong synergies and weak trade-offs from 1990 to 2020 (Figure 4). The findings revealed that, from 1990 to 2020, significant positive correlations were observed between soil conservation and carbon sequestration, water yield, and habitat quality, as well as between carbon sequestration and water yield and habitat quality, and between water yield and habitat quality, suggesting significant synergies among these ecosystem services. Conversely, significant negative correlations were found between sand fixation with carbon sequestration and habitat quality, and between soil conservation and sand fixation, highlighting significant trade-offs among them. In 1990, carbon sequestration had the strongest synergistic relationship with water yield with a correlation coefficient of 0.643, the strongest synergistic relationship was between water yield and habitat quality in 2000 with a correlation coefficient of 0.573, and the synergy between carbon sequestration and water yield was the strongest in 2010 and 2020, with correlation coefficients of 0.703 and 0.650, respectively. From 1990 to 2020, the strongest trade-off was between soil conservation and sand fixation, with correlation coefficients of −0.328, −0.348, −0.363, and −0.365, respectively.

3.2.2. Trade-Offs and Synergies at the Pixel Scale

There was significant spatial heterogeneity of the trade-off intensity during the research period in Figure 5. We divided the trade-off intensity into five levels: low (0–0.120), moderately low (0.120–0.240), medium (0.240–0.280), moderately high (0.280–0.340), and high (>0.340). The average ecosystem service trade-off intensity in the Gonghe Basin from 1990 to 2020 was 0.292, 0.274, 0.282, and 0.302, respectively. The proportion of moderately high and high ecosystem service trade-off intensity from 1990 to 2020 was 62%, 50%, 58%, and 67%, respectively. From 1990 to 2000, the ecosystem service trade-off intensity in the Gonghe Basin decreased, while it showed an upward trend from 2000 to 2020. On the other hand, ES trade-offs in the study area exhibited significant spatial heterogeneity. Over the past 30 years, regions with high and moderately high trade-off intensity were primarily located in the eastern and central parts of the Gonghe Basin, while areas with low and moderately low trade-off intensity were mainly distributed in the Chaka Salt Lake and along the western edges of the Gonghe Basin. From 1990 to 2000, the areas characterized by high trade-off intensity significantly decreased. Between 2000 and 2010, the areas with high trade-off intensity expanded along the eastern edge, and from 2010 to 2020, the regions with the strongest trade-off intensity extended to most of the east and central parts of the basin, with medium trade-off intensity predominantly distributed in mobile dune areas.

3.3. Impact Factors of Ecosystem Services

According to previous studies, natural and human factors were the main impact factors of ESs in most drylands [16,31,33]. Therefore, considering the characteristics of the Gonghe Basin and data availability, the influencing factors selected in this study included meteorological factors (annual mean precipitation, annual mean temperature), vegetation factors (NDVI), topographic factors (slope, DEM), soil factors (soil type), and land use factors (land use type) to explore the driving mechanisms of ESs using the Geographic detector. And the Geodetector is basically not influenced by the collinearity of independent variable factors (Table S7).

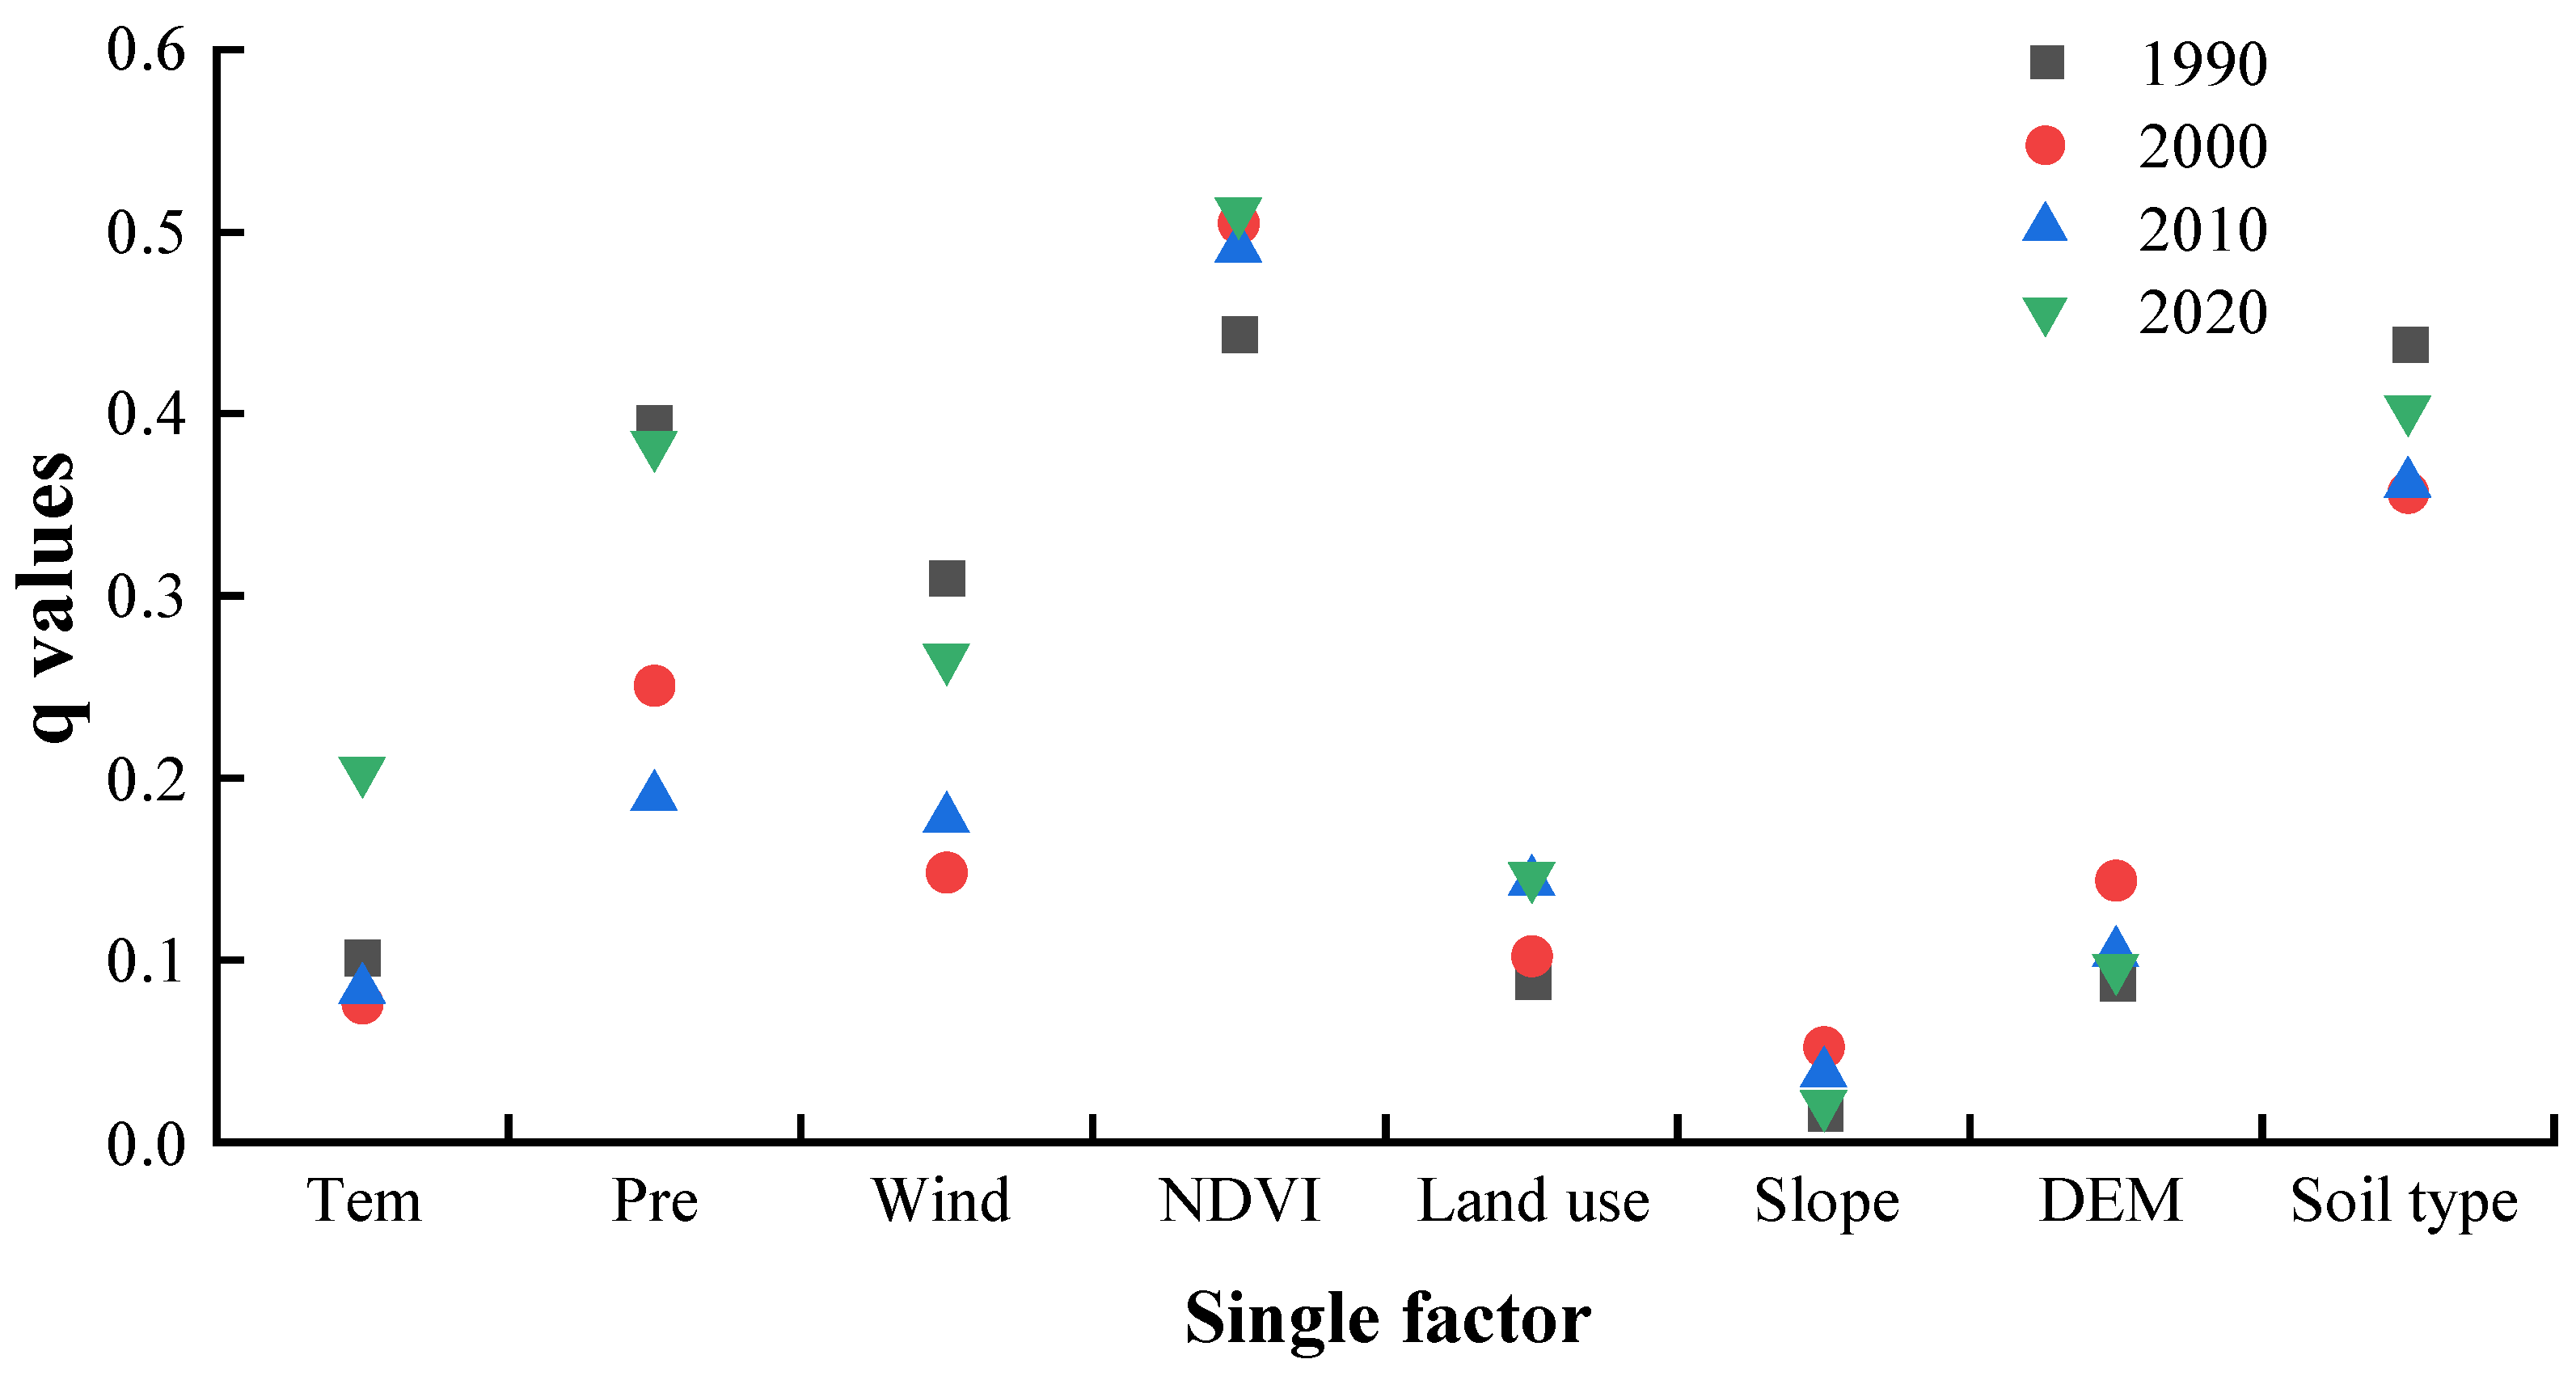
3.3.1. Single Factor Impact on Ecosystem Services

The results of the factor detector in the Geodetector are shown in Figure 6, all of which satisfy the significance test (p < 0.01). From 1990 to 2020, the q values of the dominant impact factors on ecosystem services in descending order were as follows: NDVI > soil type > precipitation > wind speed. NDVI was the most critical factor influencing ecosystem services in the Gonghe Basin, with its explanatory power surpassing 50% in 2000 and 2020, significantly higher than other factors. Soil type, precipitation, wind speed, land use type, and annual average temperature exhibited moderate explanatory power on ecosystem services, while DEM and slope had a weaker influence on ecosystem services. The average q value of the slope was only 0.032, and it had the smallest impact on the spatial heterogeneity of ecosystem services. On the other hand, the explanatory power of temperature, precipitation, and wind speed all declined from 1990 to 2010, followed by an increase from 2010 to 2020. The q value of land use type had been on a rising trend over the past 30 years. The explanatory power of other factors (DEM, slope, and soil type) had not changed much, and their impact on ecosystem services was relatively stable.

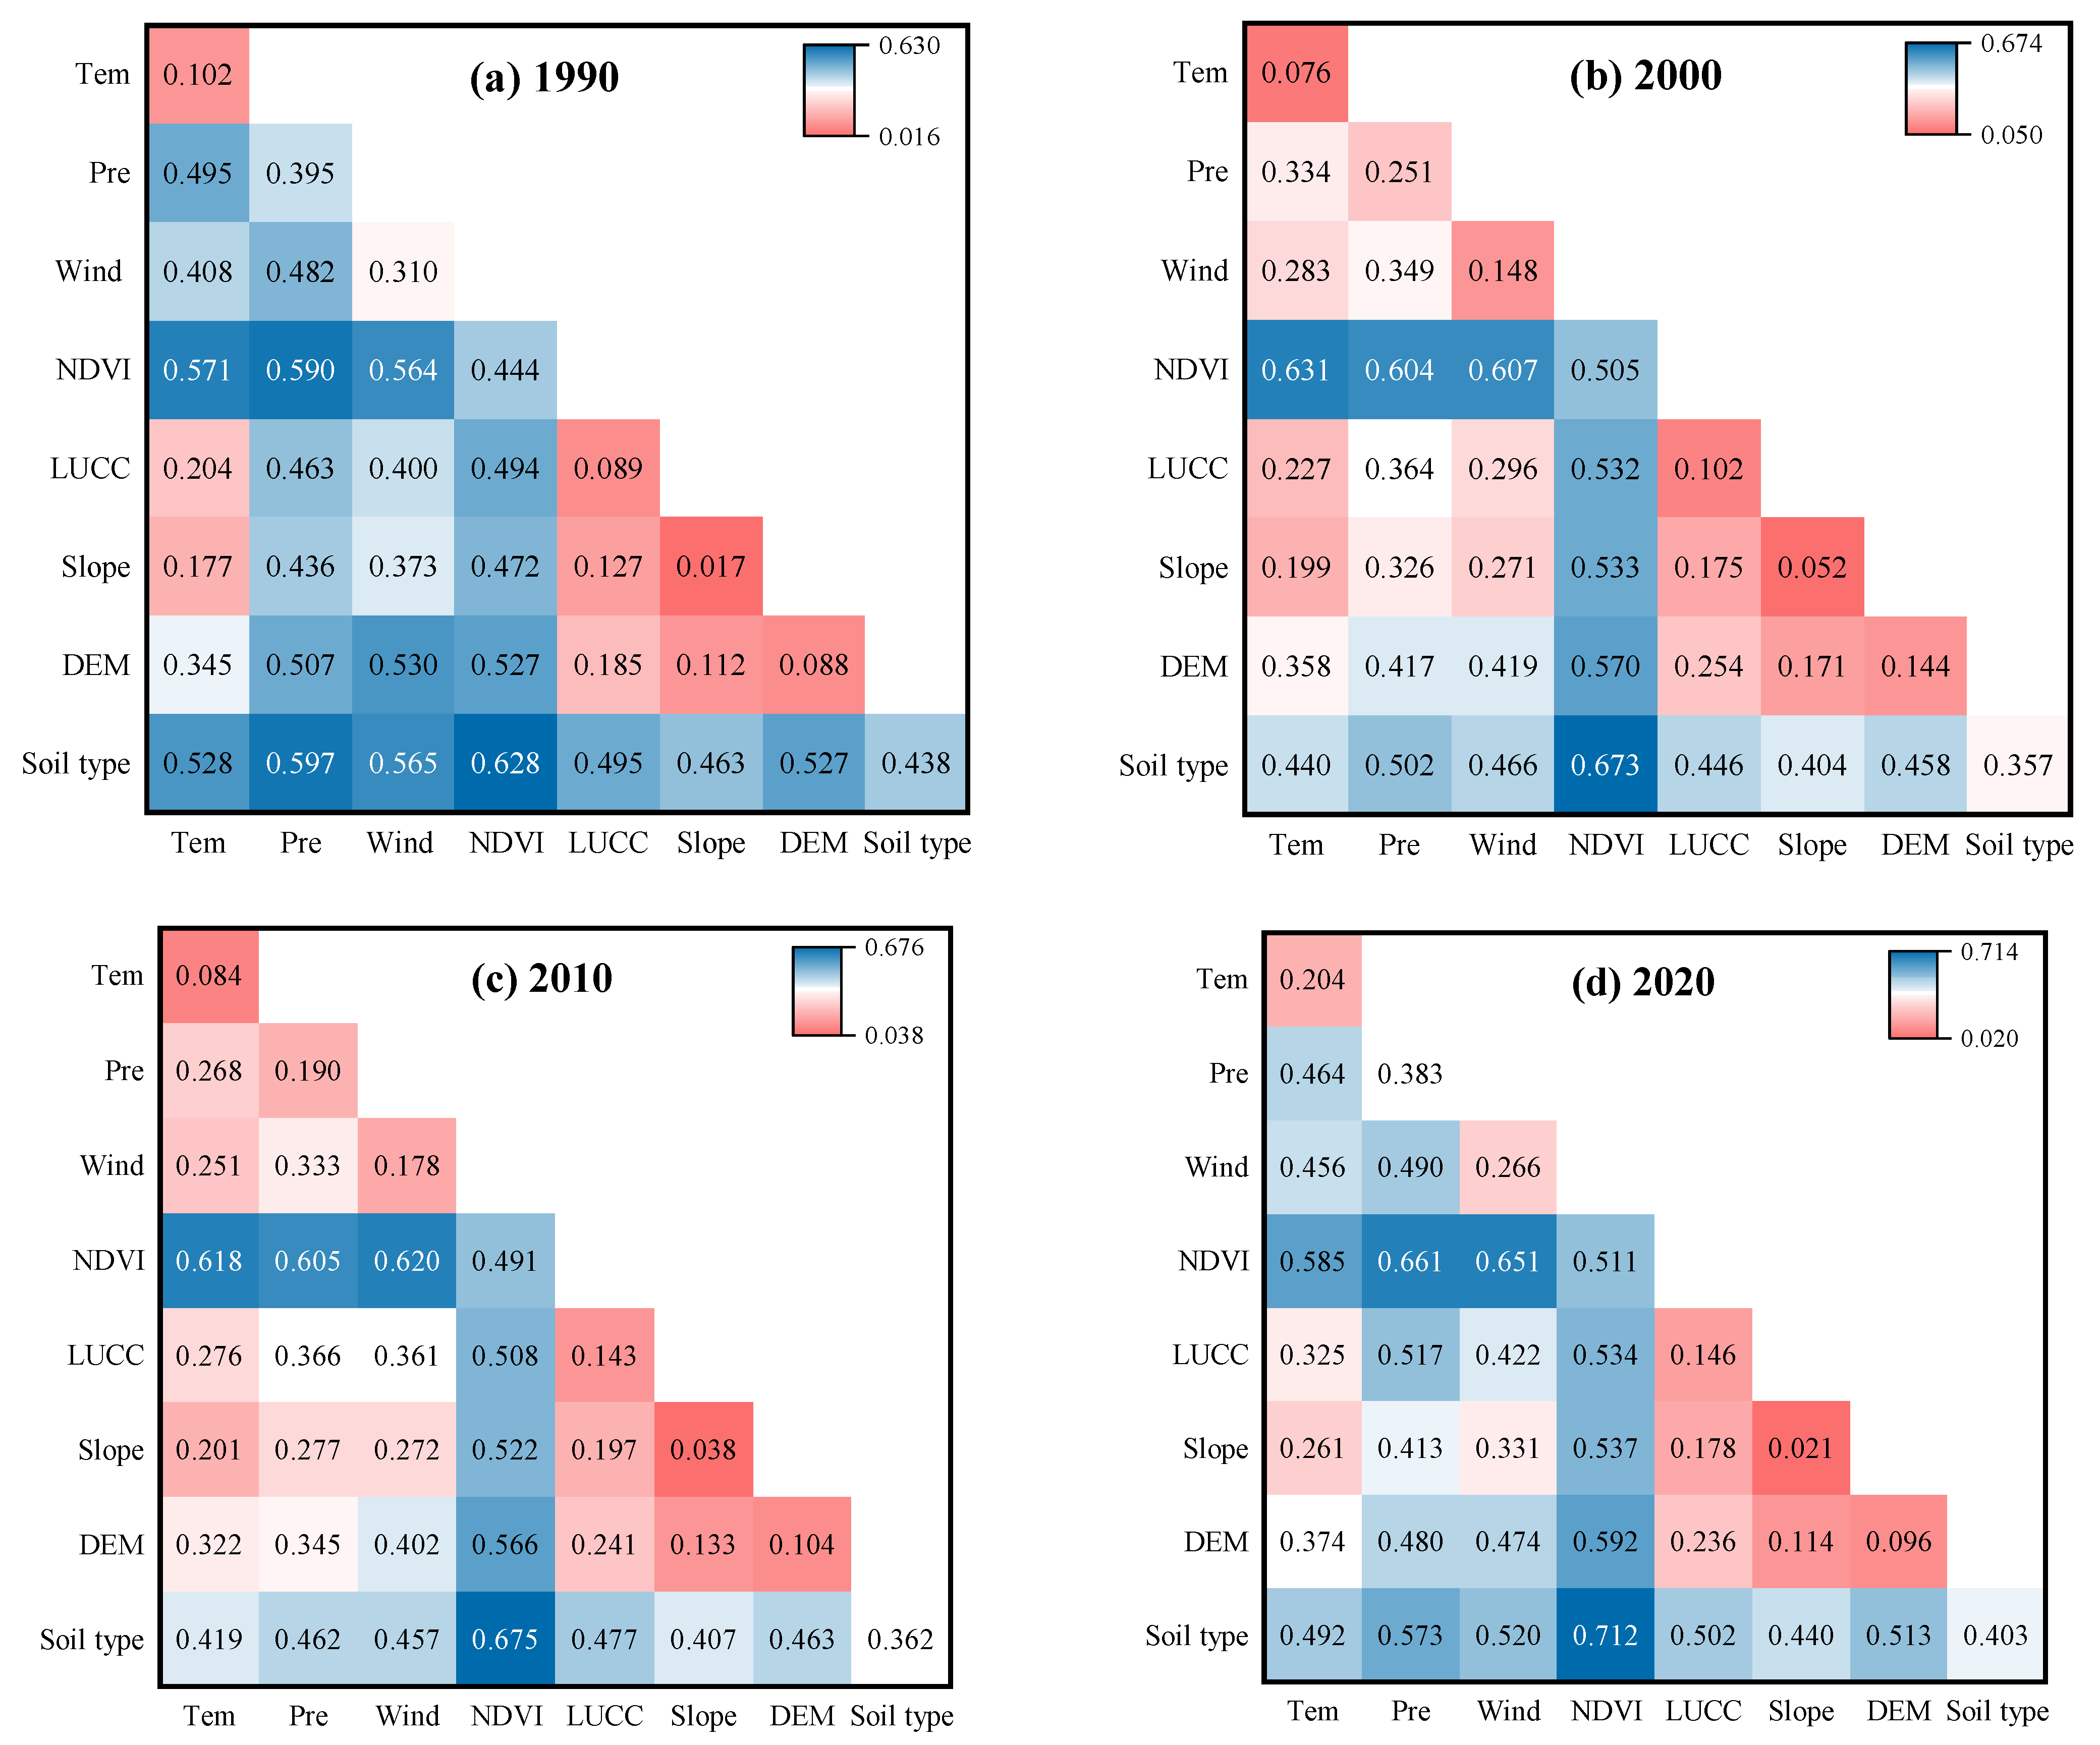
3.3.2. Double-Factor Interactional Impacts on Ecosystem Services

The results of interaction detection indicated that two factors exhibited non-linear enhancement after interaction, which can better explain the driving mechanism of ecosystem services than the effect of a single factor (Figure 7). From 1990 to 2020, the main interaction factors were NDVI ∩ soil type, NDVI ∩ precipitation, NDVI ∩ wind speed, and NDVI ∩ temperature. The explanatory powers of these main interaction factors on the ecosystem services were all higher than 55%. The q value of the DEM ∩ slope was the smallest, which was no more than 0.2. Among these interaction factors, the interaction between NDVI and soil type had the greatest impact on the spatiotemporal changes in ecosystem services in the Gonghe Basin. The q value of NDVI ∩ soil type continued to increase over the past 30 years, increasing from 0.628 to 0.712, significantly higher than the interaction between any other two impact factors. In addition, the interaction between NDVI and soil type with other factors showed a non-linear increasing trend. The explanatory power of NDVI and other factors was greater than 47%, and the explanatory power of soil type and other factors all exceeded 40%. The interaction between NDVI and climate factors had a high explanatory power on ecosystem services, with the influence of NDVI ∩ precipitation increasing and NDVI ∩ temperature decreasing. The explanatory power of the interaction between precipitation and soil type decreased from 1990 to 2010 and then increased to 0.573 by 2020.

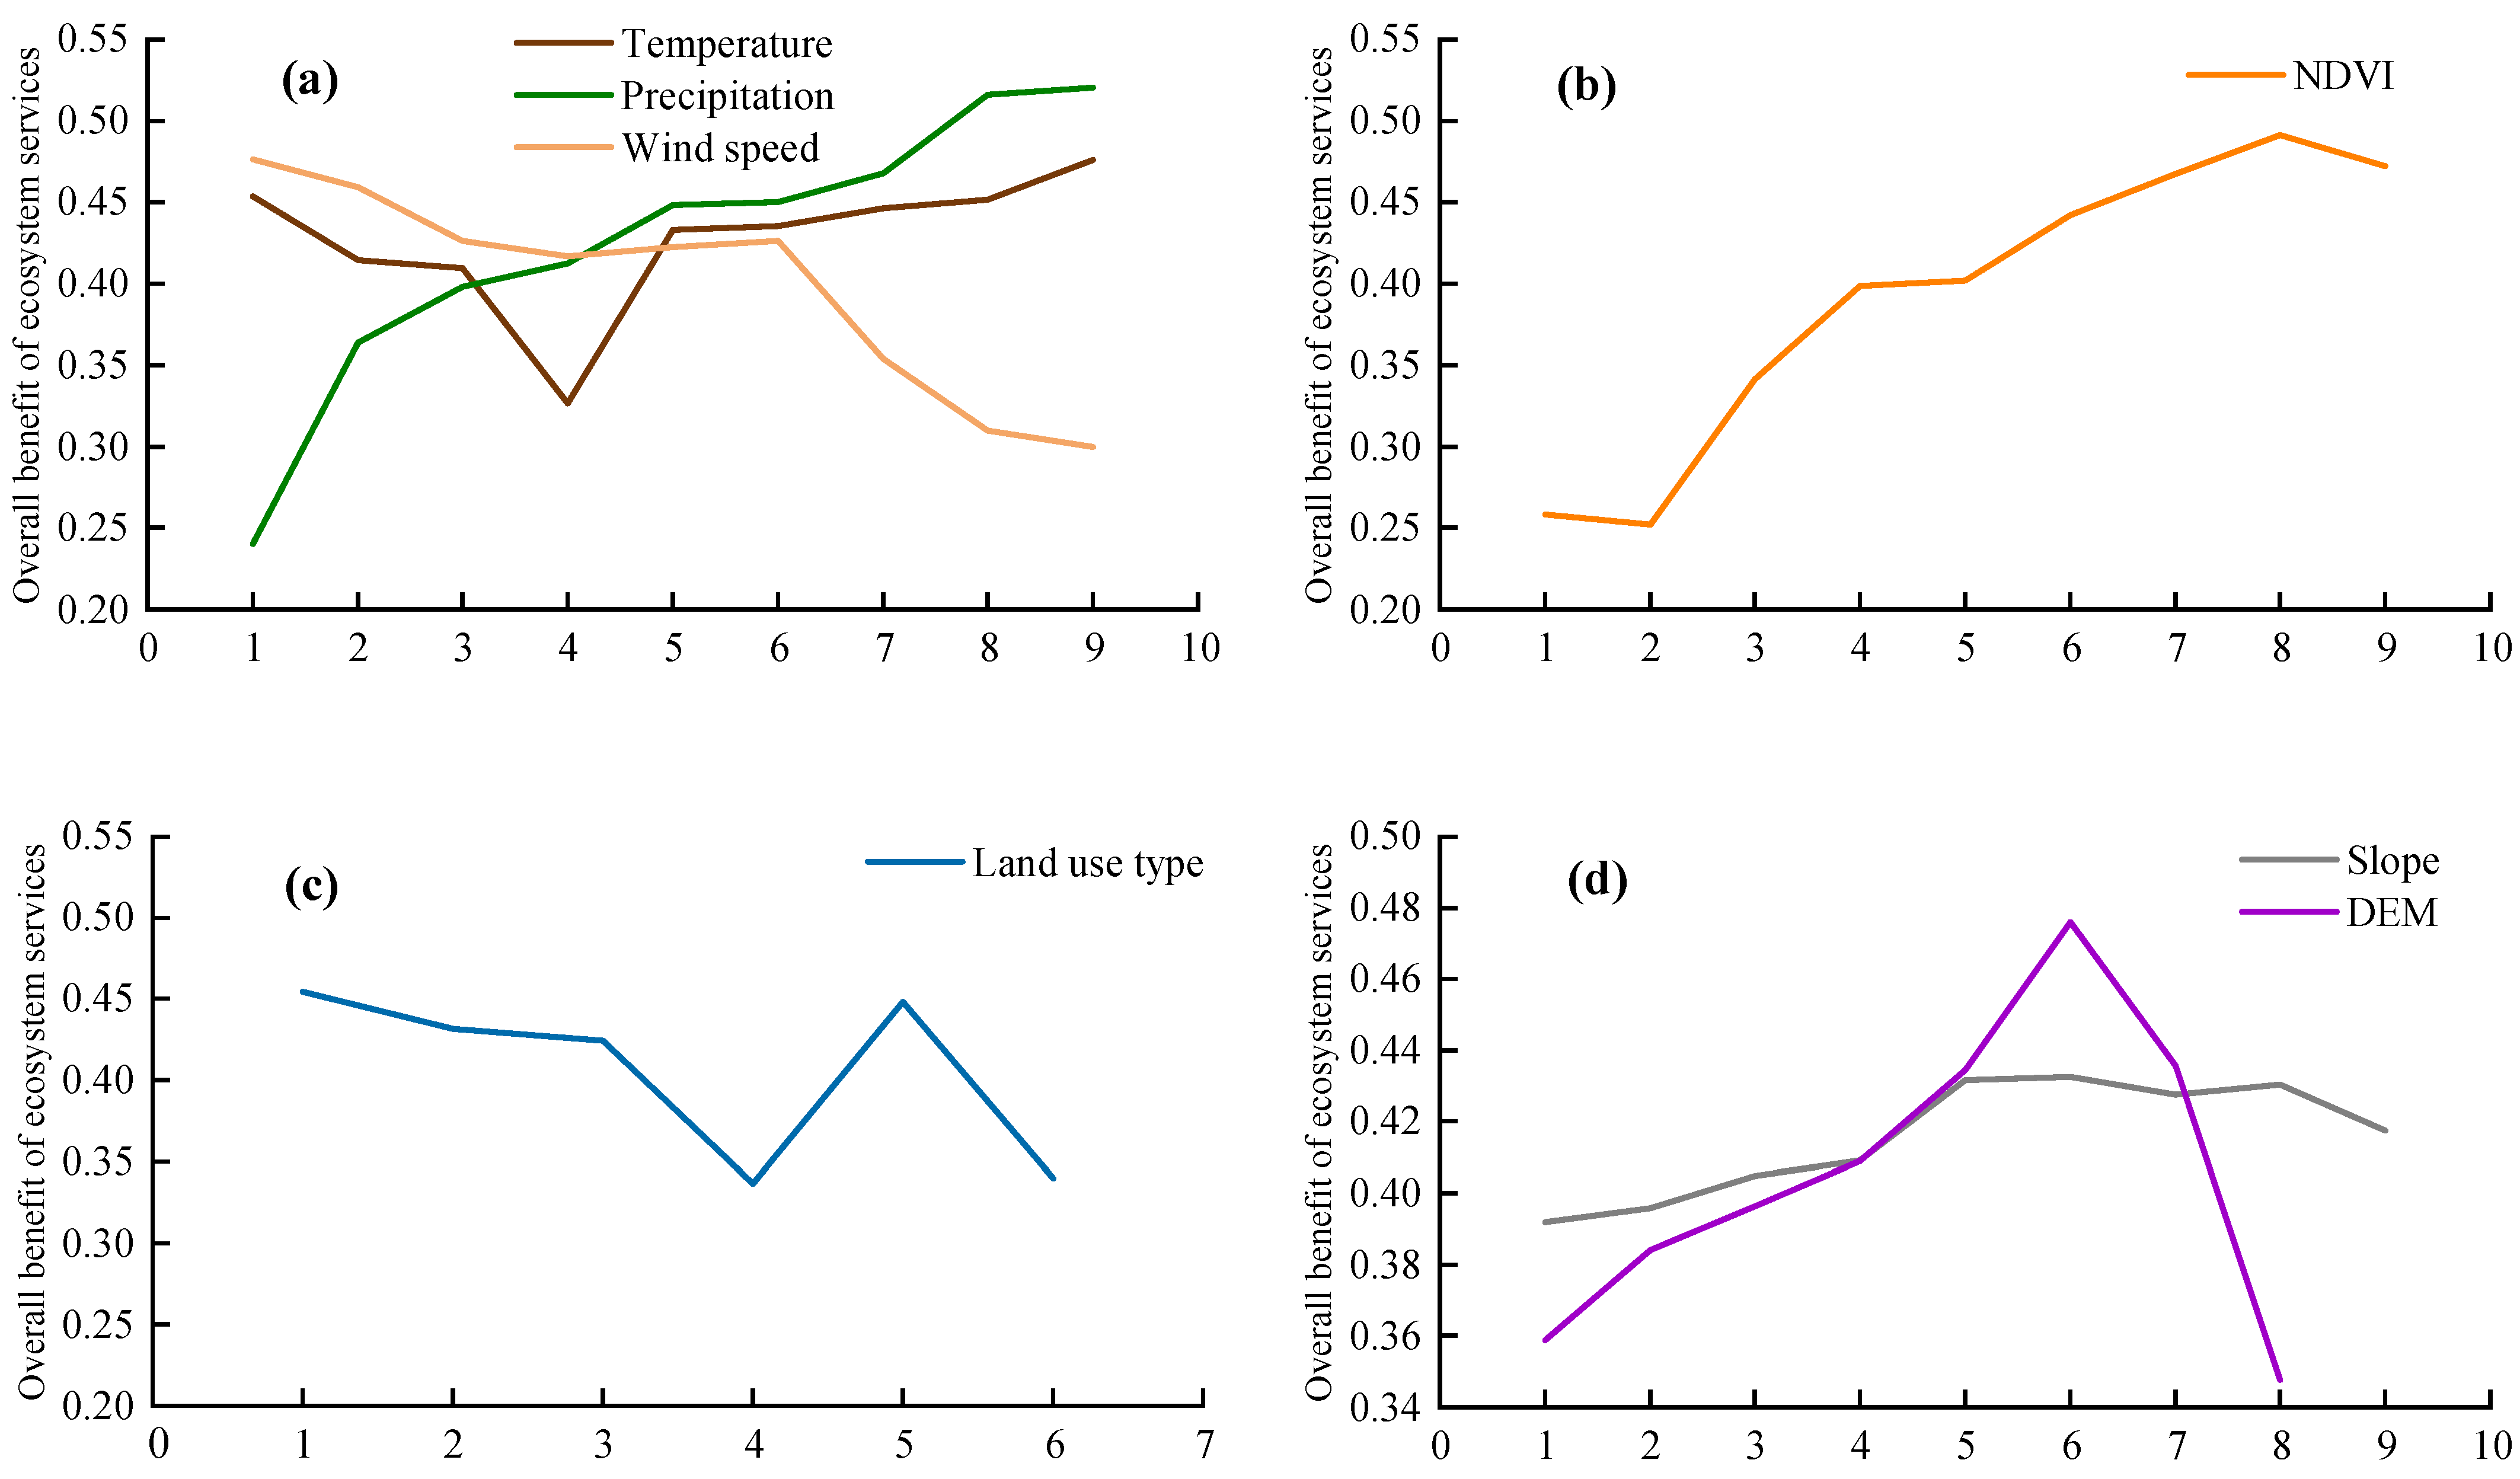
3.3.3. Suitability Zone Analysis

We used the risk detector to detect the suitable range or type of ES promoted by each factor to identify the areas with the highest ecosystem services in each factor partition [40], which passed the significance test at the 95% confidence level. The results of risk detection from 1990 to 2020 are shown in Table 2 and Table 3 and Figure 8. The impact of the annual precipitation, mean annual temperature, and NDVI on the overall benefit of ecosystem services (OB) was significantly higher than that of other factors, and the precipitation had the most substantial impact on ecosystem services. The OB values gradually increased with increased rainfall and NDVI. Meanwhile, OB values gradually decreased with increasing wind speed. As for land use types, forest and cropland were the most suitable for ecosystem services with the highest OB values. In addition, when the slope was between 30.92 and 38.67° and the DEM was between 3711 and 4013 m, the OB values were the highest, with an average of 0.431 and 0.469 over the past 30 years, respectively; beyond these ranges, the ecosystem service function decreased. Among all soil types, alpine meadow soil and marsh soil were more conducive to the ecosystem services in the Gonghe Basin.
By overlaying the risk detection results of various factors in space, Figure 9 shows the distribution of the number of suitable areas in 2020. Overall, the suitable areas for various impact factors were primarily scattered in the eastern and surrounding edges of the Gonghe Basin. A small section of the east Gonghe Basin was identified as having optimal conditions for rainfall, temperature, and wind speed. As for NDVI and land use, the suitable areas were mainly spread across the eastern and central parts of the Gonghe Basin, while the suitable areas of DEM, slope, and soil type were primarily scattered in mountainous regions with higher elevations at the edge of the study area. The quantity of suitable regions exhibits a spatial distribution trend that gradually increases from the northwest toward the southeast. In the Gonghe Basin, the different suitable areas accounted for different proportions: 22.43% for class 1, 8.32% for class 2, 2.64% for class 3, 0.81% for class 4, 0.13% for class 5, and almost 0 for class 6. However, 65.05% of the region (class 0) was not conducive to ecosystem services, predominantly dispersed across the central and northwestern areas of the Gonghe Basin.

4. Discussion

4.1. Changes in Ecosystem Services

The ecosystem service value of the Gonghe Basin was generally low, except for sand fixation (Figure 3). The ecological environment was poor in the northwest inland region with sparse precipitation, resulting in lower soil conservation, carbon sequestration, water wield, and habitat quality compared to coastal and southern regions [67]. In addition, our research results indicated that the sand fixation in the central part of the Gonghe Basin was higher than those in the surrounding mountains, consistent with the spatial distribution of sand fixation in other regions [16,31,33]. The sand fixation in the Hexi Corridor was higher than that in the Qilian Mountains [33], and the sand fixation in deserts and oases was generally higher than that in the mountains.
The research period of this study was from 1990 to 2020, and the long-term scale was more conducive to obtaining the trend characteristics of ES variations. In the past 30 years, all four ecosystem services have increased except for habitat quality (Figure 2). Previous studies had shown that carbon storage, soil conservation, water retention, and food supply significantly increased in the Hexi Corridor from 1980 to 2018, apart from habitat quality [33]. In addition, from 2000 to 2010, all five ecosystem services showed varying degrees of improvement, coinciding with research results in other regions. For example, sand prevention, soil conservation, carbon storage, and water production in the Hunshandak sandy land had all increased from 2000 to 2020 [16], while in the Jiayuguan–Jiuquan region, soil conservation, carbon storage, and water conservation had all significantly improved from 2000 to 2010 [84], which may be related to the implementation of ecological policies. For instance, afforestation, returning farmland to forests and grasslands, and sand fixation measures such as grass squares had accelerated desertification reversal [15,19], increased vegetation coverage, and thus enhanced ecosystem services.

4.2. The Trade-Off and Synergy Relationship of Ecosystem Services

This study explored the relationships among five ecosystem service functions in the Gonghe Basin. It was found that the relationships between ecosystem service functions in the Gonghe Basin were primarily characterized by strong synergies and weak trade-offs, with notable spatial heterogeneity of the trade-offs (Figure 4 and Figure 5). Significant synergistic relationships existed between soil conservation, carbon sequestration, water yield, and habitat quality, with the strongest synergistic relationship between carbon sequestration and water yield and the strongest trade-off between soil conservation and sand fixation. These results are consistent with previous findings in other arid areas. For instance, Ma et al. [74] identified a significant trade-off effect between soil conservation and sand fixation in the arid regions of Central Asia. In the arid inland basins of northwest China, characterized by scarce water resources, a pronounced synergistic relationship was observed between carbon sequestration and water conservation [84]. This finding suggests that soil and water conservation play an essential role in the ecosystem services of the Gonghe Basin, significantly impacting the local ecological environment and human well-being. Furthermore, due to the arid climate and the high intensity of land use in the Gonghe Basin, agricultural activities heavily depend on water sources, leading to a trade-off between habitat quality and sand fixation [85]. Therefore, it is crucial to promote vegetation growth, improve the surrounding ecological environment, and further enhance soil and water conservation capacity. However, due to differences in the scale of the study area and natural geographical environments, our study results also varied from those in other arid regions. For example, with the implementation of restoration projects, water resources in the Loess Plateau have decreased, leading to a trade-off between carbon sequestration and water conservation [86]. Additionally, Chen et al. [87] emphasized the synergistic relationship between water yield and carbon sequestration on the Qinghai–Tibet Plateau. Therefore, a deeper understanding of the natural and social environment of the region is necessary to evaluate the relationship between ecosystem services comprehensively.
The analysis results of RMSD indicated that the intensity of the trade-offs in ecosystem services had gradually increased from 2000 to 2020 (Figure 5), accompanied by an enhanced trade-off between soil conservation and sand fixation. At the same time, the synergistic effect between carbon sequestration and water yield showed an increase from 2000 to 2010 and a decrease from 2010 to 2020 (Figure 4). This indicates that ecological engineering intensified the groundwater consumption in the Gonghe Basin, which may affect the relationships among ecosystem functions and intensify their trade-off effect [88,89]. Therefore, the implementation of ecological policies should be adapted to local conditions. Appropriate vegetation and wind and sand control measures should be selected according to local natural conditions [31] to enhance the synergistic relationship between ecosystem services, minimize the occurrence of trade-offs, and promote the green and healthy development of the regional ecological environment.

4.3. Impacts of Factors on Ecosystem Services

Compared with other factors, NDVI was the dominant factor affecting ecosystem services (Figure 6), and with the increase in NDVI, ecosystem services were enhanced (Figure 8b. This was because NDVI directly reflected the vegetation growth status in the Gonghe sandy land, and the higher the vegetation coverage, the stronger the ecosystem service function. NDVI was mainly affected by precipitation and land use (Table S7). Soil types represent the background conditions of the Gonghe Basin, and different soil types can affect vegetation growth. The most suitable soil type for ecosystem services in the Gonghe Basin was alpine meadow soil (Table 2); previous studies had indicated that the grass felt layer was an essential guarantee of ecological security on the Qinghai–Tibetan Plateau [90]. As for climate factors, precipitation in the Gonghe Basin had shown an increasing trend over the past 30 years, with temperatures and wind speed decreasing [91,92]. This will reduce evaporation, increase vegetation productivity, alleviate soil erosion, and improve ecosystem services [93,94,95]. The impact of land use type had been on a rising trend over the past 30 years (Figure 6), correlating with the implementation of ecological policies and the development of urbanization. The changes in land use significantly influenced ecosystem services worldwide [96,97]. Under the promotion of restoration projects such as the Grain for Green Project and desertification control [15,98], the bare land decreased from 1990 to 2020 (Figure 10); this led to a significant increase in ecosystem services from 2000 to 2010 (Figure 2). The results in this research were consistent with previous studies on ecosystem service restoration in the Hunshandak sandy land and BTSSR [16,30,94]. However, the decline in habitat quality in the Gonghe Basin was related to the interference of human activities and the expansion of urbanization [99,100]. DEM and slope had the slightest influence on the spatial heterogeneity of ecosystem service functions; although research had found that soil erosion increased with the increase in slope [40,101,102], it had little impact on overall ecosystem services in this study.
The impact of interaction factors on ESs was more significant than that of individual factor effects (Figure 6), implying that ESs in the Gonghe Basin were not controlled by a single impact factor, which was an integrative effect of various factors; this was consistent with previous research findings [103,104]. The interaction detection results indicated that the interaction between NDVI and soil type was remarkably higher than the other two factors. This mainly reflected that the ecosystem services were due to the combined effects of natural and human factors in the Gonghe Basin. Xu et al. [31] found that NDVI promotes ecosystem services in the sandy areas of northern China. With the implementation of ecological engineering, the higher the vegetation coverage, the more suitable soil types will be for vegetation growth and the higher the potential of surface cover to maintain ecosystem services [16]. The explanatory power of the DEM ∩ slope had always been small, indicating that terrain factors had little effect on ecosystem services. The problem of desertification in China is becoming increasingly severe, and the formation and evolution of desertification are influenced by natural factors and human activities [20,21,22,23]. Both natural and social factors also influence the ecosystem services in the Gonghe Basin, and these research results were consistent with the research results in northern China [31], the Hunshandak sandy land [16], the Hexi Corridor [33], and BTSSR [30]. Previous studies have shown that ecological engineering can improve ecosystem service functions, such as reducing soil wind erosion [25] and increasing vegetation, which can enhance carbon sequestration [105]. At the same time, ecological engineering may lead to environmental imbalance, so we should choose appropriate water-saving vegetation based on the soil type of the Gonghe Basin.
The southeastern edge of the Gonghe Basin had diverse vegetation types (Figure 9), high rainfall, and low wind speed, which were conducive to the functioning of ecosystem services [40,93]. In addition, most areas in the central and western parts of the Gonghe Basin were unsuitable for ecosystem services. Therefore, we should strengthen our attention to these regions, adopt appropriate ecological engineering measures, improve ecosystem service functions, and promote high-quality regional development in the Gonghe Basin. The disparity in desert ecosystem services between the eastern and western parts of the Gonghe Basin comes from the different causes of desertification. And future research can further explore the mechanism of desertification formation.

4.4. Limitations

Due to limited data acquisition, this research only analyzed five ecosystem service functions and cannot fully reflect the ecosystem pattern of the region. In addition, the climate, vegetation, soil, terrain, and other data required by the model have different resolutions and accuracy, affecting the precision of ecosystem service assessment. We studied the ES spatiotemporal variations over a long period, neglecting the validation of the model. Furthermore, the impact factors discovered in the study were primarily natural factors, with human factors limited to the selection of land use type, without considering socioeconomic factors such as GDP, population density, and grazing pressure.

5. Conclusions

This study evaluated the spatiotemporal evolution of ecosystem services in the Gonghe Basin from 1990 to 2020 and analyzed the relationships among ESs using the Pearson correlation coefficient and root mean square deviation (RMSD) and explored the driving mechanism of ecosystem services. The main conclusions are as follows: (1) from 1990 to 2020, the overall benefit of ecosystem services in the Gonghe Basin had markedly increased due to the implementation of ecological engineering; (2) the synergy was the dominant relationship among ESs in the Gonghe Basin. However, the intensity of ecosystem services trade-offs significantly increased from 2010 to 2020; (3) NDVI was the most important factor affecting ecosystem services, and the interaction between NDVI and soil type had the greatest explanatory power for the spatial variation in ESs. This study enhanced our understanding of ecosystem services in drylands, and the results thus provide important support for local governments to make more appropriate policies in desertification combating and to facilitate sustainable development in the Gonghe Basin. However, some challenges should be dealt with in future research: (1) more ecosystem services should be selected for evaluation and more in-depth studies on the trade-offs and synergies among ESs; (2) more measured data should be obtained in the field for model verification and mechanism analysis to increase the certainty of the conclusions; and (3) we should accurately distinguish the impact of climate factors and ecological engineering on ESs in the Gonghe Basin.

Supplementary Materials

The following supporting information can be downloaded at: https://www.mdpi.com/article/10.3390/rs16132460/s1, Table S1: p value of different land use types, Table S2: Static parameter table, Table S3: Biophysical table, Table S4: Attributes of threat factors, Table S5: Habitat sensitivity to threats, Table S6: Comparison of the results of five ecosystem services with previous studies, Table S7: Pearson correlations between pairs of influencing factors by Geographical detector in 2020. References [72,73,74,75,76,77,78,79,80,81,82,83] are cited in the Supplementary Materials.

Author Contributions

Conceptualization, H.J. and J.L.; data curation and investigation, H.J., S.Y., R.W., Z.L. and H.L.; methodology, H.J., L.L. and J.L.; writing—original draft, H.J.; writing—review and editing, H.J. and J.L. All authors have read and agreed to the published version of the manuscript.

Funding

This research was funded by the National Natural Science Foundation of China (Grant No. 42330502); the Second Tibetan Plateau Scientific Expedition and Research Program (STEP, Grant No. 2019QZKK0906); and the National Natural Science Foundation of China (Grant No. 42201168).

Data Availability Statement

The source of relevant data acquisition has been described in the text.

Acknowledgments

The authors would like to thank the anonymous reviewers for their valuable comments and the editors’ help with this article.

Conflicts of Interest

The authors declare no conflicts of interest.

References

  1. Costanza, R.; d’Arge, R.; De Groot, R.; Farber, S.; Grasso, M.; Hannon, B.; Limburg, K.; Naeem, S.; O’neill, R.V.; Paruelo, J. The value of the world’s ecosystem services and natural capital. Nature 1997, 387, 253–260. [Google Scholar] [CrossRef]
  2. Millennium Ecosystem Assessment. Ecosystems and Human Well-Being; Island Press: Washington, DC, USA, 2005; Volume 5. [Google Scholar]
  3. Keesstra, S.; Nunes, J.; Novara, A.; Finger, D.; Avelar, D.; Kalantari, Z.; Cerdà, A. The superior effect of nature based solutions in land management for enhancing ecosystem services. Sci. Total Environ. 2018, 610, 997–1009. [Google Scholar] [CrossRef] [PubMed]
  4. Balkanlou, K.R.; Müller, B.; Cord, A.F.; Panahi, F.; Malekian, A.; Jafari, M.; Egli, L. Spatiotemporal dynamics of ecosystem services provision in a degraded ecosystem: A systematic assessment in the Lake Urmia basin, Iran. Sci. Total Environ. 2020, 716, 137100. [Google Scholar] [CrossRef] [PubMed]
  5. Staudinger, M.D.; Grimm, N.B.; Staudt, A.; Carter, S.L.; Chapin, F.S. Impacts of Climate Change on Biodiversity, Ecosystems, and Ecosystem Services; United States Global Change Research Program: Washington, DC, USA, 2012; p. 139. [Google Scholar]
  6. Mahmoud, S.H.; Gan, T.Y. Impact of anthropogenic climate change and human activities on environment and ecosystem services in arid regions. Sci. Total Environ. 2018, 633, 1329–1344. [Google Scholar] [CrossRef] [PubMed]
  7. Kuriqi, A.; Pinheiro, A.N.; Sordo-Ward, A.; Garrote, L. Water-energy-ecosystem nexus: Balancing competing interests at a run-of-river hydropower plant coupling a hydrologic–ecohydraulic approach. Energy Convers. Manag. 2020, 223, 113267. [Google Scholar] [CrossRef]
  8. Stringer, L.C.; Mirzabaev, A.; Benjaminsen, T.A.; Harris, R.M.; Jafari, M.; Lissner, T.K.; Stevens, N.; Tirado von der Pahlen, C. Climate change impacts on water security in global drylands. One Earth 2021, 4, 851–864. [Google Scholar] [CrossRef]
  9. Li, C.; Fu, B.; Wang, S.; Stringer, L.C.; Wang, Y.; Li, Z.; Liu, Y.; Zhou, W. Drivers and impacts of changes in China’s drylands. Nat. Rev. Earth Environ. 2021, 2, 858–873. [Google Scholar] [CrossRef]
  10. Reynolds, J.F.; Smith, D.M.S.; Lambin, E.F.; Turner, B.L.; Mortimore, M.; Batterbury, S.P.J.; Downing, T.E.; Dowlatabadi, H.; Fernández, R.J.; Herrick, J.E.; et al. Global Desertification: Building a Science for Dryland Development. Science 2007, 316, 847–851. [Google Scholar] [CrossRef]
  11. Poulter, B.; Frank, D.; Ciais, P.; Myneni, R.B.; Andela, N.; Bi, J.; Broquet, G.; Canadell, J.G.; Chevallier, F.; Liu, Y.; et al. Contribution of Semi-Arid Ecosystems to Interannual Variability of the Global Carbon Cycle. Nature 2014, 509, 600–603. [Google Scholar] [CrossRef]
  12. Li, C.; Fu, B.; Wang, S.; Stringer, L.C.; Zhou, W.; Ren, Z.; Hu, M.; Zhang, Y.; Rodriguez-Caballero, E.; Weber, B.; et al. Climate-Driven Ecological Thresholds in China’s Drylands Modulated by Grazing. Nat. Sustain. 2023, 6, 1363–1372. [Google Scholar] [CrossRef]
  13. Zhu, Z.; Chen, G. Sandy Desertification in China; Science Press: Beijing, China, 1994; pp. 20–33. [Google Scholar]
  14. Su, W.; Han, G.; Ye, D.; Cao, G. Remote sensing evaluation and driving force analysis of ecological environment in Gonghe Basin. J. Desert Res. 2023, 43, 74–84. [Google Scholar]
  15. Jia, H.; Wang, R.; Li, H.; Diao, B.; Zheng, H.; Guo, L.; Liu, L.; Liu, J. The Changes of Desertification and Its Driving Factors in the Gonghe Basin of North China over the Past 10 Years. Land 2023, 12, 998. [Google Scholar] [CrossRef]
  16. Liu, X.; Li, L.; Qin, F.; Li, Y.; Chen, J.; Fang, X. Ecological policies enhanced ecosystem services in the Hunshandak sandy land of China. Ecol. Indic. 2022, 14, 109450. [Google Scholar] [CrossRef]
  17. Li, S.; Yan, C.; Song, X.; Xie, J.; Duan, H. Remote Sensing Investigation of Aeolian Desertification in Longyangxia Reservoir in Rencent 30 Years. J. Desert Res. 2011, 31, 836–841. [Google Scholar]
  18. Fang, X.; Wu, J. Causes of overgrazing in Inner Mongolian grasslands: Searching for deep leverage points of intervention. Ecol. Soc. 2022, 27, 8. [Google Scholar] [CrossRef]
  19. Zhang, C.; Li, Q.; Shen, Y.; Zhou, N.; Wang, X.; Li, J.; Jia, W. Monitoring of Aeolian Desertification on the Qinghai-Tibet Plateau from the 1970s to 2015 Using Landsat Images. Sci. Total Environ. 2018, 619, 1648–1659. [Google Scholar] [CrossRef] [PubMed]
  20. Li, Q.; Zhang, C.; Shen, Y.; Jia, W.; Li, J. Quantitative Assessment of the Relative Roles of Climate Change and Human Activities in Desertification Processes on the Qinghai-Tibet Plateau Based on Net Primary Productivity. Catena 2016, 147, 789–796. [Google Scholar] [CrossRef]
  21. Duan, H.; Wang, T.; Xue, X.; Yan, C. Dynamic monitoring of aeolian desertification based on multiple indicators in Horqin Sandy Land, China. Sci. Total Environ. 2019, 650, 2374–2388. [Google Scholar] [CrossRef]
  22. Guo, B.; Wei, C.; Yu, Y.; Liu, Y.; Li, J.; Meng, C.; Cai, Y. The Dominant Influencing Factors of Desertification Changes in the Source Region of Yellow River: Climate Change or Human Activity? Sci. Total Environ. 2022, 813, 152512. [Google Scholar] [CrossRef]
  23. Zhou, Y.; Hu, Z.; Geng, Q.; Ma, J.; Liu, J.; Wang, M.; Wang, Y. Monitoring and analysis of desertification surrounding Qinghai Lake (China) using remote sensing big data. Environ. Sci. Pollut. Res. 2023, 30, 17420–17436. [Google Scholar] [CrossRef]
  24. Wu, Z.; Wu, J.; Liu, J.; He, B.; Lei, T.; Wang, Q. Increasing terrestrial vegetation activity of ecological restoration program in the Beijing-Tianjin Sand Source Region of China. Ecol. Eng. 2013, 52, 37–50. [Google Scholar] [CrossRef]
  25. Du, H.; Liu, X.; Jia, X.; Li, S.; Fan, Y. Assessment of the effects of ecological restoration projects on soil wind erosion in northern China in the past two decades. Catena 2022, 215, 106360. [Google Scholar] [CrossRef]
  26. Song, S.; Zhang, Y.; Cao, W.; Xu, D. Ecological restoration can enhance the radiation benefit of sand fixation service: A simulated evidence of Xilingol League, China. J. Environ. Manag. 2023, 328, 116947. [Google Scholar] [CrossRef] [PubMed]
  27. Wu, Z.; Zhu, D.; Xiong, K.; Wang, X. Dynamics of landscape ecological quality based on benefit evaluation coupled with the rocky desertification control in South China Karst. Ecol. Indic. 2022, 138, 108870. [Google Scholar] [CrossRef]
  28. Xue, J.; Gui, D.; Lei, J.; Sun, H.; Zeng, F.; Mao, D.; Jin, Q.; Liu, Y. Oasification: An unable evasive process in fighting against desertification for the sustainable development of arid and semiarid regions of China. Catena 2019, 179, 179–209. [Google Scholar] [CrossRef]
  29. Zhao, M.; Zhou, L.; Chen, Y.; Zhang, J.; Guo, X.; Wang, R. The influence of ecological policies on changes of land use and ecosystem service value in Hangjinqi, Inner Mongolia. China. J. Desert Res. 2016, 36, 842–850. [Google Scholar]
  30. Jiang, C.; Nath, R.; Labzovskii, L.; Wang, D. Integrating ecosystem services into effectiveness assessment of ecological restoration program in northern China’s arid areas: Insights from the Beijing-Tianjin Sandstorm Source Region. Land Use Policy 2018, 75, 201–214. [Google Scholar] [CrossRef]
  31. Xu, S.; Su, Y.; Yan, W.; Liu, Y.; Wang, Y.; Li, J.; Qian, K.; Yang, X.; Ma, X. Influences of Ecological Restoration Programs on Ecosystem Services in Sandy Areas, Northern China. Remote Sens. 2023, 15, 3519. [Google Scholar] [CrossRef]
  32. Gao, Y.; Liu, L.; Ma, S.; Zhou, Y.; Jia, R.; Li, X.; Yang, H.; Wang, B. Vegetation restoration in dryland with shrub serves as a carbon sink: Evidence from a 13-year observation at the Tengger Desert of Northern China. Land Degrad. Dev. 2024, 35, 102–113. [Google Scholar] [CrossRef]
  33. Li, Y.; Liu, W.; Feng, Q.; Zhu, M.; Yang, L.; Zhang, J. Quantitative assessment for the spatiotemporal changes of ecosystem services, tradeoff–synergy relationships and drivers in the Semi-Arid Regions of China. Remote Sens. 2022, 14, 239. [Google Scholar] [CrossRef]
  34. Yan, L.; Cao, G.; Kang, L.; Liu, M.; Ye, D. Analysis of spatial and temporal changes in habitat quality and driving factors in Gonghe County using the InVEST model 2023. Arid Zone Res. 2024, 41, 314–325. [Google Scholar]
  35. Liu, H.; Wang, H.; Teng, Y.; Zhan, J.; Wang, C.; Liu, W.; Chu, X.; Yang, Z.; Bai, C.; He, Y. Controlling desertification brings positive socioeconomic benefits beyond regional environmental improvement: Evidence from China’s Gonghe Basin. J. Environ. Manag. 2024, 354, 120395. [Google Scholar] [CrossRef] [PubMed]
  36. Xu, S.; Xu, D.; Shi, S. Aeolian Sand Deposits in The Gonghe Basin, Qinghai Province. J. Desert Res. 1982, 2, 5–12. [Google Scholar]
  37. Dong, G.; Gao, S.; Jin, J.; Li, B.; Zhou, G. Land Desertification and Its Control in Gonghe Basin, Qinghai Province. J. Desert Res. 1989, 9, 61–71. [Google Scholar]
  38. Qiang, M.; Jin, Y.; Liu, X.; Song, L.; Li, H.; Li, F.; Chen, F. Late Pleistocene and Holocene Aeolian Sedimentation in Gonghe Basin, Northeastern Qinghai-Tibetan Plateau: Variability, Processes, and Climatic Implications. Quat. Sci. Rev. 2016, 132, 57–73. [Google Scholar] [CrossRef]
  39. Renard, K.G.; Foster, G.R.; Weesies, G.A.; Porter, J.P. RUSLE: Revised universal soil loss equation. J. Soil Water Conserv. 1991, 46, 30–33. [Google Scholar]
  40. Lu, R.; Dai, E.; Wu, C. Spatial and temporal evolution characteristics and driving factors of soil conservation services on the Qinghai-Tibet Plateau. Catena 2023, 221, 106766. [Google Scholar] [CrossRef]
  41. Song, S.; Yu, D.; Li, X. Impacts of changes in climate and landscape pattern on soil conservation services in a dryland landscape. Catena 2023, 222, 106869. [Google Scholar] [CrossRef]
  42. Prasannakumar, V.; Vijith, H.; Geetha, N.; Shiny, R. Regional Scale Erosion Assessment of a Sub-Tropical Highland Segment in the Western Ghats of Kerala, South India. Water Resour. Manag. 2011, 25, 3715–3727. [Google Scholar] [CrossRef]
  43. Parysow, P.; Wang, G.; Gertner, G.; Anderson, A.B. Spatial Uncertainty Analysis for Mapping Soil Erodibility Based on Joint Sequential Simulation. Catena 2003, 53, 65–78. [Google Scholar] [CrossRef]
  44. Wischmeier, W.H.; Smith, D.D. Predicting Rainfall Erosion Losses: A Guide to Conservation Planning; U.S. Department of Agriculture: Washington, DC, USA, 1978. [Google Scholar]
  45. Williams, J.R. The Erosion-Productivity Impact Calculator (EPIC) Model: A Case History. Phil. Trans. R. Soc. Lond. B 1993, 329, 421–428. [Google Scholar]
  46. McCool, D.K.; George, G.O.; Freckleton, M. Topographic Effect on Erosion from Cropland in the Northwestern Wheat Region. Trans. ASAE 1993, 36, 1067–1071. [Google Scholar] [CrossRef]
  47. Liu, B.; Nearing, M.A.; Risse, L.M. Slope Gradient Effects on Soil Loss for Steep Slopes. Trans. ASAE 1994, 37, 1835–1840. [Google Scholar] [CrossRef]
  48. Cai, C.; Ding, S.; Shi, Z.; Huang, L.; Zhang, G. Study of Applying USLE and Geographical Information System IDRISI to Predict Soil Erosion in Small Watershed. J. Soil Water Conserv. 2020, 55, 19–24. [Google Scholar]
  49. Xiao, Q.; Hu, D.; Xiao, Y. Assessing changes in soil conservation ecosystem services and causal factors in the Three Gorges Reservoir region of China. J. Clean. Prod. 2017, 163, S172–S180. [Google Scholar] [CrossRef]
  50. Ma, X.; Zhu, J.; Yan, W.; Zhao, C. Assessment of soil conservation services of four fiver basins in Central Asia under global warming scenarios. Geoderma 2020, 375, 14533. [Google Scholar] [CrossRef]
  51. Fryrear, D.W.; Bilbro, J.D.; Saleh, A.; Schomberg, H.; Stout, J.E.; Zobeck, T.M. RWEQ: Improved wind erosion technology. J. Soil Water Conserv. 2000, 55, 183–189. [Google Scholar]
  52. Jiang, L. Estimation of wind erosion modules in Qinghai province based on RWEQ model. Res. Soil Water Conserv. 2015, 22, 21–32. [Google Scholar]
  53. Chepil, W.S. Influence of Moisture on Erodibility of Soil by Wind. Soil Sci. Soc. Am. J. 1956, 20, 288–292. [Google Scholar] [CrossRef]
  54. Fryrear, D.W.; Krammes, C.A.; Williamson, D.L.; Zobeck, T.M. Computing the wind erodible fraction of soils. J. Soil Water Conserv. 1994, 49, 183. [Google Scholar]
  55. Fryrear, D.W.; Saleh, A.; Bilbro, J.D. A Single Event Wind Erosion Model. Trans. ASAE 1998, 41, 1369–1374. [Google Scholar] [CrossRef]
  56. Zobeck, T.M. Abrasion of Crusted Soils: Influence of Abrader Flux and Soil Properties. Soil Sci. Soc. Am. J. 1991, 55, 1091–1097. [Google Scholar] [CrossRef]
  57. Saleh, A.; Fryrear, D.W. Soil roughness for the revised wind erosion equation (RWEQ). J. Soil Water Conserv. 1999, 54, 473. [Google Scholar]
  58. Saleh, A. Soil roughness measurement: Chain method. J. Soil Water Conserv. 1993, 48, 527. [Google Scholar]
  59. Bilbro, J.D.; Fryrear, D.W. Wind Erosion Losses as Related to Plant Silhouette and Soil Cover. Agron. J. 1994, 86, 550–553. [Google Scholar] [CrossRef]
  60. Melillo, J.M.; McGuire, A.D.; Kicklighter, D.W.; Moore, B.; Vorosmarty, C.J.; Schloss, A.L. Global climate change and terrestrial net primary production. Nature 1993, 363, 234–240. [Google Scholar] [CrossRef]
  61. Potter, C.S.; Randerson, J.T.; Field, C.B.; Matson, P.A.; Vitousek, P.M.; Mooney, H.A.; Klooster, S.A. Terrestrial ecosystem production: A process model based on global satellite and surface data. Glob. Biogeochem. Cycles 1993, 7, 811–841. [Google Scholar] [CrossRef]
  62. Piao, S.; Fang, J.; Zhou, L.; Zhu, B.; Tan, K.; Tao, S. Changes in Vegetation Net Primary Productivity from 1982 to 1999 in China. Glob. Biogeochem. Cycles 2005, 19, 1–16. [Google Scholar] [CrossRef]
  63. Zhu, W.; Pan, Y.; He, H.; Yu, D.; Hu, H. Simulation of Maximum Light Use Efficiency for Some Typical Vegetation Types in China. Chin. Sci. Bull. 2006, 51, 457–463. [Google Scholar] [CrossRef]
  64. Budyko, M.I. Climate and Life; Academic: San Diego, CA, USA, 1974; pp. 217–243. [Google Scholar]
  65. Zhang, L.; Dawes, W.R.; Walker, G.R. Response of mean annual evapotranspiration to vegetation changes at catchment scale. Water Resour. Res. 2001, 37, 701–708. [Google Scholar] [CrossRef]
  66. Xu, L.; Chen, S.; Xu, Y.; Li, G.; Su, W. Impacts of land-use change on habitat quality during 1985–2015 in the Taihu Lake Basin. Sustainability 2019, 11, 3513. [Google Scholar] [CrossRef]
  67. Li, J.; Dong, S.; Li, Y.; Wang, Y.; Li, Z.; Li, F. Effects of Land Use Change on Ecosystem Services in the China–Mongolia–Russia Economic Corridor. J. Clean. Prod. 2022, 360, 132175. [Google Scholar] [CrossRef]
  68. Lu, N.; Fu, B.; Jin, T.; Chang, R. Trade-off analyses of multiple ecosystem services by plantations along a precipitation gradient across Loess Plateau landscapes. Landsc. Ecol. 2014, 29, 1697–1708. [Google Scholar] [CrossRef]
  69. Yang, S.; Zhao, W.; Liu, Y.; Wang, S.; Wang, J.; Zhai, R. Influence of land use change on the ecosystem service trade-offs in the ecological restoration area: Dynamics and scenarios in the Yanhe watershed, China. Sci. Total Environ. 2018, 644, 556–566. [Google Scholar] [CrossRef] [PubMed]
  70. Zhang, M.; Liu, X.; Nazieh, S.; Wang, X.; Nkrumah, T.; Hong, S. Spatiotemporal distribution of grassland NPP in Gansu province, China from 1982 to 2011 and its impact factors. PLoS ONE 2020, 15, e0242609. [Google Scholar] [CrossRef] [PubMed]
  71. Wang, J.; Xu, C. Geodetector: Principle and prospective. Acta Geogr. Sin. 2017, 72, 117–134. [Google Scholar]
  72. Teng, H.; Liang, Z.; Chen, S.; Liu, Y.; Viscarra Rossel, R.A.; Chappell, A.; Yu, W.; Shi, Z. Current and future assessments of soil erosion by water on the Tibetan Plateau based on RUSLE and CMIP5 climate models. Sci. Total Environ. 2018, 635, 673–686. [Google Scholar] [CrossRef] [PubMed]
  73. Yan, H.; Zhan, J.; Liu, B.; Yuan, Y. Model estimation of water use efficiency for soil conservation in the lower Heihe River Basin, Northwest China during 2000–2008. Sustainability 2014, 6, 6250–6266. [Google Scholar] [CrossRef]
  74. Ma, X. Assessment of Desertification Evolution and Ecosystem Services in the Arid Region of Central Asia under Climate Change. Ph.D. Thesis, University of Chinese Academy of Sciences, Urumqi, China, 2021. [Google Scholar]
  75. Chi, W.; Zhao, Y.; Kuang, W.; He, H. Impacts of anthropogenic land use/cover changes on soil wind erosion in China. Sci. Total Environ. 2019, 668, 204–215. [Google Scholar] [CrossRef]
  76. Zhang, H.; Gao, Y.; Cui, Y. Evaluation the effects of wind erosion control projects in typical sandy area based on RWEQ model. J. Beijing Univ. (Nat. Sci. Ed.) 2019, 55, 342–350. [Google Scholar]
  77. Wu, D.; Zou, C.; Cao, W.; Xiao, T.; Gong, G. Ecosystem services changes between 2000 and 2015 in the Loess Plateau, China: A response to ecological restoration. PLoS ONE 2019, 14, e0209483. [Google Scholar] [CrossRef] [PubMed]
  78. Li, Z.; Pan, J. Spatiotemporal changes in vegetation net primary productivity in the arid region of Northwest China, 2001 to 2012. Front. Earth Sci. 2018, 12, 108–124. [Google Scholar] [CrossRef]
  79. Piao, S.; Fang, J. Terrestrial net primary production and its spatio-temporal patterns in Qinghai-Xizang Plateau, China during 1982–1999. J. Nat. Res. 2002, 17, 373–380. [Google Scholar]
  80. Yang, J.; Xie, B.; Zhang, D. Climate and land use change impacts on water yield ecosystem service in the Yellow River Basin, China. Environ. Earth Sci. 2021, 80, 72. [Google Scholar] [CrossRef]
  81. Geng, X.; Wang, X.; Yan, H. Land use/land cover change induced impacts on water supply service in the upper reach of Heihe River Basin. Sustainability 2015, 7, 366–383. [Google Scholar] [CrossRef]
  82. Zhu, J.; Gong, J.; Li, J. Spatiotemporal change of habitat quality in ecologically sensitive areas of eastern Qinghai–Tibet Plateau: A case study of the Hehuang Valley, Qinghai Province. Res. Sci. 2020, 42, 991–1003. [Google Scholar] [CrossRef]
  83. Wang, Y.; Meng, J. Effects of land use change on ecosystem services in the middle reaches of the Heihe River Basin. Arid Zone Res. 2017, 34, 200–207. [Google Scholar]
  84. Pan, J.; Wei, S.; Li, Z. Spatiotemporal pattern of trade-offs and synergistic relationships among multiple ecosystem services in an arid inland river basin in NW China. Ecol. Indic. 2020, 114, 106345. [Google Scholar] [CrossRef]
  85. Liu, Y.; Lü, Y.; Fu, B.; Harris, P.; Wu, L. Quantifying the spatio-temporal drivers of planned vegetation restoration on ecosystem services at a regional scale. Sci. Total Environ. 2019, 650, 1029–1040. [Google Scholar] [CrossRef]
  86. Wang, C.; Wang, S.; Fu, B.; Li, Z.; Wu, X.; Tang, Q. Precipitation gradient determines the tradeoff between soil moisture and soil organic carbon, total nitrogen, and species richness in the Loess Plateau, China. Sci. Total Environ. 2016, 575, 1538–1545. [Google Scholar] [CrossRef]
  87. Chen, J.; Wang, Y.; Sun, J.; Liang, E.; Shen, M.; Yang, B.; Jia, X.; Zhang, J. Precipitation dominants synergies and trade-offs among ecosystem services across the Qinghai-Tibet Plateau. Glob. Ecol. Conserv. 2021, 32, e01886. [Google Scholar] [CrossRef]
  88. Menz, M.H.; Dixon, K.W.; Hobbs, R.J. Hurdles and opportunities for landscape-scale restoration. Science 2013, 339, 526–527. [Google Scholar] [CrossRef] [PubMed]
  89. Feng, X.; Fu, B.; Piao, S.; Wang, S.; Ciais, P.; Zeng, Z.; Lü, Y.; Zeng, Y.; Li, Y.; Jiang, X. Revegetation in China’s Loess Plateau is approaching sustainable water resource limits. Nat. Clim. Chang. 2016, 6, 1019–1022. [Google Scholar] [CrossRef]
  90. Zhang, G.; Yang, F.; Long, H. Save the life-sustaining mattic layer on the Qinghai-Tibetan Plateau. Innovation 2023, 4, 100418. [Google Scholar] [CrossRef] [PubMed]
  91. Li, X.; Yao, Z.; Dong, Z. Driving Mechanism of Aeolian Desertification in Gonghe Basin of Qinghai Province. Bull. Soil Water Conserv. 2018, 38, 337–344. [Google Scholar]
  92. Ma, H.; Xiao, F.; Dong, Z.; Nan, W.; Chen, H. Change of sandy desertification land and its driving factors in Gonghe county, Qinghai province from 2000 to 2020. J. Arid. Land Resour. Environ. 2022, 36, 139–148. [Google Scholar]
  93. Huang, M.; Xiao, Y.; Qin, K.; Gan, S.; Xie, G.; Liu, J.; Wang, Y.; Niu, Y.; Liu, J. Spatiotemporal dynamics and drivers of wind erosion prevention service in Otindag from 1980 to 2018. Acta Ecol. Sin. 2022, 42, 7612–7629. [Google Scholar]
  94. Zhao, Y.; Chi, W.; Kuang, W.; Bao, Y.; Ding, G. Ecological and Environmental Consequences of Ecological Projects in the Beijing–Tianjin Sand Source Region. Ecol. Indic. 2020, 112, 106111. [Google Scholar] [CrossRef]
  95. Ma, X.; Zhu, J.; Wang, Y.; Yan, W.; Zhao, C. Variations in water use strategies of sand-binding vegetation along a precipitation gradient in sandy regions, northern China. J. Hydrol. 2021, 600, 126539. [Google Scholar] [CrossRef]
  96. Pullanikkatil, D.; Palamuleni, L.G.; Ruhiiga, T.M. Land use/land cover change and implications for ecosystems services in the Likangala River Catchment, Malawi. Phys. Chem. Earth 2016, 93, 96–103. [Google Scholar] [CrossRef]
  97. Song, W.; Deng, X. Land-use/land-cover change and ecosystem service provision in China. Sci. Total Environ. 2017, 576, 705–719. [Google Scholar] [CrossRef] [PubMed]
  98. Hu, M.; Li, X.; Zuo, H.; Pan, N.; Feng, S. Change of Sandy Desertification Land in Guinan County in Gonghe Basin from 1989 to 2014. J. Desert Res. 2018, 38, 30–38. [Google Scholar]
  99. Yang, W.; Jin, Y.; Sun, T.; Yang, Z.; Cai, Y.; Yi, Y. Trade-Offs among Ecosystem Services in Coastal Wetlands under the Effects of Reclamation Activities. Ecol. Indic. 2018, 92, 354–366. [Google Scholar] [CrossRef]
  100. Ma, L.; Bo, J.; Li, X.; Fang, F.; Cheng, W. Identifying Key Landscape Pattern Indices Influencing the Ecological Security of Inland River Basin: The Middle and Lower Reaches of Shule River Basin as an Example. Sci. Total Environ. 2019, 674, 424–438. [Google Scholar] [CrossRef] [PubMed]
  101. Wang, Y.; Cai, Y.; Pan, M. Analysis on the Relationship between Soil Erosion and Land Use in Wujiang River Basin in Guihzou Province. Res. Soil Water Conserv. 2013, 20, 11–18. [Google Scholar]
  102. Wang, H.; Gao, J.; Hou, W. Quantitative attribution analysis of soil erosion in different geomorphological types in karst areas: Based on the geodetector method. J. Geog. Sci. 2019, 29, 271–286. [Google Scholar] [CrossRef]
  103. Matson, P.; Lohse, K.; Hall, S. The Globalization of Nitrogen Deposition: Consequences for Terrestrial Ecosystems. Ambio 2002, 31, 113–119. [Google Scholar] [CrossRef] [PubMed]
  104. Su, C.; Fu, B. Evolution of Ecosystem Services in the Chinese Loess Plateau under Climatic and Land Use Changes. Glob. Planet. Change 2013, 101, 119–128. [Google Scholar] [CrossRef]
  105. Piao, S.; Fang, J.; Ciais, P.; Peylin, P.; Huang, Y.; Sitch, S.; Wang, T. The carbon balance of terrestrial ecosystems in China. Nature 2009, 458, 1009–1013. [Google Scholar] [CrossRef]
Figure 1. The location, land use types of the study area. (a) The location of the study area in China and the Qinghai–Tibet Plateau; (b) land use types; and (c) the physical environments of the Gonghe Basin (Google Earth™ in December 2020).
Remotesensing 16 02460 g001
Figure 2. Changes in ecosystem services from 1990 to 2020.
Remotesensing 16 02460 g002
Figure 3. Spatiotemporal distribution and changes in soil conservation, sand fixation, carbon sequestration, water yield, and habitat quality.
Remotesensing 16 02460 g003
Figure 4. Pearson correlations between pairs of ecosystem services in the Gonghe Basin. Note: * means that correlation is significant at the 0.05 level (2-tailed). ** means that correlation is significant at the 0.01 level (2-tailed).
Remotesensing 16 02460 g004aRemotesensing 16 02460 g004b
Figure 5. Spatial distribution of ecosystem service trade-off intensity in the Gonghe Basin (RMSD is calculated from the standardized ES values and the average ES value of five ecosystem services).
Remotesensing 16 02460 g005
Figure 6. The q values of influencing factors of the ecosystem services in the Gonghe Basin from 1990 to 2020. Note: Tem is temperature, Pre is precipitation, and Wind is wind speed.
Remotesensing 16 02460 g006
Figure 7. The interactive influencing factor explanatory power of ecosystem services in the Gonghe Basin (p < 0.01). Note: Tem is temperature, Pre is precipitation, and Wind is wind speed.
Remotesensing 16 02460 g007
Figure 8. Changes in the overall benefit of ecosystem service (OB) values of each detection factor in 2020. (a) The variation of OB value with temperature, precipitation, and wind speed factor classifica-tion; (b) the variation of OB value with NDVI factor classification; (c) the variation of OB value with land use factor classification; and (d) the variation of OB value with slope and DEM factor classification.
Remotesensing 16 02460 g008
Figure 9. The suitable regional spatial distribution of influencing factors of ecosystem services in 2020: (a) mean annual temperature; (b) annual precipitation; (c) wind speed; (d) NDVI; (e) land use type; (f) slope; (g) DEM; (h) soil type; (i) overlap numbers of suitable ranges or types for each factor.
Remotesensing 16 02460 g009
Figure 10. Changes in land use type area in the Gonghe Basin from 1990 to 2020.
Remotesensing 16 02460 g010
Table 1. Descriptions of the data used in this paper.
NameTemporal ResolutionSpatial ResolutionPeriodResource
Temperature
Precipitation
Wind speed
Daily30 m1990–2020China Meteorological
Center
Snow depthDaily0.25° × 0.25°1982–2020Long-term daily snow depth in China
NDVI15 d
16 d
8 km
250 m
1990–2015
2001–2020
GIMMS-NDVI3g
MOD13Q1
Land coverAnnual30 m1990–2020China land cover dataset
DEM30 m2019ASTER GDEM V3
Soil properties1 km2013HWSD V1.2
Table 2. Suitable ranges or types of different influencing factors.
Influencing
Factor
1990200020102020
Suitable
Range/Type
Value
of OB
Suitable
Range/Type
Value
of OB
Suitable
Range/Type
Value
of OB
Suitable
Range/Type
Value
of OB
Temperature (°C)3.24–3.610.3991.47–1.970.4095.21–5.570.4795.62–6.260.476
Precipitation (mm)380.61–425.800.502290.07–315.570.477425.50–452.200.538598.61–782.520.520
Wind speed (m/s)1.95–2.040.4071.68–1.850.4102.32–2.520.4801.81–1.880.476
NDVI0.64–0.750.4470.71–0.990.4830.69–0.780.5080.69–0.780.491
Land use typeCropland0.395Forest0.433Cropland0.480Cropland0.454
Slope (°)30.92–38.670.38830.92–38.670.42730.92–38.670.48030.92–38.670.430
DEM (m)3711–40130.4183711–40130.4663711–40130.5143711–40130.476
Soil typeMarsh soil0.499Alpine meadow soil0.491Alpine meadow soil0.518Alpine meadow soil0.513
Table 3. Classes break values of different detecting factors in 2020.
Influencing
Factor
Classes Break Values
123456789
Temperature (°C)2.963.443.834.234.685.145.646.277.40
Precipitation (mm)249.66306.25353.40395.84440.64487.80537.31598.61782.52
Wind speed (m/s)1.871.911.951.992.032.072.112.152.21
NDVI0.140.240.330.410.500.600.690.781.00
Land use typeCroplandForestGrasslandWaterConstruction landUnused land
Slope (°) 47121722293772
DEM (m)28143059324134563711401344095261
Disclaimer/Publisher’s Note: The statements, opinions and data contained in all publications are solely those of the individual author(s) and contributor(s) and not of MDPI and/or the editor(s). MDPI and/or the editor(s) disclaim responsibility for any injury to people or property resulting from any ideas, methods, instructions or products referred to in the content.

