Article

Spreading Sea Clutter Suppression for High-Frequency Hybrid Sky-Surface Wave Radar Using Orthogonal Projection in Spatial–Temporal Domain

1
School of Electronic and Optical Engineering, Nanjing University of Science and Technology, Nanjing 210094, China
2
School of Electronic Information, Wuhan University, Wuhan 430072, China
*
Author to whom correspondence should be addressed.
Remote Sens. 2024, 16(13), 2470; https://doi.org/10.3390/rs16132470
Submission received: 12 April 2024 / Revised: 29 June 2024 / Accepted: 1 July 2024 / Published: 5 July 2024
(This article belongs to the Special Issue Radar Signal Processing and Imaging for Ocean Remote Sensing)

Abstract

:
In recent years, the high-frequency hybrid sky-surface wave radar (HSSWR) has been increasingly used for target detection applications. Nevertheless, the specific bistatic system layout and the phase path disturbances induced by the ionospheric propagation channel may severely spread the sea clutter spectrum, thereby deteriorating the detection ability of the HSSWR for slow-moving targets. In this work, a novel subspace method based on the hybrid use of the amplitude and phase estimator (APES) and the orthogonal projection (OP) in the spatial–temporal domain, denoted as the APES-OP method, is proposed to suppress the spreading first-order sea clutter of the HSSWR. The distribution characteristics of targets and first-order sea clutter in the spatial–temporal domain were investigated, and a time-domain subspace signal model was adopted to describe targets perturbed by ionospheric phase path modulation. An APES filter was adopted to filter out the potential targets with a traversal approach to avoid attenuating desired signals while suppressing sea clutter. After that, sampling data from multi-channels and slow-time domains at the cell under test were employed to construct a spatial–temporal matrix, which was then utilized to obtain the sea clutter subspace by singular value decomposition. Simulation results indicate that the proposed algorithm can suppress sea clutter while retaining the target, even if the target is buried by sea clutter. The processing results of measured data further demonstrate the efficiency of the proposed algorithm. After sea clutter suppression, the target obscured by clutter can be revealed, and the signal-to-clutter ratio of the target is greatly improved.

1. Introduction

The high-frequency (HF) hybrid sky-surface wave radar (HSSWR) utilizes the sky-wave-transmitting and surface-wave-receiving hybrid propagation channel to obtain large-scale ocean surface coverage while maintaining high detection precision (see Figure 1) [1,2,3,4,5]. It has been widely used for target detection and ocean surface environmental monitoring [6,7,8,9,10]. The interaction between the transmitted radio waves and the ocean surface produces a pair of peaks, denoted as the first-order Bragg peaks, distributed symmetrically concerning 0 Hz in the Doppler spectrum [11,12]. Due to the bistatic system layout and the phase path disturbances induced by the ionosphere, the first-order Bragg peaks of the HSSWR can be severely broadened [13,14], thereby submerging the adjacent frequency points in the Doppler spectrum. As a result, the neighboring echoes backscattered by targets, such as slow-moving surface vessels, may not be detected. Suppressing the first-order sea clutters beforehand is necessary to improve the detection performance of the HSSWR.
Much work has been carried out to suppress the sea clutters of the HF over-the-horizon radar (OTHR). The algorithms can be classified chiefly into four categories. Algorithms in the first category suppress sea clutter according to its statistical characteristics [15]. Assumptions or prior knowledge are required to construct the statistical model of sea clutter [16,17]. When the practical factors (such as the radar and marine environmental parameters) are inconsistent with the model’s hypothesis, significant modeling errors will be caused, and the suppression effect will decline accordingly. Algorithms in the second category suppress sea clutter according to its time–frequency distribution characteristics [18,19,20,21]. Time–frequency methods such as Empirical Mode Decomposition [19], wavelet transform [20], and Wigner distribution [21] have been employed. Nevertheless, the process requires multiple transformation, filtering, and reconstruction steps, increasing the costs and time taken significantly. Algorithms in the third category suppress sea clutter according to its aggregation characteristics in subspace [22,23,24]. The sea clutter was assumed to consist of a finite number of narrow-band time-varying components, and the same number of significant singular values were adopted to approximate it [22]. Since echoes of targets can also be regarded as narrow band, they will inevitably be impaired along with the sea clutter during the procedure. Algorithms in the last category suppress sea clutter according to its space–time distribution characteristics [25,26,27,28]. Some space–time adaptive processing (STAP)-based methods, such as information geometric means-based STAP [8] and the amplitude and phase estimator (APES)-based STAP [26], have been proposed. The methods can suppress sea clutter while preserving targets’ echoes, but the space–time freedom of the system needs to be as high as possible.
An orthogonal projection (OP) method in the spatial–temporal domain was proposed to enhance target detection ability for HF surface wave radars (SWR) [29]. In order to retain the target echoes, sampling data from the adjacent range cells were applied to construct a covariance matrix, which was then decomposed by eigenvalue decomposition to obtain the sea clutter subspace. By projecting the original signal into the orthogonal subspace, the sea clutter was suppressed while echoes of targets were retained. The process is reasonable since, for SWR, echoes of sea clutter and targets hold distinct distribution features in the spatial–temporal domain, and the sea clutter of adjacent range cells bears a high correlation [29]. However, for HSSWR, the ionospheric propagation channel may induce an additional modulation phase in both the temporal (Doppler) and spatial domain, deteriorating the correlation between sea clutter from the adjacent range cells [8]. Specifically, the perturbation in the signal phase, denoted as the ionospheric phase path disturbances, may severely corrupt signal coherence and spread the Doppler spectrum [13,30]. At the same time, the random fluctuations in the wavefront may result in the loss of spatial correlation of sampled data from diverse array elements, widening the spatial spectrum and reducing angular resolution [31,32]. Even so, we discovered that echoes of sea clutter and targets for HSSWR still hold distinct distribution features in the spatial–temporal domain. It motivated us to investigate further the possibility of applying the OP in the spatial–temporal domain to suppress sea clutter in HSSWR.
The OP method’s critical step is constructing the training matrix to correctly estimate the sea clutter subspace. For HSSWR, sampling data from the adjacent range cells are inapplicable for constructing the training matrix due to the ionospheric modulation effects. Instead, sampling data from the cell under test (CUT) can be utilized directly to estimate the sea clutter subspace [26]. In addition, to avoid attenuating desired signals while suppressing sea clutter, echoes of targets must be filtered out in advance. It is often challenging since the signal phase of targets can also be corrupted by ionospheric disturbances. In such cases, the single-frequency signal model hypothesis of targets is no longer applicable [26]. Furthermore, the spectral points of targets, typically of slow-moving surface vessels, tend to fall in the spectral region of sea clutter, making it a challenge to distinguish them in the Doppler domain. How to filter out echoes of targets entirely without knowing their spatial (orientation) and temporal (Doppler) information in advance has become an urgent problem.
The APES algorithm was initially proposed in the field of spectral analysis [33]. Amplitudes of the desired signals were estimated by subtracting the signals of interest from the original data while minimizing the power of the residual. Moreover, the algorithm can also be used as an adaptive filter in temporal, spatial, or spatial–temporal domains [34,35]. For target detection using HSSWR, echo signals of targets are of interest, the amplitudes of which are typically unknown. Constructing the training matrix of sea clutter using the subtraction of APES with the data from CUT is feasible.
In this work, an APES-based OP method in the spatial–temporal domain has been proposed to suppress the first-order sea clutter of HSSWR. Sampling data from multi-channels and slow-time domains at the CUT was first employed to construct a spatial–temporal matrix, which was then utilized to obtain the sea clutter subspace by singular value decomposition (SVD). An APES filter was adopted to filter out the potential targets with a traversal approach to avoid attenuating desired signals while suppressing sea clutter, and a time-domain subspace signal model was adopted to describe targets perturbed by ionospheric phase path modulation. The paper is structured as follows. Section 2 introduces the principle of HSSWR and presents a theoretical sea echo modeling. In Section 3, a sea clutter suppression algorithm based on the hybrid use of the APES filter and the OP in the spatial–temporal domain was introduced and described in detail. In Section 4, simulations were conducted to investigate the effectiveness of the proposed sea clutter suppression algorithm by artificially adding simulated target signals outside and inside the clutter region, respectively. Raw data collected from an experimental HSSWR system developed by Wuhan University were then processed to further verify the applicability of the proposed algorithm in Section 5. Section 6 presents the discussion, and Section 7 is the conclusion.

2. Model

The HSSWR system operates in an ionosphere–ocean hybrid propagation channel [2]. Figure 2 is a diagram illustrating the geometric relations of the HSSWR system. The radio waves transmitted are first refracted from the ionosphere, and some turn to the Earth’s surface. They are then scattered by the sea and targets beyond the horizon and received by the receiving antenna array near shore.
The original data block of a particular range cell for HSSWR can be expressed as follows:
X = x ( 1 ) , x ( 2 ) , , x ( N )
where x ( n ) = x 1 , n , x 2 , n , , x M , n T , n = 1 , 2 , ,   N denotes the M -dimensional antenna array snapshot vector received at pulse index n , · T is the transpose operator, and N is the number of pulses in a coherent integration time (CIT).
In general, X contains the sum of internal and external interference-plus-noise N , clutter returns from ocean surfaces C , and possibly targets’ echo signal S , which is demonstrated by the following equation [8]:
X = S + C + N

2.1. Target Echo

The received echo signal from a far-field point target for a narrowband uniform linear array of identical antenna sensors can be expressed as follows:
S = A t v θ t a T f t
where A t is the complex amplitude; θ t and f t are the direction of arrival (DOA) and the Doppler frequency of the target, respectively; v θ t and a f t indicate the spatial and temporal steering vector, respectively, and
v θ t = 1 , e j 2 π d sin θ t λ , , e j 2 π ( M 1 ) d sin θ t λ T ,
a f t = 1 , e j 2 π f t , , e j 2 π ( N 1 ) f t T
where λ is the wavelength, and d is the interval spacing between adjacent elements.
The traditional single-frequency signal model no longer applies when considering ionospheric phase path disturbances. In order to better characterize the frequency features of the target, we adopted the following time-domain subspace signal model [26]:
d = a f t Δ f 2 , a f t , a f t + Δ f 2 α = Q α
where Δ f is the frequency resolution, Q is the signal subspace, and α C 3 is the weighting coefficient vector of the signal subspace, also called the orientation vector [26]. Then, the space–time two-dimensional data model of the target can be rewritten as follows:
S = A t v θ t d T

2.2. Sea Clutter

Radio waves scattered by the ocean’s surface comprise the critical component of the received echo signal of the HSSWR. The interaction between the transmitted radio waves and the ocean surface produces a pair of peaks, denoted as the first-order Bragg peaks, distributed symmetrically concerning 0 Hz in the Doppler spectrum. The first-order Bragg frequencies of the HSSWR are calculated by the following equation [6]:
f B ± = ± g f 0 2 π c 1 + 2 cos β cos γ + cos 2 γ 1 / 4
where g is the gravitational acceleration, f 0 is the operating frequency of the radar, and c is the speed of light; γ is the grazing angle, and β is the bistatic angle (see Figure 2). The plus and minus signs indicate the approaching and receding Bragg waves. The literature [36] provides more information on the Bragg scattering theory under the ionosphere–ocean hybrid propagation mode.
The sea clutter signal of a certain range cell is the superposition of radar returns from each azimuth resolution unit. Supposing a radar-irradiated region is divided into P scattering units with azimuth θ p , p = 1 , 2 , , P , the received sea clutter signal of the HSSWR can be expressed by
C = p = 1 P σ 1 v θ p g c T ,
g c = u f i a f B ± + f c
where σ 1 is the first-order sea clutter cross section; f i is the Doppler shift induced by the ionospheric irregularities, and u f i = 1 , e j 2 π f i , , e j 2 π ( N 1 ) f i T is the unwanted phase modulation vector; f c is the Doppler shift induced by the ocean current, and is the Hadamard product.
The ionospheric irregularities may be produced by turbulence, plasma instabilities, traveling ionospheric disturbances, or other physical processes [13]. In this work, we focus on the influences of plasma drift. The ionosphere is regarded as a no-tilt reflecting plane, and a specular reflection is supposed. Then, the Doppler shift induced can be calculated by [37]
f i = 2 λ v r cos i r cos ζ · μ h 0
where v r is the plasma drift velocity, i r is the angle between the drifting direction and vertical direction, and ζ is the incident angle; μ h 0 1 is the refractive index at the bottom of the ionospheric layer. The minus sign indicates that a negative Doppler shift will be experienced if the ionosphere is drifting upwards. It is important to note that although the ionospheric drift motion includes a horizontal component, this component does not significantly affect the length of the ray path (since the transmitting and receiving stations are fixed), and therefore does not result in an echo Doppler shift.
The first-order HSSWR cross section of the ocean surface is [38]
σ 1 ω d = 2 5 π 2 k 0 2 m = ± 1 S 1 ( m k ) k 5 / 2 cos 2 ϕ cos α 5 / 2 · g · δ ω d + m 2 k 0 g cos ϕ cos α
where ω d is the Doppler radian frequency, k 0 is the radar wave number, k is the ocean wave vector, and k is the magnitude of k ; S 1 m k , m = ± 1 is the first-order directional wave height spectrum, which is normally expressed as a product of two factors: the Pierson–Moskowitz (PM) spectrum S P M k and a modified cardioid directional factor [39].
f θ w w , k = ξ + ( 1 ξ ) cos 4 θ w w / 2 2 π ξ + ( 3 π / 4 ) ( 1 ξ )
where ξ = 0.004 is the strength ratio of upwind returns to downwind returns, θ w w is the angle between the direction of the ocean wave vector and that of the wind; ϕ represents the spatial bistatic angle, and α is the angle between the virtual ‘spatial wave vector’ under the ionosphere–ocean hybrid propagation mode and the actual ocean wave vector [6].
cos ϕ = 1 + cos γ cos β 2
cos α = 1 + 2 cos γ cos β + cos 2 γ 2 1 + cos γ cos β

2.3. Noise

The noise is supposed to be Gaussian, the covariance matrix of which is
R n = E N N H = σ n 2 I M
where E · denotes statistical expectation, · H is the Hermitian operator, σ n 2 is the noise power, and I M is the M × M dimensional identity matrix.

3. Methods

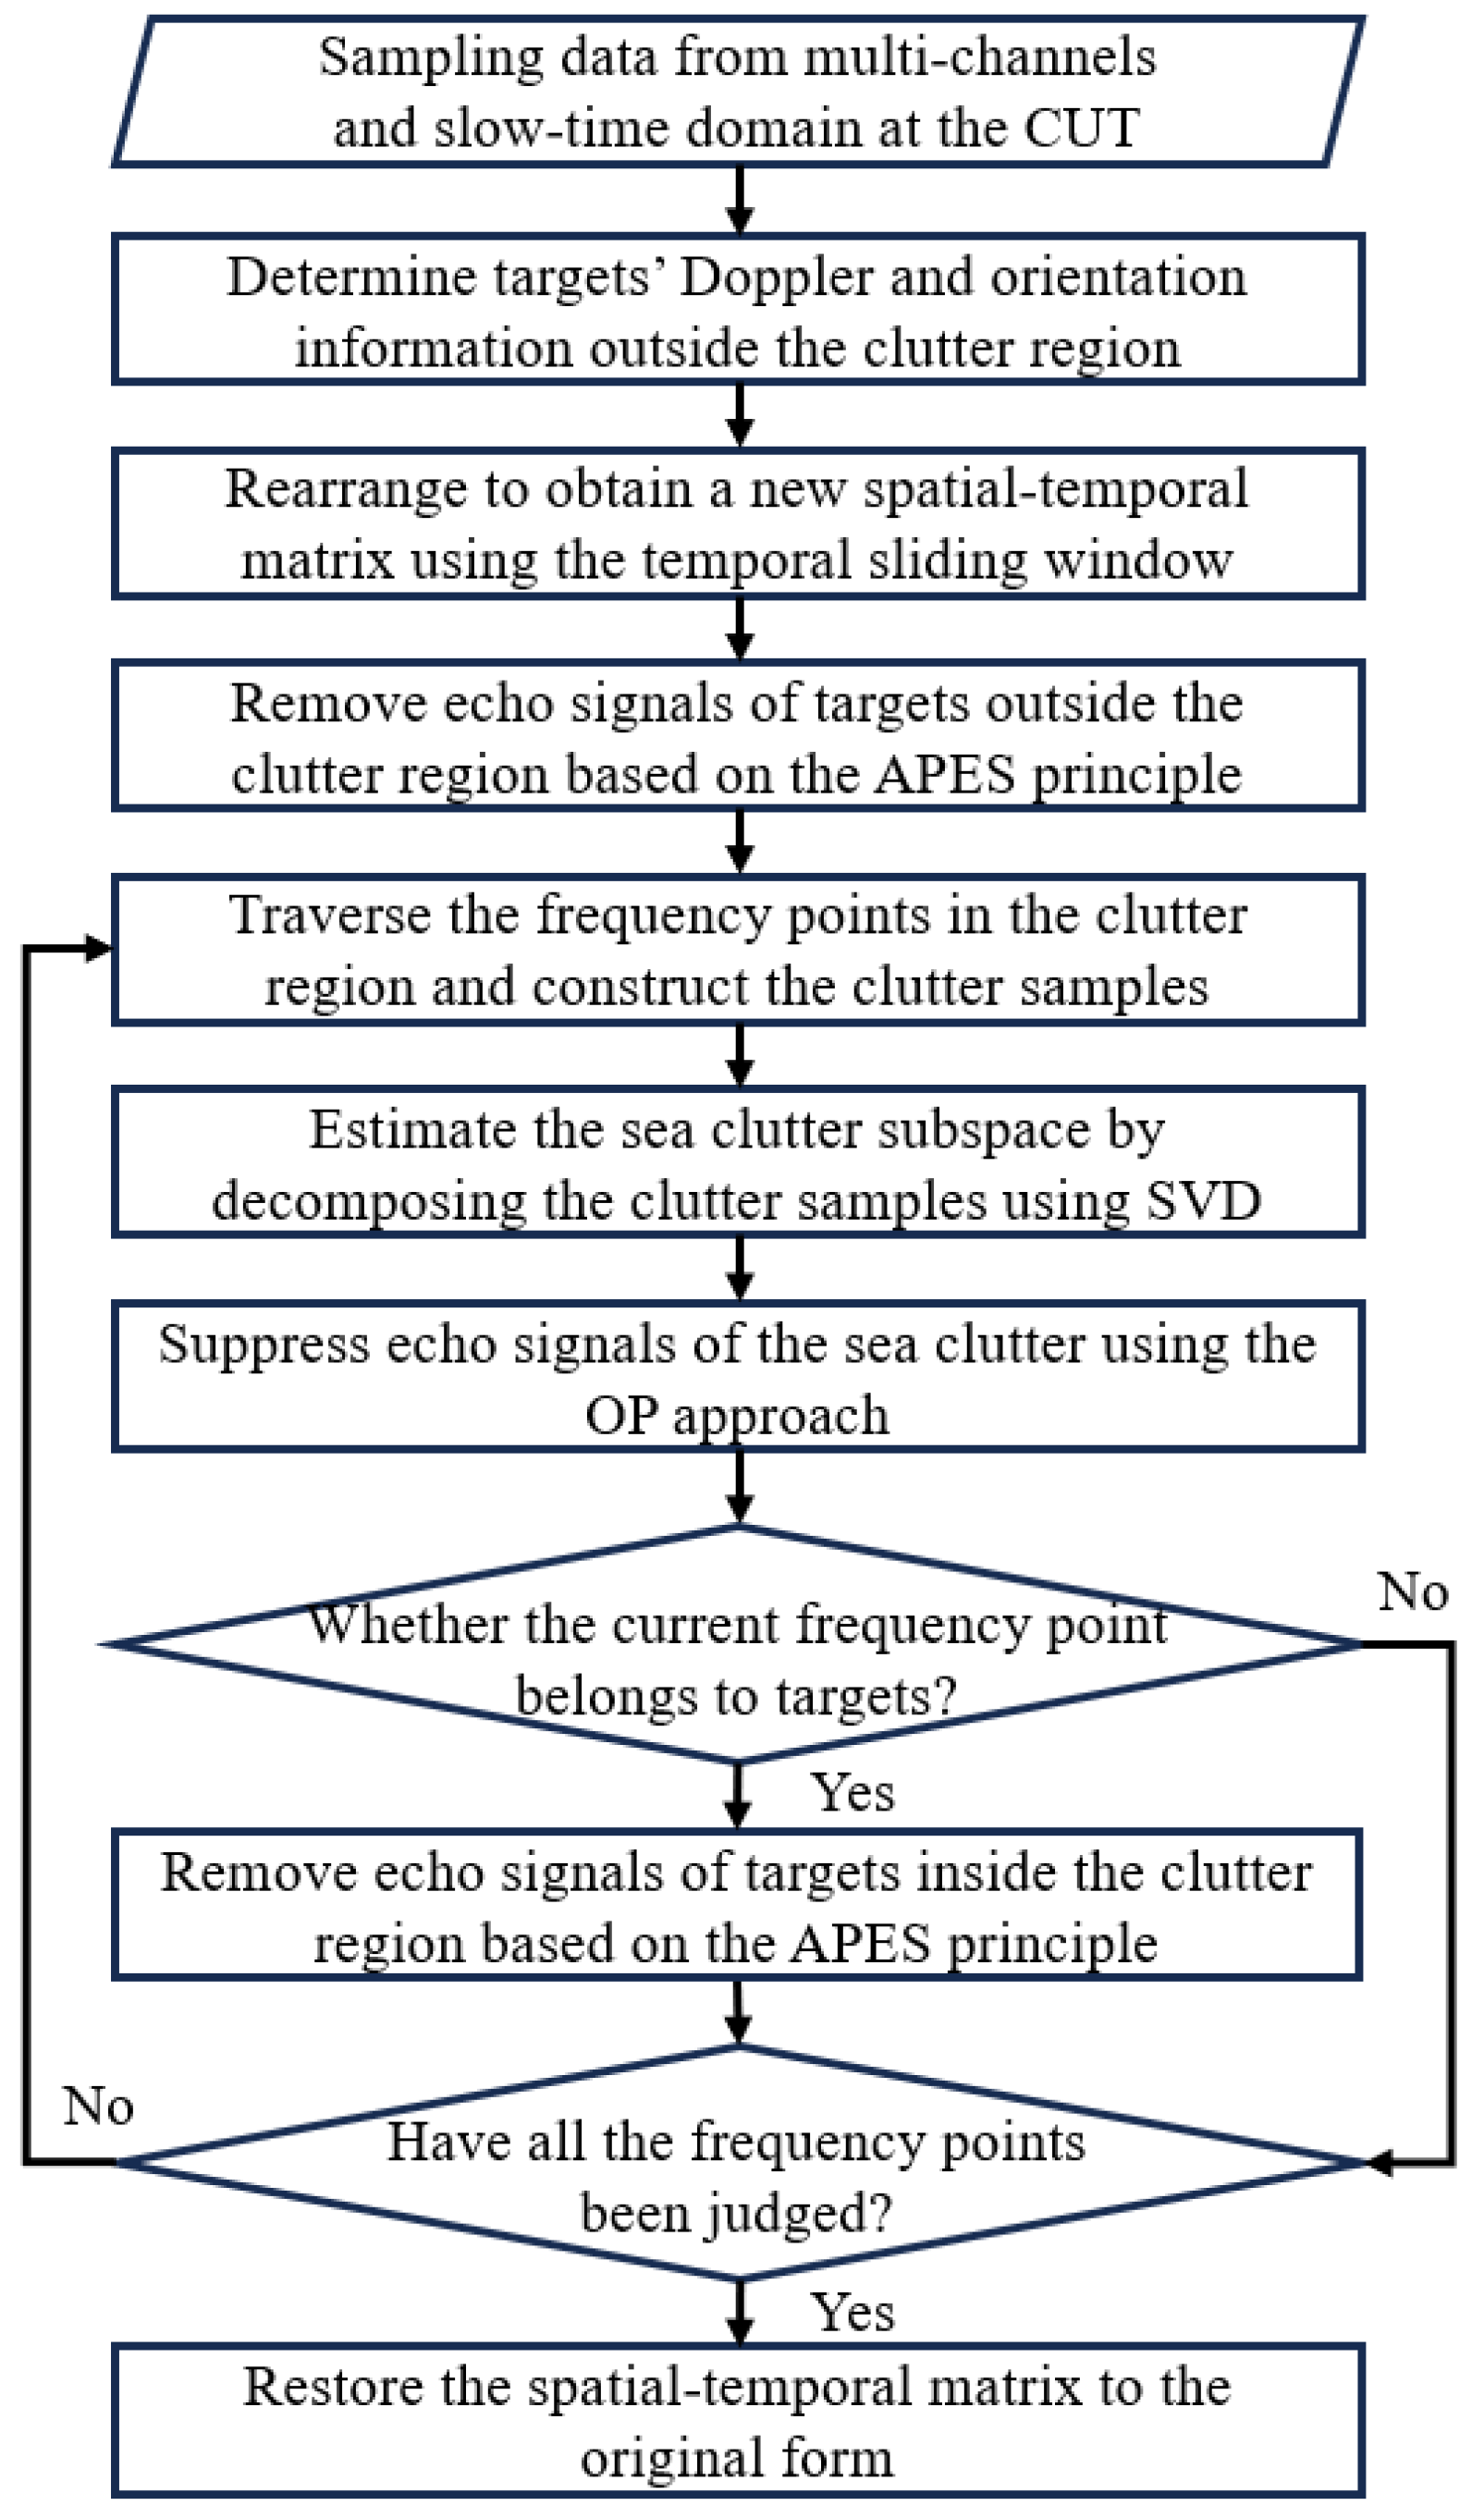
This article proposes an APES-based OP method in the spatial–temporal domain to suppress the first-order sea clutter of HSSWR. The proposed algorithm consists of the following steps:
  • Estimate the spatial–temporal spectrum (STS) using sampling data from multi-channels and slow-time domains at the CUT, divide the spectrum into clutter and non-clutter regions, and determine targets’ Doppler and orientation information outside the clutter region;
  • Rearrange the data matrix from multi-channels and slow-time domains at the CUT into a new spatial–temporal matrix using the temporal sliding window and construct filters in the temporal domain to remove echo signals of targets outside the clutter region based on the APES principle;
  • Traverse the frequency points in the clutter region and construct the clutter samples;
  • Estimate the sea clutter subspace by decomposing the clutter samples using SVD;
  • Suppress the sea clutter components by projecting the constructed spatial–temporal matrix into the orthogonal subspace concerning the sea clutter;
  • Determine whether the current frequency point belongs to the target and update the clutter samples;
  • Restore the spatial–temporal matrix to a matrix of multi-channels and slow-time domains at the CUT after all the frequency points in the clutter region are investigated.
The flowchart of the proposed sea clutter suppression method is shown in Figure 3.

3.1. Spectral Region Division

In the first step of the proposed algorithm, sampling data from multi-channels and slow-time domains at the CUT are utilized to estimate the STS. The spectrum is then divided into clutter and non-clutter regions based on the sliding window band-path filtering algorithm [13]. The Doppler and orientation information of targets located outside the clutter region is estimated.
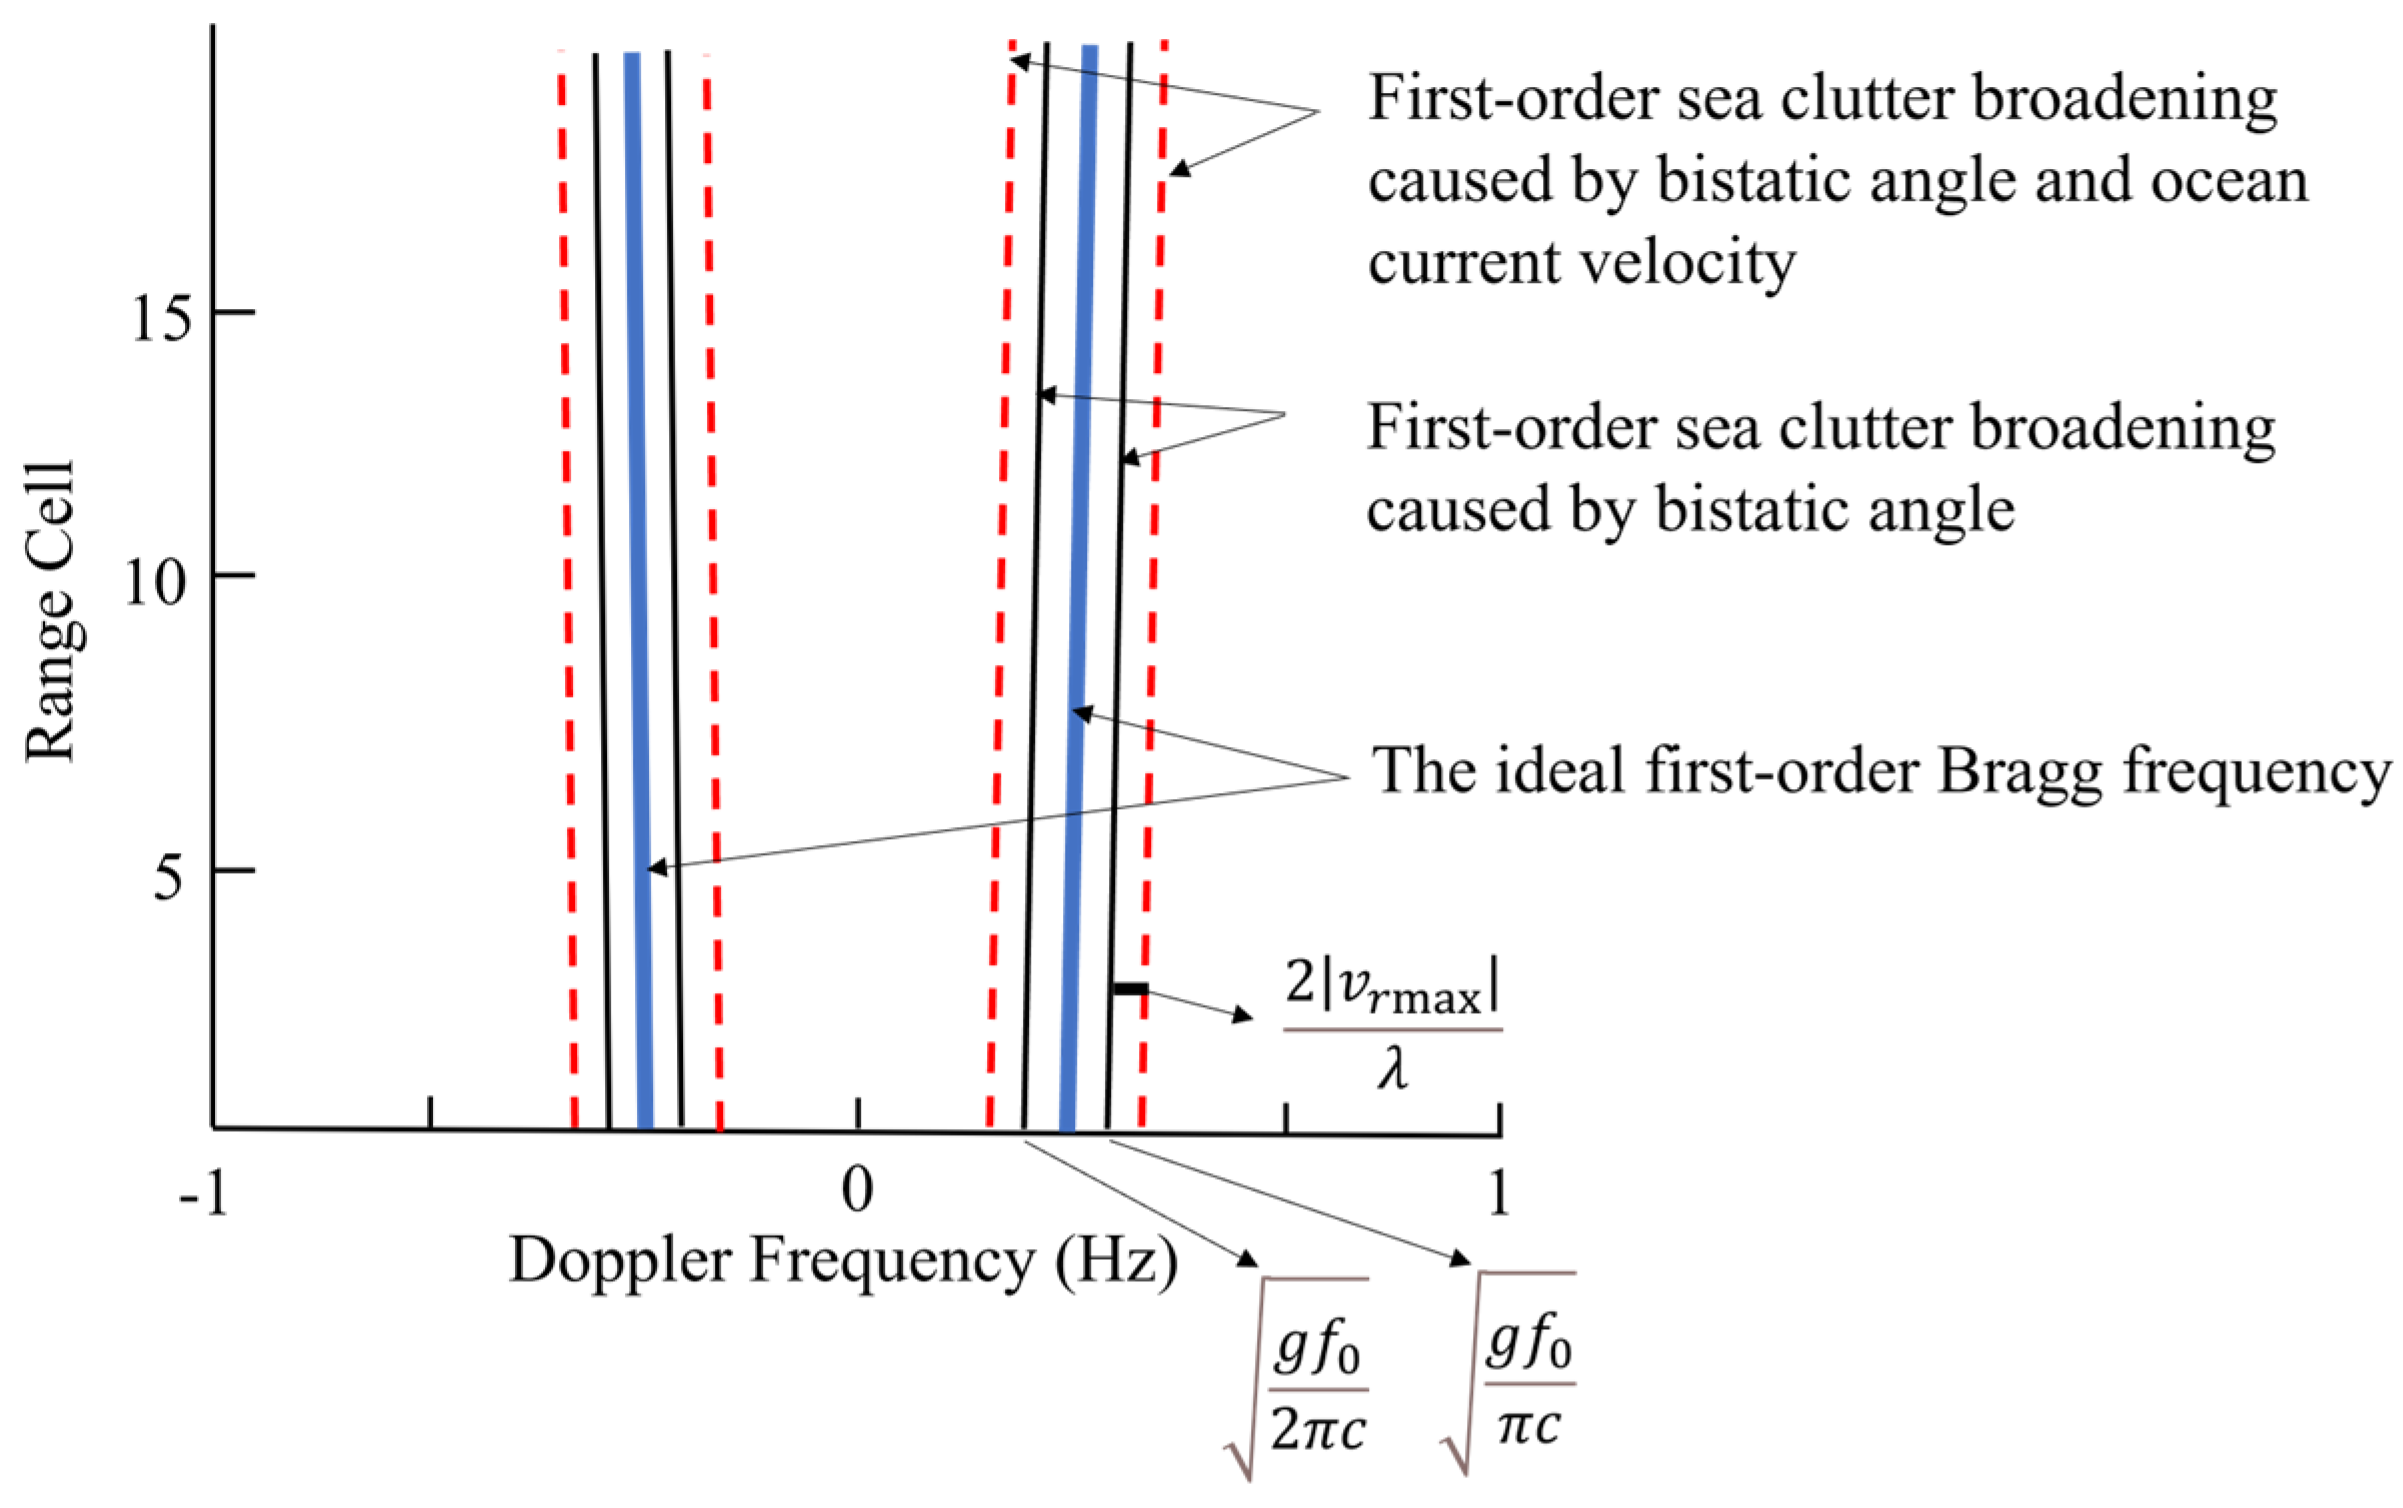
Given the signal model in Section 2, the first-order Bragg frequency of HSSWR varies with the bistatic angle β 0 , 180 ° and the grazing angle γ 0 , 90 ° and satisfies the following relations:
f B = g f 0 2 π c 1 + 2 cos β cos γ + cos 2 γ 1 / 4 < g f 0 2 π c 2 + 2 cos β 1 / 4 < g f 0 π c
f B = g f 0 2 π c 1 + 2 cos β cos γ + cos 2 γ 1 / 4 > g f 0 2 π c
Figure 4 displays the potential range of the first-order sea clutter spectrum of the HSSWR. Supposing the maximum radial velocity of the ocean current is v r m a x , the initial range of the first-order sea clutter spectrum without considering the ionospheric phase path disturbances can be expressed as [40].
F c i g f 0 π c 2 v r m a x λ , g f 0 2 π c + 2 v r m a x λ g f 0 2 π c 2 v r m a x λ , g f 0 π c + 2 v r m a x λ
The spectrum of F c i is firstly smoothed using the least-squares method [41]; then the frequency points whose amplitudes are above the signal-to-noise ratio (SNR) are subsumed into the sea clutter region and indicated as F c .
Figure 4. The potential range of the first-order sea clutter spectrum of the HSSWR.
Remotesensing 16 02470 g004
Identifying the spectral points of targets precisely according to their unique distribution characteristics in the spatial–temporal domain is possible since echo signals of targets usually bear obvious directionality in the spatial and temporal (Doppler) domain [42]. Apart from target echo signals, transient interference is also a common signal type that occurs outside the clutter region of HSSWR [43]. However, unlike echo signals of targets, transient interference is usually not directional. Moreover, the amplitude of transient interference is typically well over that of targets’ echo signals.

3.2. Clutter Sample Construction

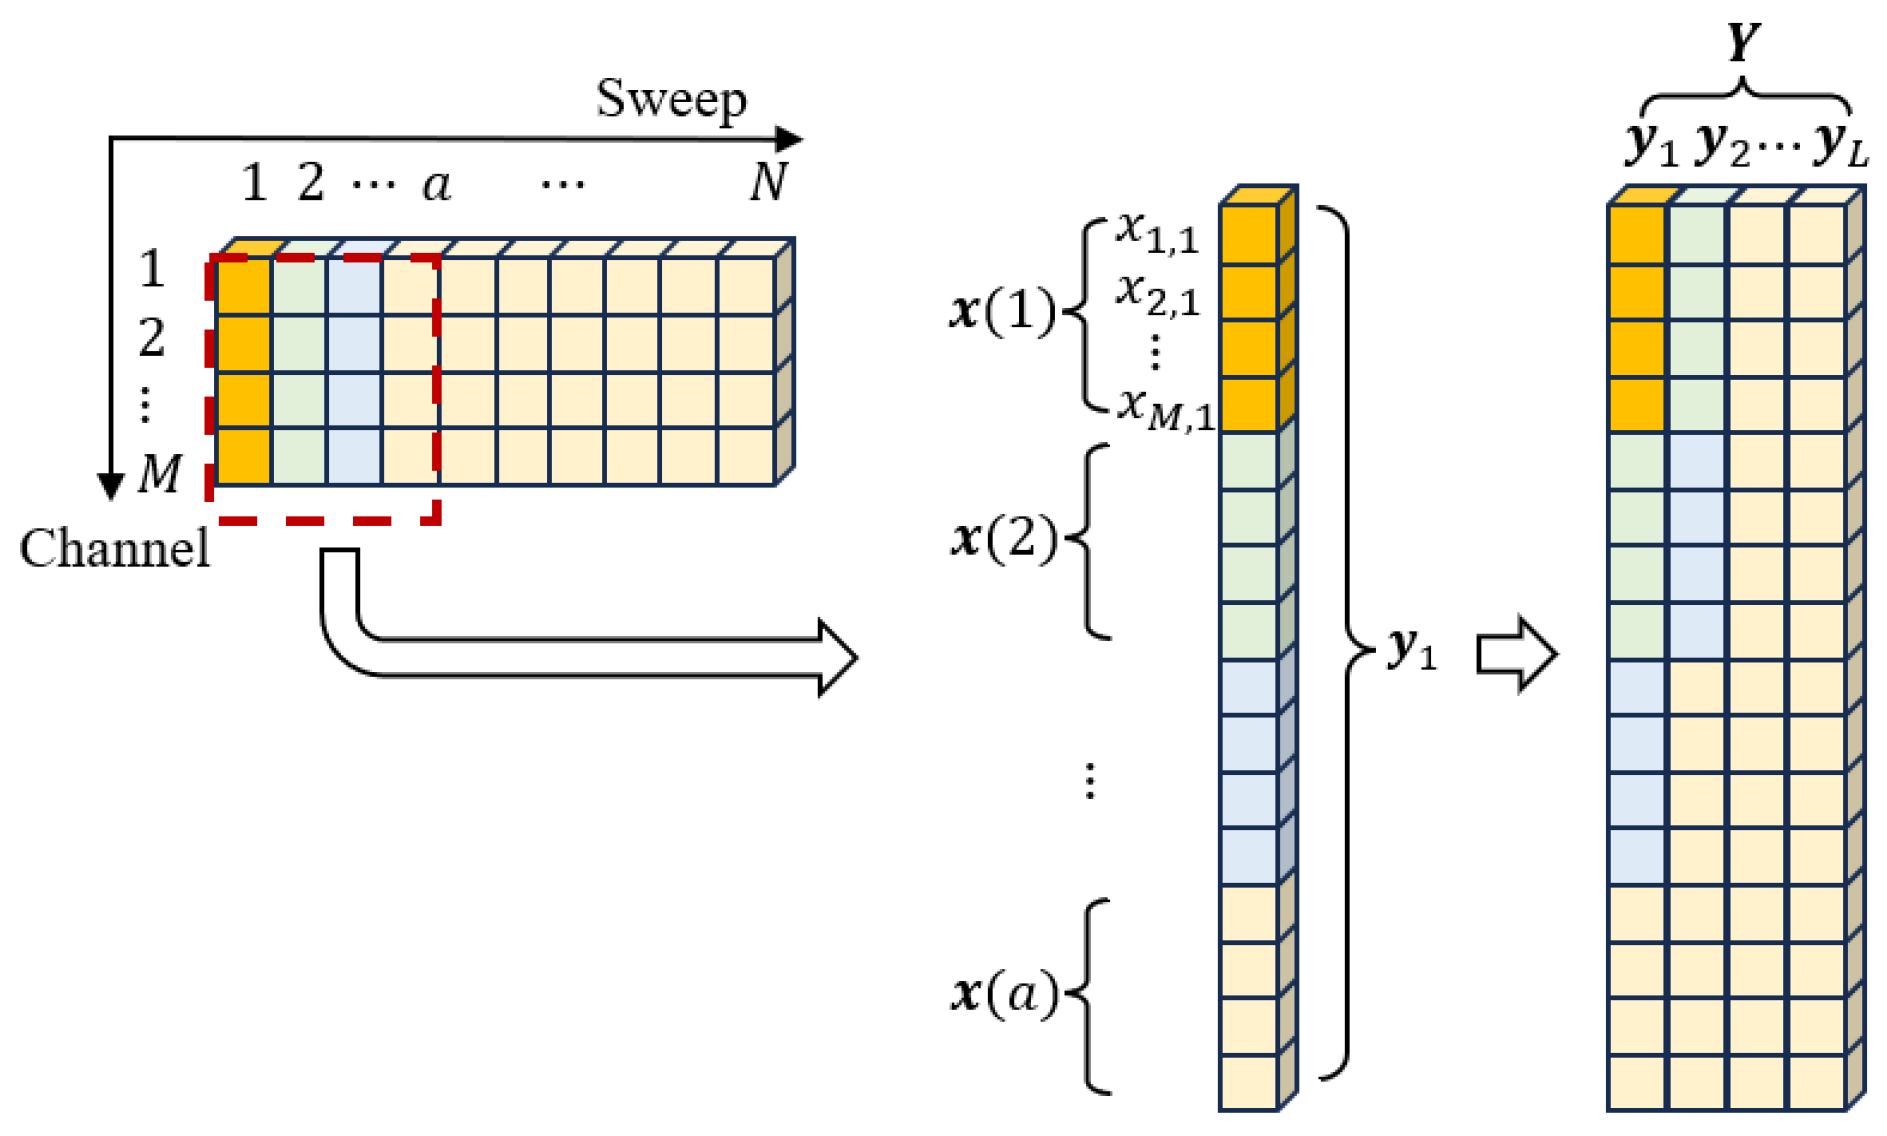
The M × N data matrix X is rearranged in the CUT into a spatial–temporal type, as follows:
Y = y 1 , y 2 , , y L
where y l = x l ; x l + 1 ; ; x ( l + a 1 ) , l = 1 , 2 , , L denotes the a M -dimensional spatial–temporal snapshot vector received at index l , a is the temporal sliding window width, and L = N a + 1 is the number of snapshots. A diagram of the process is shown in Figure 5.
The main objective of the APES filter design is to minimize the error between the filter’s output and the expected target signal while also ensuring a distortion-free output at a given Doppler and orientation, which is as follows [33]:
min w , α w H Y α T Q T w H Y α T Q T H s . t . w H S = 1
where w is the weight factor of the filter, and · H is the Hermitian operator. By using the Lagrange multiplier method, the orientation vector can be estimated using the following equation:
α ^ T = w H Y Q * Q T Q * 1
where · * is the complex conjugation operator. The following equation was obtained by substituting Equation (18) into the objective function in Equation (17):
w H Y α T Q T 2 2 = w H Y w H Y Q * Q T Q * 1 Q T 2 2 = w H Y I Q * Q T Q * 1 Q T 2 2 = w H Y P 2 2
where P = I Q * Q T Q * 1 Q T is an orthogonal projection operator, and Y P means projecting the original data onto the space orthogonal to the desired signal subspace. Then, Equation (17) can be reformulated as follows:
m i n w , α w H Y p 2 2     s . t . w H S = 1
where Y p = Y P is the clutter samples matrix we desire and contains signal components such as sea clutter, interferences, and background noise [26].
The APES principle can be used directly to construct a time-domain filter for removing target signals outside the clutter region. One can suppose that the Doppler frequencies of targets outside the clutter region are f t , t = 1 , , T , where T is the number of targets outside the clutter region. The signal subspace for targets outside the clutter region is
Q 1 = a f 1 Δ f 2 , a f 1 , a f 1 + Δ f 2 , a f 2 Δ f 2 , a f 2 , a f 2 + Δ f 2 , , a f T Δ f 2 , a f T , a f T + Δ f 2
where a f t = 1 , e j 2 π f t , , e j 2 π L 1 f t T , which denotes the temporal steering vector.
The orthogonal projection matrix of Q 1 is
P 1 = I Q 1 * Q 1 T Q 1 * 1 Q 1 T
Then, clutter samples after removing the signal components of targets outside the clutter region can be expressed as
Y p 1 = Y P 1
Since we do not know the actual location of the targets’ frequency points in the clutter region in advance, the clutter samples are then updated by traversing frequency points in the clutter region, that is
Y p 2 = Y p 1 P 2
and
P 2 = I Q 2 * Q 2 T Q 2 * 1 Q 2 T ,
Q 2 = a f i n Δ f 2 , a f i n , a f i n + Δ f 2
where f i n F c is the frequency point that is currently being executed.

3.3. Sea Clutter Suppression

The clutter sample matrix Y p 2 can be decomposed with SVD as follows:
Y p 2 = U Σ V T
where Σ = d i a g σ 1 , , σ c , σ 1 σ 2 σ c > 0 and contains the singular values of Y p 2 , c = min a M , L , U and V T are the corresponding left and the right singular vectors, respectively, and [44]
U = u 1 , u 2 , , u a M
V T = v 1 , v 2 , , v L
In the clutter samples, the energy of sea clutter is much greater than that of noise and interference [22]. Consequently, the large singular values in Σ will contain most of the power of the sea clutter, and the remaining small singular values represent interference and noise. The sea clutter subspace is
P C = u 1 , u 2 , , u k
where k ( k < c ) is obtained by calculating the largest gradient of the singular values in matrix Σ . Then, the projection operator of sea clutter is calculated by [23]
P t = P C P C H P C 1 P C H
The idea behind using the size of the singular value to differentiate sea clutter from noise is based on the necessity for a significant energy difference between the two. Effective differentiation typically occurs when sea clutter’s energy is at least 5 dB higher than the background noise. However, due to propagation attenuation, the strength of sea clutter detected by radars diminishes as the distance increases. It challenges the algorithm’s effectiveness in suppressing sea clutter for long-distance ocean echoes because their energy levels become similar to that of the noise. Based on measured data, the proposed algorithm can be effective within a range of no less than 150 km. By projecting the original spatial–temporal matrix into the sea clutter subspace and subtracting this part of the data, the spatial–temporal data matrix with sea clutter suppressed is obtained as follows:
Y s = Y P t Y
In order to determine the targets’ presence at a particular frequency point, we should first restore the sea clutter-suppressed spatial–temporal matrix to the channel-sweep dimension. Then, we calculate the STS and look for a noticeable spike. If such a spike is present, it indicates the existence of a target at the frequency point we are observing. If there is no noticeable spike, we consider that there is no target at that frequency point.
Although the above criterion is usually sufficient, there are instances when a spectral point of sea clutter can be mistakenly identified as a target. In such cases, we may further transform the sea-clutter-suppressed sampling data into the time–frequency domain. It allows us to differentiate the spectral point using the time–frequency distribution differences between the sea clutter and the target. Specifically, in the presence of a target, a clear and bright spectral line may run through the time axis in the time–frequency spectrum.
Once it is determined that there is a target at the current frequency point, the clutter samples need to be updated as follows:
Y p 1 = Y p 2
and we can revisit (24) and investigate the following frequency points in F c . Otherwise, we can directly return to (24) and investigate the other frequency points in F c .
After all the frequency points in F c have been traversed, the clutter samples obtained at the time do not contain signals from targets anymore. Then, we perform the steps between (25) and (28), and the resulting Y s is the final spatial–temporal data matrix after the sea clutter is suppressed.

4. Simulation

In this section, we simulated the first-order sea clutter spectrum of the HSSWR utilizing the signal model proposed in Section 2. We then validated the effectiveness of the proposed sea clutter suppression algorithm by adding simulated target signals both inside and outside the clutter region. The carrier frequency used was 10.66 MHz, with a bandwidth of 30 kHz and a sweep period of 0.5 s. The CIT was 300 s (600 sweep periods included). The receiving array comprised eight elements arranged in a ‘y’ shape, while the ionosphere was assumed to move in a simple harmonic motion. The ionosphere assumption is based on the properties of measured data. Specifically, the harmonic plasma drift pattern was adopted to depict situations when large traveling ionospheric disturbances (TIDs) propagate through the ionosphere [45]. Additional simulation parameters are listed in Table 1.

4.1. Target Outside the Clutter Region

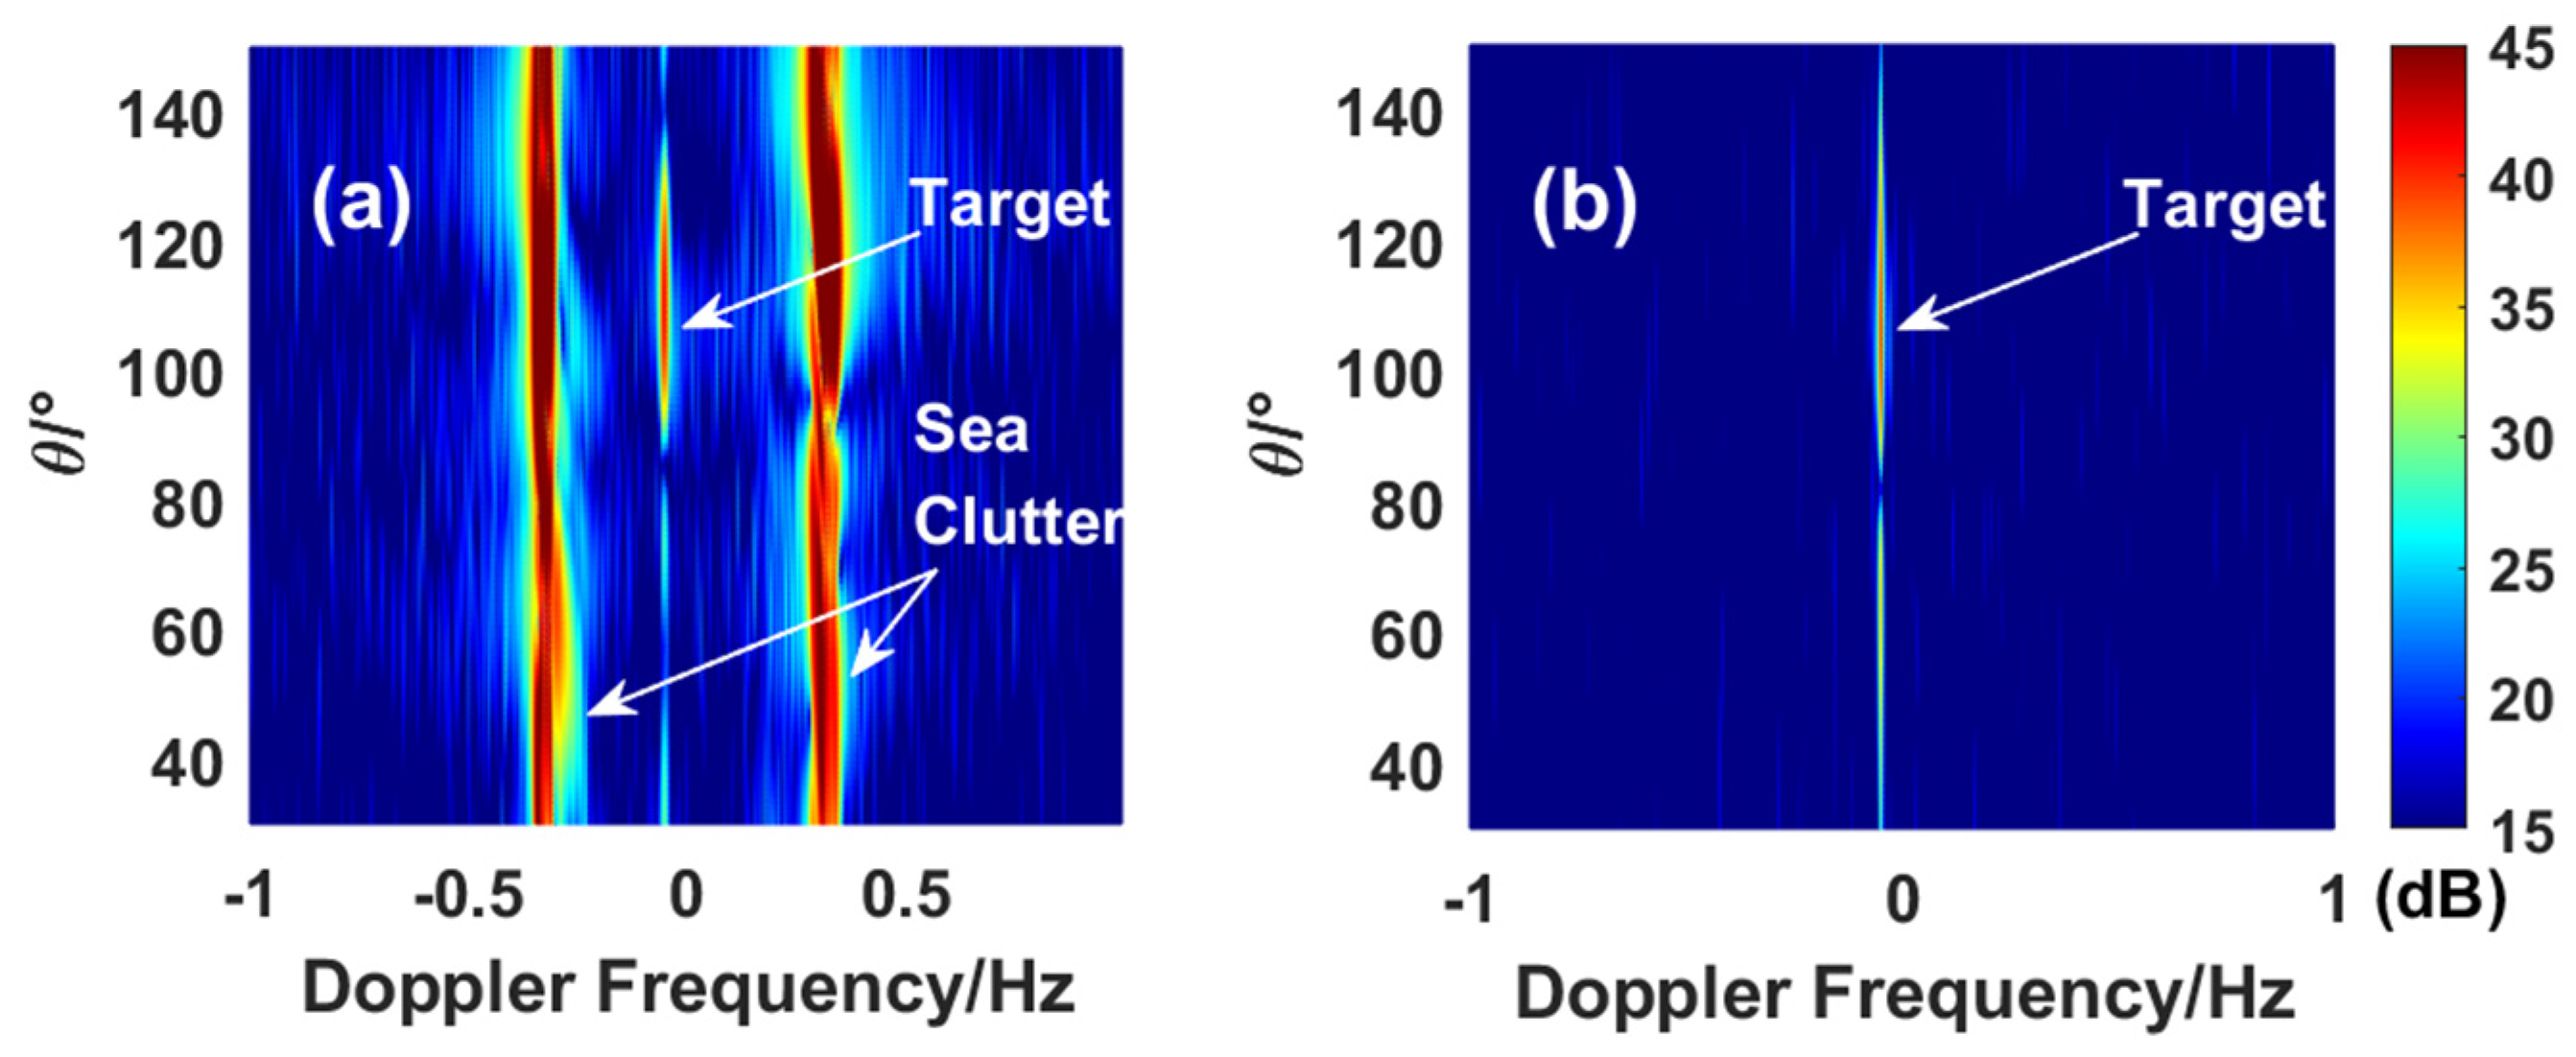
The STSs of the simulated HSSWR data from the fifth range cell (about 50 km from the receiver) with and without sea clutter suppression are presented in Figure 6. The vertical plasma drift velocity is 3 cos 0.01 t m/s, while the horizontal component is 0 m/s. After range and orientation processing, echoes of sea clutter turned into strips that were distributed from −0.37 to −0.28 Hz (the negative one) and from 0.27 to 0.36 Hz (the positive one) in Doppler and spread to all orientation cells. The Bragg peaks are slightly broadened due to the ionospheric phase path disturbances, and they are nearly symmetrically distributed concerning 0 Hz, as the modulation impacts of the ocean current were not considered. The injected target is at −0.05 Hz, with a preset DOA of 110° from the array direction, the signal-to-clutter ratio (SCR) of which is −5.17 dB. During the process, the temporal sliding window contained 50 sampling points in slow time, and the original 8 × 600 data matrix X was converted into 400 × 551 spatial–temporal type Y , with 551 being the number of snapshots. Figure 6b shows the sea clutter-mitigated results with the APES-OP algorithm proposed. The sea clutter was wholly suppressed, while the target signal was retained.
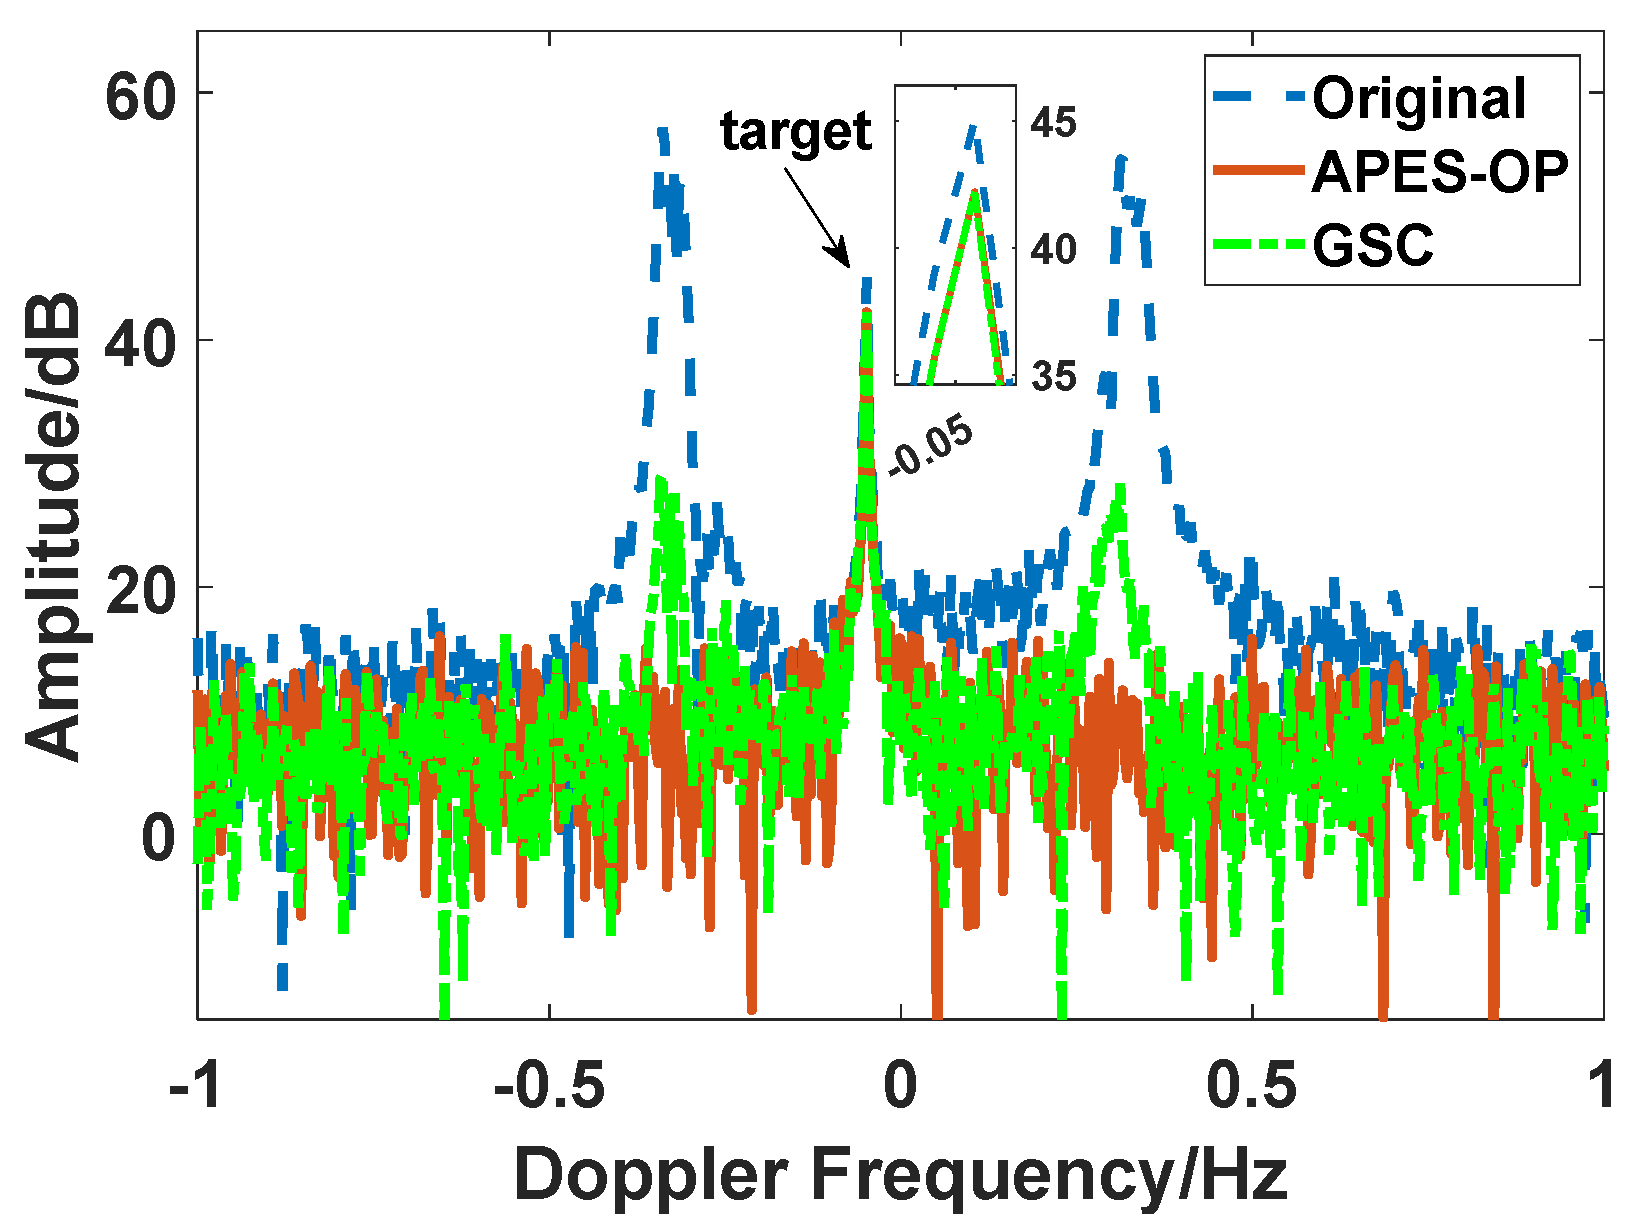
The power density spectrums (PDSs) from the fifth range cell before and after sea clutter suppression are selected and presented in Figure 7. For comparison, a sea clutter suppression algorithm based on the generalized sidelobe cancellers (GSCs) theory [46] was applied to the simulated data. The GSC algorithm was designed based on the differences in spatial features between sea clutter and the target, and sampling data from the CUT was utilized to establish the clutter samples [28]. The proposed algorithm more sufficiently suppressed the sea clutter, while residual clutter existed from −0.38 to −0.28 Hz and 0.24 to 0.35 Hz in the PDS with GSC. The amplitude peak of the target remained unvaried with APES-OP, the SCR of which significantly improved by about 31.37 dB. The target’s amplitude decreased lightly with GSC, the SCR of which just improved by about 14.62 dB.

4.2. Target Inside the Clutter Region

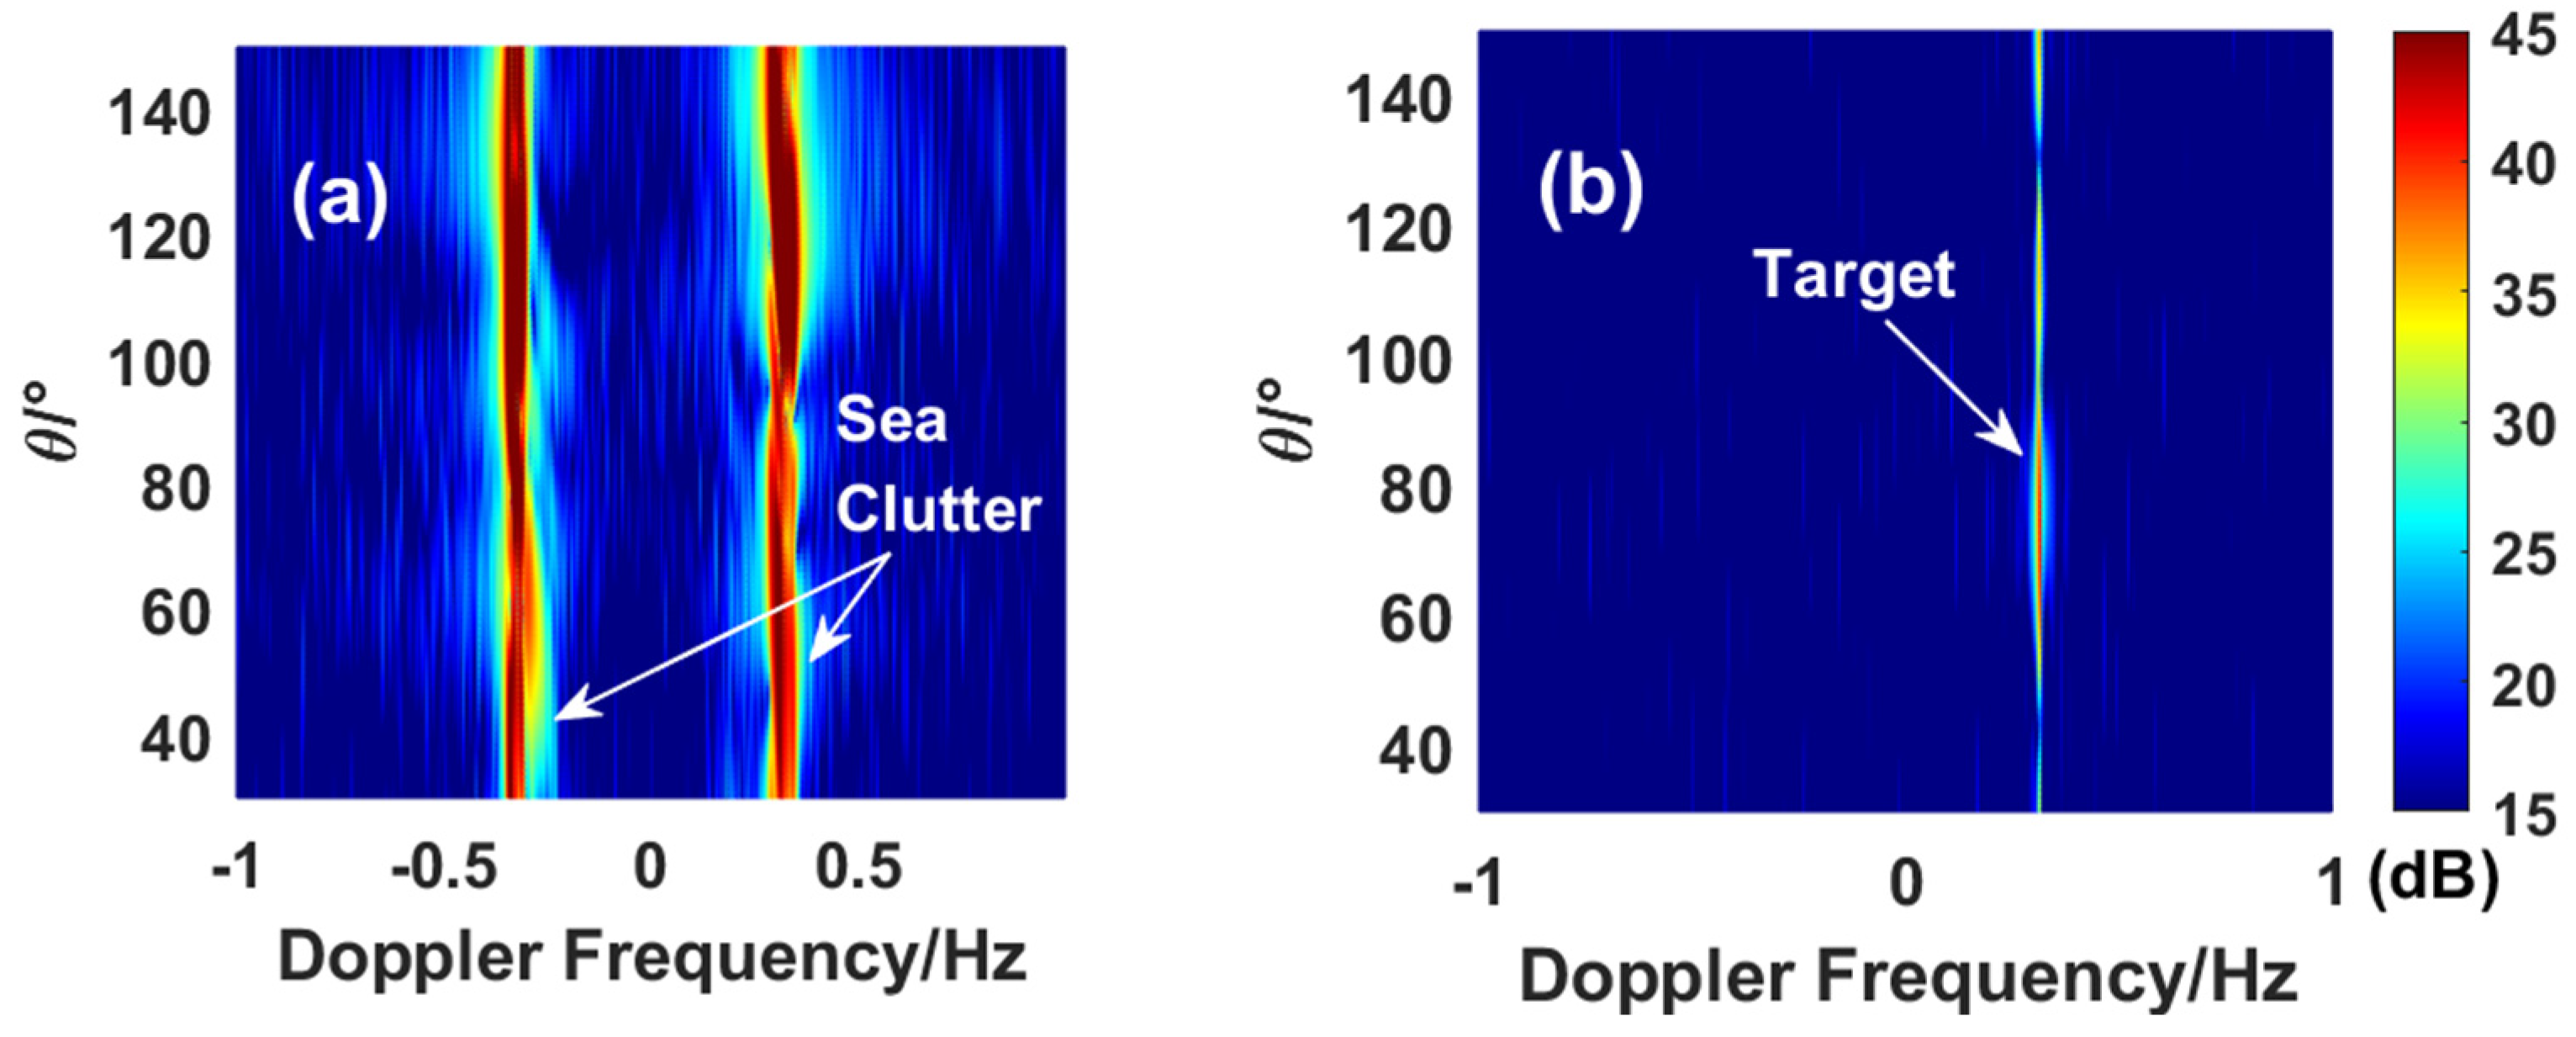
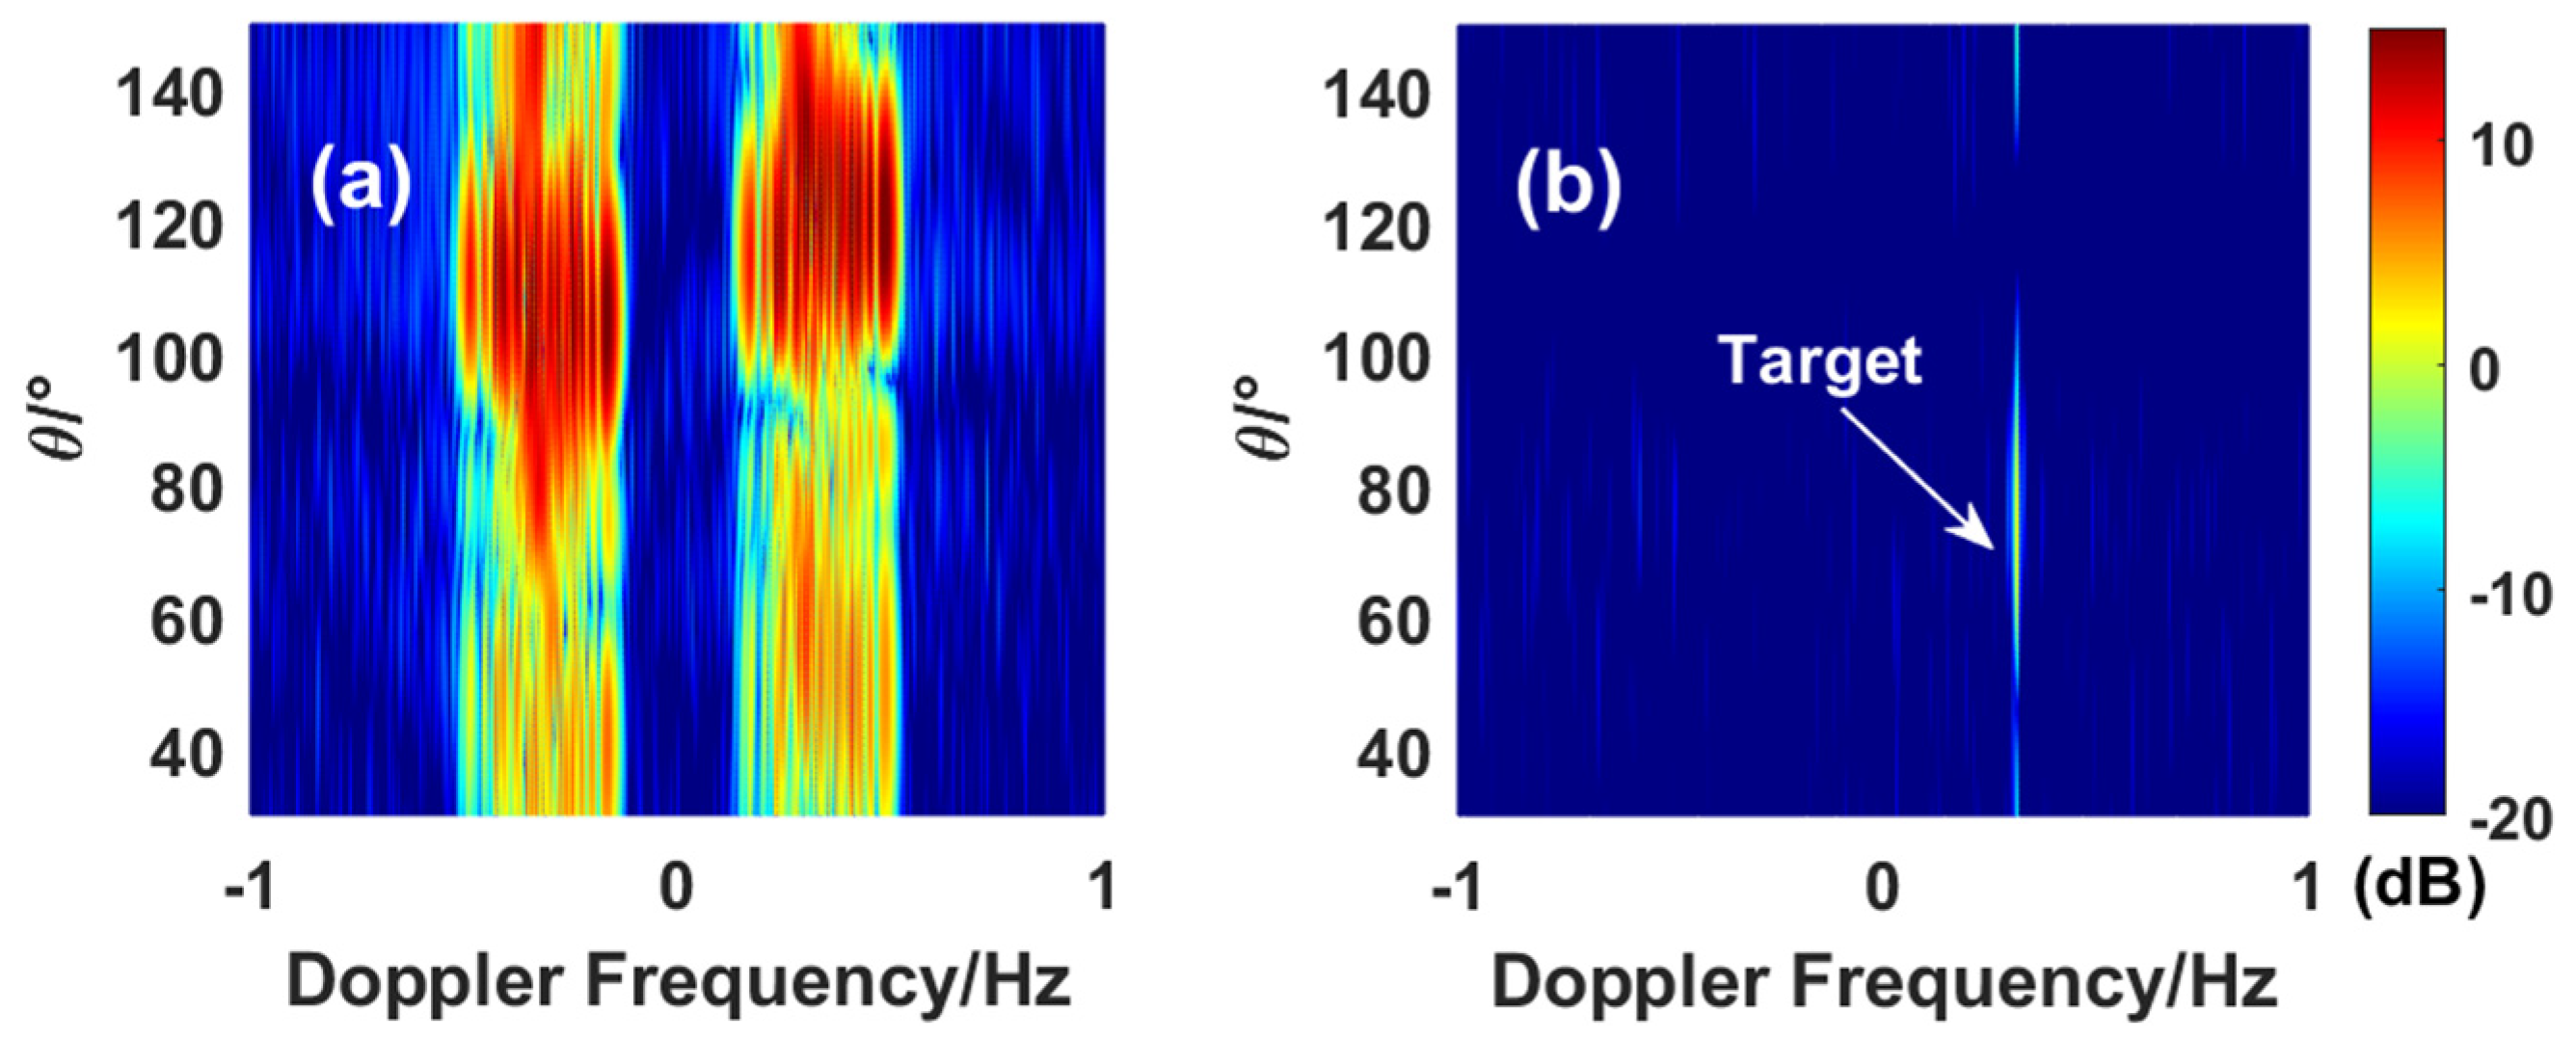
For verifying the effectiveness of the proposed algorithm for the condition of target echoes buried by sea clutter, a simulated target was injected into the clutter region, and the corresponding STSs are presented in Figure 8. The injected target is at 0.31 Hz, with a preset DOA of 80° from the array direction; the original SCR is −1.68 dB. The simulated target is submerged in the clutter region and is challenging to detect. Figure 8b shows the STS after sea clutter mitigation with the APES-OP algorithm. The sea clutter was suppressed effectively, and the target echoes were reserved.
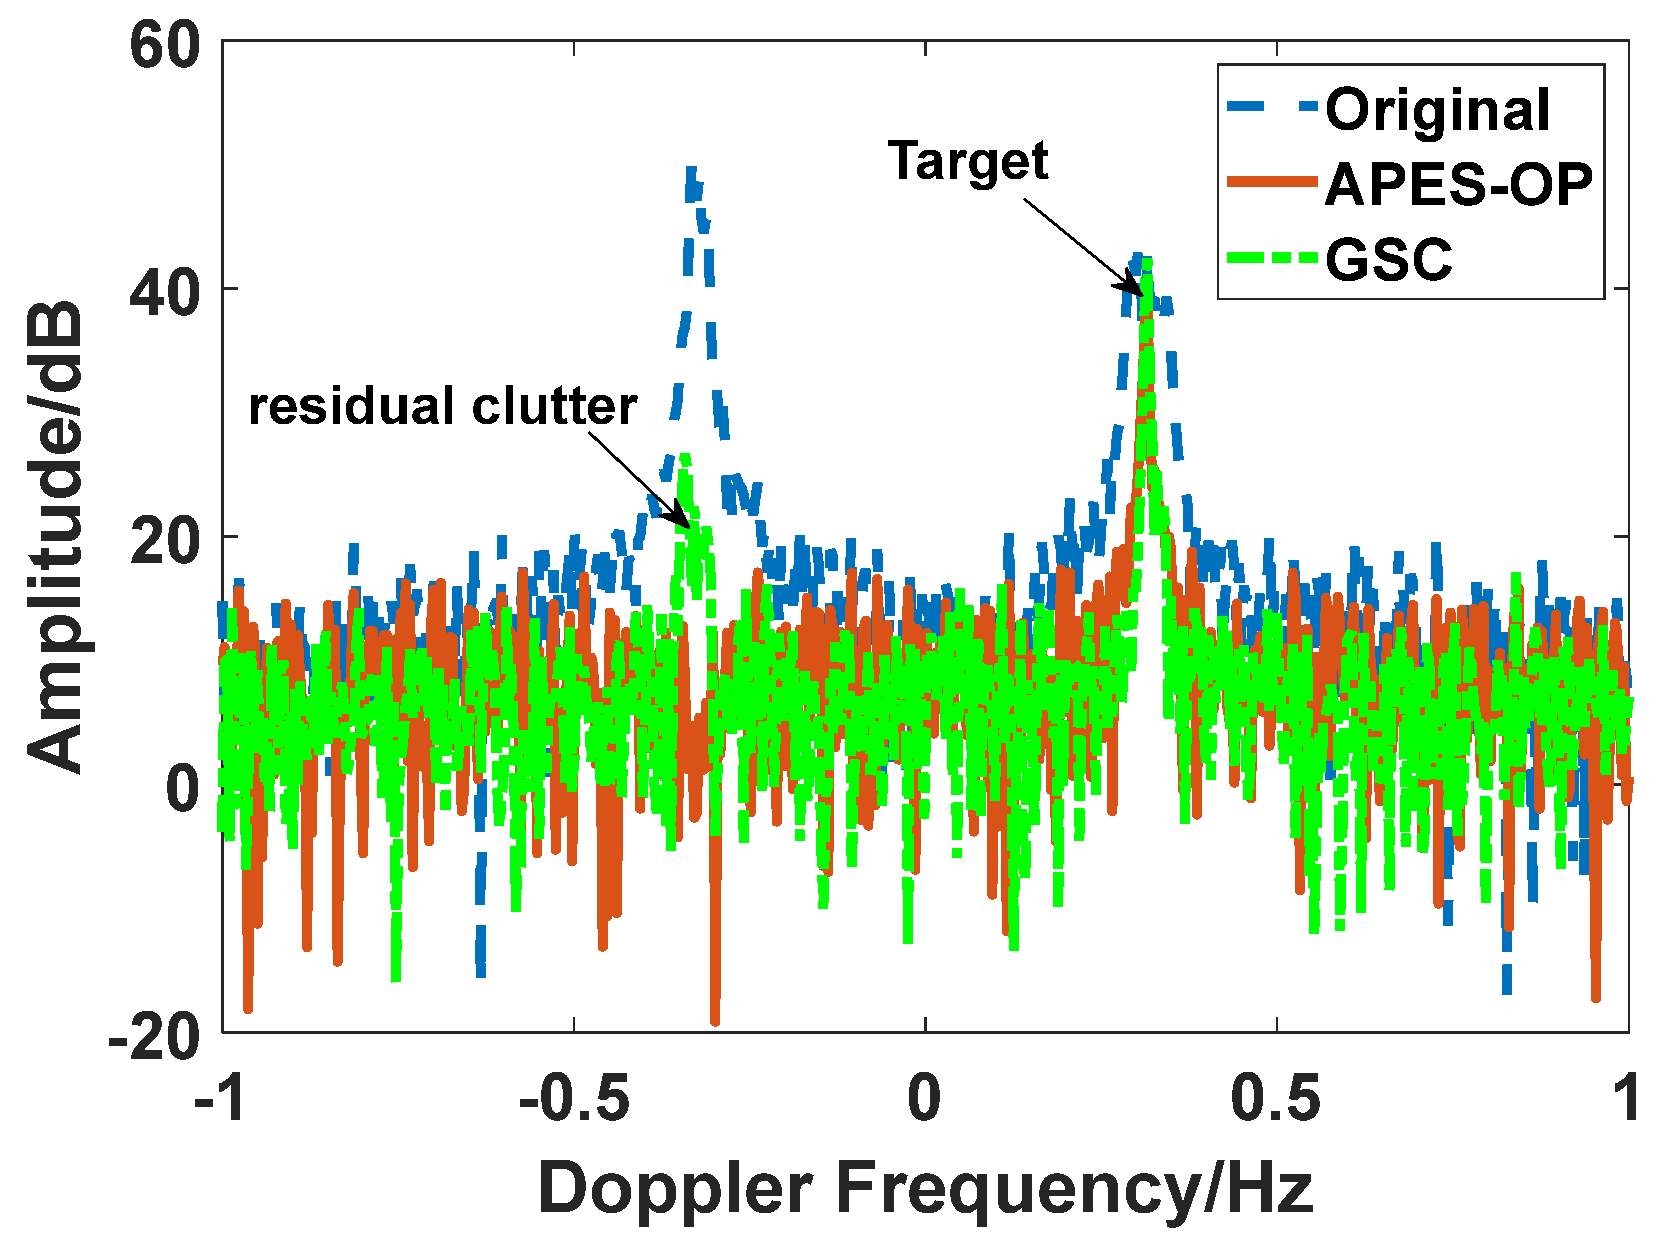
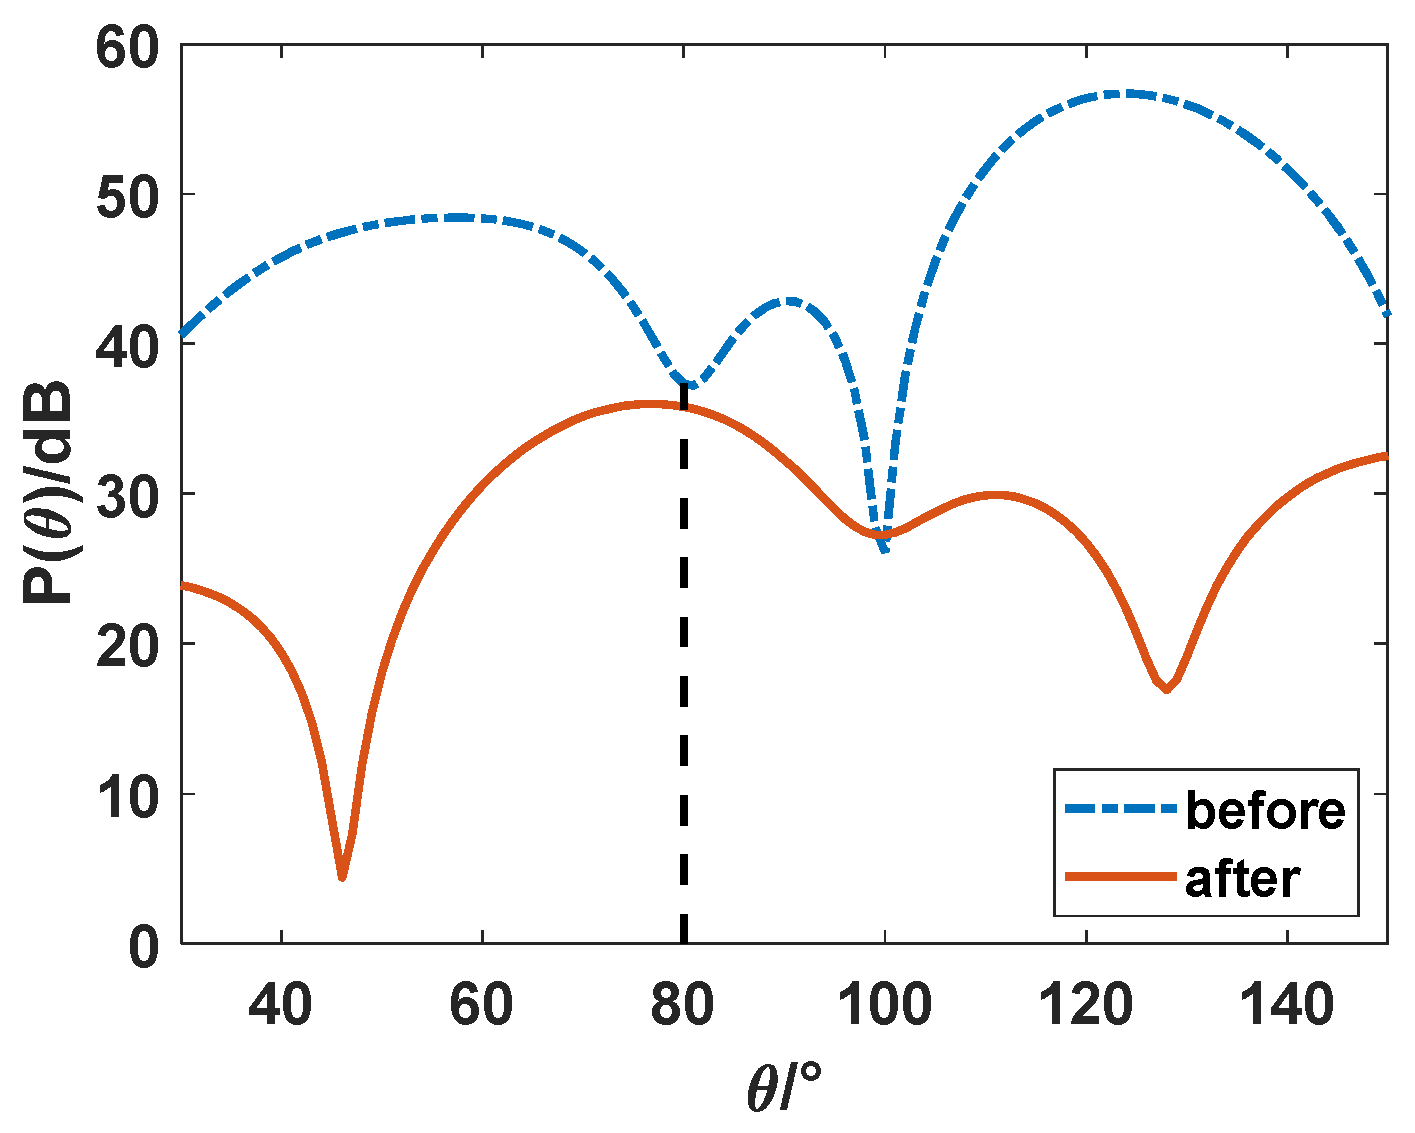
Figure 9 presents the PDS from the fifth range cell. The spectrum power of the target remained high after processing, while that of sea clutter decreased obviously. The target’s SCR results significantly improved from −1.68 dB to 26.93 dB with APES-OP and 11.65 dB with GSC. The angular response of the frequency point of the injected target (0.31 Hz in PDS) before (the blue-dotted line) and after (the red-solid line) sea clutter suppression was calculated and is shown in Figure 10. The original peak is at 124°, disturbed by sea clutter. In contrast, the mitigated results agree well with the preset direction.
It is worth mentioning that residual clutter still exists in PDSs after processing with GSC for the two examples in the simulation. The reason is that GSC needs to filter out the signal in the target direction before creating the clutter samples. During the procedure, the sea clutter from the same direction is also filtered out and cannot contribute to creating the clutter samples. As a result, this particular section of the ocean clutter is preserved as the desired signal. Since a compact receiving array was adopted in the simulation, the azimuth resolution was low, preserving a large part of the sea clutter. In contrast, the proposed algorithm constructed APES filters to effectively filter out target signals while minimizing the impact on sea clutter signals, resulting in more thorough sea clutter suppression.

4.3. Target Inside the Clutter Region with Severe Ionospheric Disturbance

To verify the proposed algorithm’s effectiveness for target echoes buried by sea clutter while the ionosphere was undergoing severe disturbances, a simulated target was injected into the clutter region, and the corresponding STSs are presented in Figure 11. The vertical plasma drift velocity is 6 cos 0.05 t m/s, while the horizontal component is 1 cos 0.01 t m/s. The injected target is at 0.31 Hz, with a preset DOA of 80° from the array direction; the original SCR is −4.43 dB. Figure 11b shows the STS after sea clutter mitigation with the APES-OP algorithm. The sea clutter was suppressed effectively, and the target echoes were reserved.
Figure 12 presents the PDS from the fifth range cell. The spectrum power of the target remained high after processing, while that of sea clutter decreased obviously. The target’s SCR results significantly improved from −4.43 dB to 24.89 dB with APES-OP and 11.37 dB with GSC.
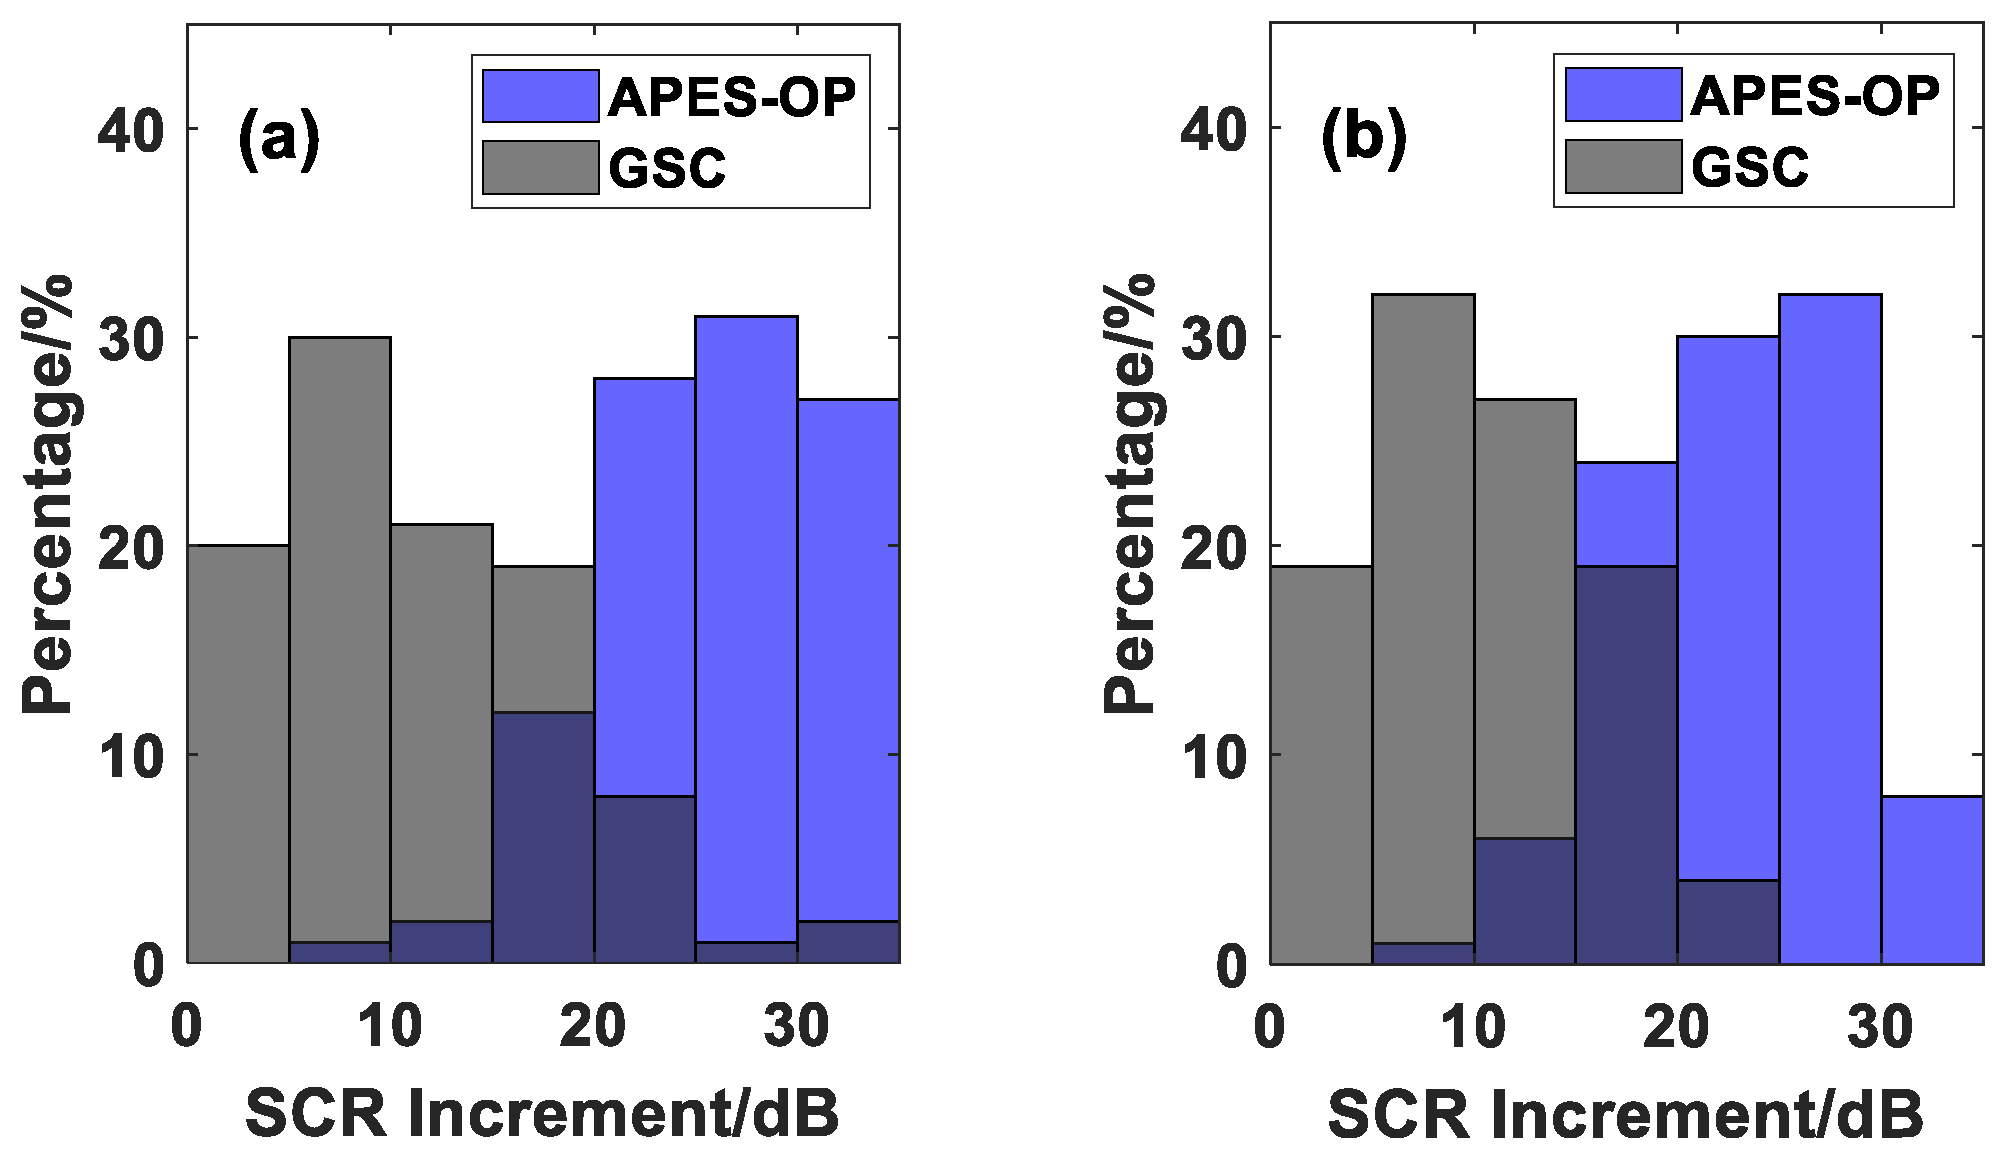
Without loss of generality, 100 Monte Carlo tests were carried out for the cases when the simulated target was inside or outside the clutter region F c . The histogram of SCR increments of targets after sea clutter suppression is shown in Figure 13. During the process, the background noise was unvaried, and the amplitude of sea clutter changed randomly. The clutter-to-noise ratio (CNR) varies from 21.5 dB to 26.5 dB. Both methods effectively improved SCR. The average SCR increment of the target outside the clutter region F c is 25.9 dB for APES-OP and 11.3 dB for GSC, while that of the target inside the clutter region is 22.6 for APES-OP and 10.2 dB for GSC. The APES-OP algorithm yielded better SCR increments than the GSC algorithm.

5. Experiment

5.1. System Layout

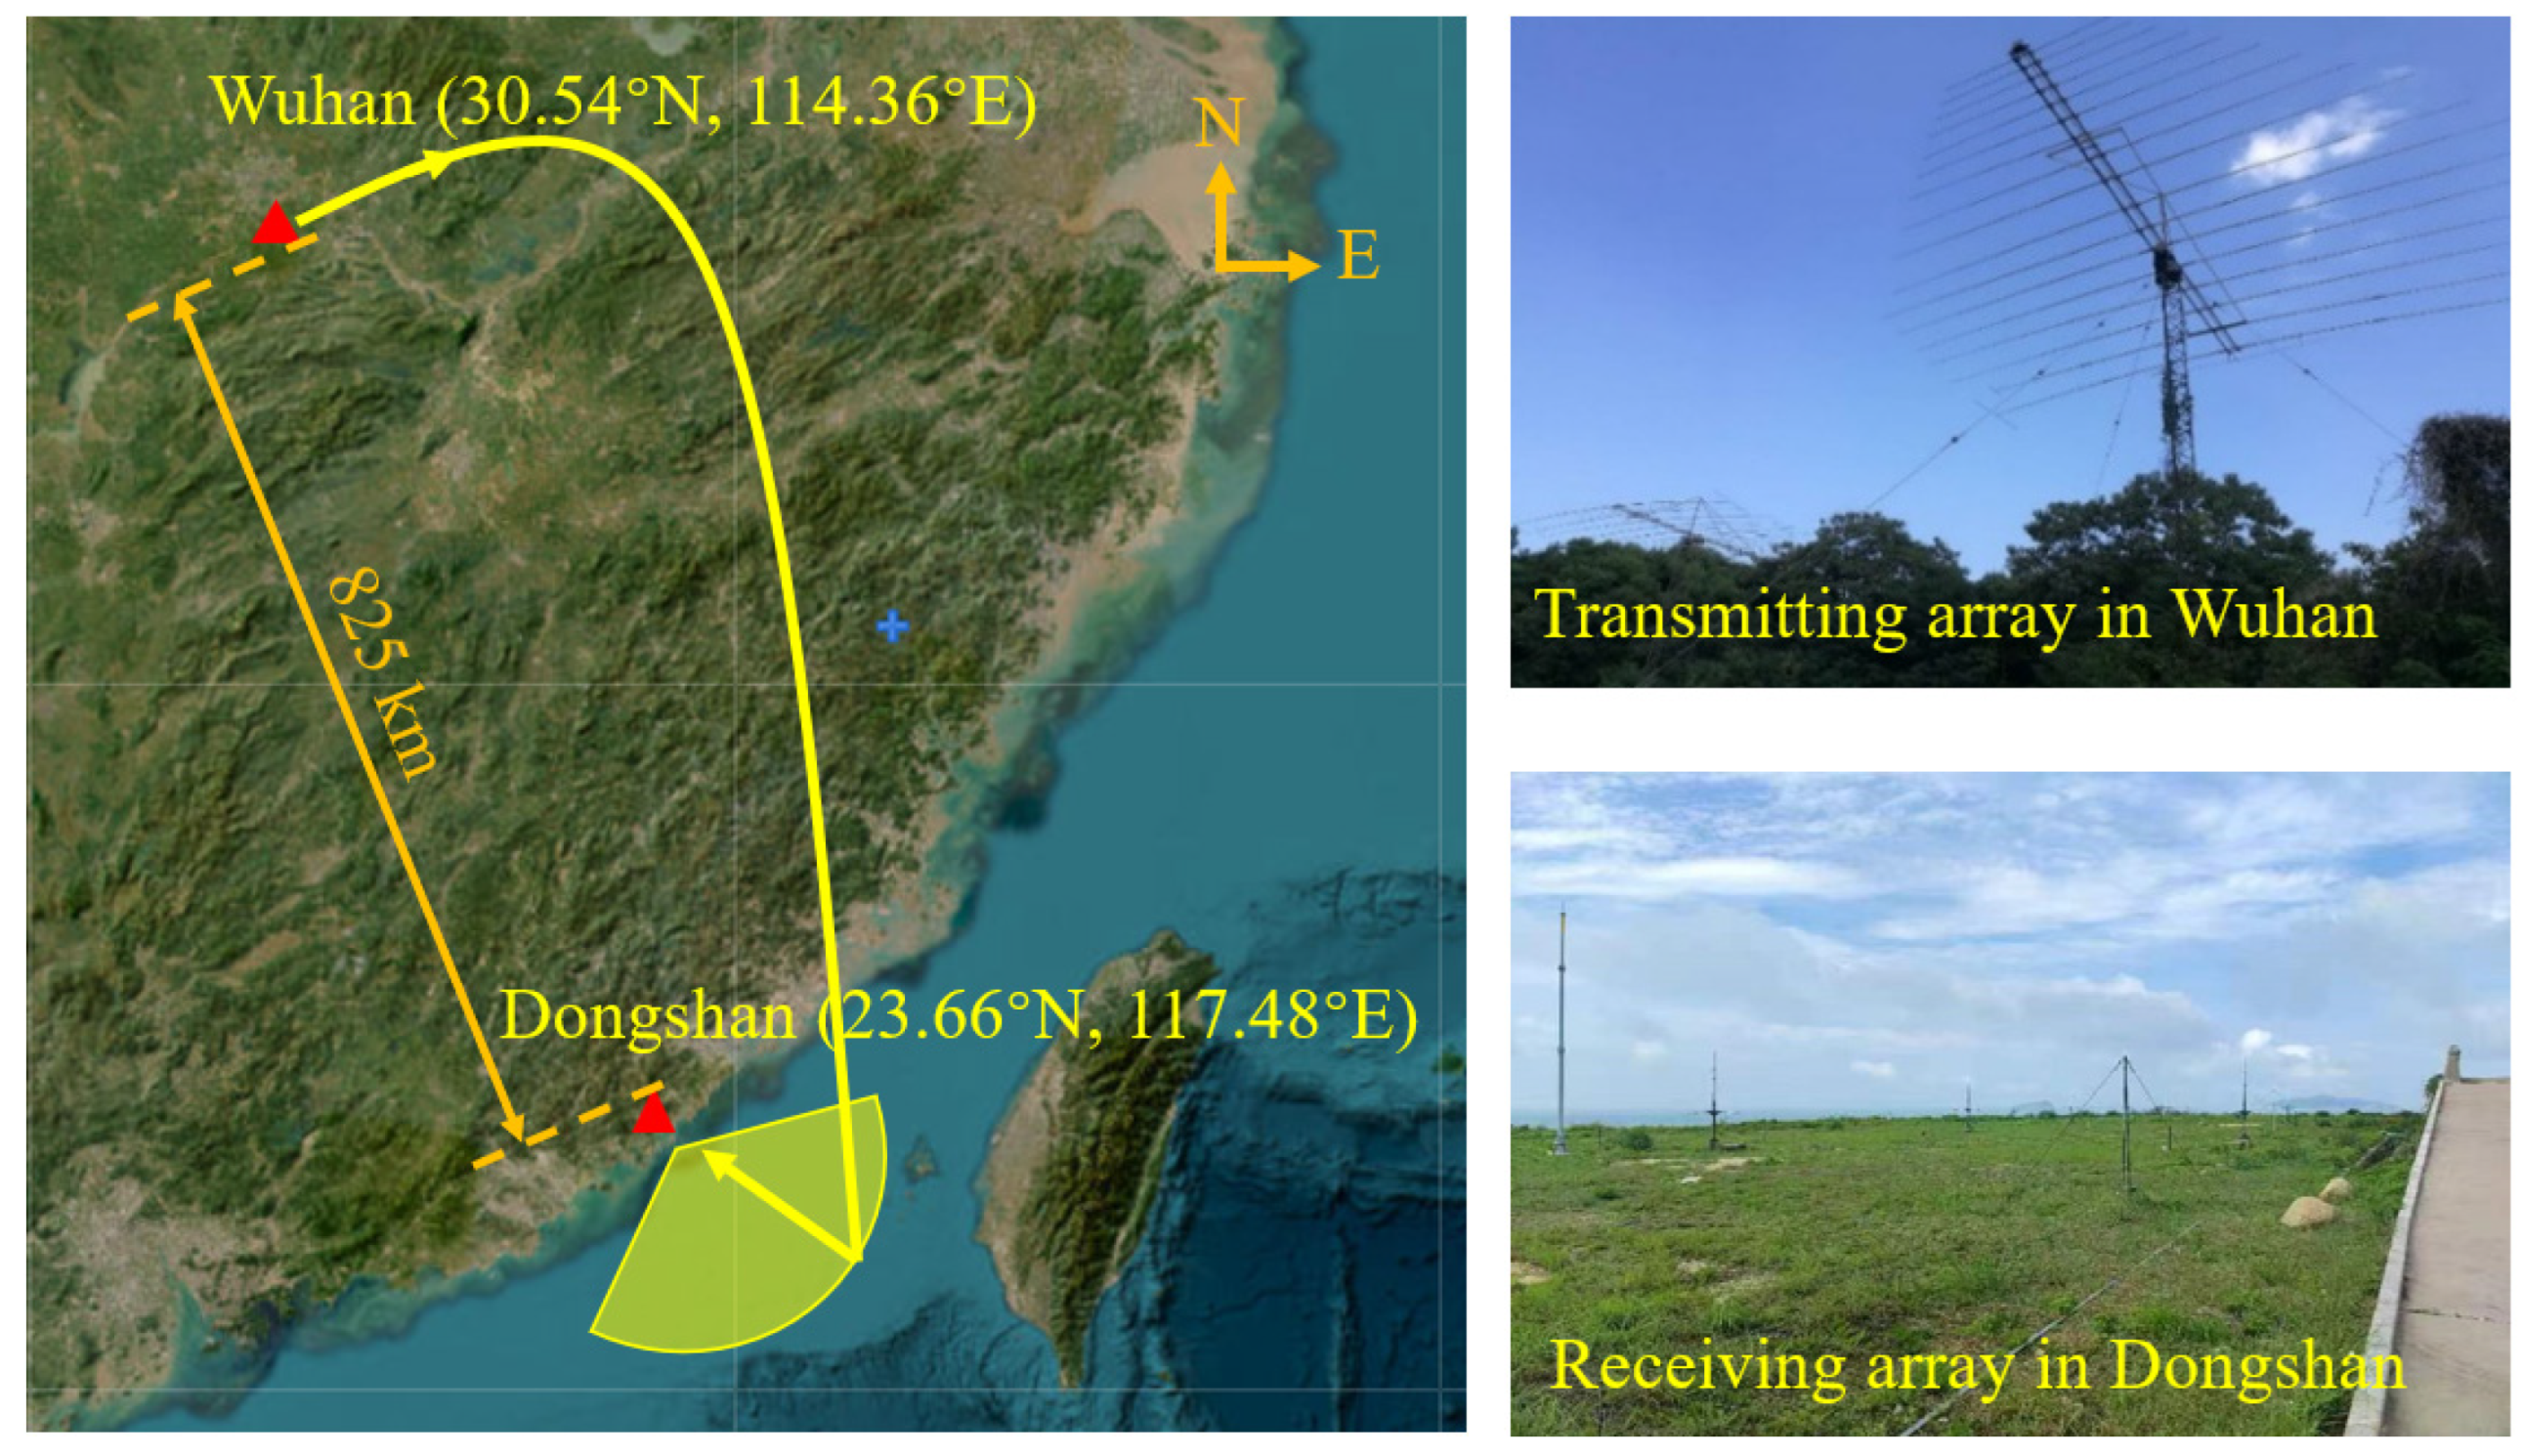
From 31 March to 4 April 2017, Wuhan University conducted a field experiment using a newly developed HSSWR system [37]. This experimental radar system consisted of a sky-wave-transmitting and surface-wave-receiving subsystem, synchronized using GPS-derived time modulation. Two log-periodic antennas were deployed in Wuhan (30.54°N, 114.36°E), China, emitting a frequency-modulated continuous wave (FMCW) signal. The surface-wave-receiving subsystem was in Dongshan (23.66°N, 117.48°E), China, 825 km from the sky-wave-transmitting station. A simplified diagram of the experimental radar system is shown in Figure 14.
The Dongshan station utilized eight vertical monopoles arranged in a non-linear pattern as the receiving array. The HSSWR system’s operating frequency was selected in real time based on environmental noise and ionosphere reflection channel conditions. The system had a maximum transmitting power of 1 kW, a sweep bandwidth of 30 kHz, a sweep interval of 500 ms, and a CIT of 300 s (including 600 sweep periods). The reader can refer to the literature [47] for a more detailed explanation of the experimental HSSWR system.

5.2. Single Target in Sea Clutter

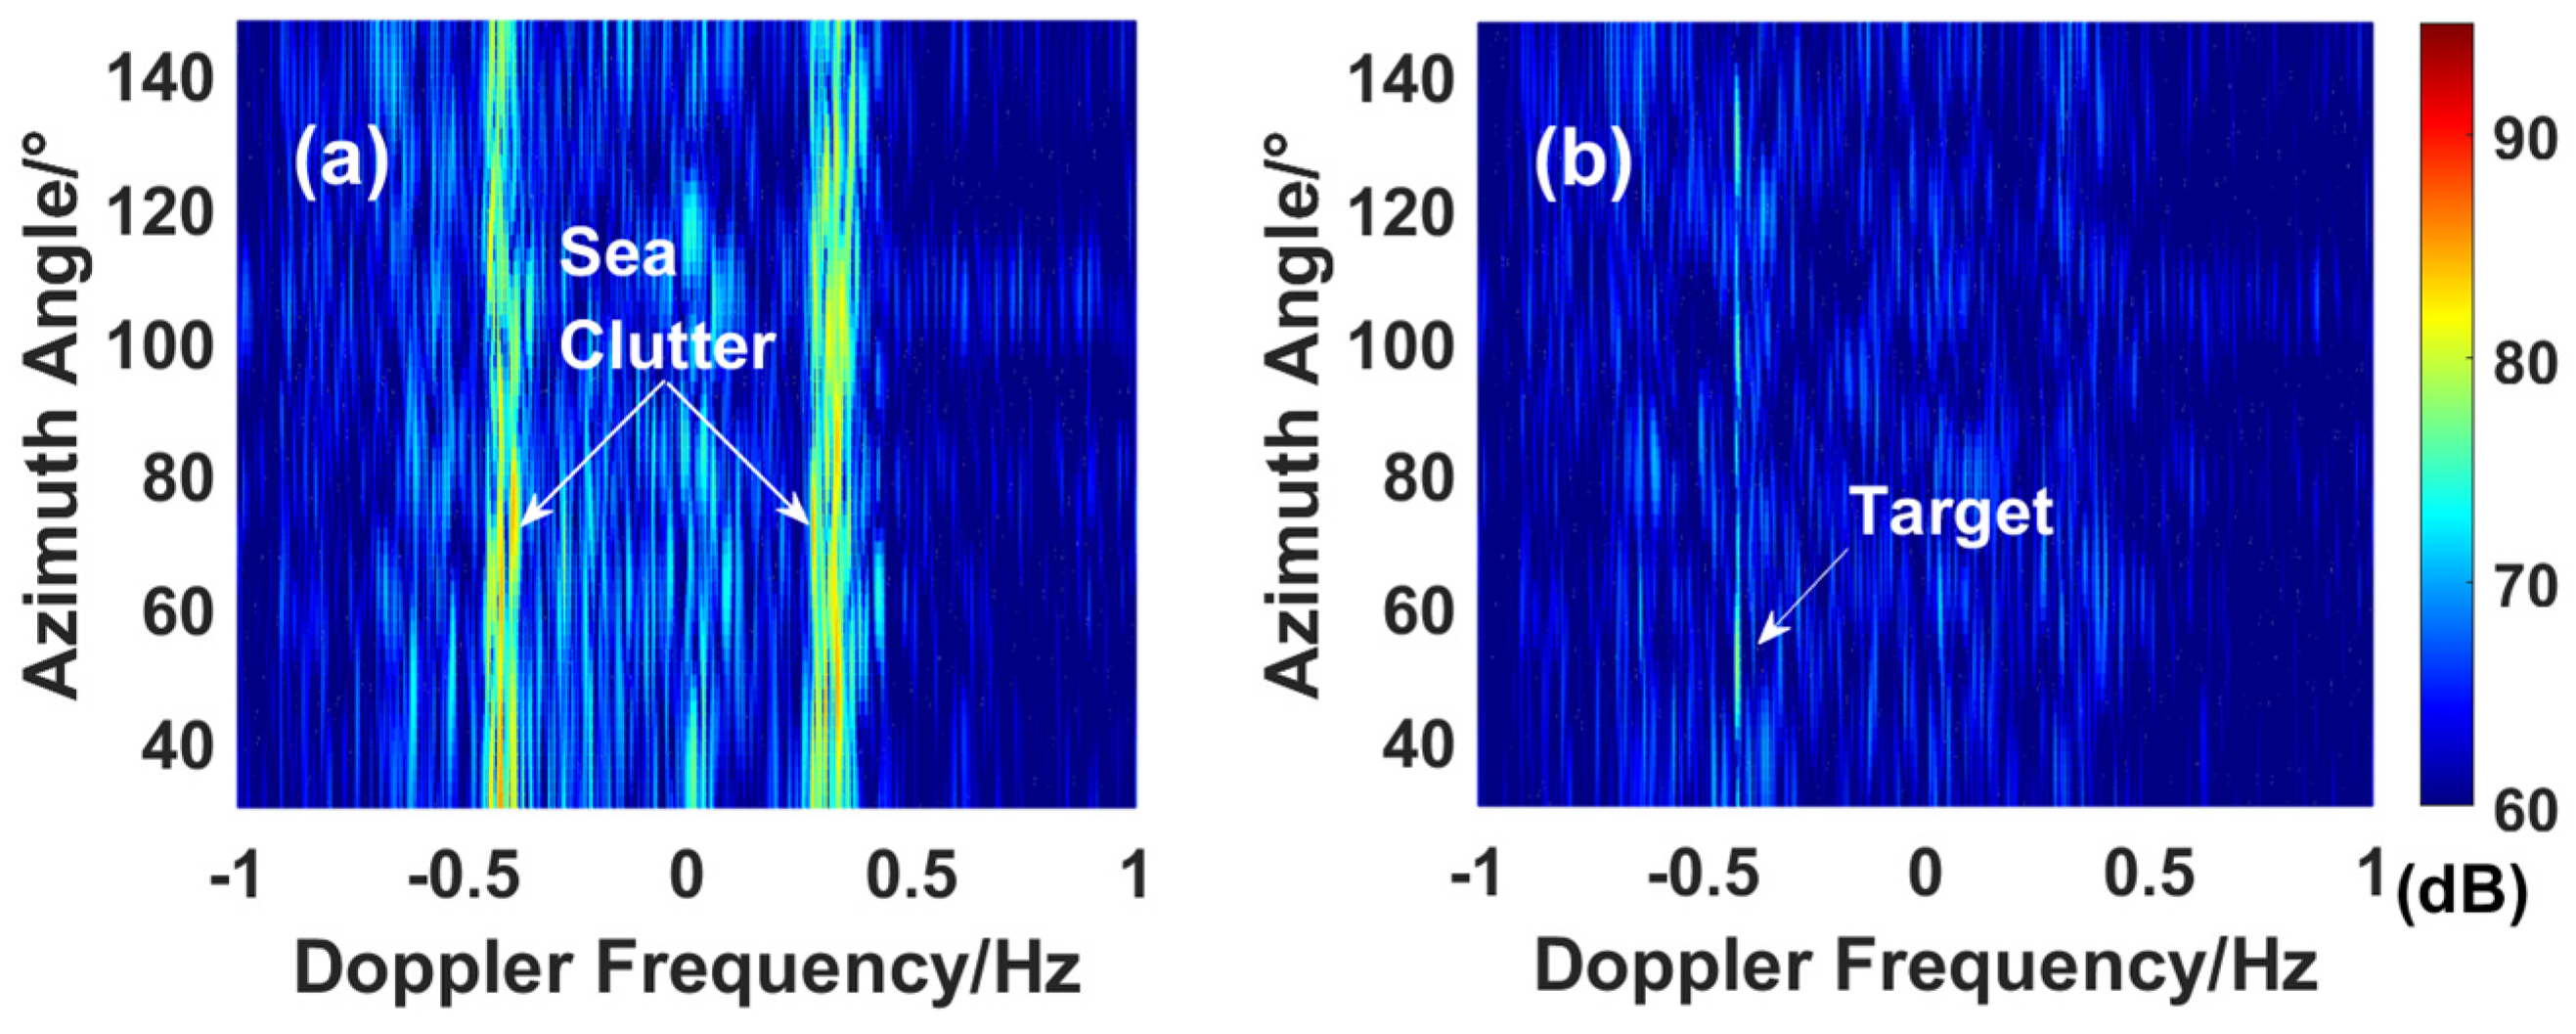
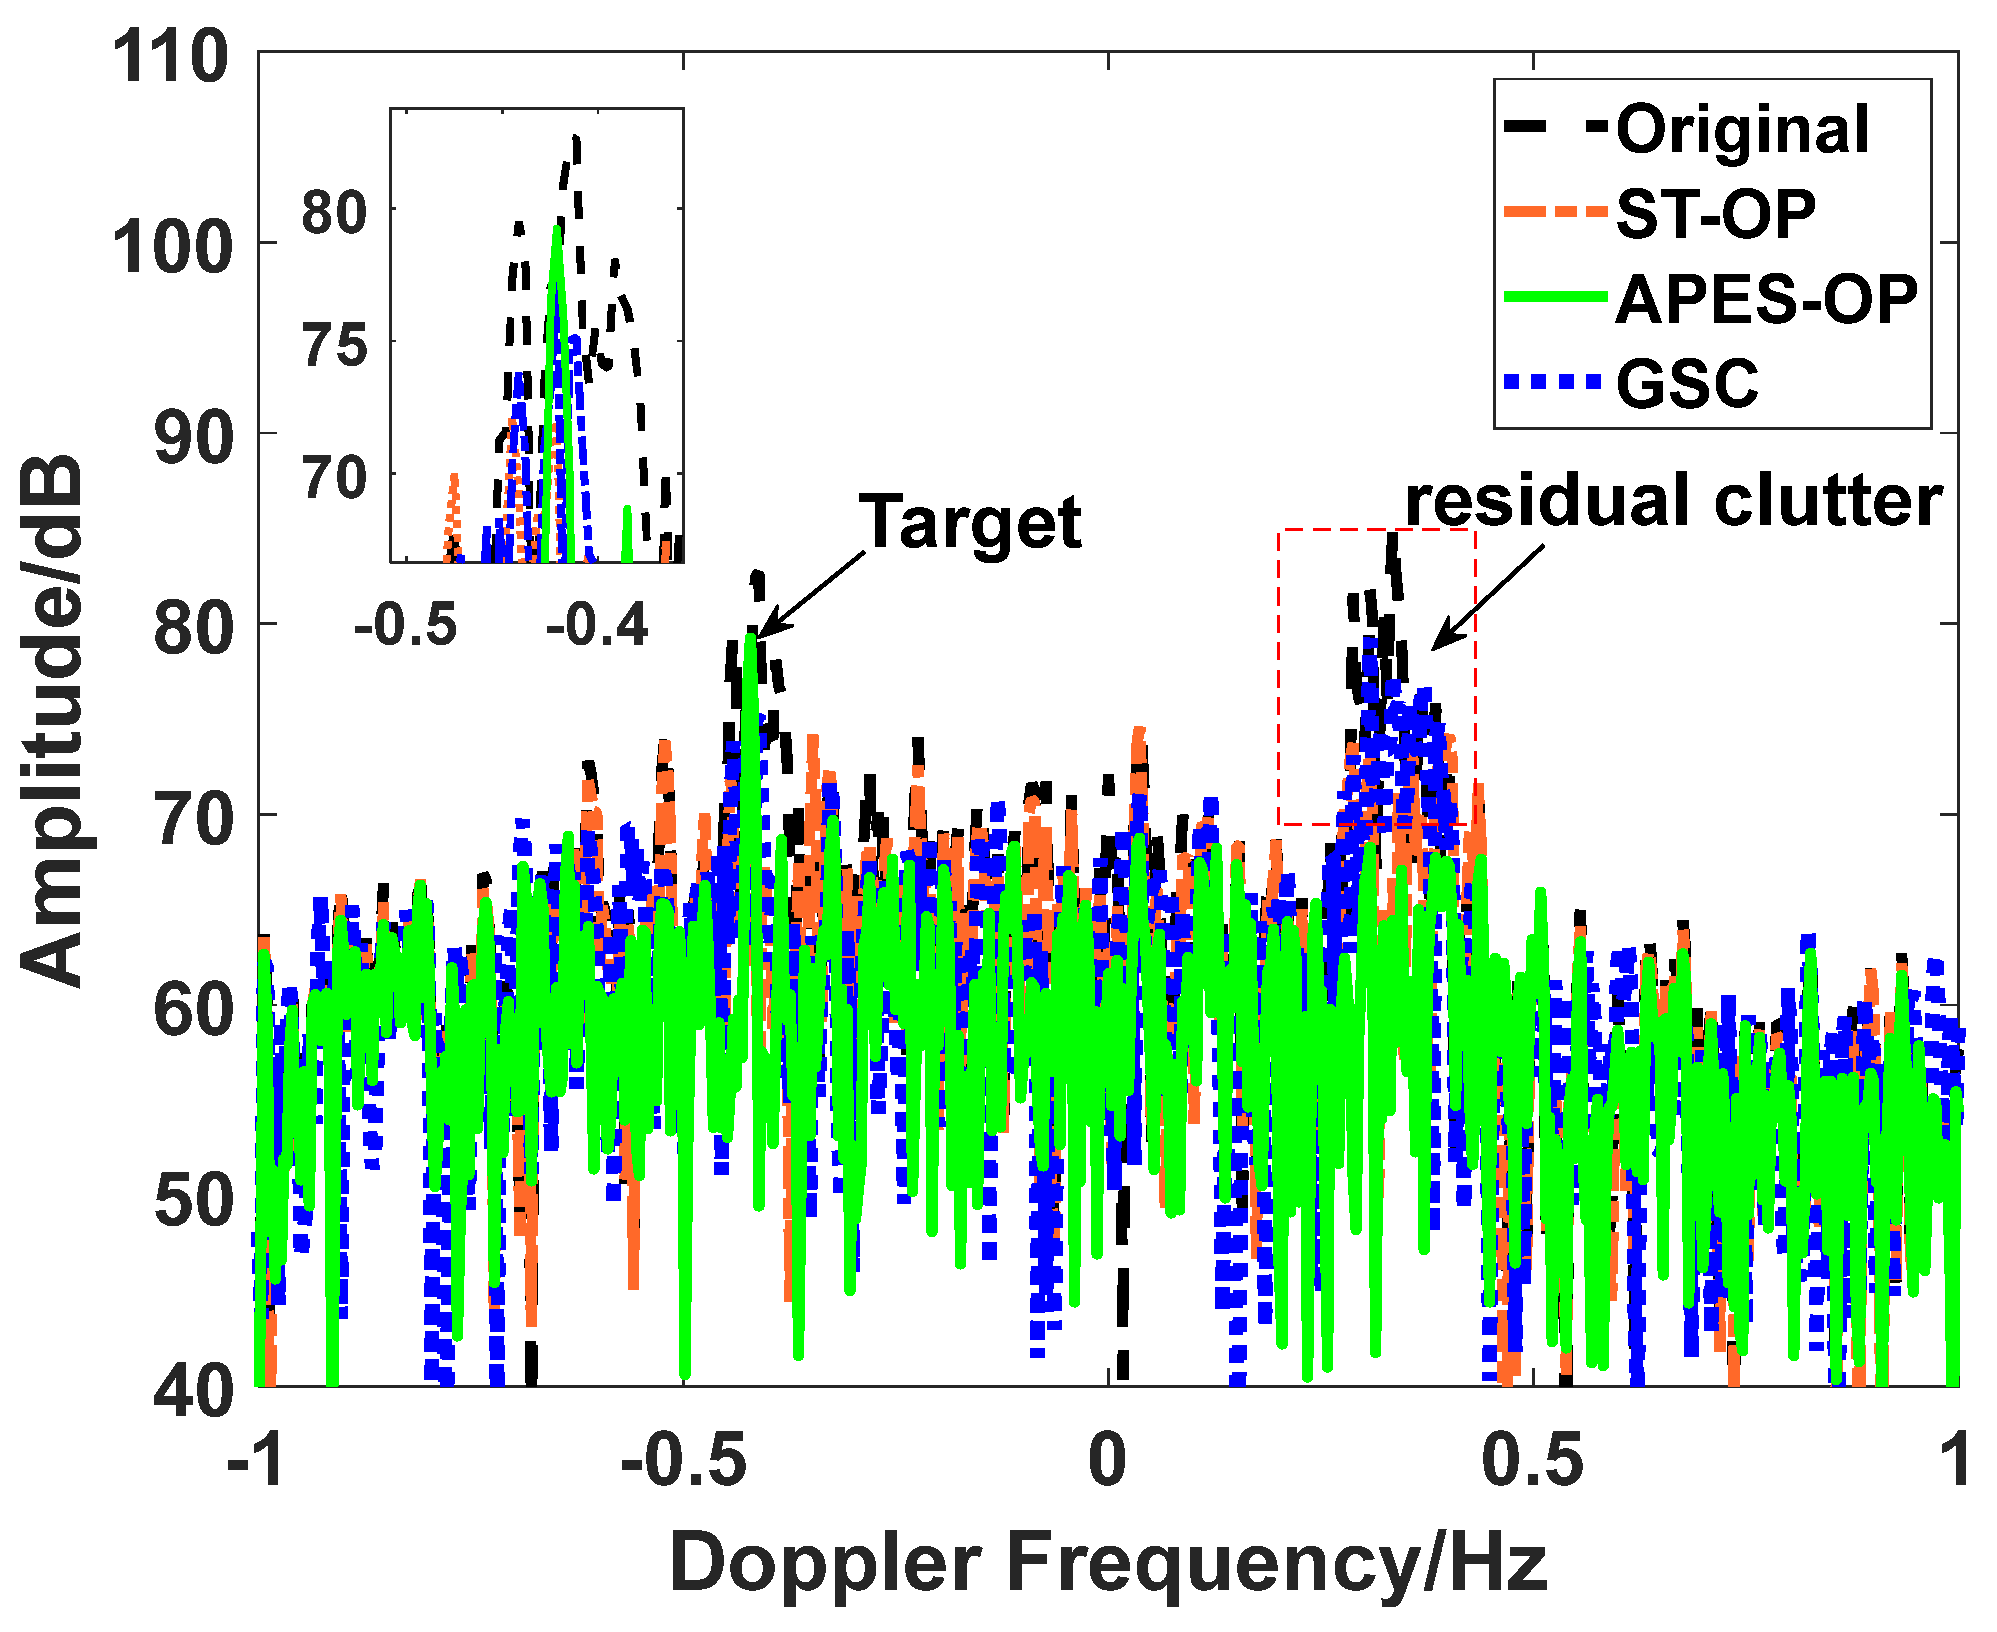
Experimental data were gathered on 1 April 2017, at 17:38 local time, and the range–Doppler PDS is plotted in Figure 15. The irradiated area was on the Taiwan Strait (see Figure 14). The mean wind speed was approximately 17 knots, and the significant wave height was around 1 m (Sea State three). The radar system operated at a frequency of 13.15 MHz. The system’s group range resolution is 10 km, and the angular resolution is about 1.5°. Following the range and Doppler processing, the first-order Bragg peaks, located approximately at ±0.4 Hz, were observed to spread across a wide frequency range within a distance of approximately 0 to 20 range cells. Affected by the attenuation of surface wave propagation, the amplitude of sea clutter decreases with the range cell. The absolute power density (i.e., CNR) of the Bragg peak on the left is smaller than that on the right at the same range cell, and the average CNR of 20 range cells of Bragg peaks is 16.22 dB, which is sufficient for processing. Next, we use a moving ship on the sea surface as an example to demonstrate the effectiveness of the proposed sea clutter suppression algorithm. According to the Automatic Identification System, the ship was about 70 km away from the receiver and moving at a speed of 4.8 m/s. The angle between the ship’s direction of movement and the direction of the receiving array was 52°. The ship was expected to be observed at a specific frequency of −0.42 Hz at the seventh range cell. However, it was buried by sea clutter and was challenging to detect.
The proposed sea clutter suppression algorithm was first applied to the original data from the seventh range cell. Similar to the simulation, the temporal sliding window contained 50 sampling points in slow time, and the original 8 × 600 data matrix X was converted into 400 × 551 spatial–temporal type Y , with 551 being the number of snapshots. Figure 16a displays the STS of the original data. It is impossible to distinguish the target from the sea clutter in the spatial domain as it covers almost all orientation units. Figure 16b shows the sea-clutter-mitigated results with the APES-OP algorithm proposed. The sea clutter was completely suppressed while the target signal was retained.
In traversing spectral points in the clutter region, simply judging whether a spectral point belongs to a target based on spectral peaks in the STS is insufficient. In such cases, we may further transform the sea-clutter-suppressed sampling data into the time–frequency domain. Figure 17 shows the time–frequency spectrum after suppressing the sea clutter (a) for the sea clutter spectral point and (b) for the target point. In the presence of the target, a clear and bright spectral line runs through the time axis in the TFD.
The GSC and a spatial–temporal domain orthogonal projection algorithm, referred to as ST-OP [29], were applied to the raw data for comparison to investigate further the validity of the proposed sea clutter suppression algorithm. The ST-OP utilizes data from adjacent range cells in the multichannel and slow-time domains to construct a covariance matrix. The matrix is then decomposed to obtain the sea clutter subspace. The PDSs of the seventh range cell are displayed in Figure 18. After sea clutter suppression, the SCR of the target improved from −1.80 dB to 6.43 dB with GSC, 3.57 dB with ST-OP, and 14.23 dB with APES-OP. Although both the GSC and ST-OP algorithms highlighted the spectral peak of the target to some extent, residual clutter still existed from −0.33 to −0.45 Hz and from 0.26 to 0.41 Hz in Doppler. This residual clutter could easily be mistaken for targets, leading to false alarms. Moreover, the background clutter made it harder to detect faint targets as it increased the threshold required. On the other hand, the proposed APES-OP algorithm suppressed sea clutter entirely and kept the target peak unchanged, making distinguishing between targets and clutter easier.
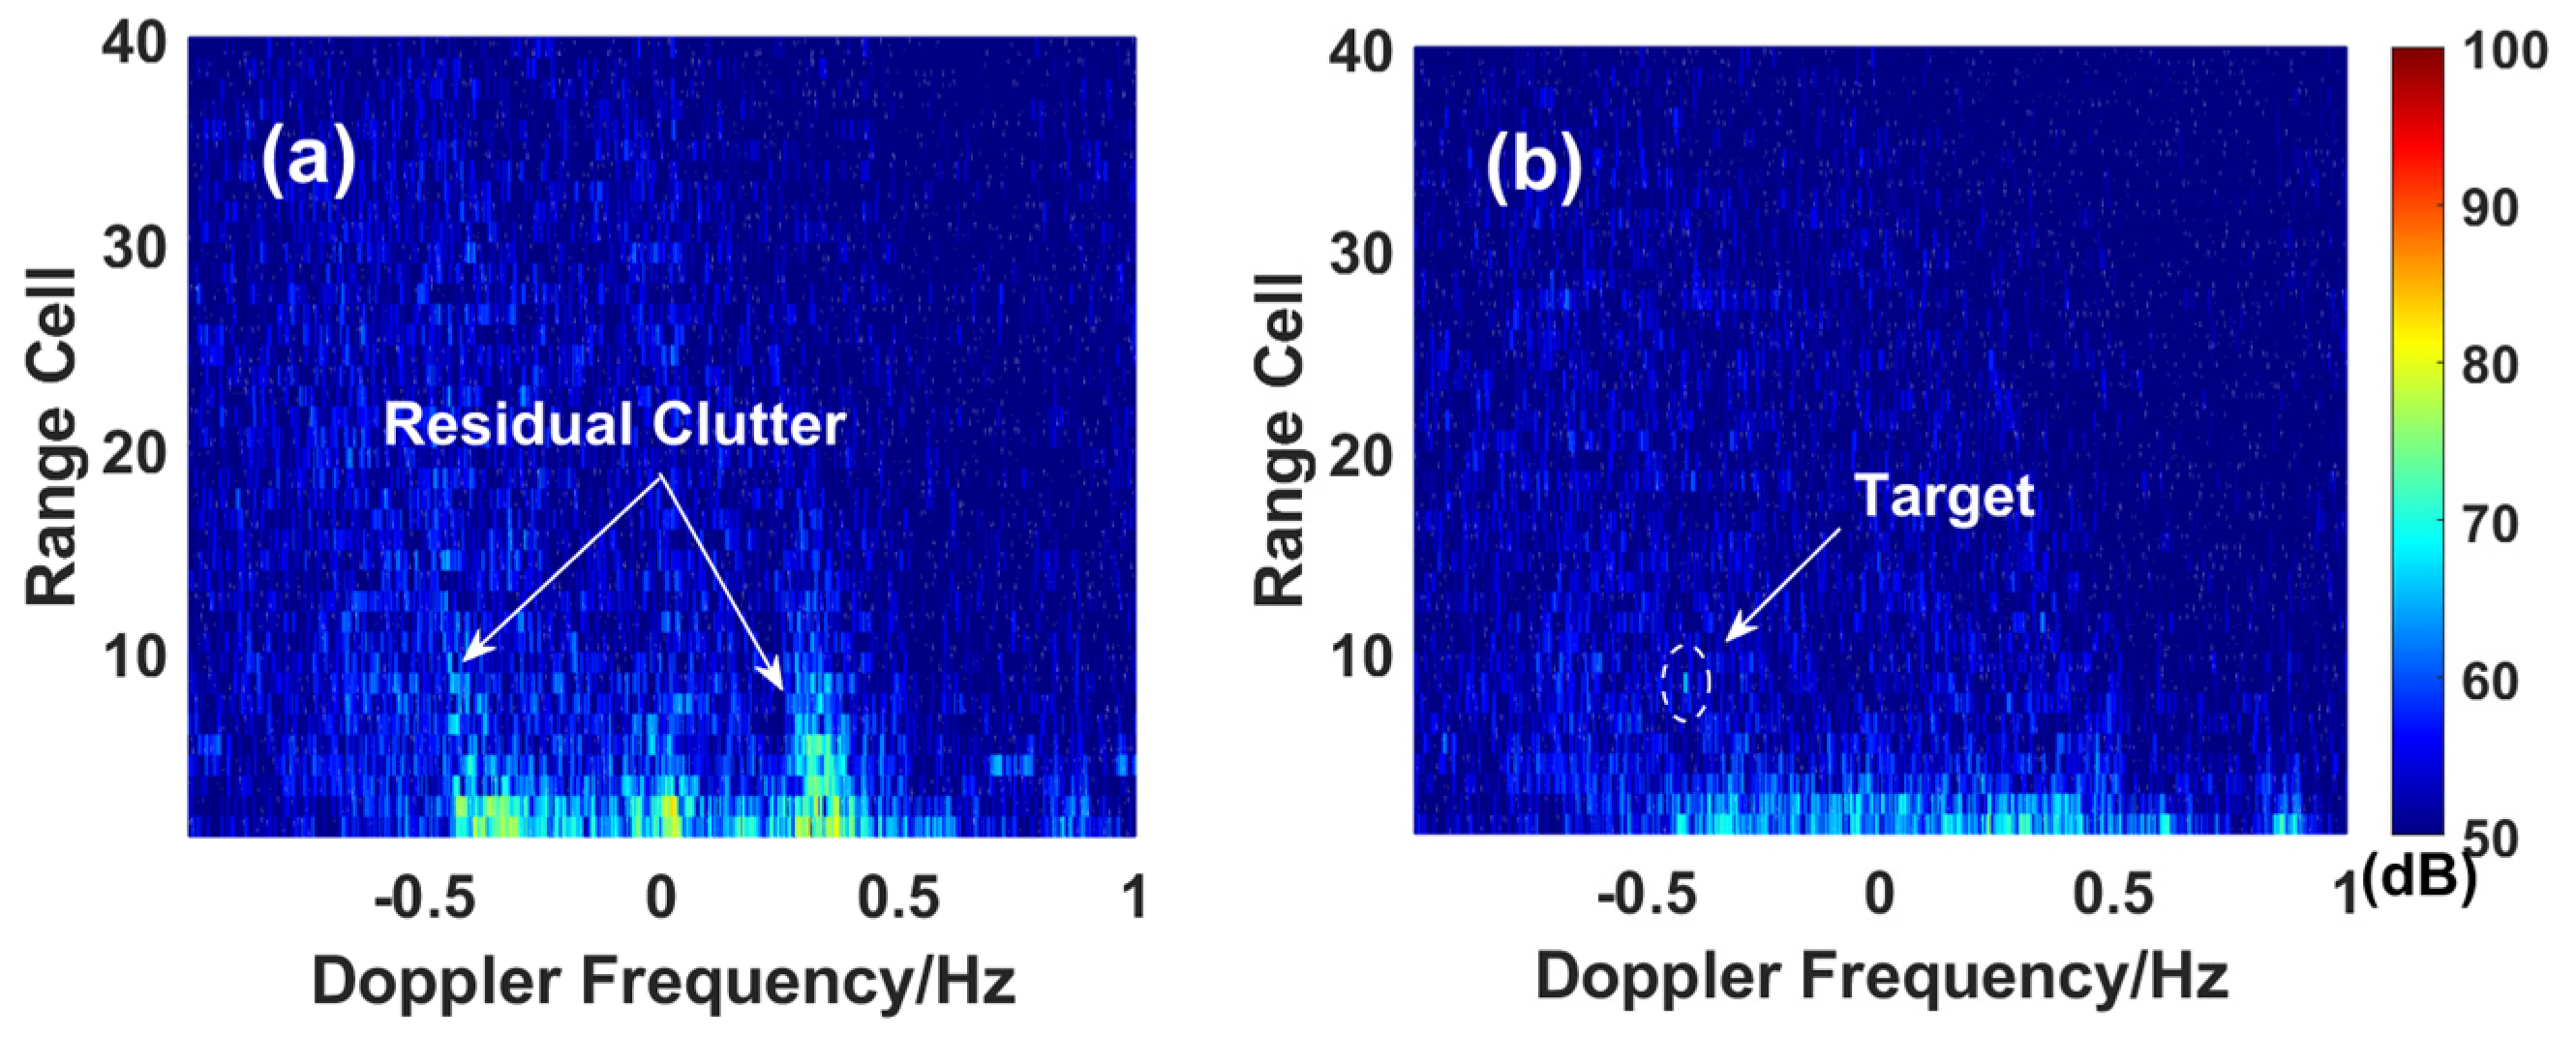
The algorithms were then applied to the original data from range cells 1 to 20. The resulting sea-clutter-suppressed range–Doppler PDSs are presented in Figure 19. It can be seen that after being processed with the ST-OP algorithm, the range–Doppler unit where the target is located is still covered by residual clutter. It is difficult to detect the target alone. In contrast, after processing with the method proposed, the sea clutter was wholly suppressed, and the spectral points of the target were highlighted.
CNR results of the first-order Bragg peaks for 20 range cells are presented in Figure 20. The CNR of sea clutter decreases with the range cell due to the attenuation impacts of the ocean surface. The average decline in CNR for the ST-OP method was about 6.2 dB, while that for APES-OP was about 9.1 dB. The APES-OP method proposed yields better sea clutter suppression effects.
The results are reasonable since the ST-OP method considers that the sea clutter of bordering range cells possesses a strong correlation, and the original data from the adjacent range cell were utilized to estimate the sea clutter subspace. However, for HSSWR, the ionospheric propagation channel can induce an additional modulation phase in both the temporal (Doppler) and spatial domains. As a result, the correlation between sea clutter from adjacent range cells can deteriorate, leading to residual clutter. Nevertheless, the APES-OP algorithm proposed utilized sampling data from the CUT to estimate the sea clutter subspace directly, and an APES-filter was designed to filter out the potential target echoes to avoid attenuating desired signals while suppressing sea clutter.

5.3. Multiple Targets in Sea Clutter

To demonstrate the multi-target applicability of the proposed algorithm, we added two simulated targets simultaneously to the experimental data from the fifth range cell. One of the injected targets was at −0.45 Hz (Target 1) with a preset DOA of 110° from the array direction, and the other was at 0.37 Hz (Target 2) with a preset DOA of 84° from the array direction. Figure 21 presents the profiles of STS after sea clutter suppression. Both the simulated targets were preserved while the sea clutter was thoroughly suppressed; the SCRs improved by no less than 10 dB.

6. Discussion

This article focused on the issue of sea clutter suppression in HSSWR. Unlike traditional SWR, the HSSWR system operates in an ionosphere–ocean hybrid propagation channel, which means that the sea clutter received is modulated by both the ocean surface and the ionosphere. The modulation effects of the ionosphere, denoted as the ionospheric disturbances, may severely deteriorate the coherence of echo signals in both the spatial and temporal domains. Specifically, the additional modulation phase in the temporal domain, denoted as the ionospheric phase path disturbances, may severely corrupt signal coherence and spread the Doppler spectrum. On the other hand, fluctuations in the wavefront can result in lost spatial correlation among sampled data from diverse array elements, reducing angular resolution and widening the spatial spectrum. The influence of the ionospheric disturbances on the proposed sea clutter suppression algorithm is worthy of discussion.
First, the ionospheric disturbances influence the segmentation accuracy of the original Doppler spectrum. When the spectrum is severely shifted or broadened due to the ionospheric phase path modulation, the preset range of the original sea clutter spectral region in (15) will no longer be applicable. In such cases, additional prior knowledge, such as echoes of the direct wave, should be incorporated to determine the actual range of the sea clutter spectral region.
Second, the ionospheric disturbances impact the selection of the appropriate signal model for the target. The traditional single-frequency signal model is no longer applicable when considering the ionospheric phase path disturbances. In order to better characterize the frequency features of the target, the time-domain subspace signal model was adopted in this study. It was achieved by adopting three adjacent time-domain steering vectors at a half-frequency resolution interval. However, in the event of a severe ionospheric disturbance, the current subspace model may not be adequate, and it would be necessary to increase the number of steering vectors to enhance the precision of the target signal characterization.
Last, the ionospheric disturbances also affect the identification of target signals outside and inside the clutter region. The algorithm proposed in this paper discriminates the target signals from other components according to their unique distribution characteristics in the spatial–temporal domain, and the discriminating results directly affect whether the spectral points of the actual targets can be effectively preserved after the sea clutter is suppressed. However, as mentioned earlier, the ionospheric disturbances will not only corrupt the Doppler spectrum but also widen the spatial spectrum of echo signals. In such cases, it is no longer valid to determine whether the current spectral point belongs to a target only by looking for a spectral peak in the spatial spectrum. To solve this problem, we can transform the sea-clutter-suppressed sampling data into the time–frequency domain. This transformation allows us to differentiate the spectral point using the time–frequency distribution differences between the sea clutter and the target. Specifically, in the presence of a target, a clear and bright spectral line may run through the time axis in the time–frequency spectrum.
In addition to the ionospheric disturbances, the column number of the constructed spatial–temporal matrix Y may significantly impact the inhibition results and needs to be carefully selected. Specifically, a too-small or an oversized L may make it difficult to distinguish between sea clutter and other signal components with SVD, causing attenuation of desired signals or leaving residual clutter after suppressing the sea clutter. In addition, the algorithm’s significant operation time is also a noteworthy problem. Since the time cost for the clutter sample matrix decomposition with SVD is relatively high, the method’s capability for batch processing can be severely limited.
It is worth noting that the proposed algorithm can also be used for monostatic radar systems, but it requires specific adjustments. When dividing the sea clutter spectrum region, both positive and negative Bragg frequencies must be calculated using the formula under monostatic conditions. Additionally, the traditional single-frequency signal model can be applied to describe target echoes without considering the impact of ionospheric phase path modulation.

7. Conclusions

Some conclusions are as follows:
The first-order sea clutter of the HSSWR is affected by the combined modulation of the ocean surface and the ionosphere (the Doppler spectrum of which can be significantly broadened), thereby submerging the adjacent frequency points of targets. For a fully developed ocean surface, the spatial–temporal distribution of echo signals from sea clutter and targets for HSSWR hold distinct features, which can be utilized to identify target signals outside and inside the clutter region.
A theoretical model of sea echo in the ionosphere–ocean hybrid propagation mode was presented, and a novel orthogonal projection method at the spatial–temporal domain based on the hybrid APES-OP was proposed for sea clutter suppression of HSSWR. Sampling data collected from multi-channels and slow-time domains at the CUT were applied to construct a spatial–temporal matrix, which was then decomposed using SVD to obtain the sea clutter subspace. During the process, a time-domain subspace model was adopted to describe target signals affected by ionospheric phase path modulation, and an APES filter was constructed to remove potential targets using a traversal approach, which prevented attenuation of desired signals while suppressing sea clutter. By projecting the original signal into the orthogonal subspace, the sea clutter was suppressed, and echoes of targets were retained.
Through simulations, we investigated the efficiency of the proposed sea clutter suppression algorithm. We added simulated target signals inside and outside the clutter region, finding that the algorithm could suppress the clutter while retaining the target, even in cases where the clutter buried the target. The proposed APES-OP in the spatial–temporal domain performed better than the GSC in the spatial domain, with lower sea clutter residue and higher target SCR increments. We also processed measured data collected by an experimental HSSWR, completely suppressing the sea clutter while retaining the target signal. By calculating and presenting comparison results for the targe’s SCR and the sea clutter’s CNR, we were able to verify further the validity of the proposed sea clutter suppression algorithm.
While the algorithm has shown some promising outcomes, there is still room for improvement to enhance its effectiveness. Since raw data from different range cells need to be processed separately, and each spectral point in the clutter region needs to be traversed to update the clutter samples, the computational time consumed is relatively high. As a result, the capability for batch processing of the algorithm proposed is severely limited. Moreover, the temporal sliding window width selection principle needs to be clarified. The correlation between the time-domain subspace signal model adopted, and the ionospheric disturbances still need to be investigated. Future work will concentrate on studying the effects of different ionospheric perturbations on sea clutter suppression and optimizing existing algorithms to reduce redundant steps and improve operational efficiency.

Author Contributions

Conceptualization, Q.Z. and Y.B.; methodology, Q.Z.; software, Y.B.; validation, Y.B.; formal analysis, Q.Z.; investigation, Y.B.; resources, X.W.; data curation, Q.Z.; writing—original draft preparation, Q.Z.; visualization, Y.B.; supervision, X.Z. and H.H.; project administration, X.Z.; funding acquisition, C.D. and H.Z. All authors have read and agreed to the published version of the manuscript.

Funding

This research was funded in part by the National Natural Science Foundation of China, grant numbers 62301255 and 62201259; in part by the Natural Science Foundation of Jiangsu Province, grant numbers BK20220942 and BK20220940.

Data Availability Statement

No new data were created or analyzed in this study. Data sharing is not applicable to this article.

Conflicts of Interest

The authors declare no conflicts of interest.

References

  1. Melyanovcky, P.A.; Turgenev, I.S. Bistatic HF radar for oceanography applications with the use of both ground and space waves. Telecommun. Radio Eng. 1997, 51, 2–3. [Google Scholar]
  2. Riddolls, R.J. Limits on the detection of low-Doppler targets by a high frequency hybrid sky-surface wave radar system. In Proceedings of the 2008 IEEE Radar Conference, Rome, Italy, 26–30 December 2008; pp. 1–4. [Google Scholar]
  3. Riddolls, R.J. Ship Detection Performance of a High Frequency Hybrid Sky-Surface Wave Radar; Defence R&D: Ottawa, Canada, 2007. [Google Scholar]
  4. Yang, L.; Fan, J.; Guo, L. Simulation analysis and experimental study on the echo characteristics of high-frequency hybrid sky–surface wave propagation mode. IEEE Trans. Antennas Propag. 2018, 66, 4821–4831. [Google Scholar] [CrossRef]
  5. Zhao, Z.; Wan, X.; Zhang, D. An experimental study of HF passive bistatic radar via hybrid sky-surface wave mode. IEEE Trans. Antennas Propag. 2012, 61, 415–424. [Google Scholar] [CrossRef]
  6. Li, M.; Zhang, L.; Wu, X. Ocean surface current extraction scheme with high-frequency distributed hybrid sky-surface wave radar system. IEEE Trans. Geosci. Remote Sens. 2018, 56, 4678–4690. [Google Scholar] [CrossRef]
  7. Li, Y.; Wang, Z.; Xu, L. Spread sea clutter suppression via prior knowledge-based space time adaptive processing in high frequency hybrid sky-surface wave radar. IET Radar Sonar Nav. 2023, 17, 830–844. [Google Scholar] [CrossRef]
  8. Zhang, J.; Zhang, X.; Deng, W. Information geometric means-based STAP for nonhomogeneous clutter suppression in high frequency hybrid sky-surface wave radar. IEEE Sens. J. 2020, 21, 1787–1798. [Google Scholar] [CrossRef]
  9. Yuan, Z.; Tong, P.; Wei, Y. An augmented filtering method for shipborne HF hybrid sky-surface wave radar. In Proceedings of the International Conference on Radar Systems (RADAR 2022), Edinburgh, UK, 24–27 October 2022; pp. 488–493. [Google Scholar]
  10. Ji, Y.; Zhang, J.; Chu, X. Ocean surface current measurement with high-frequency hybrid sky–surface wave radar. Remote Sens. Lett. 2017, 8, 617–626. [Google Scholar] [CrossRef]
  11. Barrick, D. First-order theory and analysis of MF/HF/VHF scatter from the sea. IEEE Trans. Antennas Propag. 1972, 20, 2–10. [Google Scholar] [CrossRef]
  12. Khan, R.H. Ocean-clutter model for high-frequency radar. IEEE J. Ocean. Eng. 1991, 16, 181–188. [Google Scholar]
  13. Zhou, Q.; Yue, X.; Zhang, L.; Wu, X.; Wang, L. Correction of ionospheric distortion on HF hybrid sky-surface wave radar calibrated by direct wave. Radio Sci. 2019, 54, 380–396. [Google Scholar] [CrossRef]
  14. Li, Y.; Wei, Y.; Zhu, Y.; Guo, R.; Wang, Z.; Xu, R. Analysis and simulation for broadening first-order sea clutter spectrum in high frequency hybrid sky-surface wave propagation mode. IET Radar Sonar Nav. 2015, 9, 609–621. [Google Scholar]
  15. Hu, J.; Jian, C.; Li, H.; Xie, J. Knowledge-aided ocean clutter suppression method for sky-wave over-the-horizon radar. IEEE Geosci. Remote Sens. Lett. 2018, 15, 355–358. [Google Scholar] [CrossRef]
  16. Sekine, M. Log-Weibull distributed sea clutter. IEE Proc. F-Commun. Radar Signal Process. 1980, 3, 225–228. [Google Scholar] [CrossRef]
  17. Middleton, D. New physical-statistical methods and models for clutter and reverberation: The KA-distribution and related probability structures. IEEE J. Ocean. Eng. 1999, 24, 261–284. [Google Scholar] [CrossRef]
  18. Thayaparan, T.; Kennedy, S. Detection of a manoeuvring air target in sea-clutter using joint time–frequency analysis techniques. IEE Proc. Radar Sonar Navig. 2004, 151, 19–30. [Google Scholar] [CrossRef]
  19. Jangal, F.; Mandereau, F. HFSWR clutter mitigation: From wavelets to empirical mode decomposition. IEICE Proc. Ser. 2008, 35, 1–3. [Google Scholar]
  20. Jangal, F.; Saillant, S.; Hélier, M. Wavelet contribution to remote sensing of the sea and target detection for a high-frequency surface wave radar. IEEE Geosci. Remote Sens. Lett. 2008, 5, 552–556. [Google Scholar] [CrossRef]
  21. Yasotharan, A.; Thayaparan, T. Time-frequency method for detecting an accelerating target in sea clutter. IEEE Trans. Aerosp. Electron. Syst. 2006, 42, 1289–1310. [Google Scholar] [CrossRef]
  22. Poon, M.W.Y.; Khan, R.H.; Le-Ngoc, S. A singular value decomposition (SVD) based method for suppressing ocean clutter in high frequency radar. IEEE Trans. Signal Process. 1993, 41, 1421–1425. [Google Scholar] [CrossRef] [PubMed]
  23. Chen, Z.; He, C.; Xie, F. Using SVD-FRFT filtering to suppress first-order sea clutter in HFSWR. IEEE Geosci. Remote Sens. Lett. 2017, 14, 1076–1080. [Google Scholar] [CrossRef]
  24. Lu, K.; Liu, X.; Liu, Y. Ionospheric decontamination and sea clutter suppression for HF skywave radars. IEEE J. Ocean. Eng. 2005, 30, 455–462. [Google Scholar] [CrossRef]
  25. Zhang, J.; Zhang, X.; Deng, W.; Guo, L.; Yang, Q. Low complexity single dataset STAP for nonstationary clutter suppression in HF mixed-mode surface wave radar. Remote Sens. Lett. 2021, 12, 1–10. [Google Scholar] [CrossRef]
  26. Tong, P.; Wei, Y.; Xu, R. APES based STAP for target detection in spread-Doppler clutter. In Proceedings of the 2016 IEEE 13th International Conference on Signal Processing (ICSP), Chengdu, China, 6–10 November 2016; pp. 1620–1623. [Google Scholar]
  27. Li, Y.; Wei, Y.; Xu, R.; Chu, T.; Wang, Z. Space-time characteristics and experimental analysis of broadening first-order sea clutter in HF hybrid sky-surface wave radar. Radioengineering 2014, 23, 831–841. [Google Scholar]
  28. Zhang, X.; Yang, Q.; Deng, W. Main-lobe cancellation of the space spread clutter for target detection in HFSWR. IEEE J. Sel. Top. Signal Process. 2015, 9, 1632–1638. [Google Scholar] [CrossRef]
  29. Li, J.; Chen, Z.; Zhao, C.; Ding, F. First-Order Sea Clutter Suppression for High-Frequency Surface Wave Radar Using Orthogonal Projection in Spatial–Temporal Domain. IEEE Geosci. Remote Sens. Lett. 2021, 19, 1–5. [Google Scholar] [CrossRef]
  30. Zhu, Y.; Wei, Y.; Yu, L. Ionospheric decontamination for HF hybrid sky-surface wave radar on a shipborne platform. IEEE Geosci. Remote Sens. Lett. 2017, 14, 2162–2166. [Google Scholar] [CrossRef]
  31. Warrington, E.M.; Thomas, E.C.; Jones, T.B. Measurements on the wavefronts of ionospherically propagated HF radio waves made with a large aperture antenna array. IEE Proc. H Microw. Antennas Propag. IET Digit. Libr. 1990, 137, 25–30. [Google Scholar] [CrossRef]
  32. Fabrizio, G.A. Space-Time Characterisation and Adaptive Processing of Ionospherically-Propagated HF Signals. Ph.D. Thesis, Department of Electrical and Electronic Engineering, Adelaide, Australia, 2000. [Google Scholar]
  33. Stoica, P.; Li, H.; Li, J. A new derivation of the APES filter. IEEE Signal Process. Lett. 1999, 6, 205–206. [Google Scholar] [CrossRef]
  34. Aboutanios, E.; Mulgrew, B. A STAP algorithm for radar target detection in heterogeneous environments. In Proceedings of the IEEE/SP 13th Workshop on Statistical Signal Processing, Bordeaux, France, 17–20 July 2005; pp. 966–971. [Google Scholar]
  35. Degurse, J.F.; Savy, L.; Marcos, S. Reduced-rank STAP for target detection in heterogeneous environments. IEEE Trans. Aerosp. Electron. Syst. 2014, 50, 1153–1162. [Google Scholar] [CrossRef]
  36. Walsh, J.; Gill, E.W.; Huang, W. On the development of a high-frequency radar cross section model for mixed path ionosphere–ocean propagation. IEEE Trans. Antennas Propag. 2015, 63, 2655–2664. [Google Scholar] [CrossRef]
  37. Zhou, Q.; Zhang, L.; Li, M.; Wu, X.; Yue, X.; Yang, G. Floating-Platform High-Frequency Hybrid Sky-Surface Wave Radar: Simulations and Experiments. IEEE Trans. Antennas Propag. 2021, 70, 3112–3117. [Google Scholar] [CrossRef]
  38. Zhou, Q.; Tong, L.; Hong, H.; Wu, X.; Ding, C.; Zhu, X. Compensation of Ionospheric Phase Distortion in HF Hybrid Sky-Surface Wave Radar Using Piecewise Polynomial Phase Modeling Method. IEEE Trans. Geosci. Remote Sens. 2023, 62, 5100614. [Google Scholar] [CrossRef]
  39. Zhu, Y.; Wei, Y.; Tong, P. First order sea clutter cross section for bistatic shipborne HFSWR. J. Syst. Eng. Electron. 2017, 28, 681–689. [Google Scholar]
  40. Li, M.; Wu, X.; Yue, X.; Li, C.; Liu, J. A new algorithm for surface currents inversion with high-frequency over-the-horizon radar. IEEE Geosci. Remote Sens. Lett. 2017, 14, 1303–1307. [Google Scholar] [CrossRef]
  41. Gorry, P.A. General least-squares smoothing and differentiation by the convolution (Savitzky-Golay) method. Anal. Chem. 1990, 62, 570–573. [Google Scholar] [CrossRef]
  42. Li, Y.; Yue, X.; Wu, X.; Zhang, L.; Zhou, Q.; Yi, X.; Liu, N. A higher-order singular value decomposition-based radio frequency interference mitigation method on high-frequency surface wave radar. IEEE Trans. Geosci. Remote Sens. 2019, 58, 2770–2781. [Google Scholar] [CrossRef]
  43. Guo, X.; Sun, H.; Yeo, T.S. Transient interference excision in over-the-horizon radar using adaptive time-frequency analysis. IEEE Trans. Geosci. Remote Sens. 2005, 43, 722–735. [Google Scholar]
  44. Zhou, Q.; Zheng, H.; Wu, X.; Yue, X.; Cheng, Z.; Wang, Q. Fractional Fourier transform-based radio frequency interference suppression for high-frequency surface wave radar. Remote Sens. 2019, 12, 75. [Google Scholar] [CrossRef]
  45. Howland, P.E.; Cooper, D.C. Use of the Wigner-Ville distribution to compensate for ionospheric layer movement in high-frequency sky-wave radar systems. IEE Proc. F Radar Signal Process. 1993, 140, 29–36. [Google Scholar] [CrossRef]
  46. Buckley, K.; Griffiths, L. An adaptive generalized sidelobe canceller with derivative constraints. IEEE Trans. Antennas Propag. 1986, 34, 311–319. [Google Scholar] [CrossRef]
  47. Zhang, L.; Wu, X.; Liu, J. A study on skywave-surface wave hybrid networking technique for HF oceanography radar. In Proceedings of the OCEANS 2014-TAIPEI, Taipei, Taiwan, 7–10 April 2014; pp. 1–4. [Google Scholar]
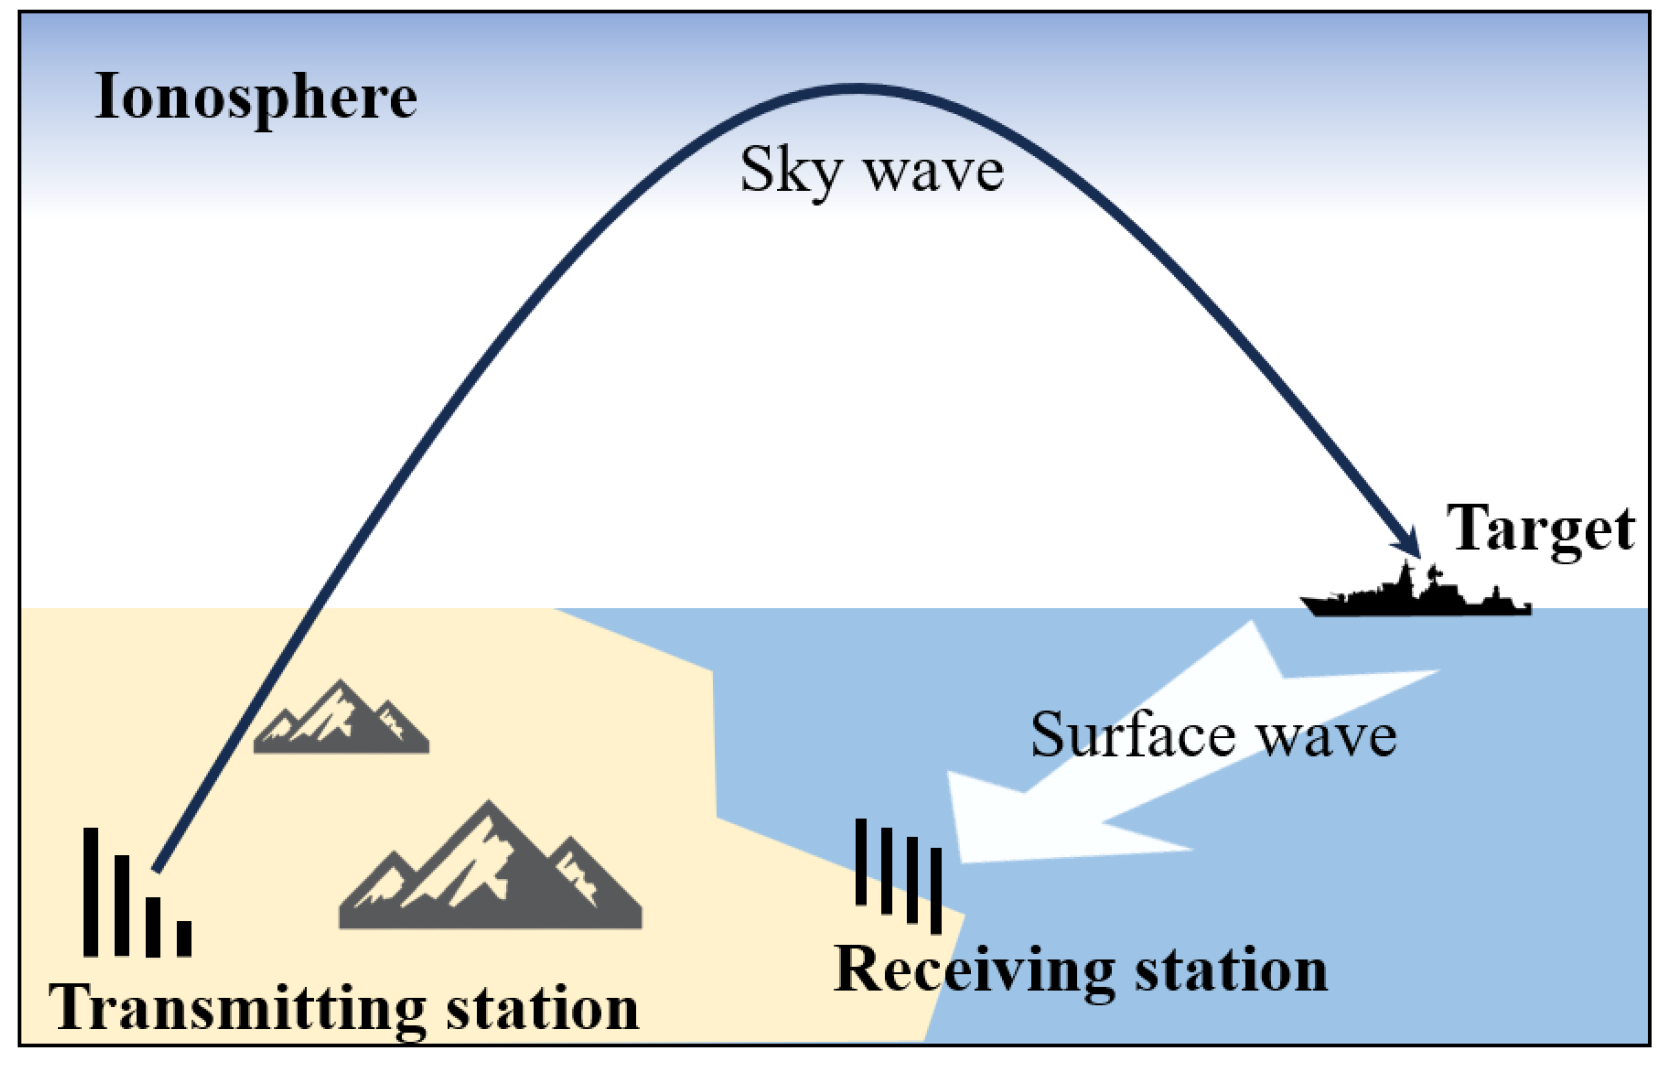
Figure 1. Diagram of the HSSWR system.
Remotesensing 16 02470 g001
Figure 2. Simplified diagram of the geometric relations of the HSSWR system. The x y plane indicates the mean sea level. T denotes the skywave transmitting station, R is the receiver deployed near shore, I is the ionospheric reflection point, and S is the scattering patch on the sea. T I and I S are the propagation paths of skywaves in the air, S R is the propagation path of surface waves on the sea level, γ is the grazing angle, and β is the bistatic angle.
Remotesensing 16 02470 g002
Figure 3. Flowchart of the sea clutter suppression algorithm for HSSWR.
Remotesensing 16 02470 g003
Figure 5. Diagram of spatial–temporal matrix construction.
Remotesensing 16 02470 g005
Figure 6. Simulated STSs (a) before and (b) after sea clutter suppression with target outside the clutter region.
Remotesensing 16 02470 g006
Figure 7. Simulated PDSs with target outside the clutter region.
Remotesensing 16 02470 g007
Figure 8. Simulated STSs (a) before and (b) after sea clutter suppression with target inside the clutter region.
Remotesensing 16 02470 g008
Figure 9. Simulated PDSs with target inside the clutter region.
Remotesensing 16 02470 g009
Figure 10. Angular response of the injected target with digital beam forming (DBF).
Remotesensing 16 02470 g010
Figure 11. Simulated STSs (a) before and (b) after sea clutter suppression with target inside the clutter region with severe ionospheric disturbance.
Remotesensing 16 02470 g011
Figure 12. Simulated PDSs with target inside the clutter region with severe ionospheric disturbance.
Remotesensing 16 02470 g012
Figure 13. SCR increment distribution histogram of the simulated targets (a) outside and (b) inside the clutter region after sea clutter suppression.
Remotesensing 16 02470 g013
Figure 14. Diagram of the experimental HSSWR system.
Remotesensing 16 02470 g014
Figure 15. PDS of range versus Doppler frequency of the raw data collected at 17:38 LT on 1 April 2017.
Remotesensing 16 02470 g015
Figure 16. STSs (a) before and (b) after sea clutter suppression of raw data from the seventh range cell.
Remotesensing 16 02470 g016
Figure 17. Time–frequency spectrum of the experimental data after suppressing the sea clutter (a) for the sea clutter spectral point and (b) for the target point.
Remotesensing 16 02470 g017
Figure 18. PDS of the raw data from the seventh range cell.
Remotesensing 16 02470 g018
Figure 19. Range–Doppler PDSs after suppressing the sea clutter with (a) ST-OP and (b) APES-OP.
Remotesensing 16 02470 g019
Figure 20. CNR results of Bragg peaks for 20 range cells.
Remotesensing 16 02470 g020
Figure 21. Slices of the STS at (a) 110° and (b) 84° after processing with the APES-OP method.
Remotesensing 16 02470 g021
Table 1. Parameter setting for simulations.
The normal direction135°
Distance   between   T   and   R of array825 km
Ionosphere height120 km
Wind direction225°
Wind speed20 knots
Disclaimer/Publisher’s Note: The statements, opinions and data contained in all publications are solely those of the individual author(s) and contributor(s) and not of MDPI and/or the editor(s). MDPI and/or the editor(s) disclaim responsibility for any injury to people or property resulting from any ideas, methods, instructions or products referred to in the content.