
Interactions and Conflicts between Urbanization and Greenness: A Case Study from Nanjing, China
 , and
, and
Abstract
:1. Introduction
2. Materials
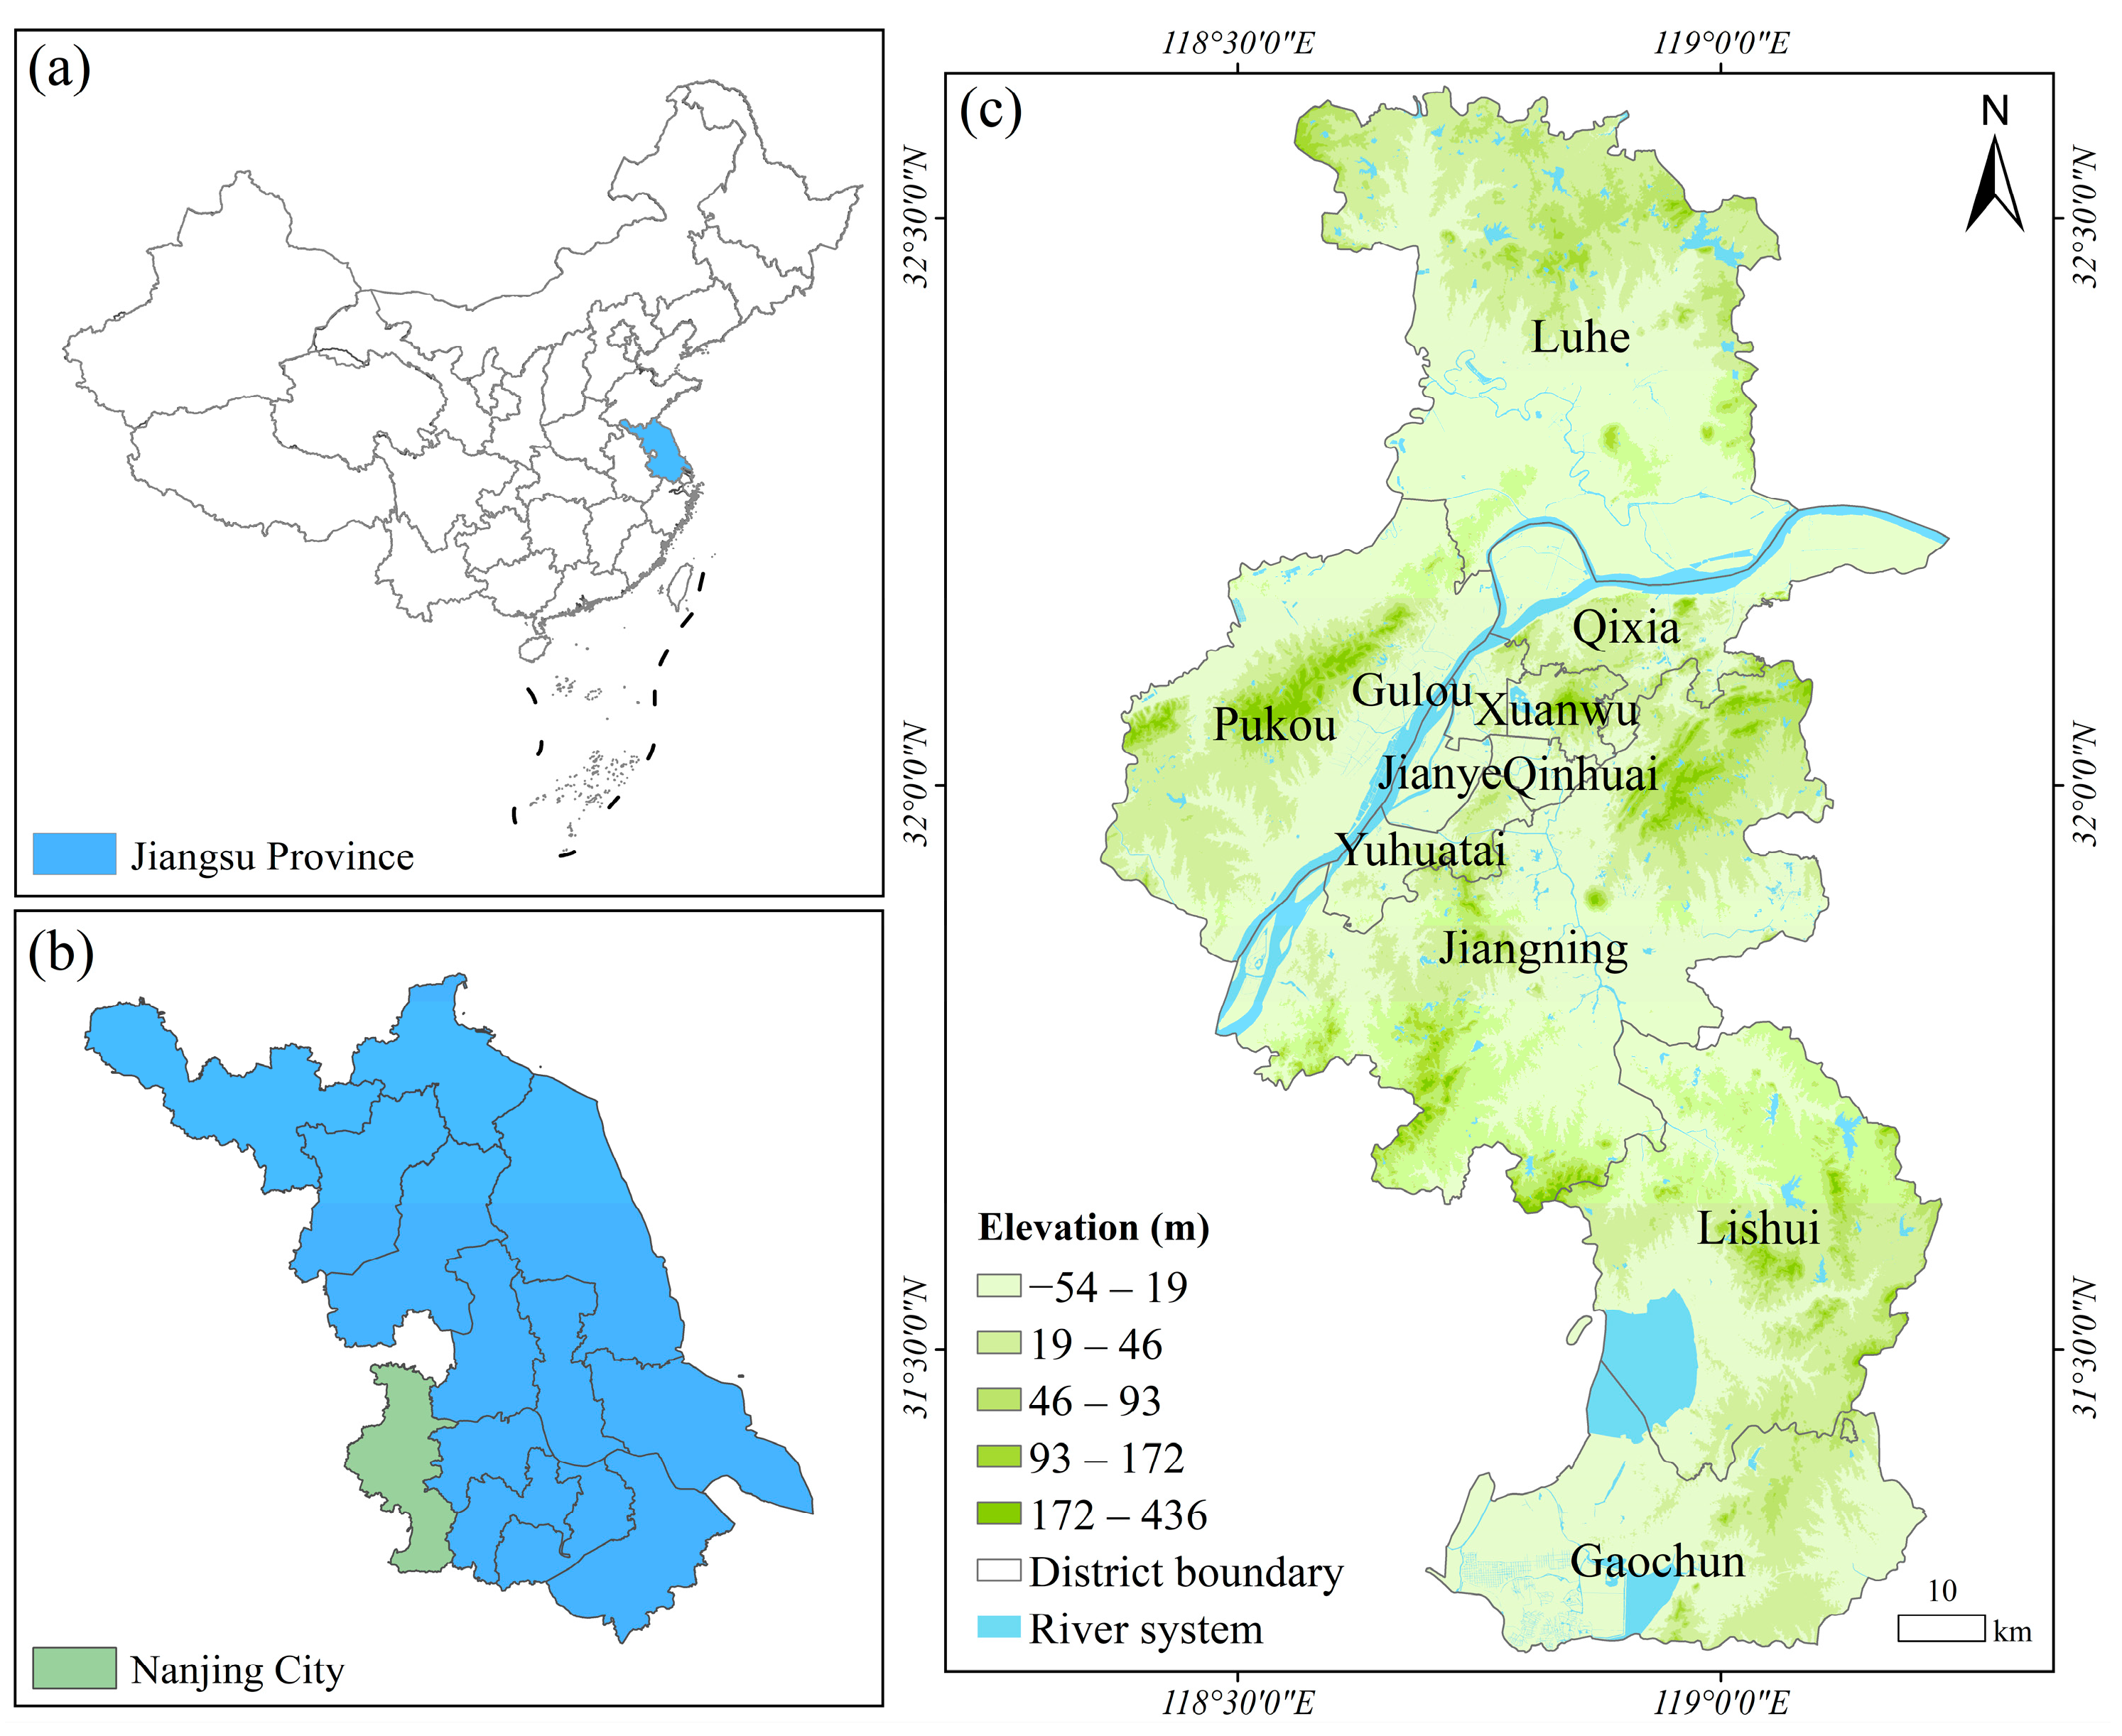
2.1. Study Area
2.2. Data Sources
3. Methods
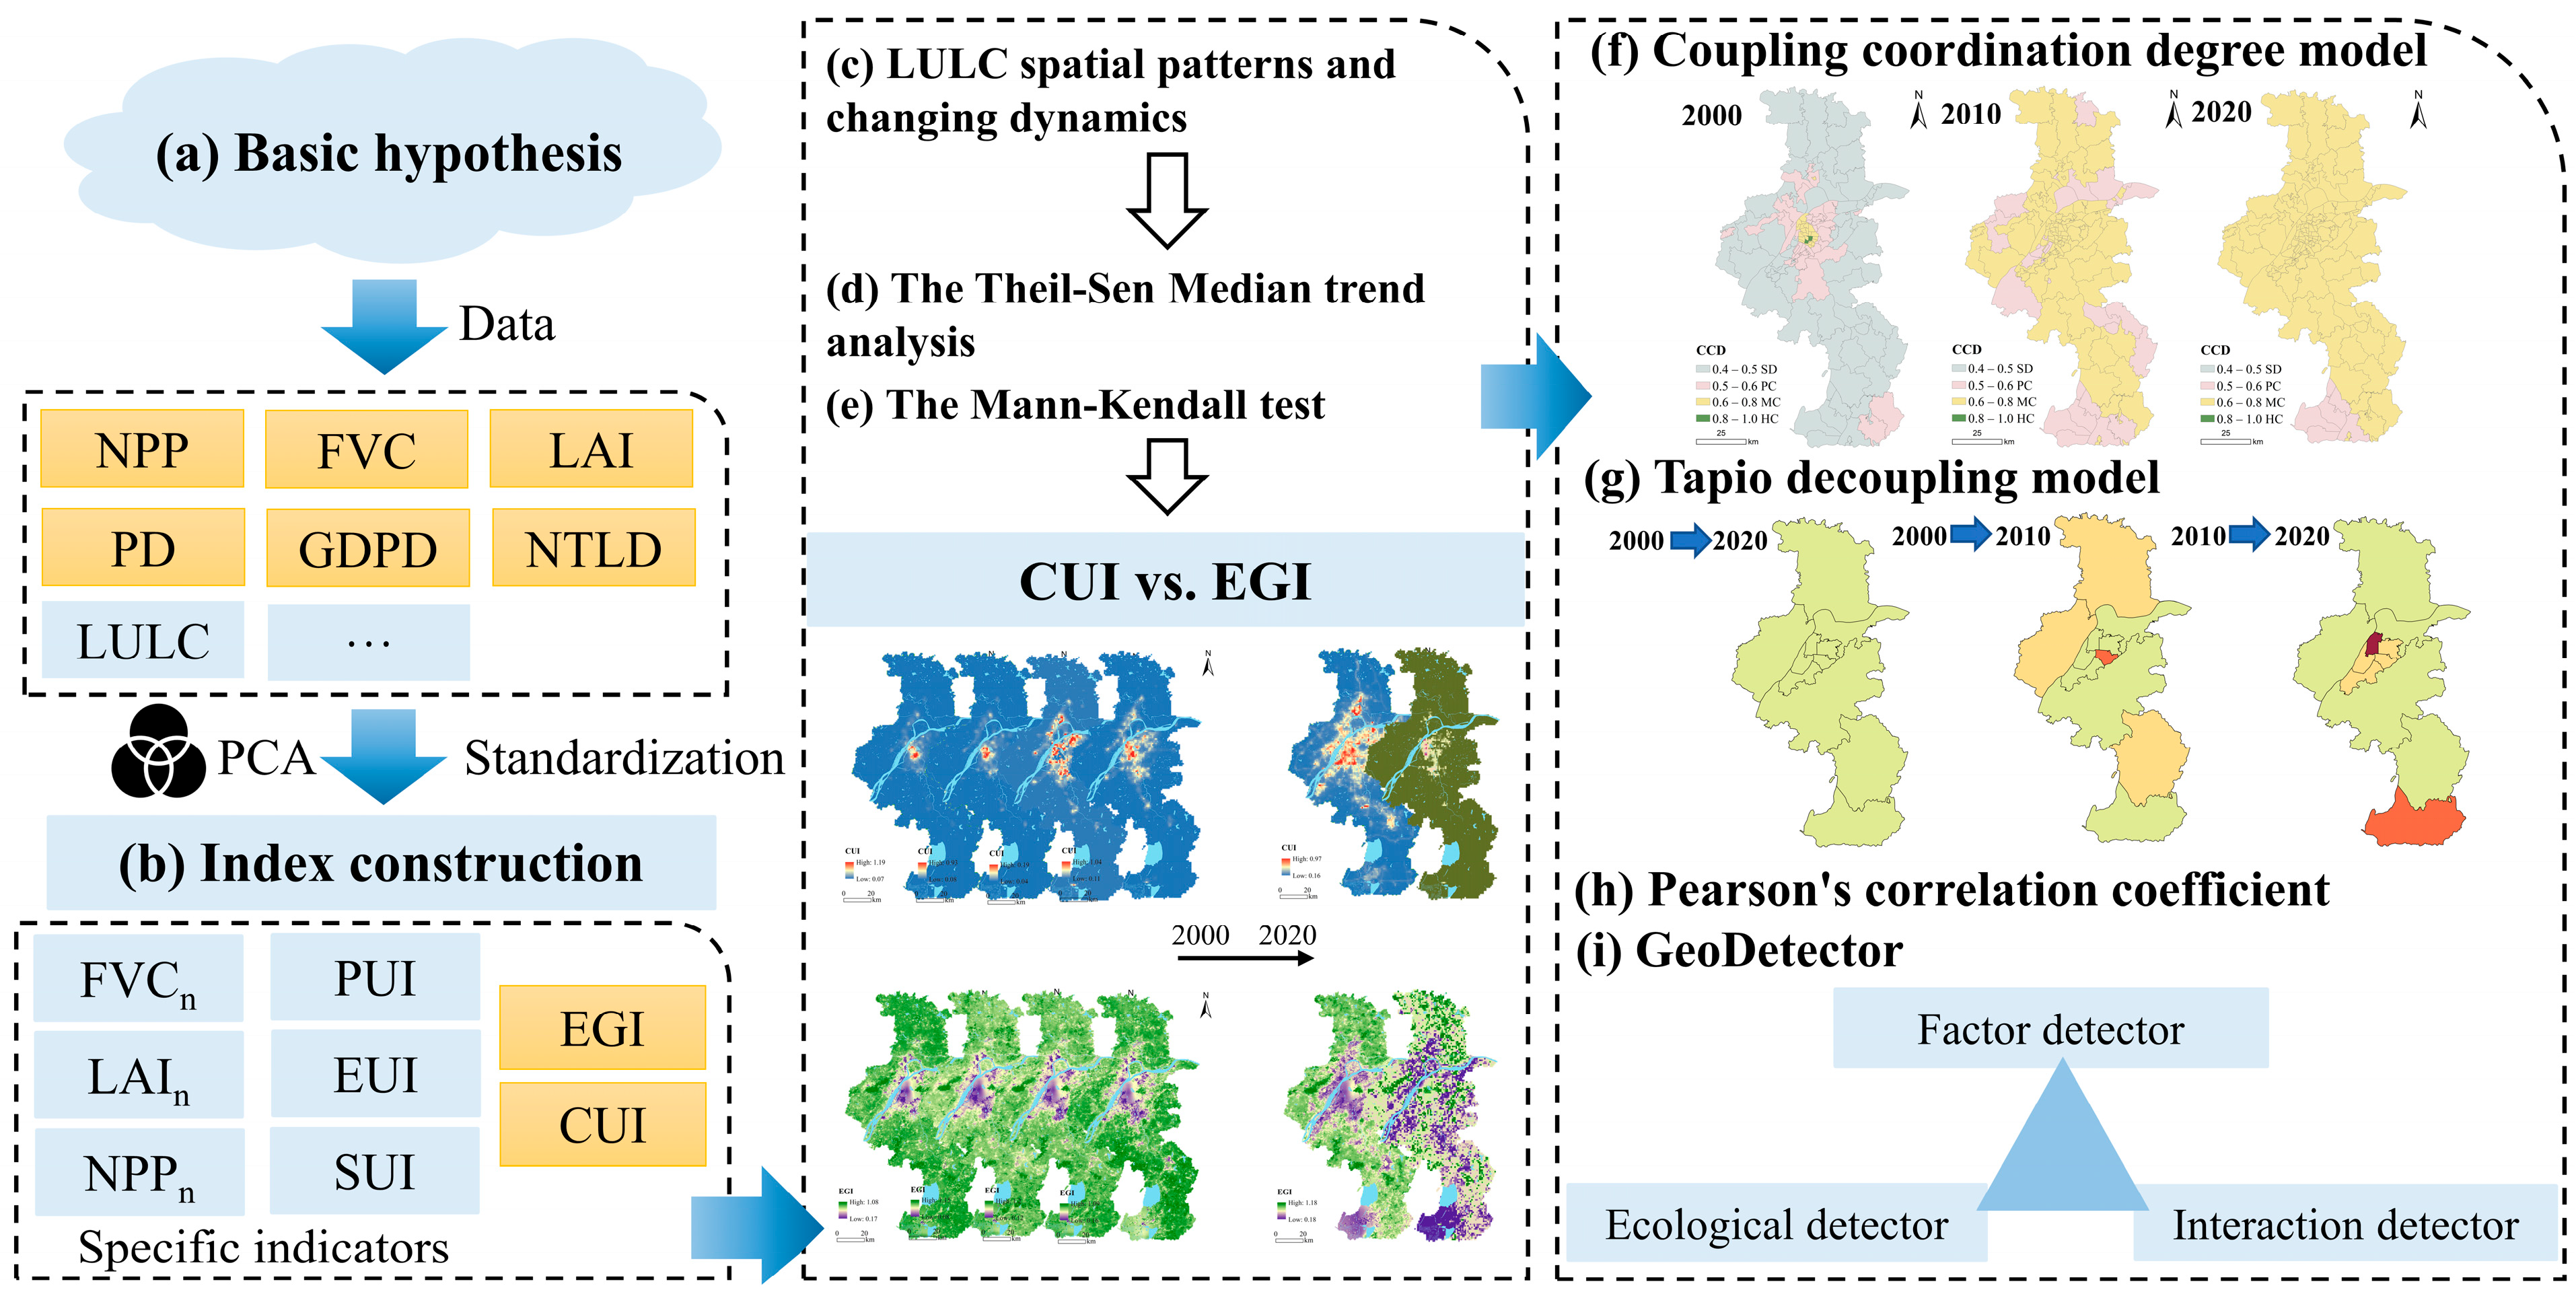
3.1. Basic Hypothesis
3.2. Index Construction
3.2.1. Construction of the CUI
3.2.2. Construction of the EGI
3.3. Trend Analysis
3.4. The CCD and Tapio Decoupling Models
3.4.1. The CCD Model
3.4.2. The Tapio Decoupling Model
3.5. Identification of Correlations and Interactions
3.5.1. Correlation Analysis
3.5.2. Spatially Stratified Heterogeneity
4. Results
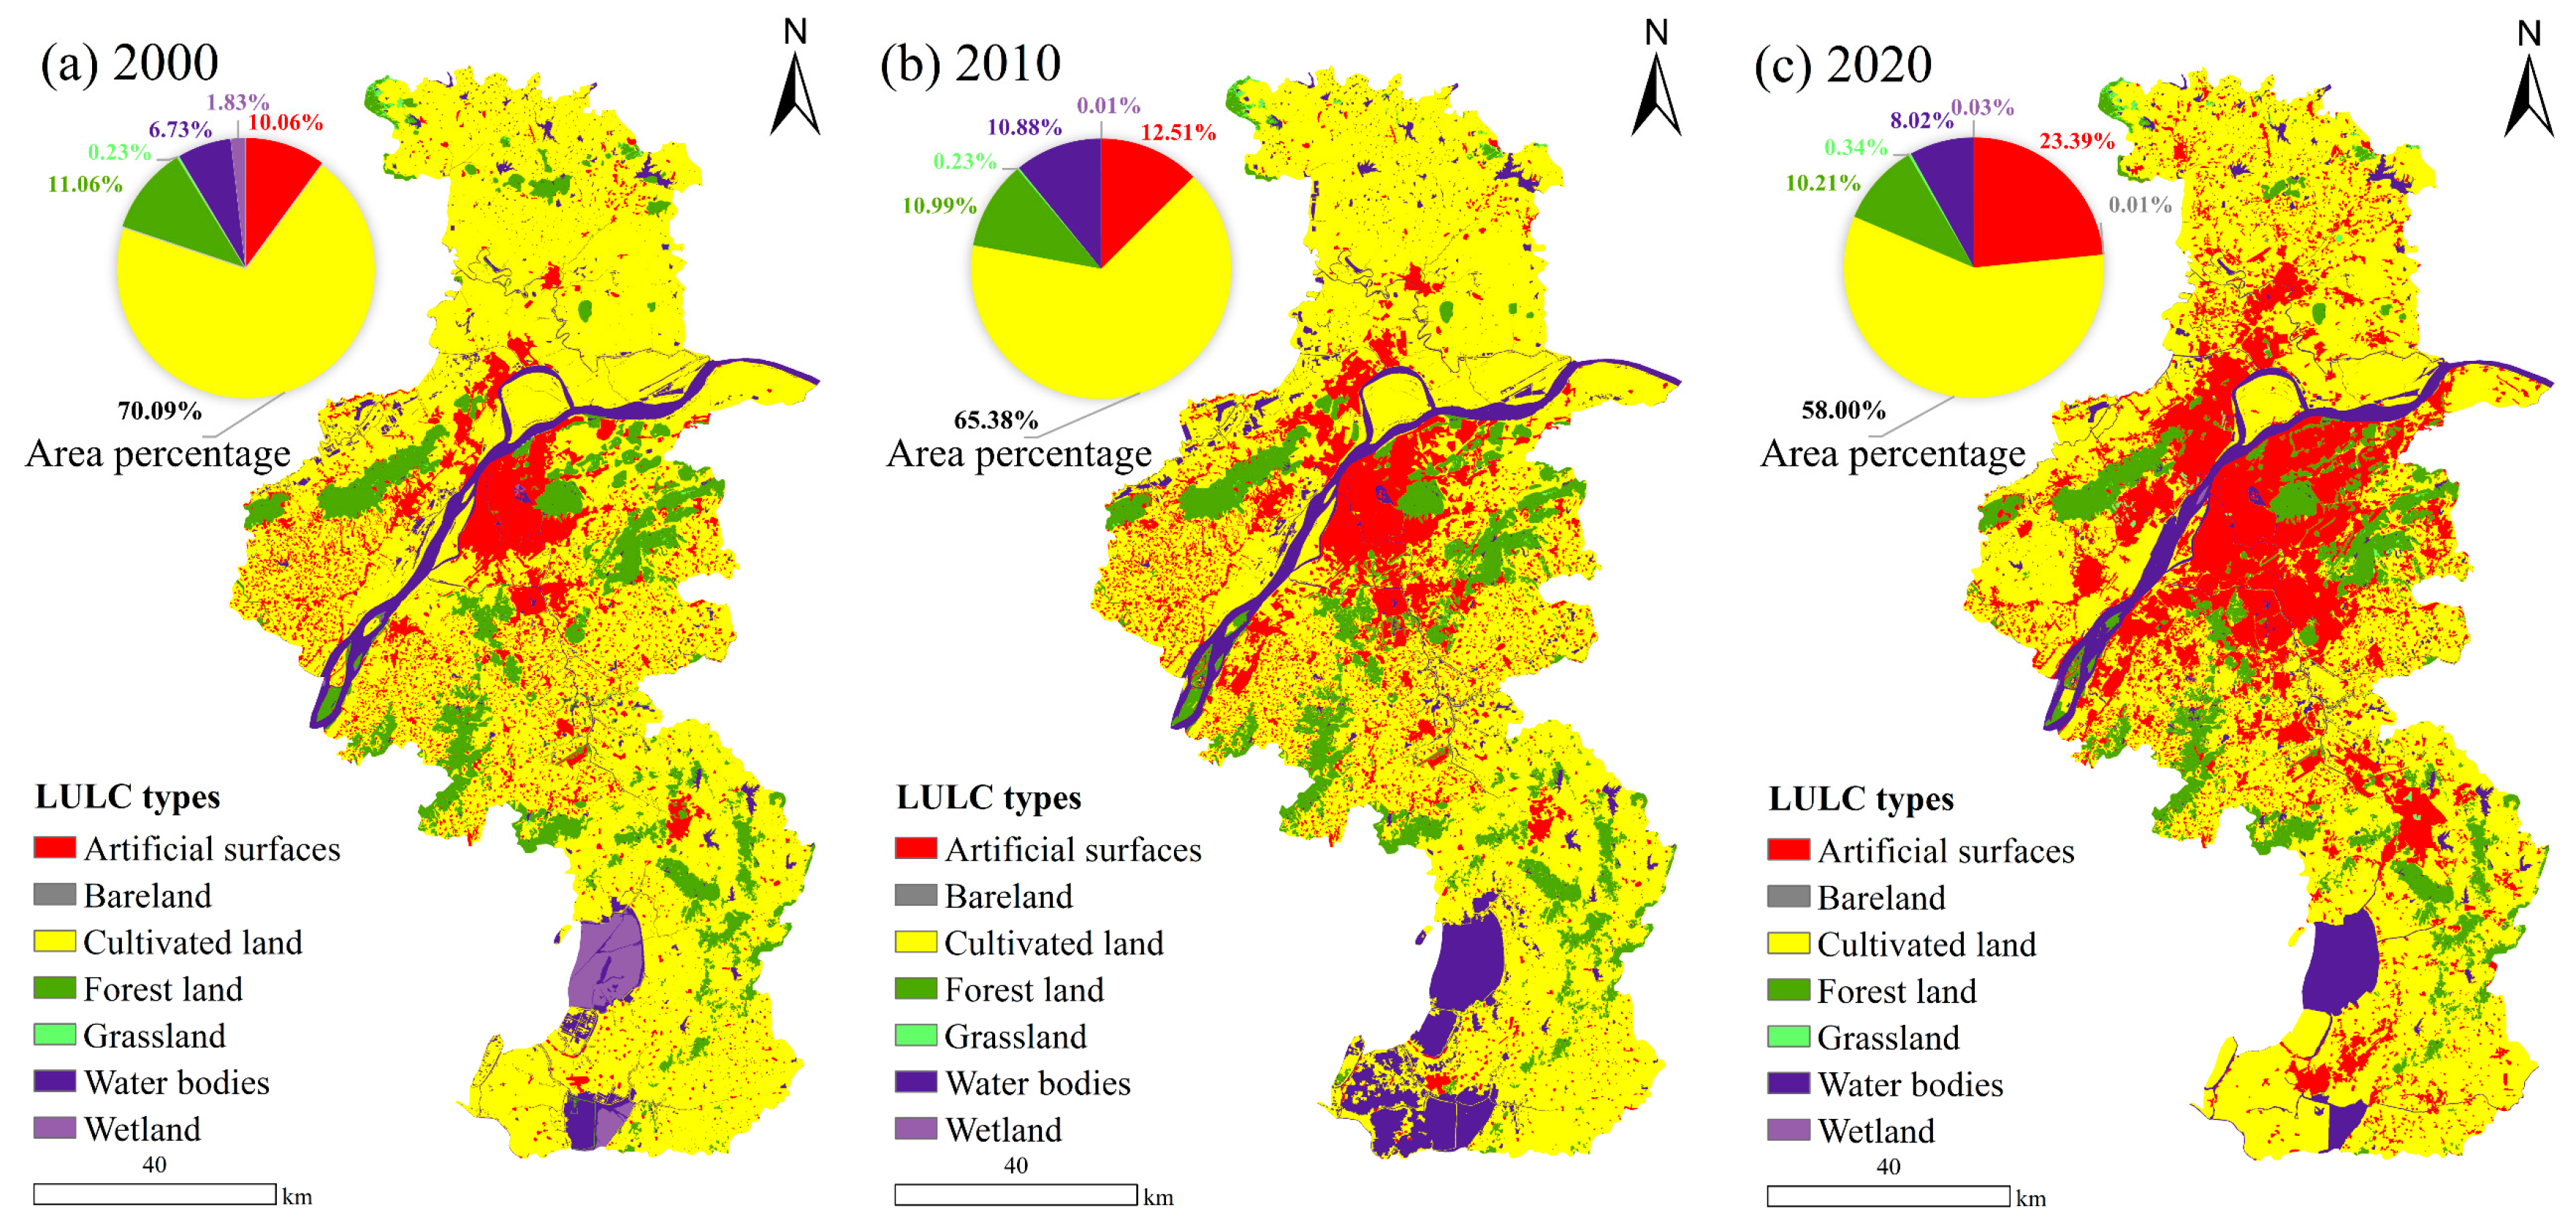
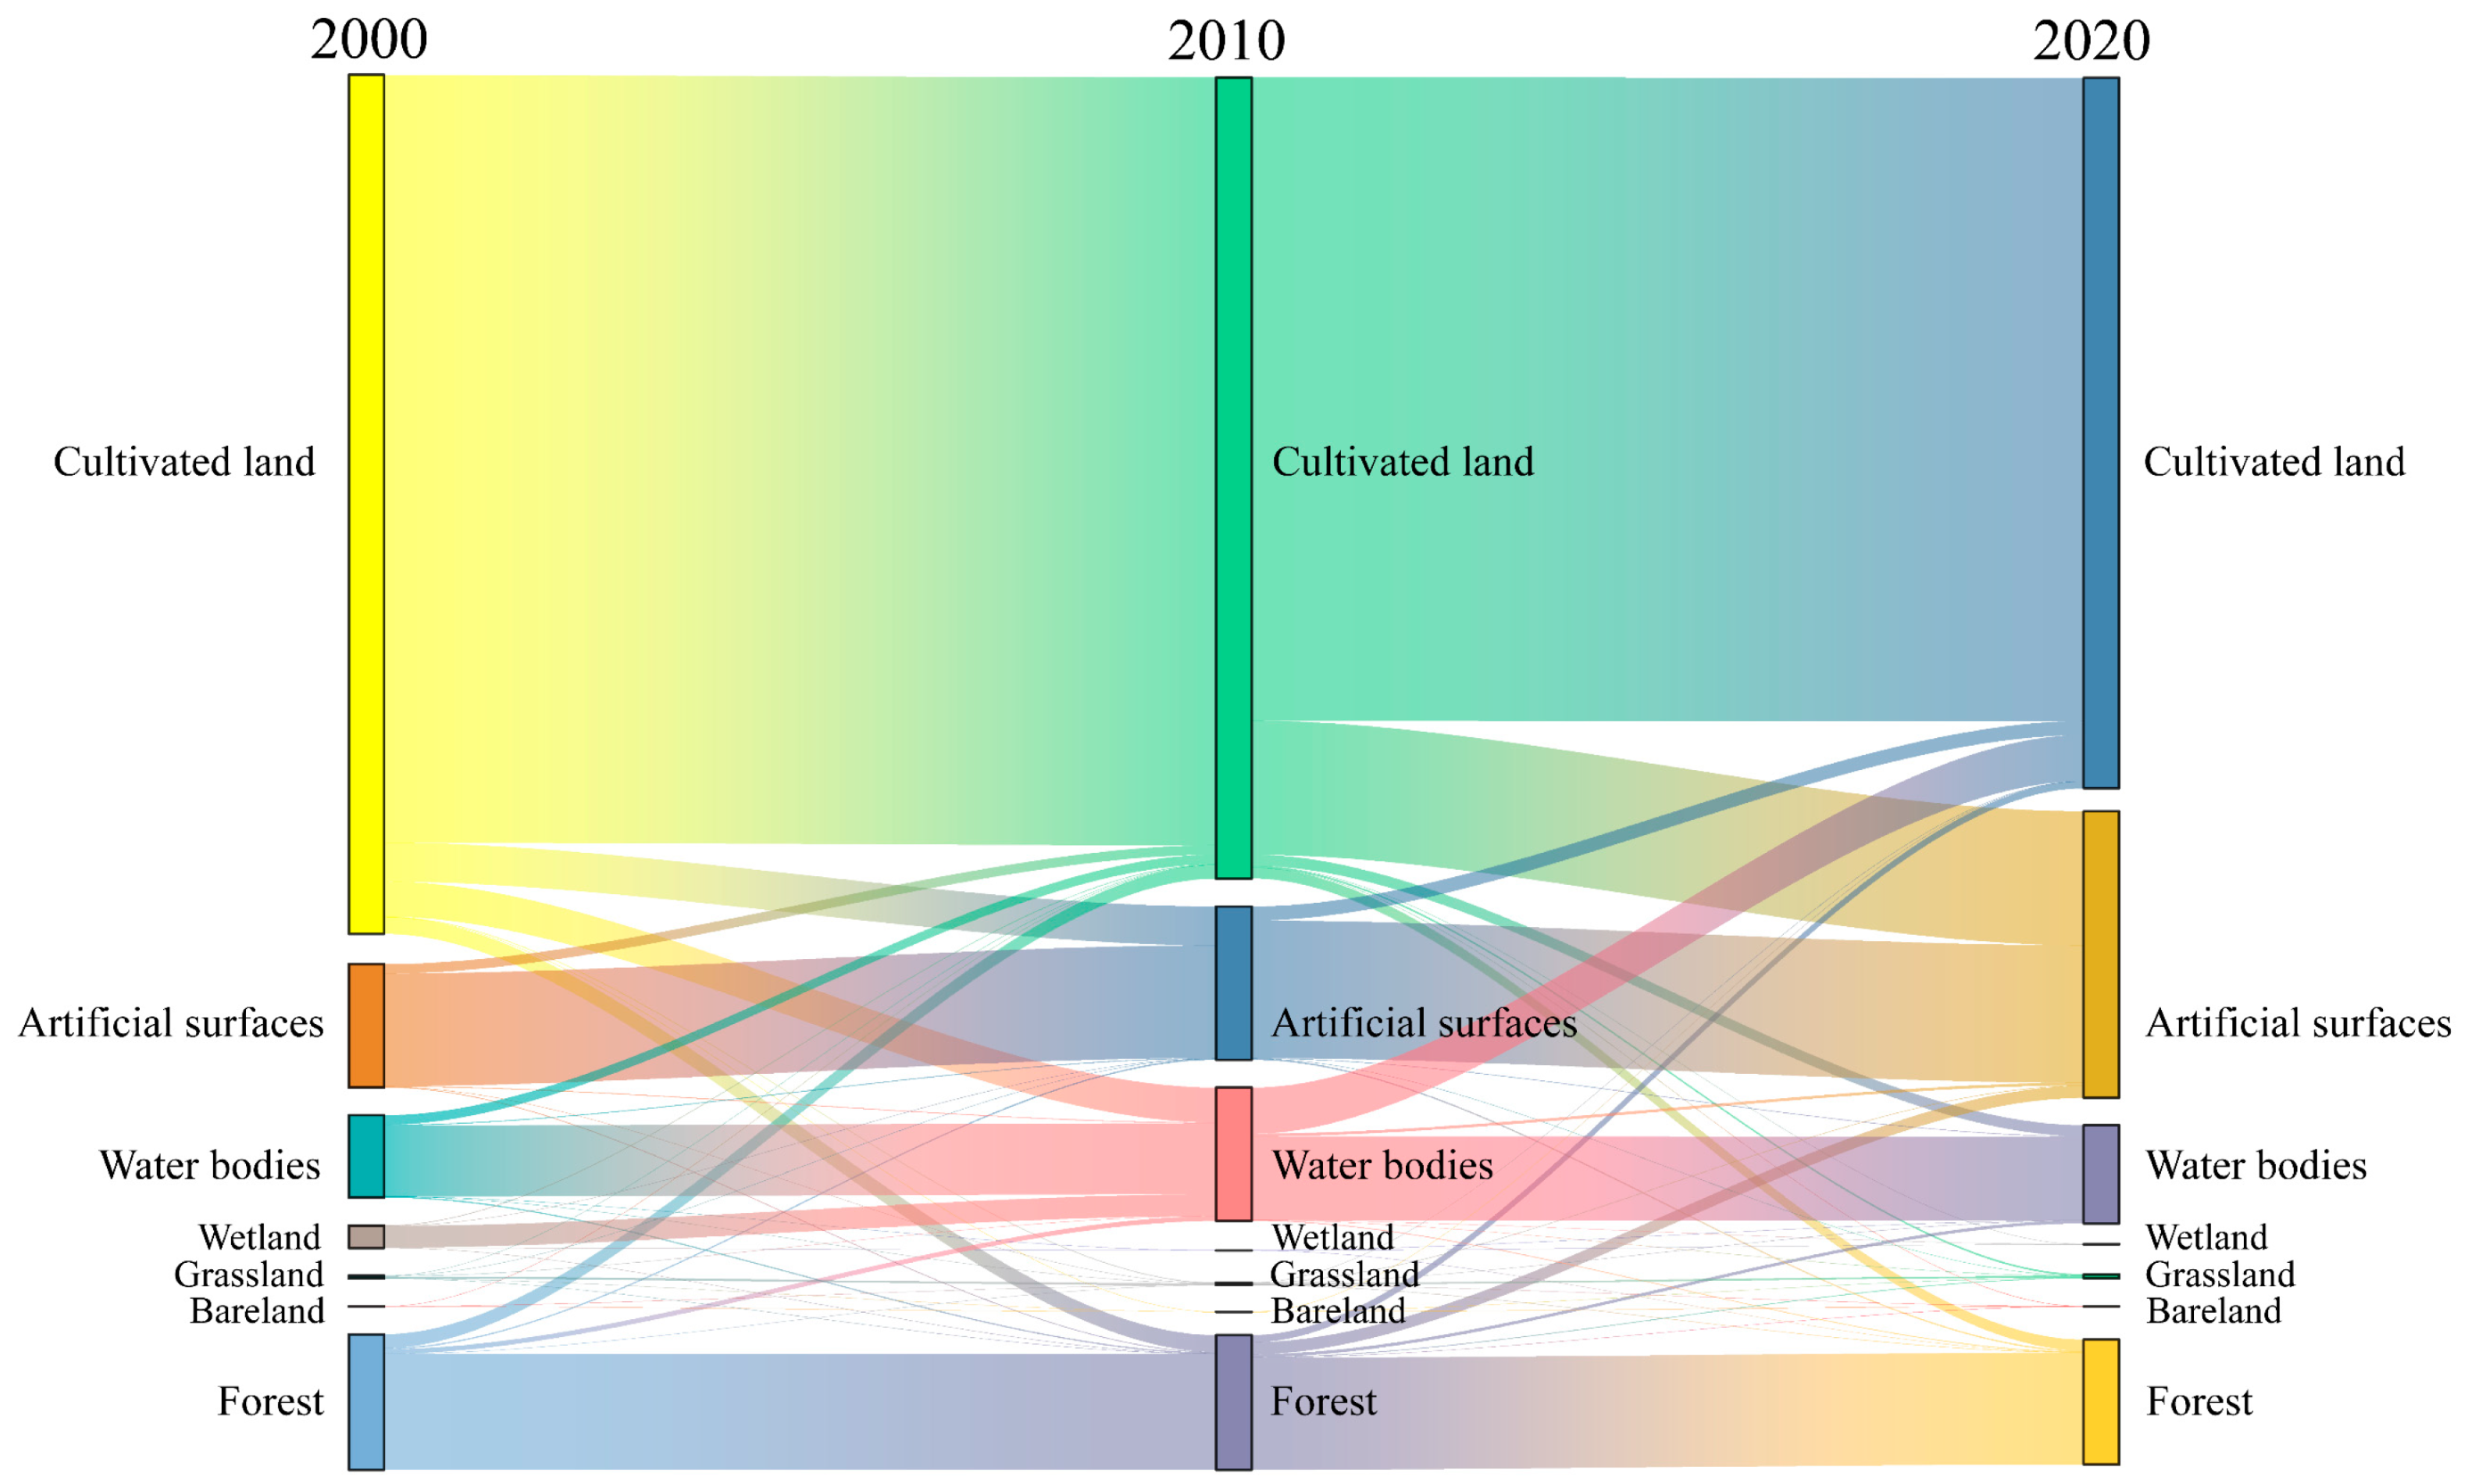
4.1. Historical Changes and Spatial Patterns in LULC
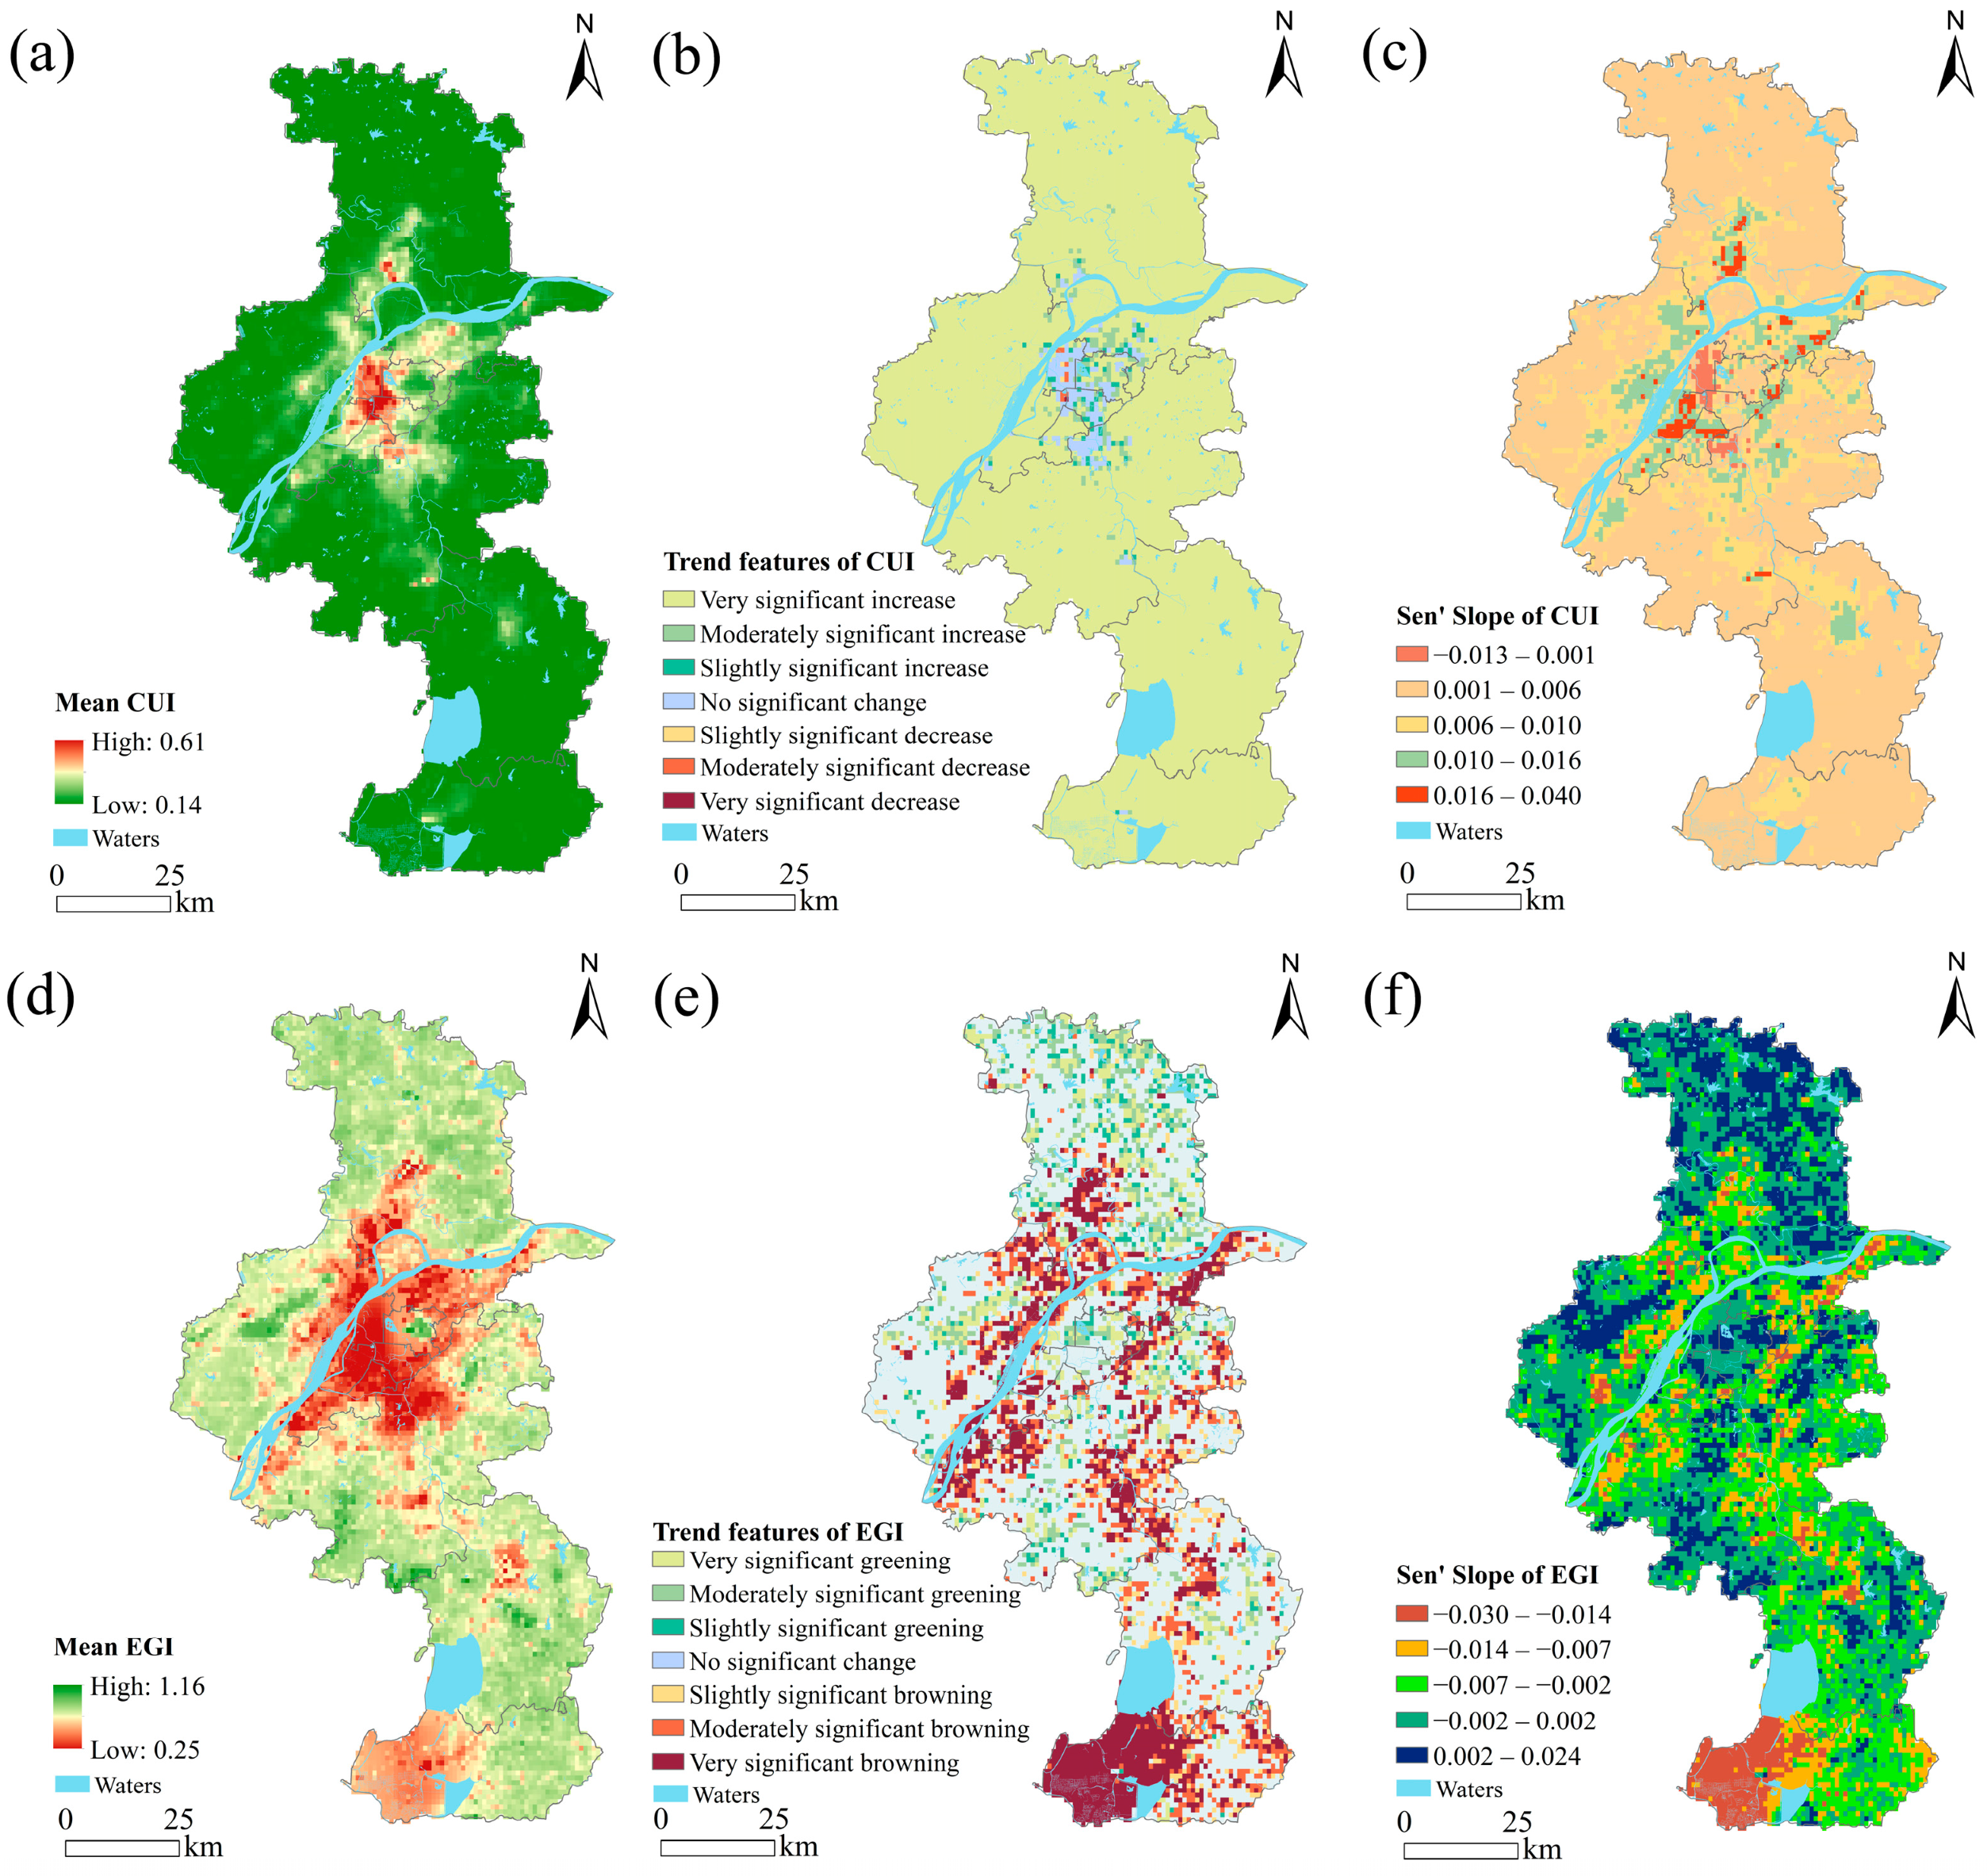
4.2. Evolutionary Trends in the CUI and EGI
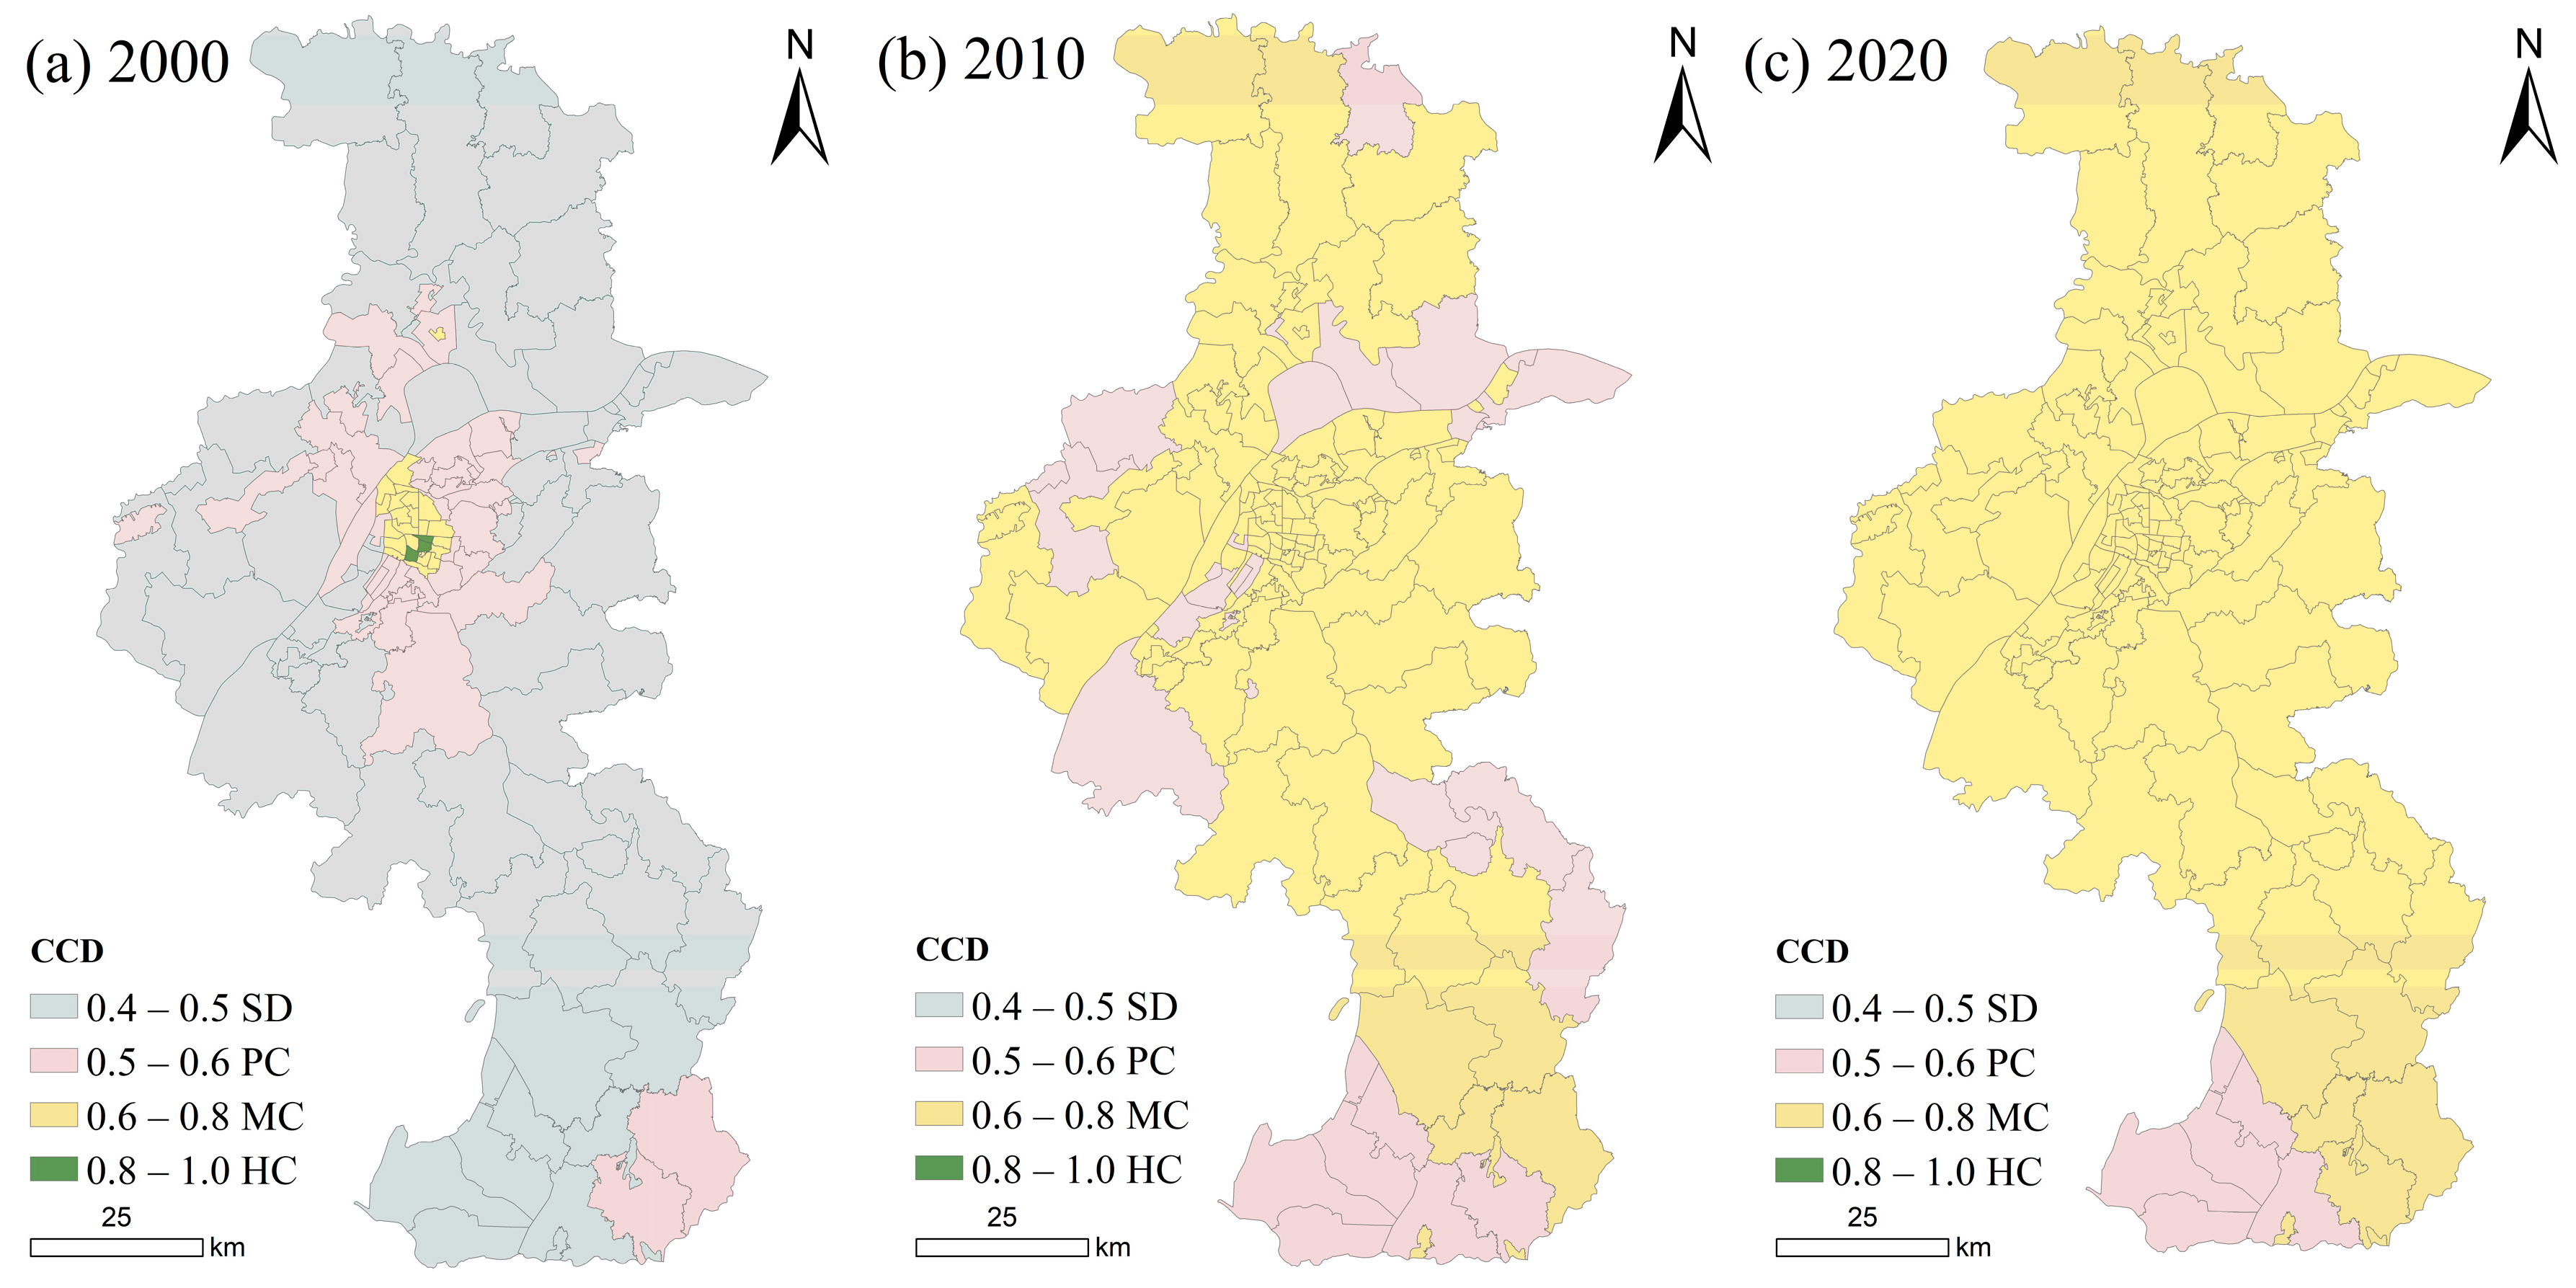
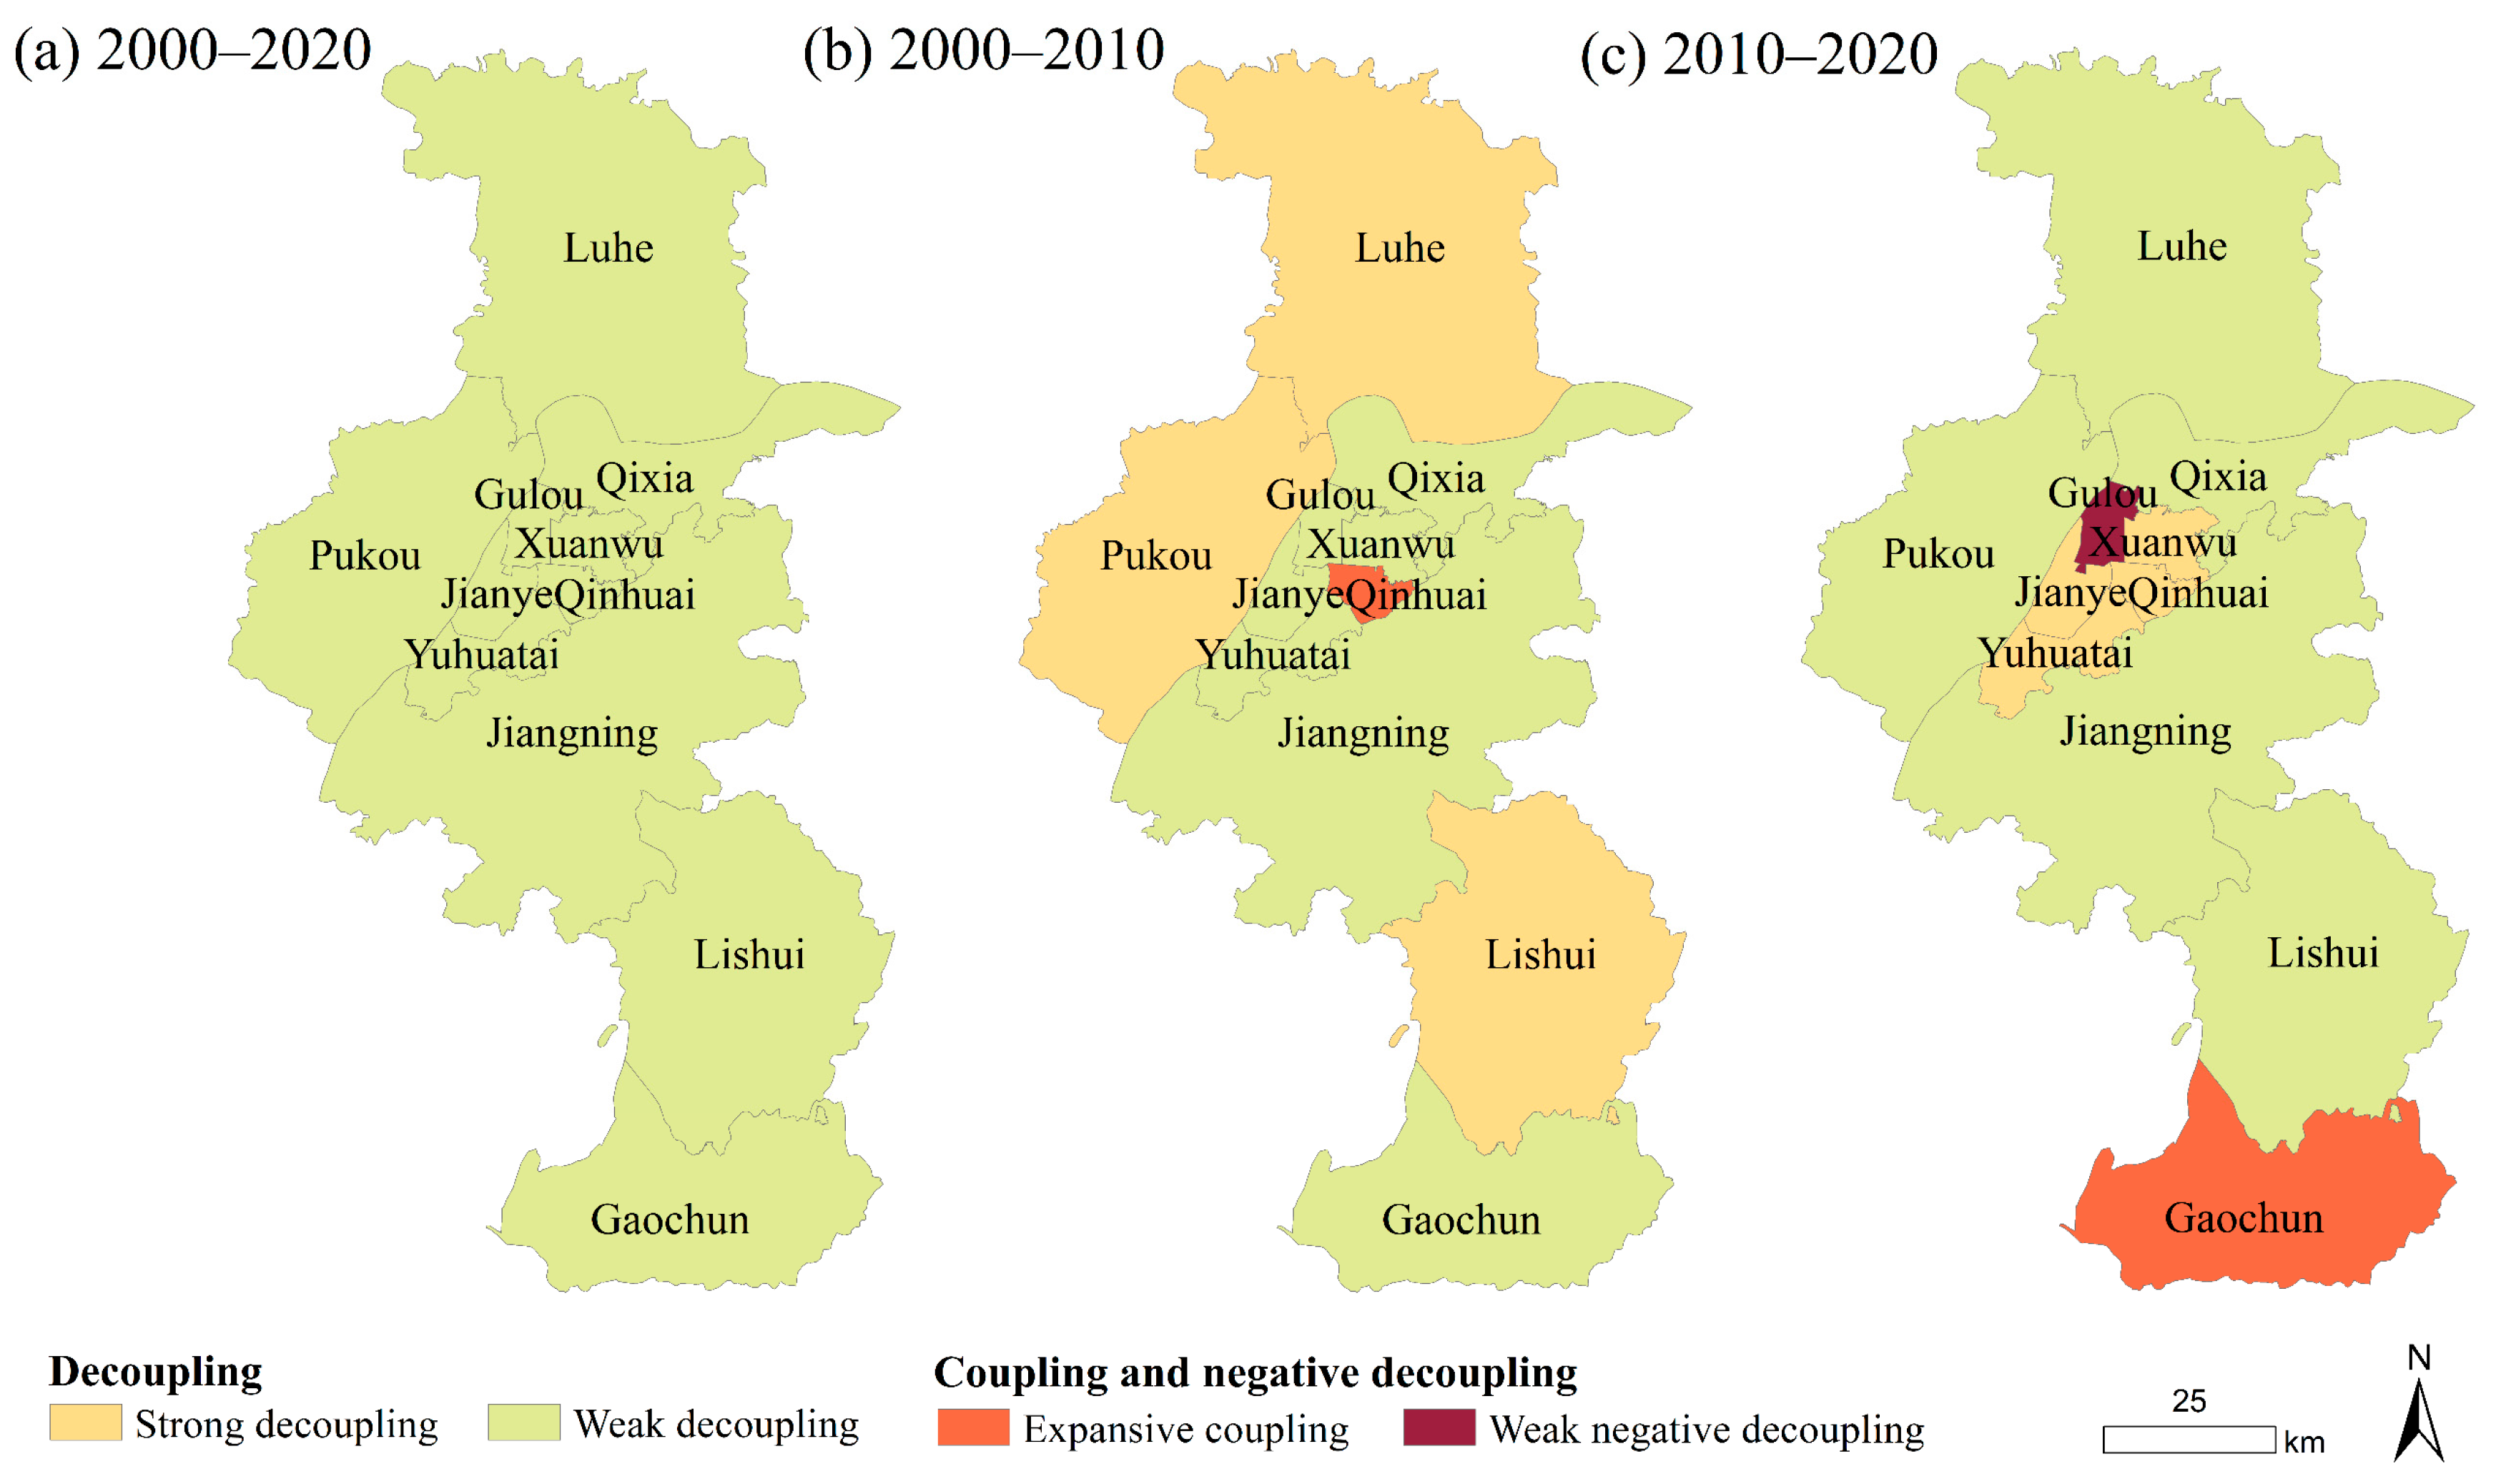
4.3. The CCD and Decoupling States
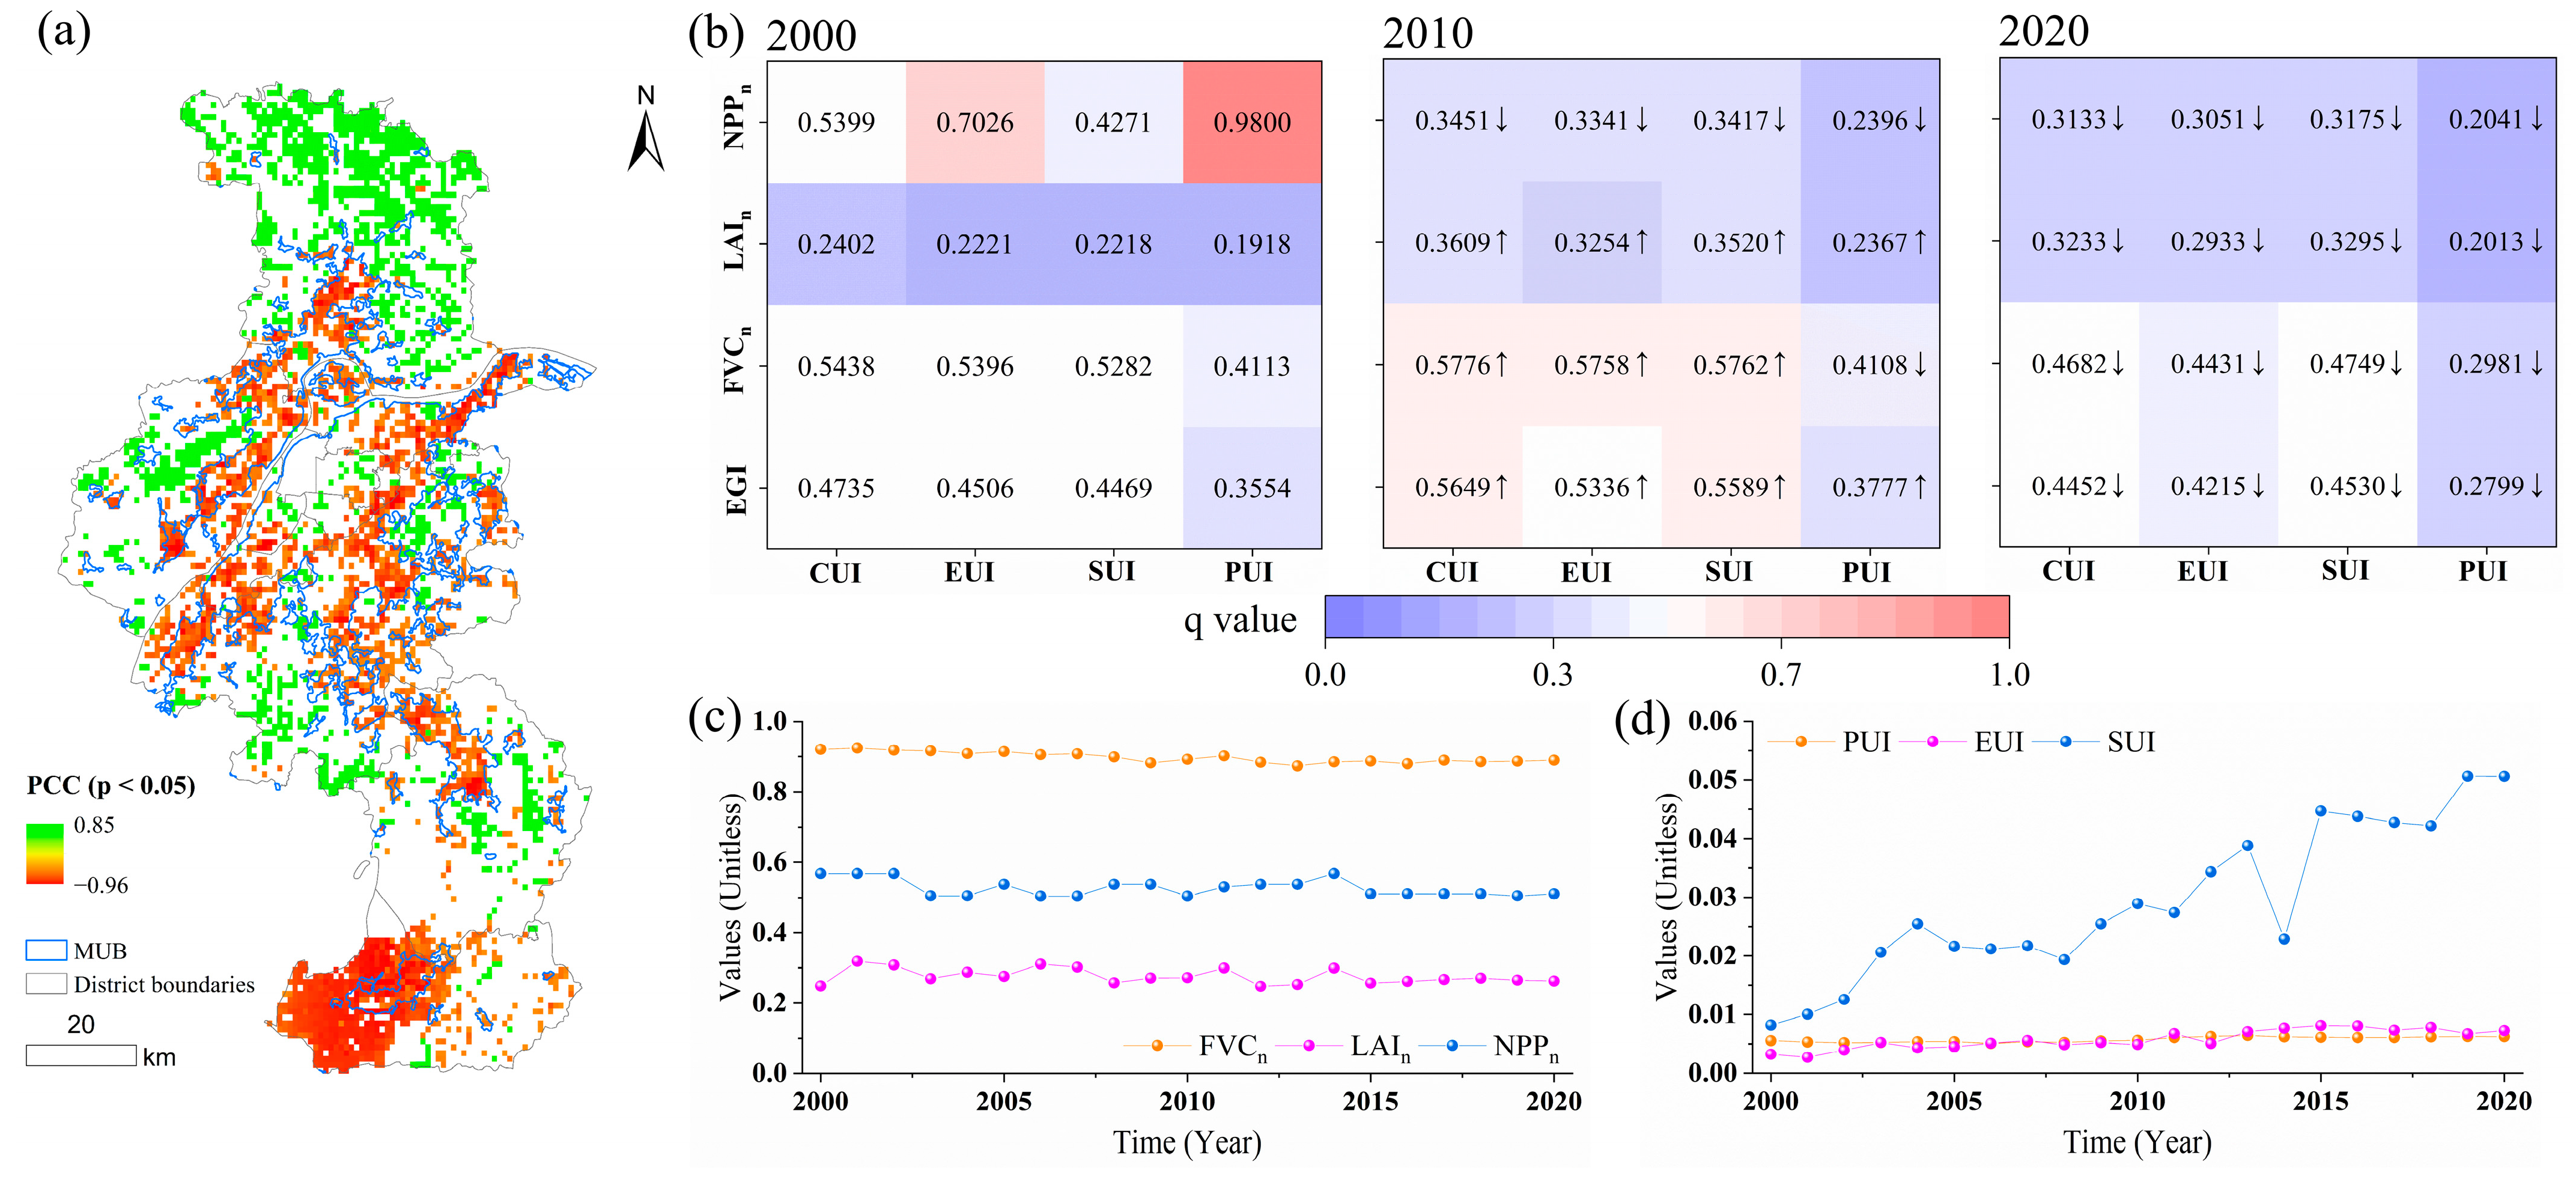
4.4. Interactive Driving Mechanisms of Urbanization and Greenness
5. Discussion
5.1. Empirical Analysis of Hypothesis
5.2. Analysis of Conflict Hotspots
5.3. Key Insights for Healthy Urban Development
5.4. Uncertainty
6. Conclusions
Supplementary Materials
Author Contributions
Funding
Data Availability Statement
Acknowledgments
Conflicts of Interest
References
- Du Toit, M.J.; Cilliers, S.S.; Dallimer, M.; Goddard, M.; Guenat, S.; Cornelius, S.F. Urban green infrastructure and ecosystem services in sub-Saharan Africa. Landsc. Urban Plan. 2018, 180, 249–261. [Google Scholar] [CrossRef]
- Kumar, P.; Druckman, A.; Gallagher, J.; Gatersleben, B.; Allison, S.; Eisenman, T.S.; Hoang, U.; Hama, S.; Tiwari, A.; Sharma, A. The nexus between air pollution, green infrastructure and human health. Environ. Int. 2019, 133, 105181. [Google Scholar] [CrossRef] [PubMed]
- O’Brien, L.E.; Urbanek, R.E.; Gregory, J.D. Ecological functions and human benefits of urban forests. Urban For. Urban Green. 2022, 75, 127707. [Google Scholar] [CrossRef]
- Qiu, J.; Zhao, H.; Chang, N.-B.; Wardropper, C.B.; Campbell, C.; Baggio, J.A.; Guan, Z.; Kohl, P.; Newell, J.; Wu, J. Scale up urban agriculture to leverage transformative food systems change, advance social–ecological resilience and improve sustainability. Nat. Food 2024, 5, 83–92. [Google Scholar] [CrossRef]
- Zhang, M.; Liu, Y.; Wu, J.; Wang, T. Index system of urban resource and environment carrying capacity based on ecological civilization. Environ. Impact Assess. Rev. 2018, 68, 90–97. [Google Scholar] [CrossRef]
- Cai, Z.; Liu, Z.; Zuo, S.; Cao, S. Finding a peaceful road to urbanization in China. Land Use Policy 2019, 83, 560–563. [Google Scholar] [CrossRef]
- Maimaiti, B.; Chen, S.; Kasimu, A.; Simayi, Z.; Aierken, N. Urban spatial expansion and its impacts on ecosystem service value of typical oasis cities around Tarim Basin, northwest China. Int. J. Appl. Earth Obs. Geoinf. 2021, 104, 102554. [Google Scholar] [CrossRef]
- Gupta, K.; Kumar, P.; Pathan, S.K.; Sharma, K.P. Urban Neighborhood Green Index–A measure of green spaces in urban areas. Landsc. Urban Plan. 2012, 105, 325–335. [Google Scholar] [CrossRef]
- Gao, S.; Yan, K.; Liu, J.; Pu, J.; Zou, D.; Qi, J.; Mu, X.; Yan, G. Assessment of remote-sensed vegetation indices for estimating forest chlorophyll concentration. Ecol. Indic. 2024, 162, 112001. [Google Scholar] [CrossRef]
- Tang, Z.; Zhou, Z.; Wang, D.; Luo, F.; Bai, J.; Fu, Y. Impact of vegetation restoration on ecosystem services in the Loess plateau, a case study in the Jinghe Watershed, China. Ecol. Indic. 2022, 142, 109183. [Google Scholar] [CrossRef]
- Taugourdeau, S.; Le Maire, G.; Avelino, J.; Jones, J.R.; Ramirez, L.G.; Quesada, M.J.; Charbonnier, F.; Gómez-Delgado, F.; Harmand, J.-M.; Rapidel, B. Leaf area index as an indicator of ecosystem services and management practices: An application for coffee agroforestry. Agric. Ecosyst. Environ. 2014, 192, 19–37. [Google Scholar] [CrossRef]
- Chen, Y.; Feng, X.; Tian, H.; Wu, X.; Gao, Z.; Feng, Y.; Piao, S.; Lv, N.; Pan, N.; Fu, B. Accelerated increase in vegetation carbon sequestration in China after 2010: A turning point resulting from climate and human interaction. Glob. Chang. Biol. 2021, 27, 5848–5864. [Google Scholar] [CrossRef] [PubMed]
- Wang, R.; Yan, F.; Wang, Y. Vegetation growth status and topographic effects in the pisha sandstone area of China. Remote Sens. 2020, 12, 2759. [Google Scholar] [CrossRef]
- Parker, G.G. Tamm review: Leaf Area Index (LAI) is both a determinant and a consequence of important processes in vegetation canopies. For. Ecol. Manag. 2020, 477, 118496. [Google Scholar] [CrossRef]
- Cao, F.; Li, J.; Fu, X.; Wu, G. Impacts of land conversion and management measures on net primary productivity in semi-arid grassland. Ecosyst. Health Sustain. 2020, 6, 1749010. [Google Scholar] [CrossRef]
- Chen, Y.; Song, J.; Zhong, S.; Liu, Z.; Gao, W. Effect of destructive earthquake on the population-economy-space urbanization at county level-a case study on Dujiangyan county, China. Sustain. Cities Soc. 2022, 76, 103345. [Google Scholar] [CrossRef]
- Zhong, Q.; Li, Z. Long-term trends of vegetation greenness under different urban development intensities in 889 global cities. Sustain. Cities Soc. 2024, 106, 105406. [Google Scholar] [CrossRef]
- Zhong, Q.; Ma, J.; Zhao, B.; Wang, X.; Zong, J.; Xiao, X. Assessing spatial-temporal dynamics of urban expansion, vegetation greenness and photosynthesis in megacity Shanghai, China during 2000–2016. Remote Sens. Environ. 2019, 233, 111374. [Google Scholar] [CrossRef]
- Zhou, X.; Wang, Y.-C. Spatial–temporal dynamics of urban green space in response to rapid urbanization and greening policies. Landsc. Urban Plan. 2011, 100, 268–277. [Google Scholar] [CrossRef]
- Li, D.; Wu, S.; Liang, Z.; Li, S. The impacts of urbanization and climate change on urban vegetation dynamics in China. Urban For. Urban Green. 2020, 54, 126764. [Google Scholar] [CrossRef]
- Lu, D.; Wang, Y.; Yang, Q.; Wang, Z.; Lin, A.; Tang, Y.; Li, Y. Effects of population spatial redistribution on vegetation greenness: A case study of Chongqing, China. Ecol. Indic. 2022, 138, 108803. [Google Scholar] [CrossRef]
- Tao, Y.; Li, F.; Liu, X.; Zhao, D.; Sun, X.; Xu, L. Variation in ecosystem services across an urbanization gradient: A study of terrestrial carbon stocks from Changzhou, China. Ecol. Model. 2015, 318, 210–216. [Google Scholar] [CrossRef]
- Jim, C.Y.; Chen, S.S. Comprehensive greenspace planning based on landscape ecology principles in compact Nanjing city, China. Landsc. Urban Plan. 2003, 65, 95–116. [Google Scholar] [CrossRef]
- Zhao, J.; Shi, L.; Tang, L.; Gao, L.; Xie, G.; Cao, S.; Bai, Y.; Fang, C.; Bao, C.; Li, W. Principles and application of sustainable development. In Contemporary Ecology Research in China; Springer: Berlin/Heidelberg, Germany, 2015; pp. 499–533. [Google Scholar]
- Xiao, Y.; Li, Y.; Huang, H. Conflict or coordination? Assessment of coordinated development between socioeconomic and ecological environment in resource-based cities: Evidence from Sichuan province of China. Environ. Sci. Pollut. Res. 2021, 28, 66327–66339. [Google Scholar] [CrossRef]
- Herring, J. Cooperative equilibrium in biosphere evolution: Reconciling competition and cooperation in evolutionary ecology. Acta Biotheor. 2021, 69, 629–641. [Google Scholar] [CrossRef]
- Zeitoun, M.; Mirumachi, N. Transboundary water interaction I: Reconsidering conflict and cooperation. Int. Environ. Agreem. Politics Law Econ. 2008, 8, 297–316. [Google Scholar] [CrossRef]
- Maes, M.J.; Jones, K.E.; Toledano, M.B.; Milligan, B. Mapping synergies and trade-offs between urban ecosystems and the sustainable development goals. Environ. Sci. Policy 2019, 93, 181–188. [Google Scholar] [CrossRef]
- Schwarz, N.; Hoffmann, F.; Knapp, S.; Strauch, M. Synergies or trade-offs? optimizing a virtual urban region to foster plant species richness, climate regulation, and compactness under varying landscape composition. Front. Environ. Sci. 2020, 8, 16. [Google Scholar] [CrossRef]
- Yang, Y.; Ren, X.; Yan, J. Trade-offs or synergies? Identifying dynamic land use functions and their interrelations at the grid scale in urban agglomeration. Cities 2023, 140, 104384. [Google Scholar] [CrossRef]
- Ren, Y.; Bai, Y.; Liu, Y.; Wang, J.; Zhang, F.; Wang, Z. Conflict or Coordination? Analysis of Spatio-Temporal Coupling Relationship between Urbanization and Eco-Efficiency: A Case Study of Urban Agglomerations in the Yellow River Basin, China. Land 2022, 11, 882. [Google Scholar] [CrossRef]
- Zhou, T.; Liu, H.; Gou, P.; Xu, N. Conflict or Coordination? measuring the relationships between urbanization and vegetation cover in China. Ecol. Indic. 2023, 147, 109993. [Google Scholar] [CrossRef]
- Shi, Y.; Feng, C.-C.; Yu, Q.; Han, R.; Guo, L. Contradiction or coordination? The spatiotemporal relationship between landscape ecological risks and urbanization from coupling perspectives in China. J. Clean. Prod. 2022, 363, 132557. [Google Scholar] [CrossRef]
- Fang, C.; Wang, J. A theoretical analysis of interactive coercing effects between urbanization and eco-environment. Chin. Geogr. Sci. 2013, 23, 147–162. [Google Scholar] [CrossRef]
- García-Gómez, M.; Maestre, F.T. Remote sensing data predict indicators of soil functioning in semi-arid steppes, central Spain. Ecol. Indic. 2011, 11, 1476–1481. [Google Scholar] [CrossRef]
- Niu, K.; He, W.; Qiu, L. Symbiosis coordination between industrial development and ecological environment for sustainable development: Theory and evidence. Sustain. Dev. 2023, 31, 3052–3069. [Google Scholar] [CrossRef]
- Fang, C.; Wang, Z.; Liu, H. Beautiful China Initiative: Human-nature harmony theory, evaluation index system and application. J. Geogr. Sci. 2020, 30, 691–704. [Google Scholar] [CrossRef]
- Dong, G.; Ge, Y.; Liu, J.; Kong, X.; Zhai, R. Evaluation of coupling relationship between urbanization and air quality based on improved coupling coordination degree model in Shandong Province, China. Ecol. Indic. 2023, 154, 110578. [Google Scholar] [CrossRef]
- Zeng, W.; Chen, X.; Wu, Q.; Dong, H. Spatiotemporal heterogeneity and influencing factors on urbanization and eco-environment coupling mechanism in China. Environ. Sci. Pollut. Res. 2023, 30, 1979–1996. [Google Scholar] [CrossRef]
- Wang, X.; Zhang, S.; Gao, C.; Tang, X. Coupling coordination and driving mechanisms of water resources carrying capacity under the dynamic interaction of the water-social-economic-ecological environment system. Sci. Total Environ. 2024, 920, 171011. [Google Scholar] [CrossRef] [PubMed]
- Zhang, M.; Li, H.; Su, B.; Yang, X. Using a new two-dimensional decoupling model to evaluate the decoupling state of global energy footprint. Sustain. Cities Soc. 2020, 63, 102461. [Google Scholar] [CrossRef]
- Zhou, X.; Zhang, M.; Zhou, M.; Zhou, M. A comparative study on decoupling relationship and influence factors between China’s regional economic development and industrial energy–related carbon emissions. J. Clean. Prod. 2017, 142, 783–800. [Google Scholar] [CrossRef]
- Shi, T.; Yang, S.; Zhang, W.; Zhou, Q. Coupling coordination degree measurement and spatiotemporal heterogeneity between economic development and ecological environment—Empirical evidence from tropical and subtropical regions of China. J. Clean. Prod. 2020, 244, 118739. [Google Scholar] [CrossRef]
- Wu, Z.; Zheng, X.; Chen, Y.; Huang, S.; Duan, C.; Hu, W. Coordination between scientific and technological innovation and the high-quality development of Baijiu industry: The coupling and decoupling perspective. PLoS ONE 2024, 19, e0301589. [Google Scholar] [CrossRef]
- Ma, T.; Yin, Z.; Li, B.; Zhou, C.; Haynie, S. Quantitative estimation of the velocity of urbanization in China using nighttime luminosity data. Remote Sens. 2016, 8, 94. [Google Scholar] [CrossRef]
- Guan, X.; Wei, H.; Lu, S.; Dai, Q.; Su, H. Assessment on the urbanization strategy in China: Achievements, challenges and reflections. Habitat Int. 2018, 71, 97–109. [Google Scholar] [CrossRef]
- Lü, Y.; Ma, Z.; Zhang, L.; Fu, B.; Gao, G. Redlines for the greening of China. Environ. Sci. Policy 2013, 33, 346–353. [Google Scholar] [CrossRef]
- Du, J.; Fu, Q.; Fang, S.; Wu, J.; He, P.; Quan, Z. Effects of rapid urbanization on vegetation cover in the metropolises of China over the last four decades. Ecol. Indic. 2019, 107, 105458. [Google Scholar] [CrossRef]
- Luo, Y.; Sun, W.; Yang, K.; Zhao, L. China urbanization process induced vegetation degradation and improvement in recent 20 years. Cities 2021, 114, 103207. [Google Scholar] [CrossRef]
- Yi, J.; Dai, S.; Cheng, J.; Liu, K. How urban sprawl affects local and nearby ecosystem services in China. Reg. Environ. Chang. 2023, 23, 139. [Google Scholar] [CrossRef]
- Cheng, M.; Wu, S.; Zeng, C.; Yu, X.; Wang, J. Can economic growth and urban greenness achieve positive synergies during rapid urbanization in China? Ecol. Indic. 2023, 150, 110250. [Google Scholar] [CrossRef]
- Sun, B.; Lu, Y.; Yang, Y.; Yu, M.; Yuan, J.; Yu, R.; Bullock, J.M.; Stenseth, N.C.; Li, X.; Cao, Z. Urbanization affects spatial variation and species similarity of bird diversity distribution. Sci. Adv. 2022, 8, eade3061. [Google Scholar] [CrossRef] [PubMed]
- Chunyu, W.; Xiaofang, S.; Meng, W.; Junbang, W.; Qingfu, D. Chinese cropland quality and its temporal and spatial changes due to urbanization in 2000–2015. J. Resour. Ecol. 2019, 10, 174–183. [Google Scholar]
- Wang, X.; Liu, E.; Lin, Q.; Liu, L.; Yuan, H.; Li, Z. Occurrence, sources and health risks of toxic metal (loid) s in road dust from a mega city (Nanjing) in China. Environ. Pollut. 2020, 263, 114518. [Google Scholar] [CrossRef] [PubMed]
- Cao, J.; Cao, W.; Fang, X.; Ma, J.; Mok, D.; Xie, Y. The identification and driving factor analysis of ecological-economi spatial conflict in Nanjing Metropolitan Area based on remote sensing Data. Remote Sens. 2022, 14, 5864. [Google Scholar] [CrossRef]
- Xu, C.; Liu, M.; Zhang, C.; An, S.; Yu, W.; Chen, J.M. The spatiotemporal dynamics of rapid urban growth in the Nanjing metropolitan region of China. Landsc. Ecol. 2007, 22, 925–937. [Google Scholar] [CrossRef]
- Min, M.; Lin, C.; Duan, X.; Jin, Z.; Zhang, L. Spatial distribution and driving force analysis of urban heat island effect based on raster data: A case study of the Nanjing metropolitan area, China. Sustain. Cities Soc. 2019, 50, 101637. [Google Scholar] [CrossRef]
- Li, B.; Chen, D.; Wu, S.; Zhou, S.; Wang, T.; Chen, H. Spatio-temporal assessment of urbanization impacts on ecosystem services: Case study of Nanjing City, China. Ecol. Indic. 2016, 71, 416–427. [Google Scholar] [CrossRef]
- Lv, L.; Han, X.; Zhu, J.; Liao, K.; Yang, Q.; Wang, X. Spatial drivers of ecosystem services supply-demand balances in the Nanjing metropolitan area, China. J. Clean. Prod. 2024, 434, 139894. [Google Scholar] [CrossRef]
- Ma, X.; Li, N.; Yang, H.; Li, Y. Exploring the relationship between urbanization and water environment based on coupling analysis in Nanjing, East China. Environ. Sci. Pollut. Res. 2022, 29, 4654–4667. [Google Scholar] [CrossRef]
- Zhang, X.; Chen, J.; Tan, M.; Sun, Y. Assessing the impact of urban sprawl on soil resources of Nanjing city using satellite images and digital soil databases. Catena 2007, 69, 16–30. [Google Scholar] [CrossRef]
- Peng, B.; Li, Y.; Elahi, E.; Wei, G. Dynamic evolution of ecological carrying capacity based on the ecological footprint theory: A case study of Jiangsu province. Ecol. Indic. 2019, 99, 19–26. [Google Scholar] [CrossRef]
- Yang, G.; Dong, Z.; Feng, S.; Li, B.; Sun, Y.; Chen, M. Early warning of water resource carrying status in Nanjing City based on coordinated development index. J. Clean. Prod. 2021, 284, 124696. [Google Scholar] [CrossRef]
- Wu, F.; Chen, W.; Lin, L.; Ren, X.; Qu, Y. The Balanced allocation of medical and health resources in urban areas of China from the perspective of sustainable development: A case study of Nanjing. Sustainability 2022, 14, 6707. [Google Scholar] [CrossRef]
- Chuai, X.; Yuan, Y.; Zhang, X.; Guo, X.; Zhang, X.; Xie, F.; Zhao, R.; Li, J. Multiangle land use-linked carbon balance examination in Nanjing City, China. Land Use Policy 2019, 84, 305–315. [Google Scholar] [CrossRef]
- Li, J.; Nie, W.; Zhang, M.; Wang, L.; Dong, H.; Xu, B. Assessment and optimization of urban ecological network resilience based on disturbance scenario simulations: A case study of Nanjing city. J. Clean. Prod. 2024, 438, 140812. [Google Scholar] [CrossRef]
- Wang, T.; Sun, F. Global gridded GDP data set consistent with the shared socioeconomic pathways. Sci. Data 2022, 9, 221. [Google Scholar] [CrossRef] [PubMed]
- Chen, Z.; Yu, B.; Yang, C.; Zhou, Y.; Qian, X.; Wang, C.; Wu, B.; Wu, J. An extended time-series (2000–2018) of global NPP-VIIRS-like nighttime light data from a cross-sensor calibration. Earth Syst. Sci. Data Discuss. 2021, 13, 889–906. [Google Scholar] [CrossRef]
- Li, X.; Gong, P.; Zhou, Y.; Wang, J.; Bai, Y.; Chen, B.; Hu, T.; Xiao, Y.; Xu, B.; Yang, J. Mapping global urban boundaries from the global artificial impervious area (GAIA) data. Environ. Res. Lett. 2020, 15, 094044. [Google Scholar] [CrossRef]
- Yan, K.; Wang, J.; Peng, R.; Yang, K.; Chen, X.; Yin, G.; Dong, J.; Weiss, M.; Pu, J.; Myneni, R.B. HiQ-LAI: A High-Quality Reprocessed MODIS LAI Dataset with Better Spatio-temporal Consistency from 2000 to 2022. Earth Syst. Sci. Data Discuss. 2024, 16, 1601–1622. [Google Scholar] [CrossRef]
- Chen, J.; Chen, J.; Liao, A.; Cao, X.; Chen, L.; Chen, X.; He, C.; Han, G.; Peng, S.; Lu, M. Global land cover mapping at 30 m resolution: A POK-based operational approach. ISPRS J. Photogramm. Remote Sens. 2015, 103, 7–27. [Google Scholar] [CrossRef]
- Zhang, Q.; Seto, K.C. Mapping urbanization dynamics at regional and global scales using multi-temporal DMSP/OLS nighttime light data. Remote Sens. Environ. 2011, 115, 2320–2329. [Google Scholar] [CrossRef]
- Yan, H.; Tao, W.; Shao, F.; Su, L.; Wang, Q.; Deng, M.; Zhou, B. Spatiotemporal patterns and evolutionary trends of eco-environmental quality in arid regions of Northwest China. Environ. Monit. Assess. 2024, 196, 176. [Google Scholar] [CrossRef] [PubMed]
- Boori, M.S.; Choudhary, K.; Paringer, R.; Kupriyanov, A. Spatiotemporal ecological vulnerability analysis with statistical correlation based on satellite remote sensing in Samara, Russia. J. Environ. Manag. 2021, 285, 112138. [Google Scholar] [CrossRef] [PubMed]
- Abson, D.J.; Dougill, A.J.; Stringer, L.C. Using principal component analysis for information-rich socio-ecological vulnerability mapping in Southern Africa. Appl. Geogr. 2012, 35, 515–524. [Google Scholar] [CrossRef]
- Theil, H. A rank-invariant method of linear and polynomial regression analysis. Indag. Math. 1950, 12, 173. [Google Scholar]
- Sen, P.K. Estimates of the regression coefficient based on Kendall’s tau. J. Am. Stat. Assoc. 1968, 63, 1379–1389. [Google Scholar] [CrossRef]
- Zhang, Z.; Fan, Y.; Jiao, Z. Wetland ecological index and assessment of spatial-temporal changes of wetland ecological integrity. Sci. Total Environ. 2023, 862, 160741. [Google Scholar] [CrossRef] [PubMed]
- Jiang, W.; Yuan, L.; Wang, W.; Cao, R.; Zhang, Y.; Shen, W. Spatio-temporal analysis of vegetation variation in the Yellow River Basin. Ecol. Indic. 2015, 51, 117–126. [Google Scholar] [CrossRef]
- Shadmani, M.; Marofi, S.; Roknian, M. Trend analysis in reference evapotranspiration using Mann-Kendall and Spearman’s Rho tests in arid regions of Iran. Water Resour. Manag. 2012, 26, 211–224. [Google Scholar] [CrossRef]
- Kendall, M.G. Rank Correlation Methods; Charles Griffin: London, UK, 1948. [Google Scholar]
- Ding, T.; Chen, J.; Fang, Z.; Chen, J. Assessment of coordinative relationship between comprehensive ecosystem service and urbanization: A case study of Yangtze River Delta urban Agglomerations, China. Ecol. Indic. 2021, 133, 108454. [Google Scholar] [CrossRef]
- Zhang, Y.; Khan, S.U.; Swallow, B.; Liu, W.; Zhao, M. Coupling coordination analysis of China’s water resources utilization efficiency and economic development level. J. Clean. Prod. 2022, 373, 133874. [Google Scholar] [CrossRef]
- Tapio, P. Towards a theory of decoupling: Degrees of decoupling in the EU and the case of road traffic in Finland between 1970 and 2001. Transp. Policy 2005, 12, 137–151. [Google Scholar] [CrossRef]
- Zhu, Z.; Kong, X.; Li, Y. Identifying the Static and dynamic relationships between rural population and settlements in Jiangsu Province, China. Chin. Geogr. Sci. 2020, 30, 810–823. [Google Scholar] [CrossRef]
- Wang, J.F.; Li, X.H.; Christakos, G.; Liao, Y.L.; Zhang, T.; Gu, X.; Zheng, X.Y. Geographical detectors-based health risk assessment and its application in the neural tube defects study of the Heshun Region, China. Int. J. Geogr. Inf. Sci. 2010, 24, 107–127. [Google Scholar] [CrossRef]
- Wang, J.-F.; Zhang, T.-L.; Fu, B.-J. A measure of spatial stratified heterogeneity. Ecol. Indic. 2016, 67, 250–256. [Google Scholar] [CrossRef]
- Hang, X.; Li, Y.; Luo, X.; Xu, M.; Han, X. Assessing the ecological quality of Nanjing during its urbanization process by using satellite, meteorological, and socioeconomic data. J. Meteorol. Res. 2020, 34, 280–293. [Google Scholar] [CrossRef]
- Tang, C.-S.; Shi, B.; Gao, L.; Daniels, J.L.; Jiang, H.-T.; Liu, C. Urbanization effect on soil temperature in Nanjing, China. Energy Build. 2011, 43, 3090–3098. [Google Scholar] [CrossRef]
- Wang, N.; Zhao, Y. Construction of an ecological security pattern in Jiangnan water network area based on an integrated Approach: A case study of Gaochun, Nanjing. Ecol. Indic. 2024, 158, 111314. [Google Scholar] [CrossRef]
- Zhang, Y.; Shen, W.; Li, M.; Lv, Y. Assessing spatio-temporal changes in forest cover and fragmentation under urban expansion in Nanjing, eastern China, from long-term Landsat observations (1987–2017). Appl. Geogr. 2020, 117, 102190. [Google Scholar] [CrossRef]
- Jin, Z.; Wang, J.; Kong, X. Combining habitat area and fragmentation change for ecological disturbance assessment in Jiangsu Province, China. Environ. Sci. Pollut. Res. 2020, 27, 20817–20830. [Google Scholar] [CrossRef]
- Wu, Y.; Shan, L.; Guo, Z.; Peng, Y. Cultivated land protection policies in China facing 2030: Dynamic balance system versus basic farmland zoning. Habitat Int. 2017, 69, 126–138. [Google Scholar] [CrossRef]
- Bille, R.A.; Jensen, K.E.; Buitenwerf, R. Global patterns in urban green space are strongly linked to human development and population density. Urban For. Urban Green. 2023, 86, 127980. [Google Scholar] [CrossRef]

| Name | Spatial Resolution | Time Resolution | Time Frame | Data Sources |
|---|---|---|---|---|
| The administrative division data | 1:1 million | Annual | 2020 | National Catalogue Service Geographic Information (https://www.webmap.cn/, accessed on 8 February 2022) |
| NPP | 500 m | Annual | 2000–2020 | MOD17A2HGF (https://appeears.earthdatacloud.nasa.gov/, accessed on 16 November 2023) |
| PD | 100 m | Annual | 2000–2020 | WorldPop Global Project Population Data (https://www.worldpop.org/, accessed on 13 January 2024) |
| GDPD | 1000 m | Annual | 2000–2020 | Paper [67] |
| NTLD | 500 m | Annual | 2000–2020 | Paper [68] |
| MUB | 30 m | Annual | 2018 | Paper [69] |
| FVC | 250 m | Months | 2000–2020 | China regional 250 m fractional vegetation cover data set (2000–2022) (https://data.tpdc.ac.cn/zh-hans/data/f3bae344-9d4b-4df6-82a0-81499c0f90f7, accessed on 5 January 2024) |
| LAI | 500 m | 8-Days | 2000–2020 | Paper [70] |
| LULC | 30 m | Annual | 2000, 2010, 2020 | National Geomatics Center of China [71] |
| Types | Decoupling States | Connotation | Decoupling Index | ||
|---|---|---|---|---|---|
| Decoupling | Strong decoupling | The level of urbanization rises while EP falls (ecological greenness rises). It shows that EP has been effectively controlled during urbanization. | <0 | >0 | <0 |
| Weak decoupling | The rate of increase in EP is less than the rate of increase in urbanization. | >0 | >0 | 0–0.8 | |
| Declining decoupling | The decrease in EP accompanies a decrease in the level of urbanization, and the change in EP is (negative) less than the level of urbanization. | <0 | <0 | >1.2 | |
| Coupling | Expansive coupling | The rate of increase in EP basically equals the rate of urbanization progress. | >0 | >0 | 0.8–1.2 |
| Declining coupling | The rate of EP reduction is almost equal to the rate of reduction in the level of urbanization. | <0 | <0 | 0.8–1.2 | |
| Negative decoupling | Expansive negative decoupling | EP is characterized by increases with the level of CUI, and the rate of increase in EP is markedly greater than the rate of urbanization advance. | >0 | >0 | >1.2 |
| Weak negative decoupling | EP decreases significantly less than the rate of CUI change. | <0 | <0 | 0–0.8 | |
| Strong negative decoupling | EP increases (i.e., ecological greenness browning) and urbanization levels regress. | >0 | <0 | <0 |
| Z | Trend Features | Percentage of Total Study Area (Excluding Water Areas) | ||
|---|---|---|---|---|
| CUI | EGI | |||
| > 0 | 2.58 < |Z| | Very significant increase/greening | 95.39% | 6.25% |
| 1.96 < |Z| ≤ 2.58 | Moderately significant increase/greening | 1.52% | 6.84% | |
| 1.65 < |Z| ≤ 1.96 | Slightly significant increase/greening | 0.67% | 3.49% | |
| |Z| ≤ 1.65 | No significant change | 1.59% | 23.48% | |
| < 0 | 0.70% | 26.30% | ||
| 1.65 < |Z| ≤ 1.96 | Slightly significant decrease/browning | 0.02% | 5.27% | |
| 1.96 < |Z| ≤ 2.58 | Moderately significant decrease/browning | 0.10% | 10.11% | |
| 2.58 < |Z| | Very significant decrease/browning | 0.01% | 18.26% | |
| = 0 | No change | |||
Disclaimer/Publisher’s Note: The statements, opinions and data contained in all publications are solely those of the individual author(s) and contributor(s) and not of MDPI and/or the editor(s). MDPI and/or the editor(s) disclaim responsibility for any injury to people or property resulting from any ideas, methods, instructions or products referred to in the content. |
© 2024 by the authors. Licensee MDPI, Basel, Switzerland. This article is an open access article distributed under the terms and conditions of the Creative Commons Attribution (CC BY) license (https://creativecommons.org/licenses/by/4.0/).
Share and Cite
Yang, S.; Zhong, L.; Zhou, Y.; Sun, B.; Wang, R.; Sun, Z.; Li, J. Interactions and Conflicts between Urbanization and Greenness: A Case Study from Nanjing, China. Remote Sens. 2024, 16, 2505. https://doi.org/10.3390/rs16132505
Yang S, Zhong L, Zhou Y, Sun B, Wang R, Sun Z, Li J. Interactions and Conflicts between Urbanization and Greenness: A Case Study from Nanjing, China. Remote Sensing. 2024; 16(13):2505. https://doi.org/10.3390/rs16132505
Chicago/Turabian StyleYang, Shengjie, Liang Zhong, Yunqiao Zhou, Bin Sun, Rui Wang, Zhengguo Sun, and Jianlong Li. 2024. "Interactions and Conflicts between Urbanization and Greenness: A Case Study from Nanjing, China" Remote Sensing 16, no. 13: 2505. https://doi.org/10.3390/rs16132505