Abstract
The eastern margin of the Tibetan Plateau is one of the regions with the most severe landslide disasters on a global scale. With the intensification of seismic activity around the Tibetan Plateau and the increase in extreme rainfall events, the prevention of landslide disasters in the region is facing serious challenges. This article selects the Bailong River Basin located in this region as the research area, and the historical landslide data obtained from high-precision remote sensing image interpretation combined with field validation are used as the sample library. Using machine learning algorithms and data-driven landslide susceptibility assessment as the methods, 17 commonly used models and 17 important factors affecting the development of landslides are selected to carry out the susceptibility assessment. The results show that the BaggingClassifier model shows advantageous applicability in the region, and the landslide susceptibility distribution map of the Bailong River Basin was generated using this model. The results show that the road and population density are both high in very high and high susceptible areas, indicating that there is still a significant potential landslide risk in the basin. The quantitative evaluation of the main influencing factors emphasizes that distance to a road is the most important factor. However, due to the widespread utilization of ancient landslides by local residents for settlement and agricultural cultivation over hundreds of years, the vast majority of landslides are likely to have occurred prior to human settlement. Therefore, the importance of this factor may be overestimated, and the evaluation of the factors still needs to be dynamically examined in conjunction with the development history of the region. The five factors of NDVI, altitude, faults, average annual rainfall, and rivers have a secondary impact on landslide susceptibility. The research results have important significance for the susceptibility assessment of landslides in the complex environment of human–land interaction and for the construction of landslide disaster monitoring and early warning systems in the Bailong River Basin.
1. Introduction
Globally, landslides remain the most dominant type of geological hazard in mountainous areas, causing a significant loss of life and damage to infrastructure every year [1,2], especially with intense seismic activity, extreme rainfall, and snowmelt events leading to an increasing trend of group-occurring landslides [3,4,5]. How to prevent landslide disasters with high efficiency and precision and low cost in vast mountainous areas has become an important challenge for the construction of geological disaster prevention systems in many countries. In the research on preventing regional landslide disasters, susceptibility assessment has become an important element that cannot be ignored and replaced [6]. Landslide susceptibility assessment is an important method for evaluating the possibility of landslide occurrence. By analogy with the environment in which landslides have occurred in the past, the likelihood of future landslides in each surveying unit (grid or slope unit) is evaluated [7]. The results have important practical value for disaster prevention planning, decision-making, and deployment of monitoring equipment within the region [8]. The traditional assessment of landslide susceptibility mainly relies on on-site investigation, recording by researchers, and feedback from ground contact monitoring equipment [9]. Although the evaluation results of these methods are accurate and reliable, they are inefficient and require a great deal of manpower and financial resources, especially in high-altitude mountainous areas with complex terrain conditions, which heavily rely on geological surveys to obtain landslide inventories. It is unrealistic to conduct a landslide susceptibility assessment based on investigation and monitoring in mountainous areas ranging from hundreds to tens of thousands of square kilometers. This phenomenon has been completely improved with the popularization of high-precision remote sensing image, DEM (Digital Elevation Model), geological map, rainfall, and other refined data, as well as the significant improvements in software and technical performance, such as Geographical Information System platforms [10,11,12].
In recent years, methods of landslide susceptibility assessment driven by big data have significantly taken a dominant position and begun to play an increasingly important role. In addition to the development of air–space–ground remote sensing technology that provides a large amount of high-quality geographic data for landslide disaster analysis, end-to-end machine/deep learning technology can automatically fit labeled datasets without the need for in-depth research on complex landslide mechanisms to achieve prediction of potential locations of landslide occurrence [13]. Models for evaluating landslide susceptibility have emerged in large numbers with the deepening of research [14,15]. However, it is widely believed that different models have adaptability issues for the environment and scale [16,17]. Therefore, selecting advantageous models suitable for regional features from a large number of models has become a key step in conducting susceptibility assessments in complex regions. The rapid development of artificial intelligence (AI) technology in recent years has provided broad prospects for solving this issue and has achieved success in various geological hazard assessments [14,18,19]. In addition, the advantage of using machine learning for landslide susceptibility assessment is that it can quantitatively reveal the relative contribution of different factors to landslide development among numerous influencing factors [12,13]. The significance of regional disaster prevention lies precisely in the targeted prevention and control of landslide development based on specific factors, which is also the most important value of landslide susceptibility assessment.
The eastern margin of the Tibetan Plateau is a globally renowned zone of rapid terrain change, with active tectonic movements, strong river incision and downcutting, and high population density [1,2], which makes it one of the most severe areas for landslide disasters in the world. The complex geological environment, extremely variable climate, and excessive human activities have caused landslides in the region to be characterized by suddenness, group occurrence, and multi-type concurrency, making prediction and management extremely difficult. Due to various factors such as terrain conditions, vegetation coverage, and disturbance by human activities, it is difficult to systematically catalog and evaluate the susceptibility of landslides in this area. In order to effectively mitigate the risk of landslide disasters and carry out systematic monitoring in the key areas, this article selects the Bailong River Basin on the eastern margin of the Tibetan Plateau as the research area. Using machine learning methods, the optimal model for evaluating susceptibility in alpine-gorge areas is selected from various algorithms, and quantitative evaluation of the main factors that affect landslide development is attempted. The final results can provide scientific reference for the monitoring and early warning of landslides in the complex human–land interaction environment on the eastern margin of the Tibetan Plateau.
2. Study Area
The Bailong River is located at the intersection of the eastern margin of the Tibetan Plateau and the West Qinling Mountains (Figure 1) and is a secondary tributary of the Yangtze River and a primary tributary of the Jialing River. With the development of large-scale fault zones and intense topographic relief, the Bailong River Basin has become one of the most serious regions for landslide disasters in China under the combined effects of earthquakes, heavy rainfall, and human engineering activities [20,21]. The total population within the watershed exceeds one million, mainly distributed in the valley and hillslope zones on both sides of the Bailong River. Long-term tracking investigations have found that due to high population density and a scarcity of land resources, the widespread utilization of old landslides as buildings, roads, and agricultural land is one of the main reasons for serious landslide disasters. The risk of landslide reactivation forming is a serious threat to the lives and properties of local residents. For example, on 12 July 2018, a large-scale landslide in Nanyu Township, Zhouqu County was reactivated, and the landslide deposit blocked most of the Bailong River channel to form a dam and backwater, causing the water level of the Bailong River to rise by 8 m in a short period of time, flooding the bridges, roads, hydropower stations, and most residential buildings in Nanyu Township [22]; and on 19 July 2019, the Yahuokou landslide, which was a long strip-shaped landslide formed along a groove of the fault zone, reactivated with a length of up to 2.0 km and an average width of less than 100 m. After the landslide occurred, it destroyed the village roads and the factory buildings at the lower edge of the slope that were perched on the old landslide body [23]; on 16 August 2020, a continuous heavy rainfall event in the Bailong River Basin triggered a large number of shallow landslides, causing serious economic losses and ecological damage; and on 18 January 2021, the Lijie landslide in Beishan Village, Zhouqu County, was reactivated, which led to the emergency evacuation of thousands of people in the township [24]. The above cases are only the tip of the iceberg of landslide disasters in the Bailong River Basin.
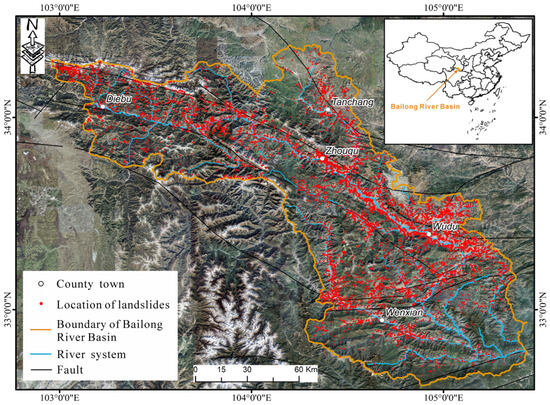
Figure 1.
The distribution of historical landslides in the Bailong River Basin.
The serious geological disasters that occur in the Bailong River Basin arise first from the geological structural conditions. Driven by the far-field stress caused by the expansion of the Tibetan Plateau, the collision between the Bailongjiang Block and the Bikou Block formed structural characteristics of the basin [25], with a stratigraphic structure mainly composed of Carboniferous to Triassic limestone nappes and lower Silurian weak phyllite. Since 1.7 Ma, the rapid downcutting of rivers has led to the abundant exposure of weak phyllite and carbonaceous slate. As a result, earthquakes and rainfall have become the main triggering factors for landslides in the limestone nappe and phyllite areas, respectively. The dry–hot valley climate within a local area is another important reason for the frequent occurrence of landslides. Since the 1950s, extensive deforestation has directly contributed to the exacerbation of the dry–hot valley climate in the basin, with frequent occurrences of extreme rainfall events. Therefore, under the coupling and synergistic effect of internal and external factors, this area has become an ideal site for landslide development.
Despite the extreme development of historical landslides in the Bailong River Basin, a systematic landslide inventory is still lacking. The previous records of landslides in this area mainly include sites of landslides on both sides of highways and river channels that pose a threat; however, there is a lack of specific parameter indicators such as range and area, making it difficult to use these records for susceptibility assessment. Historical landslide inventories are an important foundation for studying spatial distribution patterns, susceptibility assessment, risk evaluation, and formation mechanisms [26]. Qi utilized the popularization of high-resolution remote sensing images and compiled a historical landslide database of the entire watershed for the first time through remote sensing interpretation combined with on-site verification, as shown in Figure 1 [27]. This inventory covers 6609 landslides in the Bailong River Basin, including 140 giant landslides, 2619 large landslides, 3176 medium-sized landslides, and 674 small landslides. Visual inspection reveals that landslides in this area are mainly distributed along fault zones and on both sides of river valleys, closely related to the scope of human distribution and activity. Therefore, it is urgent to conduct a landslide susceptibility assessment in this area to provide a foundation for systematic disaster prevention and reduction planning.
3. Methods and Materials
3.1. Selection of Evaluation Factors
The reason why the complex geological environment and the scope of human activities easily become the ideal development areas for landslides is that these areas contain almost all the necessary factors that induce and affect the occurrence of landslides. The Bailong River Basin is located at the junction of the eastern margin of the Tibetan Plateau and the West Qinling Mountains. It is the transition zone of China’s first- and second-order terrain steps. During the formation of the Qinling Mountains in the Indosinian and the uplift of the Tibetan Plateau in the Cenozoic, it experienced strong crustal uplift and thrust compression, resulting in the formation of a wide distribution of fault fracture zones, accompanied by the erosion of rivers, resulting in the formation of a landscape with ridges and valleys. The region has a typical mountain climate, and extreme rainfall events are the main external factors inducing landslides. In recent years, intensive human activities have had a profound impact on the formation and development of landslides in the study area. Based on this background, the landslide control and inducing factors considered in this paper involve a wide range of fields, including terrain (slope, aspect, altitude, local relief, plane curvature, profile curvature, topographic wetness index, surface roughness, water system), geological structure (lithology, fault layer, topographic/bedding-plane intersection angle (TOBIA) [28]), material conditions (land use, soil type, Normalized Difference Vegetation Index (NDVI)), and human activities and rainfall (road, population density, annual rainfall). Each factor may become a direct or indirect inducing condition of landslides. Table 1 briefly describes the types and sources of these factors. The extraction of geomorphic factors is based on DEM data with a resolution of 12.5 m (from Japan Aerospace Exploration Agency’s ALOS satellite); the geological factors are derived from the 1:50,000 and 1:100,000 geological maps of China; the soil data and land use data are from the global land-cover product with fine classification system at 30 m using time-series Landsat imagery [29]; NDVI data is from GF-1 8 m resolution satellite data; road data is obtained by interpreting Google Earth image with 1 m resolution; and rainfall data are from the monitoring data of rainfall stations in Bailong River Basin.

Table 1.
Fields and characteristics of the spatial database.
3.2. Data Preprocessing
Among the selected factors, some of them may have strong correlation to a certain extent, showing an approximate linear relationship, which will disrupt the regression and fitting process of the model and affect the stability of the model operation [30]. The strong correlation of factors has an impact on the regression and fitting process: the regression and fitting of the model aims to find the relationship between each factor and the target variable. Assuming that the correlation between the two factors is too close, the change of one factor may lead to the corresponding change of the other factor when dealing with the conditional factor and the target variable, so it is impossible to fix other conditions to analyze the impact of a single factor on the output result, because one factor in the fitting will be mixed with the impact of another factor. Therefore, collinearity analysis is the first step in regression and fitting.
3.3. Selection of Machine Learning Algorithms
With the rapid development of artificial intelligence technologies, machine learning has flourished in various industries since the 1990s with significant achievements, including the implementation of neural networks, the development of boosting algorithms, and increased accessibility to internet-derived and digital data. Machine learning was first used in the field of landslides in the early to mid-2000s, where machine learning modeling demonstrated strong superiority in terms of arithmetic power and predictive accuracy compared to traditional physical-based models, heuristic models, and statistical models, with many machine learning models having predictive accuracies of 90% or more. A lot of popular machine learning algorithmic architectures appeared in the following years, including Logistic Regression, Support Vector Machine, Decision Tree, Random Forest, Bernoulli-NB and Gaussian-NB, Bagging Classifier, K-Nearest Neighbors, and Gradient Boosting algorithms, etc. [19]. However, to date, there is no consensus on which machine learning algorithms are “best suited” to predict landslide susceptibility areas. Many studies have shown that the prediction accuracy of data-driven landslide susceptibility modeling is affected not only by the quality of the data of landslide inventory and landslide condition factors but also by the underlying quality of the machine learning algorithms used [31]. Therefore, in order to compare the adaptability of different models in complex geological environments, we selected 17 models that are most widely used in landslide susceptibility assessment to screen the most suitable models for this study area. The characteristics of these algorithms are shown in Table 2.
Table 2.
Selected algorithms and characteristics.
3.4. Parameter Preprocessing
The assessment of landslide susceptibility prediction results is mainly used to test the performance and operation of landslide susceptibility prediction models subjected to various uncertainty issues and is a very important step in the modeling of landslide susceptibility prediction [3]. The results are evaluated in order to prove the validity of the study; therefore, almost every paper includes a performance evaluation of landslide susceptibility prediction. Currently, there are numerous evaluation parameters in susceptibility modeling, and the widely used evaluation parameters include the following: i. ACC, which indicates the rate of correctness of all samples involved in the modeling; ii. PPV, which is the proportion of correctly predicted positive instances to the proportion of all predictions that are positive; iii. TPR, which indicates the rate of recall or the rate of checking for completeness; iv. TNR, indicating the ability to predict negative instances; v. AUC, indicating the area under the receiver operating characteristic curve (ROC); the value indicates the degree of fit and reflects the balance between sensitivity and specificity; and vi. TSA, which indicates the correctness rate of the samples that do not participate in model training, reflecting the generalization of the model. Of the above, ACC is the most widely cited. This paper also uses this method to evaluate the model.
These terms are listed in Table 3 and are defined as follows:
Table 3.
Confusion matrix results.
True positive (TP): the predicted class is positive, and the prediction is consistent with the actual situation;
False positive (FP): the predicted class is positive, and the prediction is opposite to the actual situation;
True negative (TN): the predicted class is negative, and the prediction is consistent with the actual situation;
False negative (FN): the predicted class is negative, and the prediction is opposite to the actual situation.
4. Results
4.1. Collinearity Analysis of Factors
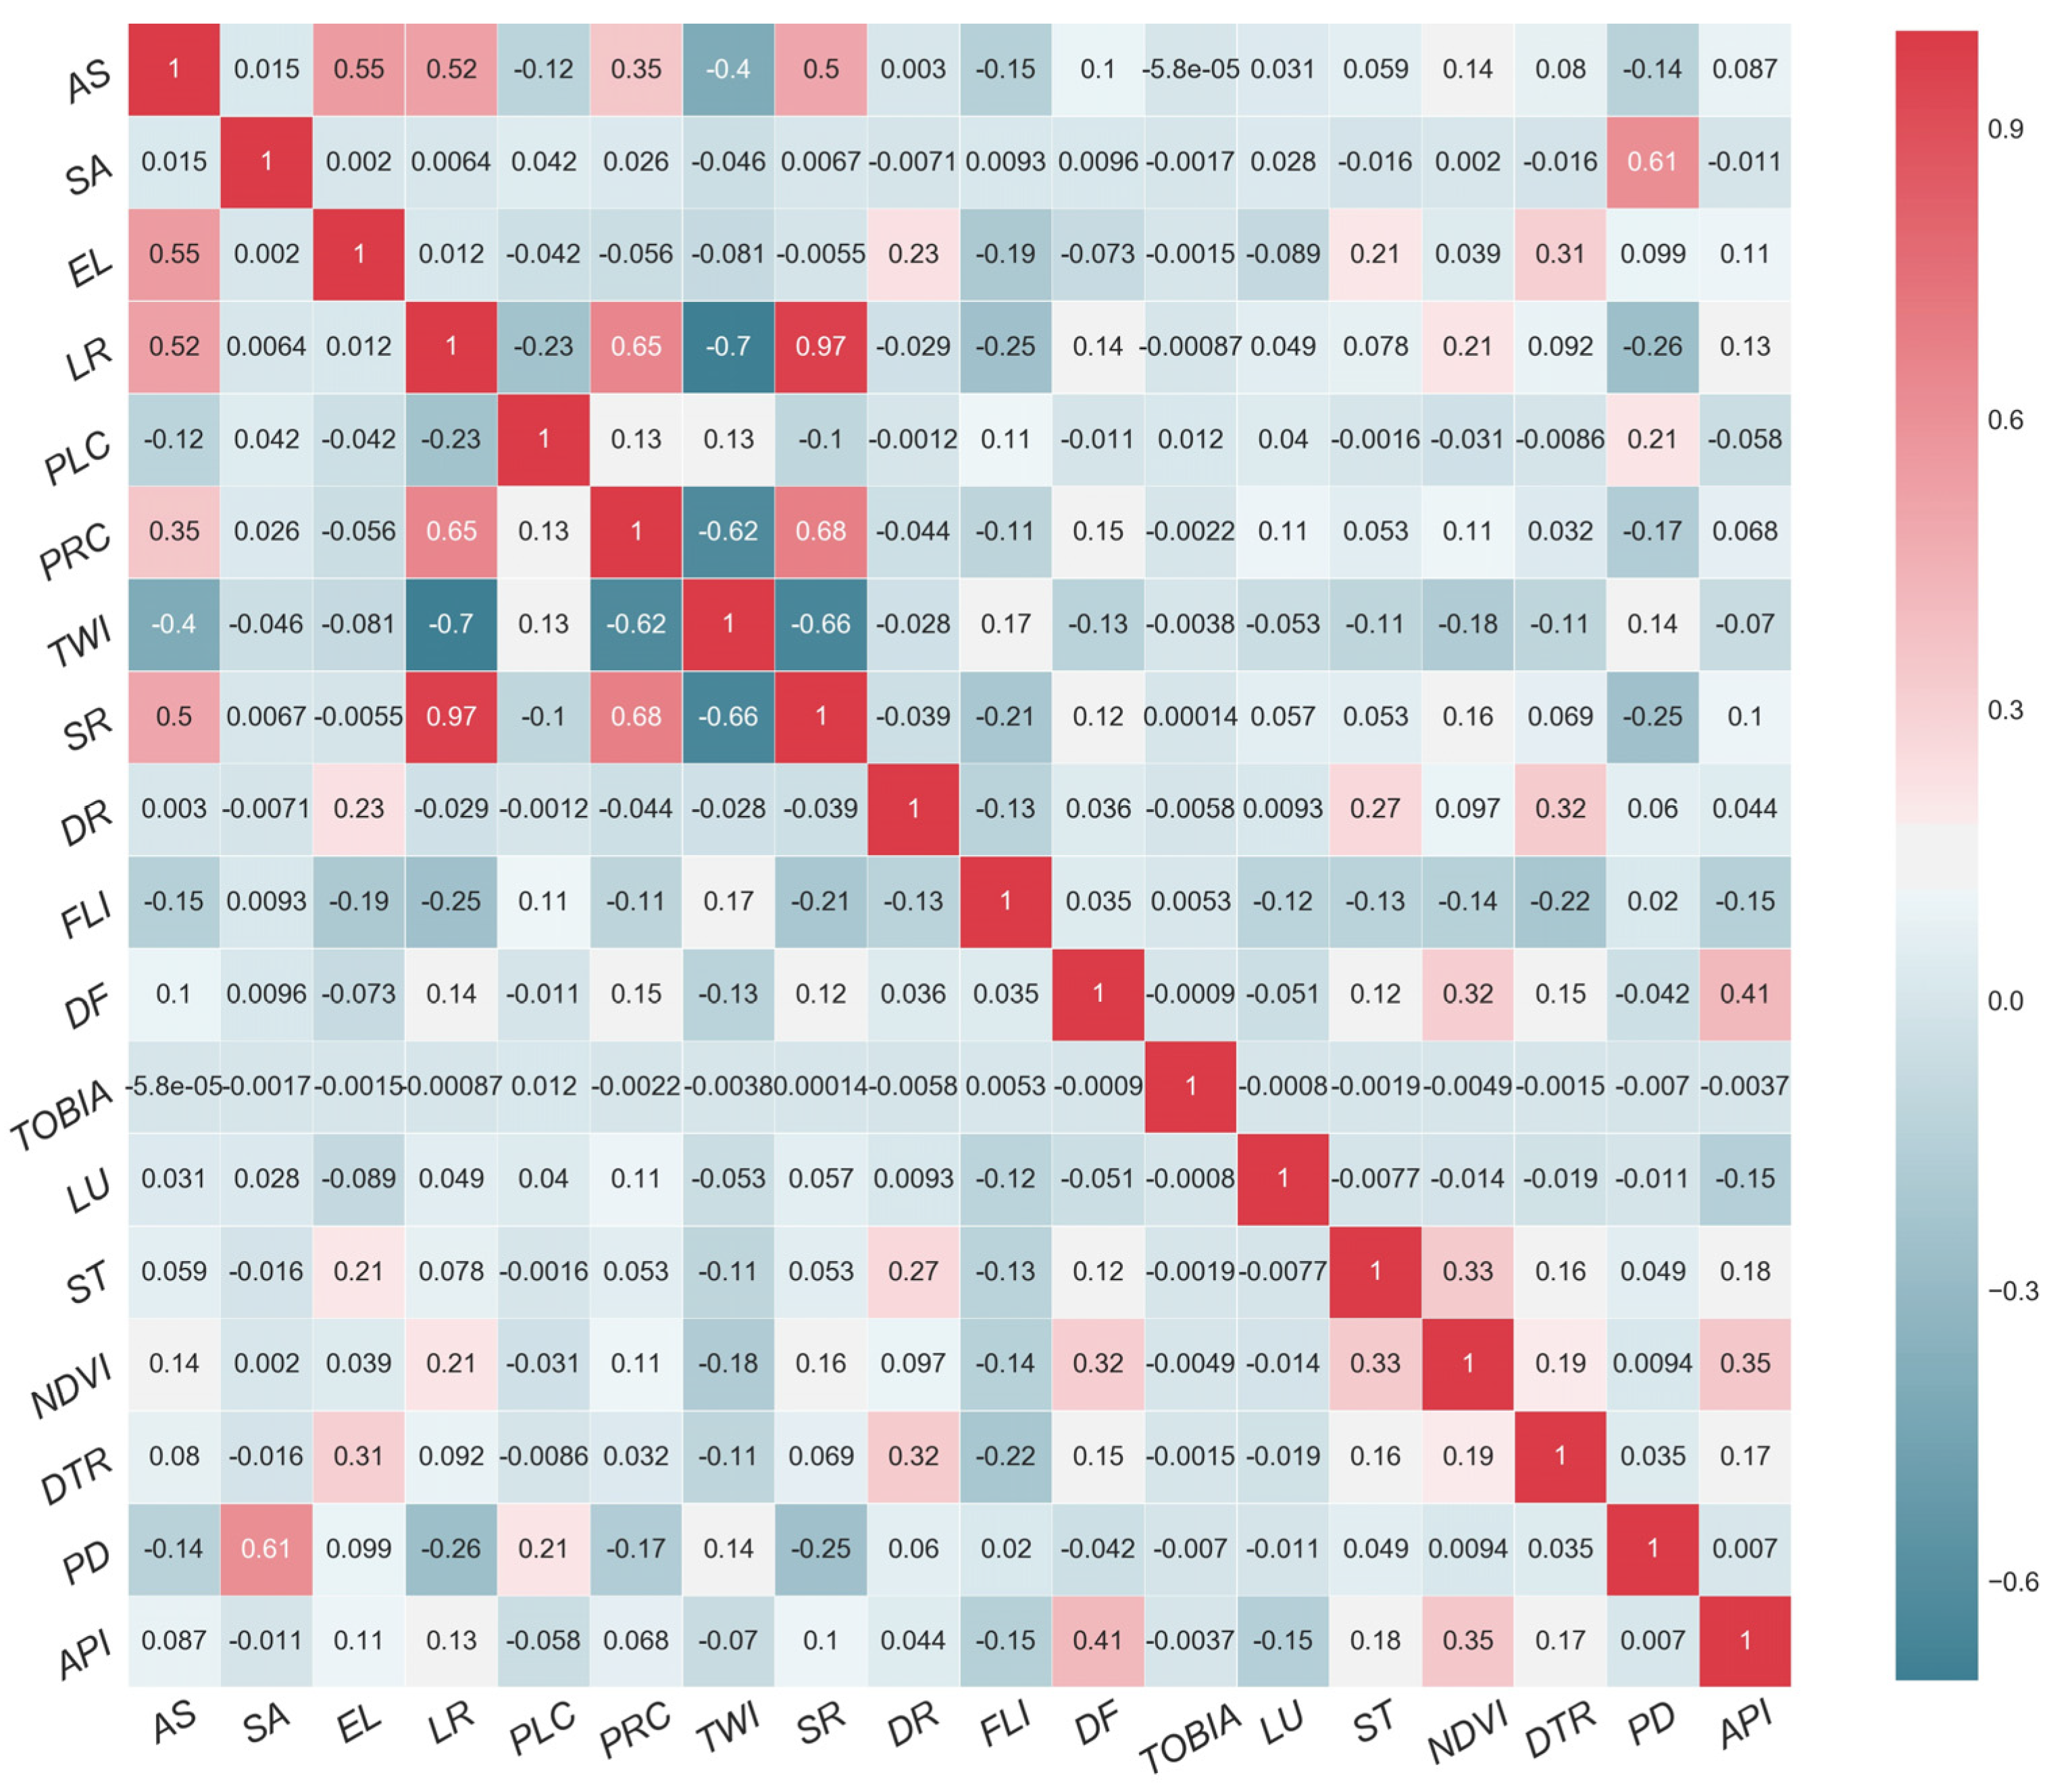
In this paper, the collinearity analysis of machine learning is used to calculate the heat map of the correlation matrix of the selected parameters (Figure 2), which is based on Seaborn Python 2.7, https://seaborn.pydata.org/generated/seaborn.heatmap.html#seaborn.heatmap (accessed on 15 October 2021). The main purpose of visual calculation is to eliminate the collinearity problem of the selected parameters. In the matrix heat map, it can be found that there is a high correlation between SR and LR, and we removed the parameters with a correlation coefficient > 0.7, as proposed by Dormann et al. [30]. Therefore, in this study, we exclude the factor of surface roughness index (SR) and select the other 17 factors for model screening.

Figure 2.
Correlation heatmap of influencing factors.
4.2. Evaluation and Optimization of Models
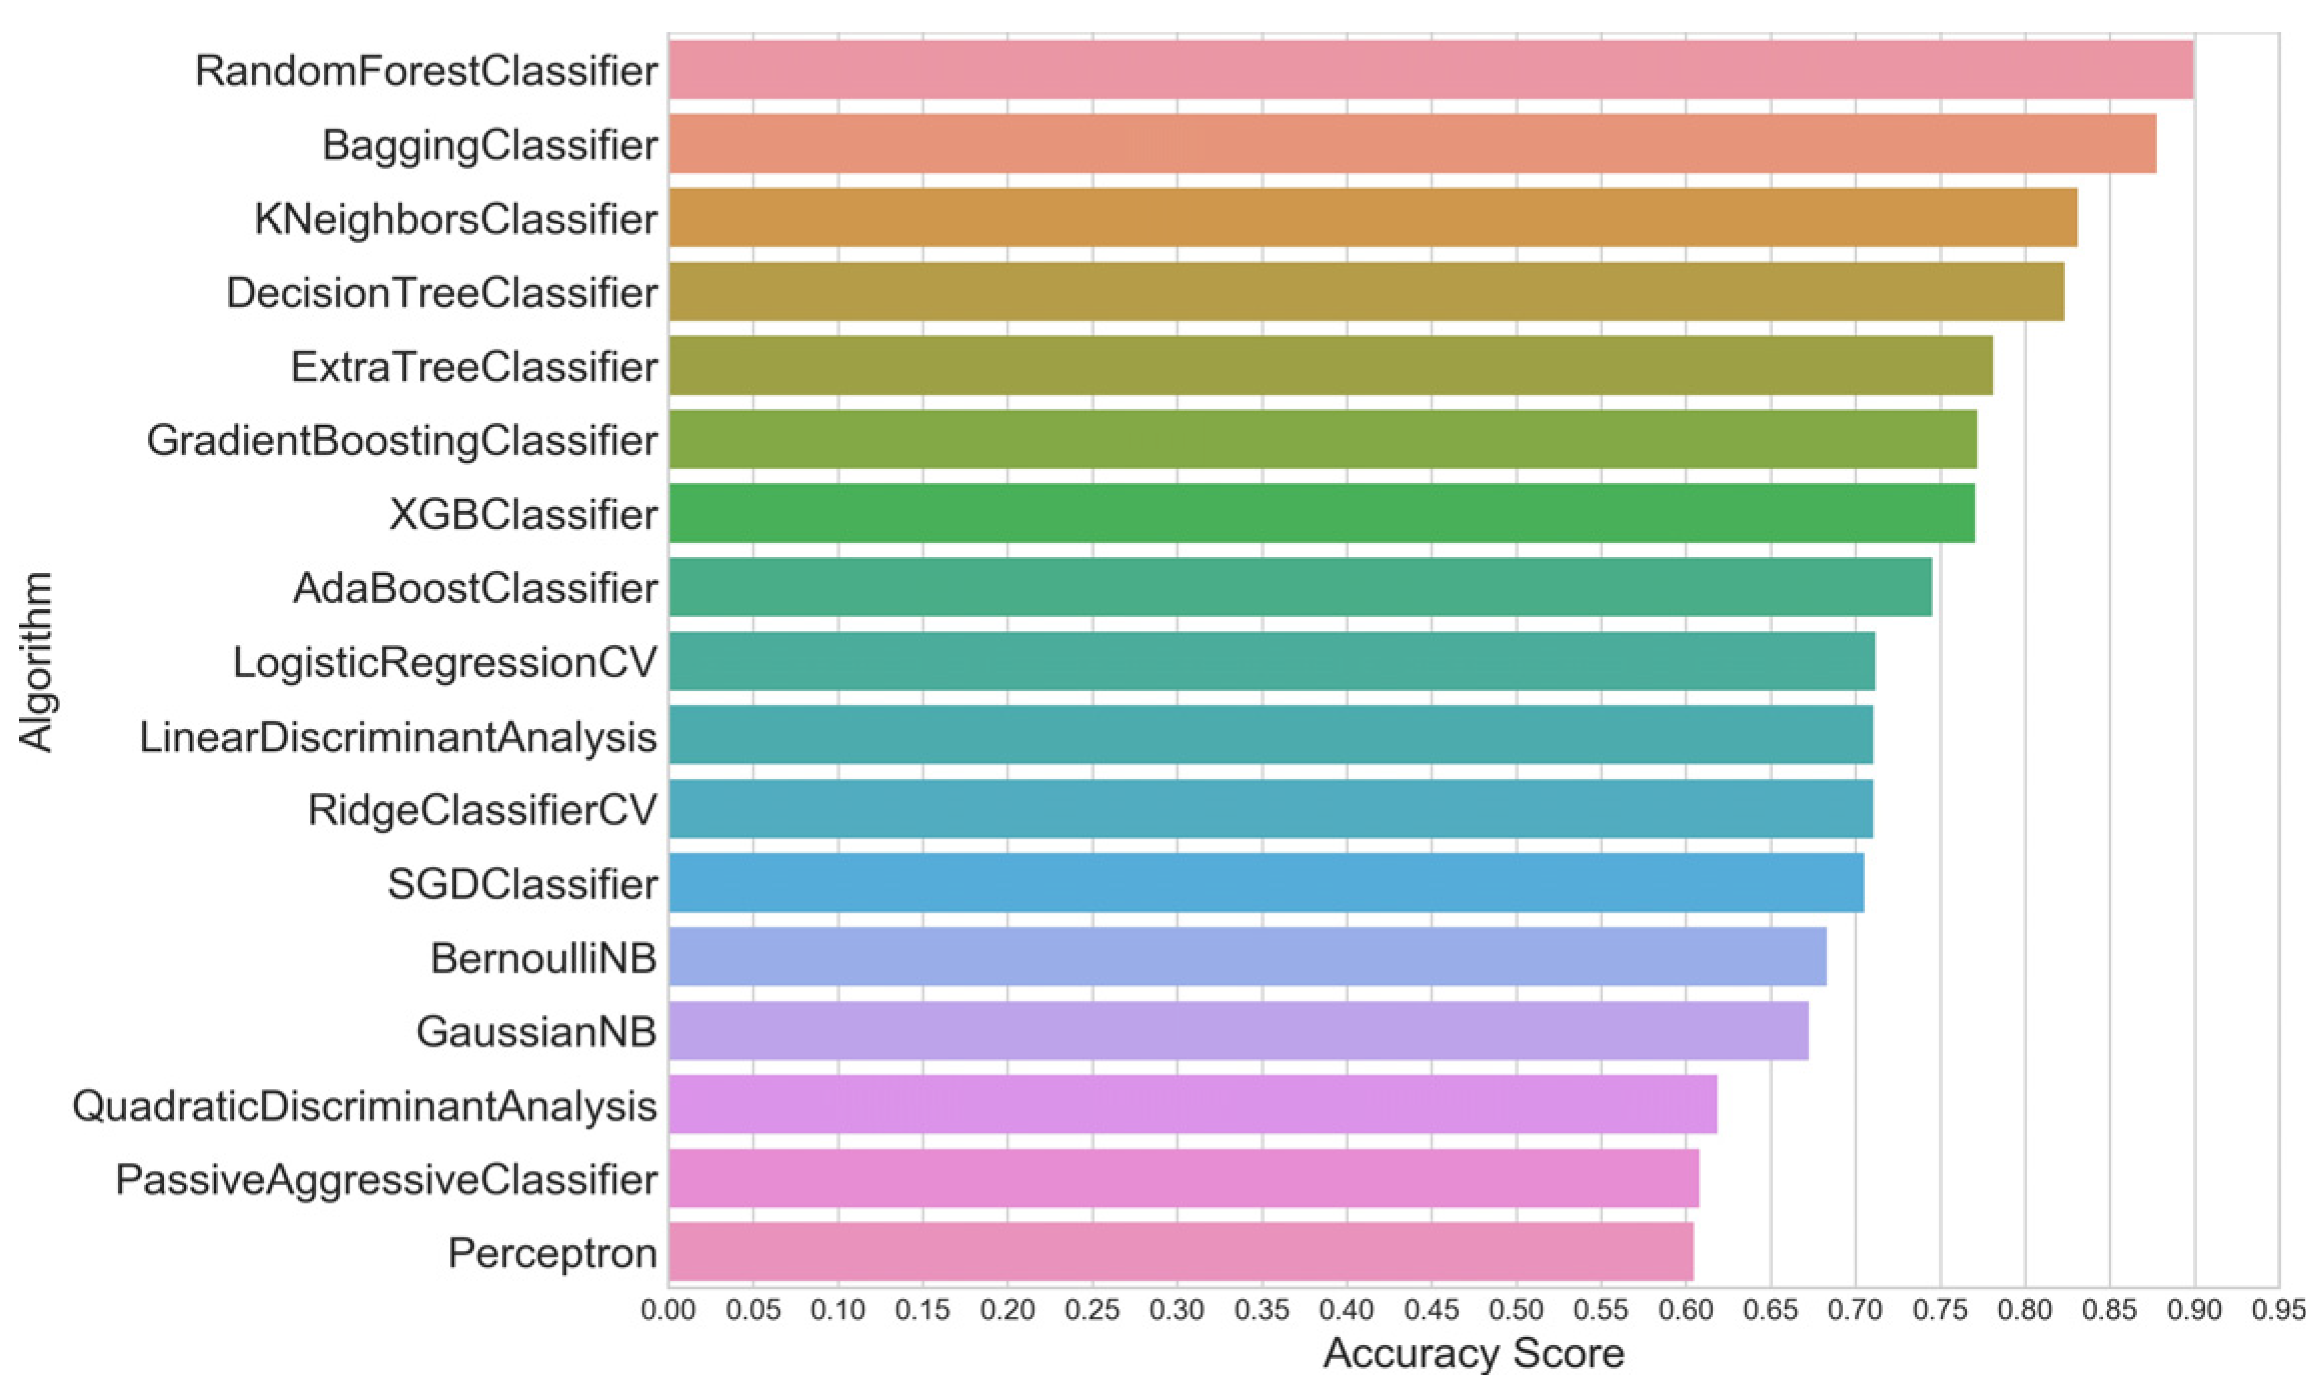
The initial model is trained using the data in the cross-validation training data set, and then, the results of the models are ranked according to the average accuracy score (ACC) of the test data in the cross-validation dataset. Finally, the model evaluation score is generated, as shown in Figure 3. Among the evaluation results of all models, the results of the ensemble models are better than those of other models, and the calculation results of all models are greater than 0.6. Among these, RandomForestClassifier has the highest score of 0.9, followed by BaggingClassifer at 0.87.

Figure 3.
Ranking of model accuracy scores.
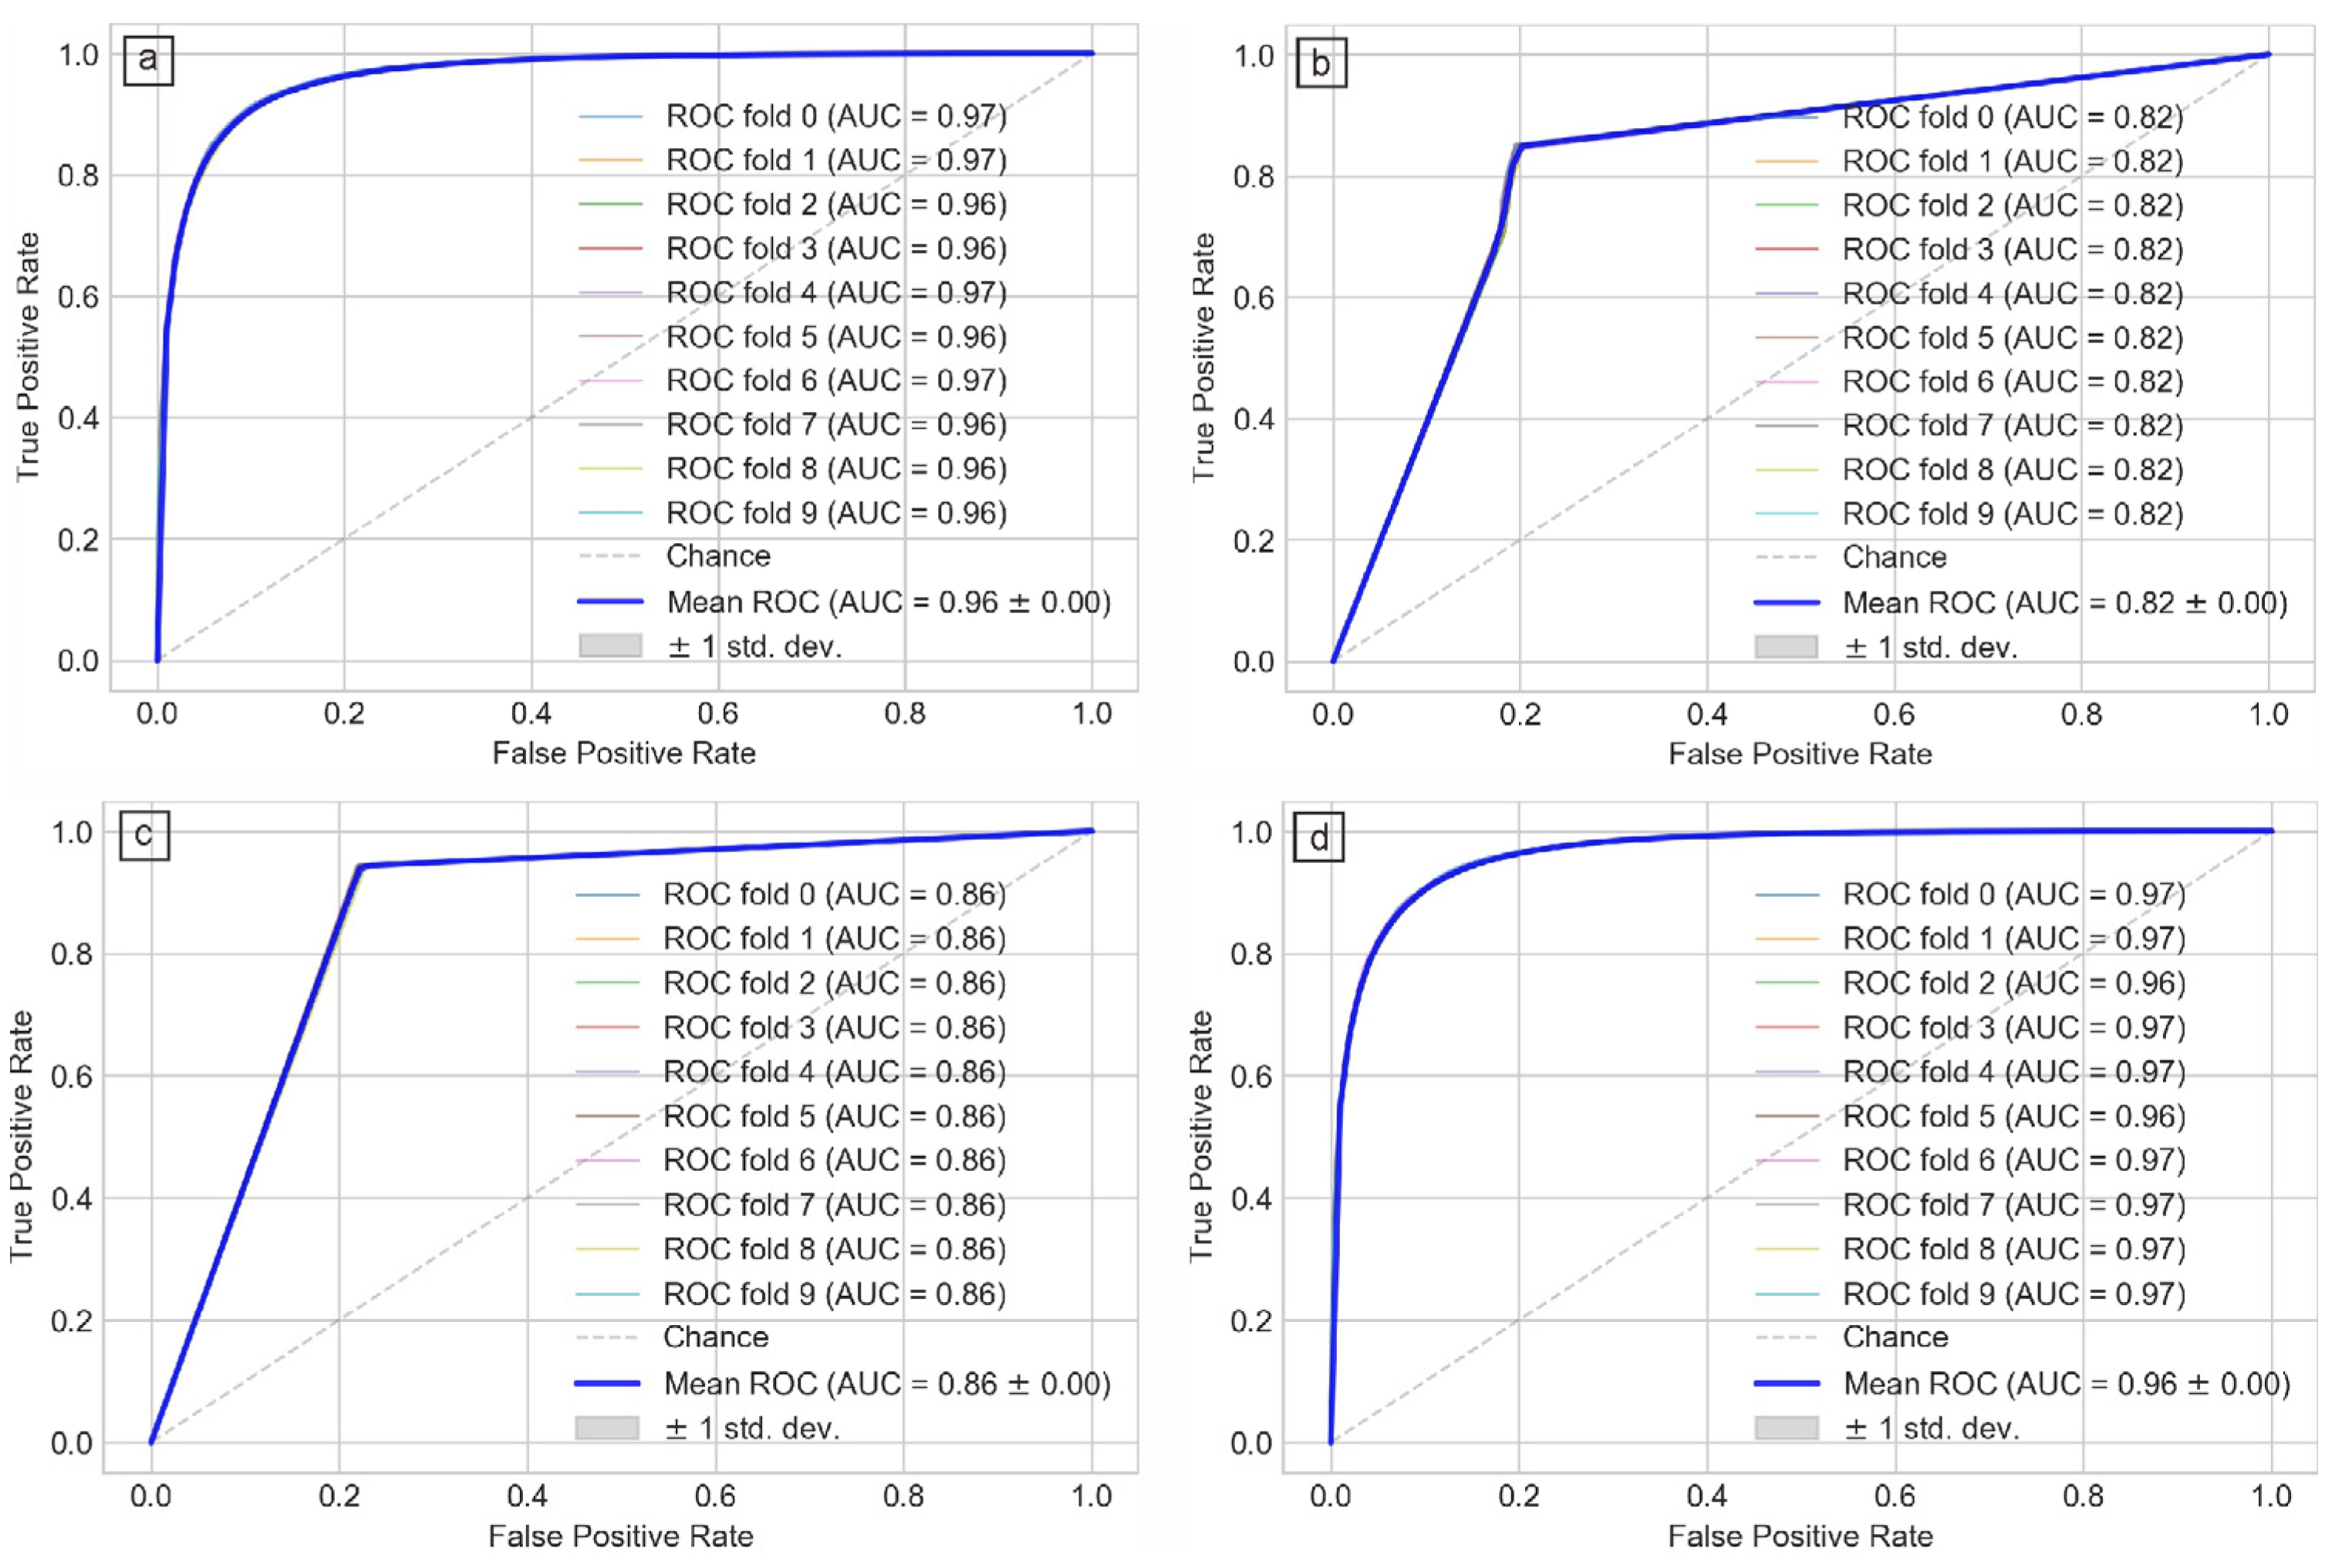
In order to improve the accuracy of these models, this paper chooses to optimize the model with the top four scores in the initial prediction. The optimization method uses the parameter grid method and grid search cross-validation method to fit the model, find the best super parameter through the ACC score, cross-validate the training set of the model 10 times according to the optimal super parameter of each model (Figure 4), and reorder the model according to the average accuracy score of the test data. After optimization, the performance of all four models has been improved (Figure 5). BaggingClassifier has the largest improvement, surpassing RandomforestClassifier as the best model. For BaggingClassifier, the ACC test data of 10 cross-verifications is 0.91, and the average AUC is 0.96. The performance of the other three models has also improved after optimization, but the extent of improvement is relatively small. After evaluation, the predicted probability of the BaggingClassifier model was finally chosen to map the landslide susceptibility of the Bailong River Basin.
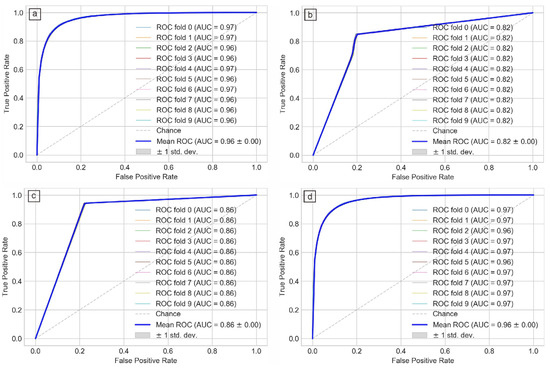
Figure 4.
ROC curve and AUC value of four models with 10 cross-validations, (a) BaggingClassifier; (b) DecisionTreeClassifer; (c) KNeighborsClassifer; (d) RandomForestClassifier.
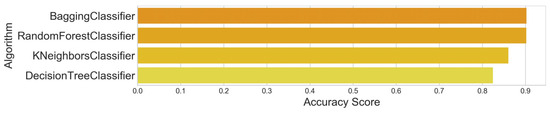
Figure 5.
Ranking of ACC scores after model optimization.
4.3. Landslide Susceptibility Mapping
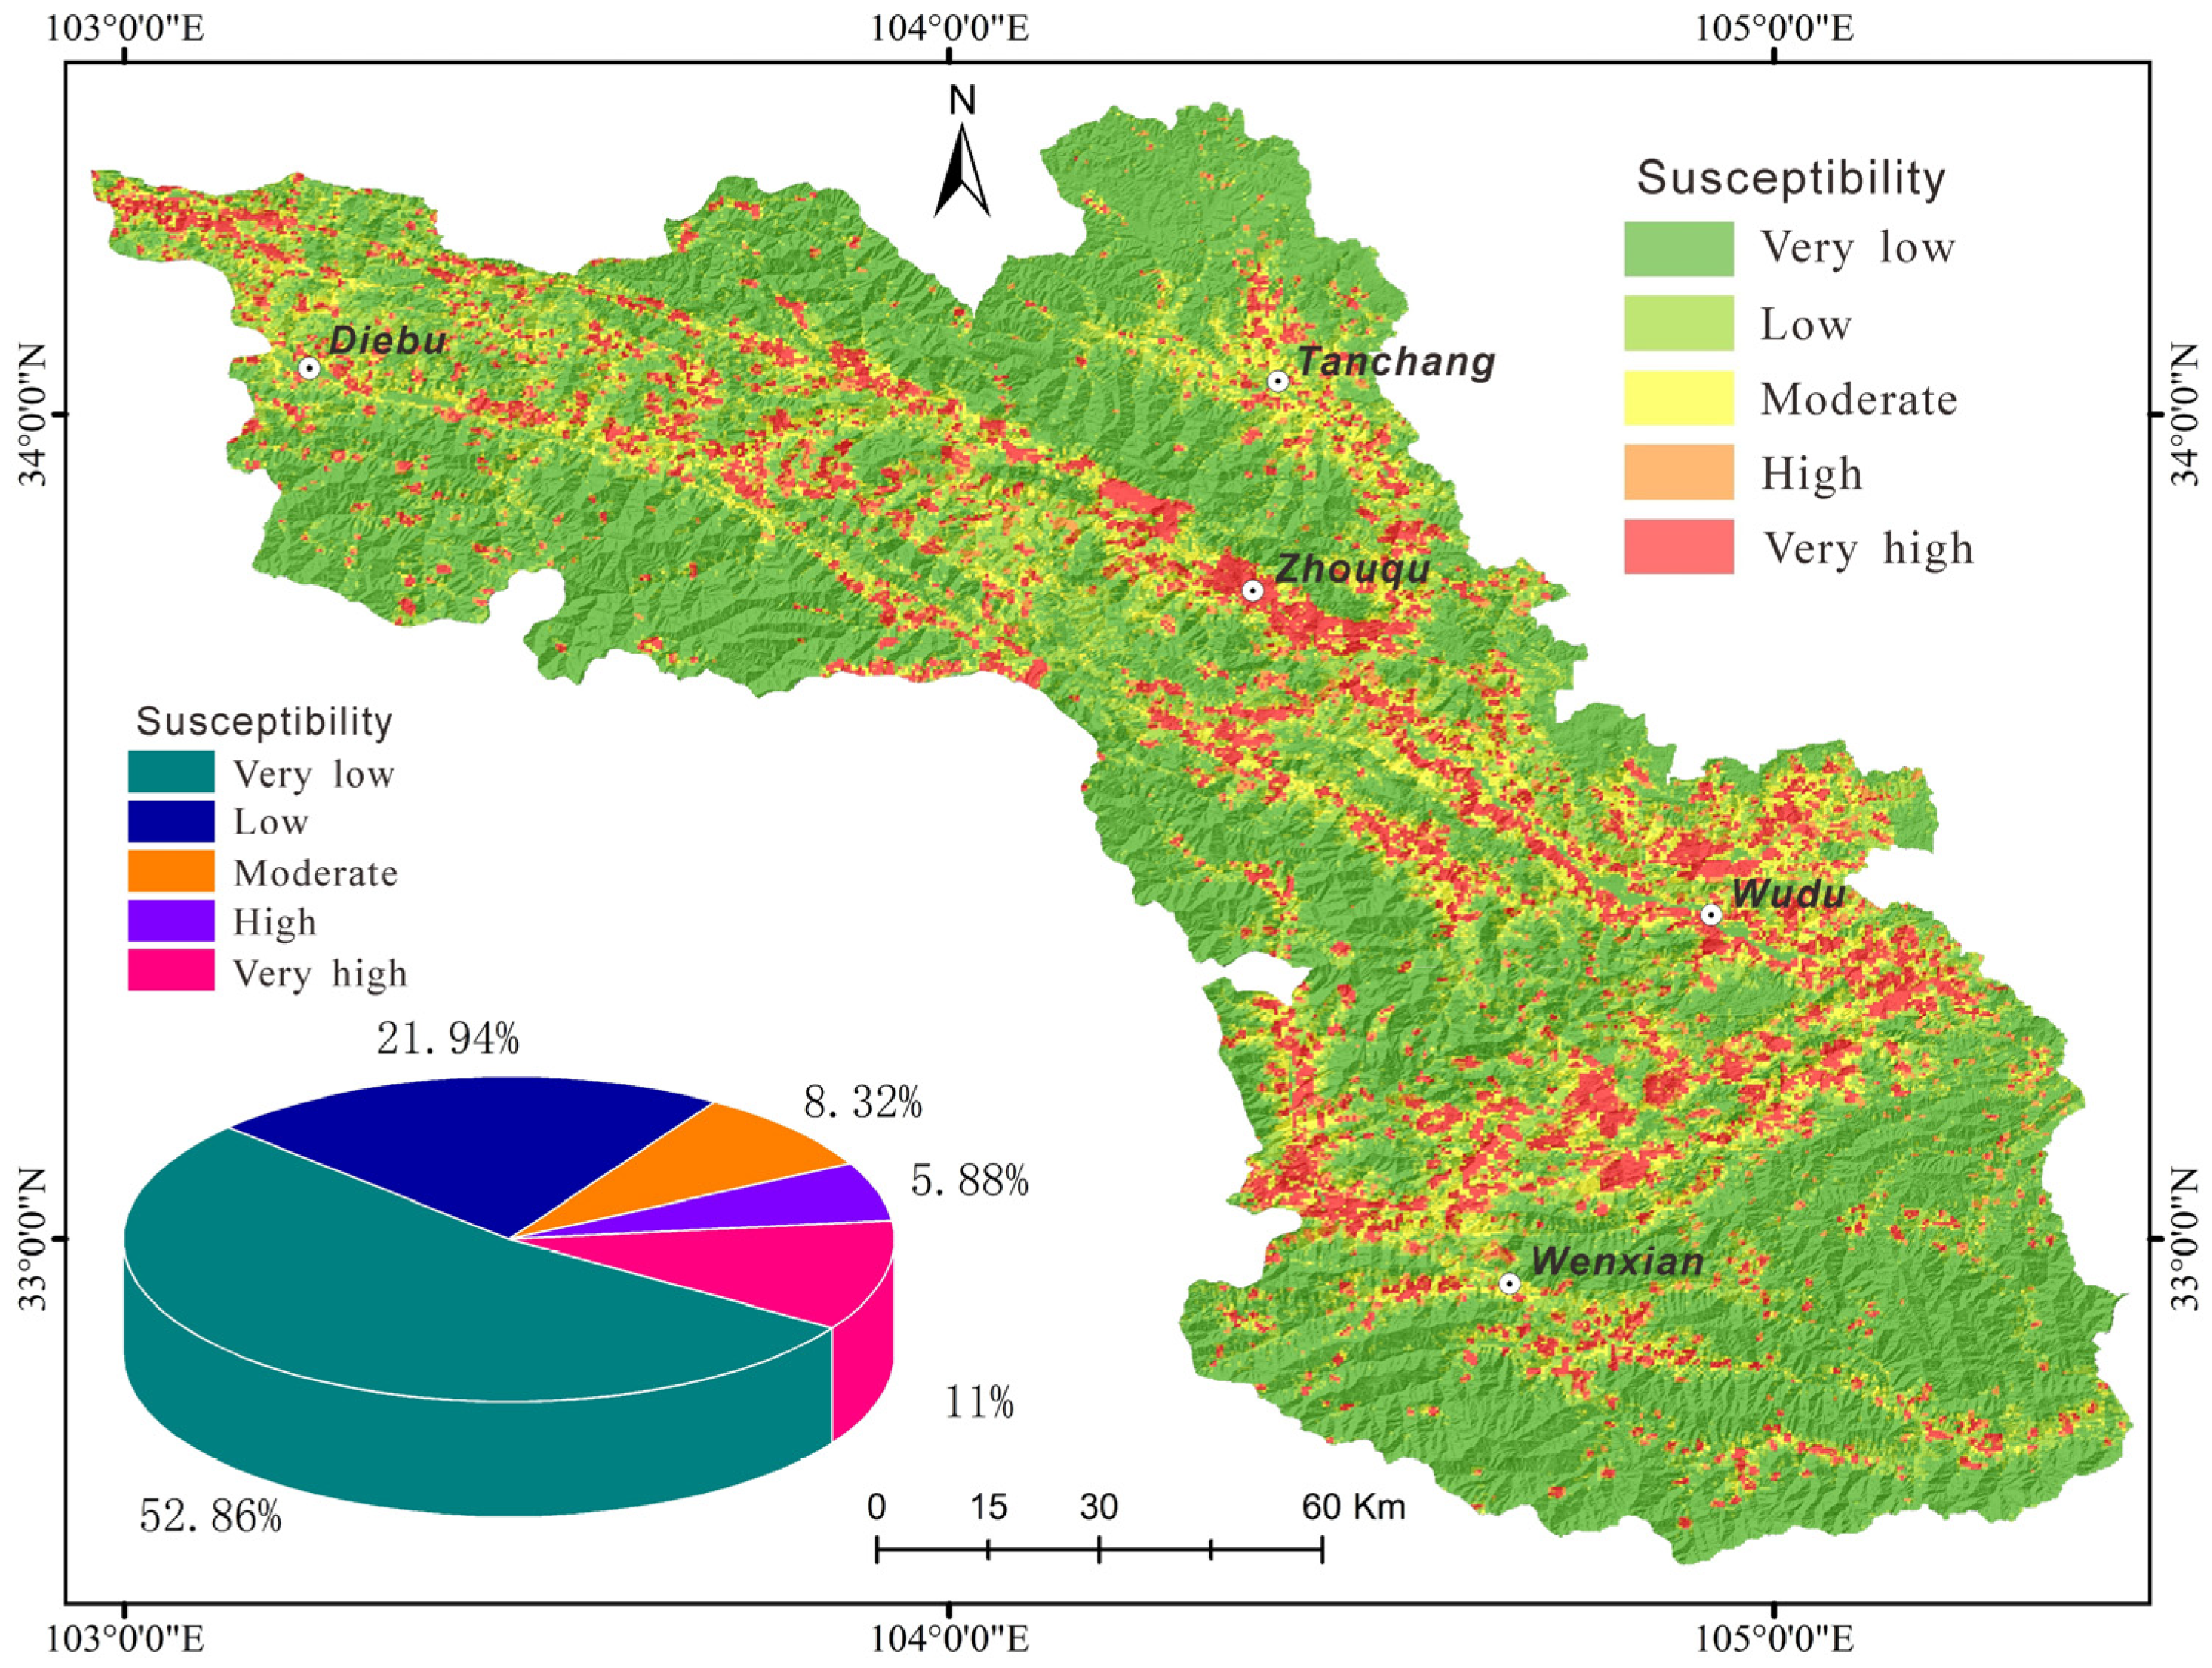
The results of landslide susceptibility assessment in the Bailong River Basin predicted by the BaggingClassifier model are shown in Figure 6. The prediction result of susceptibility is a probability value between 0 and 1. According to the classification principle of the natural discontinuity method, the susceptibility result is divided into five intervals: very low (0–0.08), low [0.08–0.19), moderate [0.19–0.39), high [0.39–0.88), and very high [0.88–1). The proportion of area occupied by each susceptibility zone within the watershed varies. According to the statistics of the area and proportion of susceptibility areas, the area ratio of the first four types of susceptibility gradually decreases in proportion to the area as the level increases. The very low susceptibility areas accounted for more than half of the total area of the region, accounting for 52.86%, and the low susceptibility areas accounted for 21.94%. The moderate and high susceptibility areas accounted for the lowest proportion in the whole basin, accounting for 8.32% and 5.88%, respectively. The area of very high susceptibility areas reached 2009.6 km2, accounting for 11% of the total basin area. The distribution of susceptibility in the basin shows the characteristics of a large proportion of low and moderate susceptibility areas and a concentrated distribution of high susceptibility areas.

Figure 6.
Distribution map of landslide susceptibility assessment in Bailong River Basin.
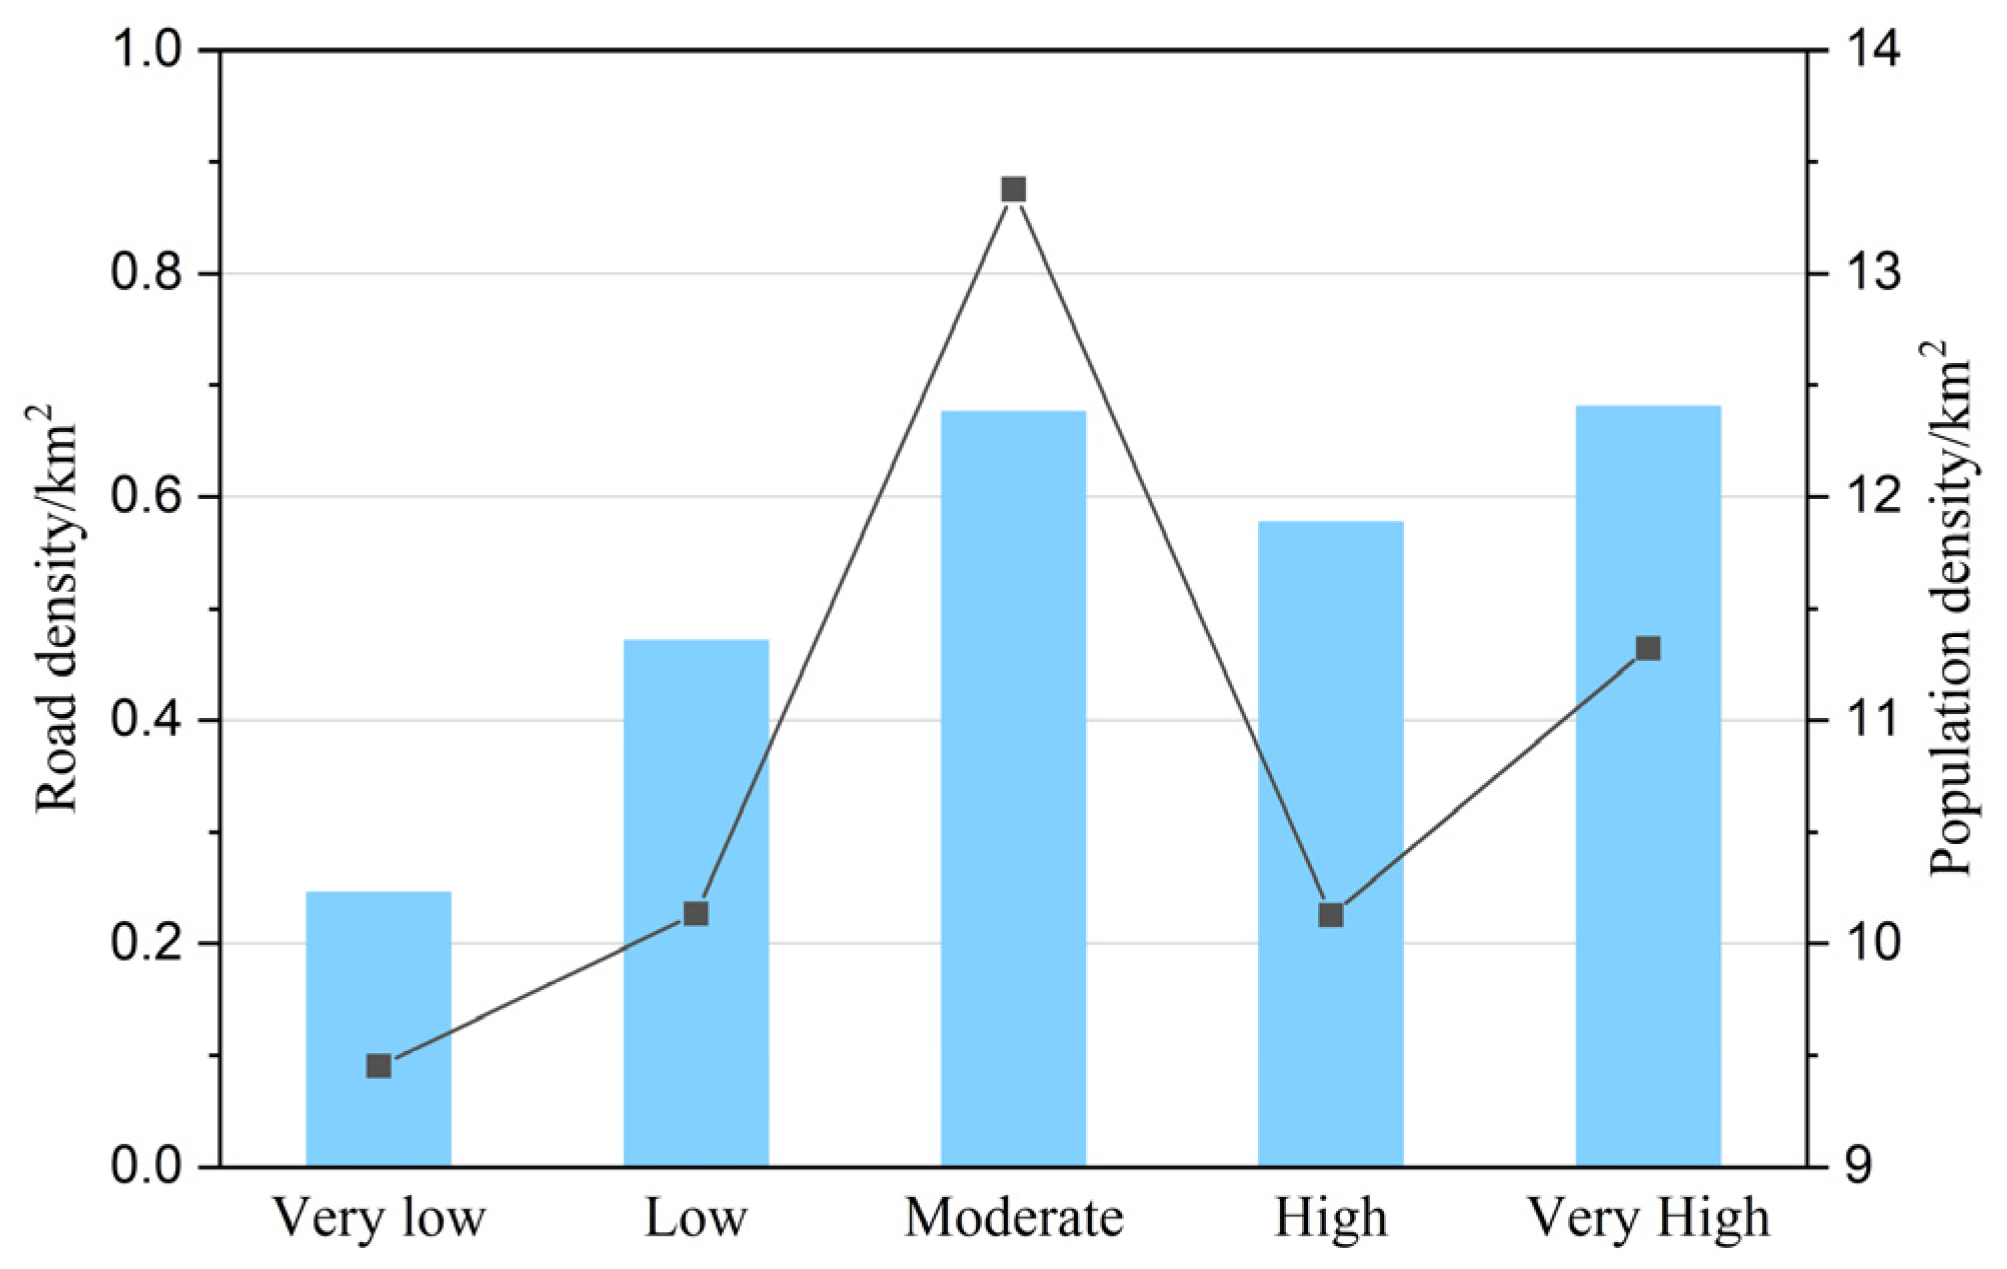
The prediction results of landslide susceptibility in the Bailong River Basin show that the low susceptibility areas in the basin are mainly located in the north and south areas of Tanchang, the south of Diebu, and the south of Wenxian, which are mainly areas with high vegetation coverage and sparse distribution of faults. The vegetation has a certain protective effect on the surface. The distribution range of high and very high landslide susceptibility areas is closely related to the distribution of river systems and faults in the basin. In the upstream area of Wudu, the very high susceptibility areas are mainly distributed along the main course and primary tributaries of the Bailong River. In the upstream of the Bailong River, very high susceptible areas are mainly distributed along the banks of the main course and primary tributaries of the Bailong River. In the downstream of Wudu, the high and very high susceptibility areas at the bend of the Bailong River are still distributed along both sides of the river. However, there are also large areas of very high susceptibility areas in the area north of Wenxian. Overall, the distribution of high and very high susceptibility areas in the Bailong River Basin are closely related to the fault zones and river system. In terms of spatial distribution, the high and very high susceptibility areas are closely related to the distribution of high population density and high road density areas in the Bailong River Basin (Figure 7), which poses a great challenge to disaster prevention and control in the basin. The susceptibility assessment results in this paper can be used as reference data for decision-makers and government managers in land management and allocation.
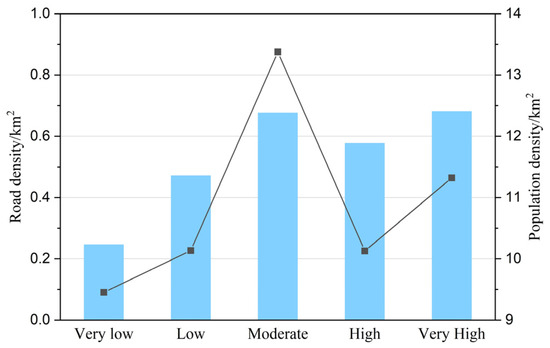
Figure 7.
Statistical relationship between road density and population density in different susceptibility areas.
4.4. On-Site Verification of Susceptibility Assessment Results
Under the existing conditions, field survey is one of the auxiliary means to verify the landslide susceptibility assessment results, and the accuracy of the evaluation results can be judged intuitively through field survey. The high and very high susceptibility areas of the evaluation results are the focus of our attention and are also the key areas for future disaster prevention, land planning, and management. Therefore, we chose to investigate and verify the high and very high susceptibility zones of this susceptibility assessment result.
Considering that the study area is mainly controlled by fracture zones, whether the evaluation results can perform well along the fracture zones is an important test criterion. Therefore, in this paper, we choose the Zhouqu area located in the middle reaches of the Bailong River Basin as a susceptibility validation area (Figure 8a). This area is controlled by fracture zones with dramatic topographic relief, broken rock units, and extremely developed landslides, and has experienced serious landslide disasters in the historical period. The high and very high susceptibility areas in the susceptibility assessment results include landslides that have occurred and slopes with destabilization potential, and the validation of the two types of slopes shows that serious landslides have occurred in almost all of the high and very high susceptibility zones and that famous landslides in the study area, such as Suoertou landslide (Figure 8c), Xieliupo landslide (Figure 8d), Yahuokou landslide (Figure 8e), Lijie landslide (Figure 8i), etc., are in the very high susceptibility zones, and they are accompanied by rock fragmentation and local destabilization. This indicates that the susceptibility evaluation results obtained in this paper using machine learning are in line with the actual situation, have high credibility, and can be used as reference data for future disaster prevention and mitigation planning and land management.
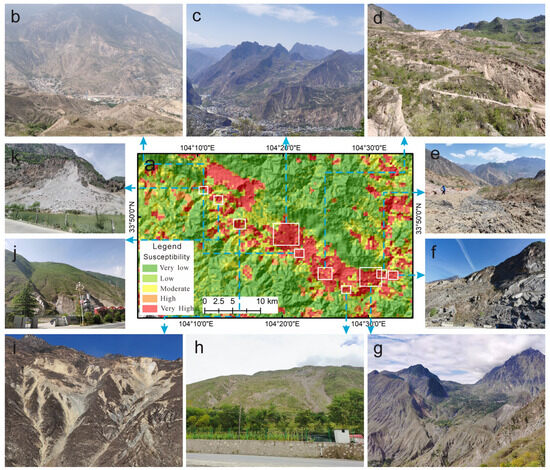
Figure 8.
Field verification of landslide susceptibility assessment results. (a) Susceptibility assessment verification area, (b) Nanqiao lanslide, (c) Suoertou and Daxiaowan landslides, (d) Xieliupo landslide, (e) Yahuokou landslide, (f) A small scale rockfall, (g) Zhongpai landslide, (h) An old landslide, (i) Lijie landslide, (j) An old landslide, (k) A small scale rockfall.
5. Discussion
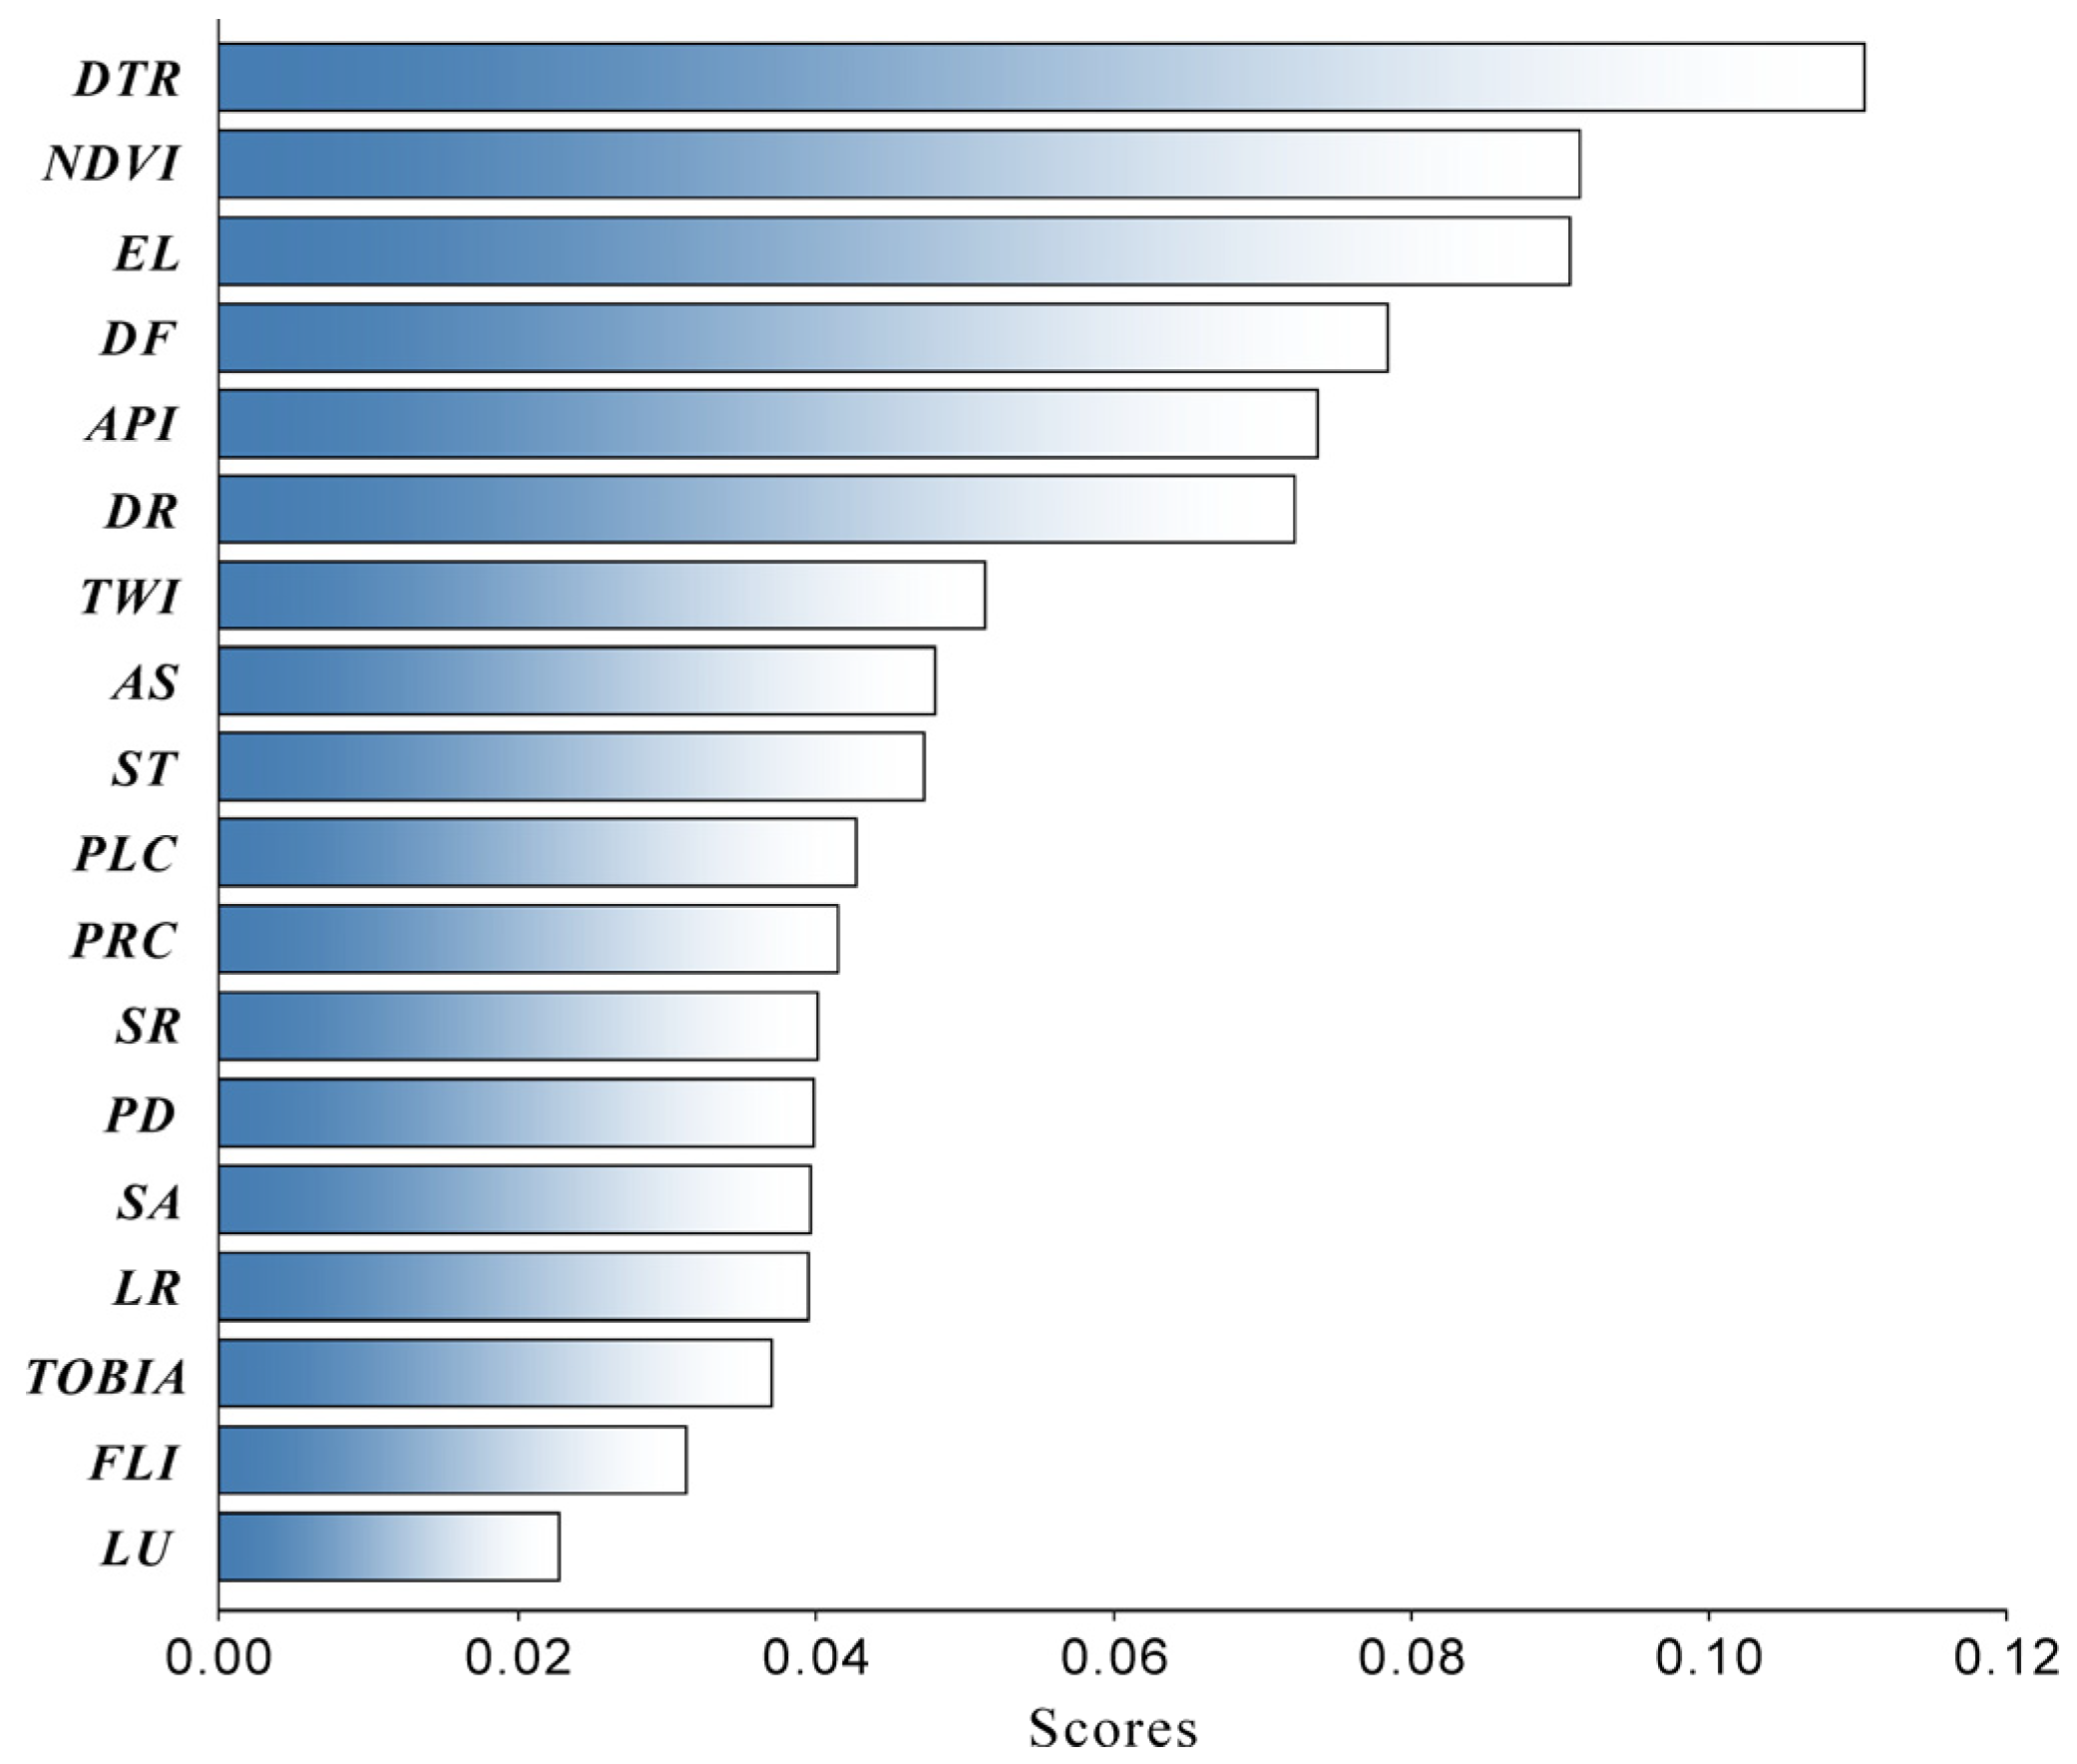
One of the advantages of machine learning modeling is that the interpretability of the model can be used to quantitatively evaluate the importance of the selected factors [13,32]. In this way, we can better understand the importance of various factors in landslide development and thus, take targeted prevention and control measures. The calculated importance weights of all factors are shown in Figure 9. There is no doubt that each factor plays a role in landslide development. Among all the factors, the distance to a road has the highest degree of impact, while the impact of land use type has the lowest effect. The impact of engineering construction on landslide development is unexpected. The impact of human activities on geological hazards in the Bailong River Basin has always been a concern for researchers. Engineering excavation will cause the readjustment of slope stress structures, which will seriously affect the stability of slopes [7,33]. In many studies of landslide susceptibility assessment, despite the repeated emphasis on the important influence of human activities, roads are not viewed as the most critical influence factor compared to the importance of condition factors such as slope, elevation, rainfall, and lithology [3,34], which is significantly different from the results of this paper. However, if the background of the Bailong River Basin is understood, roads may be acceptable as the factor most closely associated with landslide development. We regard that the importance of roads may be overestimated in the landslide susceptibility assessment of this area, and we did not consider that the dynamic process of the factors may be the reason for the overestimation or underestimation of the assessment results of some factors. Old and ancient landslides in the Bailong River Basin account for 73% of the total number of landslides, and the formation time of these landslides may be far older than the activity history in this region, which dates from the beginning of the human industrial age. Therefore, the formation of these old and ancient landslides is not the result of human activities. As for the high value for the influence of DTR, we believe that the main reason for this is that the combination of complex topography, limited land resources, and rapid population expansion forced most residents to migrate to and settle on high hillslope areas, and these places of settlement and production activities are generally sites of large-scale ancient landslides and old landslide deposits in the historical period. In recent years, almost all villages have built hardened roads. Therefore, the importance of DTR in the factor evaluation is actually a feedback effect of landslide-based geomorphological processes on human activities, and landslide hazards bring risks and scarce land resources at the same time. Therefore, how to consider the dynamic connection between the historical landslide formation process and the condition factor is a key component to continuing to improve the reliability of the assessment results in the future. Nevertheless, the results of this paper are still of great revelation, because large landslides in the Bailong River Basin are predominantly ancient landslides and old landslides, and there is a potential risk of landslide reactivation under the influence of human activities, rainfall, and other factors. In fact, the reactivation of landslides has already caused serious consequences, and the likelihood of the occurrence of risk is even greater considering the close correlation that exists between roads and landslides. Therefore, there is a need for a systematic assessment and management of landslide and road relationships in order to avoid and mitigate the potential risks created by landslide utilization.

Figure 9.
Quantitative evaluation results of importance of influencing factors.
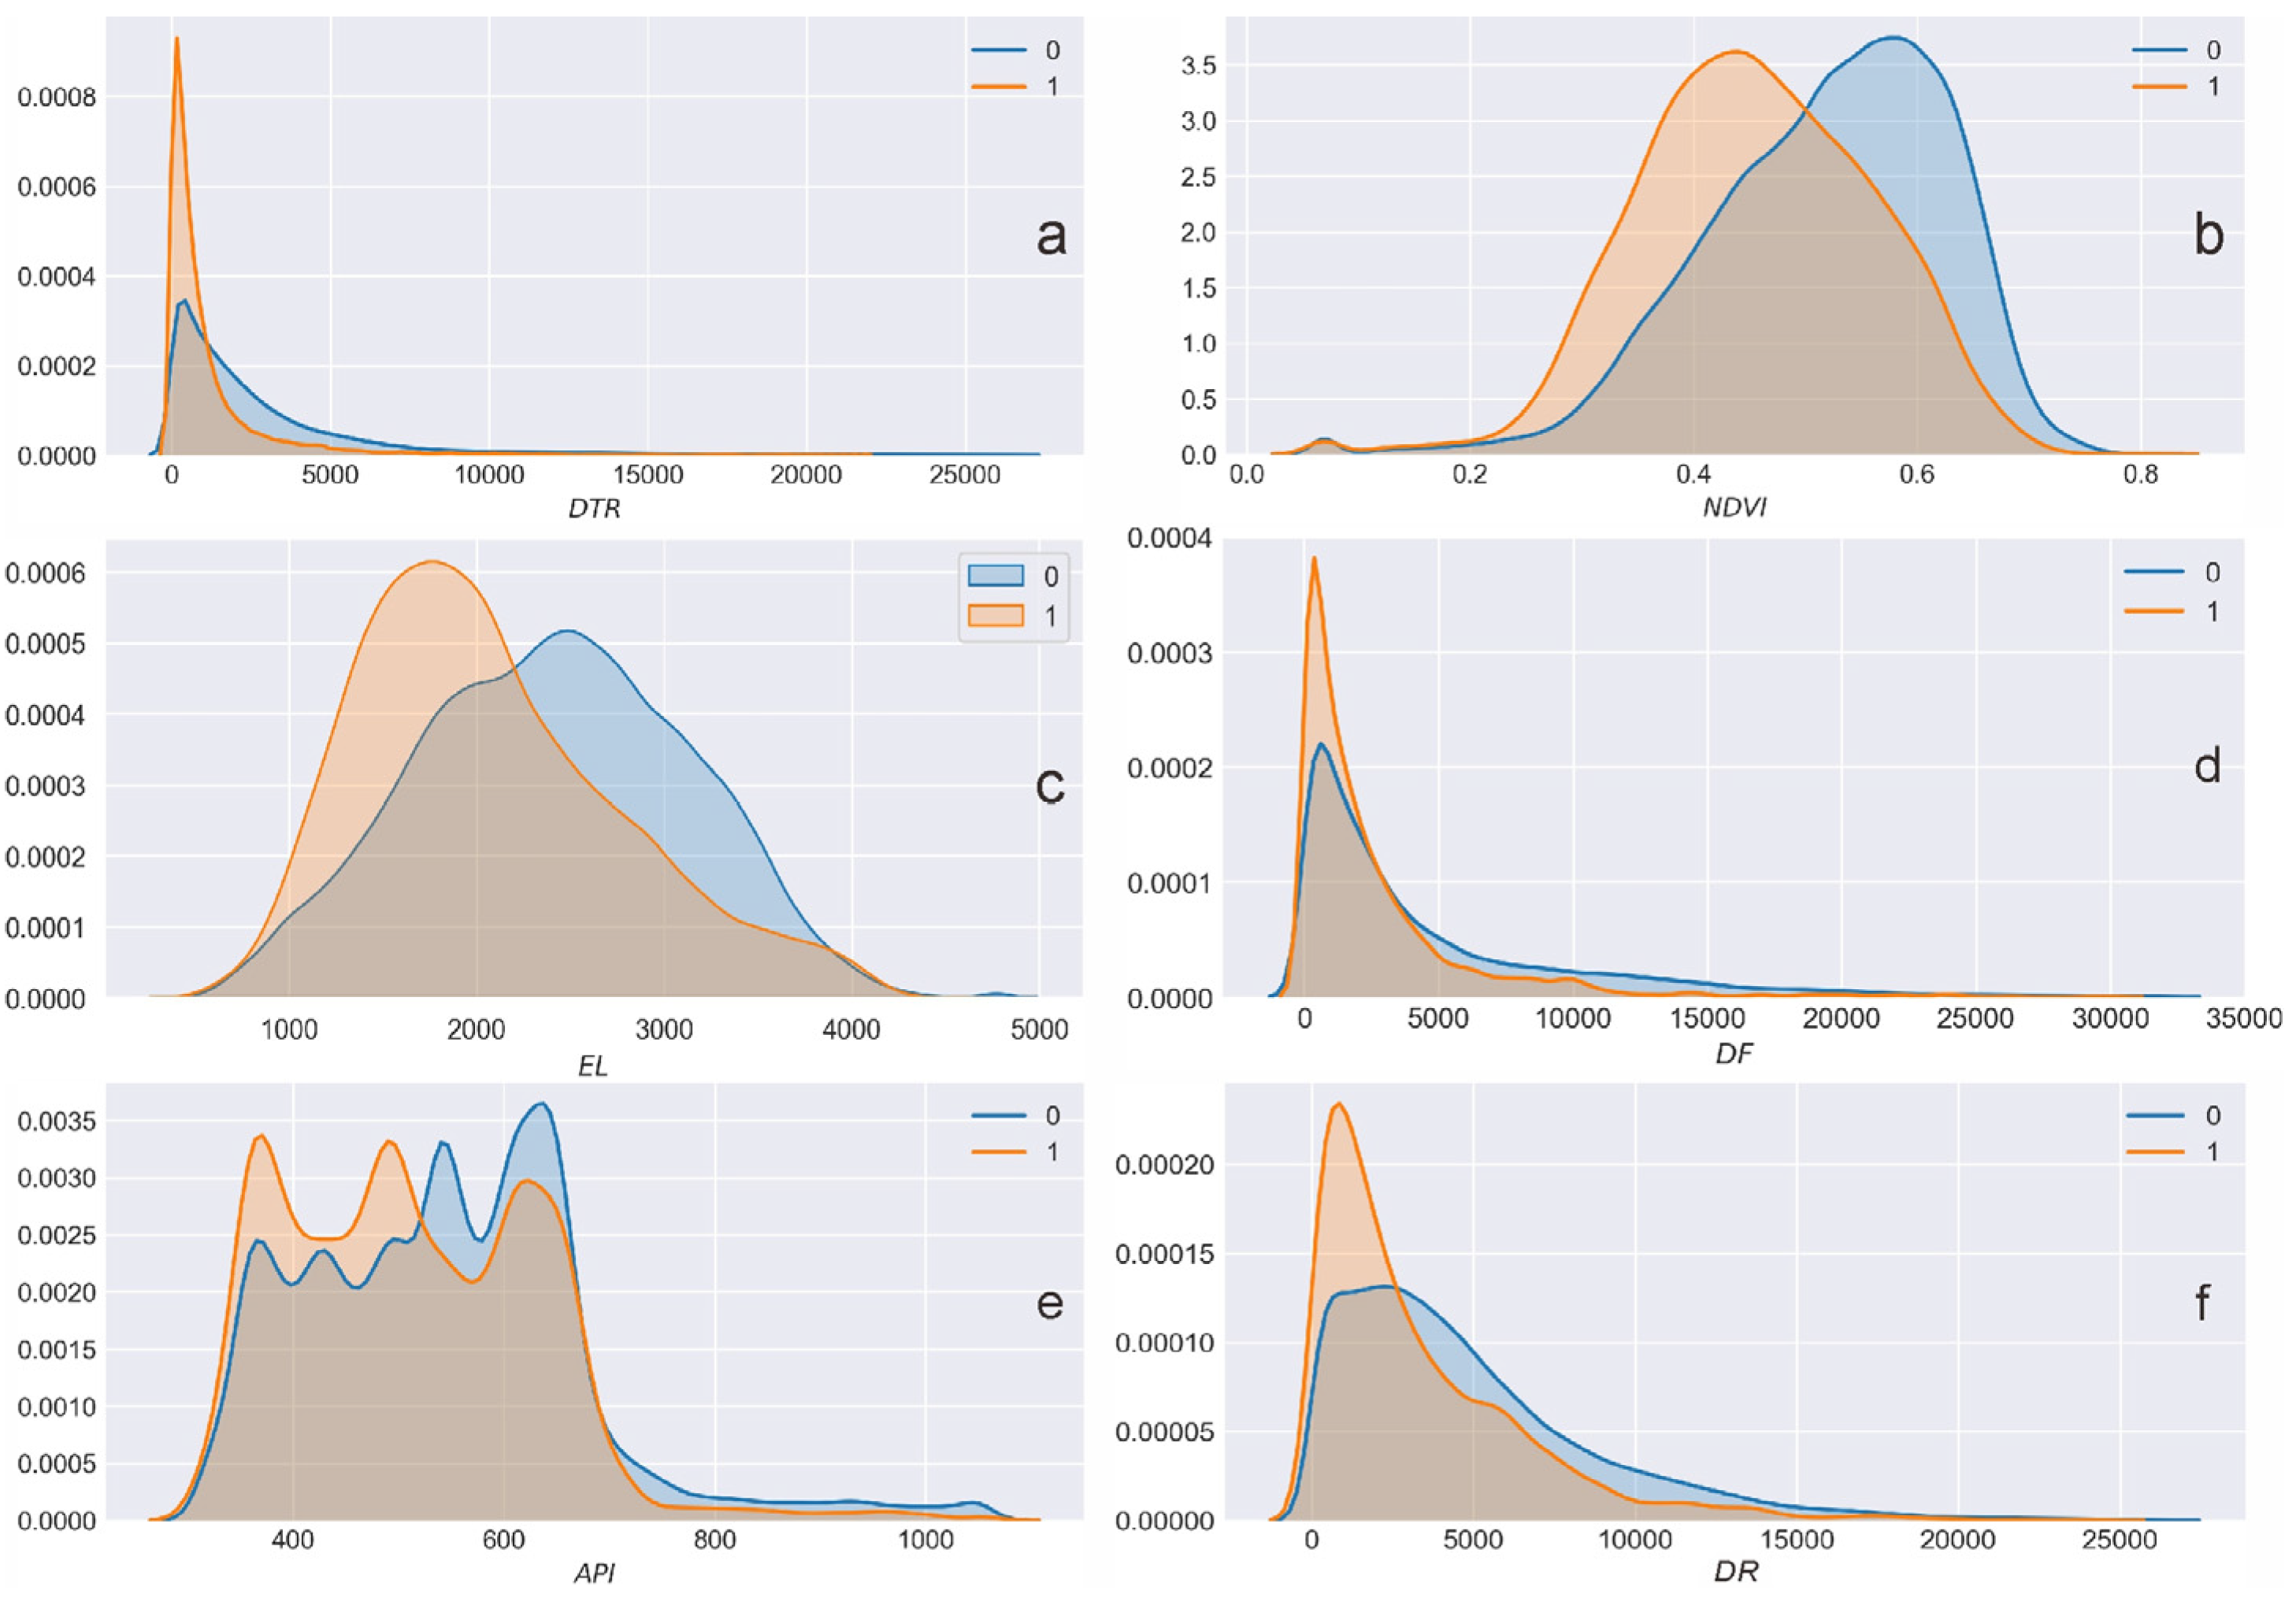
NDVI is the second most important factor affecting landslide susceptibility with a 9% contribution. The statistical results show that in areas with vegetation coverage of less than 50% (Figure 10b), the proportion of landslide area is higher than that of non-landslide areas, while in areas with vegetation coverage of more than 50%, the proportion of non-landslide areas is significantly higher than that of landslide areas. This result clearly demonstrates the constraining effect of vegetation in the process of landslide development. The grid structure formed by vegetation roots is particularly effective in controlling shallow landslides [35]. Considering the explosive growth of geological disasters caused by human damage to forest resources and the ecological environment in the region in recent decades, ecological environment treatment and returning farmland to forest can be considered the priority choice for constraining geological disasters in the Bailong River Basin. The influence of faults on landslide development ranked fourth, accounting for 8% of the weight. It should be specified that the influence of fault zones on landslide development cannot be completely replaced by faults, including the influence of lithological fracture and crustal uplift. From the analysis of the results, it can be seen that the proportion of landslide areas is significantly higher than that of non-landslide areas within 2000 m of a fault (Figure 10d). The influence of annual rainfall on the distribution of landslides is special. The distribution of landslides is concentrated in areas with annual rainfall in the range of 300 mm to 700 mm. Paradoxically, the proportion of landslides in low-rainfall areas is higher than that in high-rainfall areas (Figure 10e). There are three main reasons for this phenomenon: i. the rainfall in the Bailong River Basin is greatest in the Bikou area in the south and Diebu area in the north, however, as a stable craton block, the Bikou block experiences no violent tectonic activity, and very few landslides develop there, whereas the Diebu region has mostly tectonically formed ancient landslides with a lower density of landslides; ii. ecological damage reduces the stability threshold of the hillslope, which can induce a landslide under the condition of low rainfall, and ecological damage in the Bailong River Basin is concentrated in the area from Zhouqu to Wudu; thus the critical threshold of landslide occurrence in this area is low; iii. the section from Zhouqu to Wudu within the Bailong River Basin has a dry–hot valley climate, with concentrated rainfall, conditions that are more likely to induce landslides. However, it must also be acknowledged that the low resolution of rainfall data may also be the reason for this phenomenon. The influence of distances to a river is similar to that of distance to a fault in that the range of within 2000 m of a river is a high incidence area for landslides (Figure 10f), and in addition to erosion of the foot of the slope, the transport of material is necessary for the continuation of landslides.
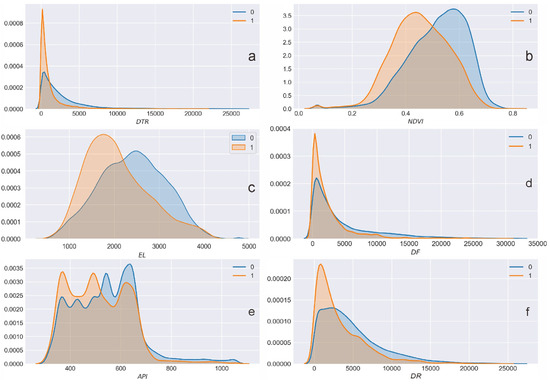
Figure 10.
Landslide and non-landslide area distribution in some factors, (a) road, (b) NDVI, (c) altitude, (d) fault, (e) annual precipitation index, and (f) river. “1” represents landslide area and “0” represents non-landslide area.
6. Conclusions
The serious geological disasters that have occurred in the eastern margin of the Tibetan Plateau have made government managers and decision-makers face great challenges in urban planning, land management, ecological governance, and disaster prevention. The susceptibility assessment of landslide disasters as a quantitative and effective analysis result has a certain reference value. As the representative achievements of the 21st-century technological revolution, machine learning and artificial intelligence are becoming the dominant technologies leading the progress of human civilization. Artificial intelligence has shown great advantages in all professions. How to apply artificial intelligence in the field of geological disaster prevention has always been a problem for practitioners. In this paper, the Bailong River Basin on the eastern margin of the Tibetan Plateau is taken as a typical study area, and 17 kinds of machine learning algorithms are selected for susceptibility assessment modeling, evaluation, and optimization. The results show that the BaggingClassifier and RandomforestClassifier models perform well, and the accuracy of validation is more than 90%. Using BaggingClassifier to generate predictions of Bailong River Basin landslide susceptibility, the findings are applied to divide the basin into very low, low, moderate, high, and very high susceptibility areas, accounting for 52.86%, 21.94%, 8.32%, 5.88%, and 11% of the basin, respectively. The high and very high landslide susceptibility areas are mainly distributed in the middle and lower reaches of the Bailong River from Zhouqu to Wenxian, close to the river banks, and are areas with high population density and road density in the basin, which indicates that the risk of landslide in the Bailong River Basin is high, and there is the possibility of river blocking, directly causing casualties and property losses. The interpretability of machine learning permits us to quantitatively assess the importance of the influencing factors, and the results of the quantitative assessment of the factors show that the six factors of distance to roads, NDVI, elevation, distance to faults, average annual rainfall, and distance to rivers have the greatest influence on landslide susceptibility, while geomorphologically related factors have a lesser combined influence on landslides.
Author Contributions
Conceptualization, methodology, visualization, and writing—original draft preparation, T.Q.; validation, formal analysis, resources, data curation, project administration, writing—review and editing, T.Q. and X.M.; software and investigation, T.Q. and Y.Z. All authors have read and agreed to the published version of the manuscript.
Funding
This work was funded by Fundamental Research Funds for the Central Universities (Grant No. lzujbky-2023-pd03), the Science and Technology Major Project of Gansu Province (Grant No. 22ZD6FA051), and the Second Tibetan Plateau Scientific Expedition and Research Program (STEP) (Grant No. 2021QZKK0201).
Data Availability Statement
Relevant data can be used in ResearchGate: Landslide locations in Bailong River Basin.
Acknowledgments
The Digital Elevation Model data were provided by the Japan Aerospace Exploration Agency (JAXA).
Conflicts of Interest
We declare that we have no financial and personal relationships with other people or organizations that can inappropriately influence our work, there is no professional or other personal interest of any nature or kind in any product, service, and/or company that could be construed as influencing the position presented in, or the review of, this manuscript.
References
- Petley, D. Global patterns of loss of life from landslides. Geology 2012, 40, 927–930. [Google Scholar] [CrossRef]
- Stanley, T.; Kirschbaum, D.; Zhou, Y. Spatial and temporal analysis of a global landslide catalog. Geomorphology 2015, 249, 4–15. [Google Scholar]
- Huang, R.; Fan, X. The landslide story. Nat. Geosci. 2013, 6, 325–326. [Google Scholar] [CrossRef]
- Shou, K.J.; Yang, C.M. Predictive analysis of landslide susceptibility under climate change conditions—A study on the Chingshui River Watershed of Taiwan. Eng. Geol. 2015, 192, 46–62. [Google Scholar] [CrossRef]
- Chen, M.; Tang, C.; Xiong, J.; Chang, M.; Li, N. Spatio-temporal mapping and long-term evolution of debris flow activity after a high magnitude earthquake. Catena 2024, 236, 107716. [Google Scholar] [CrossRef]
- Ayalew, L.; Yamagishi, H. The application of GIS-based logistic regression for landslide susceptibility mapping in the Kakuda-Yahiko Mountains, Central Japan. Geomorphology 2005, 65, 15–31. [Google Scholar] [CrossRef]
- Dai, J.; Yang, J.; Yao, C.; Hu, Y.; Zhang, X.; Jiang, Q.; Zhou, C. Study on the mechanism of displacement mutation for jointed rock slopes during blasting excavation. Int. J. Rock. Mech. Min. Sci. 2022, 150, 105032. [Google Scholar] [CrossRef]
- Peethambaran, B.; Leshchinsky, B. Application of landslide susceptibility towards urbanization suitability zonation in mountainous settings. Int. J. Disaster Risk Reduct. 2023, 97, 104061. [Google Scholar] [CrossRef]
- Goyes-Penafiel, P.; Hernandez-Rojas, H.R. Landslide susceptibility index based on the integration of logistic regression and weights of evidence: A case study in Popayan, Colombia. Eng. Geol. 2021, 280, 105958. [Google Scholar] [CrossRef]
- Süzen, M.L.; Doyuran, V. Data driven bivariate landslide susceptibility assessment using geographical information systems: A method and application to Asarsuyu catchment, Turkey. Eng. Geol. 2004, 71, 303–321. [Google Scholar] [CrossRef]
- Liu, C.; Li, W.; Wu, H.; Ping, L.; Kai, S.; Sun, W.; Wen, C. Susceptibility evaluation and mapping of China’s landslides based on multi-source data. Nat. Hazards 2013, 69, 1477–1495. [Google Scholar] [CrossRef]
- Qi, T.; Zhao, Y.; Meng, X.; Chen, G.; Dijkstra, T. AI-Based Susceptibility Analysis of Shallow Landslides Induced by Heavy Rainfall in Tianshui, China. Remote Sens. 2021, 13, 1819. [Google Scholar] [CrossRef]
- Chen, L.; Ma, P.; Yu, C.; Zheng, Y.; Zhu, Q.; Ding, Y. Landslide susceptibility assessment in multiple urban slope settings with a landslide inventory augmented by InSAR techniques. Eng. Geol. 2023, 327, 107342. [Google Scholar] [CrossRef]
- Napoli, M.D.; Carotenuto, F.; Cevasco, A.; Confuorto, P.; Martire, D.D.; Firpo, M.; Pepe, G.; Raso, E.; Calcaterra, D. Machine learning ensemble modelling as a tool to improve landslide susceptibility mapping reliability. Landslides 2020, 17, 1897–1914. [Google Scholar] [CrossRef]
- Zeng, T.; Wu, L.; Hayakawa, Y.S.; Yin, K.; Gui, L.; Jin, B.; Guo, Z.; Peduto, D. Advanced integration of ensemble learning and MT-InSAR for enhanced slow-moving landslide susceptibility zoning. Eng. Geol. 2024, 331, 107436. [Google Scholar] [CrossRef]
- Ciurleo, M.; Cascini, L.; Calvello, M. A comparison of statistical and deterministic methods for shallow landslide susceptibility zoning in clayey soils. Eng. Geol. 2017, 223, 71–81. [Google Scholar] [CrossRef]
- Zhao, Y.; Meng, X.; Qi, T.; Qing, F.; Chen, G. AI-based identification of low-frequency debris flow catchments in the Bailong River basin, China. Geomorphology 2020, 359, 107125. [Google Scholar] [CrossRef]
- Marjanović, M.; Kovačević, M.; Bajat, B.; Voženílek, V. Landslide susceptibility assessment using SVM machine learning algorithm. Eng. Geol. 2011, 123, 225–234. [Google Scholar] [CrossRef]
- Merghadi, A.; Yunus, A.P.; Dou, J.; Whiteley, J.; Pham, B.T.; Bui, D.T.; Avtar, R.; Abderrahmane, B. Machine learning methods for landslide susceptibility studies: A comparative overview of algorithm performance. Earth Sci. Rev. 2020, 207, 103225. [Google Scholar] [CrossRef]
- Meng, X.; Chen, G.; Guo, P.; Xiong, M.; Janusz, W. Research of landslides and debris flows in Bailong River Basin: Process and prospect. Mar. Geol. Quat. Geol. 2013, 33, 1–15. [Google Scholar] [CrossRef]
- Qi, T.; Meng, X.; Zhao, Y.; Su, X.; Chen, G.; Zeng, R.; Zhang, Y.; Li, Y.; Yue, D. Formation and distribution of landslides controlled by thrust-strike-slip fault zones and fluvial erosion in the Western Qinling Mountains, China. Eng. Geol. 2023, 47, 283–306. [Google Scholar] [CrossRef]
- Guo, C.; Zhang, Y.; Li, X.; Ren, S.; Yang, Z.; Wu, R.; Jin, J. Reactivation of giant Jiangdingya ancient landslide in Zhouqu County, Gansu Province, China. Landslides 2019, 17, 179–190. [Google Scholar] [CrossRef]
- Zhang, Z. Mechanism of the 2019 Yahuokou landslide reactivation in Gansu, China and its causes. Landslides 2020, 17, 1429–1440. [Google Scholar] [CrossRef]
- Chong, Y.; Chen, G.; Meng, X.; Bian, S.; Huang, F.; Lin, L.; Yue, D.; Zhang, Y.; Guo, F. Formation mechanism and quantitative risk analysis of the landslide-induced hazard chain by an integrated approach for emergency management: A case study in the Bailong River basin, China. Catena 2023, 233, 107522. [Google Scholar] [CrossRef]
- Li, H.; Zhang, Y.; Dong, S.; Zhang, J.; Wang, Q. Neotectonics of the Bailongjiang and Hanan faults: New insights into late Cenozoic deformation along the eastern margin of the Tibetan Plateau. Geol. Soc. Am. Bull. 2020, 132, 1845–1862. [Google Scholar] [CrossRef]
- Guzzetti, F.; Mondini, A.C.; Cardinali, M.; Fiorucci, F.; Santangelo, M.; Chang, K.T. Landslide inventory maps: New tools for an old problem. Earth Sci. Rev. 2012, 112, 42–66. [Google Scholar] [CrossRef]
- Qi, T. Spatial Distribution and Formation Mechanism of Landslides in the Bailong River Basin. Ph.D. Thesis, Lanzhou University, Gansu, China, 2022; pp. 34–51. [Google Scholar]
- Meentemeyer, R.K.; Moody, A. Automated mapping of conformity between topographic and geological surfaces. Comput. Geosci. 2000, 26, 815–829. [Google Scholar] [CrossRef]
- Zhang, X.; Liu, L.; Chen, X.; Gao, Y.; Xie, S.; Mi, J. GLC_FCS30: Global land-cover product with fine classification system at 30 m using time-series Landsat imagery. Earth Syst. Sci. Data 2020, 182, 2753–2776. [Google Scholar] [CrossRef]
- Dormann, C.F.; Elith, J.; Bacher, S.; Buchmann, C.; Carl, G.; Carré, G.; Marquéz, J.R.G.; Gruber, B.; Lafourcade, B.; Leitão, P.J.; et al. Collinearity: A review of methods to deal with it and a simulation study evaluating their performance. Ecography 2013, 36, 27–46. [Google Scholar] [CrossRef]
- Yilmaz, I. Landslide susceptibility mapping using frequency ratio, logistic regression, artificial neural networks and their comparison: A case study from Kat landslides (Tokat—Turkey). Comput. Geosci. 2009, 35, 1125–1138. [Google Scholar] [CrossRef]
- Xu, Y.; Ju, L.; Tong, J.; Zhou, C.M.; Yang, J.J. Machine Learning Algorithms for Predicting the Recurrence of Stage IV Colorectal Cancer After Tumor Resection. Sci. Rep. 2020, 10, 2519. [Google Scholar] [CrossRef] [PubMed]
- Zeng, J.; Zhao, Y.; Zheng, J.; Zhang, Y.; Shi, P.; Li, Y.; Chen, G.; Meng, X.; Yue, D. Early Identification of River Blockage Disasters Caused by Debris Flows in the Bailong River Basin, China. Remote Sens. 2024, 16, 1302. [Google Scholar] [CrossRef]
- Zhang, F.; Liu, G.; Chen, W.; Liang, S.; Chen, R.; Han, W. Human-induced landslide on a high cut slope: A case of repeated failures due to multi-excavation. J. Rock Mech. Geotech. Eng. 2012, 4, 367–374. [Google Scholar] [CrossRef]
- Vegani, C.; Giadrossich, F.; Buckley, P.; Conedera, M.; Pividori, M.; Salbitano, F.; Rauch, H.S.; Lovreglib, R.; Schwarz, M. Root reinforcement dynamics of European coppice woodlands and their effect on shallow landslides: A review. Earth Sci. Rev. 2017, 167, 88–102. [Google Scholar] [CrossRef]


Disclaimer/Publisher’s Note: The statements, opinions and data contained in all publications are solely those of the individual author(s) and contributor(s) and not of MDPI and/or the editor(s). MDPI and/or the editor(s) disclaim responsibility for any injury to people or property resulting from any ideas, methods, instructions or products referred to in the content. |
© 2024 by the authors. Licensee MDPI, Basel, Switzerland. This article is an open access article distributed under the terms and conditions of the Creative Commons Attribution (CC BY) license (https://creativecommons.org/licenses/by/4.0/).