Article

Multi-Scale Dynamics and Spatial Consistency of Economy and Population Based on NPP/VIIRS Nighttime Light Data and Population Imagery: A Case Study of the Yangtze River Delta

College of Geo-Exploration Science and Technology, Jilin University, Changchun 130026, China
*
Author to whom correspondence should be addressed.
Remote Sens. 2024, 16(15), 2806; https://doi.org/10.3390/rs16152806
Submission received: 12 June 2024 / Revised: 24 July 2024 / Accepted: 29 July 2024 / Published: 31 July 2024

Abstract

:
Population and economy are crucial factors contributing to regional disparities. Studying the patterns and relationships between these two elements is essential for promoting sustainable development in regions and cities. This study constructs multi-scale geographic concentration indices and inconsistency indices, utilizing NPP/VIIRS and LandScan data to quantitatively analyze the spatial pattern changes of population and economy in the Yangtze River Delta across various spatial scales, revealing the matching relationships between population and economic elements within cities. The results indicate that the economy in the Yangtze River Delta is spreading outward from the core areas, with the average population–nightlight inconsistency index decreasing from 1.57 to 1.33. This suggests that the imbalance between population and economy within the urban agglomeration is gradually improving, consistent with trends observed in statistical survey data. Within individual cities, there is a noticeable spatial mismatch between population and nightlight intensity, with the population primarily concentrated in urban core areas. As urban spaces expand, the areas where population concentration is significantly lower than nightlight concentration are gradually diminishing. By 2022, the land area where population and economic concentration are coordinated within the Yangtze River Delta urban areas increased from 9.13% to 16.24%. Population concentration in these coordinated regions rose from 11.33% to 16.33%, while nightlight concentration increased from 9.98% to 13.63%. The improved geographic concentration and inconsistency indices are effective indicators for multi-scale monitoring of population and economic spatial changes. The integration of NPP/VIIRS nighttime light data and LandScan data provides an effective method for uncovering different spatial patterns of population and socio-economic element aggregation in urban structures. This can offer insights for promoting sustainable regional and urban development.

1. Introduction

By 2022, over 4 billion people, more than half of the global population, lived in urban areas, with this proportion projected to exceed two-thirds by 2050 [1]. Urbanization is a critical global social transformation phenomenon in the 21st century [2]. Building sustainable cities has become one of the Sustainable Development Goals (SDGs) in the United Nations 2030 Agenda [3]. Sustainable urban development aims to meet current and future development needs while achieving advanced urbanization and modernization [4]. While the definition of indicators and frameworks influencing urban sustainability in economics is still evolving, they generally fall into categories such as population, economy, and environment [4,5,6]. As the world’s largest and fastest-developing country, China faces significant challenges in regional development imbalances due to its rapid urbanization and industrialization, which pose a threat to sustainable development [7,8,9]. Population and economy, as critical drivers of social development, are considered the main factors causing regional disparities in China, thus inhibiting sustainable development [10].
The impact of population on the economy is non-linear and multifaceted [11,12]. Traditional theories on population and economic development include Lee’s Migration Laws, Neoclassical Economics, the Dual Exponential Model, and the Push-Pull Model [13]. Common research methods include geographic concentration, dissimilarity index, center of gravity model, imbalance index, deviation index, spatial autocorrelation, rank-size rule, and elasticity coefficient [10,13,14,15]. As research on the relationship between population and economic evolution deepens, many studies have adopted statistical data to calculate geographic concentration and dissimilarity indices, becoming effective ways to explore the spatial relationship between population and economy. These studies have quantitatively analyzed population and economic development trends and inconsistencies at macro scales such as cities, provinces, and urban agglomerations [13,14,15,16,17]. According to the definition of the dissimilarity index, the mismatch between population and economy in spatial patterns indicates a low degree of coupling and coordination between the two factors at the same spatial level [15,17]. Excessive population may lead to environmental degradation and resource waste, while labor shortages can result in insufficient economic vitality, thereby hindering urban development. The limitations of statistical data lie in their lack of spatiality and the structural incomparability of GDP data obtained from different regions, which can be subject to human influence, making statistical results potentially lacking in objectivity and scientific accuracy [18,19]. Although some studies have combined land use data and used statistical methods to model population and economic densities at a 1 km resolution through multiple linear regression, this approach still fundamentally belongs to the realm of statistical data-based quantitative analysis of inconsistencies and offers relatively low spatial resolution [14].
Remote sensing technology provides more efficient and accurate spatial data for various social and natural science research compared to traditional methods [20]. In urban remote sensing, unlike daytime satellite data, which only represents urban spatial extents, nighttime light data, a typical remote sensing data type, can effectively model and spatialize various socio-economic and environmental variables within cities by directly indicating human activities through nighttime light intensity [21]. In the rapid urbanization process, nighttime light data can effectively detect urban expansion dynamics and the spatial structure of urban centers [22,23]. Existing research shows that nighttime light data, as a proxy for GDP data, can more intuitively reflect different cities’ economic development levels and disparities [19,24,25,26]. Besides socio-economic aspects, nighttime light data can also be used globally to study population patterns [27]. Nighttime light data is highly correlated with population density at local scales and is often used for pixel-level population spatialization [28,29,30] and to assess population migration dynamics [31,32]. However, due to income disparities, nighttime light data, as a good proxy for regional economic representation, inherently differ from population density at finer scales [33,34,35]. Research has shown that residential population density is not the primary factor affecting nighttime light, leading to low correlations between population and nighttime light at finer scales [27].
With the continuous deepening of nighttime light data mining, combining other geospatial data to utilize nighttime light data more efficiently is a crucial future research direction [21]. Existing population grid data, including GPWv4.11, GHS-POP, LandScan, and WorldPop, offer more reasonable population spatial distribution compared to single-source nighttime light data or models combined with statistical data [36]. Numerous studies have demonstrated that LandScan population data, a commonly used population data type, can be successfully integrated with VIIRS data in various applications: for instance, estimating global 1 km hourly anthropogenic heat flux to prevent adverse environmental impacts from rapid urban population growth [37]; developing the Nighttime Light Development Index (NLDI) to measure human development differences at fine scales [38]; predicting China’s GDP more accurately at the pixel level [39]; and improving blackout detection in urban areas using combined power outage data [40]. Existing research mainly discusses the contribution of the economy to regional sustainable development at large scales using nighttime light data [35]. The spatial mismatch between population and economic factors within urban structures also impedes sustainable urban development [41]. Currently, there is still a lack of research based on nighttime light data to quantitatively analyze the differences between these two factors at finer scales within cities and to reflect the degree of inconsistency between the two factors from both micro and macro scales.
Urban agglomerations have become essential carriers of urbanization [42]. Economic globalization has made urban agglomerations crucial platforms for population aggregation and economic development, and their balanced internal population and economic growth directly contribute to the enhancement of regional economic levels in China [43,44]. In 2022, the Yangtze River Delta urban agglomeration accounted for 24.1% of China’s total GDP and 16.8% of the total population. The Yangtze River Delta is also one of the world’s six major urban agglomerations and one of China’s fastest-growing urban agglomerations, making it a typical region in the context of global urbanization [45]. Currently, its economy is transitioning from focusing on speed to high-quality coordinated development [43]. Existing studies on the Yangtze River Delta have explored its population active areas, economic efficiency, and urbanization quality [44,45,46].
In summary, this study focuses on the Yangtze River Delta, utilizing more objective and practical NPP/VIIRS nighttime light data combined with LandScan population data to replace statistical data. Using improved multi-scale geographic concentration and dissimilarity indices applicable to satellite data, we quantitatively analyze the aggregation and inconsistency changes of population and economy among cities and within urban structures in the Yangtze River Delta over ten years at macro and micro scales. Our research aims to provide a more detailed depiction of the spatial dynamic patterns of population and economy within urban areas at finer scales, further elucidating the degree of factor matching to promote sustainable urban development in the future. This study fills a gap in the field of nighttime remote sensing regarding multi-scale urban population and economic coordination research.

2. Study Area and Datasets
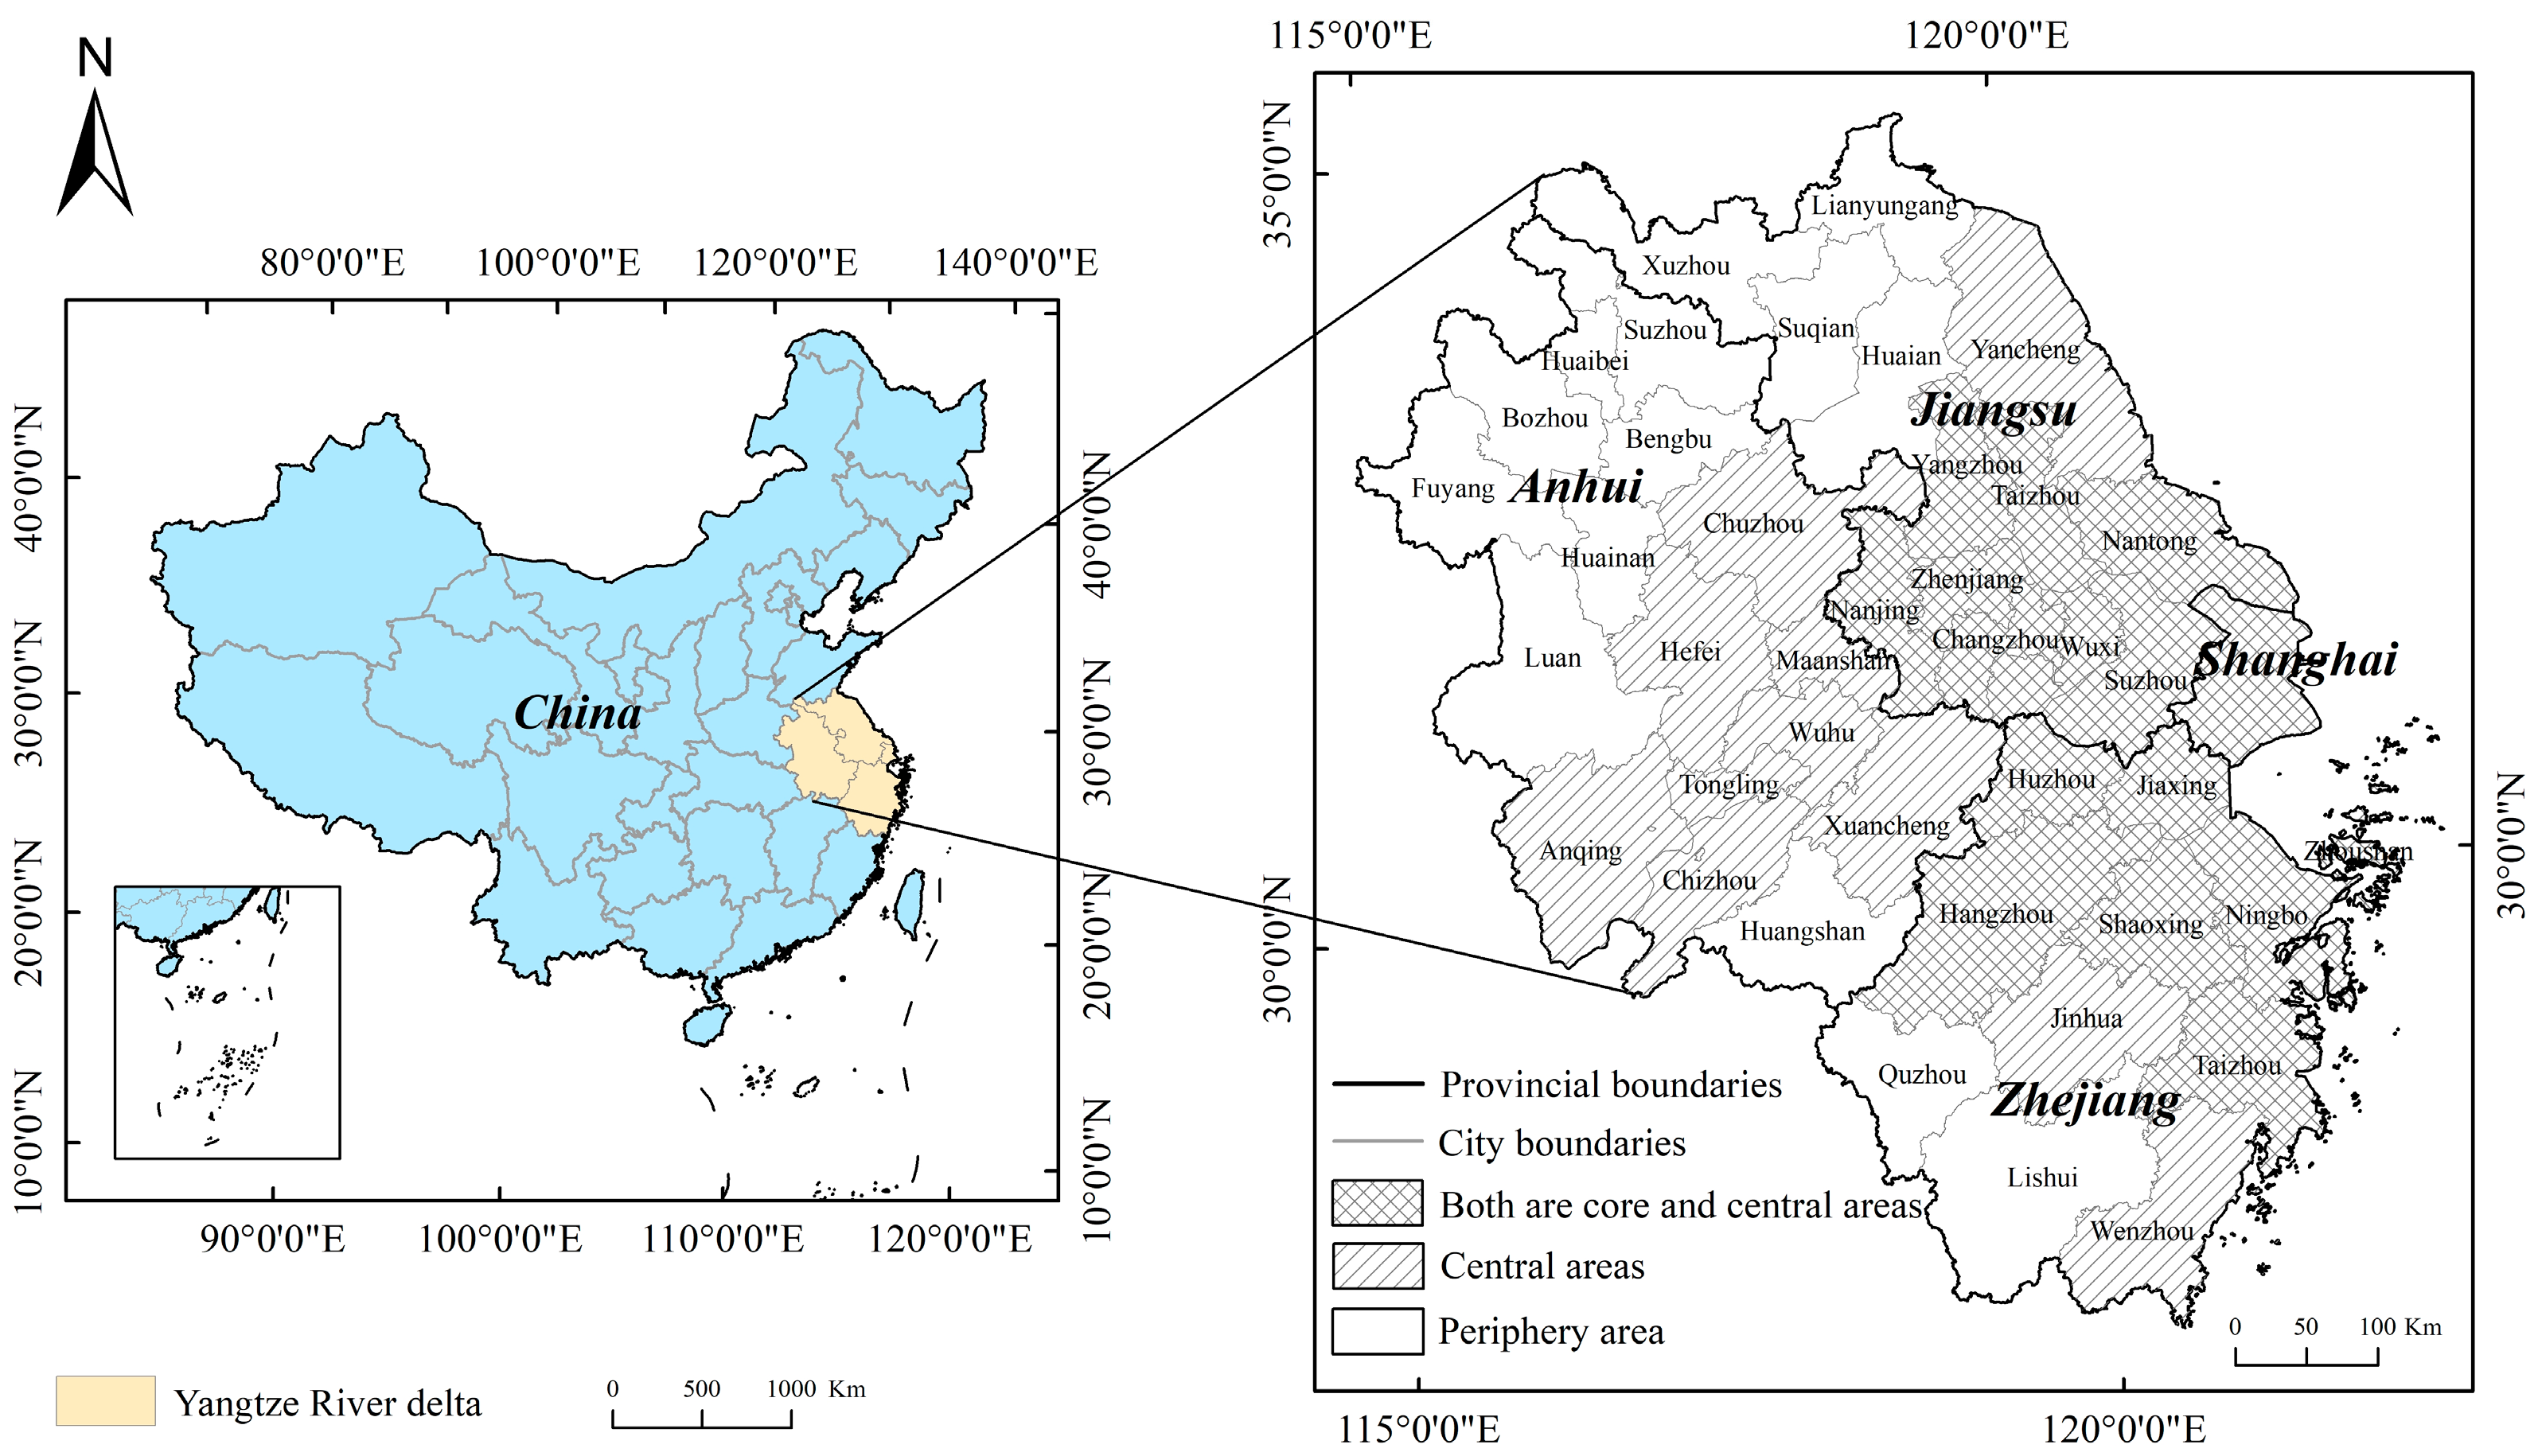
2.1. Study Areas

The Yangtze River Delta is in the downstream area of the Yangtze River in China. According to the “Outline of the Development Plan for the Yangtze River Delta Regional Integration” approved by the State Council of China in 2019, the region includes Jiangsu Province, Zhejiang Province, Anhui Province, and Shanghai Municipality, comprising a total of 41 cities in Figure 1. The Yangtze River Delta is an important intersection of the “Belt and Road Initiative” and the Yangtze River Economic Belt, serving as a crucial engine for China’s high-quality economic development. By the end of 2022, the Yangtze River Delta (YRD) region, encompassing only 3.7% of China’s land area, was home to 16.8% of the national population and generated nearly one-quarter of the country’s GDP. This makes the YRD a prime example of population and economic concentration. The YRD leads the nation in socio-economic development and technological innovation, establishing itself as a significant global hub for modern services and advanced manufacturing.

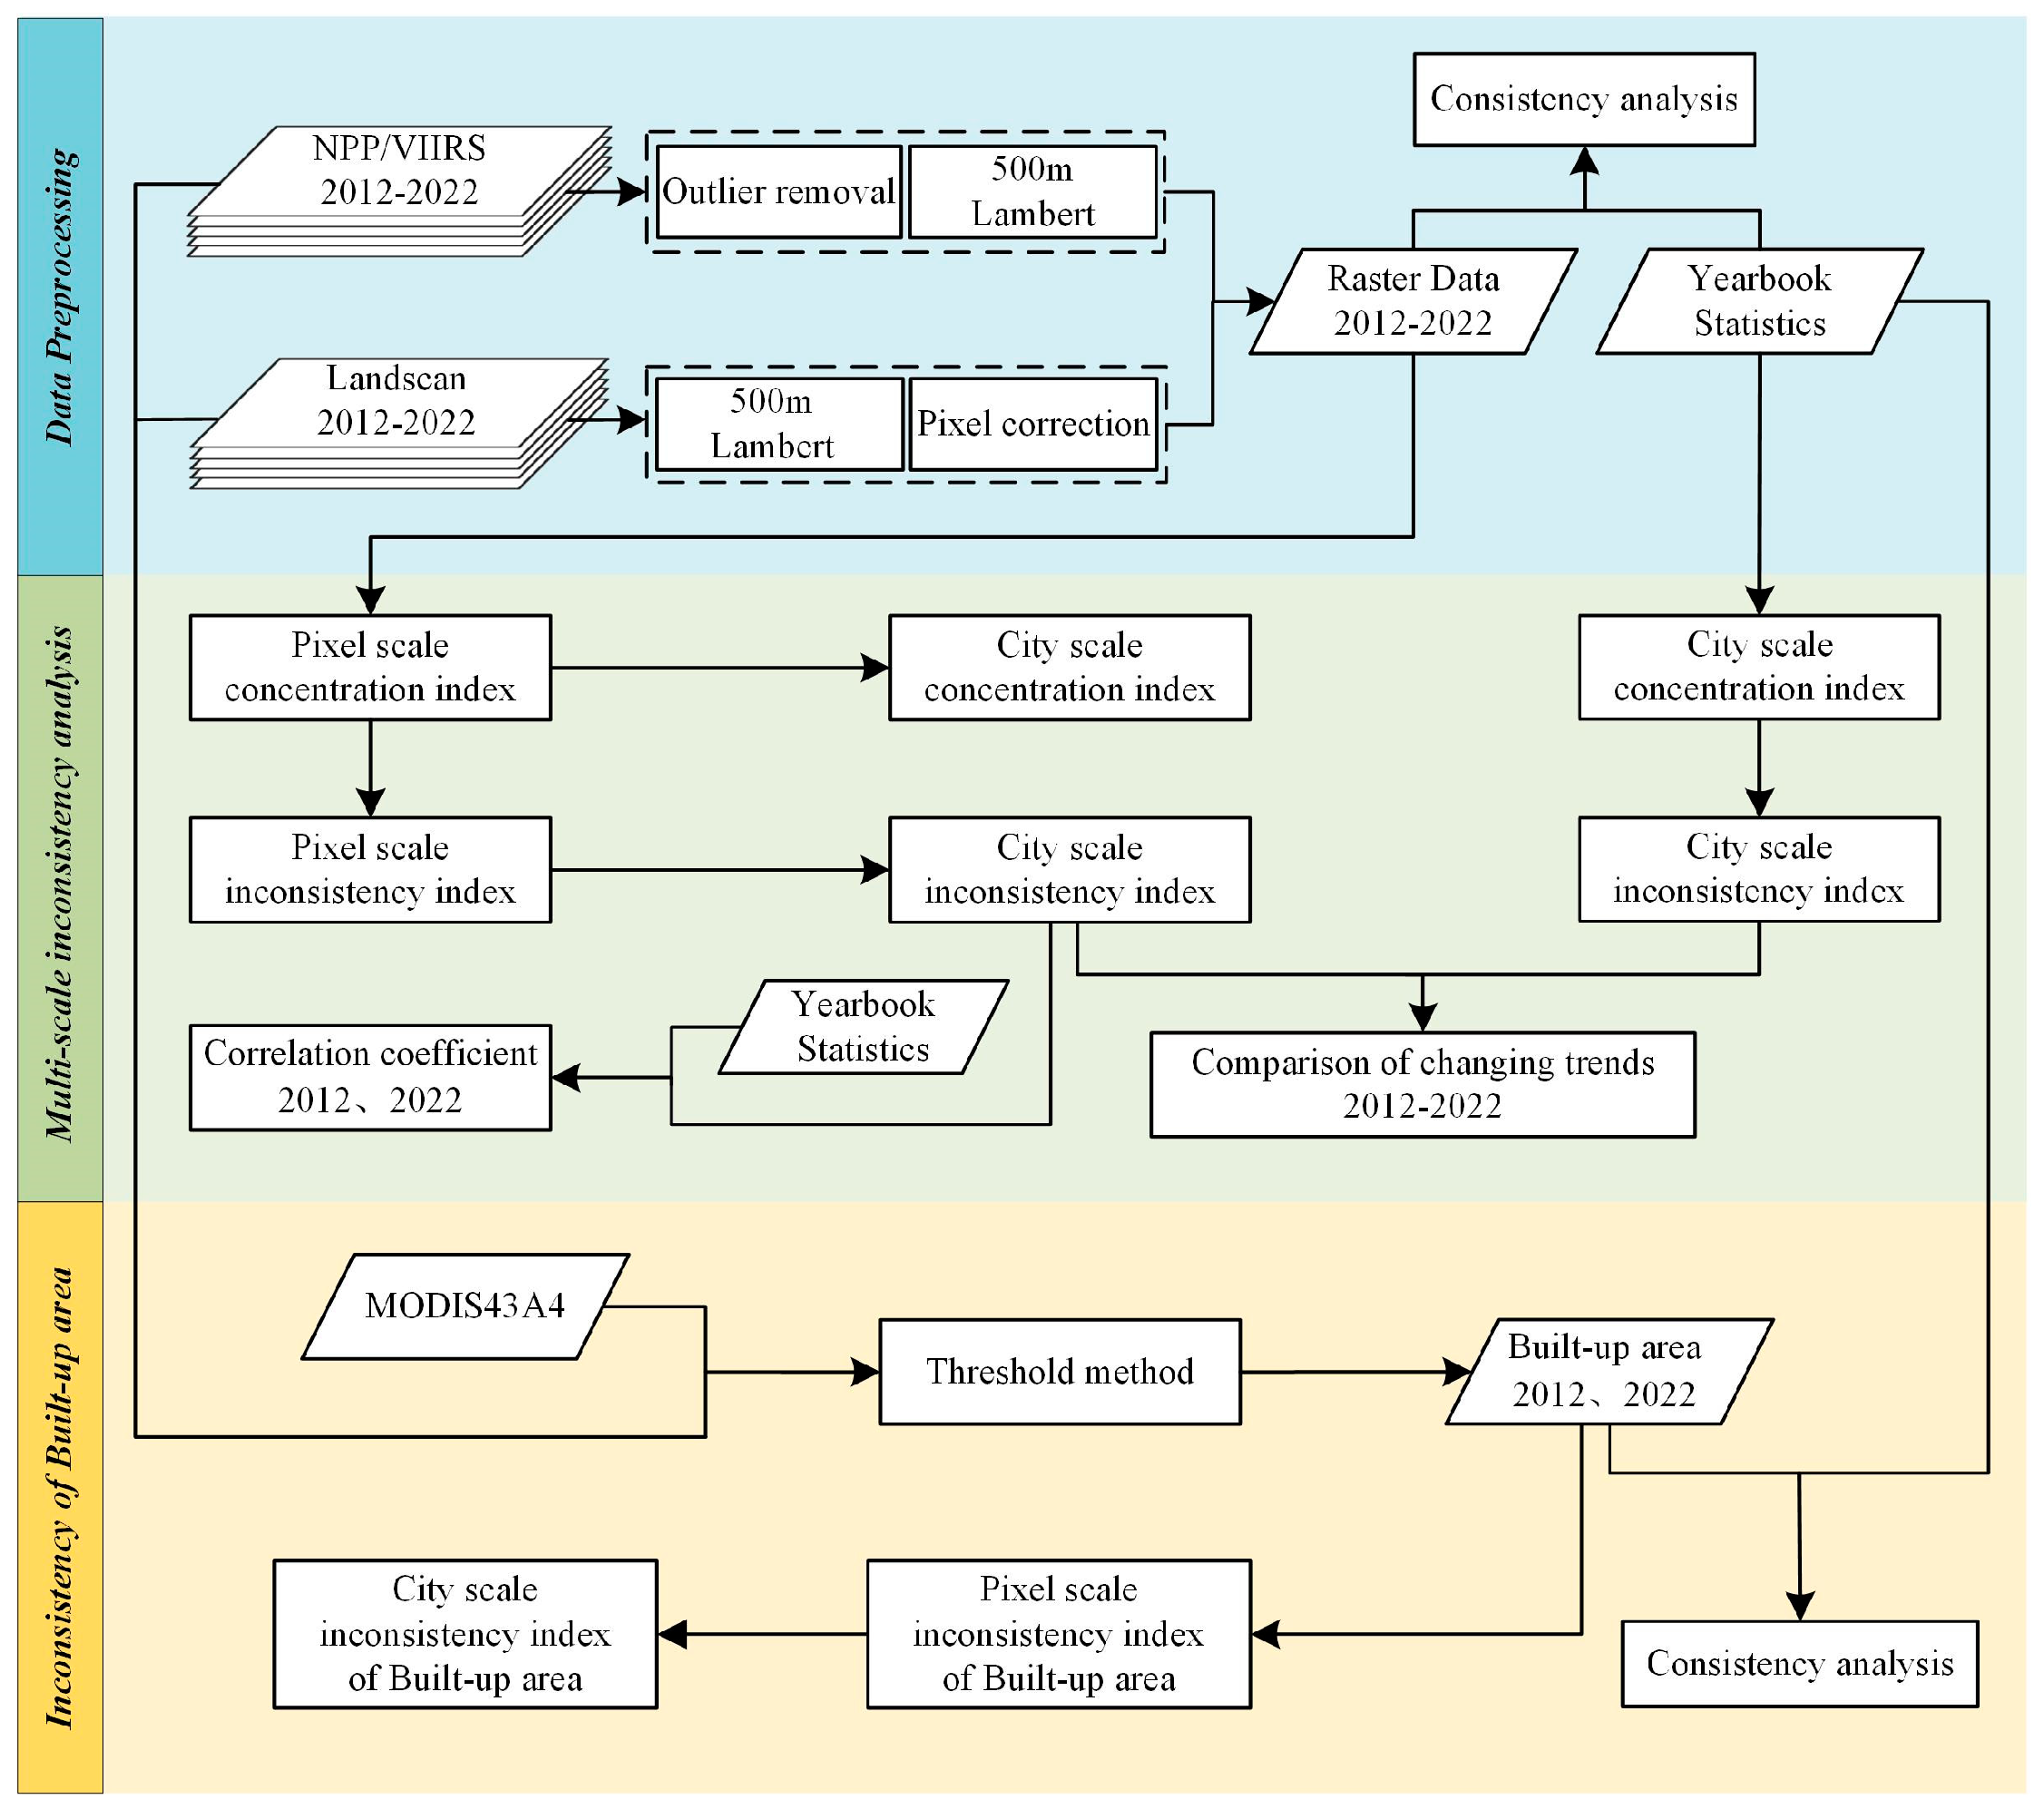
2.2. Data Acquisition and Pre-Processing

2.2.1. NPP/VIIRS Nighttime Light Data

The VIIRS onboard the Suomi National Polar-orbiting Partnership (NPP) satellite acquire images in a broader spectral range and at higher spatial resolution than the Defense Meteorological Satellite Program-Operational Linescan System (DMSP-OLS), providing greater advantages in regional economic research [47]. The VIIRS sensor has a total of 22 spectral bands and records the radiance of ground illumination in units of nanoWatts/sr at a spatial resolution of 15 arcseconds. Data acquisition began in April 2012, and images are available at daily, monthly, and annual intervals. In this study, we utilized the version 2.1 monthly data from 2012 to 2022, processed and made available by the Earth Observation Group (EOG) at the Colorado School of Mines (https://eogdata.mines.edu/products/vnl/, accessed on 7 July 2023).
The monthly nighttime light data provided by the EOG group underwent initial processing to remove irrelevant features and low-quality values [48]. However, it still contains outliers caused by factors such as gas flares, fires, and noise. In this study, negative values were set to zero, and an outlier detection method based on the pixel value attribute and its spatial location and implemented in R was employed to further remove outlier pixels. Two sliding windows, 3 × 3 and 9 × 9, were used to calculate pixel robust mean and standard deviation, respectively, to determine appropriate thresholds for outlier removal [49].
After processing monthly nighttime light data, missing monthly data for the year 2012 were filled with the data from 2013. Combining annual data entails deriving the weighted mean from the 12 monthly datasets, factoring in the quantity of cloud-free coverages for each respective month [50]. The data were transformed to a spatial resolution of 500 m using the Asia_Lambert_Conformal_Conic planar projection coordinate system. The following parameters were set: Central_Meridian: 110.0, Standard_Parallel_1: 25.0, Standard_Parallel_2: 47.0, Latitude_Of_Origin: 0.0. A vector map with the same Asia_Lambert_Conformal_Conic projection and the World Geodetic System (WGS)-84 geographic coordinate system was used to clip the NPP/VIIRS data for the Yangtze River Delta region.

2.2.2. Landscan Data

The Landscan dataset, provided by Oak Ridge National Laboratory (ORNL) (https://landscan.ornl.gov/, accessed on 11 July 2023), is a global population database depicting environmental (24 h average) population distribution at nominal one kilometer resolution. This dataset is constructed utilizing various data sources such as the best available census data at sub-provincial levels, satellite imagery, and land-use data to model population distribution [51]. It is extensively used to derive more refined population distributions in regions where census data below the national level is crude or absent [52].
To harmonize Landscan with NPP/VIIRS, we initially converted the population count per grid in Landscan to population density per square kilometer. Employing the nearest-neighbor method, we resampled Landscan data to a 500 m resolution while ensuring consistency in the projection coordinate system with the nighttime light data. Subsequently, we divided the population density per square kilometer by 4 to derive the population count per grid at 500 m resolution. Finally, to address errors caused by resampling, we use the ratio of the total population of each district or county after processing to the total population before resampling as the correction factor for each district or county [53]. The final result is obtained by multiplying the processed pixel-level population total of each district or county by its respective correction factor.

2.2.3. MODIS Data

Given that the study area encompasses more than a single city, the limited coverage of individual Landsat scenes necessitates the use of daily MODIS (MCD43A4) Level 3 data products provided by the Google Earth Engine (GEE) platform (https://earthengine.google.com/, accessed on 4 June 2024). These products are utilized to calculate the Normalized Difference Water Index (NDWI) and the Normalized Difference Vegetation Index (NDVI), effectively mitigating the blooming effect of nighttime light data on water bodies and vegetation.
The MCD43A4 dataset’s surface reflectance values have been corrected using the Bidirectional Reflectance Distribution Function (BRDF), which eliminates atmospheric absorption and scattering, resulting in nadir-view reflectance values that accurately represent the optical properties of the surface. This correction ensures temporal consistency and stability in reflectance values, which is crucial for reliable vegetation index calculations [54]. For this study, scenes from August 2012 and August 2022 were selected, and the MCD43A4 data were resampled to match the projection of the nighttime light data.

2.2.4. Statistical Yearbook Data

This study utilizes resident population and GDP data from 2012 to 2022 to assess the viability of using raster data as a substitute for statistical data. We also investigate the impact of socio-economic parameters on population-economic inconsistencies using five indicators: fixed investment, industry, employment and income, resource consumption, transportation, and education. These indicators are extracted from provincial and Shanghai statistical yearbooks, accessible on the China Social Big Data Research Platform (http://data.cnki.net/, accessed on 12 April 2024). Data for built-up areas in 2012 and 2022 are sourced from the Urban Construction Statistical Yearbook (https://www.mohurd.gov.cn/, accessed on 12 April 2024). The categories and names of each statistical parameter are shown in Table 1.

2.2.5. Administrative Boundary Data

The study area of the Yangtze River Delta includes 41 cities across Jiangsu, Zhejiang, Anhui provinces, and Shanghai Municipality. The administrative boundaries for these provinces and cities were obtained from the National Geomatics Center of China (https://www.ngcc.cn, accessed on 11 June 2023). The geographic coordinate system and projection coordinate system of these data are consistent with those of the nightlight data.

3. Methodology

The experimental workflow of this study is illustrated in Figure 2. First, we standardized the spatial resolution of nighttime light and population raster data from 2012 to 2022 and validated the suitability of raster data as a substitute for statistical data. Next, we calculated multi-scale geographic concentration and inconsistency indices for both nighttime light and Landscan data at pixel and city scales. We compared the 10-year trends in inconsistency indices derived from nighttime light data with those obtained from statistical data and examined the impact of various social factors on these trends. Finally, we extracted pixel-scale inconsistency indices for built-up areas in 2012 and 2022 to perform a quantitative analysis of the coupling changes between population and economic activities within cities.

3.1. Geographic Concentration Index

The geographic concentration index reflects the spatial clustering of a geographic feature in a specific area relative to the overall region. It effectively measures the distribution of population and economic elements within the study area by considering factors such as total economic output, population, and land area [15,16]. It is a key method for evaluating population, economic output, and regional area and serves as an effective indicator for measuring the spatial distribution of both population and economy [15]. Since it was developed using spatially limited statistical data, this indicator can be understood as a measure of factor concentration within urban administrative boundaries, combining both urban and rural areas. Currently, the economic geographic concentration ( L G D P ) and population geographic concentration ( L P O P ) calculated using GDP and resident population data are widely used in population and economic studies at the national, urban agglomeration, and provincial levels. The method is only applicable to statistical data, and the calculation formula is as follows:
L G D P j = G D P j / G D P j S j / S j , L P O P i = P O P j / P O P j S j / S j
where L G D P j is the economic concentration of city j , L P O P j is the population concentration of city j, G D P j is the total GDP of city j , P O P j is the total population of city j , and S j is the land area of city j. A larger value indicates a relatively higher economic total and population density, indicating a stronger economy and population aggregation in the city.

3.2. Population-Economy Inconsistency Index

In previous studies, the inconsistency index is typically defined as the ratio of population geographic concentration to economic geographic concentration in Equation (1). It reflects the coupling relationship between population and economy distribution, serving as an indicator of the consistency level between population distribution and economic development in a certain area [15,17]. This method is only applicable to statistical data, and the calculation formula is as follows:
P j = C P O P i C G D P i
where P j is the population-economy inconsistency index of city j . A larger difference from P j to 1 indicates a greater inconsistency between the population and nightlight distribution in city j . As the value P j approaches 1, it indicates a higher level of consistency between the population and economic distribution in the city j .

3.3. Multiscale Geographic Concentration Index

Geographic concentration indices in previous studies were calculated based on statistical data, often constrained by administrative boundaries. Based on the theoretical foundation of geographic concentration discussed in Section 3.1, this study constructs a multi-scale concentration index applicable at the pixel level using nighttime light data and Landscan data. To differentiate from the concentration index L obtained from statistical data in Section 3.1, we designate the indices derived from these two raster data sources as the Nighttime Light Geographic Concentration ( C T N L ) and the Landscan Population Geographic Concentration ( C L D P ). This approach aims to provide a clearer and more specific representation of human activities within each pixel’s spatial range in the urban structure, relative to the overall concentration level of elements within the study area. At the macro scale, this method achieves similar effects to previous geographic concentration indices; for instance, the concentration index at the city scale can be the sum of all pixel-level concentration indices within the city, reflecting the development and clustering status of economy and population between cities. The formula is as follows:
C T N L i j = T N L i / T N L j S j / S j , C L D P i j = L D P i / L D P j S j / S j
C T N L j = C T N L i j , C L D P j = C L D P i j
where C T N L i j is the nightlight geographic concentration of pixel i in city j , C L D P i j is the population geographic concentration of pixel i in city j , C T N L j is the nightlight geographic concentration of city j , C L D P j is the population geographic concentration of city j , T N L j is the total nightlight brightness of city j, L D P j is the total population of city j , and S j is the land area of city j . A larger value of C T N L i j and C L D P i j indicates a relatively higher population density and economic total of the i pixel within the city j compared to the overall regional baseline, indicating a population aggregation and stronger economy in that area.

3.4. Multi-Scale Inconsistency Index

In areas with high human activity, such as urban regions, the concentration indices derived from the two types of raster data are generally positive. However, in rural areas with lower human activity, it is rare for both datasets to have non-zero or non-empty values at each pixel. Consequently, the inconsistency index within urban areas is divided into high-frequency and low-frequency regions based on the level of human activity.
For pixels in high-frequency activity areas, the inconsistency index between population and nighttime light can be constructed using the ratio of nighttime light concentration ( C T N L ) to Landscan population concentration ( C L D P ) as defined by Equation (3) in Section 3.3. This enables nightlight data to reflect the balance and disparity between population aggregation and economic development at a finer pixel scale between cities. The formula is as follows:
I i j = C L D P i j C T N L i j
where Iij represents the population–nightlight inconsistency index of the pixel i of city j.
The macro-scale population–nighttime light inconsistency index should be derived by summing the inconsistency indices I i j of high-frequency pixels within the administrative region, weighted by N i j , and then adding the inconsistency index I j for low-frequency areas. The weight N i j is the ratio of the nighttime light concentration C T N L i j of pixel i in high-frequency areas to the total nighttime light concentration C T N L i j within the city. Low-frequency areas with minimal human activity are treated as a whole, with their population concentration summed as C L D P i j , and the ratio to C T N L i j represents I j , . The index I i j serves the same purpose as P j in Equation (2) of Section 3.2, representing the balance of elements within the administrative region, allowing for comparison of the reliability of raster data versus statistical data at a macro scale. For instance, to calculate the city-level population-nighttime light inconsistency index, the formula is as follows:
I j = I i j N i j + I j
N i j = C T N L i j C T N L i j
I j = C L D P i j C T N L i j
where I j is the population–nightlight inconsistency index of city j . The larger the difference between I j and 1, the greater the inconsistency between the population and nighttime light distribution in city j . Conversely, the closer I j is to 1, the greater the consistency between the population and nighttime light distribution in city j . The weight N i j is the value each pixel’s inconsistency index in high-frequency human activity areas of city j must be multiplied by to calculate the city’s overall inconsistency index. I j represents the inconsistency index for low-frequency human activity areas in city j .

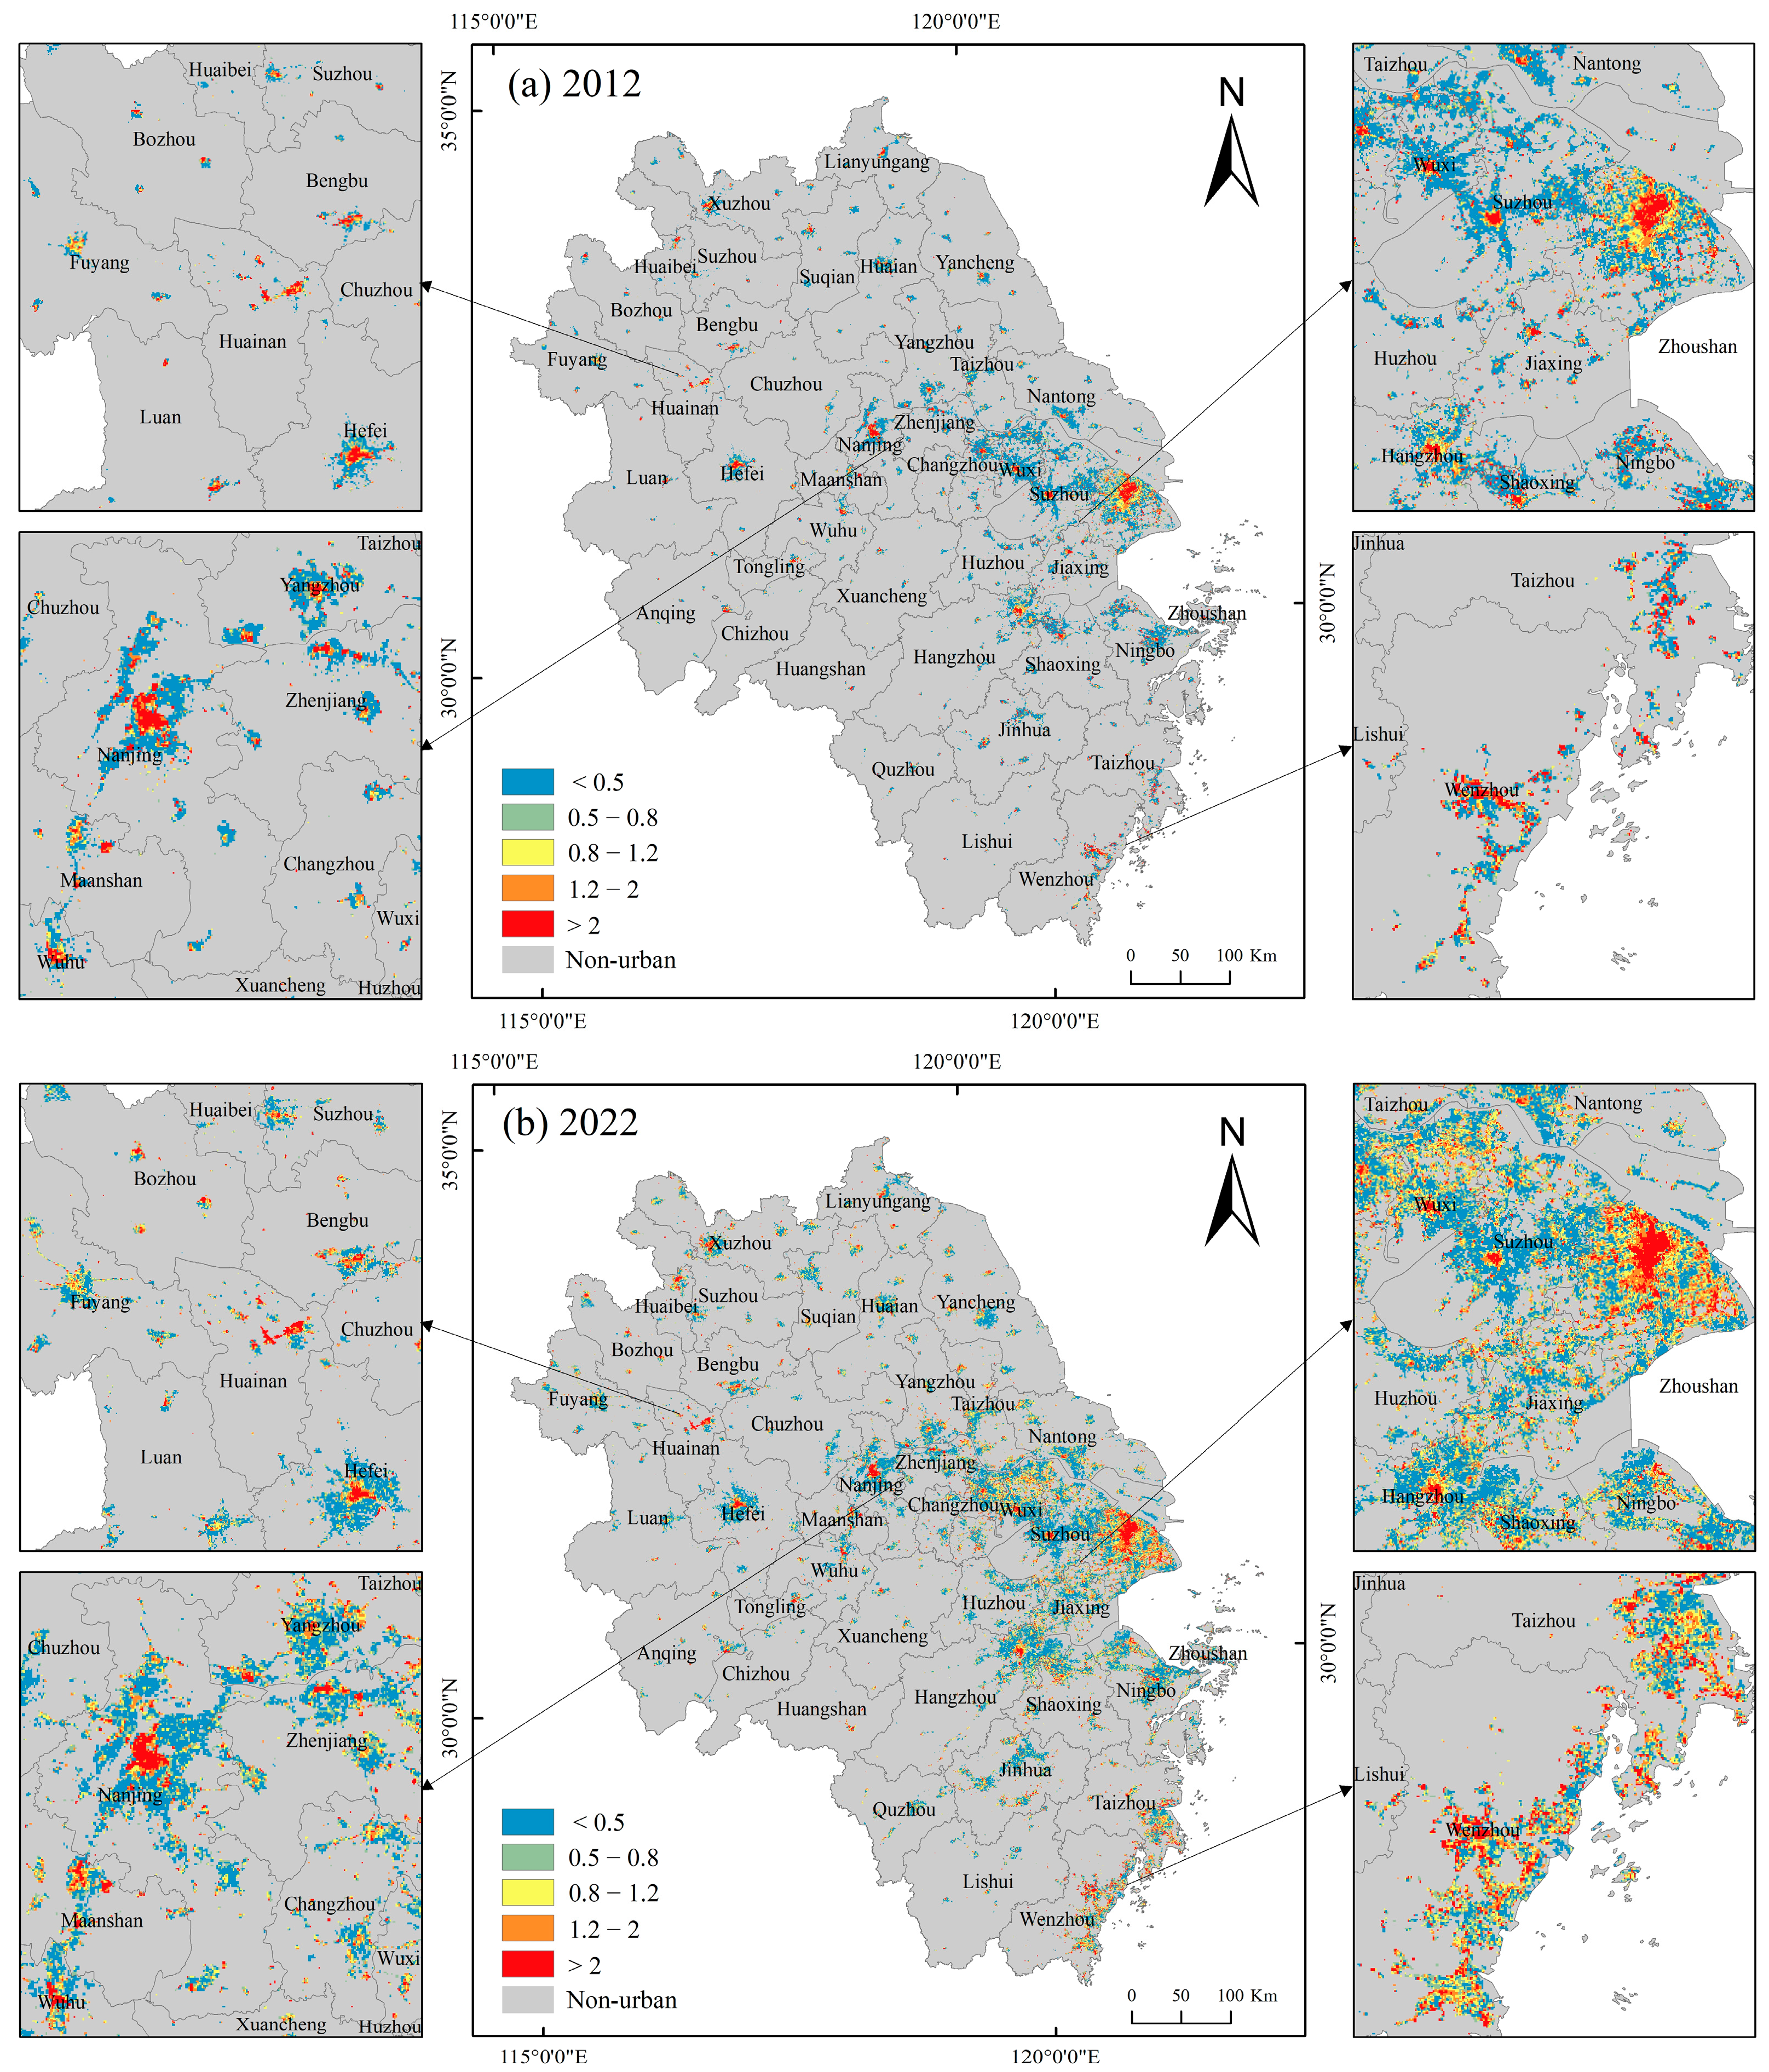
3.5. Built-Up Area Extraction

To better illustrate the spatial relationship between population density and economic activities within cities, this study defines built-up areas as regions that can simultaneously reflect urban economic structures and cover the majority of residential areas in towns and cities. Threshold methods are commonly employed in analyzing nocturnal light data for urban area extraction, including spatial correspondence with ancillary data [55], object-based thresholds [56], and empirical thresholds [57].
This study utilizes MODIS43A4 optical imagery, with a resolution of 500 m, to calculate NDVI and NDWI indices to mitigate the halo effect in nighttime light data. These indices, combined with threshold values derived from Landscan and NPP/VIIRS pixels, were used to extract the final urban built-up areas. Normalized Difference Water Index (NDWI) can effectively eliminate the halo effect of nightlight data on water bodies [58]. In this study, the threshold for water body identification is set to −0.1, followed by binary processing of NDWI. Normalized Difference Vegetation Index (NDVI) is binarized using the Otsu algorithm to mitigate the halo effect of nightlight data on vegetation [59]. LandScan pixels are binarized into 0 and 1 using a threshold of 100 to exclude rural residential areas. By using a threshold value of 5, the NPP/VIIRS data was binarized into 0 and 1 to exclude rural population areas. The formulations are as follows:
A N T L = A N T L [ P O P b N T L b 1 N D V I b 1 N D W I b ]
N D V I = N I R R E D N I R + R E D
N D W I = G N I R G + N I R
where A N T L represents the pixels identified as urban residential areas in this study, P O P b represents the binary population total after binarization, N T L b represents the binarized nighttime light intensity. N D V I b represents the binarized NDVI, and N D W I b represents the binarized NDWI. NIR represents the near-infrared band, RED represents the red band, and G represents the green band.

4. Results

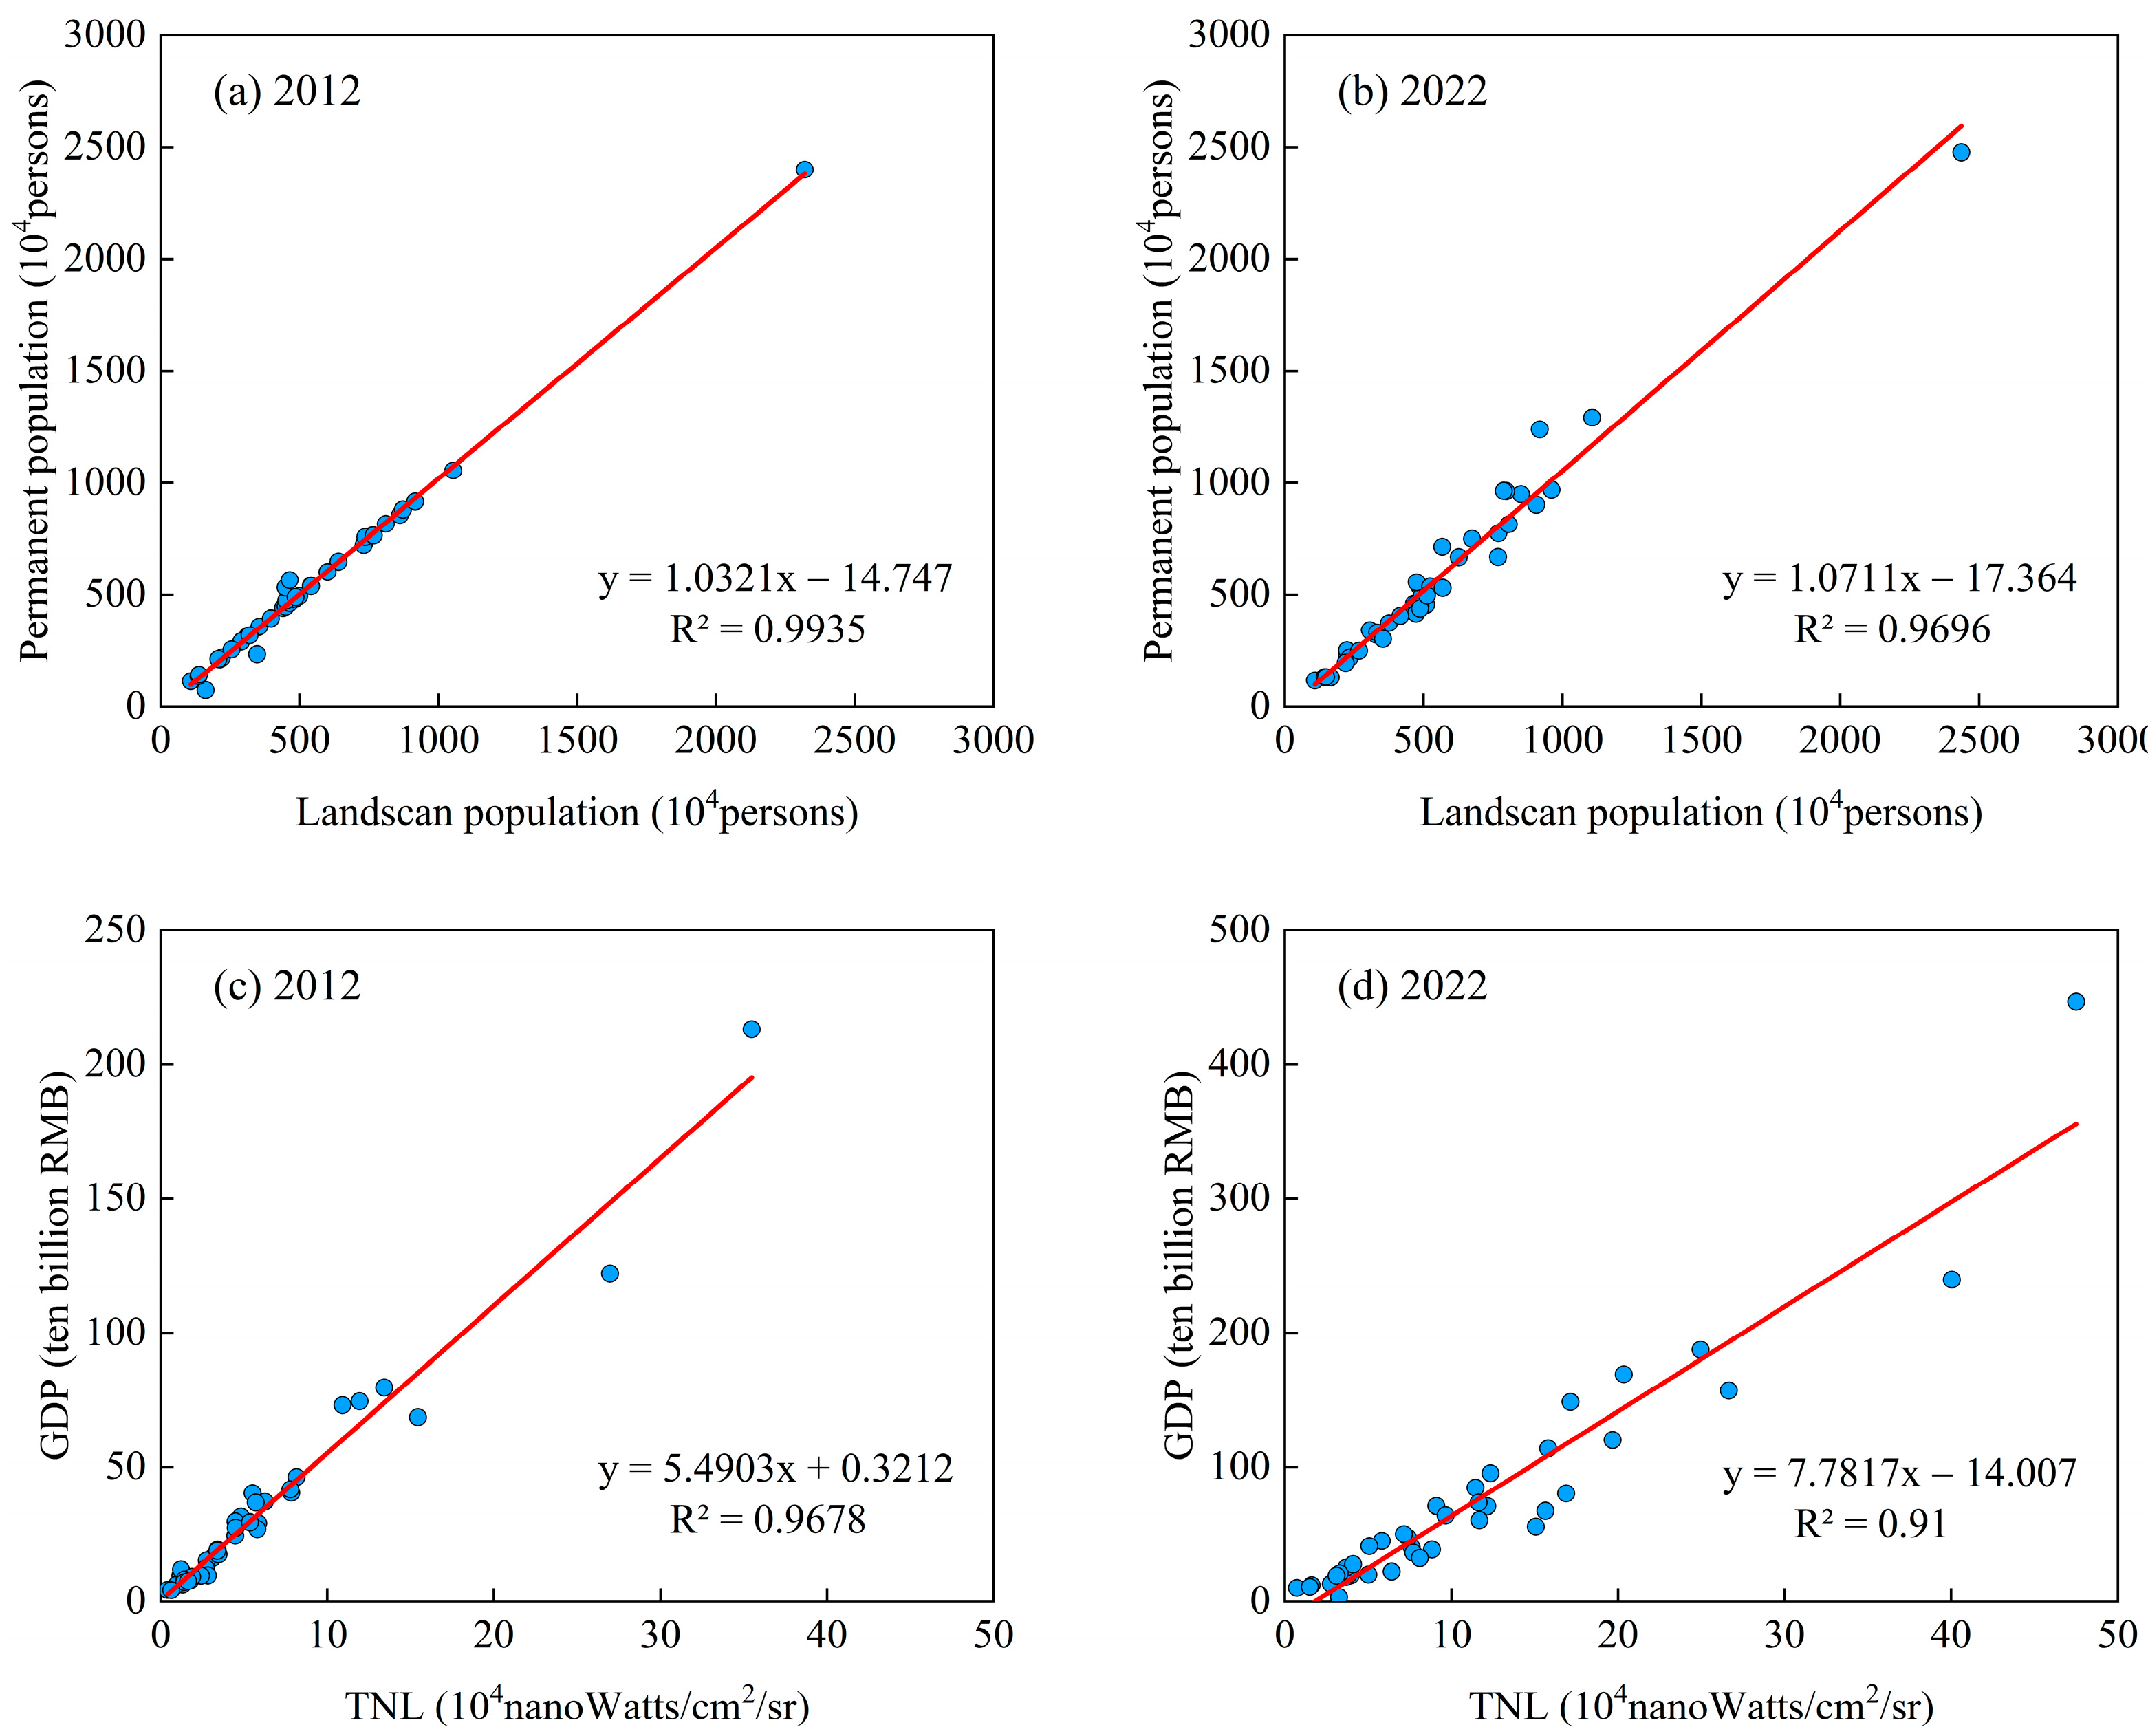
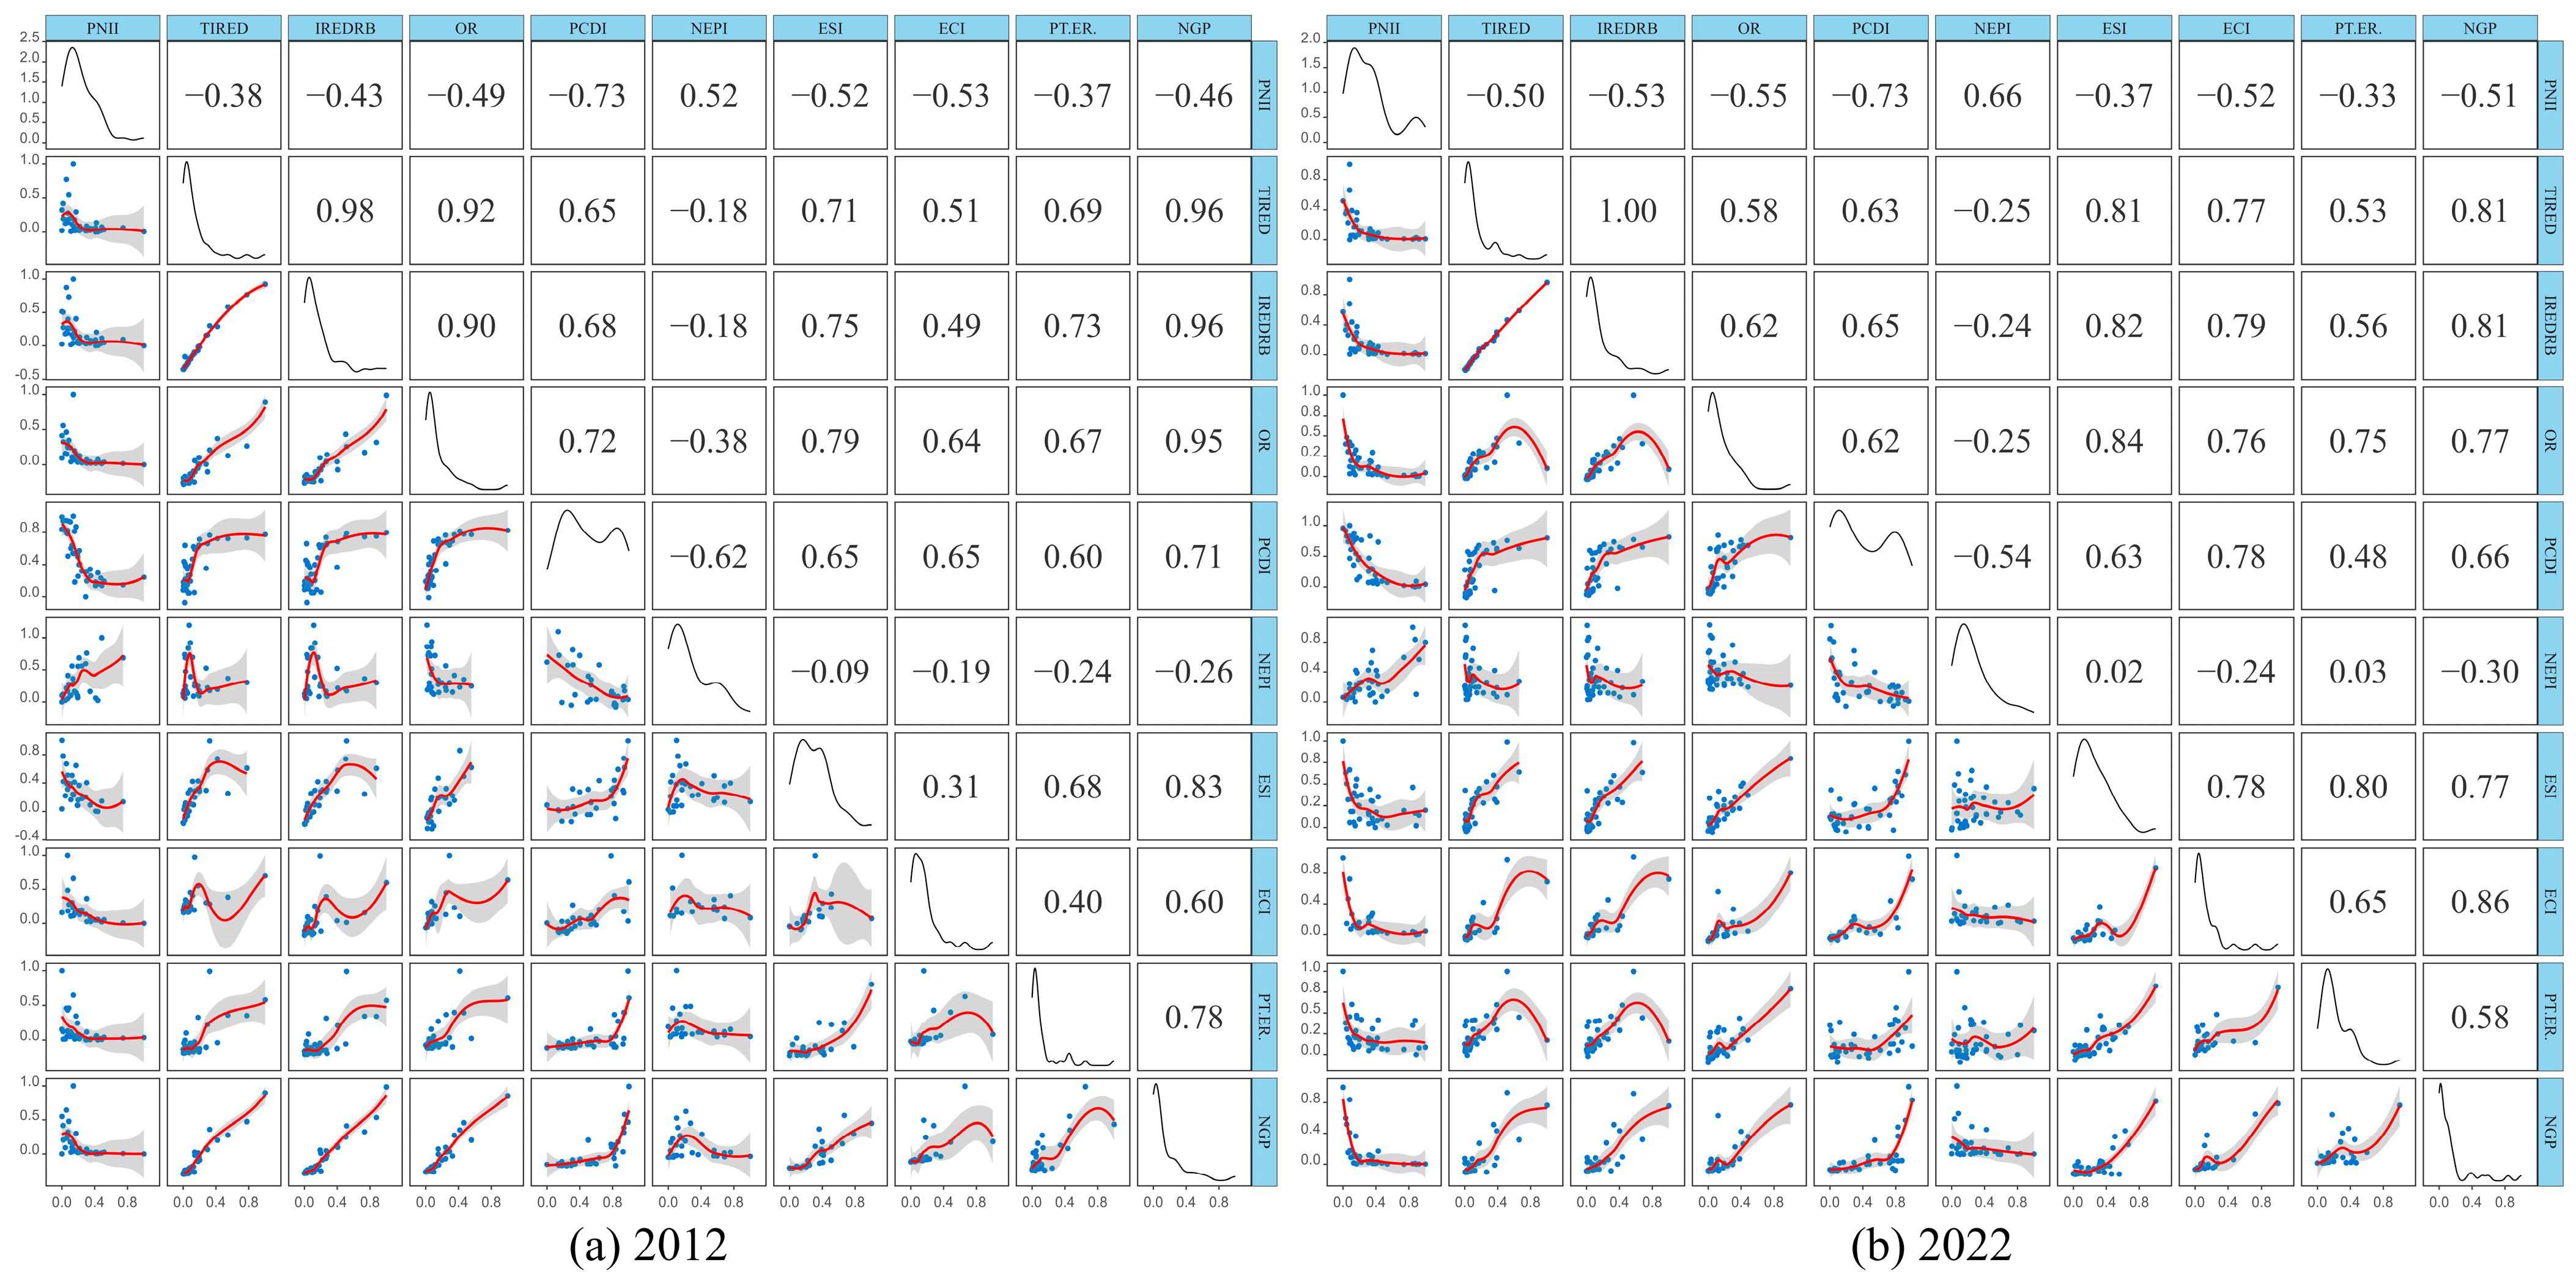
4.1. Relationship between NPP/VIIRS, Landscan Data, and Statistical Data

A linear model was employed to assess the ability of uniformly resolved NPP/VIIRS and LandScan data at a resolution of 500 m to analyze the changing relationship and spatial patterns of economy and population. To eliminate randomness, this study calculated the Pearson correlation coefficients between the grid data and statistical data for 41 cities annually from 2012 to 2022 (Table 2). The correlation coefficients between NPP/VIIRS nightlight and GDP ranged from 0.9107 to 0.9678, while those between LandScan population and resident population ranged from 0.9696 to 0.9957 (Figure 3). The strong linear relationships between NPP/VIIRS and GDP, as well as between LandScan Global and resident population (SPD), demonstrate the rationality of using NPP/VIIRS nightlight data and LandScan Global data as proxy variables for economic and population parameters in the Yangtze River Delta.

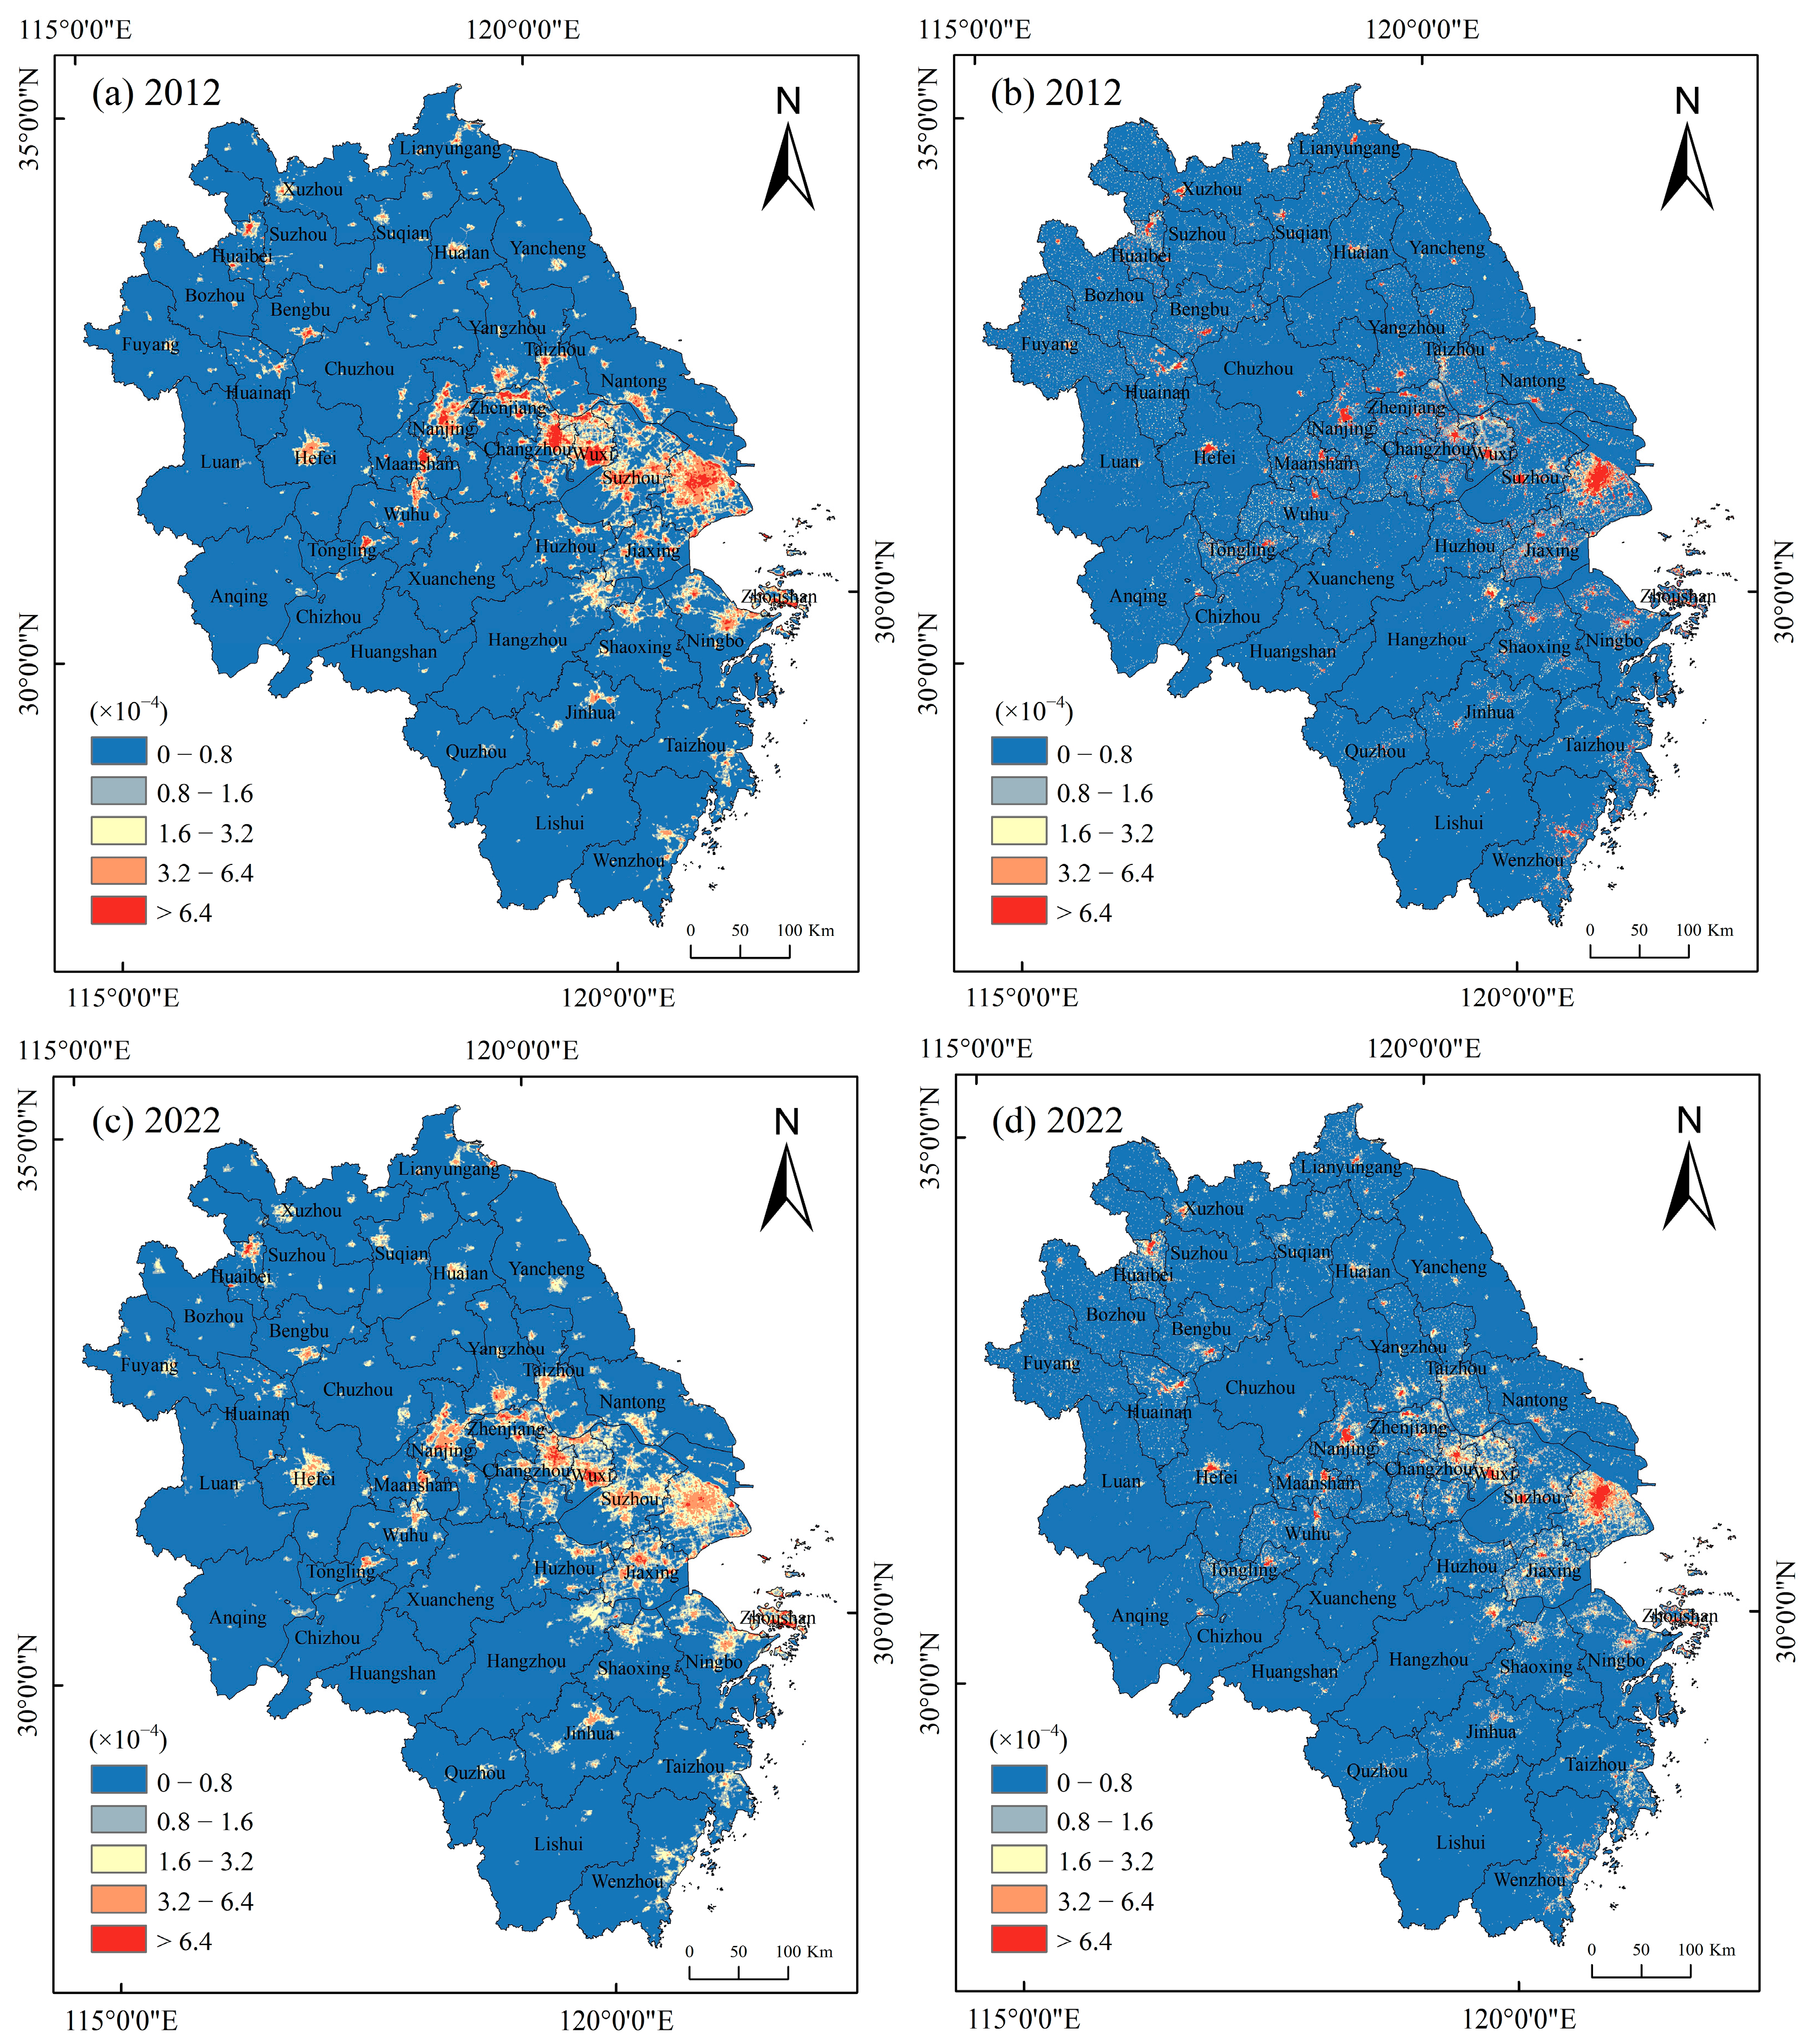
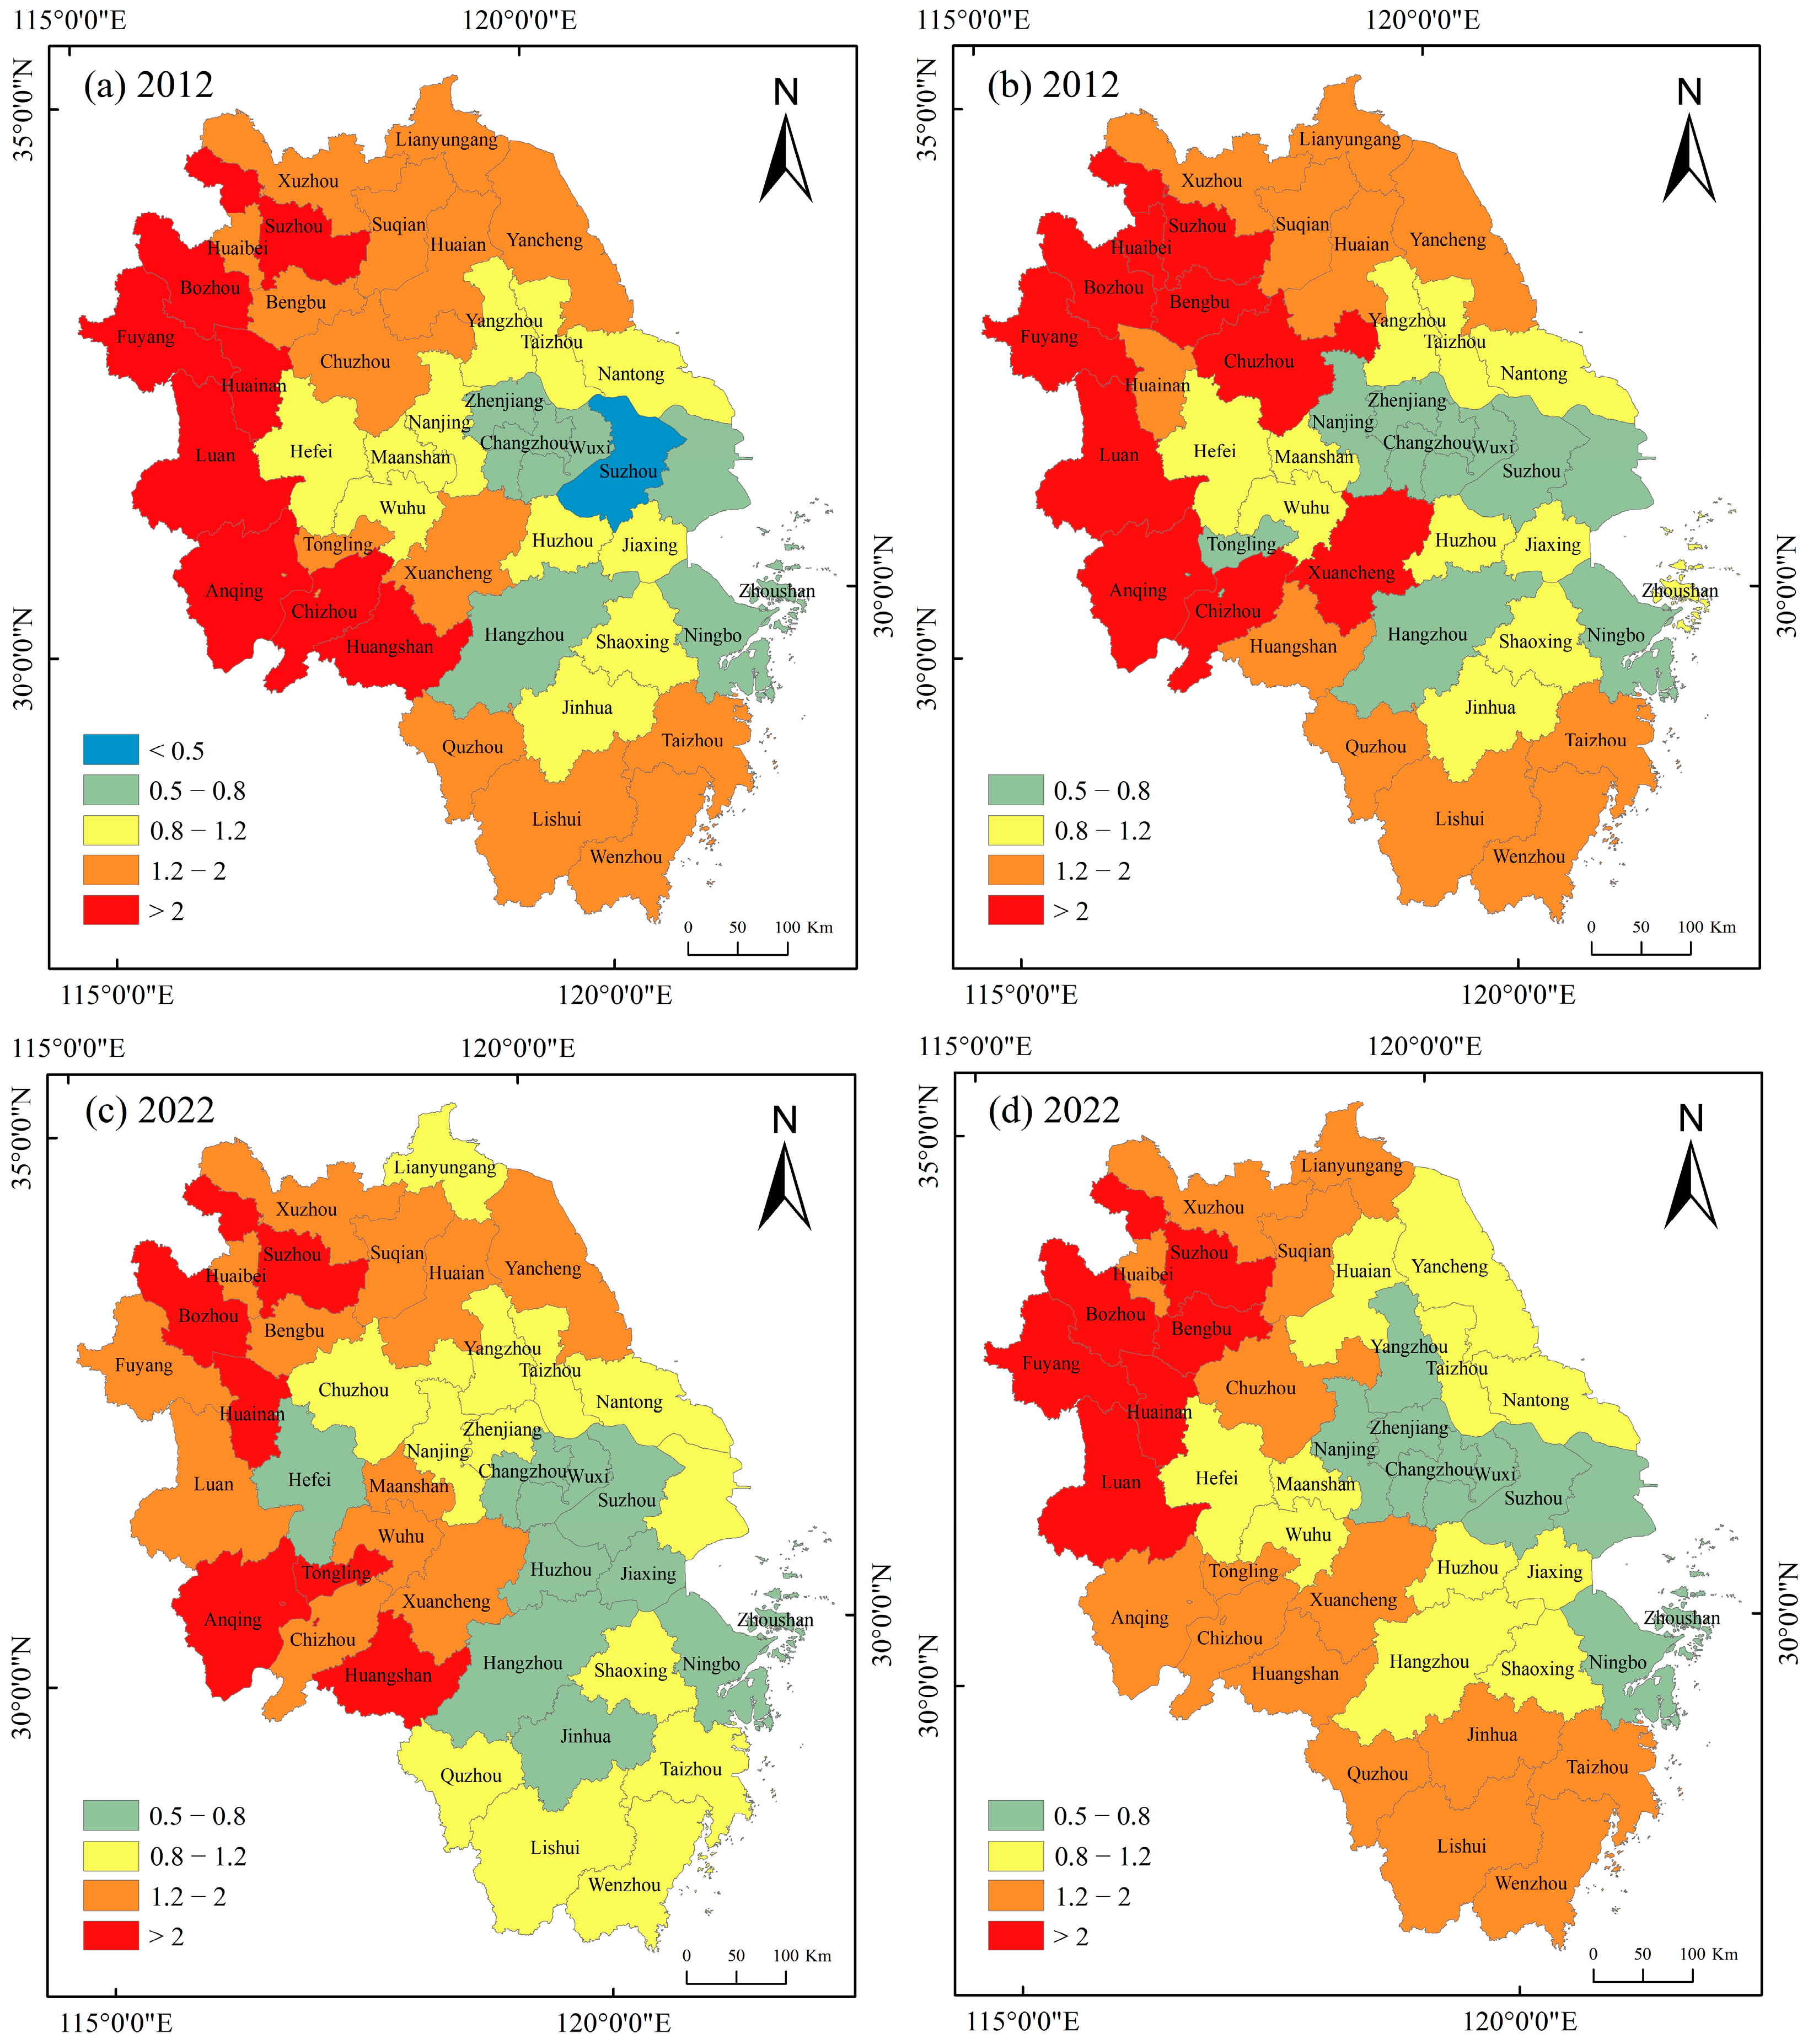
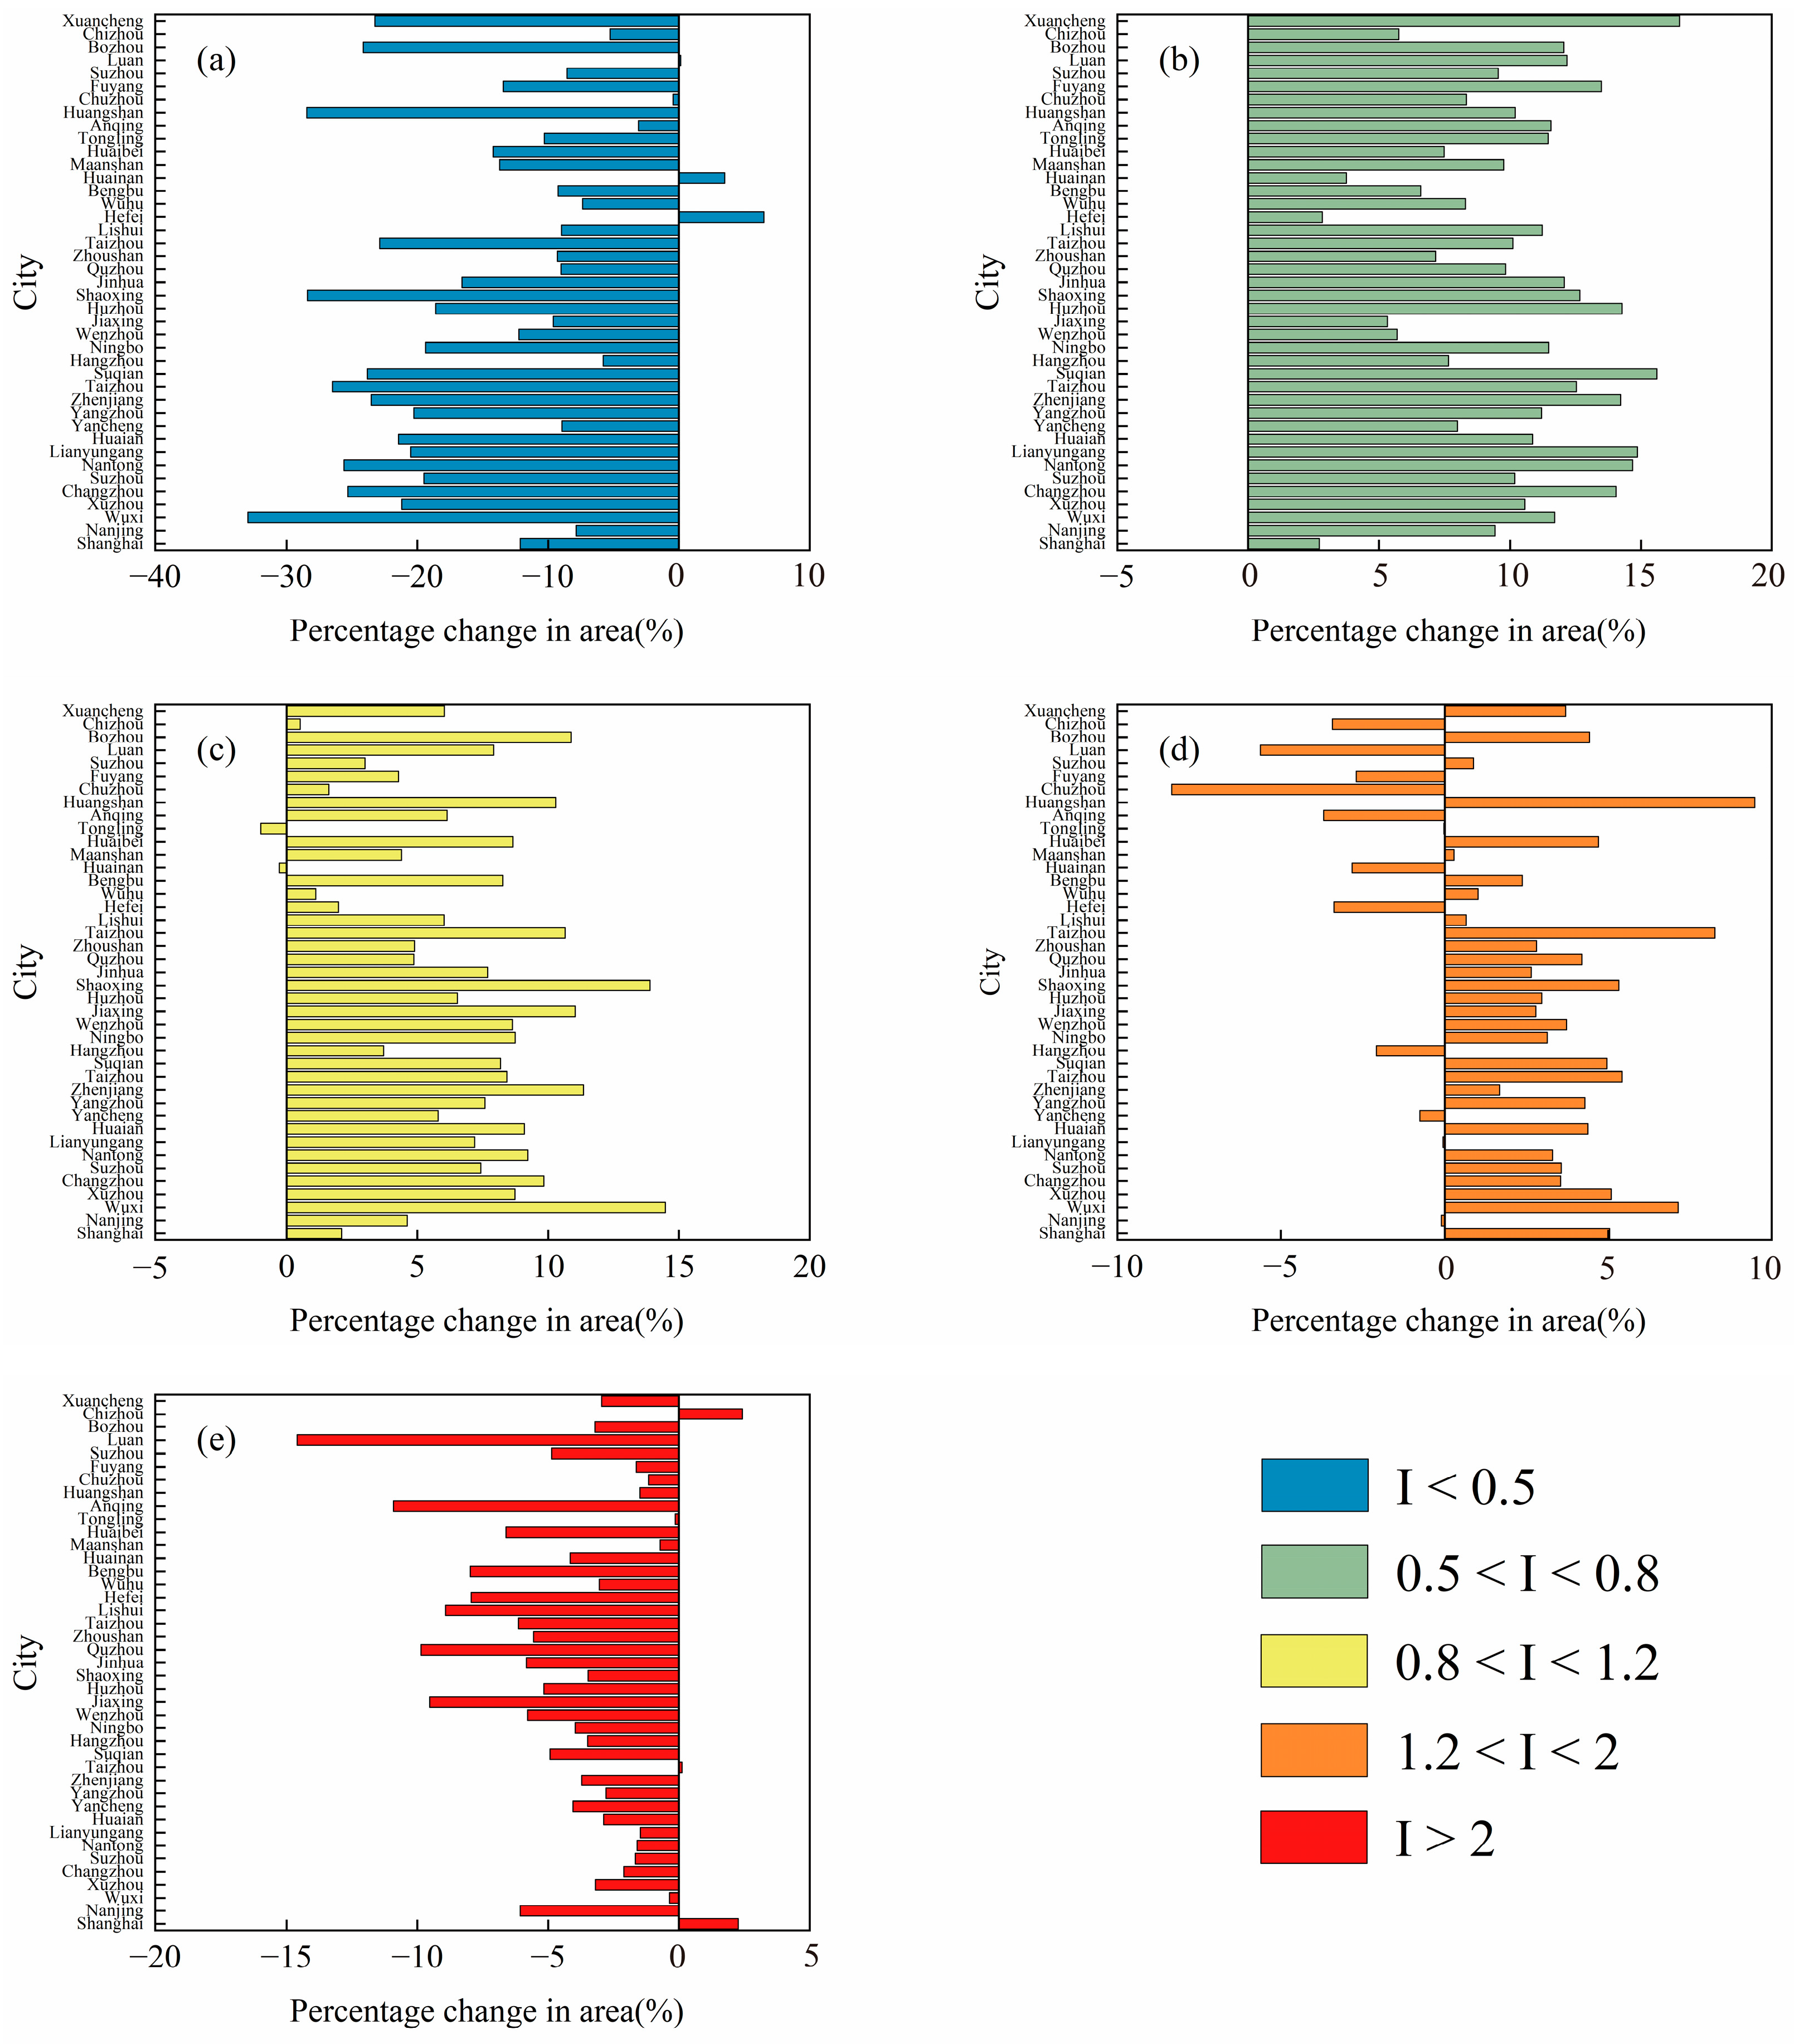
4.2. Evolution of Nightlight and Population Geographic Concentration Patterns

To provide a clearer demonstration of the changes in nightlight intensity and population at the micro-scale, this study manually divided the pixel-based nightlight concentration index and population concentration index for 2012 and 2022 into five levels using the same threshold (Figure 4). Regions with concentration levels less than 1.6, greater than 1.6 but less than 3.2, and greater than 3.2 are referred to as low-, medium-, and high-concentration areas of the elements, respectively. In 2012, within the Yangtze River Delta, both nighttime light and population were primarily concentrated along three main axes: from Ma’anshan to Shanghai, Shanghai to Hangzhou, and Hangzhou to Zhoushan, forming an overall Z-shaped pattern. By 2022, as cities continued expanding outward, the concentration of nighttime light and population in urban centers decreased, while the peripheral areas transitioned rapidly from low-aggregation zones to moderate-aggregation zones for these elements.
To better demonstrate the macroscopic patterns of element changes at the city scale, the Jenks natural breaks classification method in ArcGIS 10.8 was utilized. It automatically divided the nightlight and population geographic concentration indices for each city-level scale from high to low into five levels for both 2012 and 2022. This ensured that the variance within each class was minimized while the difference between classes was maximized (Figure 5). City clusters in the Yangtze River Delta displayed an east-to-west densification gradient, indicating a core–periphery pattern. In 2012, nighttime light concentrated along the Shanghai–Nanjing and Shanghai–Ningbo corridors, expanding by 2022 to cover Suzhou, Hefei, and parts of Zhejiang. Population remained concentrated along the Shanghai–Nanjing corridor but was sparse in western areas, especially border regions from Lu’an to Lishui, over the decade.

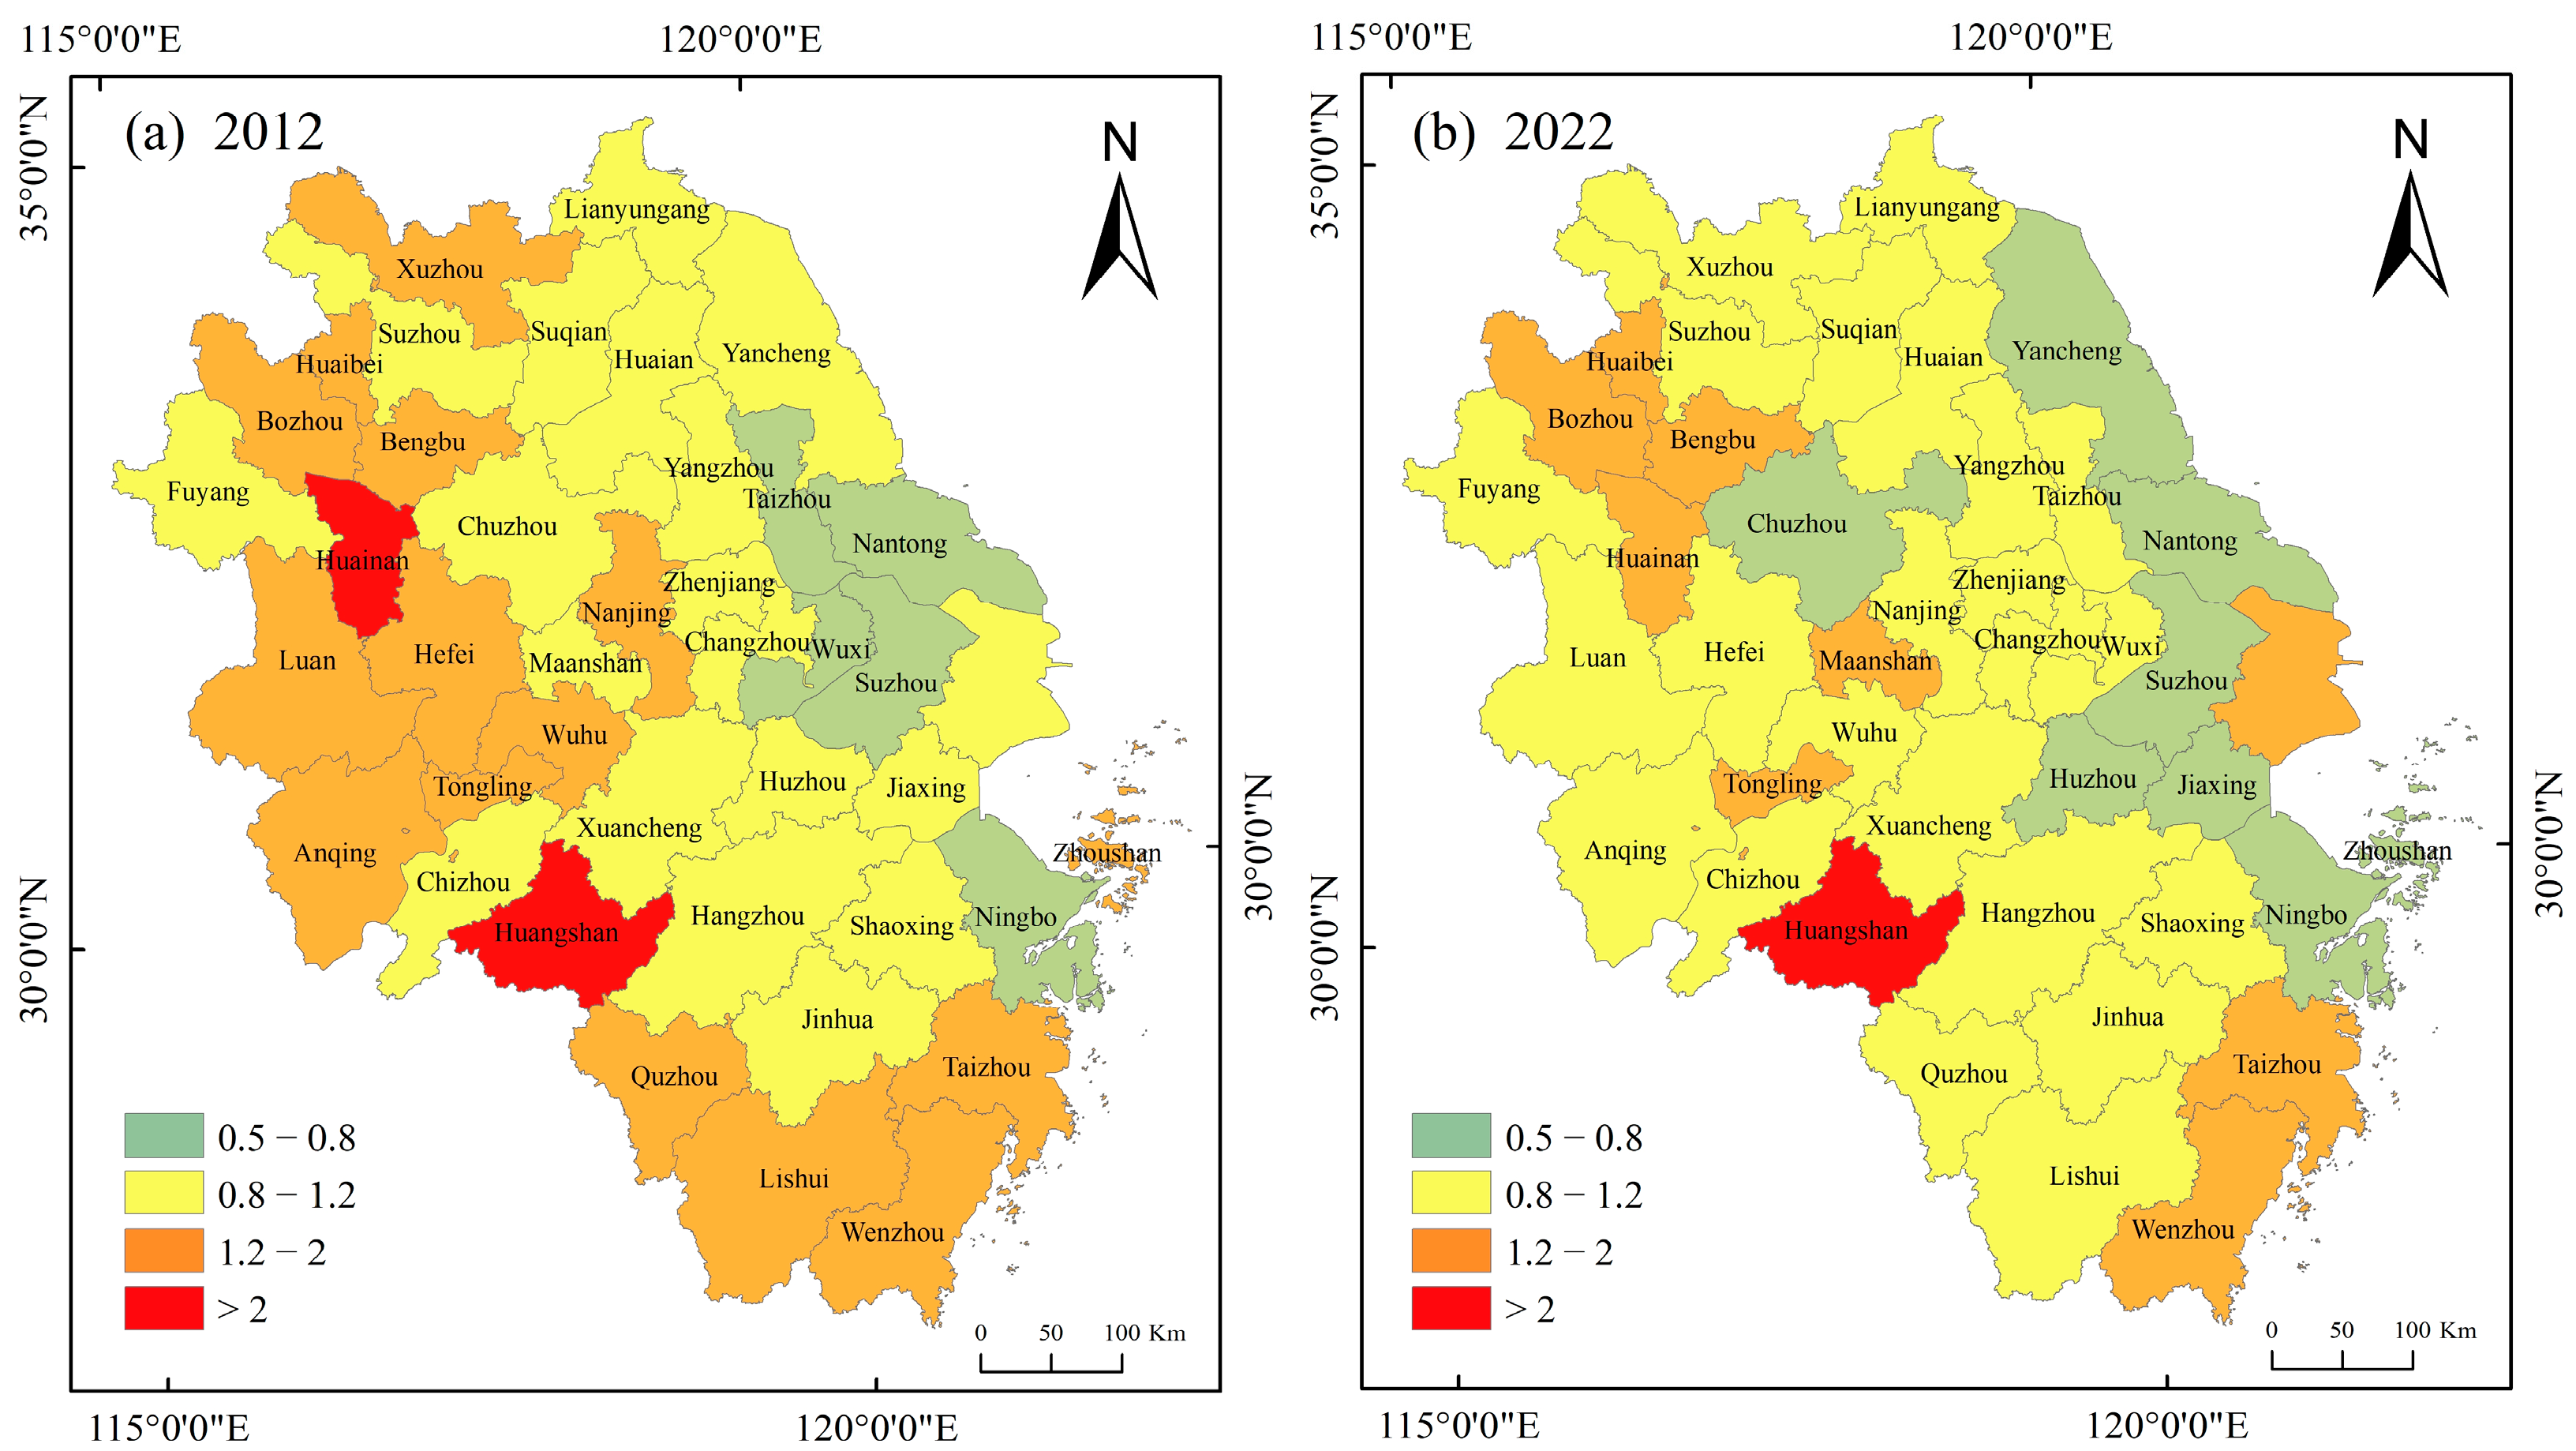
4.3. Patterns and Influencing Factors of Inconsistency Index Changes

For the purpose of comparing the computational effectiveness between raster and statistical data, the extraction of built-up areas is temporarily suspended in this section. According to the Chinese spatial consistency classification standard for population distribution and economic development [60], the disparity in population and nighttime light intensity across various cities in the Yangtze River Delta is classified into five categories in Figure 6: Category 1, where population aggregation is significantly lower than nighttime light aggregation (I < 0.5); Category 2, where population aggregation slightly lags behind nighttime light aggregation (0.5 < I < 0.8); Category 3, where population aggregation matches economic aggregation (0.8 < I < 1.2); Category 4, where population aggregation slightly exceeds nighttime light aggregation (1.2 < I < 2); and Category 5, where population aggregation far exceeds nighttime light aggregation (I > 2). The high deviation between population and nightlight in the first and fifth categories indicates that these areas are highly inconsistent in terms of population and economic development within urban areas, which inhibits sustainable development in these regions. The Delta’s core area, historically economically robust, maintains a lower inconsistency index. Conversely, western urban zones host more population but exhibit smaller economic capacities. Trends in grid and statistical data mirror each other: rising inconsistency indices in the east, diminishing trends in select western areas.
After validating NPP/VIIRS and Landscan as proxies for economic and population parameters (Section 4.1), we computed the average values of geographical concentration and inconsistency index for these parameters across 41 Yangtze River Delta cities from 2012 to 2022 using grid and statistical data (Table 3). The average L_TNL decreased from 1.17 to 1.15, mirroring the average L_GDP trend. Geographical population concentration, from Landscan and resident population (RP), remained around 1.1. The grid-based inconsistency index dropped from 1.57 to 1.33, showing improved population-economic balance within the Delta urban cluster, differing from statistical trends.
Political effects, market mechanisms, spatial industrial linkages, and transportation networks exert a crucial influence on the development of urban agglomerations [61]. Changes in population and economy are often associated with socio-economic variables such as market mechanisms, employment, transportation, and investment. Therefore, this study collected various statistical parameters from cities in the Yangtze River Delta (YRD) region based on Table 1, including fixed investments, income and employment, industry, resources, transportation, and education—11 categories in total. The data were standardized and normalized. Due to the limited spatial resolution of the statistical data, the loess regression method in R was used to fit the 11 parameters to the city-scale population–nightlight inconsistency index (PNII) derived from raster data, calculating the correlation coefficients. This approach aimed to identify the key social factors leading to inconsistent changes in population and economy across YRD cities. The parameters with absolute correlation coefficients greater than 0.3 for the years 2012 and 2022 are shown in Figure 7.
Excluding Huangshan City, the correlation coefficients of primary industry employment with the inconsistency index were 0.52 in 2012 and 0.66 in 2022, indicating a strong positive correlation. The per capita disposable income showed the lowest correlation coefficients with the inconsistency index, both being −0.73 for the two years. Industrial electricity consumption remained relatively stable, with coefficients less than −0.5 in both years. Other parameters, including real estate, transportation, and education, had negative correlation coefficients with the inconsistency index, indicating varying degrees of negative impact. Thus, it is evident that the influence of social parameters on the inconsistency index is multifaceted, with employment and income being the primary factors.

4.4. Evolution of Urban Inconsistency Index Patterns

The method described in Section 3.5 was utilized to extract built-up areas. The extracted built-up areas for the 41 cities in 2012 and 2022 were compared with data published in the urban statistical yearbooks for 2012 and 2022. Determination indices of 0.71 and 0.61 were obtained, respectively. Similarly, determination indices of 0.96 and 0.94 were obtained for the fit between Landscan population totals and urban resident populations for 2012 and 2022, respectively, within the extracted built-up areas. These results indicate that the built-up area extraction method employed in this study provides a reasonable level of accuracy by considering both urban construction areas and the distribution of population residences.
The population–nighttime light inconsistency index were computed for urban area pixel scales in 2012 and 2022 (Figure 8). The results reveal that in most cities, the central urban regions exhibit significantly higher population concentration compared to nighttime light intensity (I > 2). Slightly farther from the city centers, there is a tendency toward a more coordinated aggregation of population and economy (0.8 < I < 1.2), while the outer areas of the cities mostly display lower population concentration compared to nighttime light intensity (I < 0.5). This inconsistency is notably evident in highly urbanized cities such as Shanghai, Suzhou, Nanjing, Wuxi, Hefei, and Hangzhou, where urbanization rates exceed 80%.
The statistical distribution of the five categories of population–nighttime light inconsistency index within each city is illustrated in Figure 9. Most cities are experiencing a shift from categories where population concentration is significantly lower than nighttime light concentration (I < 0.5) and where population concentration far exceeds nighttime light concentration (I > 2) to the other three categories. Notably, Wuxi and Shaoxing show the largest increase in the area where population aggregation aligns with economic aggregation, with increments of 14.48% and 13.89%, respectively.
Quantitative calculations of population–economic consistency levels within urban areas for 2012 and 2022 are presented in Table 4 and Table 5. In 2012, 90.87% of urban areas within the city cluster demonstrated inconsistencies between population and nighttime light distribution, accounting for 90.02% of the total NTL and 88.67% of the total population. Nearly 60% of the regions showed population concentration significantly lower than nighttime light concentration, and nearly half of the population is concentrated where the population was significantly higher than nighttime light intensity. By 2022, the area demonstrating coordination between population and economic aggregation increased from 9.13% to 16.24%, with corresponding population percentages increasing from 11.33% to 16.33%. This indicates a growing trend towards population–economic consistency.
We analyze the evolution of the inconsistency pattern between urban population and nighttime light from 2012 to 2022 in Figure 10. The inconsistency index in the Yangtze River Delta follows an east-to-west gradient. Over the past decade, cities demonstrating coordinated population and nighttime light increased from 19 (46.3% of the total) to 23 (56.1% of the total).

5. Discussion

5.1. Analysis of Driving Forces of City Development

Since China’s WTO accession in the 20th century, the Yangtze River Delta (YRD) has undergone rapid economic development and market refinement. The eastern core region, benefiting from favorable initial conditions, has attracted high-quality resources from surrounding areas through market-driven siphoning and polarization effects, resulting in a high-to-low spatial pattern of economic and population concentration from east to west. Political factors such as industrial relocation and integration have slowed industrial upgrades and urban expansion in cities like Shanghai, while market-driven spillover effects have caused nocturnal light emissions to spread from central areas to surrounding regions. This finding aligns with previous studies [43]. High employment, income, and consumption levels in developed areas like Southern Jiangsu and Shanghai contribute to stable population concentrations [62], consistent with our finding in Section 4.3 that income and employment significantly impact inconsistency levels. To address higher inconsistency indices, regions should increase per capita income and industrial capacity or reduce primary sector employment. Conversely, areas with lower indices should attract more population through targeted policies. Excessive population concentration negatively affects urban development, and the trend of population migration towards large cities in the YRD may eventually reverse [63]. Our results show a gradual decrease in population concentration, supporting this potential reversal. The YRD exhibits a high-to-low distribution of population and economic activity from east to west, and the decrease in the inconsistency index over the past decade indicates reduced imbalance between population and economic development. This trend is further supported by studies on sustainable development from social, economic, and ecological perspectives [64].
At the urban scale, achieving population and economic concentration does not necessarily imply an identical spatial distribution of population and economic elements within the city. Population and economic factors tend to concentrate in the city center, with varying gradients as one moves away from the city center [41]. At the pixel level, populations and nighttime lights in various cities in the Yangtze River Delta primarily concentrate in the urban core. However, as one moves further from the city center, the gradient of population concentration decreases more significantly, resulting in areas on the outskirts of the city being predominantly characterized by population concentrations far lower than nighttime light concentrations (I < 0.5). Meanwhile, the central areas of the city are typically characterized by population concentrations significantly higher than nighttime light concentrations (I > 2). This phenomenon stems from richer manufacturing and service industries in urban cores, coupled with higher land use density and lower transportation costs for commuting [41]. Population aggregation aligns with economic factors while also displaying a certain lag. Over the past decade, cities have rapidly expanded outward, leading to a migration of economically driven population from urban cores to peripheral regions. Consequently, areas that previously exhibited significantly lower population aggregation compared to light intensity (I < 0.5) in the peripheral zones have transformed into areas where population aggregation aligns with economic aggregation (0.8 < I < 1.2). Simultaneously, achieving a balance between the overall population and economic output within the city’s administrative boundaries becomes relatively more feasible, indicating that the strong population aggregation in western areas of urban clusters primarily stems from a lower urbanization ratio, with most of the population still residing in rural areas.
To address the persistent “core–periphery” regional disparities within the Yangtze River Delta urban agglomeration, the government should actively enhance its coordinating role. This can be achieved through the design of special policies aimed at fostering regional cooperation between the core areas of Shanghai and its surrounding regions and the relatively underdeveloped areas of northern Jiangsu, southwestern Zhejiang, and northern Anhui. Continuous promotion of metropolitan integration is essential, leveraging central cities to amplify the synergetic effects on neighboring urban areas.
Enhancing the level of joint urban and rural infrastructure development will facilitate regional cooperation and urban-rural integration across cities. Furthermore, improving infrastructure in new urban areas and suburbs can encourage population migration from city centers, alleviating resource pressures in central urban zones [65]. These measures will contribute to a balanced and sustainable development of urban spaces, harmonizing population distribution with economic activities.

5.2. Limitations and Future Prospects

This study also presents several uncertainties. Variability in the availability of satellite data and differences in information extraction techniques among different Landscan data sets from different periods may affect the comparability of spatial accuracy between years [66]. Additionally, resampling the population estimates represented by Landscan pixels with a resolution of approximately 1 km into four 500 m resolution pixels may influence the accurate estimation of population in the 500 m pixel area. Using a unified threshold to extract built-up areas based on population and nighttime light data might result in the omission of certain areas with weaker human economic activity. However, these limitations do not significantly affect the estimation of the degree of coordination between population and nighttime light at a large spatial scale and over a long time scale in this study.
Nighttime light data are positively correlated with daytime economic indicators such as institutional density and total wages, indicating that while nighttime lights primarily reflect nocturnal human activity, they also represent broader economic activities within urban areas [67]. Therefore, analyzing nighttime lights alongside 24 h average population activity data, such as Landscan, is justifiable. Future research should utilize higher-resolution population spatial data to ensure accuracy at the pixel level [30]. Additionally, nighttime light data can be combined with multi-source geospatial data to generate grid-based GDP data, thereby improving its capability to represent comprehensive economic activities at a micro level [68]. VIIRS data could be assimilated with DMSP data to create longer-term nighttime light datasets [69], facilitating the study of long-term economic and population dynamics. To address spatial imbalances in urban structures, methods such as inverse functions and concentric ring approaches can more effectively illustrate spatial gradients of population density and light intensity [2]. Furthermore, combining grid-based socioeconomic parameters with techniques like geographic detectors can improve the assessment of the spatial balance between population and economic activities in built-up areas.
The improved pixel-level geographic concentration and inconsistency indices in this study enhance their ability to reflect the matching degree of urban elements at a fine scale while preserving the macroscopic summarization capability of the original indices. These indices can be calculated using any spatial scale of satellite or geographic spatial data. However, the criteria for classifying the consistency degree between population and nighttime light at the pixel scale still rely on previous research standards derived from statistical data [60]. In the future, more rational criteria could be developed by considering deeper levels of interaction between population and economy in different regions. Additionally, these indices are not only applicable to studies related to economy and population but can also be combined with road network data, POI data, carbon dioxide, land use, and other rasterized data to comprehensively explore the consistency degree among factors such as human activities, economic development, and environmental changes within cities, making deeper and multi-faceted contributions to promoting urban sustainable development.

6. Conclusions

This study explores the feasibility of using nighttime light data to assess spatial inconsistencies between population and economic activities at both city and fine scales. To measure these inconsistencies more accurately at the micro scale, we developed improved multi-scale geographic concentration and inconsistency indices, comparing results with statistical data at the city scale. The results indicate a high correlation between the two data sources over a decade, with a similar trend of decreasing average inconsistency index. Employment and income are identified as major influencing factors. In the Yangtze River Delta, population density decreases with increasing distance from city centers, showing a more pronounced gradient than nighttime light intensity. Areas with low population density relative to nighttime light (I < 0.5) and high population density relative to nighttime light (I > 2) have significantly decreased. Conversely, areas with balanced population and economic concentration (0.8 < I < 1.2) have experienced growth in land area, nighttime light intensity, and population, with the most notable increase in population. This has led to a reduction in the mismatch between population and nighttime light within urban areas. NPP/VIIRS nighttime light data have proven to be an effective source for revealing detailed patterns and levels of population and economic concentration. Future research should integrate these data with other rich geospatial sources to further enhance the understanding of the underlying factors influencing the coordinated development of population and economic activities, particularly in rapidly urbanizing areas, and to monitor and evaluate dynamic urban development.

Author Contributions

Conceptualization, Y.X.; methodology, Y.X. and Z.W.; software, B.L. and L.W.; validation, Z.W., L.W. and B.L.; writing—original draft preparation, Y.X.; writing—review and editing, S.C. and Z.W.; funding acquisition, S.C. All authors have read and agreed to the published version of the manuscript.

Funding

This research was funded by the National Key Research and Development Program of China (grant No. 2020YFA0714103).

Data Availability Statement

The data presented in this study are available in NPP/VIIRS Nighttime Light Data at https://eogdata.mines.edu/products/vnl/, accessed on 7 July 2023; Landscan Data at https://landscan.ornl.gov/, accessed on 11 July 2023; MODIS (MCD43A4) Level 3 data at https://earthengine.google.com/, accessed on 4 June 2024; The historical data on permanent resident population and GDP at http://data.cnki.net/, accessed on 12 April 2024; Urban Construction Statistical Yearbook at https://www.mohurd.gov.cn/, accessed on 12 April 2024; Administrative Boundary Data at https://www.ngcc.cn, accessed on 11 June 2023.

Conflicts of Interest

The authors declare no conflicts of interest.

References

  1. Ritchie, H.; Samborska, V.; Roser, M. Urbanization. Our World Data 2024. Available online: https://ourworldindata.org/urbanization (accessed on 23 July 2024).
  2. Zheng, M.; Huang, W.; Xu, G.; Li, X.; Jiao, L. Spatial gradients of urban land density and nighttime light intensity in 30 global megacities. Humanit. Soc. Sci. Commun. 2023, 10, 404. [Google Scholar] [CrossRef]
  3. Akuraju, V.; Pradhan, P.; Haase, D.; Kropp, J.P.; Rybski, D. Relating SDG11 indicators and urban scaling–An exploratory study. Sustain. Cities Soc. 2020, 52, 101853. [Google Scholar] [CrossRef]
  4. Yang, Z.; Yang, H.; Wang, H. Evaluating urban sustainability under different development pathways: A case study of the Beijing-Tianjin-Hebei region. Sustain. Cities Soc. 2020, 61, 102226. [Google Scholar] [CrossRef]
  5. Xu, Z.; Coors, V. Combining system dynamics model, GIS and 3D visualization in sustainability assessment of urban residential development. Build. Environ. 2012, 47, 272–287. [Google Scholar] [CrossRef]
  6. Dong, L.; Longwu, L.; Zhenbo, W.; Liangkan, C.; Faming, Z. Exploration of coupling effects in the Economy–Society–Environment system in urban areas: Case study of the Yangtze River Delta Urban Agglomeration. Ecol. Indic. 2021, 128, 107858. [Google Scholar] [CrossRef]
  7. Cohen, B. Urbanization in developing countries: Current trends, future projections, and key challenges for sustainability. Technol. Soc. 2006, 28, 63–80. [Google Scholar] [CrossRef]
  8. Wang, Q.; Su, M. The effects of urbanization and industrialization on decoupling economic growth from carbon emission—A case study of China. Sustain. Cities Soc. 2019, 51, 101758. [Google Scholar] [CrossRef]
  9. Liang, L.; Chen, M.; Luo, X.; Xian, Y. Changes pattern in the population and economic gravity centers since the Reform and Opening up in China: The widening gaps between the South and North. J. Clean. Prod. 2021, 310, 127379. [Google Scholar] [CrossRef]
  10. Yufeng, W. Analysis on the evolution of spatial relationship between population and economy in the Beijing-Tianjin-Hebei and Shandong region of China. Sustain. Cities Soc. 2022, 83, 103948. [Google Scholar] [CrossRef]
  11. Bloom, D.; Canning, D.; Sevilla, J. The Demographic Dividend: A New Perspective on the Economic Consequences of Population Change; Rand Corporation: Santa Monica, CA, USA, 2003. [Google Scholar]
  12. Paganelli, M.P. Adam Smith and economic development in theory and practice: A rejection of the stadial model? J. Hist. Econ. Thought 2022, 44, 95–104. [Google Scholar] [CrossRef]
  13. Wang, Y.; Zou, H.; Duan, X.; Wang, L. Coordinated Evolution and Influencing Factors of Population and Economy in the Yangtze River Economic Belt. Int. J. Environ. Res. Public Health 2022, 19, 14395. [Google Scholar] [CrossRef]
  14. Yang, Z.; Hong, Y.; Zhai, G.; Wang, S.; Zhao, M.; Liu, C.; Yu, X. Spatial Coupling of Population and Economic Densities and the Effect of Topography in Anhui Province, China, at a Grid Scale. Land 2023, 12, 2128. [Google Scholar] [CrossRef]
  15. Chu, N.; Wu, X.; Zhang, P.; Xu, S.; Shi, X.; Jiang, B. Spatial Distribution Pattern Evolution of the Population and Economy in Russia since the 21st Century. Int. J. Environ. Res. Public Health 2022, 20, 684. [Google Scholar] [CrossRef]
  16. Yao, H. Evolution of spatial pattern and influencing factors of population in Guangdong-Hong Kong-Macao greater bay area. Open J. Soc. Sci. 2020, 8, 33. [Google Scholar] [CrossRef]
  17. Yang, Q.; He, L. Spatiotemporal changes in population distribution and socioeconomic development in China from 1950 to 2010. Arab. J. Geosci. 2017, 10, 498. [Google Scholar] [CrossRef]
  18. Rawski, T.G. What is happening to China’s GDP statistics? China Econ. Rev. 2001, 12, 347–354. [Google Scholar] [CrossRef]
  19. Henderson, J.V.; Storeygard, A.; Weil, D.N. Measuring economic growth from outer space. Am. Econ. Rev. 2012, 102, 994–1028. [Google Scholar] [CrossRef]
  20. Yu, B.; Shi, K.; Hu, Y.; Huang, C.; Chen, Z.; Wu, J. Poverty evaluation using NPP-VIIRS nighttime light composite data at the county level in China. IEEE J. Sel. Top. Appl. Earth Obs. Remote Sens. 2015, 8, 1217–1229. [Google Scholar] [CrossRef]
  21. Zheng, Q.; Seto, K.C.; Zhou, Y.; You, S.; Weng, Q. Nighttime light remote sensing for urban applications: Progress, challenges, and prospects. ISPRS J. Photogramm. Remote Sens. 2023, 202, 125–141. [Google Scholar] [CrossRef]
  22. Chen, Z.; Yu, B.; Song, W.; Liu, H.; Wu, Q.; Shi, K.; Wu, J. A new approach for detecting urban centers and their spatial structure with nighttime light remote sensing. IEEE Trans. Geosci. Remote Sens. 2017, 55, 6305–6319. [Google Scholar] [CrossRef]
  23. Xiao, P.; Wang, X.; Feng, X.; Zhang, X.; Yang, Y. Detecting China’s urban expansion over the past three decades using nighttime light data. IEEE J. Sel. Top. Appl. Earth Obs. Remote Sens. 2014, 7, 4095–4106. [Google Scholar] [CrossRef]
  24. Jiang, L.; Liu, Y.; Wu, S.; Yang, C. Study on Urban Spatial Pattern Based on DMSP/OLS and NPP/VIIRS in Democratic People’s Republic of Korea. Remote Sens. 2021, 13, 4879. [Google Scholar] [CrossRef]
  25. Weidmann, N.B.; Theunissen, G. Estimating local inequality from nighttime lights. Remote Sens. 2021, 13, 4624. [Google Scholar] [CrossRef]
  26. Huang, Z.; Li, S.; Gao, F.; Wang, F.; Lin, J.; Tan, Z. Evaluating the performance of LBSM data to estimate the gross domestic product of China at multiple scales: A comparison with NPP-VIIRS nighttime light data. J. Clean. Prod. 2021, 328, 129558. [Google Scholar] [CrossRef]
  27. Levin, N.; Duke, Y. High spatial resolution night-time light images for demographic and socio-economic studies. Remote Sens. Environ. 2012, 119, 1–10. [Google Scholar] [CrossRef]
  28. Xu, X.; Tan, M.; Liu, X.; Wang, X.; Xin, L. Stability and Changes in the Spatial Distribution of China’s Population in the Past 30 Years Based on Census Data Spatialization. Remote Sens. 2023, 15, 1674. [Google Scholar] [CrossRef]
  29. Tu, W.; Liu, Z.; Du, Y.; Yi, J.; Liang, F.; Wang, N.; Qian, J.; Huang, S.; Wang, H. An ensemble method to generate high-resolution gridded population data for China from digital footprint and ancillary geospatial data. Int. J. Appl. Earth Obs. Geoinf. 2022, 107, 102709. [Google Scholar] [CrossRef]
  30. Wu, B.; Yang, C.; Wu, Q.; Wang, C.; Wu, J.; Yu, B. A building volume adjusted nighttime light index for characterizing the relationship between urban population and nighttime light intensity. Comput. Environ. Urban Syst. 2023, 99, 101911. [Google Scholar] [CrossRef]
  31. Chen, X. Nighttime lights and population migration: Revisiting classic demographic perspectives with an analysis of recent European data. Remote Sens. 2020, 12, 169. [Google Scholar] [CrossRef]
  32. Hall, O.; Bustos, M.F.A.; Olén, N.B.; Niedomysl, T. Population centroids of the world administrative units from nighttime lights 1992–2013. Sci. Data 2019, 6, 235. [Google Scholar] [CrossRef]
  33. Anderson, S.J.; Tuttle, B.T.; Powell, R.L.; Sutton, P.C. Characterizing relationships between population density and nighttime imagery for Denver, Colorado: Issues of scale and representation. Int. J. Remote Sens. 2010, 31, 5733–5746. [Google Scholar] [CrossRef]
  34. Xu, H.; Yang, H.; Li, X.; Jin, H.; Li, D. Multi-scale measurement of regional inequality in Mainland China during 2005–2010 using DMSP/OLS night light imagery and population density grid data. Sustainability 2015, 7, 13469–13499. [Google Scholar] [CrossRef]
  35. Ivan, K.; Holobâcă, I.-H.; Benedek, J.; Török, I. Potential of night-time lights to measure regional inequality. Remote Sens. 2019, 12, 33. [Google Scholar] [CrossRef]
  36. Leyk, S.; Gaughan, A.E.; Adamo, S.B.; de Sherbinin, A.; Balk, D.; Freire, S.; Rose, A.; Stevens, F.R.; Blankespoor, B.; Frye, C. The spatial allocation of population: A review of large-scale gridded population data products and their fitness for use. Earth Syst. Sci. Data 2019, 11, 1385–1409. [Google Scholar] [CrossRef]
  37. Varquez, A.C.G.; Kiyomoto, S.; Khanh, D.N.; Kanda, M. Global 1-km present and future hourly anthropogenic heat flux. Sci. Data 2021, 8, 64. [Google Scholar] [CrossRef] [PubMed]
  38. Elvidge, C.D.; Baugh, K.E.; Anderson, S.J.; Sutton, P.C.; Ghosh, T. The Night Light Development Index (NLDI): A spatially explicit measure of human development from satellite data. Soc. Geogr. 2012, 7, 23–35. [Google Scholar] [CrossRef]
  39. Zhao, N.; Liu, Y.; Cao, G.; Samson, E.L.; Zhang, J. Forecasting China’s GDP at the pixel level using nighttime lights time series and population images. GIScience Remote Sens. 2017, 54, 407–425. [Google Scholar] [CrossRef]
  40. Cole, T.A.; Wanik, D.W.; Molthan, A.L.; Román, M.O.; Griffin, R.E. Synergistic use of nighttime satellite data, electric utility infrastructure, and ambient population to improve power outage detections in urban areas. Remote Sens. 2017, 9, 286. [Google Scholar] [CrossRef]
  41. Li, Z.; Jiao, L.; Zhang, B.; Xu, G.; Liu, J. Understanding the pattern and mechanism of spatial concentration of urban land use, population and economic activities: A case study in Wuhan, China. Geo.-Spat. Inf. Sci. 2021, 24, 678–694. [Google Scholar] [CrossRef]
  42. Ouyang, X.; Tang, L.; Wei, X.; Li, Y. Spatial interaction between urbanization and ecosystem services in Chinese urban agglomerations. Land Use Policy 2021, 109, 105587. [Google Scholar] [CrossRef]
  43. Lin, J.; Yang, S.; Liu, Y.; Zhu, Y.; Cai, A. The urban population agglomeration capacity and its impact on economic efficiency in the Yangtze River Delta Urban Agglomeration. Environ. Dev. Sustain. 2024, 26, 13739–13768. [Google Scholar] [CrossRef]
  44. Yu, T.; Liu, C.; Li, W.; Huang, W.; Wu, H.; Fan, Z. Characterizing urban actively populated area growth in the Yangtze River Delta using nighttime light data. Int. J. Appl. Earth Obs. Geoinf. 2024, 129, 103857. [Google Scholar] [CrossRef]
  45. Tian, G.; Jiang, J.; Yang, Z.; Zhang, Y. The urban growth, size distribution and spatio-temporal dynamic pattern of the Yangtze River Delta megalopolitan region, China. Ecol. Model. 2011, 222, 865–878. [Google Scholar] [CrossRef]
  46. Xu, H.; Jiao, M. City size, industrial structure and urbanization quality—A case study of the Yangtze River Delta urban agglomeration in China. Land Use Policy 2021, 111, 105735. [Google Scholar] [CrossRef]
  47. Zhao, M.; Cheng, W.; Zhou, C.; Li, M.; Wang, N.; Liu, Q. GDP spatialization and economic differences in South China based on NPP-VIIRS nighttime light imagery. Remote Sens. 2017, 9, 673. [Google Scholar] [CrossRef]
  48. Elvidge, C.D.; Baugh, K.; Zhizhin, M.; Hsu, F.C.; Ghosh, T. VIIRS night-time lights. Int. J. Remote Sens. 2017, 38, 5860–5879. [Google Scholar] [CrossRef]
  49. Wang, Z.; Chen, S. Development of the Remote Sensing Datasets of the Annual Nighttime Light in China from 1992 to 2021. Master’s Thesis, Jilin University, Changchun, China, 2022. [Google Scholar]
  50. Elvidge, C.D.; Zhizhin, M.; Ghosh, T.; Hsu, F.-C.; Taneja, J. Annual time series of global VIIRS nighttime lights derived from monthly averages: 2012 to 2019. Remote Sens. 2021, 13, 922. [Google Scholar] [CrossRef]
  51. Calka, B.; Bielecka, E. Reliability analysis of LandScan gridded population data. The case study of Poland. ISPRS Int. J. Geo-Inf. 2019, 8, 222. [Google Scholar] [CrossRef]
  52. Dobson, J.E.; Bright, E.A.; Coleman, P.R.; Durfee, R.C.; Worley, B.A. LandScan: A global population database for estimating populations at risk. Photogramm. Eng. Remote Sens. 2000, 66, 849–857. [Google Scholar]
  53. Yu, S.; Zhang, Z.; Liu, F. Monitoring population evolution in China using time-series DMSP/OLS nightlight imagery. Remote Sens. 2018, 10, 194. [Google Scholar] [CrossRef]
  54. He, L.; Li, A.; Yin, G.; Nan, X.; Bian, J. Retrieval of grassland aboveground biomass through inversion of the PROSAIL model with MODIS imagery. Remote Sens. 2019, 11, 1597. [Google Scholar] [CrossRef]
  55. Lu, H.; Zhang, M.; Sun, W.; Li, W. Expansion analysis of yangtze river delta urban agglomeration using dmsp/ols nighttime light imagery for 1993 to 2012. ISPRS Int. J. Geo-Inf. 2018, 7, 52. [Google Scholar] [CrossRef]
  56. Xie, Y.; Weng, Q. Updating urban extents with nighttime light imagery by using an object-based thresholding method. Remote Sens. Environ. 2016, 187, 1–13. [Google Scholar] [CrossRef]
  57. Elvidge, C.D.; Baugh, K.E.; Kihn, E.A.; Kroehl, H.W.; Davis, E.R. Mapping city lights with nighttime data from the DMSP Operational Linescan System. Photogramm. Eng. Remote Sens. 1997, 63, 727–734. [Google Scholar]
  58. Zheng, Y.; Tang, L.; Wang, H. An improved approach for monitoring urban built-up areas by combining NPP-VIIRS nighttime light, NDVI, NDWI, and NDBI. J. Clean. Prod. 2021, 328, 129488. [Google Scholar] [CrossRef]
  59. Liu, C.; Yang, K.; Bennett, M.M.; Guo, Z.; Cheng, L.; Li, M. Automated extraction of built-up areas by fusing VIIRS nighttime lights and Landsat-8 data. Remote Sens. 2019, 11, 1571. [Google Scholar] [CrossRef]
  60. Feng, Z.; Liu, X. Multi-scale studies on the space consistency between population distribution and economic development in China. Popul. Econ. 2013, 197, 3–11. (In Chinese) [Google Scholar]
  61. Gao, B.; Huang, Q.; He, C.; Dou, Y. Similarities and differences of city-size distributions in three main urban agglomerations of China from 1992 to 2015: A comparative study based on nighttime light data. J. Geogr. Sci. 2017, 27, 533–545. [Google Scholar] [CrossRef]
  62. Wang, X.; Ding, S.; Cao, W.; Fan, D.; Tang, B. Research on network patterns and influencing factors of population flow and migration in the Yangtze River Delta urban agglomeration, China. Sustainability 2020, 12, 6803. [Google Scholar] [CrossRef]
  63. Tang, Y.; Gao, J.; Chen, W. The Spatial-Temporal Evolution of Population in the Yangtze River Delta, China: An Urban Hierarchy Perspective. Land 2022, 11, 1764. [Google Scholar] [CrossRef]
  64. Ni, R.; Wang, F.; Yu, J. Spatiotemporal changes in sustainable development and its driving force in the Yangtze River Delta region, China. J. Clean. Prod. 2022, 379, 134751. [Google Scholar] [CrossRef]
  65. Xu, G.; Su, J.; Xia, C.; Li, X.; Xiao, R. Spatial mismatches between nighttime light intensity and building morphology in Shanghai, China. Sustain. Cities Soc. 2022, 81, 103851. [Google Scholar] [CrossRef]
  66. Henderson, J.V.; Nigmatulina, D.; Kriticos, S. Measuring urban economic density. J. Urban Econ. 2021, 125, 103188. [Google Scholar] [CrossRef]
  67. Mellander, C.; Lobo, J.; Stolarick, K.; Matheson, Z. Night-time light data: A good proxy measure for economic activity? PLoS ONE 2015, 10, e0139779. [Google Scholar] [CrossRef]
  68. Wang, T.; Sun, F. Global gridded GDP data set consistent with the shared socioeconomic pathways. Sci. Data 2022, 9, 221. [Google Scholar] [CrossRef]
  69. Chen, Z.; Yu, B.; Yang, C.; Zhou, Y.; Yao, S.; Qian, X.; Wang, C.; Wu, B.; Wu, J. An extended time series (2000–2018) of global NPP-VIIRS-like nighttime light data from a cross-sensor calibration. Earth Syst. Sci. Data 2021, 13, 889–906. [Google Scholar] [CrossRef]
Figure 1. Location of the study area in China and the main administrative districts.
Remotesensing 16 02806 g001
Figure 2. Flowchart of multi-scale population-economy consistency analysis.
Remotesensing 16 02806 g002
Figure 3. Scatter plots of 41 cities for the Yangtze River Delta for NPP/VIIRS vs. GDP in 2012 (a) and 2022 (b) and for Landscan vs. resident population in 2012 (c) and 2022 (d).
Remotesensing 16 02806 g003
Figure 4. 2012–2022 spatial patterns of population and nightlight geographic concentration at the pixel scale in the Yangtze River Delta region: (a) nightlight geographic concentration in 2012, (b) population geographic concentration in 2012, (c) nightlight geographic concentration in 2022, (d) population geographic concentration in 2022.
Remotesensing 16 02806 g004
Figure 5. Spatial patterns of population and nighttime light geographical concentration at the city scale in the Yangtze River Delta region from 2012 to 2022. (a) nighttime light geographical concentration in 2012, (b) population geographical concentration in 2012, (c) nighttime light geographical concentration in 2022, (d) population geographical concentration in 2022.
Remotesensing 16 02806 g005
Figure 6. Spatial patterns of population and economic inconsistency in the Yangtze River Delta from 2012 to 2022. (a) Spatial pattern of inconsistency calculated based on raster data in 2012, (b) spatial pattern of inconsistency calculated based on statistical data in 2012, (c) spatial pattern of inconsistency calculated based on raster data in 2022, (d) spatial pattern of inconsistency calculated based on statistical data in 2022.
Remotesensing 16 02806 g006
Figure 7. Impact of socio-economic variables on the city-scale inconsistency index. (a) 2012, (b) 2022.
Remotesensing 16 02806 g007
Figure 8. Spatial patterns of population and nighttime light inconsistency at the pixel scale in urban areas of Yangtze River Delta region from 2012 to 2022. (a) Population and nighttime light inconsistency in 2012, (b) population and nighttime light inconsistency in 2022.
Remotesensing 16 02806 g008
Figure 9. Illustrates the changes in the proportion of land area with different degrees of inconsistency between population and nighttime light intensity in the urban areas of the Yangtze River Delta from 2012 to 2022. Subfigures are categorized as follows: (a) population concentration significantly lower than nighttime light concentration (I < 0.5), (b) population concentration slightly lower than nighttime light concentration (0.5 < I < 0.8), (c) coordinated concentration of population and economy (0.8 < I < 1.2), (d) population concentration slightly higher than nighttime light concentration (1.2 < I < 2), (e) population concentration significantly higher than nighttime light concentration (I > 2).
Remotesensing 16 02806 g009
Figure 10. Spatial patterns of population and nighttime light inconsistency at the city scale in urban areas of the Yangtze River Delta region from 2012 to 2022. (a) Population and nighttime light inconsistency in 2012, (b) population and nighttime light inconsistency in 2022.
Remotesensing 16 02806 g010
Table 1. The categories and names of each statistical parameter.
Data SourcesIndicator TypeStatistical IndicatorsLabel
Statistical yearbooks of various regionsPopulationResident populationRP
Urban resident populationURP
EconomyGross national productGNP
Fixed investmentTotal investment in real estate developmentTIRED
Investment in real estate development for residential buildingsIREDRB
IndustryOperating revenueOR
Employment and incomePer capita disposable incomePCDI
Number of employees in primary industryNEPI
Number of employees in secondary industryNESI
Number of employees in tertiary industryNETI
ResourceElectricity consumption in industryECI
TransportationAssenger traffic (excluding railway)PT(ER)
Highway mileage open to trafficHMOT
EducateNumber of granted patentsNGP
Urban construction statistical yearbookConstruction landBuilt-up areaBUA
Table 2. Coefficient of determination for grid data and statistical data from 2013 to 2021.
YearR2
NTL/GDPLandscan/RP
20120.96780.9932
20130.96720.9910
20140.95860.9947
20150.94780.9937
20160.93540.9957
20170.93330.9869
20180.92580.9836
20190.93510.9757
20200.92510.9727
20210.91070.9696
20220.91120.9935
Table 3. Comparison of average geographic concentration and inconsistency index between grid.
YearAverage Geographical Concentration of EconomyAverage Geographical Concentration of PopulationAverage Inconsistency Index
NTL (LTNL)GDP (LGDP)Landscan (CLDP)RP (CPOP)Raster Data (Pj)Statistical Data (Ij)
20121.17001.16241.10961.09831.57001.5434
20131.16551.16791.10961.09851.55041.4421
20141.15951.16261.10961.09541.56251.4267
20151.15411.15861.10961.10771.56011.4528
20161.15351.15751.10961.10501.53921.4566
20171.14521.15481.10881.10311.43191.5350
20181.14881.15221.10881.09981.40921.4342
20191.14691.14401.10881.09531.36901.4316
20201.15011.14891.10781.10031.34971.3770
20211.14331.14951.10781.10041.32331.3716
20221.14571.15401.10781.09991.32811.3705
Table 4. Evaluation results of population-economic consistency level in the Yangtze River Delta region in 2012.
TypeLandNTLPopulation
Area   ( 10 4   k m 2 )Percentage (%)Quantity
( 10 4 n a n o W a t t s / c m 2 / s r )
Percentage (%) Area   ( 10 4   k m 2 )Percentage (%)
0 < I < 0.511,275.5056.4475.4756.571493.0814.85
0.5 < I < 0.82672.7513.3815.0911.31839.818.35
I < 0.813,948.2569.8190.5667.882332.8923.20
0.8 < I < 1.21824.009.1313.319.981138.9611.33
1.2 < I < 21939.509.7114.3610.761941.6619.31
I > 22267.7511.3515.1811.384640.7946.16
I > 1.24207.2521.0629.5422.146582.4565.47
Table 5. Evaluation results of population-economic consistency level in the Yangtze River Delta region in 2022.
TypeLandNTLPopulation
Area   ( 10 4 k m 2 )Percentage (%)Quantity
( 10 4 n a n o W a t t s / c m 2 / s r )
Percentage (%) Area   ( 10 4 k m 2 ) Percentage (%)
0 < I < 0.517,205.2539.93150.4948.042118.6916.70
0.5 < I < 0.89889.0022.9561.3119.571941.9515.31
I < 0.827,094.2562.89211.8067.614060.6532.01
0.8 < I < 1.26996.0016.2442.7113.632071.2316.33
1.2 < I < 25384.2512.5034.0110.862537.1120.00
I > 23609.258.3824.757.904018.0931.67
I > 1.28993.5020.8758.7518.756555.2051.67
Disclaimer/Publisher’s Note: The statements, opinions and data contained in all publications are solely those of the individual author(s) and contributor(s) and not of MDPI and/or the editor(s). MDPI and/or the editor(s) disclaim responsibility for any injury to people or property resulting from any ideas, methods, instructions or products referred to in the content.

