Abstract
With the continuous development and popularization of remote sensing technology, remote sensing images have been widely used in the field of land cover classification. Since remote sensing images have complex spatial structure and texture features, it is becoming a challenging problem to accurately categorize them. Land cover classification has practical application value in various fields, such as environmental monitoring and protection, urban and rural planning and management, and climate change research. In recent years, remote sensing image classification methods based on deep learning have been rapidly developed, in which semantic segmentation technology has become one of the mainstream methods for land cover classification using remote sensing image. Traditional semantic segmentation algorithms tend to ignore the edge information, resulting in poor classification of the edge part in land cover classification, and there are numerous attention mechanisms to make improvements for these problems. In this paper, a triple attention mechanism, BETAM (Border-Enhanced Triple Attention Mechanism), for edge feature enhancement of high-resolution remote sensing images is proposed. Furthermore, a new model on the basis of the semantic segmentation network model DeeplabV3+ is also introduced, which is called DeepBETAM. The triple attention mechanism BETAM is able to capture feature dependencies in three dimensions: position, space, and channel, respectively. Through feature importance weighting, modeling of spatial relationships, and adaptive learning capabilities, the model BETAM pays more attention to edge features, thus improving the accuracy of edge detection. A remote sensing image dataset SMCD (Subject Meticulous Categorization Dataset) is constructed to verify the robustness of the attention mechanism BETAM and the model DeepBETAM. Extensive experiments were conducted on the two self-built datasets FRSID and SMCD. Experimental results showed that the mean Intersection over Union (mIoU), mean Pixel Accuracy (mPA), and mean Recall (mRecall) of DeepBETAM are 63.64%, 71.27%, and 71.31%, respectively. These metrics are superior to DeeplabV3+, DeeplabV3+(SENet), DeeplabV3+(CBAM), DeeplabV3+(SAM), DeeplabV3+(ECANet), and DeeplabV3+(CAM), which are network models that incorporate different attention mechanisms. The reason is that BETAM has better edge segmentation results and segmentation accuracy. Meanwhile, on the basis of the self-built dataset, the four main classifications of buildings, cultivated land, water bodies and vegetation were subdivided and detected, and good experimental results were obtained, which verified the robustness of the attention mechanism BETAM and the model DeepBETAM. The method has broad application prospects and can provide favorable support for research and application in the field of surface classification.
1. Introduction
The extraction and classification of land cover information is an important part of land surveys and is of great value. Land cover classification via semantic segmentation of remote sensing images has shown great potential for application in the fields of disaster assessment and prediction, environmental protection, land planning, and transportation navigation [1]. With the continuous improvement of satellite observation capabilities, the quantity and quality of high-resolution remote sensing images have been greatly enhanced. It is becoming an important research direction in the field of image processing to quickly and accurately extract key information in high-resolution remote sensing images in recent years.
In the early image segmentation field, some traditional image segmentation techniques are more popular, including threshold-based image segmentation algorithms [2], edge-based image segmentation algorithms [3], and region-based image segmentation algorithms [4]. However, because the resolution of remote sensing images is getting higher and higher, the background is getting more and more complex, and there are more and more targets in the images, the traditional image segmentation algorithms cannot fully and comprehensively extract the information in the remote sensing images and achieve better results. Therefore, there is a need to incorporate deep learning for segmentation studies of remote sensing images. Semantic segmentation can accurately classify individual pixels in an image according to the differences in the texture, color, and scene information of the image [5], which is a more suitable algorithm for segmentation in deep learning and has been widely used in the fields of medical imaging, engineering technology, etc.
In the field of semantic segmentation, attention mechanism is a research focus. The attention mechanism originates from the human visual system, through which humans can accurately and quickly focus on the important parts, ignore irrelevant information, and prioritize the centers of attention in accordance with the degree of importance in complex scenarios. Similar to human visual attention, attention mechanisms tend to focus on key features and bias learning resources towards informative and more valuable parts by, e.g., assigning weights.
Attention mechanisms have been a hot research topic in recent years, and most of the research work on deep learning and attention mechanisms has focused on masking. The salient image features are obtained from the feature matrix and the propagation and training properties of the neural network are applied to capture the salient regions of the image. Attention mechanisms can be categorized into soft attention [6] and hard attention [7]. Soft attention focuses on information about the weights of positions or dimensions on features, and hard attention focuses on only one position of an input feature. Many research advances have been achieved in the field of semantic segmentation, including attention mechanisms and remote sensing geology. Yan et al. [8] proposed a groundbreaking semantic segmentation model with improved remote sensing image coordinate attention based on the TransUNet architecture. Zhou et al. [9] took landslide disasters as the research object and proposed a semantic segmentation model for landslide remote sensing images based on multi-scale attention segmentation network, which is used for timely and accurate identification and monitoring of landslides.
To address the problem of insufficient contextual information, some studies have expanded the sensory field through attentional mechanisms to acquire a larger range of contextual information to enhance feature representation. Approaches based on attention mechanisms, such as DANet [10] and EDFT [11], use self-attention modules [12] in the decoder of the network to adaptively aggregate the global context information in the image.
Attention mechanism can be combined in end-to-end neural networks by stacking modules, and it can enhance neural networks to capture key local features. Attention mechanism has become an important theoretical foundation in the field of deep learning, and more and more research has applied it to neural networks and achieved good results.
Convolutional neural networks, graph convolutional networks, transformers, and other network architectures are important components of deep learning, each with its own characteristics when processing different types of data and tasks. Convolutional neural networks are designed specifically for processing grid-like data and can effectively capture local features and spatial hierarchical structures. They perform well in fields such as image recognition, object detection, and video analysis. Graph convolutional networks are designed specifically for processing graph structured data, such as graph social networks, knowledge graphs, etc. Using the structural information of the graph, convolution operations are defined based on the adjacency relationships between nodes. Transformers were originally designed for natural language processing tasks, especially sequence to sequence models, which introduced self-attention mechanisms to capture long-range dependencies in sequences. Significant achievements have been made in fields such as text generation, problem systems, and speech recognition. With the continuous development of deep learning, the boundaries between these architectures are becoming increasingly blurred, and researchers often combine the advantages of different architectures to solve complex problems.
Regarding semantic segmentation networks, at first fully convolutional networks (FCN) [13] were widely used, and then there were numerous optimized network models on the basis of FCN. Yuan et al. carried out land cover classification of high spatial resolution multispectral remote sensing images using the PSPNet network [14]. Hou et al. utilized the UNet network to extract roads from remotely sensing images [15]. Weng et al. utilized the SegNet network to segment waters [16]. The research above has made contribution to remote sensing image segmentation, but there is still much room for improvement in terms of accuracy and other aspects.
The Deeplab [17] semantic segmentation series combines a deep convolutional neural network and a probabilistic graph model to increase the sensory field of the convolutional operation process and maintain the resolution through null convolution. These methods proposed and improved Atrous Spatial Pyramid Pooling (ASPP) [18], which enables the full fusion of different levels of semantic information and, combined with spatial convolution with different dilation rates [19], can effectively capture multi-scale information. DeeplabV3+ [20] combines the advantages of the encoding–decoding structure and the ASPP module, which has a relatively good influence in the field of semantic segmentation and becomes the main semantic segmentation algorithm, with superior comprehensive performance.
However, the model DeeplabV3+ still has some aspects to improve. The first one is the relatively high complexity, with its feature extraction network Xception [21], which has a large number of network layers and parameters. Secondly, the extraction of feature information is not sufficiently complete. Finally, the accuracy for target edge recognition is not very high. The ASPP module cannot completely simulate the connection between the local features of the target, which leads to a hollow phenomenon for the target segmentation, so there are problems, such as low recognition accuracy and poor edge recognition.
Aiming at the above problems, in order to segment remote sensing images more accurately and efficiently, a Border-Enhanced Triple Attention Mechanism (BETAM) for the semantic segmentation of remote sensing images is proposed in this paper. The BETAM mechanism can be piggybacked on a semantic segmentation network model, such as DeeplabV3+, for land cover classification.
In order to meet the needs of the robustness validation experiments of the BETAM attention mechanism, a dataset SMCD (Subject Meticulous Categorization Dataset) of remote sensing image land cover information is constructed.
In summary, the main contributions of this paper include three aspects, which are listed as following
- (1)
- A new attention mechanism, BETAM, for the semantic segmentation of remote sensing images is proposed, which captures feature dependencies in the three dimensions of position, space, and channel, respectively, and pays more attention to the edge features through the weighting of feature importance, modeling of spatial relationships, and adaptive learning capability, thus improving the accuracy of edge detection.
- (2)
- A deep learning network model, DeepBETAM, is introduced, which is the application of BETAM to the semantic segmentation network DeepLabV3. Using the model, the performance of BETAM is examined and compared with other forms of attention mechanism.
- (3)
- A new dataset SMCD (Subject Meticulous Categorization Dataset) of remote sensing image land cover information is constructed and shared. The dataset has 3200 original maps as well as labeled maps and there are four sub-datasets, which are building, cropland, water body, and vegetation datasets. The dataset is used to verify the usability and robustness of the proposed BETAM.
The rest of the paper is organized as follows. Section 2 details the main structure of BETAM, the triple attention mechanism proposed in this paper, and the basic principles involved. Section 3 describes the experimental environment and the specific program of the experiment, the experimental steps, and the collection and processing of the data set. The results of the experiments, as well as the analysis of the results of the ablation comparison experiments, are presented in Section 4. Finally, the last section summarizes the work of this paper.
2. Materials and Methods
2.1. Main Ideas
There may be some differences between the features corresponding to the pixels of a label, and these differences affect the accuracy of the recognition and lead to less detailed edge segmentation. In the semantic segmentation of remote sensing images, the information in the image is diverse in scale, illumination, and viewpoint, and these diversities affect the accuracy of model.
The positional attention mechanism (PAM) [10] discriminates features by capturing the remote contextual information, encoding a wider range of contextual information as local features that can enhance the representation of the model. The bottleneck attention mechanism (BAM) [22], including both spatial and channel attention, is a method to improve the expressiveness of a network. The module efficiently learns what should be focused or suppressed parts through two different attention mechanisms, effectively improving intermediate features. Only a trivial increase in computational complexity is made, but it can significantly improve performance.
Combining the advantages of the above two methods, a Border-Enhanced Triple Attention Mechanism (BETAM) is proposed in this paper. BETAM establishes associations between features through an attention mechanism that draws global contextual information on local features generated by expanding the residual network. It also captures feature dependencies in the three dimensions of position, space, and channel, respectively. Through the weighting of feature importance, modeling of spatial relationships, and adaptive learning capabilities, BETAM is able to pay more attention to edge features and perform edge feature enhancement.
Three steps are included in the triple attention mechanism BETAM. Firstly, a spatial matrix is generated to model the relationship between pixels. Secondly, multiple outputs are obtained under different attention matrices. Finally, the outputs of different attention modules are aggregated to improve the pixel-level predictive feature representation. The structure of the triple attention mechanism BETAM is illustrated in Figure 1.
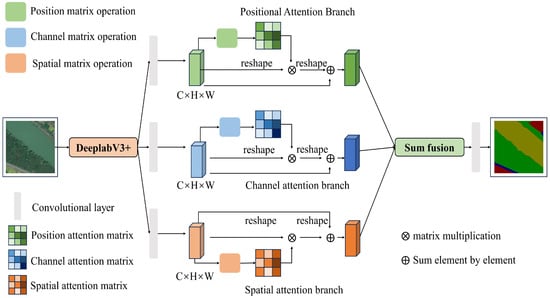
Figure 1.
Structure of border-enhanced triple attention mechanism BETAM.
As can be seen from Figure 1, the main ideas of BETAM consist of three aspects:
- Positional Attention Branch. The positional attention branch can effectively capture the relationship between different positions and helps BETAM understand the importance of image features in the positional dimension. By focusing on the position information, the model improves the understanding of the relevance of different regions in the image, thus improving the accuracy of classification and recognition. This attention branch effectively improves the ability of understanding, utilizes spatial information, and enhances the performance of BETAM when dealing with tasks, such as image classification and detection.
- Spatial Attention Branch. The spatial attention branch helps BETAM better understand the spatial relationship between different regions in the image, thus enhancing the spatial perception of the model. By allocating attention to different regions, the model can focus on important spatial information more accurately and improve the accuracy of feature extraction and recognition. This attention branch can effectively improve the model’s ability to understand and utilize image spatial information and enhance the performance of BETAM in processing image tasks.
- Channel Attention Branch. The channel attention branch enables BETAM to learn the importance of each channel and weight the features of different channels to strengthen the focus on specific information. By dynamically adjusting the channel weights, the different levels of semantic information in the image are better captured, the richness and diversity of feature expression are improved, and the redundant information between channels is reduced. Focusing on the most informative channels, the generalization ability of BETAM is improved.
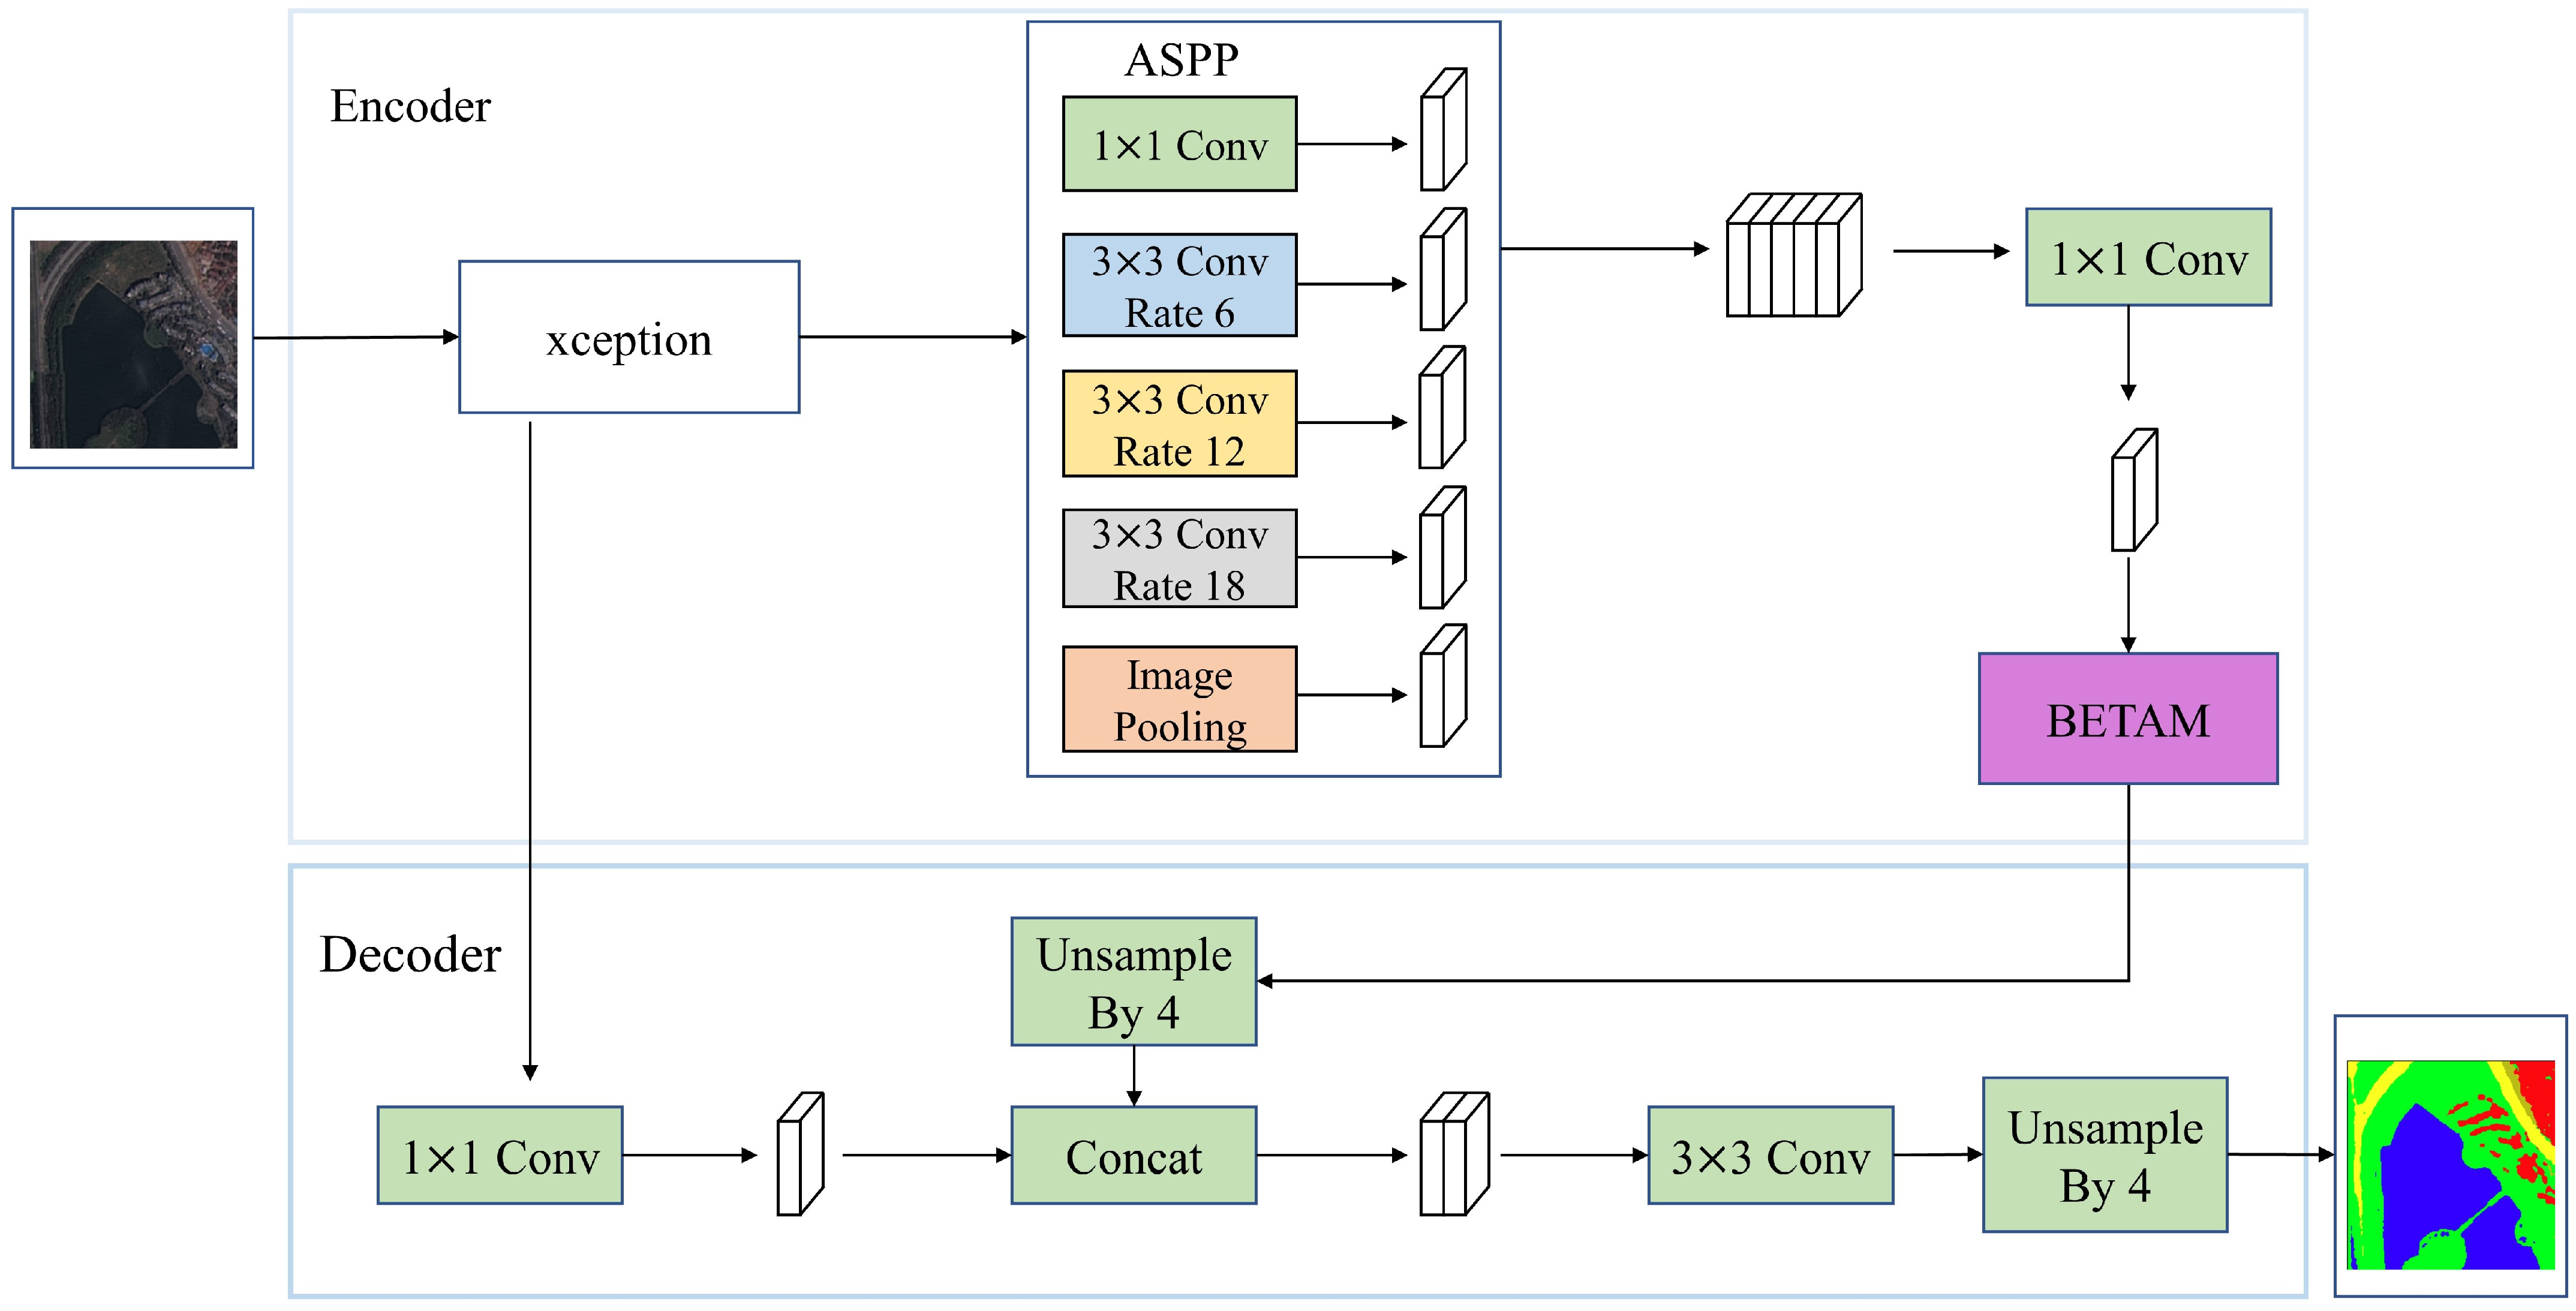
The triple attention mechanism BETAM introduced above can be imported into a semantic segmentation network, such as DeeplabV3+, which is named as DeepBETAM, so as to verify the usability of BETAM. The structure of DeepBETAM is shown in Figure 2.
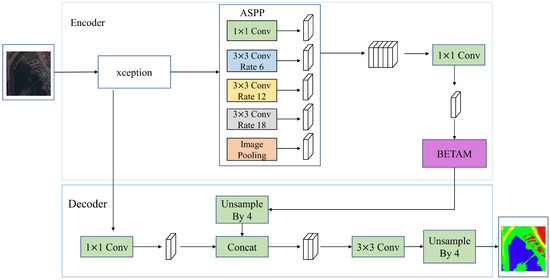
Figure 2.
Structure of model DeepBETAM.
2.2. Positional Attention Branch
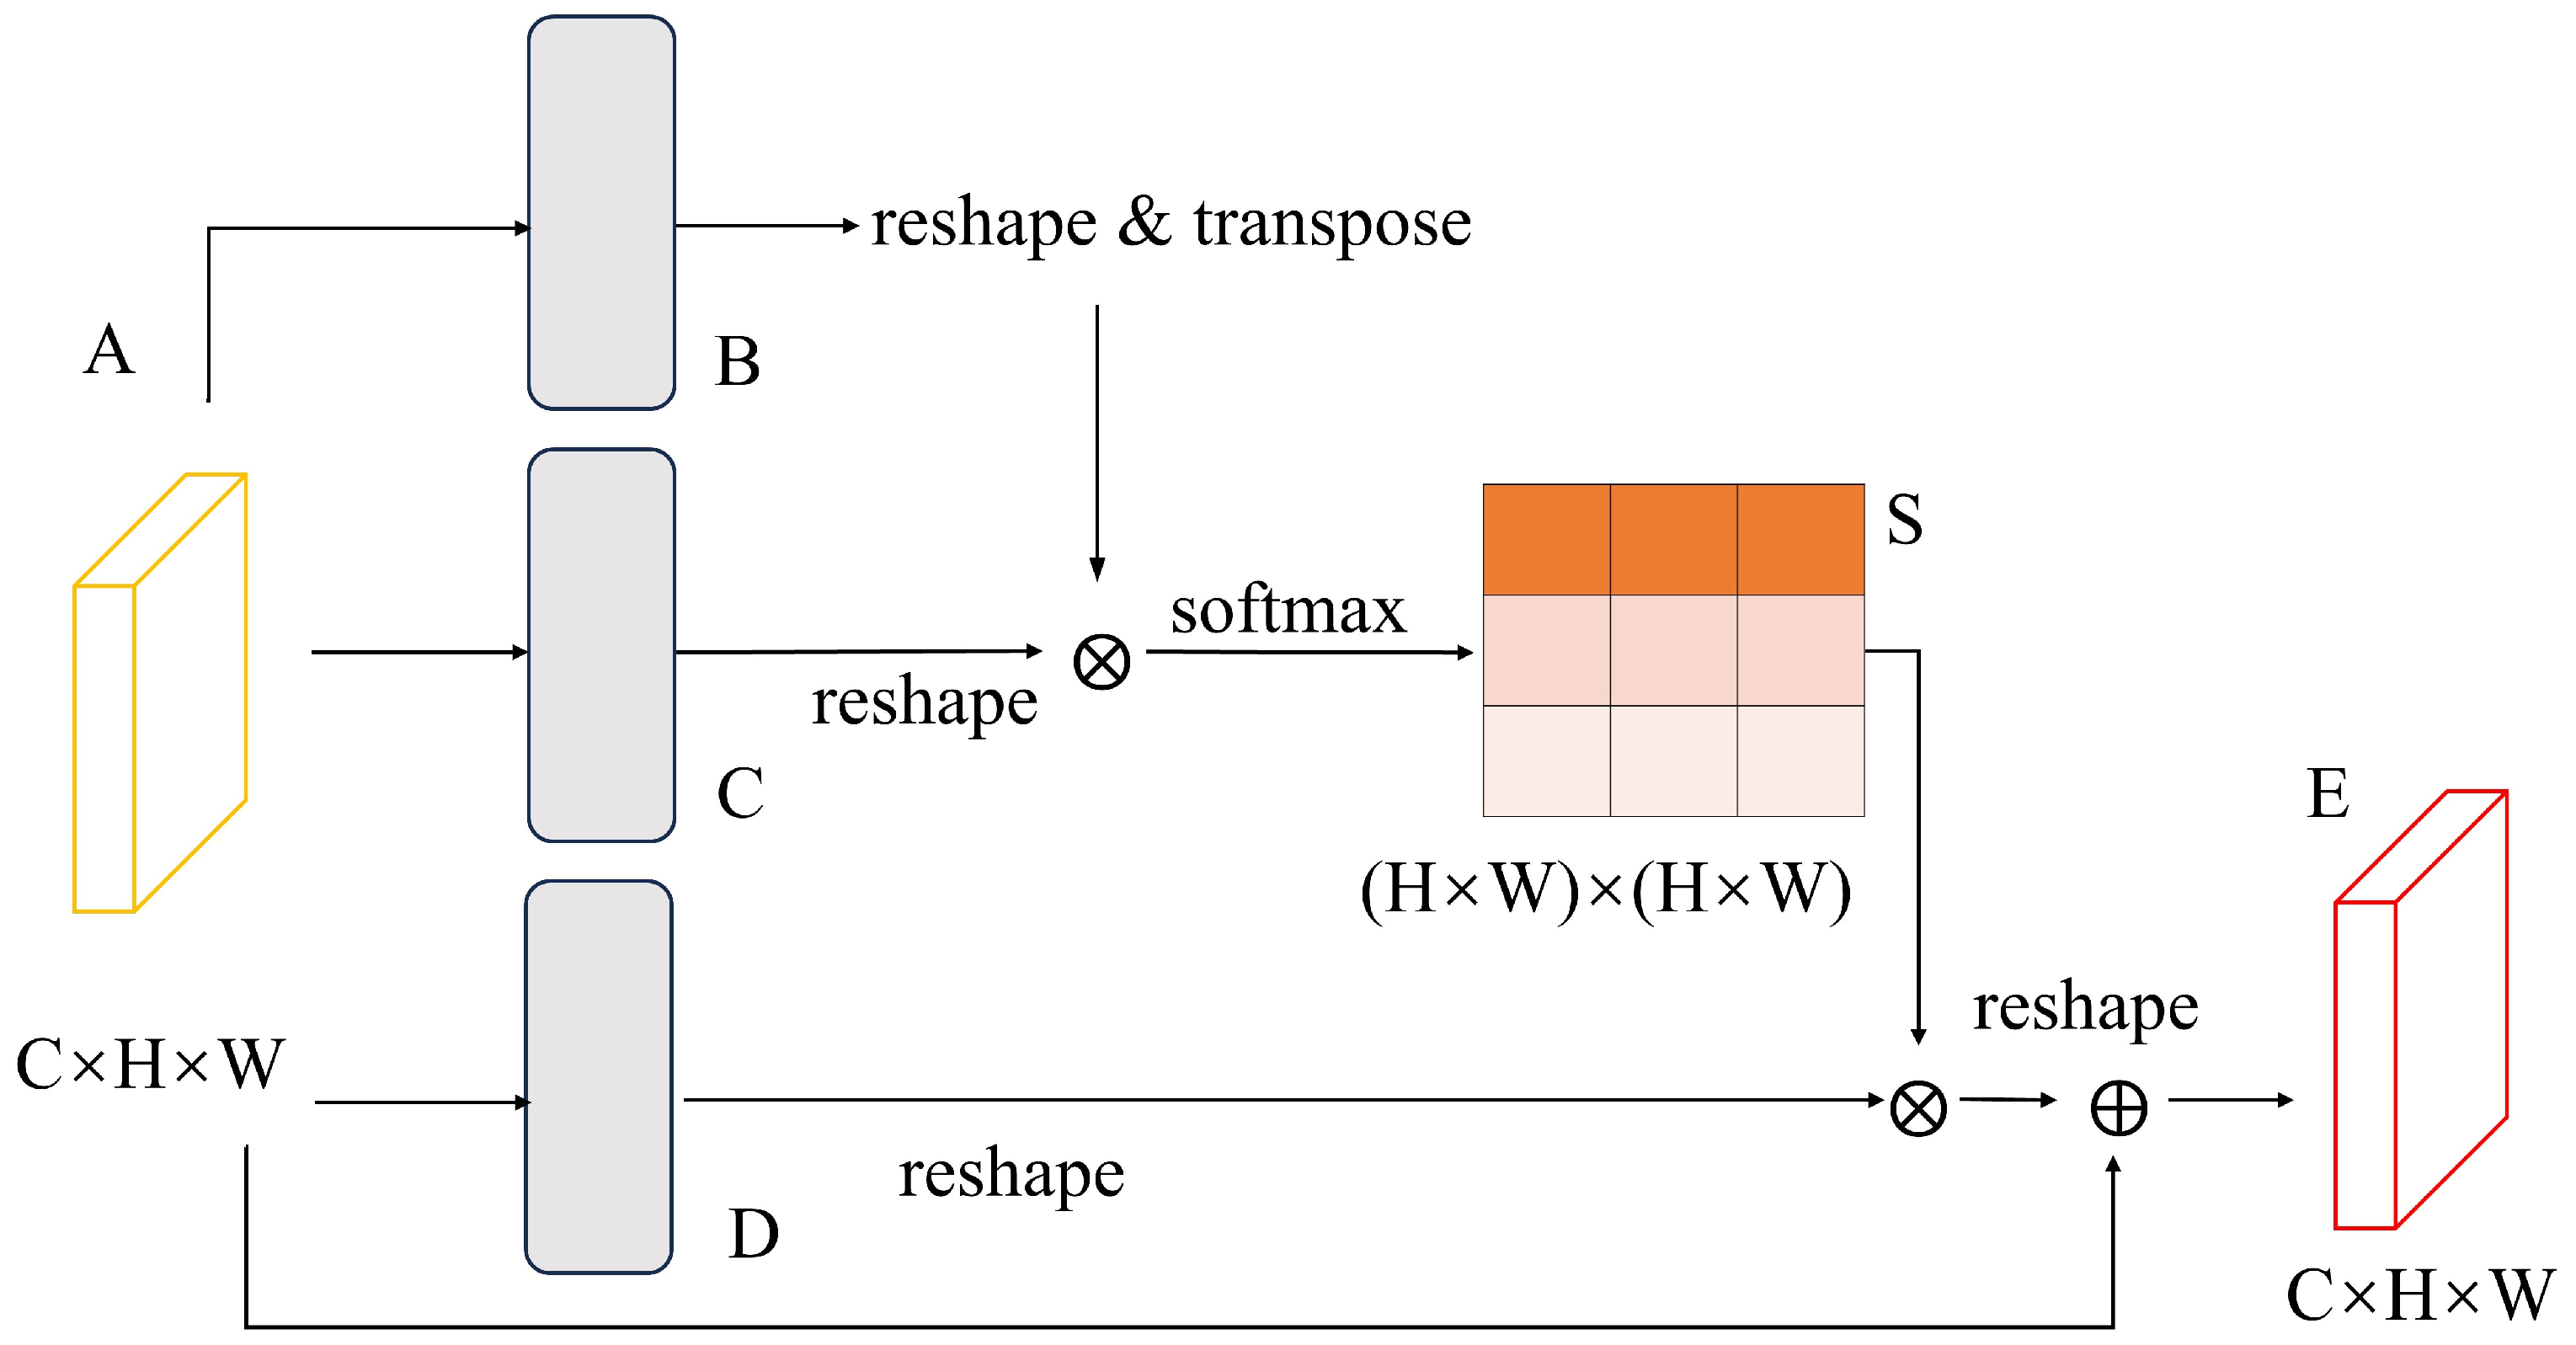
The representations of discriminative features are crucial to semantic segmentation and can be obtained by capturing remote contextual information. In order to enhance the neural network’s annotation of different positional information in the feature map, the positional attention branch is introduced in the BETAM triple attention mechanism. The positional attention can effectively improve the neural network to understand and utilize the relationship between different positions, enhance attention of the model to position information, and improve the ability of representation and performance. The process of adaptive aggregation of spatial contexts in the positional attention branch is represented in Figure 3.
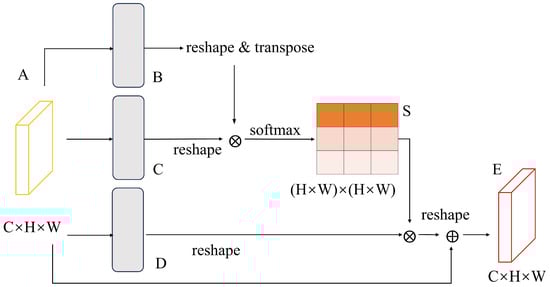
Figure 3.
Structure of positional attention branch.
The input feature maps are first positionally encoded to capture the relationships and distances between different positions. Positional encoding can be done using spatial coordinates, absolute or relative positions, etc. Based on the features after location encoding, the similarity and correlation between each location are calculated to generate location attention weights. A local feature is divided into two new feature maps and , where . Then the two feature maps are reshaped into , where is the number of pixels. Finally, matrix multiplication is performed on the transpose of and , as denoted by Equation (1):
where denotes the effect of position on position . Meanwhile, feature is input into the convolutional layer to generate a new feature mapping and it is reshaped into . Matrix multiplication is then performed between the transpositions of and , and the result is reshaped into . Finally, it is multiplied by the scale parameter and subjected to an element-by-element summation operation with the feature to obtain the final output , as expressed in Equation (2):
where is initialized as 0 and is gradually learned and given more weights. From the above equation, it can be inferred that the obtained feature E for each location is the weighted sum of the features of all locations with the original feature. The positional attention branch is able to apply location attention weights to the spatial dimension of the original feature map, weighting features at different locations to emphasize or suppress information at different locations.
2.3. Channel Attention Branch
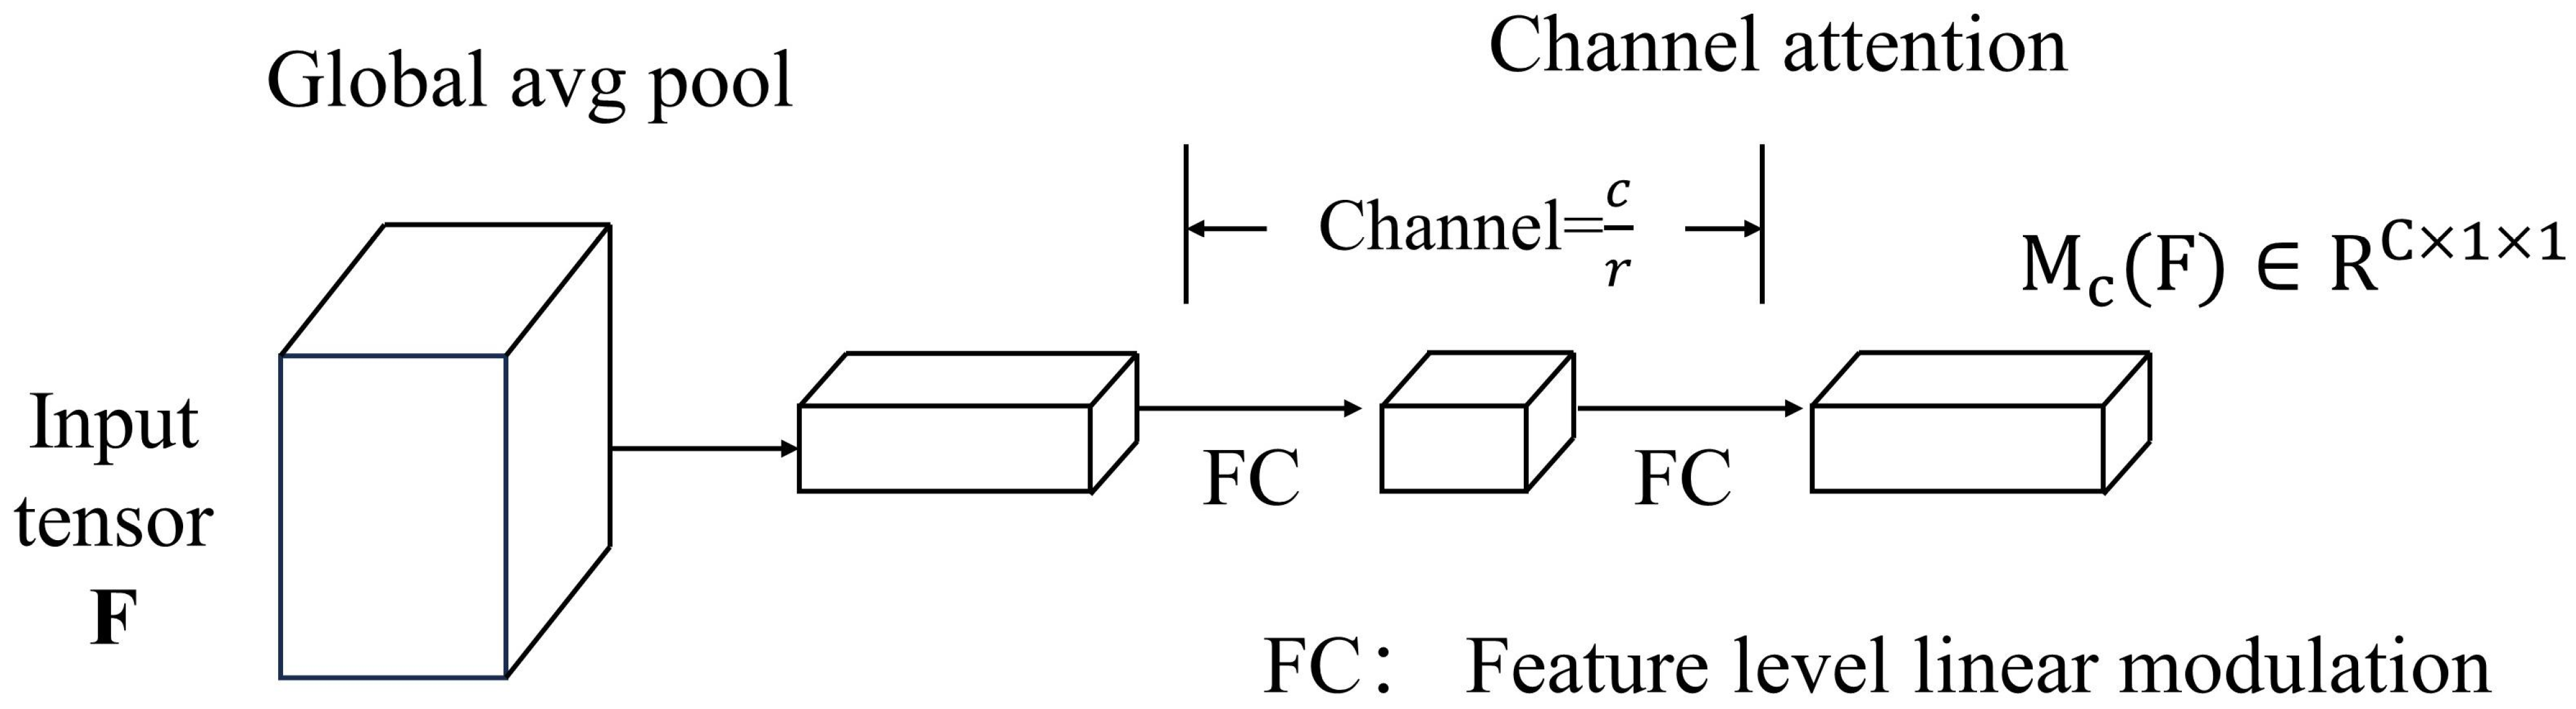
The main role of this branch is to introduce and compute the importance of image features in the channel dimension, to enhance the focus and utilization of channel information. By learning the importance weights of different channel features, the input feature maps are weighted and compressed and integrated in the channel dimension to improve the quality and diversity of feature representations. There are several specific considerations.
- The feature mappings in all channels are first integrated, the feature mapping is generated into a channel vector using global average pooling, and the encoding operation is done in all channels to encode the overall information.
- A multi-layer perceptron was utilized to estimate the attention between individual channels in the channel vector . The activation size is adjusted to to conserve the overall number of parameters, and represents the decay rate.
- Using a batch normalization layer after adding a multi-layer perceptron, the output scale size is adjusted using spatial attention branching.
The formula for the channel attention branch can be expressed as Equation (3):
where , , , and .
The structure of the channel attention branch is represented in Figure 4.
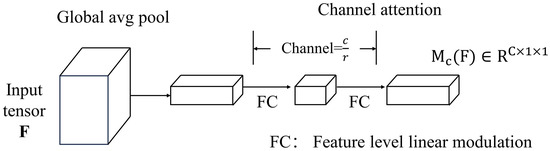
Figure 4.
Structure of channel attention branch.
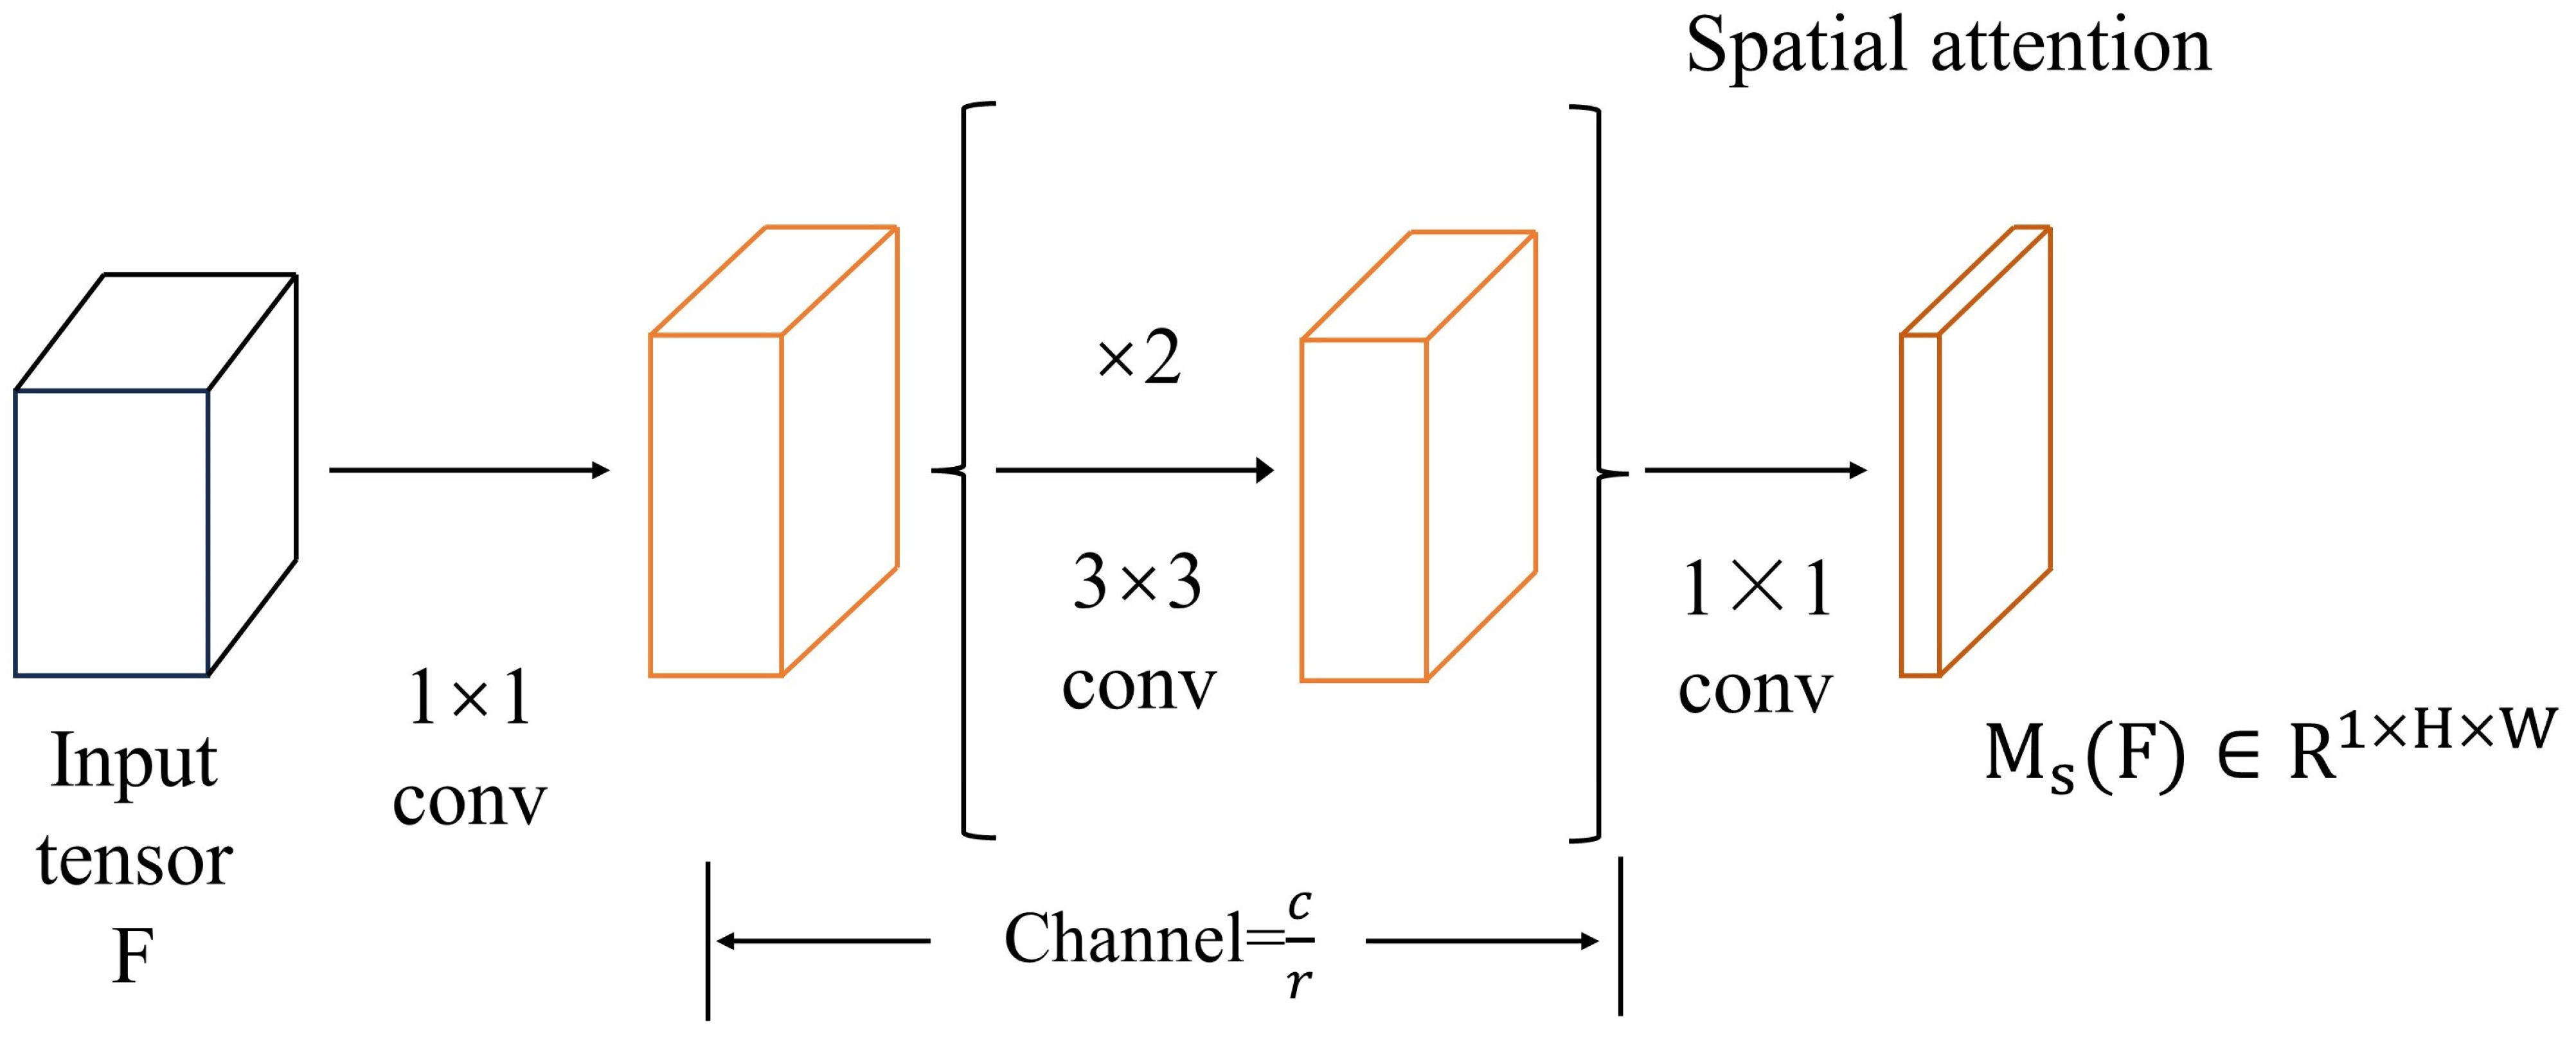
2.4. Spatial Attention Branch
The main role of this branch is to introduce and compute the importance of image features in the spatial dimension, so as to improve the model’s focus on spatial information and its utilization efficiency. Weighting the input feature map in the spatial dimension pays more attention to the important information in different regions of the image, which helps to improve the model’s ability to perceive the spatial structure. In the process of calculating the attention weights, compression operations, such as global average pooling or convolution operations, are introduced to reduce the feature dimensions and the number of parameters, which helps to reduce the computational cost and memory consumption and improve the computational efficiency of the model. The spatial attention branch produces spatial attention maps , which are used to highlight or suppress feature information in different spaces. It is well known that utilizing contextual information is the key to understanding spatial location, and that inflated convolution makes it easier to construct more efficient spatial mappings than standard convolution. The spatial attention branch employs a “bottleneck structure” that effectively saves the size of the parameter count and reduces the amount of computation. There are several specific considerations.
- The feature is subjected to a dimensionality reduction operation to obtain the new feature , and then the operations of collation and compression in the channel dimension are performed on the features newly obtained.
- A decay operation is carried out using the decay rate r, after which two dilation convolutions are used to combine the contextual information.
- Finally, a simplification operation is performed on the features using convolution to obtain a spatial attention map of , and a batch normalization layer is used at the final tail to make adjustments to the feature scale.
The formula for the spatial attention branch can be expressed as Equation (4).
In the formula, f denotes the convolution operation, BN [23] denotes the batch normalization operation, and the superscript denotes the size of the convolution filter.
Spatial attention branching is represented as in Figure 5.
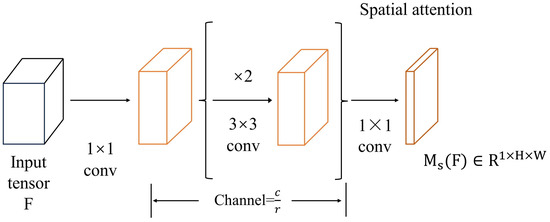
Figure 5.
Structure of spatial attention branch.
3. Experiments
3.1. Software and Hardware Configurations
The deep learning framework PyTorch 1.10.0 is used in this paper for the implementation of network models. The specific software and hardware configurations are shown in Table 1.

Table 1.
Experimental hardware and software configuration.
3.2. Experimental Datasets
Two main datasets are used for the experiments in this paper, the self-built dataset FRSID and SMCD. The dataset FRSID is used for the overall segmentation result experiments of BETAM, and SMCD is used to verify the robustness of the BETAM proposed in this paper, as well as to explore the results of the edge segmentation between different subjects in the data images.
- (1)
- FRSID [24]
FRSID is Fuyang Remote Sensing Image Dataset, which is a dataset built by us. The content of the dataset is the remote sensing images of the Fuyang District area of Hangzhou City, Zhejiang Province in 2021. The study area is located in the northwest of Zhejiang Province, between 119°25′ and 120°19.5′E longitude and 29°44′ and 30°11′N latitude. It has a humid subtropical monsoon climate and the topography is dominated by hills and mountains.
This dataset contains 900 original remote sensing images around the main urban area of Fuyang and is standardized as 600 × 600 pixels RGB images. All categories contained in the dataset are labeled and stored using the graphical interface labeling software LabelMe 3.16.7 [25], which generates JSON files and transforms the data labels into binarized png images using the JSON to dataset command. The dataset is stored in PASCAL VOC [26] data format. Using the data enhancement tool, the dataset is augmented with a combination of operations including but not limited to random rotation, mirroring, etc., to expand the dataset and finally increase the number of datasets to 4500 RGB images to improve the generalization ability. The spatial resolution is 2 M.
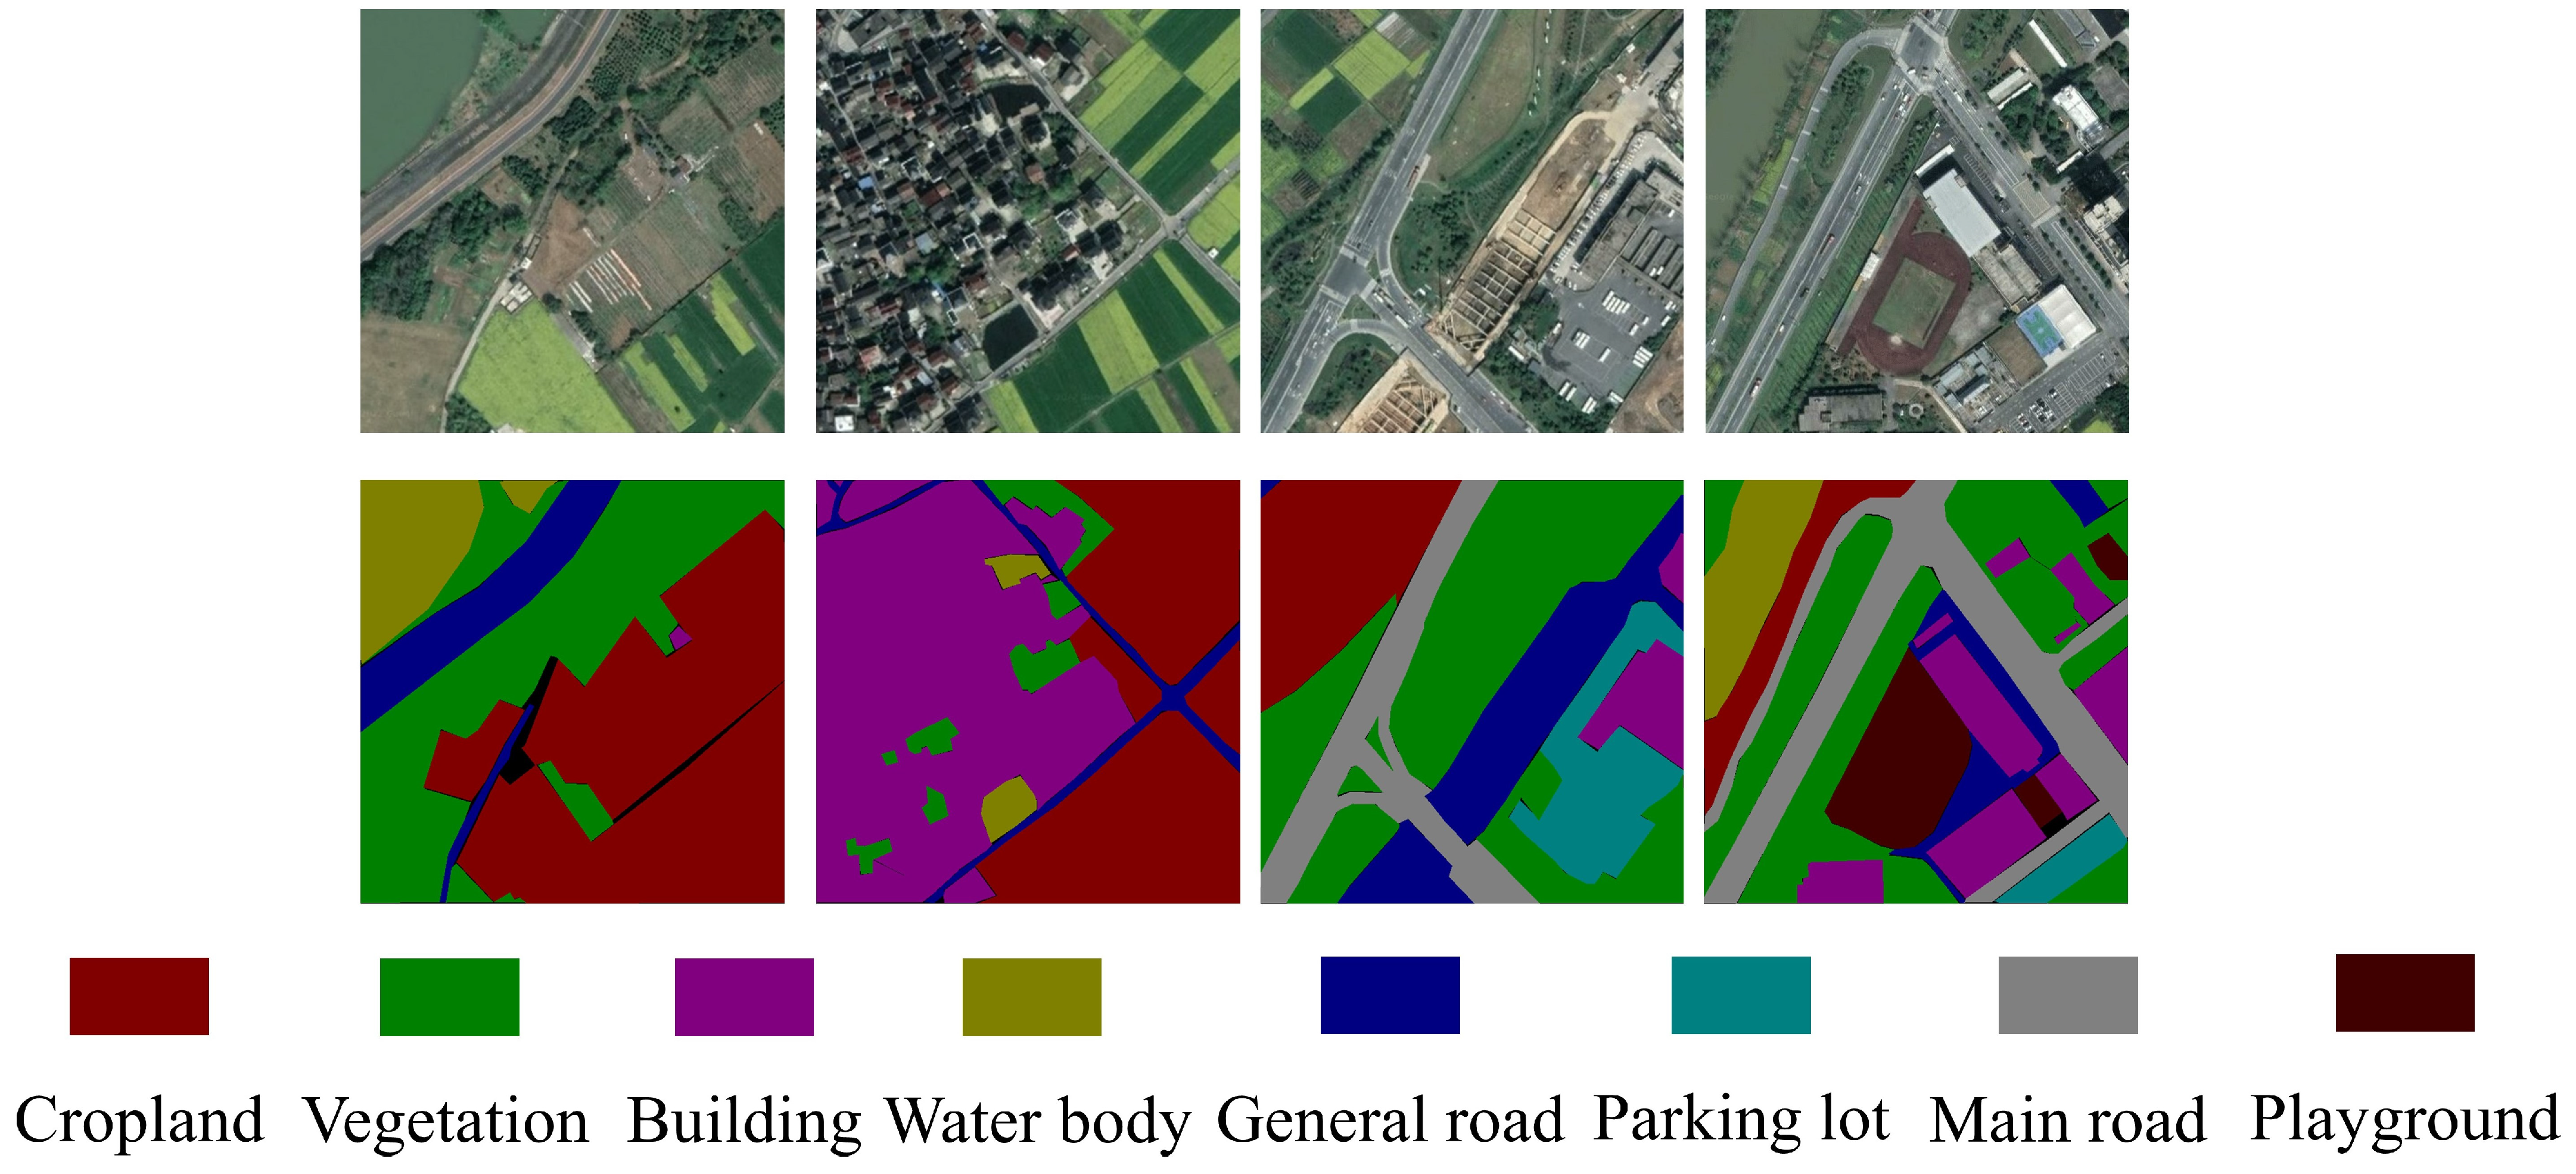
The eight categories of image annotation in the dataset are: cropland, vegetation, building, water body, general road, parking lot, main road, and playground. Some of the original images and labeled maps in the FRSID dataset are shown in Figure 6.
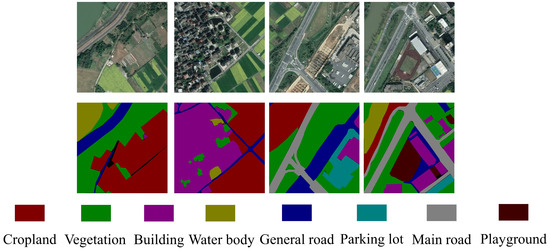
Figure 6.
FRSID dataset raw and labeled images.
- (2)
- SMCD
SMCD is the Subject Meticulous Categorization Dataset, which is a newly created dataset for the experiments of this paper. Most of the images in the dataset come from the dataset FRSID. SMCD contains 1600 original remote sensing images with a standard resolution of 600 × 600-pixel RGB images. Using the data enhancement tool, the dataset was enhanced and finally the number of datasets increased to 3200 RGB images. The dataset contents are described in detail in Section 3.3.
3.3. Partition of SMCD Dataset
In order to test the relationship between the edge segmentation effect of similar categories present in the dataset and the segmentation accuracy of the model and validate the robustness of the attention mechanism BETAM proposed in this paper, the SMCD dataset is partitioned according to the following four subject types: building, field, water and vegetation. This results in four sub-datasets: (1) Buildings Dataset (BD); (2) Field Dataset (FD); (3) Water Dataset (WD); and (4) Vegetation Dataset (VD).
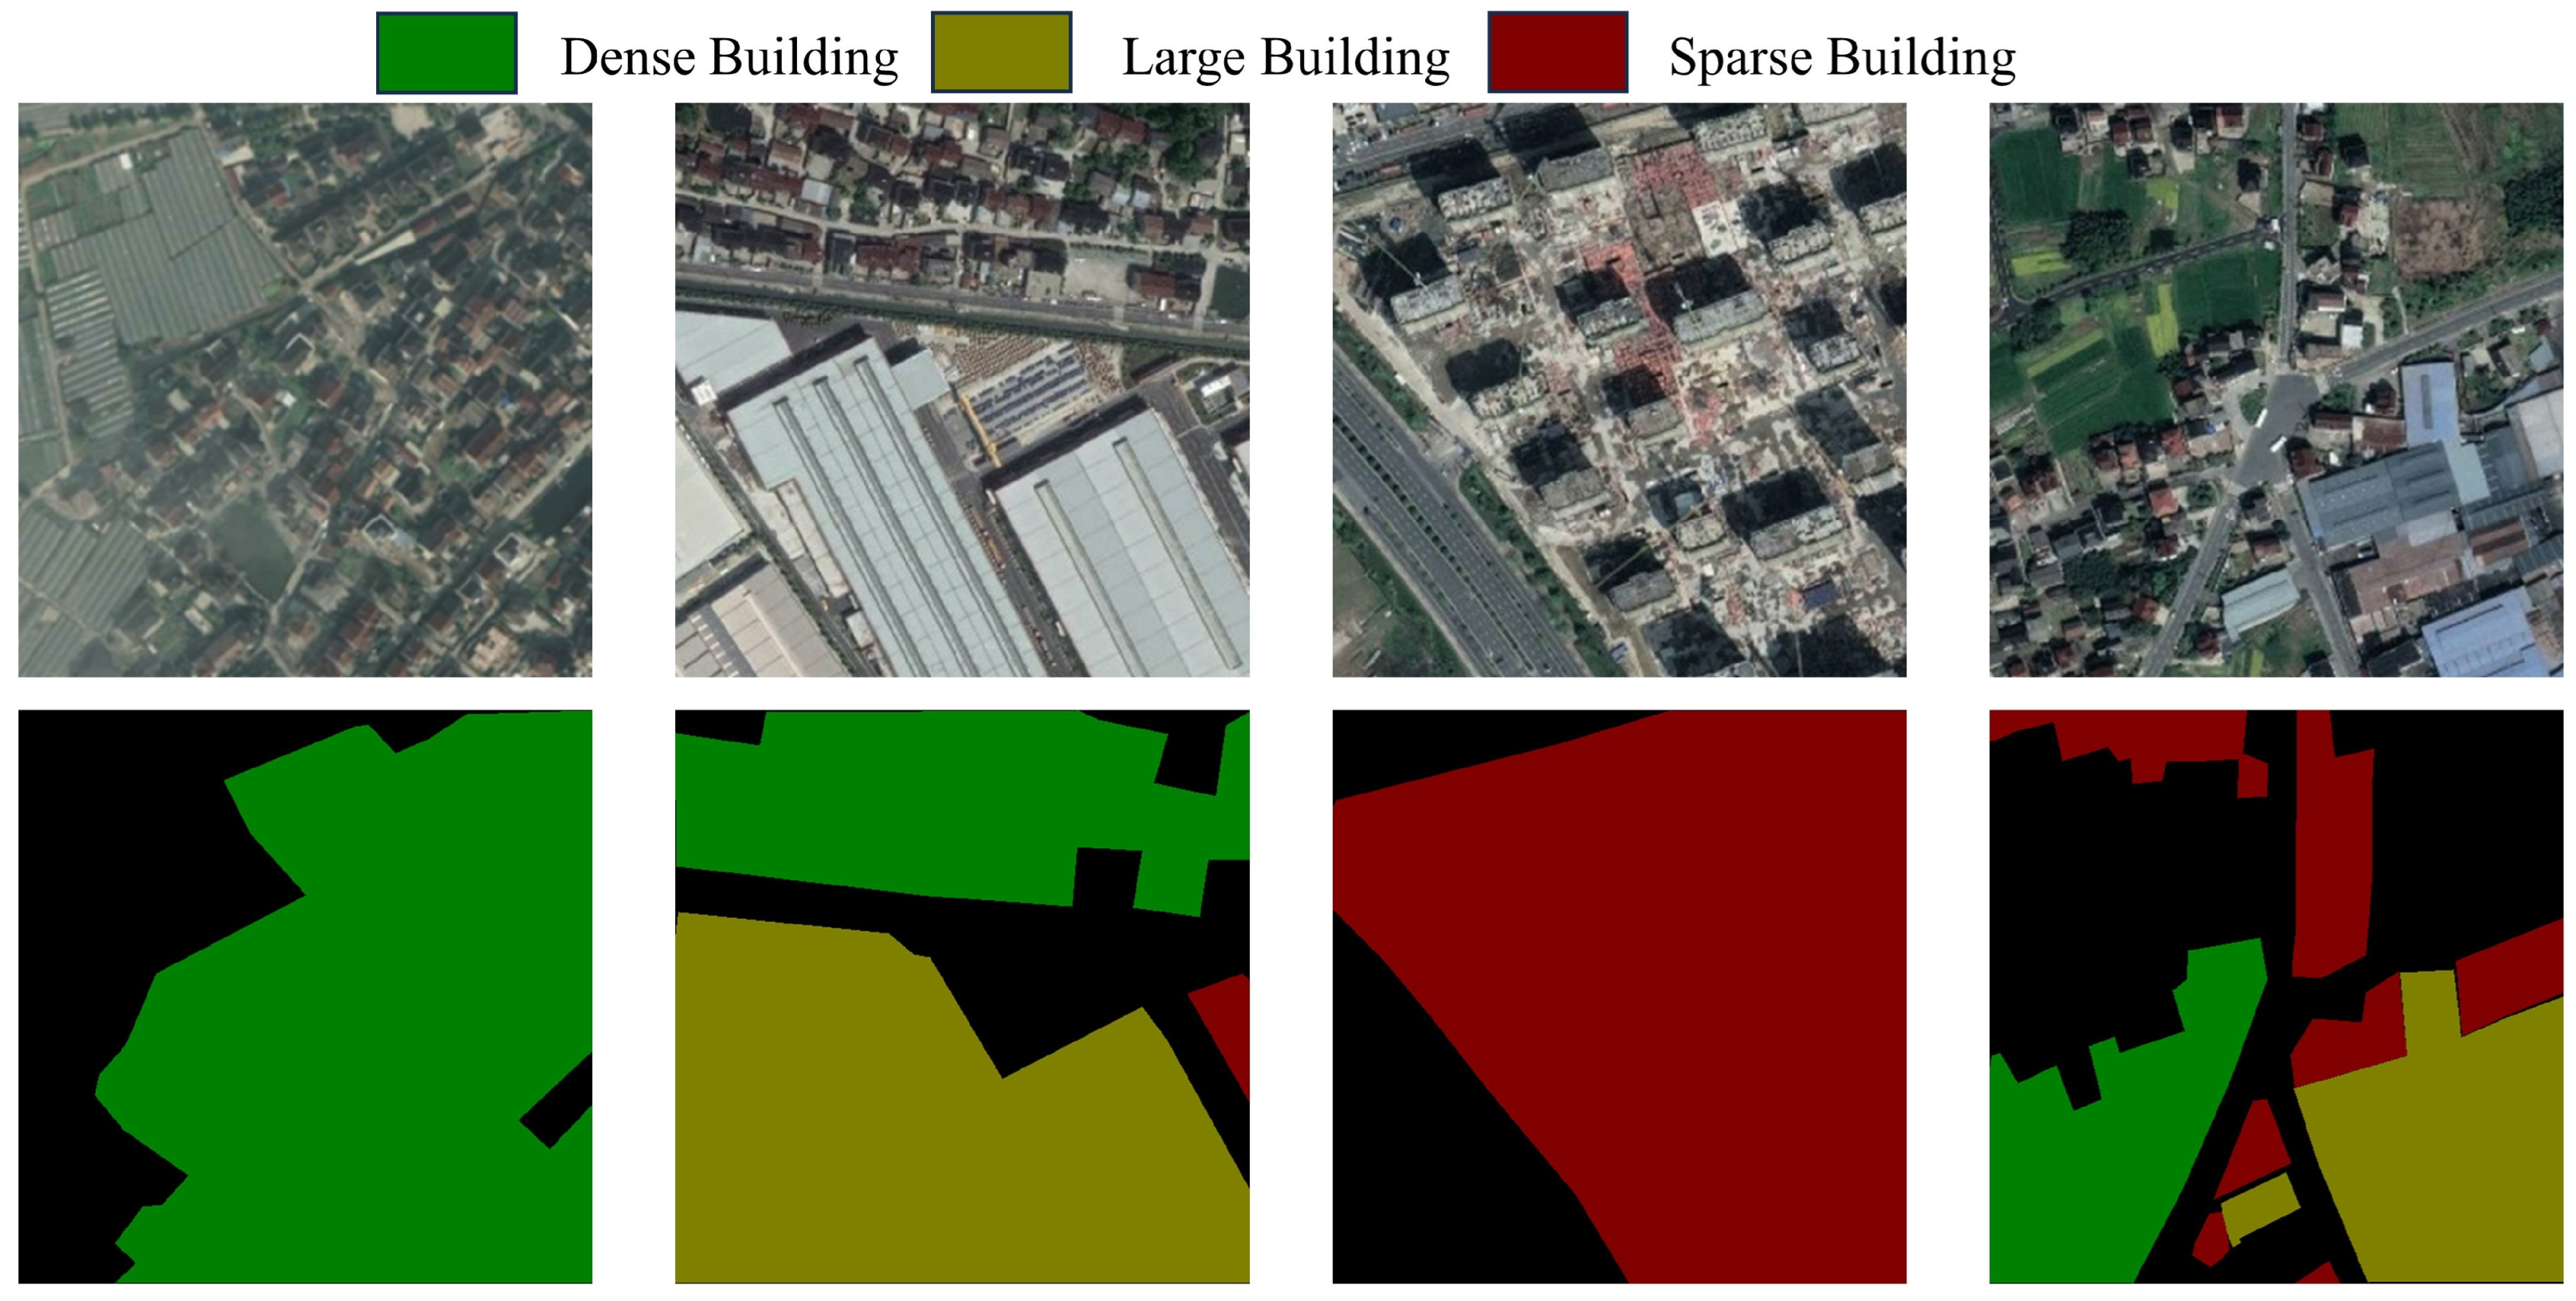
3.3.1. Buildings Dataset (BD)
This sub-dataset includes images whose main proportion is buildings. The images containing buildings were selected, and a total of 400 data images were chosen. The image annotation categories in the dataset were categorized into three different levels: Dense Buildings, Large Buildings, Sparse Buildings. Some samples of the BD dataset are displayed in Figure 7.
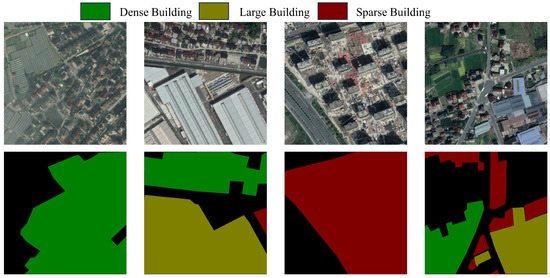
Figure 7.
BD dataset images and their labeled images.
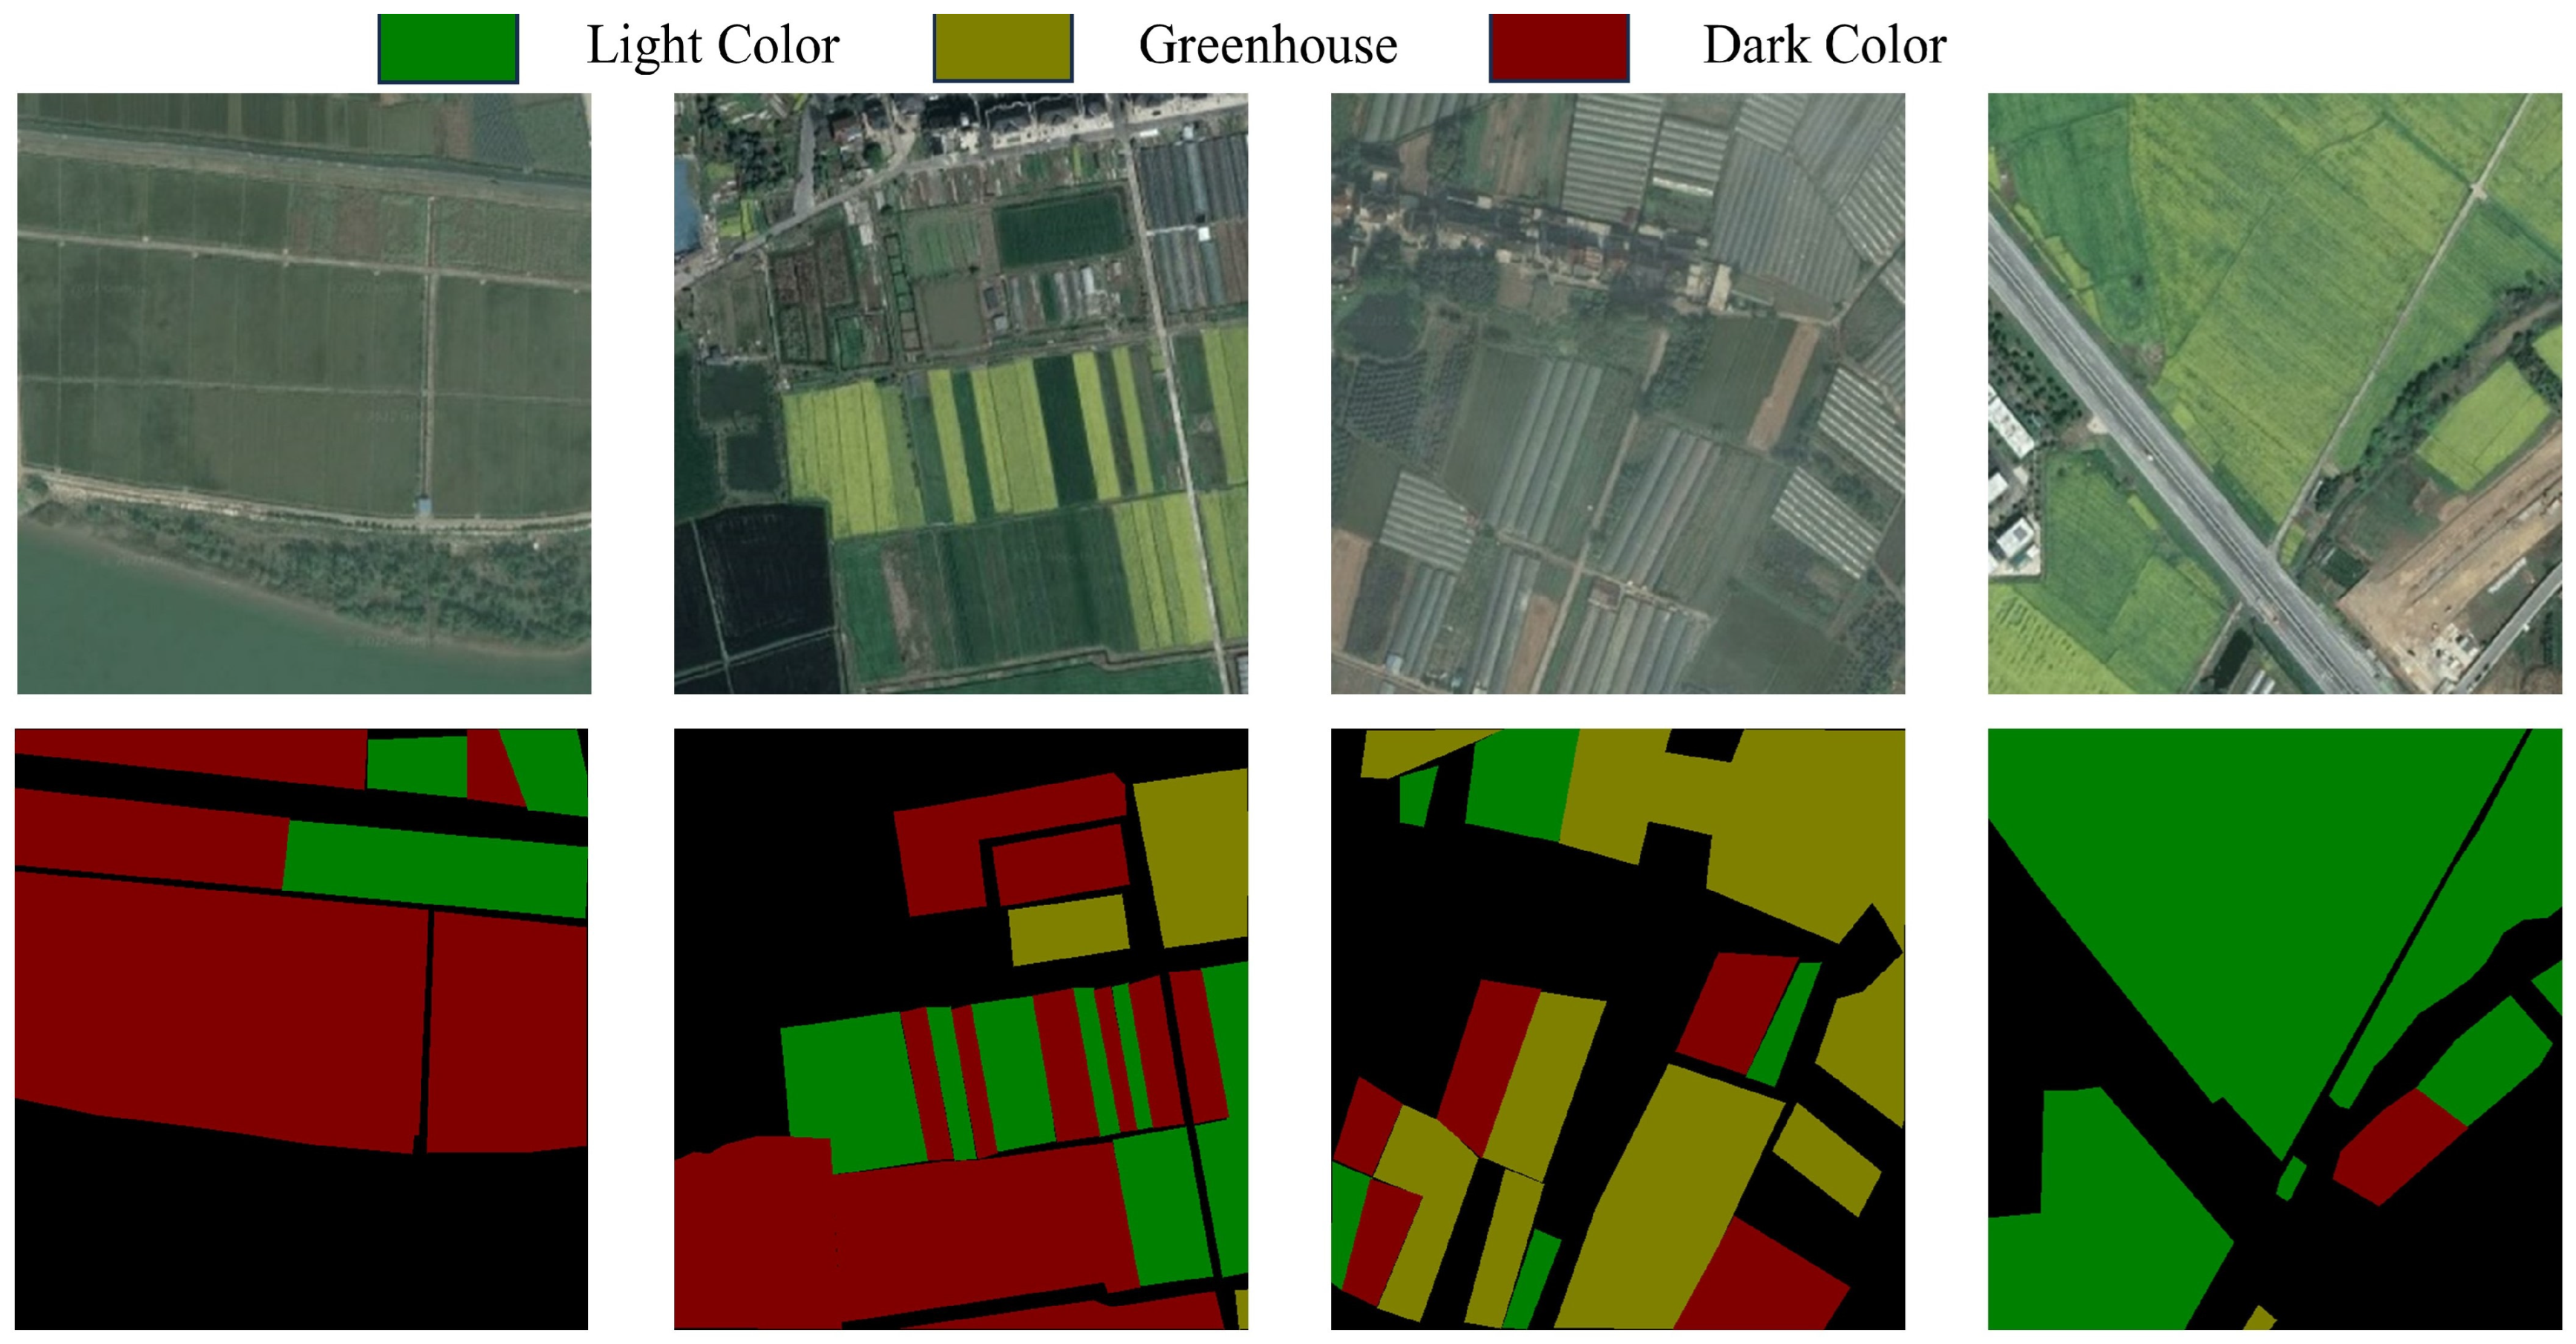
3.3.2. Field Dataset (FD)
This sub-dataset is primarily constructed for crop land. The data images containing arable land were selected, and a total of 400 data images with arable land as the subject were chosen. The image annotation in the dataset was categorized into three different levels: Dark Color, Light Color, Greenhouse. Some samples of the FD dataset are represented in Figure 8.
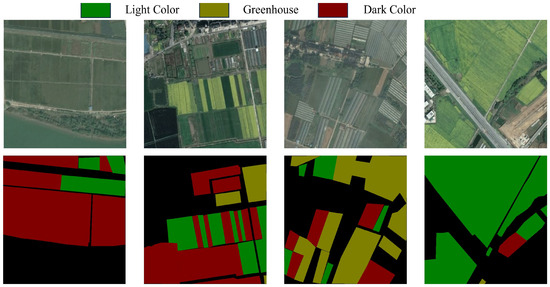
Figure 8.
FD dataset images and their labeled images.
3.3.3. Water Dataset (WD)
This sub-dataset is constructed mainly for water bodies. The data images containing water bodies were selected, and a total of 400 data images whose subjects were water bodies were chosen. The image annotation categories in the dataset were categorized into three levels: Flow Area, Enclosed Area, Dyke-dam. Some samples of the WD dataset are represented in Figure 9.
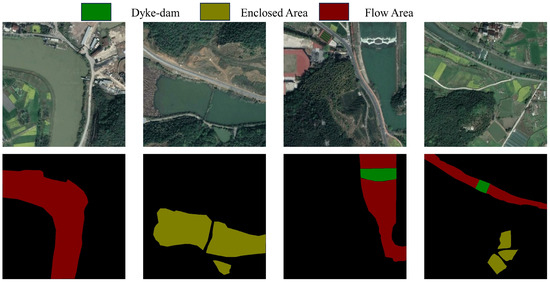
Figure 9.
WD dataset images and their labeled images.
3.3.4. Vegetation Dataset (VD)
This sub-dataset is constructed for vegetation. The data images containing vegetation were selected, and a total of 400 data images with vegetation as the subject were chosen. The image annotation in the dataset were categorized into three levels: Forest, Shrubs, Grass. Some samples of the VD dataset are shown in Figure 10.
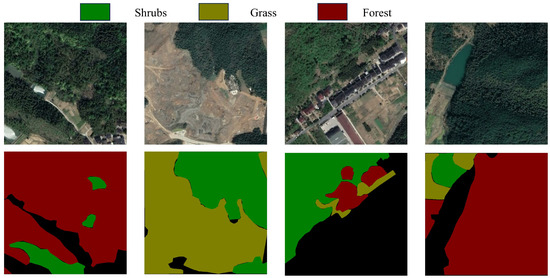
Figure 10.
VD dataset images and their labeled images.
3.4. Data Augmentation
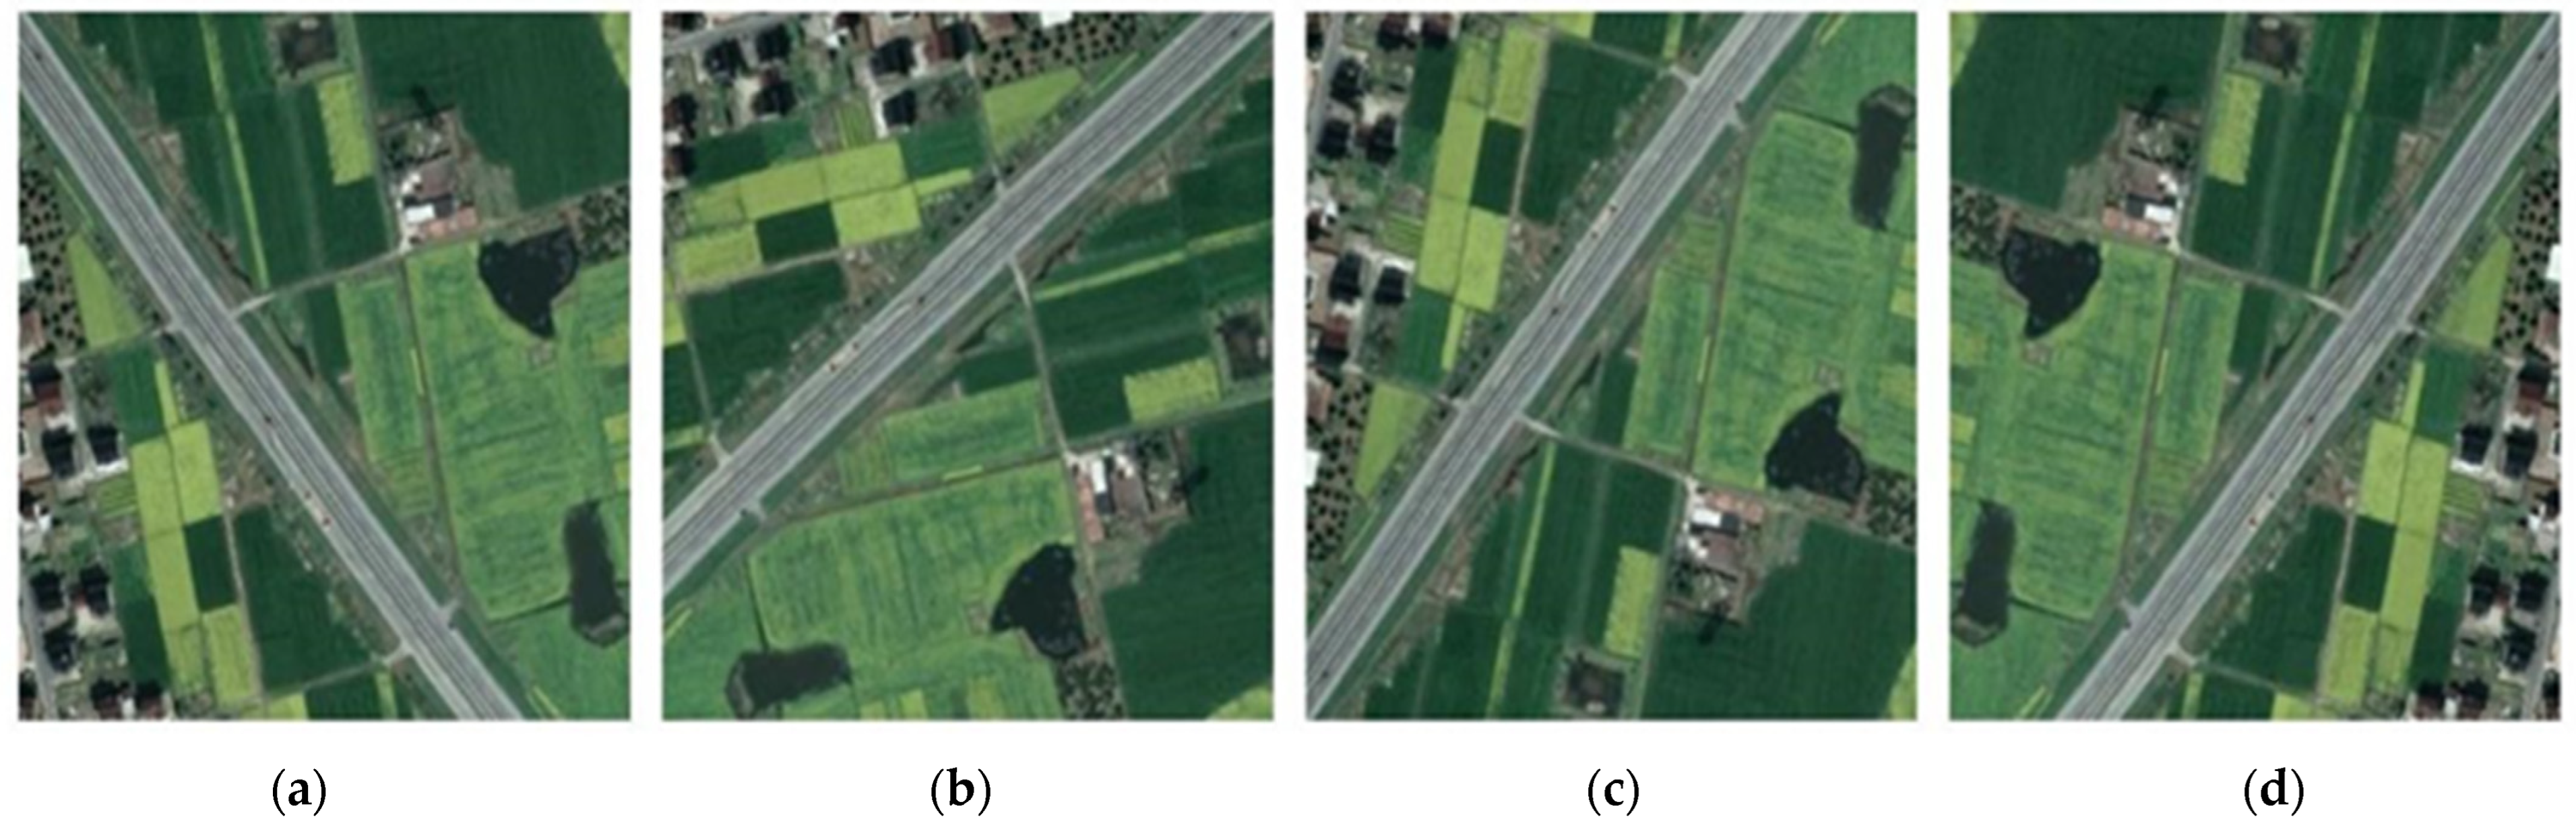
The data preprocessing steps are crucial as they have a direct positive impact on the effectiveness and segmentation accuracy of the model. Data augmentation is a method of increasing the size of a training set by creating modified versions of the original data. The main purpose of data augmentation is to prevent overfitting of the model and improve its generalization ability. Data augmentation is widely used in tasks such as image classification and speech recognition. There are generally several methods for data augmentation: image rotation, scaling, and flipping. These operations can generate visually different but semantically identical images, thereby increasing the recognition ability of a model for images from different perspectives, sizes, and directions. The data augmentation methods used in this article mainly include flipping, mirroring, scaling, etc. Some data images are shown in Figure 11.

Figure 11.
Data augmentation. (a) Original image. (b) Rotating image. (c) Vertical mirror. (d) Horizontal mirror.
3.5. Evaluation Indicators
In the experiments of this paper, the following metrics were used to evaluate the segmentation performance of the high-resolution remote sensing image dataset: mean Intersection over Union (mIoU), mean Pixel Accuracy (mPA) and mean Recall (mRecall).
- (1)
- mean Intersection over Union (mIoU)
The mIoU is the most commonly used evaluation metric in experimental studies of semantic segmentation. The ratio of the intersection and union of the two sets of true and predicted values on each category is calculated firstly, and then average for the intersection and union ratios over all categories is calculated, and the result is mIoU. The formula can be expressed as Equation (5).
- (2)
- mean Pixel Accuracy (mPA)
The mPA is the average of the ratio of correctly predicted pixel points to total pixel points for all categories. The formula is as Equation (6).
- (3)
- mean Recall (mRecall)
mRecall is the average of the sum of the ratios of the number of pixel points correctly categorized in each category to the number of pixel points predicted to be in that category. The formula is as Equation (7).
In this formula, n is the total category, represents the number of pixels that would have belonged to category but were predicted to be in category , represents the number of pixels that would have belonged to category but were predicted to be in category , represents the number of correct predictions, and and are false positive and false negative, respectively.
3.6. Experimental Schemes
3.6.1. Determination of Training Parameters
All datasets for this experiment were selected and the training set, validation set and test set were constructed using 80%, 10%, and 10% images, respectively. All models in the experiments were implemented using PyTorch.
In this paper, we design and test the accuracy of the model under different learning rate and batch size using publicly available remote sensing image-like datasets, and the final selection of training parameters is shown in Table 2.
Table 2.
Optimal training parameters.
In order to improve the accuracy of model segmentation, pre-training weights are loaded before model training, and the loss function Focal Loss is used to reduce the impact of large differences in the proportion of feature classes in the dataset on the accuracy of model feature classification.
3.6.2. Experimental Scheme for Performance Comparison
In order to verify the segmentation performance of the triple attention mechanism BETAM proposed in this paper, seven different models, DeeplabV3+, DeeplabV3+(SENet), DeeplabV3+(CBAM), DeeplabV3+(SAM), DeeplabV3+(CAM), DeeplabV3+(ECANet) and DeeplabV3+(BETAM), which are the different forms of attention mechanism embedded in DeeplabV3, were used for the comparative experiments. The mIoU, mPA, and mRecall are used as metrics to test the segmentation performance of this paper’s method.
3.6.3. Experimental Scheme for Robustness Analysis
In order to test the generalization ability and the robustness of BETAM proposed in this paper, experiments are conducted on the Buildings Dataset, the Field Dataset, the Water Dataset and the Vegetation Dataset, which are classified as four different subject datasets. The mIoU, mPA, and mRecall are selected as metrics to test the robustness of the method in this paper.
3.6.4. Scheme of Ablation Experiments
In order to verify the effectiveness in facilitating the segmentation performance of the triple attention mechanism BETAM proposed in this paper, the triple attention mechanisms of position, channel and space are used as the ablation variables to carry out the segmentation result ablation experiments on the FRSID dataset.
A total of five modeling experiments are conducted for control, which are described in detail as follows.
- DeeplabV3+: The traditional DeeplabV3+ model.
- DeepP: Adding positional attention mechanism after ASPP module based on DeeplabV3+.
- DeepC: Adding channel attention mechanism after ASPP module based on DeeplabV3+.
- DeepS: Adding spatial attention mechanism after ASPP module based on DeeplabV3+.
- DeepBETAM: Adding the triple attention mechanism BETAM after the ASPP module based on DeeplabV3+.
4. Results and Analysis
4.1. Segmentation Results
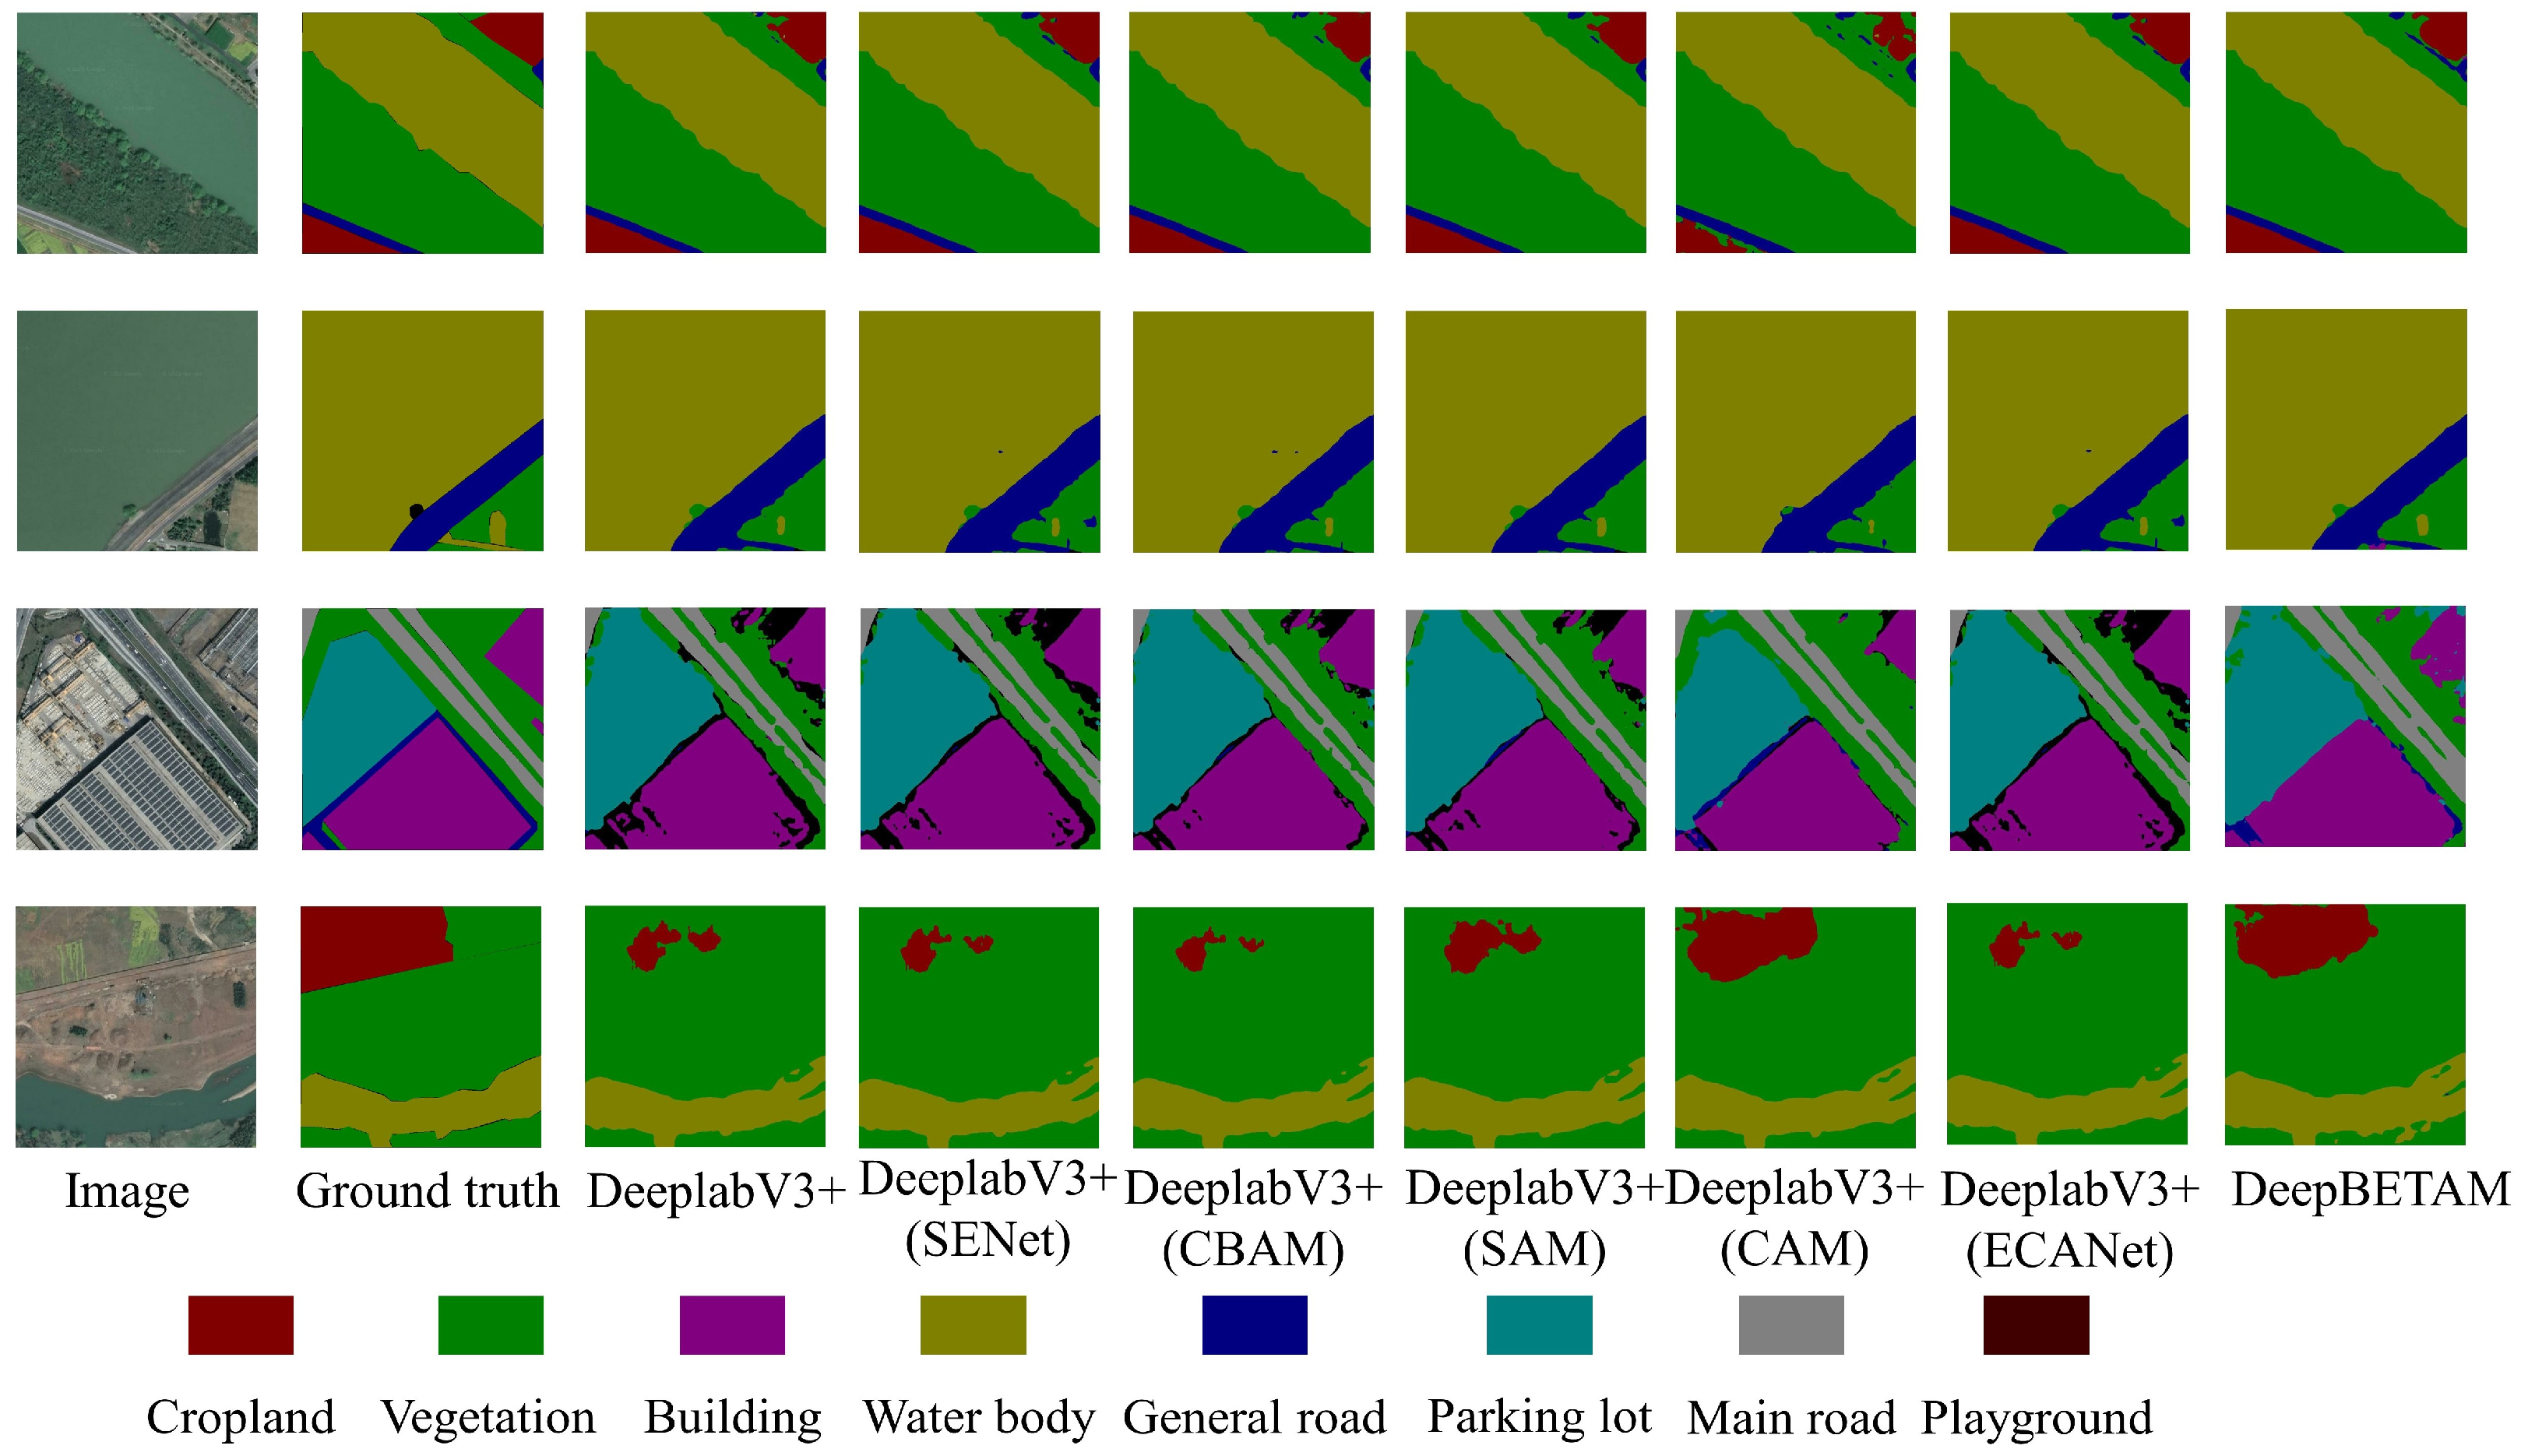
In order to verify the impact of the triple attention mechanism BETAM proposed in this paper on segmentation performance, DeeplabV3+, DeeplabV3+(SENet), DeeplabV3+(CBAM), DeeplabV3+(SAM), DeeplabV3+(CAM), DeeplabV3+(ECANet) and DeeplabV3+(BETAM) are different attention mechanisms for comparative experiments. Experiments were carried out using the FRSID dataset. The segmentation comparison results for some images are shown in Figure 12. The edge segmentation detail comparison is shown in Figure 13. Using mIoU, mPA, and mRecall as metrics for comparison, the results of the evaluation metrics are shown in Table 3.
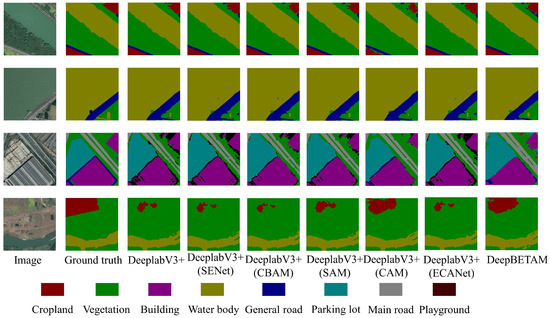
Figure 12.
Segmentation experiment result image.
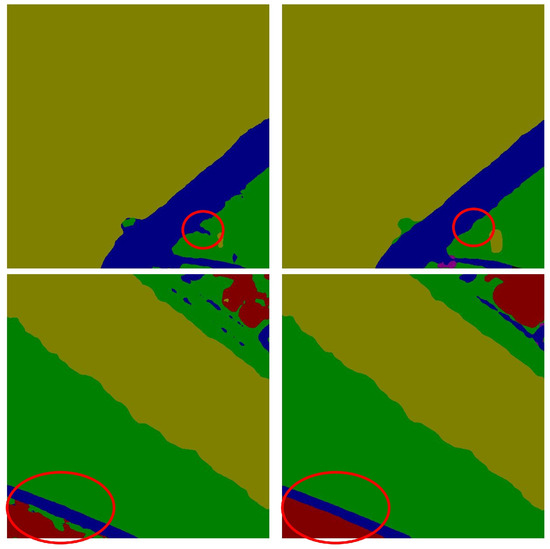
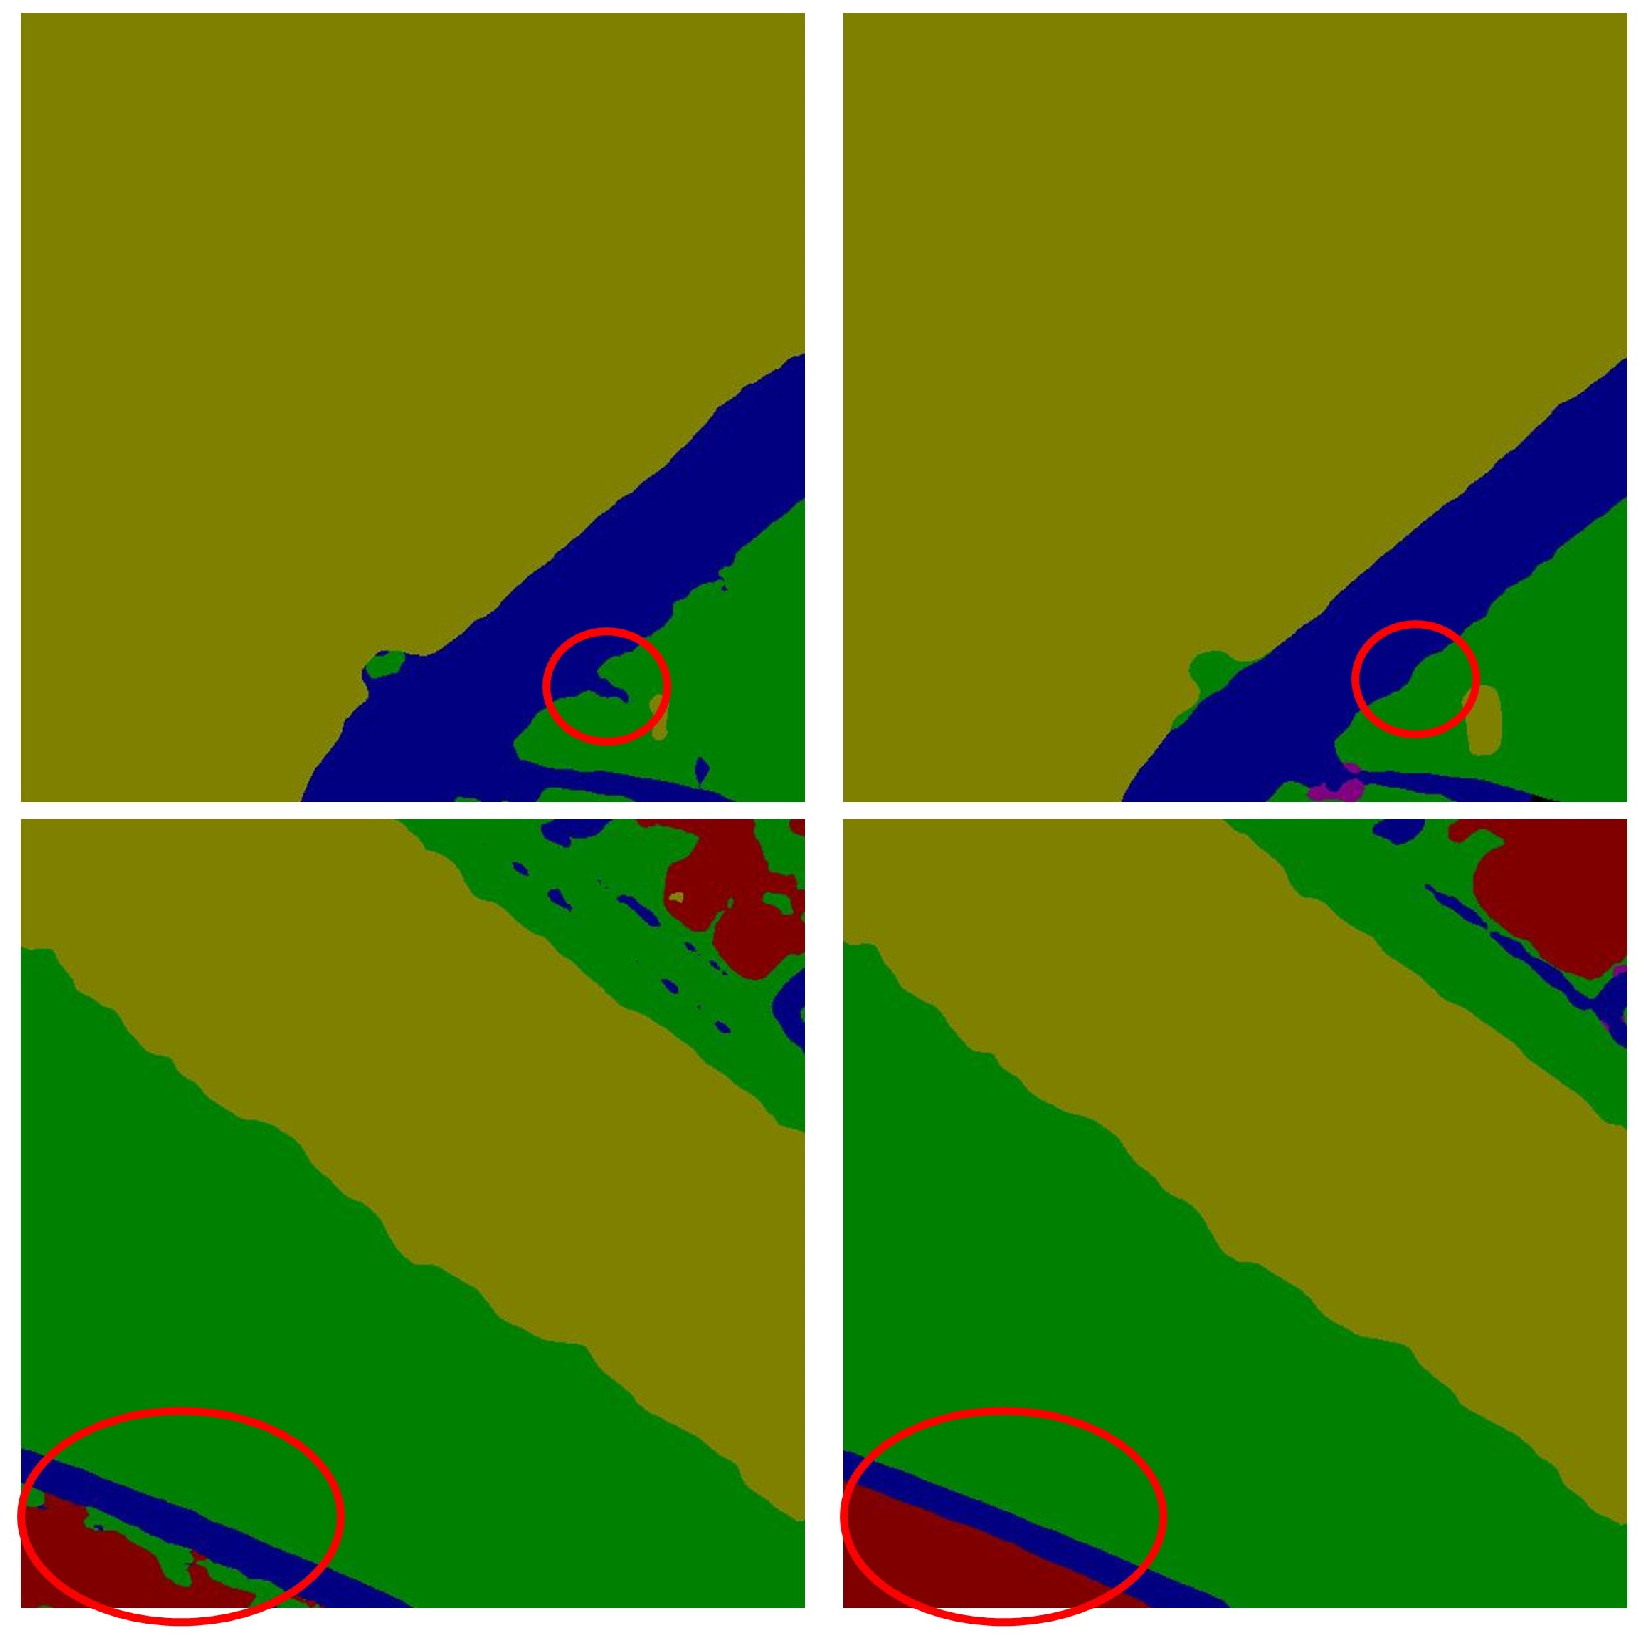
Figure 13.
Edge Segmentation Detail Comparison. The red circles indicate the positions with a clear distinction.
Table 3.
Segmentation results of different modeling methods.
From Figure 13, it can be seen that the segmentation effect of the proposed BETAM attention mechanism is better than that of DeeplabV3+, DeeplabV3+(SENet), DeeplabV3+(CBAM), DeeplabV3+(SAM), and DeeplabV3+(CAM). It is especially more effective in the detection of edge segmentation effect, proving that the triple attention mechanism BETAM has a good role in edge feature enhancement.
From Table 3, it can be seen that the triple attention mechanism BETAM proposed in this paper is better for semantic segmentation than the DeeplabV3+ network incorporating other attention mechanisms. In the FRSID dataset segmentation results, the mPA of this method is 71.27%, which is 1.7%, 1.4%, 0.5%, 0.6%, 1.1% and 0.5% higher than DeeplabV3+, DeeplabV3+(SENet), DeeplabV3+(CBAM), DeeplabV3+(SAM), DeeplabV3+(CAM), DeeplabV3+(ECANet); the mRecall of this method was 71.31%, which was 2.0%, 1.2%, 1.7%, 1.3%, 1.1% and 0.6% higher than DeeplabV3+, DeeplabV3+(SENet), DeeplabV3+(CBAM), DeeplabV3+(SAM), DeeplabV3+(CAM); the mIoU of this method was 63.64%, which was 3.2%, 2.2%, 2.3%, 1.3%, 1.7% and 1.0% higher than DeeplabV3+, DeeplabV3+(SENet), DeeplabV3+(CBAM), DeeplabV3+(SAM), and DeeplabV3+(CAM), DeeplabV3+(ECANet), respectively.
The experimental results showed that the triple attention mechanism BETAM outperforms the other six comparison models on the dataset FRSID. Importing BETAM into the DeeplabV3+ model improves the feature extraction ability and segmentation accuracy of the model, further demonstrating the ability of BETAM edge feature enhancement.
4.2. Robustness Analysis
In order to test the robustness of the method, comparative experiments of segmentation effects were carried out on the datasets BD, FD, WD, and VD, using the models trained from the SMCD dataset.
Segmentation experiments are performed on the dataset BD, which is dominated by buildings, and the results are shown in Table 4.
Table 4.
Comparison of Segmentation Performance of the Building Dataset BD.
Segmentation experiments are performed on the dataset FD dominated by cropland. The comparison results are shown in Table 5.
Table 5.
Comparison of Segmentation Performance of the Field Dataset FD.
Segmentation experiments are performed on the dataset WD, which is dominated by water bodies, and the comparison results are shown in Table 6.
Table 6.
Comparison of Segmentation Performance of the Water Dataset WD.
Segmentation experiments were performed on the Vegetation Dataset VD, and the comparison results are shown in Table 7.
Table 7.
Comparison of Segmentation Performance of the Vegetation Dataset VD.
As can be seen from the four tables above, the DeeplabV3+ model equipped with the triple attention mechanism BETAM shows better segmentation performance, as well as robustness, on datasets dominated by buildings, cultivated land, water bodies or vegetation. The segmentation result on the dataset dominated by water bodies was the best, with an mIoU of 74.14%, which was the most effective classification among the four datasets. The reason is that images in WD have more neat and regular classification edges compared with several other datasets, unlike the edges of images in VD, which are uneven.
4.3. Results of Ablation Experiments
The experiments in this section were performed according to the ablation experiment protocol of Section 3.6.4, and the evaluation metrics were mPA, mRecall, and mIoU. The results of the experimental data are shown in Table 8.
Table 8.
Ablation experiment segmentation results.
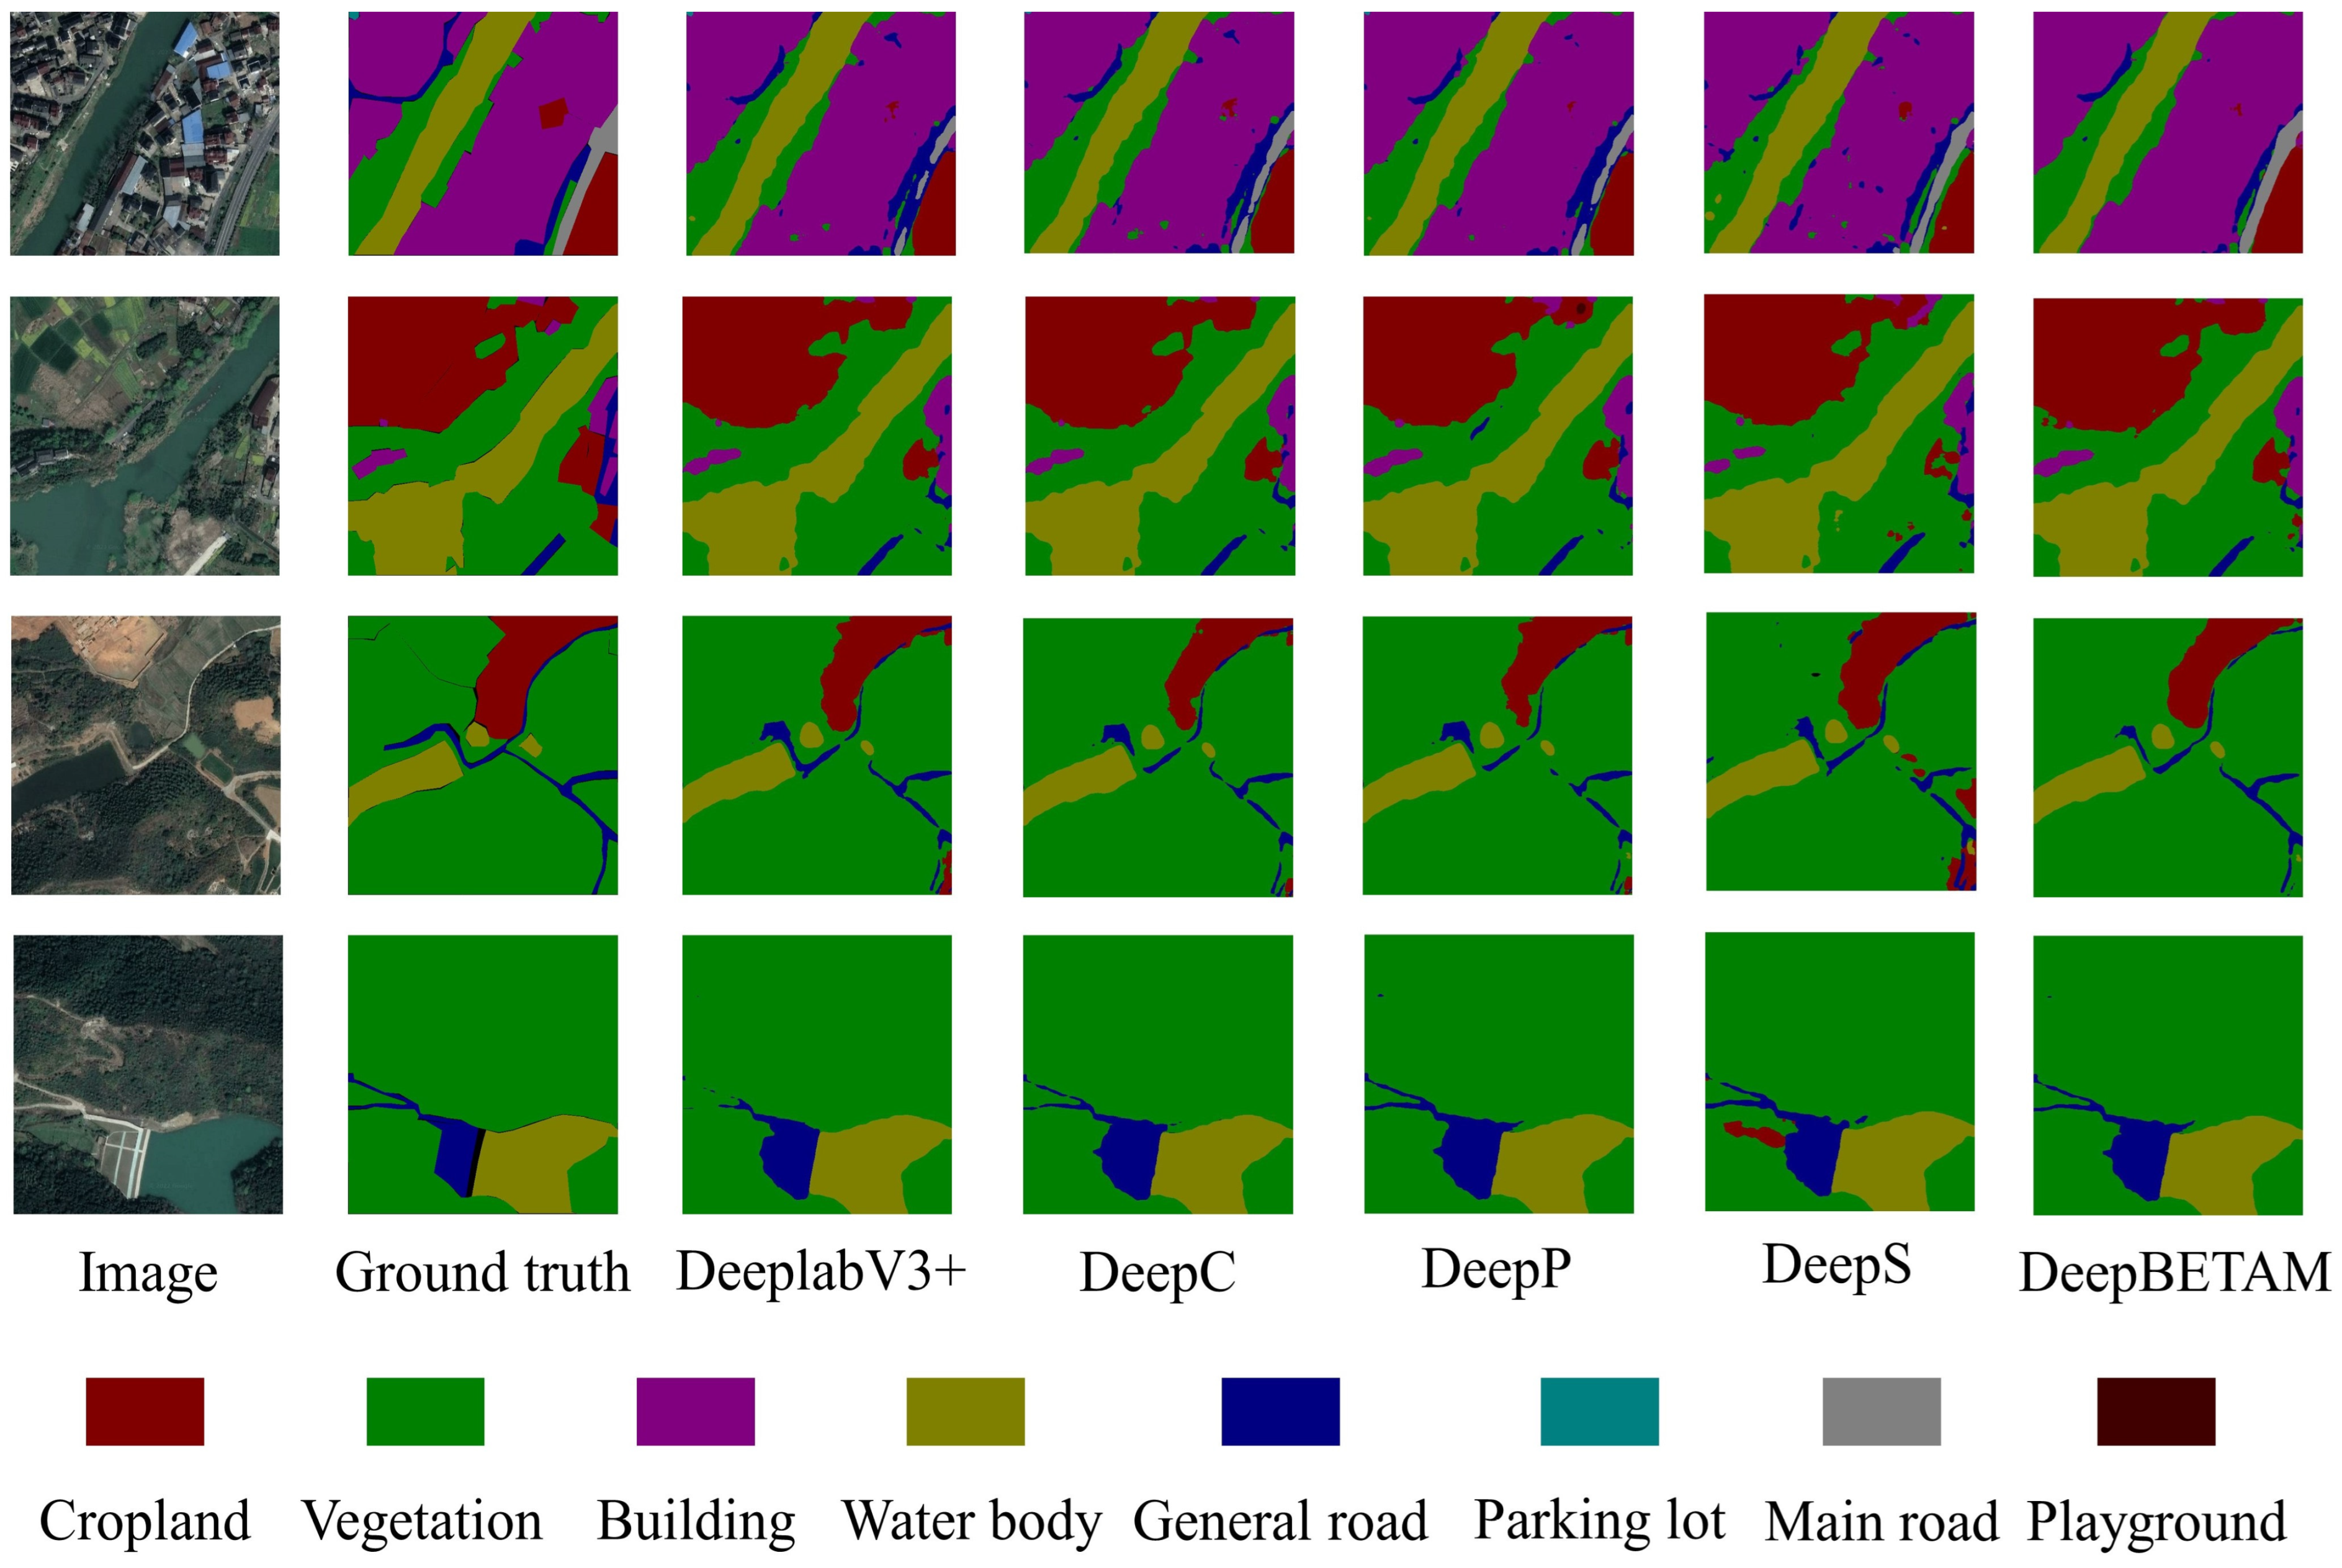
According to the results of the ablation experiments in Table 8, it can be seen that the inclusion of different attention mechanisms contributes to the segmentation accuracy of the model. The DeepP model improves the model accuracy slightly more. By modeling the positional association of image features, the DeepP model is able to capture the correlation and dependency between different positions, which helps the model to better understand the information of each position in the image, improves the model’s characterization and generalization ability, and increases the performance of the model’s edge segmentation. The DeepB model improves performance to some extent while adding little or no burden to computational complexity. The fusion of the three attention mechanisms is the triple attention mechanism BETAM proposed in this paper. The import of this attention mechanism BETAM into the DeeplabV3+ model resulted in an mIoU of 63.64%, which is a 2.3% improvement over the original DeeplabV3+ module. All branches of the BETAM attention mechanism were verified as effective for the model in the ablation experiments. Therefore, it is concluded that the attention mechanism BETAM can better improve the accuracy of segmentation and enhance the ability of edge segmentation.
The specific experimental results are shown in Figure 14.
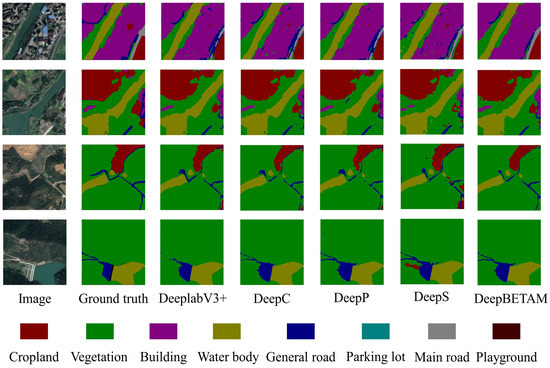
Figure 14.
Images of ablation experiment results.
5. Conclusions
In this paper, a triple attention mechanism BETAM for edge feature enhancement of remote sensing images is proposed. BETAM consists of a combination of three forms of attention and incorporates the advantages of these three branches. The positional attention branch is utilized to encode contextual information as local features to enhance its representation. Capturing feature dependencies in the three dimensions of position, space, and channel, respectively, BETAM is able to focus more on edge features through feature importance weighting, modeling of spatial relationships, and adaptive learning capabilities. Comparative experiments were conducted on the FRSID dataset, and the segmentation effect on different subject categorization datasets was tested on the SMCD dataset, verifying the robustness of the DeeplabV3+ model equipped with the BETAM attention mechanism.
Semantic segmentation models can effectively segment remote sensing images for land cover classification, utilizing the ability of BETAM edge feature enhancement to obtain better segmentation results. The mIoU of DeepBETAM on the FRSID dataset reached 63.64%, the mPA reached 71.27%, and the mRecall reached 71.31%, which achieved better results compared with other attention mechanisms and realized effective segmentation of remote sensing images with rural surface information. The remote sensing image dataset SMCD was established and the robustness of the model DeepBETAM was tested in different subject categorization datasets. Through comparison experiments with DeeplabV3+, DeeplabV3+(SENet), DeeplabV3+(CBAM), DeeplabV3+(SAM), DeeplabV3+(CAM), DeeplabV3+(ECANet), which are semantic segmentation models accompanied with different attention mechanisms, the effectiveness of the triple attention mechanism BETAM utilized in DeeplabV3+ model segmentation is demonstrated.
The attention mechanism BETAM can be applied to crop monitoring and disease monitoring in the agricultural field, utilizing attention mechanisms to more effectively identify crop disease areas and improve the accuracy and efficiency of disease monitoring. In urban planning, attention mechanisms can be used to more accurately analyze and predict traffic flow, optimize traffic planning and management. In terms of environmental monitoring, it can be used to analyze and identify the precursors of natural disasters and make early warnings.
However, the proposed attention mechanism BETAM has some potential limitations. The effectiveness of attention mechanisms may depend on specific application scenarios and datasets. In some cases, inappropriate attention allocation may lead to a decrease in the performance of the model. In addition, attention mechanisms typically require a large amount of computing resources, which may limit their application in resource constrained environments.
The further work of this study can be focused on the following aspects. 1. For the categories with low segmentation accuracy, the reasons need to be studied and improvements can be made accordingly, so as to improve the segmentation accuracy of the overall model. 2. Some uncertain factors in the segmentation, such as low clarity between different categories and the presence of shadow areas, may influence the accuracy of the segmentation model, so methods to reduce the interference of these factors need be investigated. 3. A dataset with more remote sensing images and more categories of land cover needs be constructed, using algorithms to provide more detailed definitions for dataset classification. 4. Algorithm-assisted methods of semi-automatic or fully-automatic data annotation need be proposed, so as to expand the dataset and obtain more usable data.
Author Contributions
Conceptualization, J.C. and G.W.; methodology, J.C., G.W., L.M., P.W. and X.Y.; software, J.C.; validation, J.C.; formal analysis, J.C., P.W. and X.Y.; investigation, J.C., G.W., L.M., P.W. and X.Y.; data curation, J.C.; writing—original draft, J.C.; resources, G.W. and L.M.; writing—review and editing, G.W.; funding acquisition, L.M. and P.W. All authors have read and agreed to the published version of the manuscript.
Funding
This study was supported by the Key Research and Development Program of Zhejiang Province (Grant number: 2021C02005) and the Natural Science Foundation of China (Grant number: U1809208).
Data Availability Statement
The original contributions presented in the study are included in the article, further inquiries can be directed to the corresponding author.
Conflicts of Interest
The authors declare no conflicts of interest.
References
- Shao, Z.; Tang, P.; Wang, Z.; Saleem, N.; Yam, S.; Sommai, C. BRRNet: A fully convolutional neural network for automatic building extraction from high-resolution remote sensing images. Remote Sens. 2020, 12, 1050. [Google Scholar] [CrossRef]
- Cao, X.; Li, T.; Li, H.; Xia, S.; Ren, F.; Sun, Y.; Xu, X.A. robust parameter-free thresholding method for image segmentation. IEEE Access 2018, 7, 3448–3458. [Google Scholar] [CrossRef] [PubMed]
- Li, J.; Cheng, X.; Wu, Z.; Guo, W. An over-segmentation-based uphill clustering method for individual trees extraction in urban street areas from MLS data. IEEE J. Sel. Top. Appl. Earth Obs. Remote Sens. 2021, 14, 2206–2221. [Google Scholar] [CrossRef]
- Pan, S.; Tao, Y.; Nie, C.; Chong, Y. PEGNet: Progressive edge guidance network for semantic segmentation of remote sensing images. IEEE Geosci. Remote Sens. Lett. 2020, 18, 637–641. [Google Scholar] [CrossRef]
- Yuan, Y.; Chen, X.; Wang, J. Object-contextual representations for semantic segmentation. In Proceedings, Part VI 16, Proceedings of the Computer Vision–ECCV 2020: 16th European Conference, Glasgow, UK, 23–28 August 2020; Springer International Publishing: Cham, Swizerland, 2020; pp. 173–190. [Google Scholar]
- Bahdanau, D.; Cho, K.; Bengio, Y. Neural machine translation by jointly learning to align and translate. arXiv 2014, arXiv:1409.0473. [Google Scholar]
- Xu, K.; Ba, J.; Kiros, R.; Cho, K.; Courville, A.; Salakhudinov, R.; Zemel, R.; Bengio, Y. Show, attend and tell: Neural image caption generation with visual attention. In Proceedings of the 32rd International Conference on Machine Learning, Lille, France, 6–11 July 2015; Association of Computing Machinery: New York, NY, USA, 2015; Volume 37, pp. 2048–2057. [Google Scholar]
- Huo, Y.; Gang, S.; Dong, L.; Guan, C. An Efficient Semantic Segmentation Method for Remote-Sensing Imagery Using Improved Coordinate Attention. Appl. Sci. 2024, 14, 4075. [Google Scholar] [CrossRef]
- Zhou, N.; Hong, J.; Cui, W.; Wu, S.; Zhang, Z. A Multiscale Attention Segment Network-Based Semantic Segmentation Model for Landslide Remote Sensing Images. Remote Sens. 2024, 16, 1712. [Google Scholar] [CrossRef]
- Fu, J.; Liu, J.; Tian, H.; Li, Y.; Bao, Y.; Fang, Z.; Lu, H. Dual Attention Network for Scene Segmentation. In Proceedings of the 2019 IEEE/CVF Conference on Computer Vision and Pattern Recognition (CVPR), Long Beach, CA, USA, 15–20 June 2019; pp. 3141–3149. [Google Scholar]
- Yan, L.; Huang, J.; Xie, H.; Wei, P.; Gao, Z. Efficient Depth Fusion Transformer for Aerial Image Semantic Segmentation. Remote Sens. 2022, 14, 1294. [Google Scholar] [CrossRef]
- Vaswani, A.; Shazeer, N.; Parmar, N.; Uszkoreit, J.; Jones, L.; Gomez, A.N.; Kaiser, Ł.; Polosukhin, I. Attention is all you need. In Proceedings of the 31st International Conference on Neural Information Processing Systems (NIPS), Long Beach, CA, USA, 4–9 December 2017; pp. 6000–6010. [Google Scholar]
- Fukushima, K.; Miyake, S. Neocognitron: A self-organizing neural network model for a mechanism of visual pattern recognition. In Competition and Cooperation in Neural Nets, Proceedings of the US–Japan Joint Seminar, Kyoto, Japan, 15–19 February 1982; Springer: Berlin/Heidelberg, Germany, 1982; pp. 267–285. [Google Scholar]
- Yuan, X.; Chen, Z.; Chen, N.; Gong, J. Land cover classification based on the PSPNet and superpixel segmentation methods with high spatial resolution multispectral remote sensing imagery. J. Appl. Remote Sens. 2021, 15, 034511. [Google Scholar] [CrossRef]
- Hou, Y.; Liu, Z.; Zhang, T.; Li, Y. C-UNet: Complement UNet for remote sensing road extraction. Sensors 2021, 21, 2153. [Google Scholar] [CrossRef] [PubMed]
- Weng, L.; Xu, Y.; Xia, M.; Zhang, Y.; Liu, J.; Xu, Y. Water areas segmentation from remote sensing images using a separable residual segnet network. ISPRS Int. J. Geo-Inf. 2020, 9, 256. [Google Scholar] [CrossRef]
- Chen, L.C.; Papandreou, G.; Kokkinos, I.; Murphy, K.; Yuille, A.L. Semantic image segmentation with deep convolutional nets and fully connected crfs. arXiv 2014, arXiv:1412.7062. [Google Scholar]
- Yao, X.; Guo, Q.; Li, A. Light-weight cloud detection network for optical remote sensing images with attention-based deeplabv3+ architecture. Remote Sens. 2021, 13, 3617. [Google Scholar] [CrossRef]
- Chen, L.C.; Papandreou, G.; Schroff, F.; Adam, H. Rethinking atrous convolution for semantic image segmentation. arXiv 2017, arXiv:1706.05587. [Google Scholar]
- Chen, L.C.; Zhu, Y.; Papandreou, G.; Schroff, F.; Adam, H. Encoder-decoder with atrous separable convolution for semantic image segmentation. In Proceedings of the European Conference on Computer Vision (ECCV), Munich, Germany, 8–14 September 2018; pp. 801–818. [Google Scholar]
- Chollet, F. Xception: Deep learning with depthwise separable convolutions. In Proceedings of the IEEE Conference on Computer Vision and Pattern Recognition, Honolulu, HI, USA, 21–26 July 2017; pp. 1251–1258. [Google Scholar]
- Park, J.; Woo, S.; Lee, J.Y.; Kweon, I.S. Bam: Bottleneck attention module. arXiv 2018, arXiv:1807.06514. [Google Scholar]
- Glorot, X.; Bordes, A.; Bengio, Y. Deep sparse rectifier neural networks. In Proceedings of the Fourteenth International Conference on Artificial Intelligence and Statistics, Fort Lauderdale, FL, USA, 11–13 April 2011; JMLR Workshop and Conference Proceedings, New York, NY, USA, 2011. pp. 315–323. [Google Scholar]
- Wang, G.; Chen, J.; Mo, L.; Wu, P.; Yi, X. Lightweight Land Cover Classification via Semantic Segmentation of Remote Sensing Imagery and Analysis of Influencing Factors. Front. Environ. Sci. 2024, 12, 1329517. [Google Scholar] [CrossRef]
- Russell, B.C.; Torralba, A.; Murphy, K.P.; Freeman, W.T. LabelMe: A database and web-based tool for image annotation. Int. J. Comput. Vis. 2008, 77, 157–173. [Google Scholar] [CrossRef]
- Vicente, S.; Carreira, J.; Agapito, L.; Batista, J. Reconstructing pascal voc. In Proceedings of the IEEE Conference on Computer Vision and Pattern Recognition, Columbus, OH, USA, 23–28 June 2014; pp. 41–48. [Google Scholar]


Disclaimer/Publisher’s Note: The statements, opinions and data contained in all publications are solely those of the individual author(s) and contributor(s) and not of MDPI and/or the editor(s). MDPI and/or the editor(s) disclaim responsibility for any injury to people or property resulting from any ideas, methods, instructions or products referred to in the content. |
© 2024 by the authors. Licensee MDPI, Basel, Switzerland. This article is an open access article distributed under the terms and conditions of the Creative Commons Attribution (CC BY) license (https://creativecommons.org/licenses/by/4.0/).