Article

Exploring Spatial Non-Stationarity and Scale Effects of Natural and Anthropogenic Factors on Net Primary Productivity of Vegetation in the Yellow River Basin

1
The School of Geoscience and Technology, Zhengzhou University, Zhengzhou 450052, China
2
Joint Laboratory of Eco-Meteorology, Chinese Academy of Meteorological Sciences, Zhengzhou University, Zhengzhou 450052, China
3
Songshan Laboratory, Zhengzhou 450046, China
4
National Engineering Research Center of Geographic Information System, School of Geography and Information Engineering, China University of Geosciences, Wuhan 430074, China
*
Author to whom correspondence should be addressed.
Remote Sens. 2024, 16(17), 3156; https://doi.org/10.3390/rs16173156
Submission received: 15 July 2024 / Revised: 24 August 2024 / Accepted: 25 August 2024 / Published: 27 August 2024
(This article belongs to the Special Issue GeoAI and EO Big Data Driven Advances in Earth Environmental Science)

Abstract

:
Investigating the spatiotemporal dynamics of vegetation net primary productivity (NPP) and its influencing factors are crucial for green and low-carbon development and facilitate human well-being in the Yellow River Basin (YRB). Although the research on NPP has advanced rapidly, in view of the regional particularity of the YRB, the persistence of its NPP change trend needs to be further discussed and more comprehensive impact factors need to be included in the analysis. Meanwhile, the spatial non-stationarity and scale effects of the impact on NPP when multiple factors are involved remain uncertain. Here, we selected a total of twelve natural and anthropogenic factors and used multi-scale geographically weighted regression (MGWR) to disentangle the spatial non-stationary relationship between vegetation NPP and related factors and identify the impact scale difference in the YRB. Additionally, we analyze the spatiotemporal variation trend and persistence of NPP during 2000–2020. The results revealed the following: (1) The annual NPP showed a fluctuating increasing trend, and the vegetation NPP in most regions will exhibit a future trend of increasing to decreasing. (2) The effects of different factors show significant spatial non-stationarity. Among them, the intensity of the impact of most natural factors shows a clear strip-shaped distribution in the east-west direction. It is closely related to the spatial distribution characteristics of natural factors in the YRB. In contrast, the regularity of anthropogenic influences is less obvious. (3) The impact scales of different factors on vegetation NPP were significantly different, and this scale changed with time. The factors with small impact scales could better explain the change in vegetation NPP. Interestingly, the impact size and scale of relative humidity on NPP in the YRB are both larger. This may be due to the arid and semi-arid characteristics of the YRB. Our findings could provide policy makers with specific and quantitative insights for protecting the ecological environment in the YRB.

1. Introduction

Net primary productivity (NPP) is the essential indicator to measure ecosystem health and productivity. It is the total amount of organic matter produced by plants through photosynthesis minus the rest of autotrophic respiration in unit time and unit area, representing the net accumulation of organic matter by green plants [1]. Due to regional differences, NPP tends to exhibit a complex spatial variation when disturbed by a variety of factors, such as terrain differences, climatic changes, and anthropogenic interference [2,3,4]. The spatial variations are particularly prominent in the Yellow River Basin (YRB). The YRB traverses “the three major stairs” in the macroscopic topography of China, which makes the terrain, climate and water resources in the basin show obvious changes [5,6]. Therefore, monitoring the change trend and persistence of vegetation NPP in the YRB and exploring the pattern of spatial interconnection between natural and anthropogenic factors and NPP are crucial for ecological environment protection in the YRB.
The comprehension of long-term NPP trends is beneficial in elucidating the intricacies of vegetation changes and in enhancing the capacity to forecast ecosystem changes [7]. Currently, many scholars have conducted research on the overall spatiotemporal variations in vegetation NPP in various regions and made comparative analyses [8,9,10,11,12]. Among them, the NPP in the majority of Chinese regions displayed a rising trend from 1982 to 2019 [13,14]. And the vegetation NPP in the YRB also showed a predominantly increasing trend [15]. Nevertheless, it must be noted that the ecologically fragile areas of the YRB are widely dispersed, and are highly susceptible to changes in the external environment [16]. A recent study has demonstrated that the region is experiencing significant ecosystem degradation and desertification and is at risk of being converted from improvement to degradation [17]. Therefore, the persistence of the increasing NPP of localized regions requires further assessment.
Increasing evidence has revealed that the influence of natural factors on vegetation NPP varies depending on the spatial scale and geographic location [18,19,20]. For instance, the vegetation NPP of different terrain units varied significantly [21]. Precipitation dominates vegetation changes in arid and semi-arid regions of China. By contrast, temperature is important for high mountain vegetation [22]. Additionally, the influence of anthropogenic factors on NPP also exhibits spatial differences [23,24]. Anthropogenic factors have been reported to have a positive influence on NPP in the northwestern portion of the Zoige Plateau and negatively affect the rest of the area [25]. These investigations suggest that the spatial processes of the impact of natural and anthropogenic factors on NPP exhibit heterogeneity (spatial non-stationarity) [26]. Nevertheless, there are numerous natural and anthropogenic factors that affect NPP [27,28]. The above research analyzed the response of NPP changes to meteorological factors. However, due to the regional specificity and arid climate conditions of the YRB, relative humidity and evapotranspiration have a significant impact on the physiological processes of vegetation. In addition, the production of NPP depends on the process of photosynthesis, which is closely related to sunshine, C and N [29]. On the other hand, when studying the impact of human activities on NPP, multivariate residual trend analysis (RESTREND) is often used, and the human impact obtained depends on the climate factors inputted in the model [30]. However, this method is based on the assumption that there is a close relationship between climate factors and vegetation productivity. When the climate factors are not fully considered or there is a nonlinear relationship, the result may lead to overestimation. Mu et al. proposed a human footprint dataset that can better reflect the comprehensive impact of human activities on ecological environment changes [31]. In addition, recent studies have shown that changes in greenhouse gases also affect vegetation composition and productivity [17,32,33]. The main source of greenhouse gas formation is due to the anthropogenic impact of industrial development [17]. Therefore, in view of the complex terrain, special climatic conditions, frequent human activities and the relationship between anthropogenic greenhouse gases and NPP in the YRB, it is imperative to elucidate and disentangle the spatial non-stationary characteristics of more comprehensive factors’ impact on NPP.
When studying the driving mechanisms of different factors on NPP, it is difficult to characterize the impact scale differences in different factors on NPP from the same scale analysis [15,34]. The multi-scale geographically weighted regression (MGWR) can be used to identify the differences in impact scales of each factor and detect relationships at different spatial scales [35,36]. It provides new insights for studying the spatial non-stationarity of ecological environment changes and is widely applied in various disciplines [37]. However, the differences in the impact scale from the various factors and the size of effect are interconnected and differ in particular regions [37]. Therefore, there is an urgent need to clarify the scale effects of various factors on NPP in YRB.
In this study, our primary objective was to untangle the spatial non-stationarity and scale effects of natural and anthropogenic factors affecting the vegetation NPP in the YRB. To achieve this, we included a total of 12 influencing factors and employed an MGWR model. The specific aims of our investigation were threefold: (i) to explore the spatiotemporal patterns and future trends of NPP over the period 2000 to 2020, (ii) to scrutinize the spatial non-stationarity of effect on NPP by 12 natural and human factors closely related to the YRB, and (iii) to identify the scale differences and scale effects of different factors, and propose reasonable policy recommendations. This study will aid in understanding the complex evolution of vegetation NPP and provide valuable guidance for the management and conservation of the YRB ecology.

2. Materials and Methods

2.1. Study Area

The Yellow River Basin refers to the geo-ecological area affected by the Yellow River system from its source to the sea. It flows through nine provinces and regions: Qinghai, Sichuan, Gansu, Ningxia, Inner Mongolia, Shaanxi, Shanxi, Henan and Shandong (Figure 1). The YRB is located between 32°N–42°N and 95°E–119°E. The elevation of the region varies from a low of −8 m to a high of 6237 m, with the western region displaying higher elevations and the eastern region exhibiting lower values. The climate in the region undergoes significant changes throughout the four seasons and large temperature differences in spring and fall. Annual precipitation is unevenly distributed. The northwest region exhibits a lower precipitation in comparison to the southeast region. The average annual temperature spans about 3.6–14.3 °C, with significant annual and daily temperature differences. The YRB serves as China’s critical eco-safety barrier, as well as an essential area for the advancement of the economy.

2.2. Data Sources

The data are divided into two categories, NPP data and influencing factors data.
(1)
The MOD17A3HGF v006 NPP data from Google Earth Engine (https://code.earthengine.google.com/, accessed on 26 August 2024).
The MOD17A3HGF NPP product is affected by cloud coverage and atmospheric conditions. We obtained the product from the GEE platform and it has undergone cloud masking and atmospheric correction preprocessing to eliminate the impact of cloud coverage, atmospheric scattering and absorption on the data. Although the spatial resolution of the MOD17A3HGF NPP products is low, the data were validated using eddy covariance flux towers data, and the large area of the YRB makes it adequate for studying the spatial variation in NPP in the region.
(2)
Influencing factor data includes 8 natural and 4 anthropogenic factors (Table 1).
The human footprint is the pressure on the ecological environment caused by the changes in ecological processes and natural landscapes, which is attracting worldwide attention to biodiversity and ecological protection. The human footprint dataset used eight variables that reflect different aspects of human pressure, including building environment, population density, night light, farmland, pasture, highway, railway and navigable waterway and follows the method of Sanderson and Venter et al. [38,39] to develop the annual dynamic data of global terrestrial human footprint from 2000 to 2020. Using Venter’s visual interpretation samples (a total of 3460) to evaluate the mapping accuracy, the results showed that the human footprint map R2 = 0.62 was higher than the previous human footprint map (R2 = 0.50). At the same time, it is consistent with the data developed by Venter, Kennedy and Williams, and the correlation is 0.72, 0.66 and 0.93, respectively [31]. It was used to reflect the ecological impacts caused by human activities. It can capture a wide range of pressures from human activities, addressing the limitations of considering a single factor in representing anthropogenic influence and the redundancy caused by the similarities that exist between factors (nighttime lights and GDP).
Monthly climate data were synthesized on an annual basis using Matlab R2018b and the source data were converted from nc format to raster. Except for the NPP data from 2000 to 2020, the other data were from 2000, 2005, 2010, 2015 and 2020. All the data were transformed into an Albers equal-area conic-WGS 84 projected coordinate system and used bilinear interpolation to resample the above data to 500 m spatial resolution by ArcGIS 10.8 and extracted to the same extent by mask according to the boundary of the YRB.

2.3. Methods

2.3.1. Theil–Sen Median Analysis and Mann–Kendall Test

Theil–Sen Median is an effective nonparametric method of estimating trends that is often employed in the analysis of lengthy time-series datasets [40,41]. The formula is:
  S N P P = m e a n x j x i j i , j > i
where x i and x j are the NPP mean values in year i and year j . The sign of S N P P indicates the direction of the NPP time series. S N P P > 0 and S N P P < 0 denote upward and downward trends, respectively, and S N P P = 0 indicates that there is no change.
The MK test is a non-parametric statistical test, where measurements need not be normally distributed or linearly trended [42,43]. For the time series x 1 , x 2 , …, x n , its calculation formula is:
S = i = 1 n 1 j = i + 1 n s i g n x j x i
s i g n θ = 1                   θ > 0 0                   θ = 0 1             θ < 0
Z = S V a r S                         S > 0 0                                                       S = 0 S + 1 V a r S                         S < 0
V a r S = n n 1 2 n + 5 18
where x j and x i are time series data, n is the number of data and V a r S is the variance.

2.3.2. Hurst Index

The Hurst index can be used to describe the persistence of trends in vegetation NPP evolution [44]. The formula is:
H = log ( R / S ) log n
in which H is the Hurst index, R is the range of the subsequence, S is the standard deviation of the subsequence and n is the length of the subsequence. The results are between 0 and 1, categorized as 0.5~1, 0.5 and 0~0.5, representing continuous, random and anti-continuous time series, respectively.

2.3.3. Multi-Scale Geographically Weighted Regression

The MGWR model can effectively account for spatial non-stationarity and can consider multiple bandwidths simultaneously to identify the scale effects of the impacts of different variables [35,45]. The formula is:
y i = j = 1 k β b w j u i , v i x i j + ε i
where: y i , x i j , ε i represent the dependent variable, the independent variable and the random error, respectively, at point i in space; u i , v i is the spatial location of point i ; j represents the number of independent variables; and β j is the regression coefficient at point i and β 0 is the intercept; b w j denotes the bandwidth of the jth variable and the bandwidths possess specificity [46].
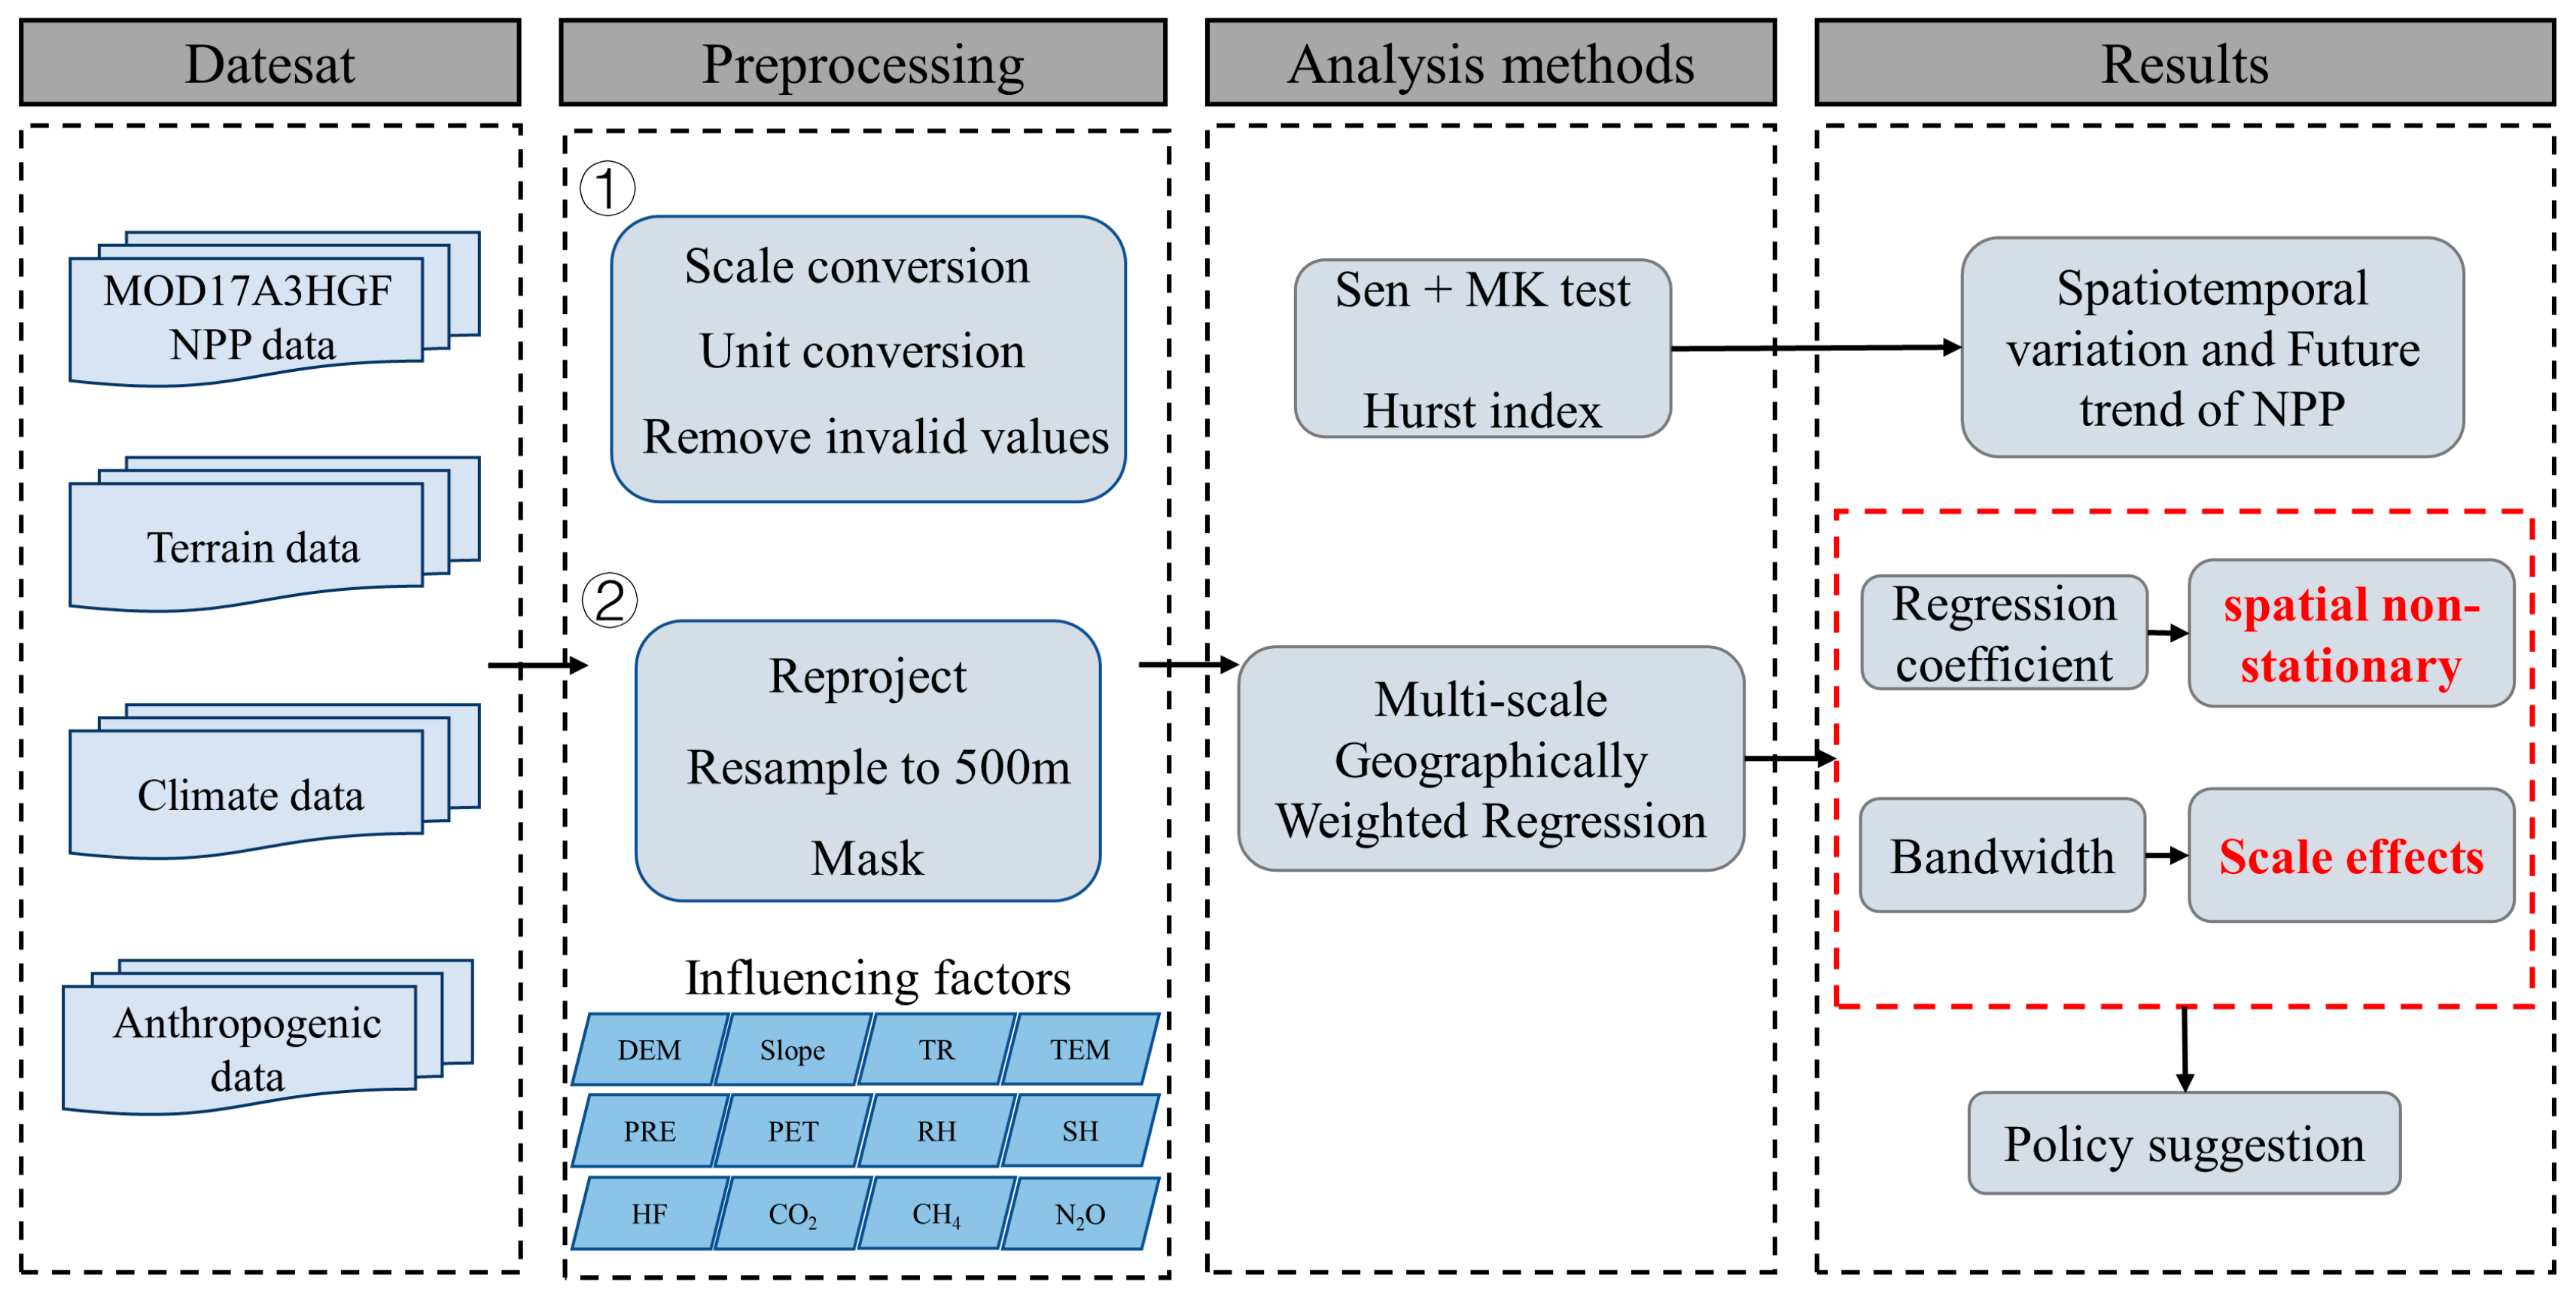
The study flowchart is shown in Figure 2.

3. Results

3.1. Spatiotemporal Variation in Vegetation NPP

The interannual variation in vegetation NPP in the YRB from 2000 to 2020 is shown in Figure 3a. The annual average vegetation NPP generally displayed a fluctuating increasing trend with a change rate of 5.34 gC m−2 a−1. The maximum average NPP value appeared in 2018 at 334.61 gC m−2 a−1, and the minimum value appeared in 2001 at 199.15 gC m−2 a−1, with a fluctuation range of 135.46 gC m−2 a−1. In addition, the area proportion changes in high and low NPP levels are shown in Figure 3b. It showed that the area of NPP < 100 gC m−2 a−1, i.e., the area of the low-value, exhibited a fluctuating decreasing trend, with the southeastern region exhibiting more prominent changes. The area of NPP > 400 gC m−2 a−1, i.e., the area of the high-value, exhibited a fluctuating increasing trend, particularly in the northwest (Figure 3c–g).
The vegetation NPP in the YRB presents a spatial pattern of high in the south and low in the north (Figure 3h). The high NPP value area was mainly located in south-central Shaanxi, southwestern Gansu and small parts of Shanxi and Henan. The low NPP value area was mainly concentrated in western Qinghai and northwestern Inner Mongolia. The pixel-scale vegetation NPP of the YRB exhibited considerable variability from 2000 to 2020, with an overall mean of 273.55 gC m−2a−1, and the maximum and minimum values were 1048.69 and 0 gC m−2a−1, respectively.

3.2. Trend of Change in NPP

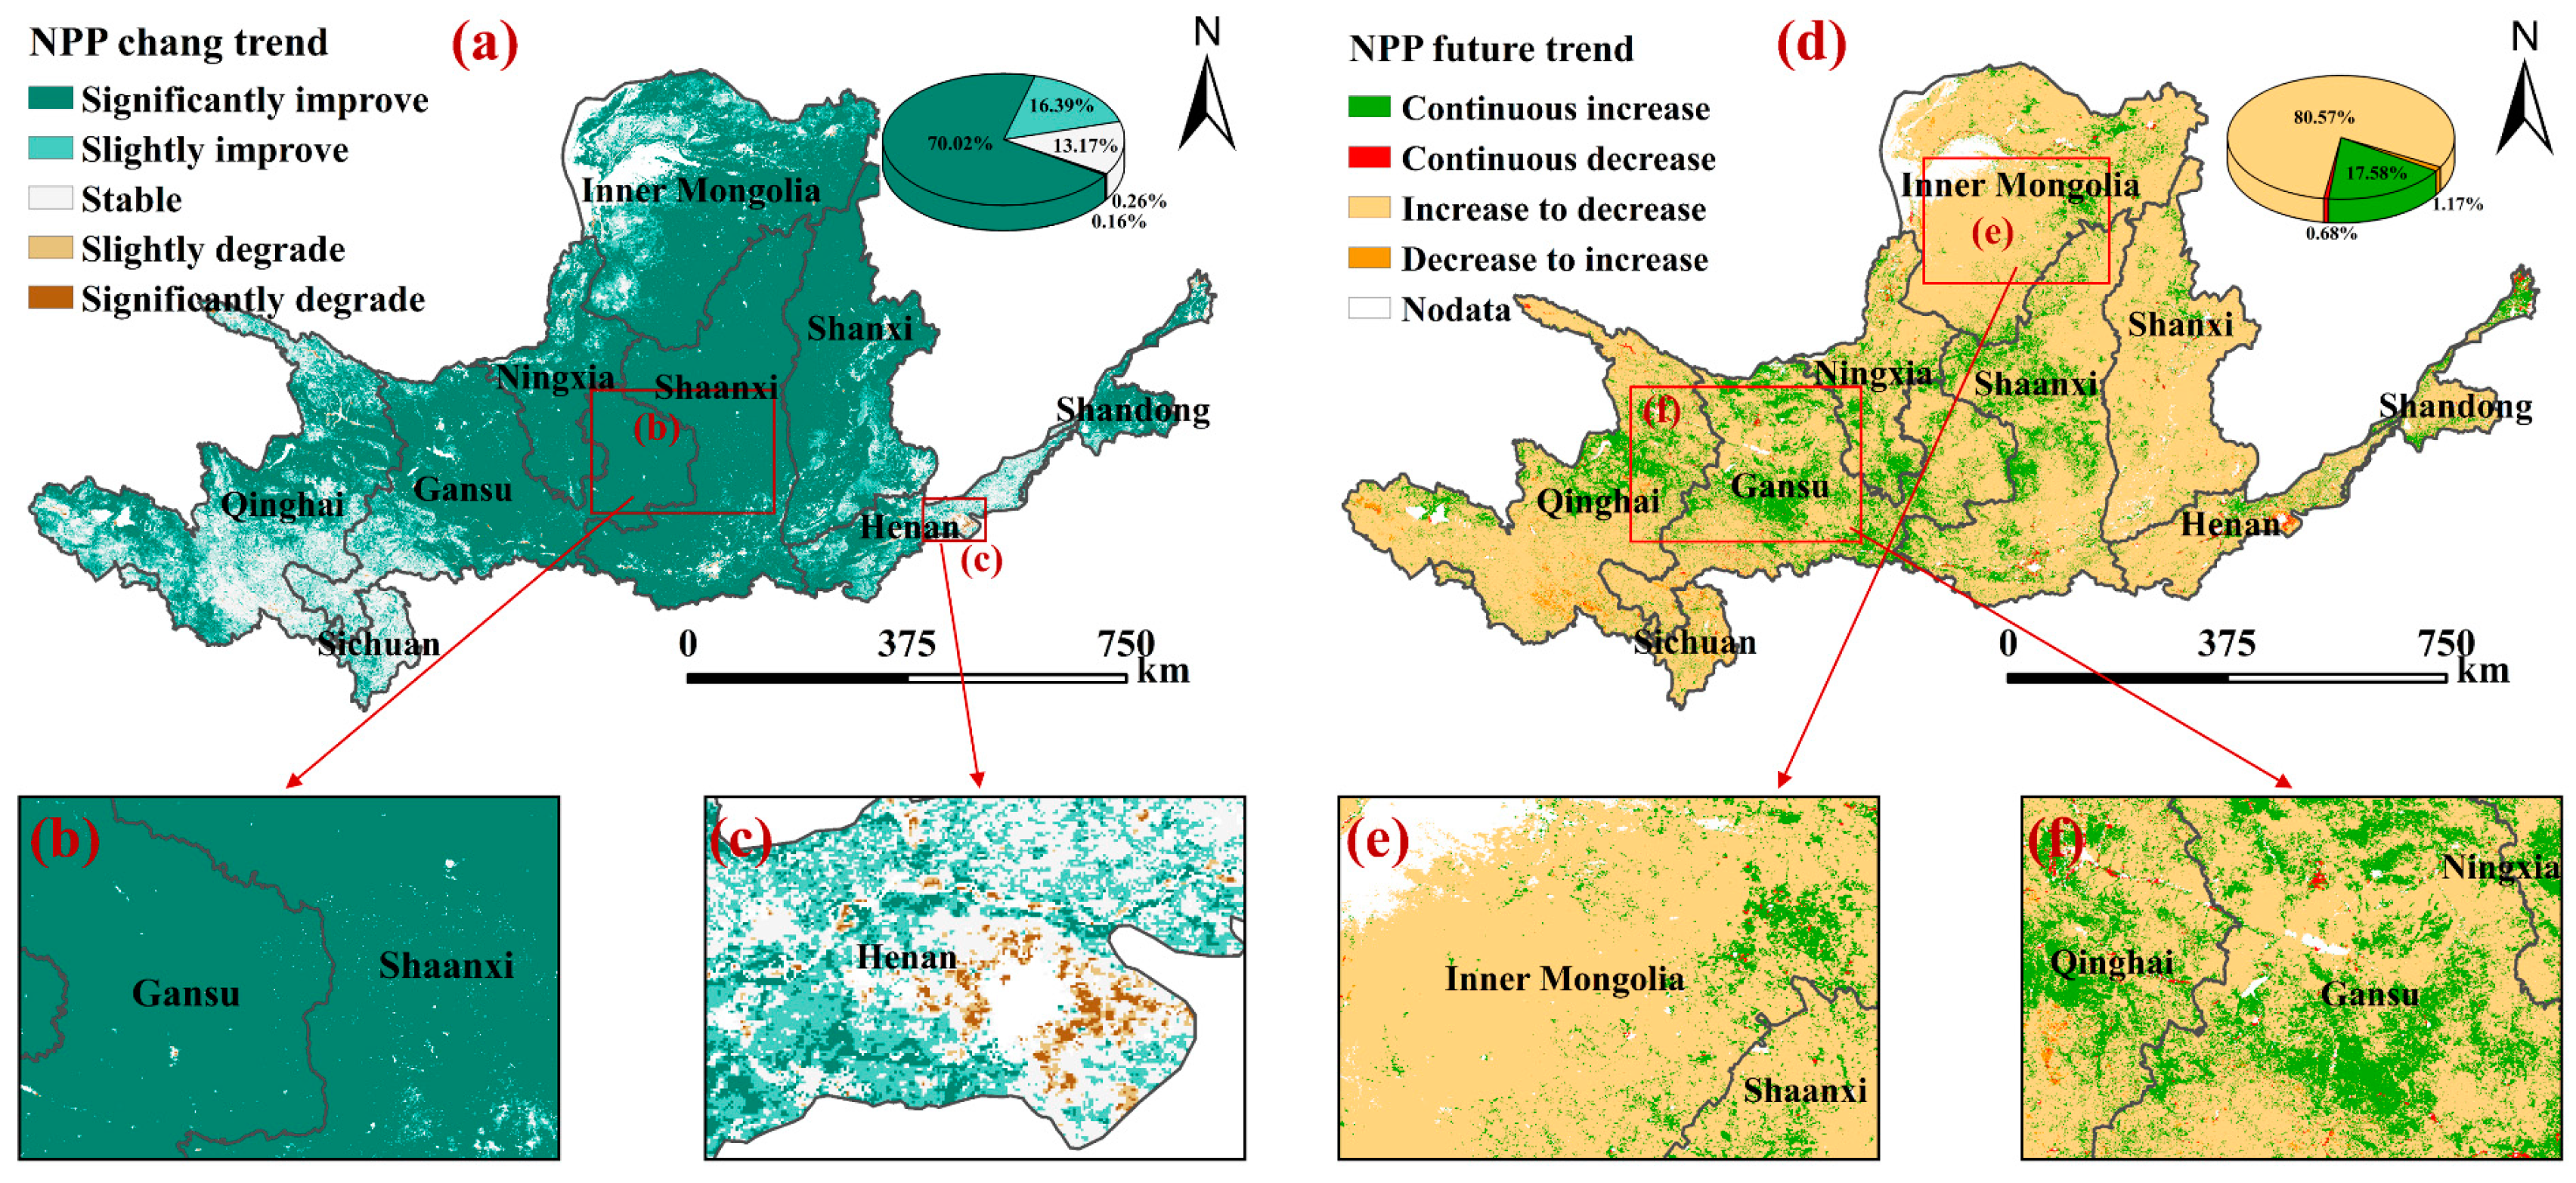
In this paper, we classified the NPP trends into five types (Table 2). The spatial distribution of the trend of change in NPP in the YRB from 2000 to 2020 is shown in Figure 4a. The area in which the NPP of vegetation demonstrated a significant improvement constituted 70.02% of the entire study region and was predominantly located in the central portion of the basin (Figure 4b). The areas exhibiting the significant decrease in NPP were predominantly situated within the urban built-up areas (Figure 4c), representing 0.16%.
We overlay the NPP trend with the computed Hurst index for analysis and classify the future NPP trend into the following four categories (Table 3). The future trend shows that the proportion of NPP in the YRB shows an increasing to decreasing trend, with the largest reaching 80.57%, mainly distributed in Inner Mongolia and other areas, with a wide distribution (Figure 4d,e). The area exhibiting a continuous increase represented 17.58% of the study area, with the majority of this occurring in the upper and middle reaches of the basin, including northern Qinghai, Gansu and Ningxia (Figure 4f). The areas exhibiting a continuous decrease or a change from decrease to increase collectively comprise a mere 1.85% of the basin.

3.3. Regression Coefficients of Influencing Factors

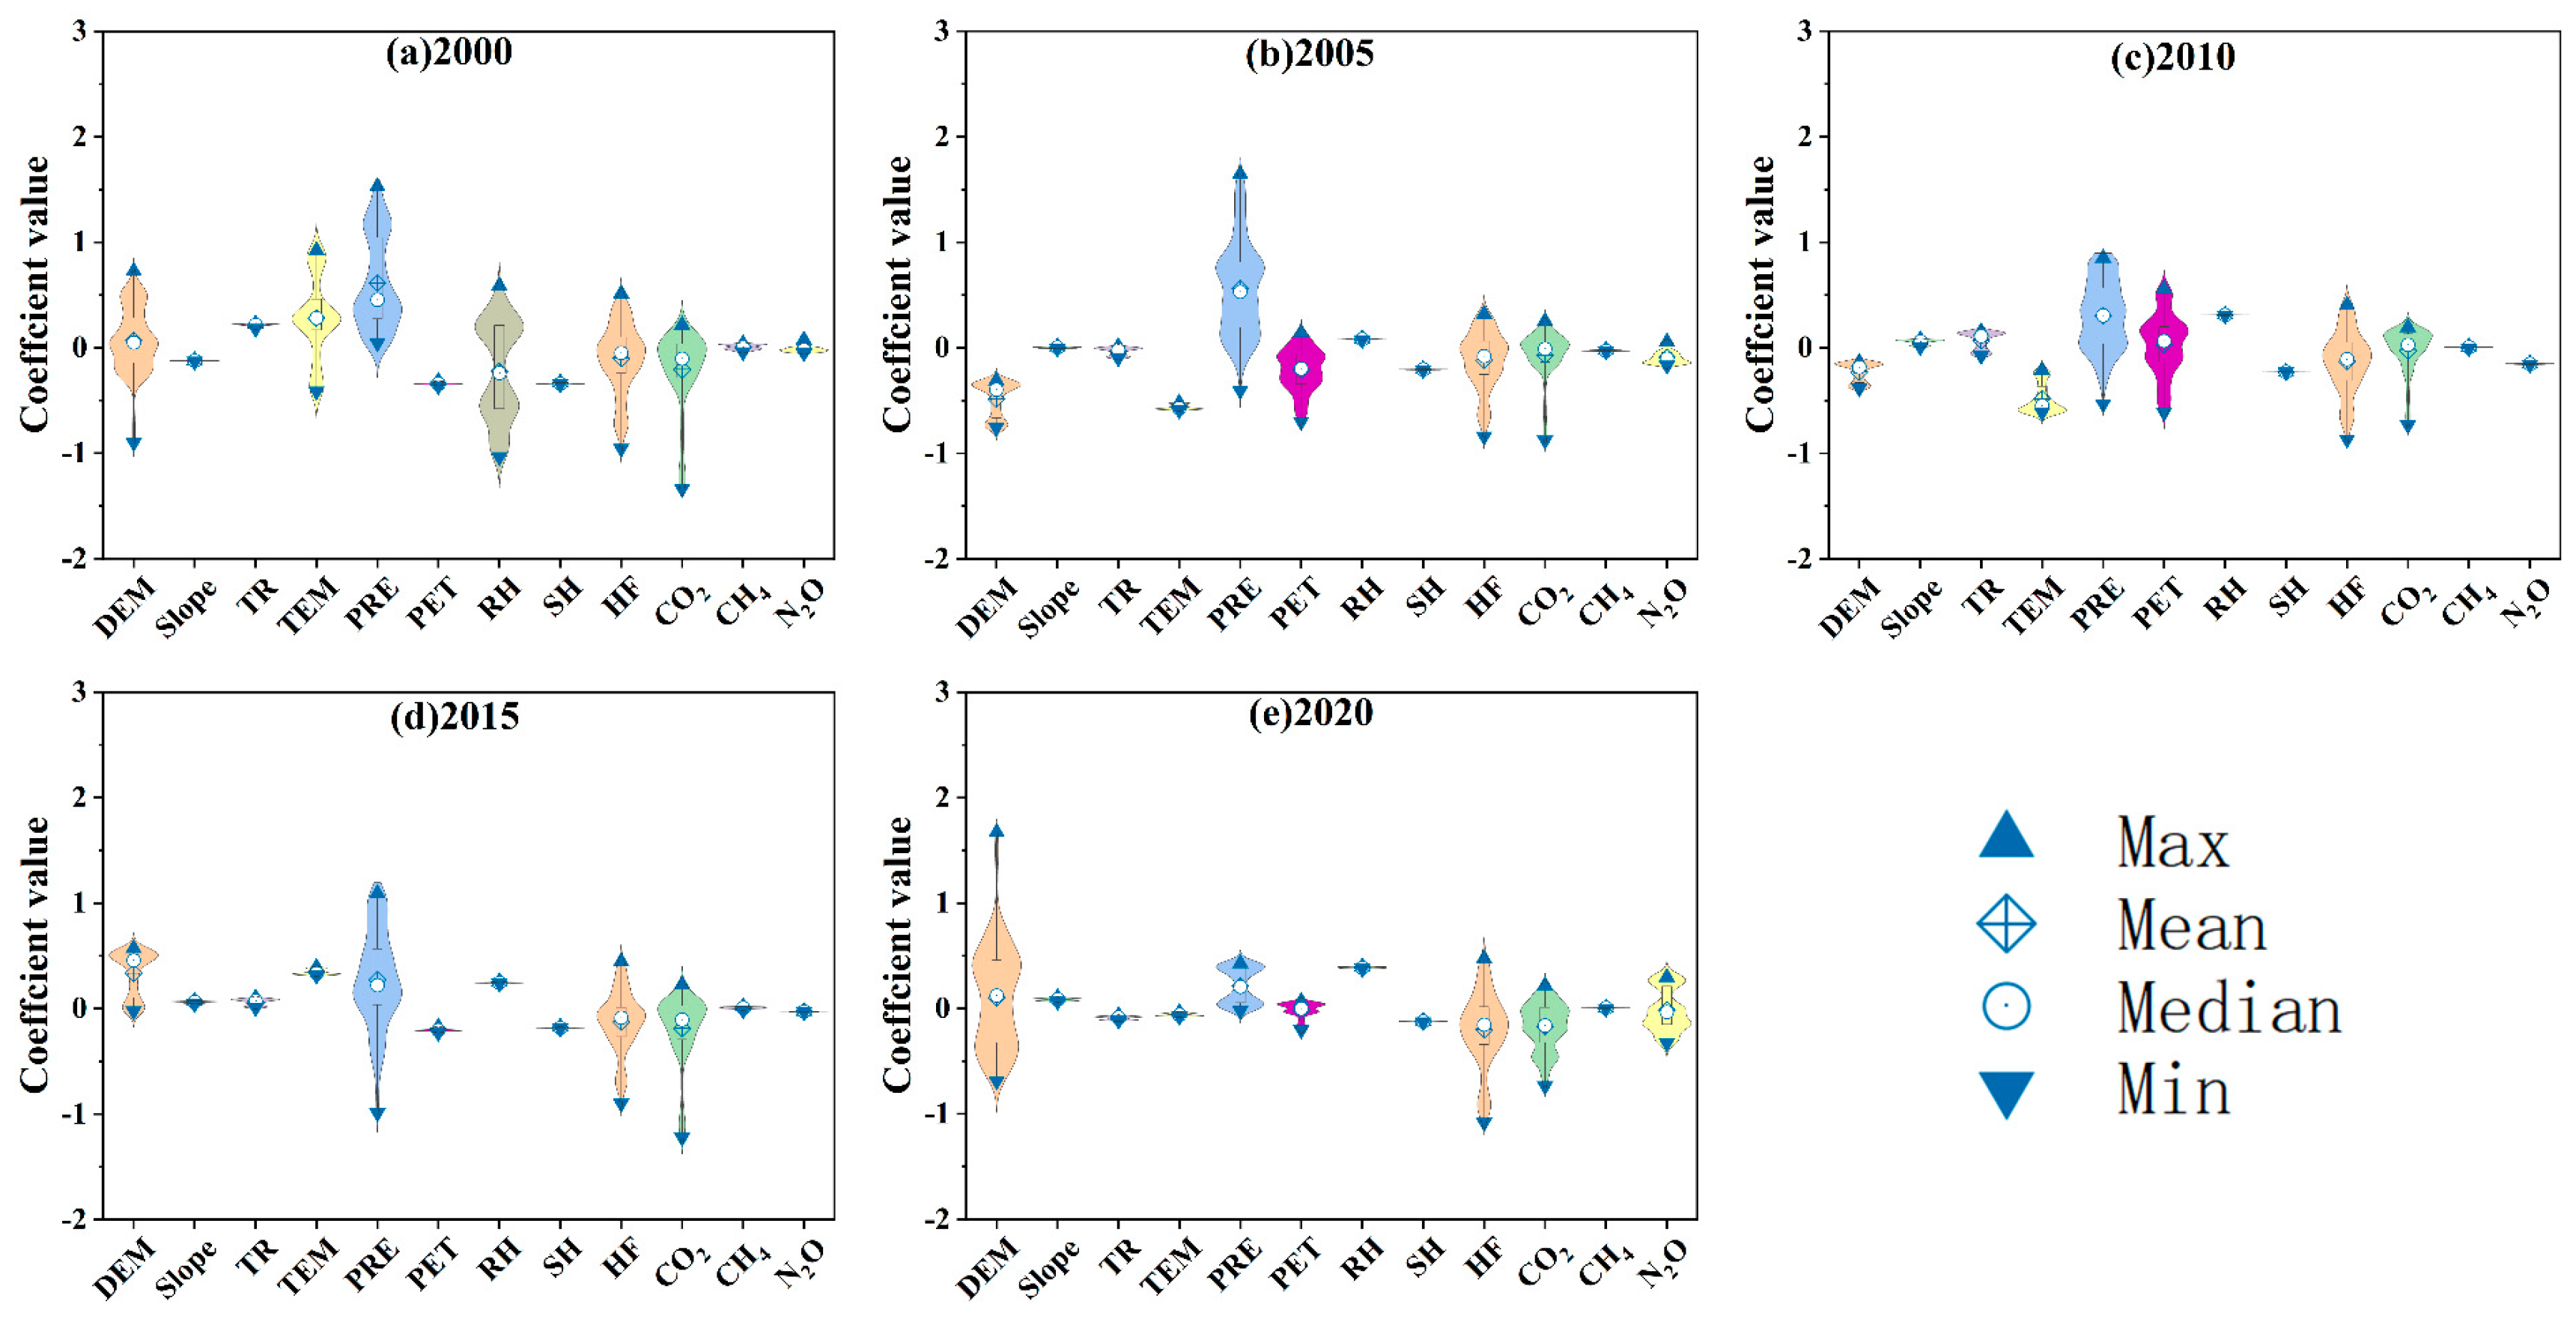
The shape of the violin chart reflects the distribution of regression coefficients, indicating the spatial variation in the coefficients (Figure 5). The spatial variation in the relationship between variables reflected by MGWR regression coefficients is a form of spatial process heterogeneity (spatial non-stationarity). It can be observed that there are significant differences in the spatial non-stationary characteristics of different factors. The coefficients of DEM, PRE, HF and CO2 have a wide distribution range at different times, showing significant non-stationarity. The coefficient distributions of Slope, TR, SH and CH4 are relatively concentrated and have weak non-stationarity. The coefficient distribution of other factors undergoes significant changes over time.
The magnitude of the regression coefficient reflects the extent to which driving factors impact NPP, while the direction of influence is indicated by the sign of the coefficient. From Figure 5, it can be observed that the magnitude and direction of the effect of each factor have changed over time, but the degree of change has varied.

3.4. Spatial Interactions between NPP and Influencing Factors

NPP originates from the natural environment, the spatial pattern of natural factors determines the variation in NPP and is closely related to the spatial non-stationary relationship between natural factors and NPP. Figure 6 shows the spatial distribution of different natural factors in the YRB. It can be found that the terrain factors show east-west differences (Figure 6a–c). TEM shows a distribution of low in the west and high in the east (Figure 6d). But PRE shows a pattern of high in the south and low in the north (Figure 6e). PET is similar to TEM, it changes from east to west (Figure 6f). RH and SH showed the same north-south difference as PRE (Figure 6g,h).
The MGWR was employed to investigate the spatial non-stationarity characteristics of the county-level correlation between NPP and factors, taking the output of the MGWR model in 2020 as a case study to illustrate the geographic differentiation of the spatial interactions between NPP and influencing factors in the YRB.
In terms of natural factors, there is a clear east-west divergence in the degree of influence (except PET, SH) (Figure 7). The negative influence of DEM on NPP in the western part of the YRB (especially the plateau) is contrasted by a positive influence in the eastern part (mainly the plains) (Figure 7a). The Slope exhibits a positive influence on NPP and shows a trend of gradual increase from west to east in the YRB (Figure 7b). The direction and change trend of the influence of TR is opposite to that of the Slope (Figure 7c). The influence of TEM on NPP showed a negative effect that gradually increased from west to east (Figure 7d). PRE promoted almost all areas, only inhibiting some counties in Changzhi, Linfen, Jincheng, Jiyuan and Jiaozuo (Figure 7e). The effect of PET on vegetation NPP was found to be small and positive in the downstream region of the basin, while in other areas of the YRB, the effect was negative (Figure 7f). The RH exerted a single positive influence on the NPP in the YRB, with a weak tendency to gradually increase from west to east (Figure 7g). Different from RH, the effects of SH on NPP were all negative and had a weak tendency to increase gradually from south to north (Figure 7h).
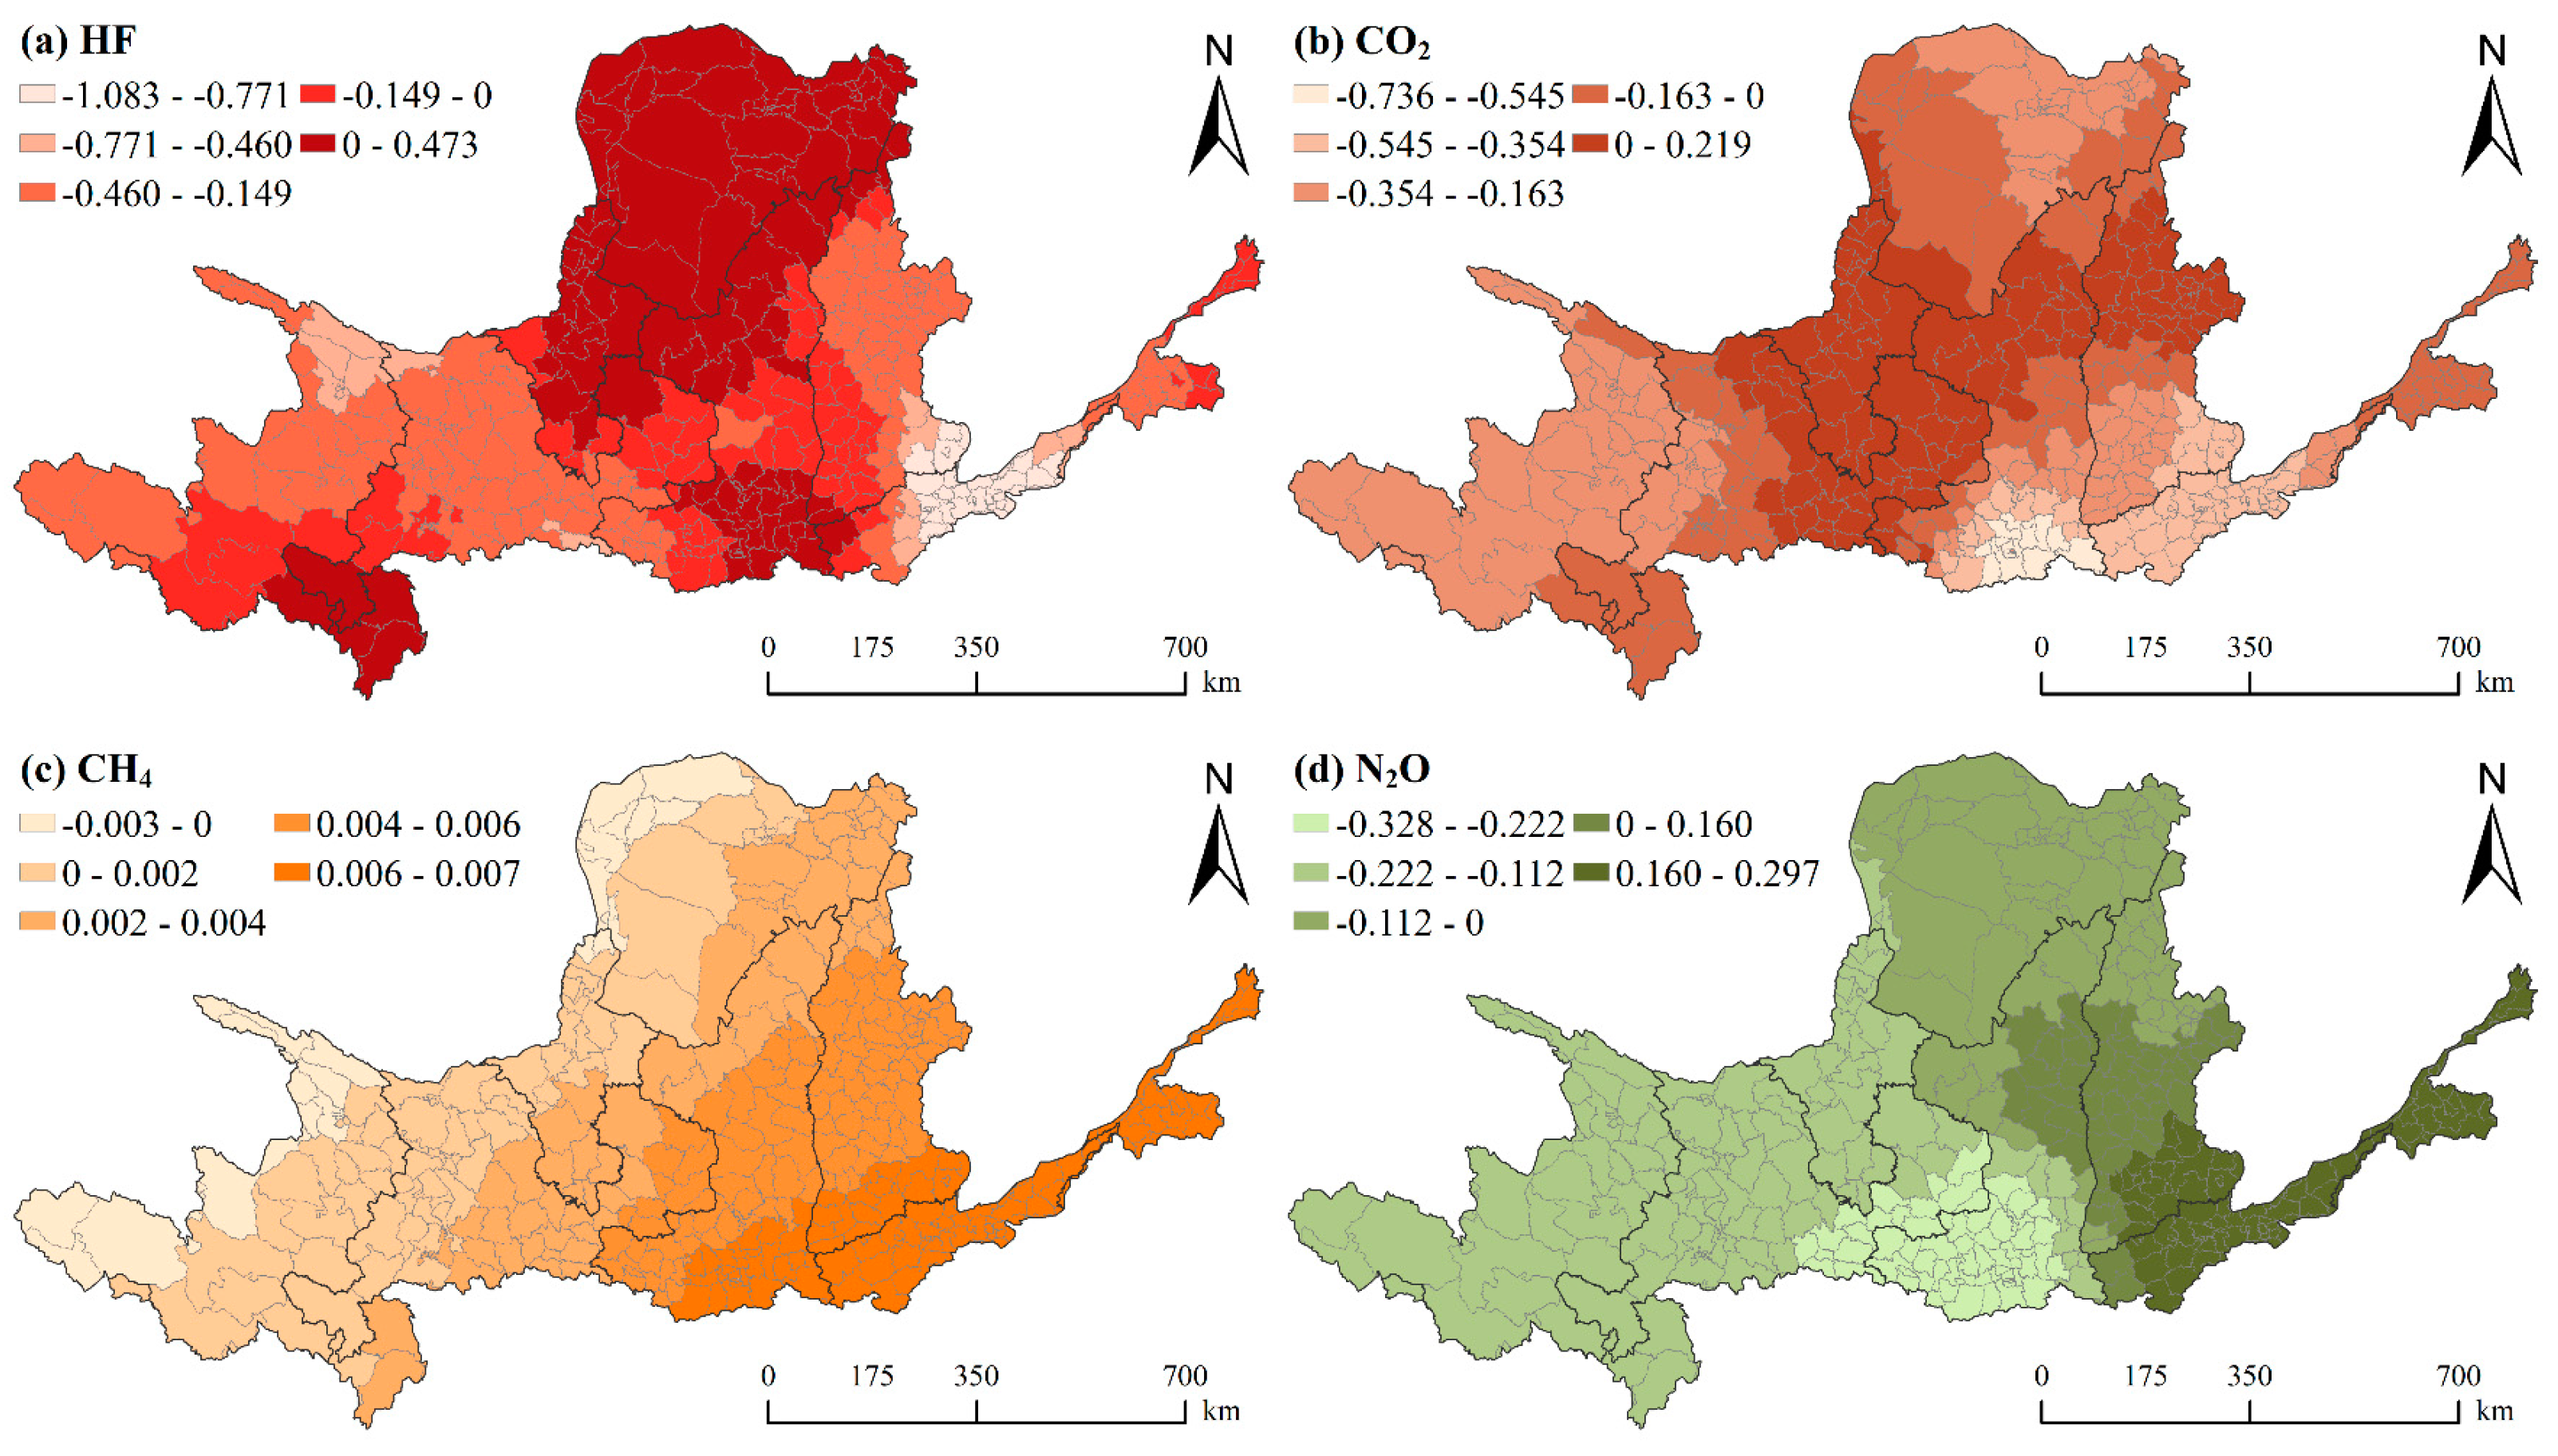
In terms of anthropogenic factors, the influence of HF changed from positive to negative in a north-to-south gradient, such that more frequent human activities had a greater inhibitory effect on NPP (Figure 8a). CO2 has a positive effect in the middle (Figure 8b), while the negative impact on the remainder of the counties exhibited an increasing trend from the central region to the surrounding area. CH4 had a positive effect on most of the basin, demonstrating an increasing trend from west to east (Figure 8c), with a relatively small degree of influence (≤0.007). The spatial correlation between N2O and NPP exhibited a positive correlation, predominantly in the downstream region of the basin (Figure 8d).
Overall, the influence of natural factors on NPP in YRB exhibits a more pronounced geographical pattern of east-west changes than anthropogenic factors.

3.5. Scale Differences in Influencing Factors

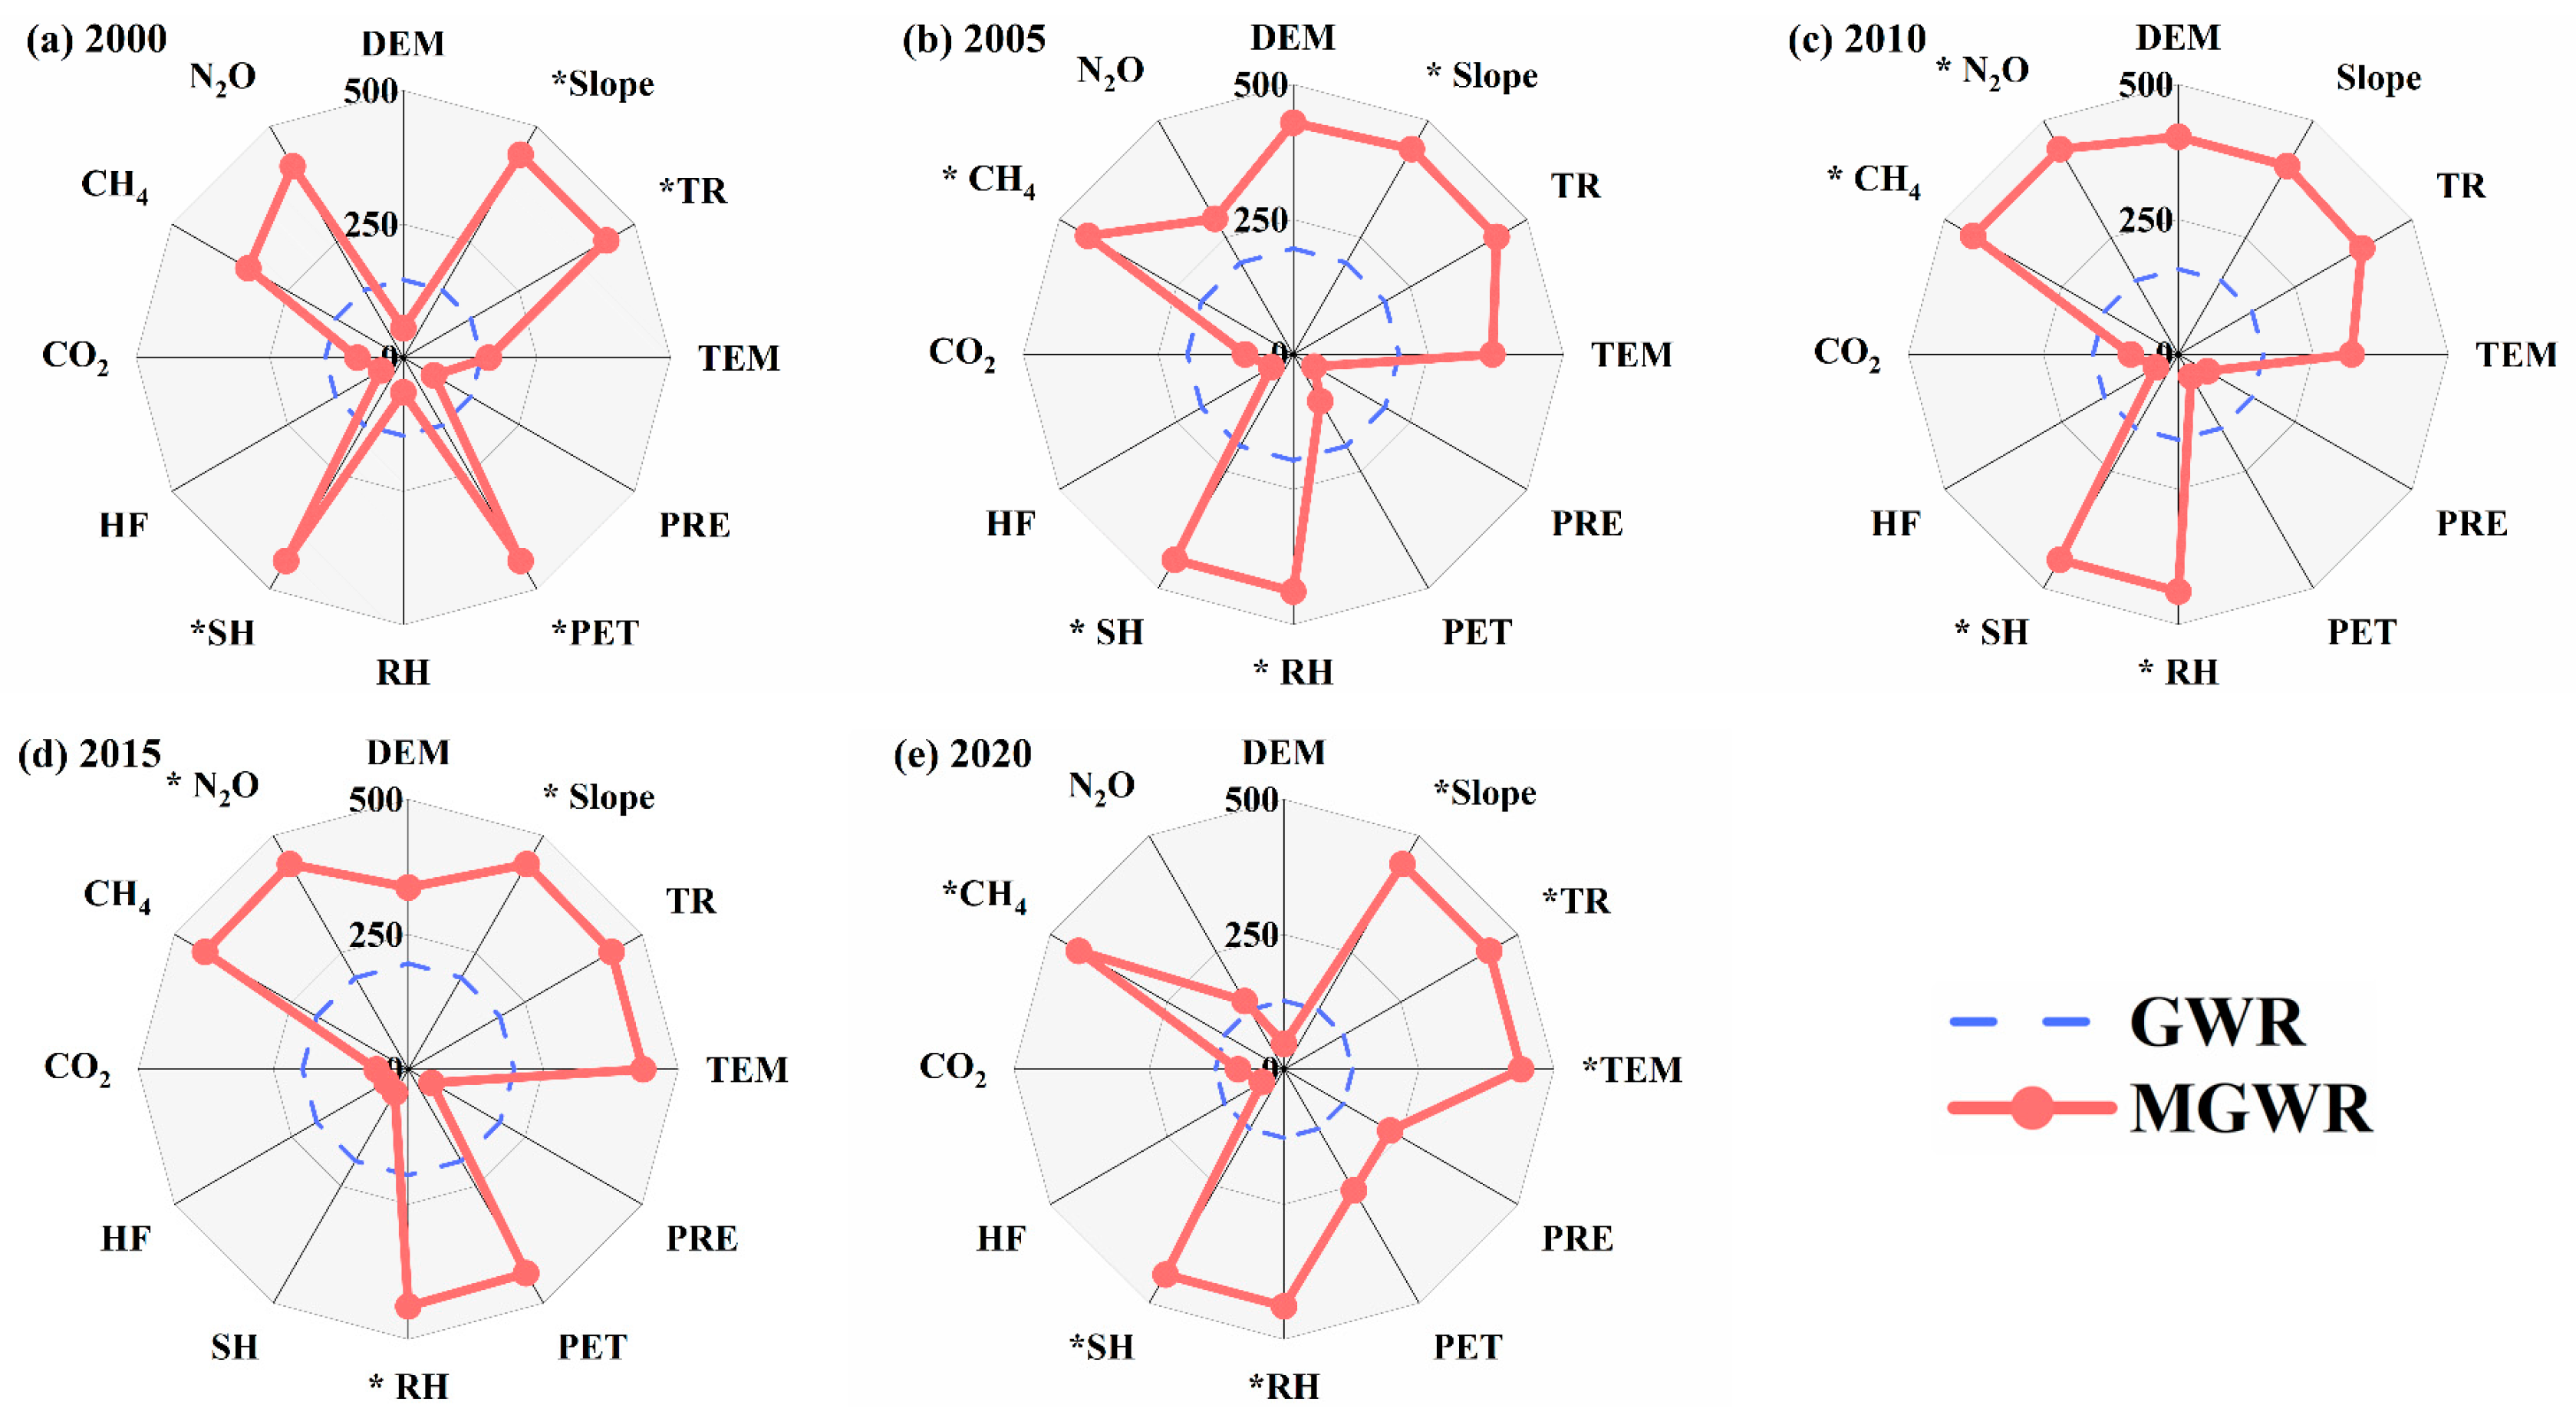
To more accurately represent the varying impact scales of the influencing factors, we analyzed the bandwidths of the MGWR model outputs for each year in conjunction with the bandwidths of the GWR model (Figure 9). The differing bandwidths suggest that these factors have varying impact scales on vegetation NPP. The bandwidth of the classical GWR in 2000 was 146 (Figure 9a). MGWR’s results indicate that the impact scale of various influencing factors on the NPP varies considerably. Slope, TR, PET and SH have the same scale of influence, corresponding to the maximum bandwidth (439). Close to the global scale are CH4 and N2O, with response scales of 335 and 414. The remaining variables have a local scale of influence on the NPP, which corresponds to a bandwidth of <160 (Figure 9a). In the results for every five years from 2000 to 2020, it can be found that the impact scale of the various influencing factors has changed to varying degrees (Figure 9). For instance, the impact scale of HF exhibits minimal fluctuation, ranging from 47 to 48. In contrast, the impact scale of RH underwent a significant shift, moving from a local scale (65) to a global scale (439) between 2000 and 2005.
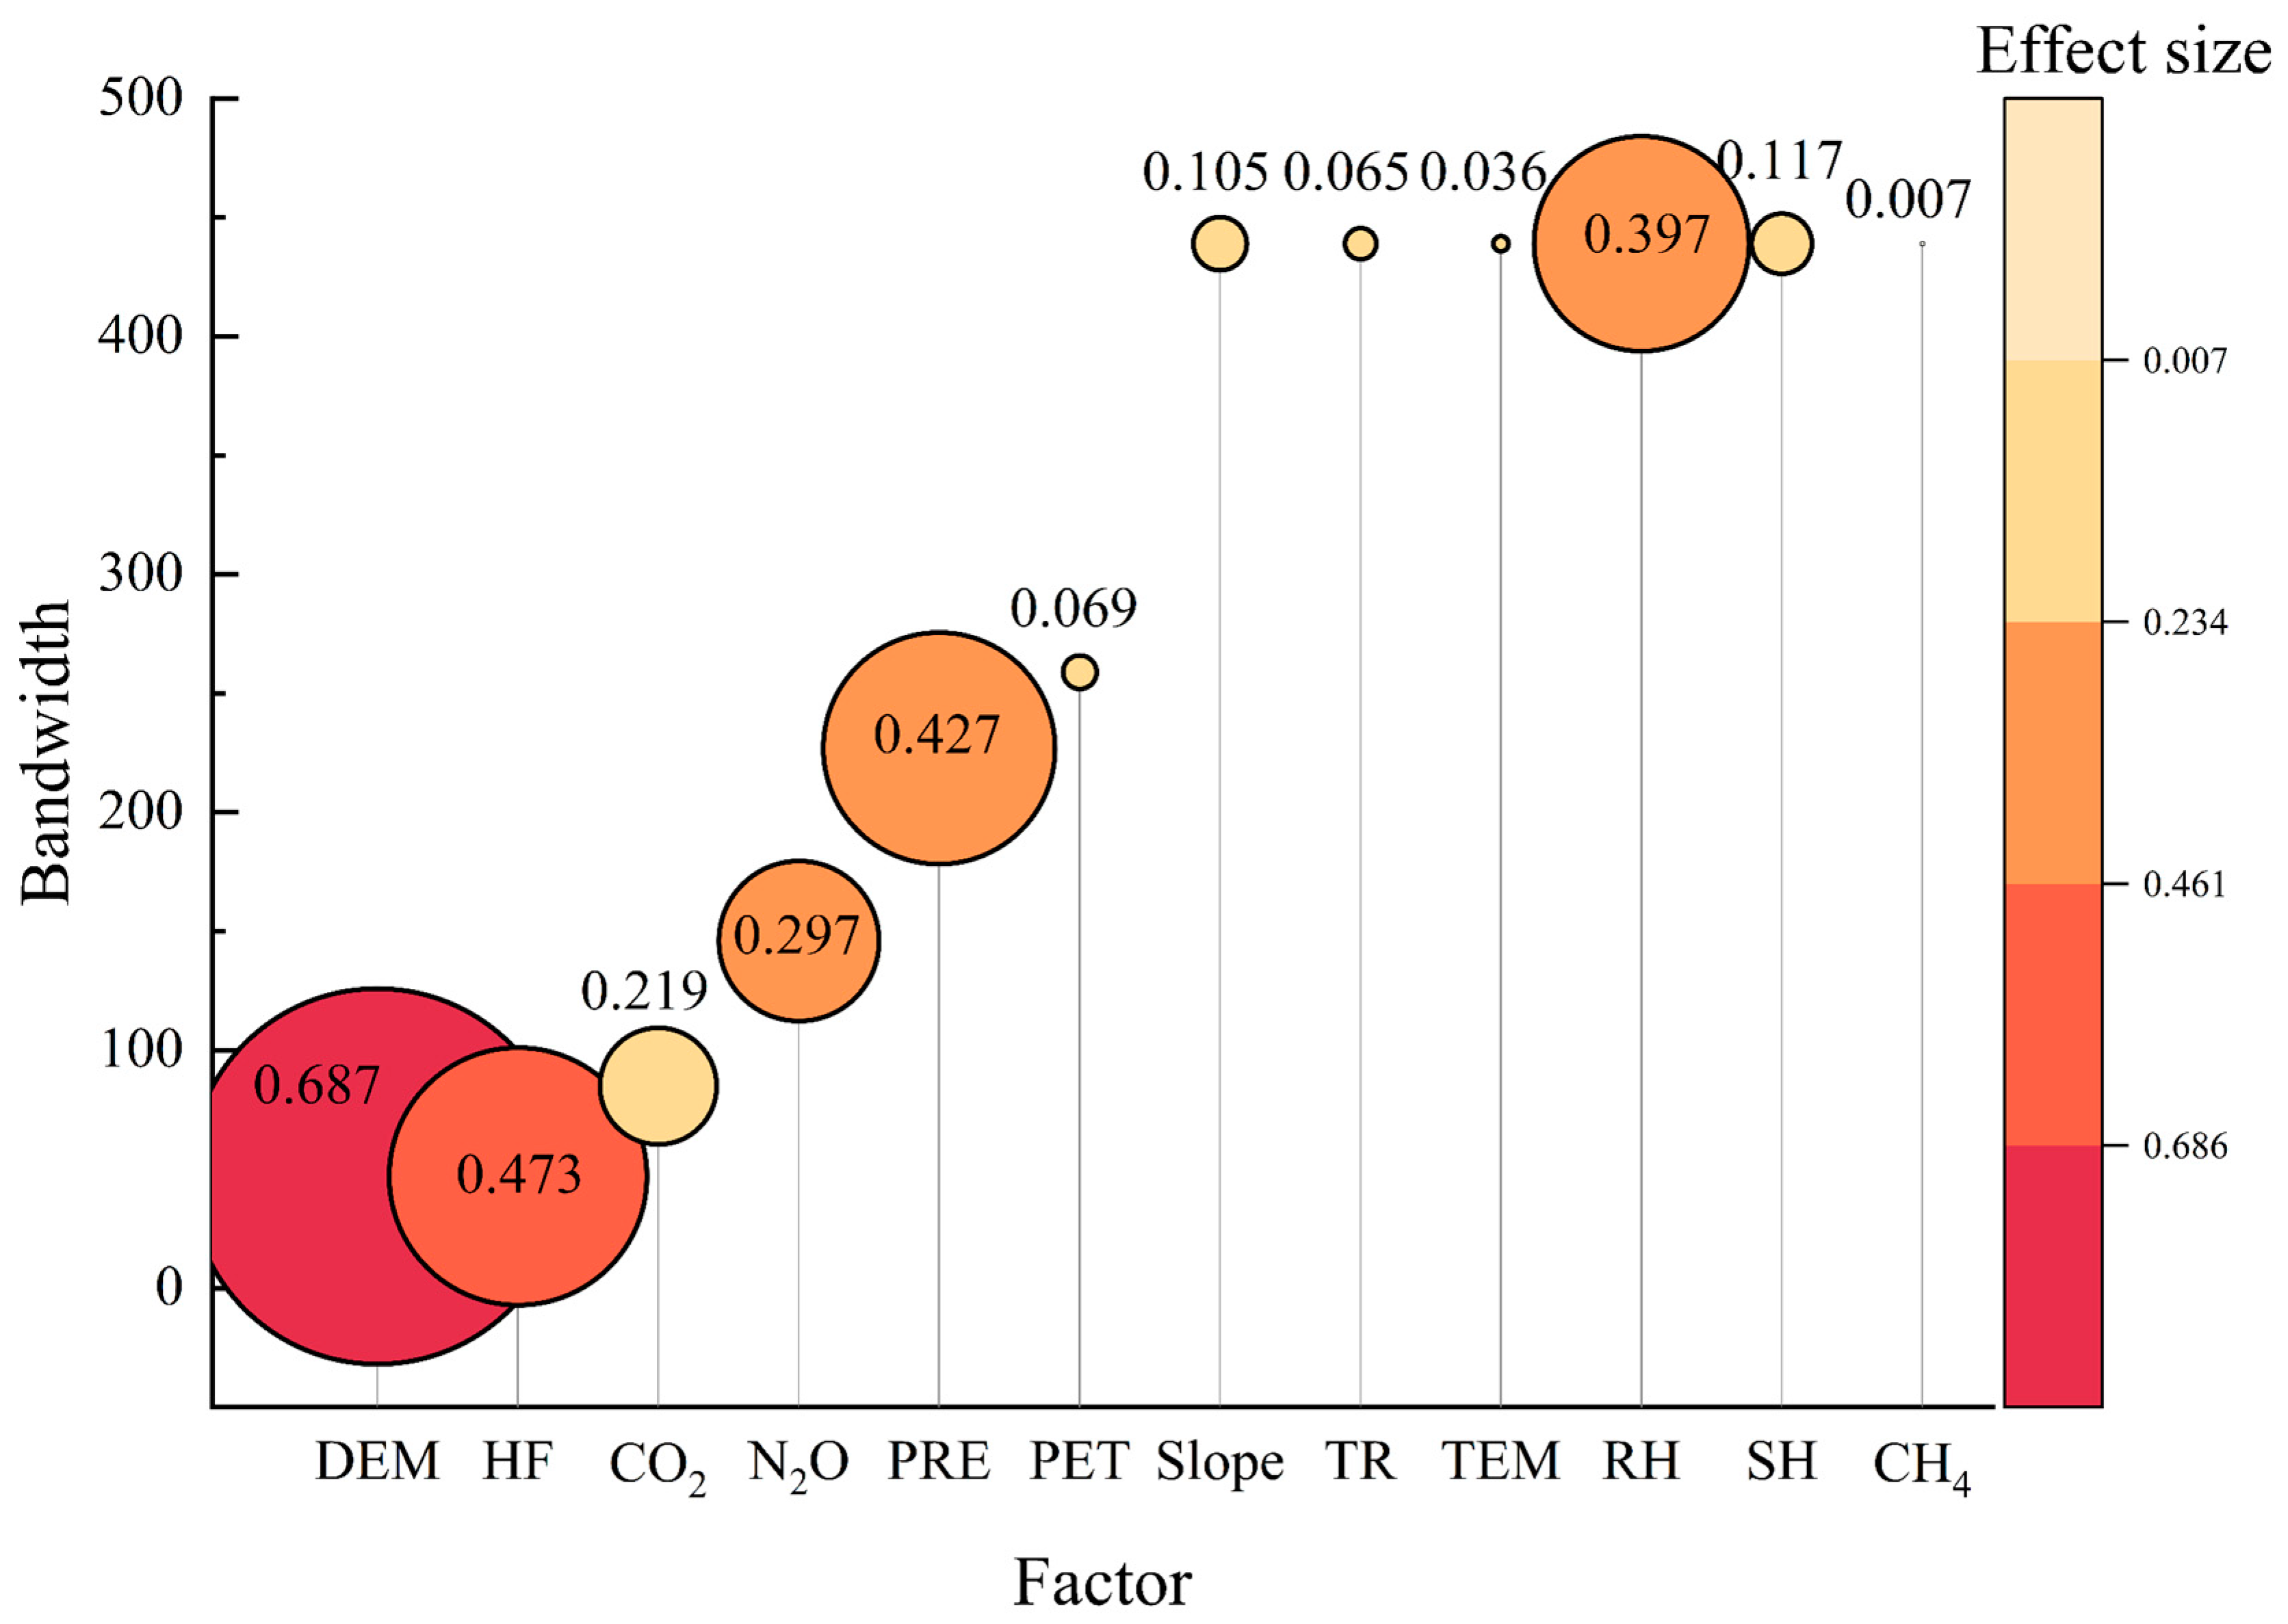
In the MGWR model and taking the 2020 bandwidth and regression coefficient as examples, the size of the regression coefficient of the factors increases as the bandwidth decreases (Figure 10). Overall, the bandwidths of factors were negatively correlated with the regression coefficient, and the regression coefficients decayed approximately exponentially with bandwidth. This pattern suggests that the stronger the effect intensity, the stronger the spatial non-stationarity relationship between vegetation NPP and factors.

4. Discussion

4.1. Increased Trend in Vegetation NPP and Its Persistence

Over the past few decades, vegetation greenness has been increasing globally [47]. The vegetation NPP shows an upward trend from 2000 to 2020 in the YRB (Figure 3a), which is consistent with the previous studies [34,48]. It is worth noting that there were two periods of significant continuous growth. The significant increase in NPP from 2000 to 2004 was mainly due to a series of natural forest protection projects implemented around 2000 [49]. From 2011 to 2013, there also occurred a continuous increase in NPP that was relatively significant in magnitude. This was mainly due to the large-scale afforestation project implemented around 2009 [50]. That reflected a certain time lag in the manifestation of the effects of the ecological program implementation [51]. NPP exhibited significant improvement in the middle basin, with the increasing area predominantly concentrated within the agriculture and grassland ecoregion of the Loess Plateau (Figure 4b). This area is the primary implementation location of China’s “Three-North Protective Forests” construction. The government-led ecological restoration system is effective, and the effect of carbon sequestration is obvious in forests [52]. A decrease in vegetation NPP was observed in a small portion of the lower part of the YRB (Figure 4c), where human activities, such as dense population distribution, urban expansion, and cultivation of arable land, inhibited vegetation growth [15,53].
Trends in NPP have been frequently reported in previous research, and the persistence of these trends has rarely been discussed. The overall development trend in the future of NPP in the YRB is from increasing to decreasing (Figure 4d). And the future trend from increasing to decreasing is evident in Inner Mongolia (Figure 4e). It may be related to the shift from warm and wet to warm and dry climatic conditions in Inner Mongolia [17,54]. However, there are also some regions showing a continuously increasing future trend. For example, the sustained increase in NPP in the western headwaters may be related to the ample water supply provided by warming snowmelt [54]. NPP continues to increase in Gansu and Ningxia, possibly associated with the execution of the fallow to forest program (Figure 4f) [55]. Therefore, NPP change trends in the future are critical to providing advanced warning of future ecological environment changes and developing appropriate strategies [56].

4.2. Spatial Non-Stationarity of Natural and Anthropogenic Effects on NPP

4.2.1. The Effect of Natural Factors on NPP

In Figure 6a–c combined with Figure 7a–c, it can be observed that the influence of terrain factors distributed in an east-west trend is closely related to the terrain characteristics of high west and low east, mostly due to terrain factors that can indirectly influence vegetation growth change by the regulation of hydrothermal conditions and organic nutrients needed by vegetation [57,58]. For example, Figure 7a shows that the NPP at high altitudes in the upper YRB is more negatively affected by DEM. The main reasons for this are low temperatures and the lack of precipitation at high altitudes. Another reason is that the mountainous terrain leads to easy water loss, which will limit the growth and photosynthesis rate of the plants, thus reducing the NPP [59].
We found that TEM and SH have negative effects on vegetation NPP (Figure 7d,h), which is consistent with previous studies [60]. TEM has the strongest negative effects in the basin’s lower reaches, which is due to the fact that TEM is the highest in the region (Figure 6d). High temperatures increase the intensity of plant respiration, consuming more energy and nutrients and can exacerbate plant water stress [61]. SH has the strongest negative effects in the north of the basin. Higher SH in the northern part of the YRB was mainly responsible for this result (Figure 6h), which resulted in a high intensity of plant photorespiration and a decrease in plant productivity [62].
PET and PRE have both positive and negative effects (Figure 7e,f). Of these, PRE has a negative effect on only a small portion of the basin’s lower reaches, while PET has a positive effect only on the lower reaches. This may be due to PRE and PET being higher in the area (Figure 6e,f). Higher PRE in the region may lead to soil saturation, making it difficult for plants to absorb sufficient oxygen and nutrients [63]. In contrast, high PET can promote the solubilization and uptake of nutrients in the soil, which would provide more nutrients for plant growth [64].
RH has a positive effect on NPP (Figure 7g). This may be because the YRB is predominantly arid and semi-arid [65]. A relative humidity increase will lead to soil moisture content increase, which allows plants to absorb more water and facilitates plant growth [22]. Although the positive effect gradually weakens from west to east, the changes are relatively small and the spatial non-stationarity is not obvious. So, the correlation with the spatial distribution of RH is not significant (Figure 6g).

4.2.2. The Effect of Anthropogenic Factors on NPP

The influence of HF on NPP in the northwest of the YRB was positive, whereas in other areas, the effect was negative (Figure 8a). Previous research on the impact of nighttime lighting and population density on vegetation of the YRB confirms this finding [66]. This could be due to the difference in the main land use and the imbalance of economic development in different regions of the YRB. The northwest region has a lot of agricultural production land; agricultural activities can promote the nutrient cycling of the land. The Northwest is dry and water-scarce [65], and the diversion of water to irrigate farmland improves the water use efficiency of vegetation and thus increases NPP [67]. In addition, the economic development of Northwest China is relatively underdeveloped. The higher the HF, which drives economic development, the more sufficient the subsidy funds for the fallow reforestation project to the farmers. At the same time, it can lead to better living standards for herders, which can improve vegetation NPP by reducing grazing pressure thereby [68].
Among anthropogenic greenhouse gas emissions, it is generally accepted that the fertilization effect of CO2 promotes vegetative photosynthesis, which in turn increases vegetative NPP [69]. However, we found that CO2 has a negative effect and varies with geographic location (Figure 8b), mostly due to the different climate conditions, soil texture and vegetation types in different regions. The response to CO2 concentration is not the same [70,71]. N2O inhibited almost all areas (Figure 8d), which may be related to the use of nitrogen fertilizers. Excessive nitrogen deposition leads to nitrogen enrichment in the soil, thereby disrupting the balance of nitrogen absorption by vegetation and ultimately inhibiting plant growth [72]. Compared with CO2 and N2O and although CH4 exhibits an east-west gradient, the actual coefficient change is very small (Figure 8c). This may be because CH4 is not a constraint on vegetation production. It plays more of an indirect role and the relationship with plant productivity is not significant [17,73].

4.3. Scale Effect Analysis

Most previous studies assumed that the impact scale of various factors on NPP remained unchanged [23,74]. However, we found that the spatial scale of the relationship between NPP and associated factors varies with time (Figure 9). It is generally believed that terrain factors such as DEM are relatively stable and will not change in a short period (i.e., 5 years). But we had different bandwidths of these three factors in the MGWR model. The reason may be as follows: (1) In different time periods, the MGWR model may find different optimal bandwidth combinations, which depend on the change in dependent variables and the objective function of the model. (2) Even if DEM and other factors change slowly, the change in the dependent variable may lead to a change in the sensitivity of the model to different factors. (3) Although the DEM changes little on the whole, its local influence range may be affected by other factors. It may be that other factors affect their local spatial autocorrelation, such as land use change, climate change or human activities. In conclusion, the huge change in DEM bandwidth is not entirely driven by the change in DEM itself but may be caused by the process of model optimization, the change in dependent variables and other influencing factors.
Smaller bandwidths indicate a greater extent of spatial heterogeneity in factor effects. Scale effect analysis showed that factors with higher spatial heterogeneity could better explain the change in vegetation NPP. Among them, we found that RH has a significant impact despite its large bandwidth (Figure 10). This may be because the climatic characteristics of the YRB are predominantly arid and semi-arid. These findings indicate that the impact scale, as a crucial element influencing the relationship between multiple factors and NPP, varies significantly between various factors in explaining vegetation NPP [75].

4.4. Policy Suggestion

According to the results of spatial non-stationary analysis, timely external interventions and continuous adjustments to the corresponding areas of the basin may be an effective way to increase NPP in the YRB. For example, in the upper parts of the YRB, the impact of PRE is significant (Figure 7e). Earlier studies have shown that different plant species have different levels of adaptation to precipitation [76,77]. Therefore, selecting drought-tolerant plants is the key to ecological restoration in the YRB. Low-growing plant shrubs usually have smaller leaves with a waxy or downy surface that reduces water transpiration, and they have fat, juicy stalks or leaves that store large amounts of water to withstand the effects of reduced precipitation.
Based on the results of scale analysis (Figure 9), accurate identification of spatial scale relationships can help decision-makers focus on inter-regional characteristics to formulate ecological management policies. For example, the vegetation NPP is influenced by 47 proximate terrain units, thereby indicating that these 47 terrain units can be aggregated into an optimal minimal area to implement the corresponding vegetation policy. As another example, the impact of CO2 emissions from the 87 nearby units on the vegetation NPP should be considered when developing ecological management policies. This method avoids global execution of the same policy and reduces resource wastage due to policy execution overflow. Meanwhile, the fluctuation in the scale relationship also forces the relevant authorities to keep updating the ecological management policies for specific factors over time.

4.5. Limitations and Uncertainties

Firstly, in addition to the individual impacts of natural and anthropogenic factors on vegetation NPP, various environmental factors may also interact and have both direct and indirect relationships, with varying degrees of importance. Admittedly, multiple new approaches based on machine learning methods were proposed recently, such as the XGBoost model [78]. It provides insights into the relative significance of different features in predicting the target variable, enabling better understanding and interpretation of the model. Additionally, understanding feature importance can inform domain-specific insights, reviewing which variables are most influential in the context of the problem being addressed. For example, when studying the dynamics of vegetation NPP, the XGBoost model can be used to explore the interpretation degree of impact factors on vegetation NPP.
Secondly, the impact of anthropogenic factors may be fraught with uncertainty, despite the fact that the rising CO2 concentrations and N depositions are closely linked to human activities. However, their effects are indirect since a plant absorbs CO2 directly, as well as captures nutrients (N and P) from the soil and performs a series of physiological processes. Therefore, the simple characterization of greenhouse gas emissions as anthropogenic impacts here needs further discussion. So, the MGWR model constructed based on natural and anthropogenic factors may be subject to some limitations and uncertainties. In the future, it is hoped that these limitations and uncertainties will be resolved to assist decision-makers in carrying out scientifically sound regional ecosystem management.
Thirdly, MODIS NPP products provide global vegetation productivity data and can be used to analyze the changes and impacts of NPP in the YRB. However, to further investigate the spatial details of NPP variability and to capture the monthly and seasonal changes in NPP, as well as its response to extreme climate events, higher spatial-temporal resolution data are needed. For example, the Copernicus Programme has provided an official global NPP product (2023-present), with a spatial resolution of 300 m and a temporal resolution of 10 days. Therefore, future work should consider using Copernicus NPP data to further research the spatiotemporal changes and attribution of NPP or for cross-validation.

5. Conclusions

This study assessed the spatiotemporal patterns of NPP in the YRB from 2000 to 2020 and selected 12 natural and anthropogenic factors according to the regional characteristics of the YRB, revealing the spatial non-stationarity and different response scales of the relationship between factors and NPP.
(1)
From 2000 to 2020, the overall trend in NPP for YRB is increasing. The future trend indicates that the NPP in southern Qinghai, Shaanxi and Inner Mongolia will show a change from increasing to decreasing, and the vegetation is at risk of degradation. Therefore, the focus of future management should be on the region for the improvement of its ecosystem stability.
(2)
The reaction of NPP to influencing factors exhibits significant spatial non-stationarity. Most of the effects of natural factors show east-west gradual distribution, and individuals show north-south distribution. This is due to the fact that NPP originates from the natural environment and is related to the spatial distribution of natural factors in the YRB. In contrast, there is no similar law of spatial non-stationarity between anthropogenic factors and NPP.
(3)
The impact scale of different factors on vegetation NPP varied significantly. The bandwidths of factors were negatively correlated with the regression coefficient, that is, the greater the effect intensity, the stronger the spatial non-stationary relationship of vegetation NPP. Due to the YRB being semi-arid, the impact size and scale of RH are both large. The study of such scale effects can allow governments to set the scope of policy implementation according to the size of the impact scale.

Author Contributions

Conceptualization, X.W. (Xiaolei Wang); Data curation, W.H.; Formal analysis, W.H.; Methodology, X.W. (Xiaolei Wang) and B.Z.; Project administration, X.W. (Xiaolei Wang) and X.Z.; Software, W.H. and X.W. (Xing Wu); Validation, Y.H. and B.Z.; Writing—original draft, W.H.; Writing—review and editing, X.W. (Xiaolei Wang) and W.H. All authors have read and agreed to the published version of the manuscript.

Funding

This research was funded by the Pre-research Project of SongShan Laboratory, grant number YYYY062022001, and the Natural Science Foundation of Henan, grant number 212300410292.

Data Availability Statement

The raw data supporting the conclusions of this article will be made available by the authors on request.

Conflicts of Interest

The authors declare no conflicts of interest.

References

  1. Vitousek, P.M.; Ehrlich, P.R.; Ehrlich, A.H.; Matson, P.A. Net Primary Production: Original Calculations. Science 1987, 235, 730. [Google Scholar] [CrossRef]
  2. Liu, C.; Shi, S.; Wang, T.; Gong, W.; Xu, L.; Shi, Z.; Du, J.; Qu, F. Analysis of Net Primary Productivity Variation and Quantitative Assessment of Driving Forces&mdash;A Case Study of the Yangtze River Basin. Plants 2023, 12, 3412. [Google Scholar] [CrossRef]
  3. Ji, R.; Tan, K.; Wang, X.; Pan, C.; Xin, L. Spatiotemporal Monitoring of a Grassland Ecosystem and Its Net Primary Production Using Google Earth Engine: A Case Study of Inner Mongolia from 2000 to 2020. Remote Sens. 2021, 13, 4480. [Google Scholar] [CrossRef]
  4. Chen, T.; Werf, G.R.; Jeu, R.A.M.; Wang, G.; Dolman, A.J. A global analysis of the impact of drought on net primary productivity. Hydrol. Earth Syst. Sci. 2013, 17, 3885–3894. [Google Scholar] [CrossRef]
  5. Chang, J.; Wei, J.; Wang, Y.; Yuan, M.; Guo, J. Precipitation and runoff variations in the Yellow River Basin of China. J. Hydroinform. 2016, 19, 138–155. [Google Scholar] [CrossRef]
  6. Xiao, F. Impact of Climate Change on Ecological Security of the Yellow River Basin and Its Adaptation Countermeasures. J. Landsc. Res. 2021, 13, 51–56. [Google Scholar]
  7. Wang, D.; Qin, W.; Jia, G.; Shan, Z.; Hao, M. Assessing the effects of climate variability and vegetation conversion on variations of net primary productivity in the mountainous area of North China. For. Ecol. Manag. 2022, 506, 119957. [Google Scholar] [CrossRef]
  8. Cao, M.; Prince, S.D.; Small, J.; Goetz, S.J. Remotely Sensed Interannual Variations and Trends in Terrestrial Net Primary Productivity 1981–2000. Ecosystems 2004, 7, 233–242. [Google Scholar] [CrossRef]
  9. Gang, C.; Zhou, W.; Wang, Z.; Chen, Y.; Li, J.; Chen, J.; Qi, J.; Odeh, I.; Groisman, P.Y. Comparative Assessment of Grassland NPP Dynamics in Response to Climate Change in China, North America, Europe and Australia from 1981 to 2010. J. Agron. Crop Sci. 2015, 201, 57–68. [Google Scholar] [CrossRef]
  10. Wang, Q.; Liang, L.; Wang, S.; Wang, S.; Zhang, L.; Qiu, S.; Shi, Y.; Shi, J.; Sun, C. Insights into Spatiotemporal Variations in the NPP of Terrestrial Vegetation in Africa from 1981 to 2018. Remote Sens. 2023, 15, 2748. [Google Scholar] [CrossRef]
  11. Ding, Z.; Peng, J.; Qiu, S.; Zhao, Y. Nearly Half of Global Vegetated Area Experienced Inconsistent Vegetation Growth in Terms of Greenness, Cover, and Productivity. Earth’s Future 2020, 8, e2020EF001618. [Google Scholar] [CrossRef]
  12. Koju, U.A.; Zhang, J.; Maharjan, S.; Bai, Y.; Zhang, S.; Yao, F. Analysis of spatiotemporal dynamics of forest Net Primary Productivity of Nepal during 2000–2015. Int. J. Remote Sens. 2020, 41, 4336–4364. [Google Scholar] [CrossRef]
  13. Piao, S.; Fang, J.; Zhou, L.; Zhu, B.; Tan, K.; Tao, S. Changes in vegetation net primary productivity from 1982 to 1999 in China. Glob. Biogeochem. Cycles 2005, 19, GB2027. [Google Scholar] [CrossRef]
  14. Liu, G.; Shao, Q.; Fan, J.; Ning, J.; Rong, K.; Huang, H.; Liu, S.; Zhang, X.; Niu, L.; Liu, J. Change Trend and Restoration Potential of Vegetation Net Primary Productivity in China over the Past 20 Years. Remote Sens. 2022, 14, 1634. [Google Scholar] [CrossRef]
  15. Chen, Y.; Guo, D.; Cao, W.; Li, Y. Changes in Net Primary Productivity and Factor Detection in China&rsquo;s Yellow River Basin from 2000 to 2019. Remote Sens. 2023, 15, 2798. [Google Scholar] [CrossRef]
  16. Wang, L.; Zhang, J.; Shu, Z.; Bao, Z.; Jin, J.; Liu, C.; He, R.; Liu, Y.; Wang, G. Assessment of future eco-hydrological regime and uncertainty under climate changes over an alpine region. J. Hydrol. 2023, 620, 129451. [Google Scholar] [CrossRef]
  17. Gong, H.; Cao, L.; Duan, Y.; Jiao, F.; Xu, X.; Zhang, M.; Wang, K.; Liu, H. Multiple effects of climate changes and human activities on NPP increase in the Three-north Shelter Forest Program area. For. Ecol. Manag. 2023, 529, 120732. [Google Scholar] [CrossRef]
  18. Lai, X.; Xu, Y.; Yin, B.; Zhu, Q.; Wang, G.; Miao, L. A comparative study on the spatio-temporal patterns and drivers of net primary productivity in three basins across different climate gradients in China. Trans. Earth Environ. Sustain. 2023, 1, 251–270. [Google Scholar] [CrossRef]
  19. Zarei, A.; Chemura, A.; Gleixner, S.; Hoff, H. Evaluating the grassland NPP dynamics in response to climate change in Tanzania. Ecol. Indic. 2021, 125, 107600. [Google Scholar] [CrossRef]
  20. Islam, A.R.M.T.; Islam, H.M.T.; Shahid, S.; Khatun, M.K.; Ali, M.M.; Rahman, M.S.; Ibrahim, S.M.; Almoajel, A.M. Spatiotemporal nexus between vegetation change and extreme climatic indices and their possible causes of change. J. Environ. Manag. 2021, 289, 112505. [Google Scholar] [CrossRef]
  21. Zhou, Y.; Yue, D.; Li, C.; Mu, X.; Guo, J. Identifying the spatial drivers of net primary productivity: A case study in the Bailong River Basin, China. Glob. Ecol. Conserv. 2021, 28, e01685. [Google Scholar] [CrossRef]
  22. Ge, W.; Deng, L.; Wang, F.; Han, J. Quantifying the contributions of human activities and climate change to vegetation net primary productivity dynamics in China from 2001 to 2016. Sci. Total Environ. 2021, 773, 145648. [Google Scholar] [CrossRef] [PubMed]
  23. Wang, G.; Peng, W.; Zhang, L.; Zhang, J. Quantifying the impacts of natural and human factors on changes in NPP using an optimal parameters-based geographical detector. Ecol. Indic. 2023, 155, 111018. [Google Scholar] [CrossRef]
  24. Ugbaje, S.U.; Odeh, I.O.A.; Bishop, T.F.A.; Li, J. Assessing the spatio-temporal variability of vegetation productivity in Africa: Quantifying the relative roles of climate variability and human activities. Int. J. Digit. Earth 2017, 10, 879–900. [Google Scholar] [CrossRef]
  25. Yan, W.; Wang, Y.; Chaudhary, P.; Ju, P.; Zhu, Q.; Kang, X.; Chen, H.; He, Y. Effects of climate change and human activities on net primary production of wetlands on the Zoige Plateau from 1990 to 2015. Glob. Ecol. Conserv. 2022, 35, e02052. [Google Scholar] [CrossRef]
  26. Chen, F.; Leung, Y.; Wang, Q.; Zhou, Y. Spatial non-stationarity test of regression relationships in the multiscale geographically weighted regression model. Spat. Stat. 2024, 62, 100846. [Google Scholar] [CrossRef]
  27. Rind, D. Complexity and Climate. Science 1999, 284, 105–107. [Google Scholar] [CrossRef]
  28. Chen, T.; Tang, G.; Yuan, Y.; Guo, H.; Xu, Z.; Jiang, G.; Chen, X. Unraveling the relative impacts of climate change and human activities on grassland productivity in Central Asia over last three decades. Sci. Total Environ. 2020, 743, 140649. [Google Scholar] [CrossRef]
  29. Nowicka, B.; Ciura, J.; Szymańska, R.; Kruk, J. Improving photosynthesis, plant productivity and abiotic stress tolerance—current trends and future perspectives. J. Plant Physiol. 2018, 231, 415–433. [Google Scholar] [CrossRef]
  30. Bejagam, V.; Sharma, A. Impact of climatic changes and anthropogenic activities on ecosystem net primary productivity in India during 2001–2019. Ecol. Inform. 2022, 70, 101732. [Google Scholar] [CrossRef]
  31. Mu, H.; Li, X.; Wen, Y.; Huang, J.; Du, P.; Su, W.; Miao, S.; Geng, M. A global record of annual terrestrial Human Footprint dataset from 2000 to 2018. Sci. Data 2022, 9, 176. [Google Scholar] [CrossRef]
  32. Zhao, M.; Running, S.W. Drought-Induced Reduction in Global Terrestrial Net Primary Production from 2000 Through 2009. Science 2010, 329, 940–943. [Google Scholar] [CrossRef]
  33. Schwalm, C.R.; Huntzinger, D.N.; Michalak, A.M.; Schaefer, K.; Fisher, J.B.; Fang, Y.; Wei, Y. Modeling suggests fossil fuel emissions have been driving increased land carbon uptake since the turn of the 20th Century. Sci. Rep. 2020, 10, 9059. [Google Scholar] [CrossRef]
  34. Cao, Y.; Li, H.; Liu, Y.; Zhang, Y.; Jiang, Y.; Dai, W.; Shen, M.; Guo, X.; Qi, W.; Li, L.; et al. Regional Contribution and Attribution of the Interannual Variation of Net Primary Production in the Yellow River Basin, China. Remote Sens. 2023, 15, 5212. [Google Scholar] [CrossRef]
  35. Fotheringham, A.S.; Yang, W.; Kang, W. Multiscale Geographically Weighted Regression (MGWR). Ann. Am. Assoc. Geogr. 2017, 107, 1247–1265. [Google Scholar] [CrossRef]
  36. Dutta, I.; Basu, T.; Das, A. Spatial analysis of COVID-19 incidence and its determinants using spatial modeling: A study on India. Environ. Chall. 2021, 4, 100096. [Google Scholar] [CrossRef]
  37. Wu, Z.; Borzée, A.; Qian, T.; Dai, W.; Li, S.; Wang, J. Spatial non-stationarity effect of determinants regulates variation in amphibian species richness. Ecol. Indic. 2023, 150, 110268. [Google Scholar] [CrossRef]
  38. Sanderson, E.W.; Jaiteh, M.; Levy, M.A.; Redford, K.H.; Wannebo, A.V.; Woolmer, G. The Human Footprint and the Last of the Wild: The human footprint is a global map of human influence on the land surface, which suggests that human beings are stewards of nature, whether we like it or not. BioScience 2002, 52, 891–904. [Google Scholar] [CrossRef]
  39. Venter, O.; Sanderson, E.W.; Magrach, A.; Allan, J.R.; Beher, J.; Jones, K.R.; Possingham, H.P.; Laurance, W.F.; Wood, P.; Fekete, B.M.; et al. Global terrestrial Human Footprint maps for 1993 and 2009. Sci. Data 2016, 3, 160067. [Google Scholar] [CrossRef]
  40. Peng, Q.; Wang, R.; Jiang, Y.; Li, C. Contributions of climate change and human activities to vegetation dynamics in Qilian Mountain National Park, northwest China. Glob. Ecol. Conserv. 2021, 32, e01947. [Google Scholar] [CrossRef]
  41. Bai, Y.; Liang, S.; Jia, A.; Li, S. Different Satellite Products Revealing Variable Trends in Global Gross Primary Production. J. Geophys. Res. Biogeosci. 2023, 128, e2022JG006918. [Google Scholar] [CrossRef]
  42. Yue, S.; Pilon, P.; Cavadias, G. Power of the Mann–Kendall and Spearman’s rho tests for detecting monotonic trends in hydrological series. J. Hydrol. 2002, 259, 254–271. [Google Scholar] [CrossRef]
  43. Liu, Y.; Wu, J.; Huang, T.; Nie, W.; Jia, Z.; Gu, Y.; Ma, X. Study on the relationship between regional soil desertification and salinization and groundwater based on remote sensing inversion: A case study of the windy beach area in Northern Shaanxi. Sci. Total Environ. 2024, 912, 168854. [Google Scholar] [CrossRef]
  44. Hurst, H.E. Long-Term Storage Capacity of Reservoirs. Trans. Am. Soc. Civ. Eng. 1951, 116, 770–799. [Google Scholar] [CrossRef]
  45. Fotheringham, A.S.; Yu, H.; Wolf, L.J.; Oshan, T.M.; Li, Z. On the notion of ‘bandwidth’ in geographically weighted regression models of spatially varying processes. Int. J. Geogr. Inf. Sci. 2022, 36, 1485–1502. [Google Scholar] [CrossRef]
  46. Zhang, J.; Dou, S.; Liu, J.; Chen, Y. Ecological challenges on small tourist islands: A case from Chinese rural island. Sustain. Dev. 2024, 32, 1723–1742. [Google Scholar] [CrossRef]
  47. Piao, S.; Wang, X.; Park, T.; Chen, C.; Lian, X.; He, Y.; Bjerke, J.W.; Chen, A.; Ciais, P.; Tømmervik, H.; et al. Characteristics, drivers and feedbacks of global greening. Nat. Rev. Earth Environ. 2020, 1, 14–27. [Google Scholar] [CrossRef]
  48. Lin, Z.; Liu, Y.; Wen, Z.; Chen, X.; Han, P.; Zheng, C.; Yao, H.; Wang, Z.; Shi, H. Spatial&ndash;Temporal Variation Characteristics and Driving Factors of Net Primary Production in the Yellow River Basin over Multiple Time Scales. Remote Sens. 2023, 15, 5273. [Google Scholar] [CrossRef]
  49. Dai, L.; Li, S.; Zhou, W.; Qi, L.; Zhou, L.; Wei, Y.; Li, J.; Shao, G.; Yu, D. Opportunities and challenges for the protection and ecological functions promotion of natural forests in China. For. Ecol. Manag. 2018, 410, 187–192. [Google Scholar] [CrossRef]
  50. Pérez-Silos, I.; Álvarez-Martínez, J.M.; Barquín, J. Large-scale afforestation for ecosystem service provisioning: Learning from the past to improve the future. Landsc. Ecol. 2021, 36, 3329–3343. [Google Scholar] [CrossRef]
  51. Wang, Y.; Tian, J.; Feng, X.; Ren, Y.; Wu, G.; Ji, J. Analysis of spatio-temporal changes in net primary productivity and their driving factors in ecological functional areas of the Yellow River Basin. Ecol. Eng. 2024, 203, 107262. [Google Scholar] [CrossRef]
  52. Zhang, D.; Zuo, X.; Zang, C. Assessment of future potential carbon sequestration and water consumption in the construction area of the Three-North Shelterbelt Programme in China. Agric. For. Meteorol. 2021, 303, 108377. [Google Scholar] [CrossRef]
  53. Huang, M.; Gong, D.; Zhang, L.; Lin, H.; Chen, Y.; Zhu, D.; Xiao, C.; Altan, O. Spatiotemporal dynamics and forecasting of ecological security pattern under the consideration of protecting habitat: A case study of the Poyang Lake ecoregion. Int. J. Digit. Earth 2024, 17, 2376277. [Google Scholar] [CrossRef]
  54. He, B.; Chen, A.; Wang, H.; Wang, Q. Dynamic Response of Satellite-Derived Vegetation Growth to Climate Change in the Three North Shelter Forest Region in China. Remote Sens. 2015, 7, 9998–10016. [Google Scholar] [CrossRef]
  55. Liu, H.; Cao, L.; Jia, J.; Gong, H.; Qi, X.; Xu, X. Effects of land use changes on the nonlinear trends of net primary productivity in arid and semiarid areas, China. Land Degrad. Dev. 2021, 32, 2183–2196. [Google Scholar]
  56. Qiu, B.; Chen, G.; Tang, Z.; Lu, D.; Wang, Z.; Chen, C. Assessing the Three-North Shelter Forest Program in China by a novel framework for characterizing vegetation changes. ISPRS J. Photogramm. Remote Sens. 2017, 133, 75–88. [Google Scholar] [CrossRef]
  57. Gao, M.; Piao, S.; Chen, A.; Yang, H.; Liu, Q.; Fu, Y.H.; Janssens, I.A. Divergent changes in the elevational gradient of vegetation activities over the last 30 years. Nat. Commun. 2019, 10, 2970. [Google Scholar] [PubMed]
  58. Li, S.-F.; Valdes, P.J.; Farnsworth, A.; Davies-Barnard, T.; Su, T.; Lunt, D.J.; Spicer, R.A.; Liu, J.; Deng, W.-Y.-D.; Huang, J.; et al. Orographic evolution of northern Tibet shaped vegetation and plant diversity in eastern Asia. Sci. Adv. 2021, 7, eabc7741. [Google Scholar] [CrossRef]
  59. Ren, Z.; Tian, Z.; Wei, H.; Liu, Y.; Yu, Y. Spatiotemporal evolution and driving mechanisms of vegetation in the Yellow River Basin, China during 2000–2020. Ecol. Indic. 2022, 138, 108832. [Google Scholar] [CrossRef]
  60. Xuan, W.; Rao, L. Spatiotemporal dynamics of net primary productivity and its influencing factors in the middle reaches of the Yellow River from 2000 to 2020. Front. Plant Sci. 2023, 14, 1043807. [Google Scholar] [CrossRef]
  61. Gu, F.; Zhang, Y.; Huang, M.; Tao, B.; Guo, R.; Yan, C. Effects of climate warming on net primary productivity in China during 1961-2010. Ecol. Evol. 2017, 7, 6736–6746. [Google Scholar] [CrossRef] [PubMed]
  62. Chikov, V.; Akhtyamova, G. Photorespiration and Its Role in the Regulation of Photosynthesis and Plant Productivity. Am. J. Plant Sci. 2019, 10, 2179–2202. [Google Scholar] [CrossRef]
  63. Gavrilescu, M. Water, Soil, and Plants Interactions in a Threatened Environment. Water 2021, 13, 2746. [Google Scholar] [CrossRef]
  64. Li, Y.; Piao, S.; Li, L.Z.X.; Chen, A.; Wang, X.; Ciais, P.; Huang, L.; Lian, X.; Peng, S.; Zeng, Z.; et al. Divergent hydrological response to large-scale afforestation and vegetation greening in China. Sci. Adv. 2018, 4, eaar4182. [Google Scholar] [CrossRef]
  65. Jiang, T.; Wang, X.; Afzal, M.M.; Sun, L.; Luo, Y. Vegetation Productivity and Precipitation Use Efficiency across the Yellow River Basin: Spatial Patterns and Controls. Remote Sens. 2022, 14, 5074. [Google Scholar] [CrossRef]
  66. Wang, X.; Shi, S.; Zhao, X.; Hu, Z.; Hou, M.; Xu, L. Detecting Spatially Non-Stationary between Vegetation and Related Factors in the Yellow River Basin from 1986 to 2021 Using Multiscale Geographically Weighted Regression Based on Landsat. Remote Sens. 2022, 14, 6276. [Google Scholar] [CrossRef]
  67. Kim, D.; Baik, J.; Umair, M.; Choi, M. Water use efficiency in terrestrial ecosystem over East Asia: Effects of climate regimes and land cover types. Sci. Total Environ. 2021, 773, 145519. [Google Scholar] [CrossRef]
  68. Cao, S.; Ma, H.; Yuan, W.; Wang, X. Interaction of ecological and social factors affects vegetation recovery in China. Biol. Conserv. 2014, 180, 270–277. [Google Scholar] [CrossRef]
  69. Fernández-Martínez, M.; Sardans, J.; Chevallier, F.; Ciais, P.; Obersteiner, M.; Vicca, S.; Canadell, J.G.; Bastos, A.; Friedlingstein, P.; Sitch, S.; et al. Global trends in carbon sinks and their relationships with CO2 and temperature. Nat. Clim. Change 2019, 9, 73–79. [Google Scholar] [CrossRef]
  70. Xiao, X.; Melillo, J.M.; Kicklighter, D.W.; Pan, Y.; McGuire, A.D.; Helfrich, J.V.K. Net Primary Production of Terrestrial Ecosystems in China and Its Equilibrium Response to Changes in Climate and Atmospheric CO2 Concentration. 1996. Available online: https://dspace.mit.edu/handle/1721.1/3637 (accessed on 26 August 2024).
  71. Ainsworth, E.A.; Lemonnier, P.; Wedow, J.M. The influence of rising tropospheric carbon dioxide and ozone on plant productivity. Plant Biol. 2020, 22, 5–11. [Google Scholar] [CrossRef]
  72. Yang, G.J.; Stevens, C.; Zhang, Z.J.; Lü, X.T.; Han, X.G. Different nitrogen saturation thresholds for above-, below-, and total net primary productivity in a temperate steppe. Glob. Chang. Biol. 2023, 29, 4586–4594. [Google Scholar] [CrossRef] [PubMed]
  73. Chen, W.; Wang, B.; Zhang, F.; Li, Z.; Wang, J.; Yu, G.; Wen, X.; Niu, S. Hysteretic relationship between plant productivity and methane uptake in an alpine meadow. Agric. For. Meteorol. 2020, 288–289, 107982. [Google Scholar] [CrossRef]
  74. Chen, L.; Zhang, H.; Zhang, X.; Liu, P.; Zhang, W.; Ma, X. Vegetation changes in coal mining areas: Naturally or anthropogenically Driven? Catena 2022, 208, 105712. [Google Scholar] [CrossRef]
  75. Wang, Z.; Dong, C.; Dai, L.; Wang, R.; Liang, Q.; He, L.; Wei, D. Spatiotemporal evolution and attribution analysis of grassland NPP in the Yellow River source region, China. Ecol. Inform. 2023, 76, 102135. [Google Scholar] [CrossRef]
  76. Yang, L.; Guan, Q.; Lin, J.; Tian, J.; Tan, Z.; Li, H. Evolution of NDVI secular trends and responses to climate change: A perspective from nonlinearity and nonstationarity characteristics. Remote Sens. Environ. 2021, 254, 112247. [Google Scholar] [CrossRef]
  77. Li, H.; He, Y.; Zhang, L.; Cao, S.; Sun, Q. Spatiotemporal changes of Gross Primary Production in the Yellow River Basin of China under the influence of climate-driven and human-activity. Glob. Ecol. Conserv. 2023, 46, e02550. [Google Scholar] [CrossRef]
  78. Bartold, M.; Kluczek, M. A Machine Learning Approach for Mapping Chlorophyll Fluorescence at Inland Wetlands. Remote Sens. 2023, 15, 2392. [Google Scholar] [CrossRef]
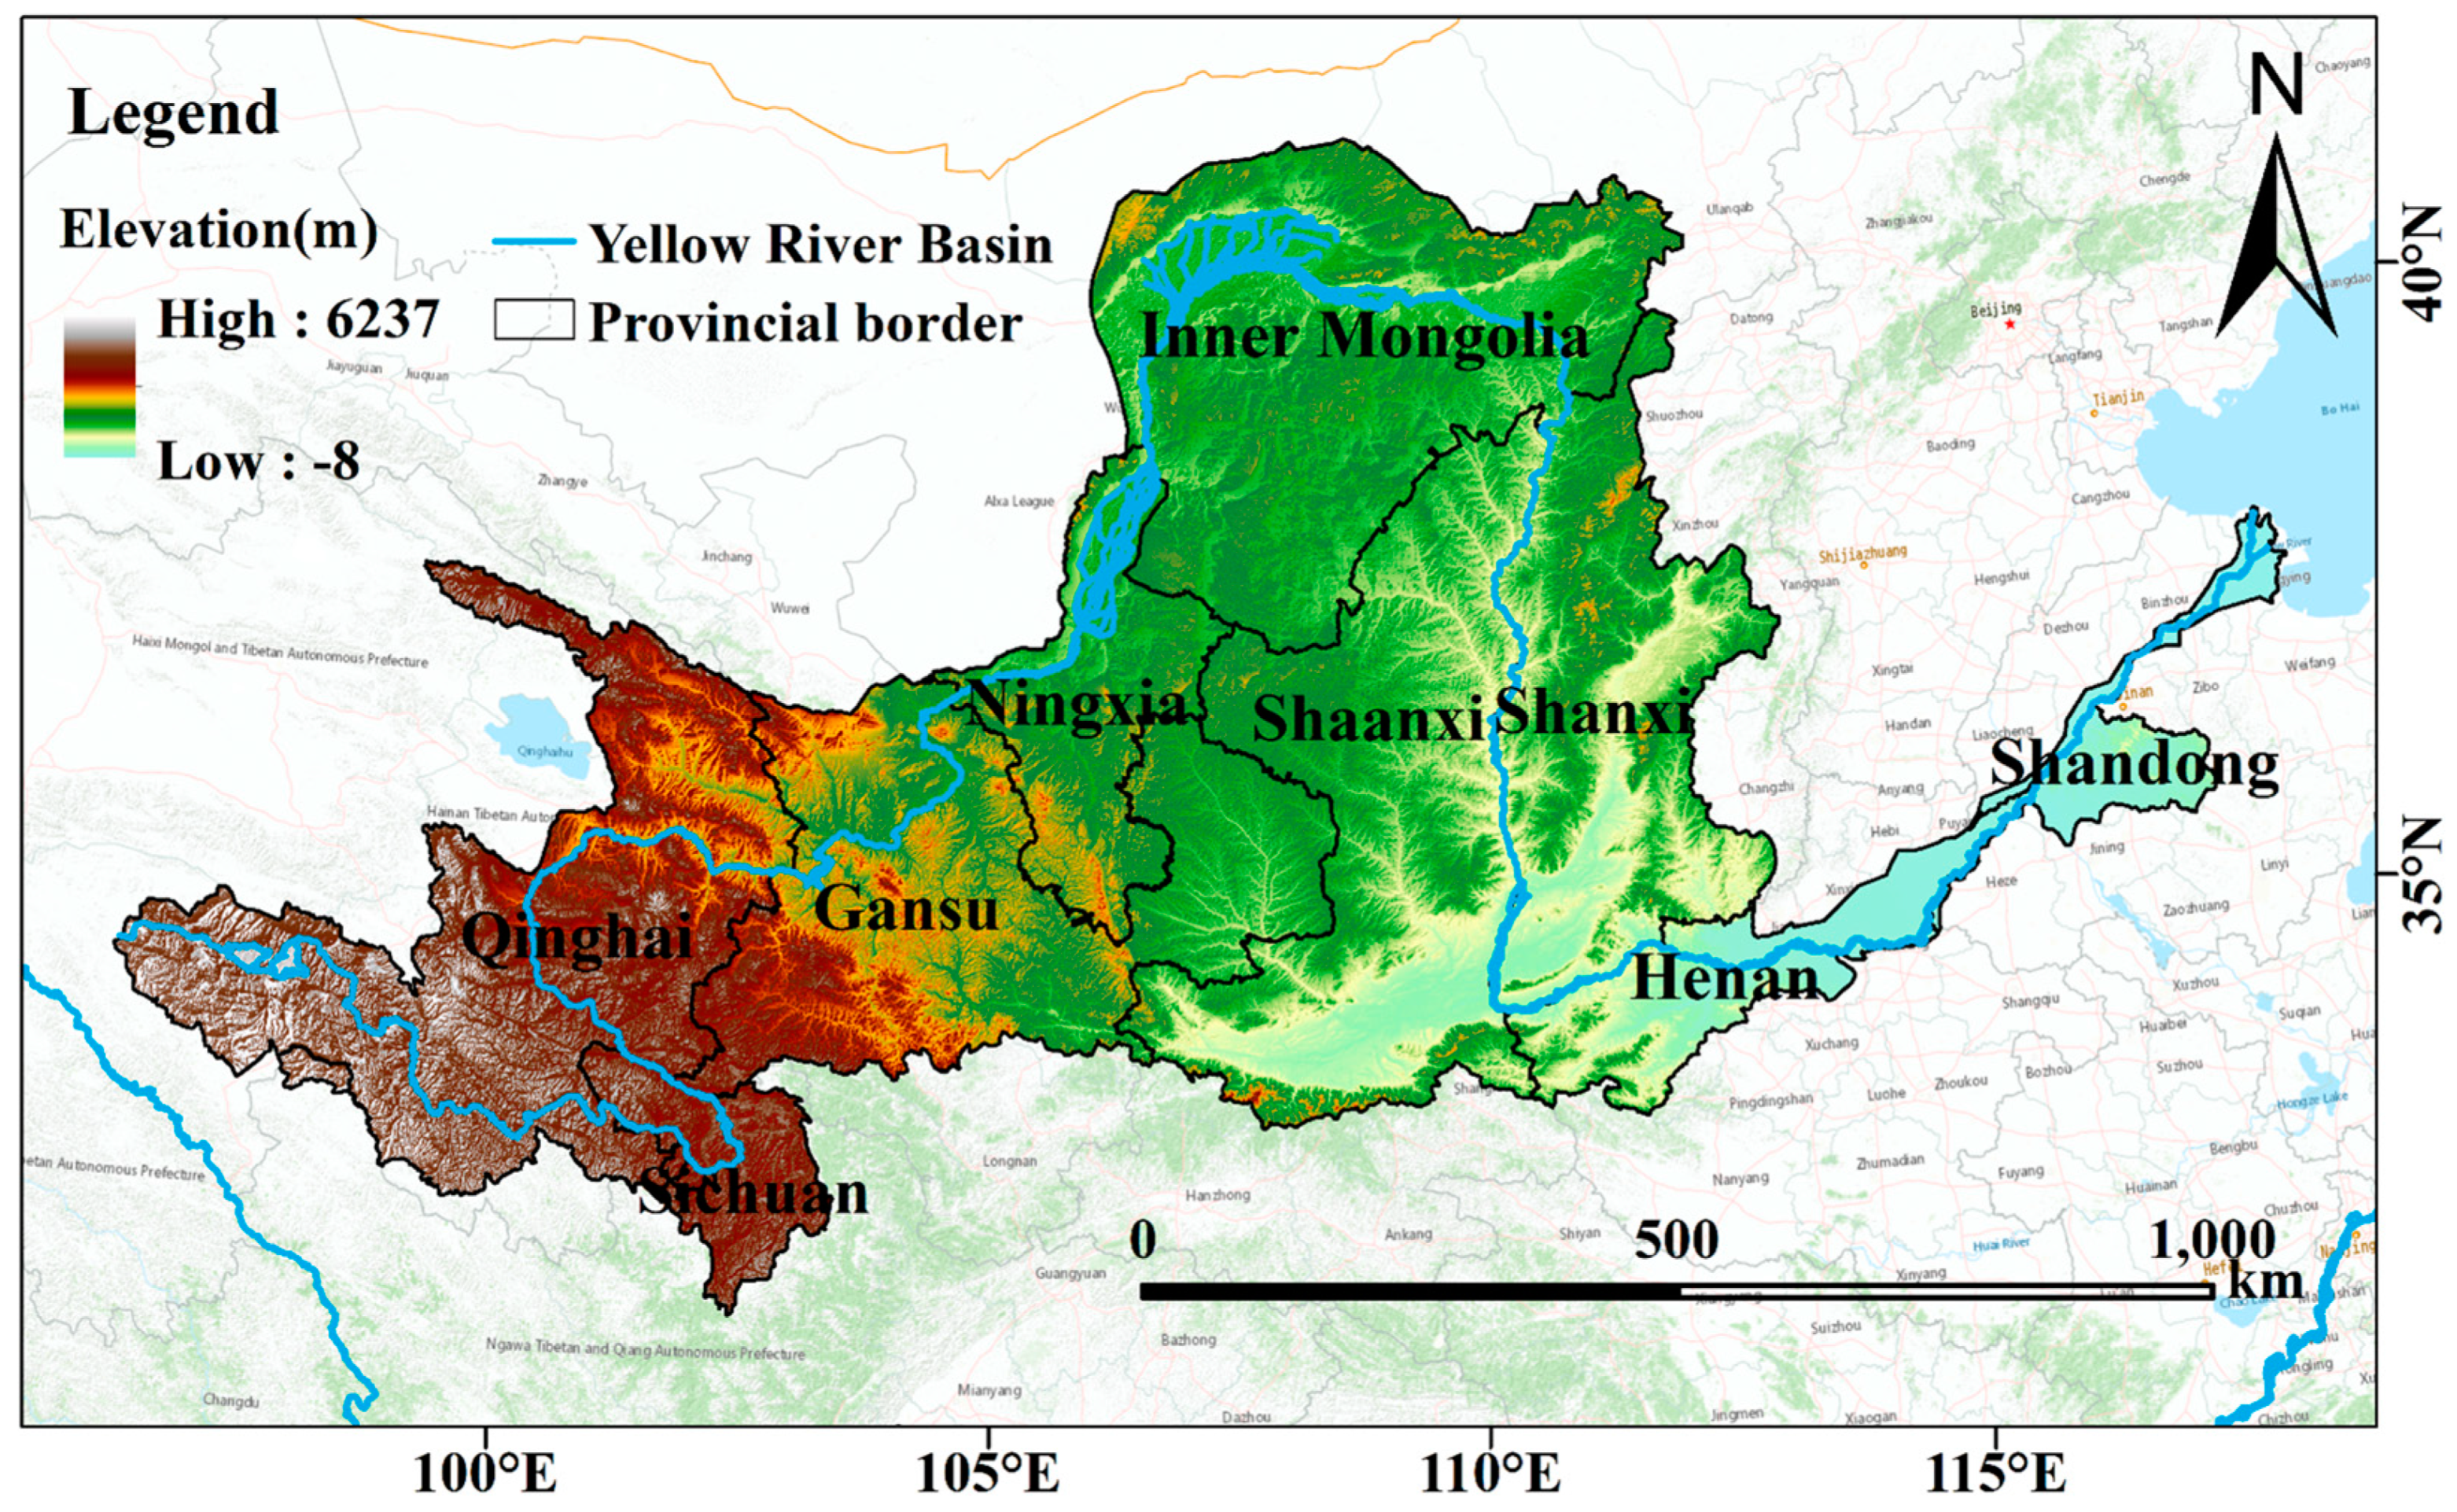
Figure 1. Spatial distribution of elevation in the study area.
Remotesensing 16 03156 g001
Figure 2. Technical flowchart of the study.
Remotesensing 16 03156 g002
Figure 3. Interannual variation in NPP annual average (a). Changes in the proportion of high and low NPP values (b). Vegetation NPP (cg) and NPP multi-year mean distribution (h) from 2000 to 2020.
Remotesensing 16 03156 g003
Figure 4. Trends of NPP changes from 2000 to 2020 (a) and the areas with significantly improve (b) and degrade (c). The future trend of NPP (d) and the areas with increase to decrease (e) and continuous increase (f).
Remotesensing 16 03156 g004
Figure 5. Statistics of MGWR regression coefficients for influencing factors from 2000 to 2020. (ae) 2000; 2005; 2010; 2015; 2020.
Remotesensing 16 03156 g005
Figure 6. The spatial distribution of natural factors in the YRB. (a) DEM; (b) Slope; (c) TR; (d) TEM; (e) PRE; (f) PET; (g) RH; (h) SH.
Remotesensing 16 03156 g006
Figure 7. Spatial distribution of MGWR regression coefficients of natural factors. (a) DEM; (b) Slope; (c) TR; (d) TEM; (e) PRE; (f) PET; (g) RH; (h) SH.
Remotesensing 16 03156 g007
Figure 8. Spatial distribution of MGWR regression coefficients of anthropogenic factors. (a) HF; (b) CO2; (c) CH4; (d) N2O.
Remotesensing 16 03156 g008
Figure 9. Bandwidth of GWR and MGWR. (ae) 2000; 2005; 2010; 2015; 2020. Note: * represents global scales.
Remotesensing 16 03156 g009
Figure 10. The relationship between effect sizes and bandwidths. Circle size and color shades indicate effect size. The height of the circle center indicates the bandwidth.
Remotesensing 16 03156 g010
Table 1. List of influencing factor data.
FactorCodeUnitResolutionData Source
Natural factorsDigital elevation modelDEMm30 mUnited States Geological Survey
(https://www.usgs.gov/, accessed on 26 August 2024)
SlopeSlope°30 m
Topographic reliefTRm30 m
Mean annual temperatureTEM°C1 kmNational Earth System Science Data Center
(http://www.geodata.cn, accessed on 26 August 2024)
Annual precipitationPREmm1 km
Potential evapotranspirationPETmm1 km
Relative humidityRH%1 km
Sunshine hoursSHh1 km
Anthropogenic factorsHuman footprintHF/1 kmhttps://doi.org/10.6084/m9.figshare.16571064, accessed on 26 August 2024
Greenhouse gasesCO2 0.1°Emissions Database for Global Atmospheric Research (EDGAR)
(https://edgar.jrc.ec.europa.eu/, accessed on 26 August 2024)
CH4ton0.1°
N2O 0.1°
Table 2. NPP change trend statistics.
SNPPZ ValueNPP Change TrendArea Proportion/%
<0<−1.96Significantly degrade0.16
−1.96–1.96Slightly degrade0.26
=0−1.96–1.96Stable13.17
>0−1.96–1.96Slightly improve16.39
>1.96Significantly improve70.02
Table 3. NPP Future Trends Statistics.
SNPPHurst IndexNPP Future Trend ChangeArea Proportion/%
>0>0.5Continuous increase17.58
<0>0.5Continuous decrease0.68
>0<0.5Increase to decrease80.57
<0<0.5Decrease to increase1.17
Disclaimer/Publisher’s Note: The statements, opinions and data contained in all publications are solely those of the individual author(s) and contributor(s) and not of MDPI and/or the editor(s). MDPI and/or the editor(s) disclaim responsibility for any injury to people or property resulting from any ideas, methods, instructions or products referred to in the content.