Article

Spatial Consistency and Accuracy Analysis of Multi-Source Land Cover Products on the Southeastern Tibetan Plateau, China

1
Key Laboratory of Land Surface Pattern and Simulation, Institute of Geographic Sciences and Natural Resources Research, Chinese Academy of Sciences, Beijing 100101, China
2
College of Resources and Environment, University of Chinese Academy of Sciences, Beijing 100049, China
3
School of Computer and Information Engineering, Xiamen University of Technology, Xiamen 361024, China
*
Author to whom correspondence should be addressed.
Remote Sens. 2024, 16(17), 3219; https://doi.org/10.3390/rs16173219
Submission received: 17 June 2024 / Revised: 25 August 2024 / Accepted: 27 August 2024 / Published: 30 August 2024

Abstract

:
Land cover products provide the key inputs for terrestrial change monitoring and modeling. Numerous land cover products have been generated in the past few decades, but their performance on the southeastern Tibetan Plateau remains unclear. This study analyzed 15 land cover products for consistency through compositional similarity and overlay analyses. Additionally, 1305 validation samples from four datasets were employed to construct confusion matrices to evaluate their accuracy. The results indicate the following: (1) Land cover products exhibit relatively high consistency in 62.92% of the region. (2) Land cover products are strongly influenced by terrain fluctuations, showing lower consistency at elevation below 200 m and instability in land cover classification with increasing elevation, particularly between 2800–4400 m and 4800–5400 m. (3) The accuracy for forest, water, and snow/ice is relatively high. However, there is a relatively lower accuracy for wetland and shrubland, necessitating more field samples for reference to improve classification. (4) The average values of the four validation datasets show that the overall accuracy of the 15 products ranges from 50.97% to 73.50%. For broad-scale studies with lower resolution requirements, the CGLS-LC100 product can be considered. For studies requiring a finer scale, a combination of multiple land cover products should be utilized. ESRI is recommended as a reference for built-up land, while FROM-GLC30 can be used for cropland, although misclassification issues should be noted. This study provides valuable insights for analyzing land cover types on plateaus to refine classification. It also offers guidance for selecting suitable land cover products for future research in this region.

1. Introduction

Land cover, defined as the physical characteristics of the Earth’s surface and the near-surface layer shaped by both natural processes and human activities [1], plays an indispensable role in the study of Earth system processes [2]. To meet the increasing demand for comprehensive land cover information in regional and global studies, numerous national research institutions have developed large-scale land cover datasets. For instance, earlier efforts led to the creation of datasets such as IGBP DISCover (1992–1993, 1 km) [3,4], released in 1997 and the University of Maryland’s UMD dataset (1992–1993, 1 km), released in 2000 [5]. With advancements in satellite technology, research methods, and computing platforms, substantial progress has been made in generating global land cover products with higher spatial and temporal resolution, as well as more detailed classification systems. Examples include Globeland30 (2000–2020, every 10 years, 30 m) [6], WorldCover (2020 and 2021, 10 m) [7] and Dynamic World (2020, near real-time, 10 m) [8]. However, the diversity in satellite data sources, classification systems, classification methods, and uncertainties during data processing lead to poor consistency and low accuracy among different products, especially in areas with high heterogeneity [2,9]. Consequently, it is imperative for scientists and resource managers to conduct consistency analysis and accuracy assessment using multi-source land cover products before incorporating them into further research.
Previous studies have extensively examined the reliability of land cover products at global [10,11], continental [12], national [13,14], and regional [15,16] scales. Research methods can be divided into two categories based on whether validation sample points are used. Obtaining validation points is often time-consuming and labor-intensive, especially during large-scale accuracy assessments. Some methods do not require sample points, such as comparing spatial consistency across different products—a commonly used approach. Constructing confusion matrices between pairs of products can also help identify classification differences [14]. Some studies used high-resolution products as references to evaluate the relative accuracy of low-resolution products [13], based on the assumption that products with finer spatial resolution have higher accuracy. Some recently developed land cover products started to provide long time series, and researchers tested their accuracy by assessing whether they can monitor significant land cover changes [2,17,18]. For study focusing solely on certain types of land cover changes (such as croplands [19] or forests [20]), statistical data can also help to assess their performance [21,22]. While these methods can effectively demonstrate the differences among various products, they cannot provide comparative accuracy that indicates the degree of correctness of classification [11,23]. In contrast, calculating confusion matrices based on field samples or visually interpreted samples from high-resolution images can address this shortcoming, and the increasing availability of global shared-point datasets (e.g., GeoWiki and GLCVSS) has made this process easier. However, the accuracy indices derived from confusion matrices can only provide a global estimate of the product, which may be limited when non-stationary error distributions occur or when heteroscedastic residual distributions are present [24]. To address this issue, researchers have attempted to explore the spatial distribution of errors through geostatistical methods [2,25]. However, a more commonly used approach is to combine none-sample data methods with confusion matrices.
The Tibetan Plateau (TP) serves as the ecological security shelter for China and Southeast Asia [26]. Land cover on the TP is increasingly influenced by rapid climate change and growing human activities, which have drawn considerable attention [27]. There is an urgent need for accurate land cover data as foundations for research. Zhao et al. [12] noted confusion among existing products between grassland and bareland on the TP and found that the ESRI product differed significantly from others. Wang et al. [28] analyzed the consistency of three 10 m products in Southwest China (including Xizang Zizhiqu, Sichuan, Yunnan, and Guizhou). They recorded an accuracy range of 40% to 65% and noted that current products do not meet the requirements for rocky desertification studies. A similar study [10] conducted in northwestern China (including Qinghai, Gansu, and Xinjiang Uygur Zizhiqu) found that the complete agreement rate was below 50%, with particularly low accuracy for grassland, bareland, and shrubland. Studies on the western TP [25] have shown overall accuracy ranging from 20% to 60%, with deserts being particularly difficult to identify accurately. Previous data assessments mainly focused on grassland, desert-dominated regions, and cropland [19,29] of the TP. However, the southeastern TP, a global biodiversity hotspot [30] and a key region for China’s forest resources, has lacked sufficient data evaluation. This region has diverse ecosystems, ranging from tropical rainforests to alpine deserts. Due to high altitude and frequent cloud contamination, image quality in this region is poor, and problems such as “same object, different spectrum” and “different objects, same spectrum” are prevalent; therefore, classification uncertainty is high [31]. Meanwhile, due to the difficulty of access caused by rugged terrain, it is challenging to obtain field validation points. Currently, land cover research in this area only focuses on certain regions or particular land cover types of interest [32,33,34]. Therefore, consistency and accuracy analyses of existing land cover products in this region can not only fill the gap in our understanding of the accuracy of land cover products on the plateau, but also provide valuable reference for future detailed land cover studies in this area.
This study aims to evaluate the consistency and reliability of 15 existing land cover products on the southeastern TP, with the following objectives: (1) compare the area differences of various land cover types through compositional similarity analysis, and reveal the spatial performance of the 15 products; (2) evaluate accuracy using three global validation sample sets and visually interpreted/field sampled data, to determine the accuracy of products and individual land cover types based on a confusion matrix; (3) compare product performance across different regions; and (4) discuss uncertainties in these products and provide suggestions for future classification of the southeastern TP.

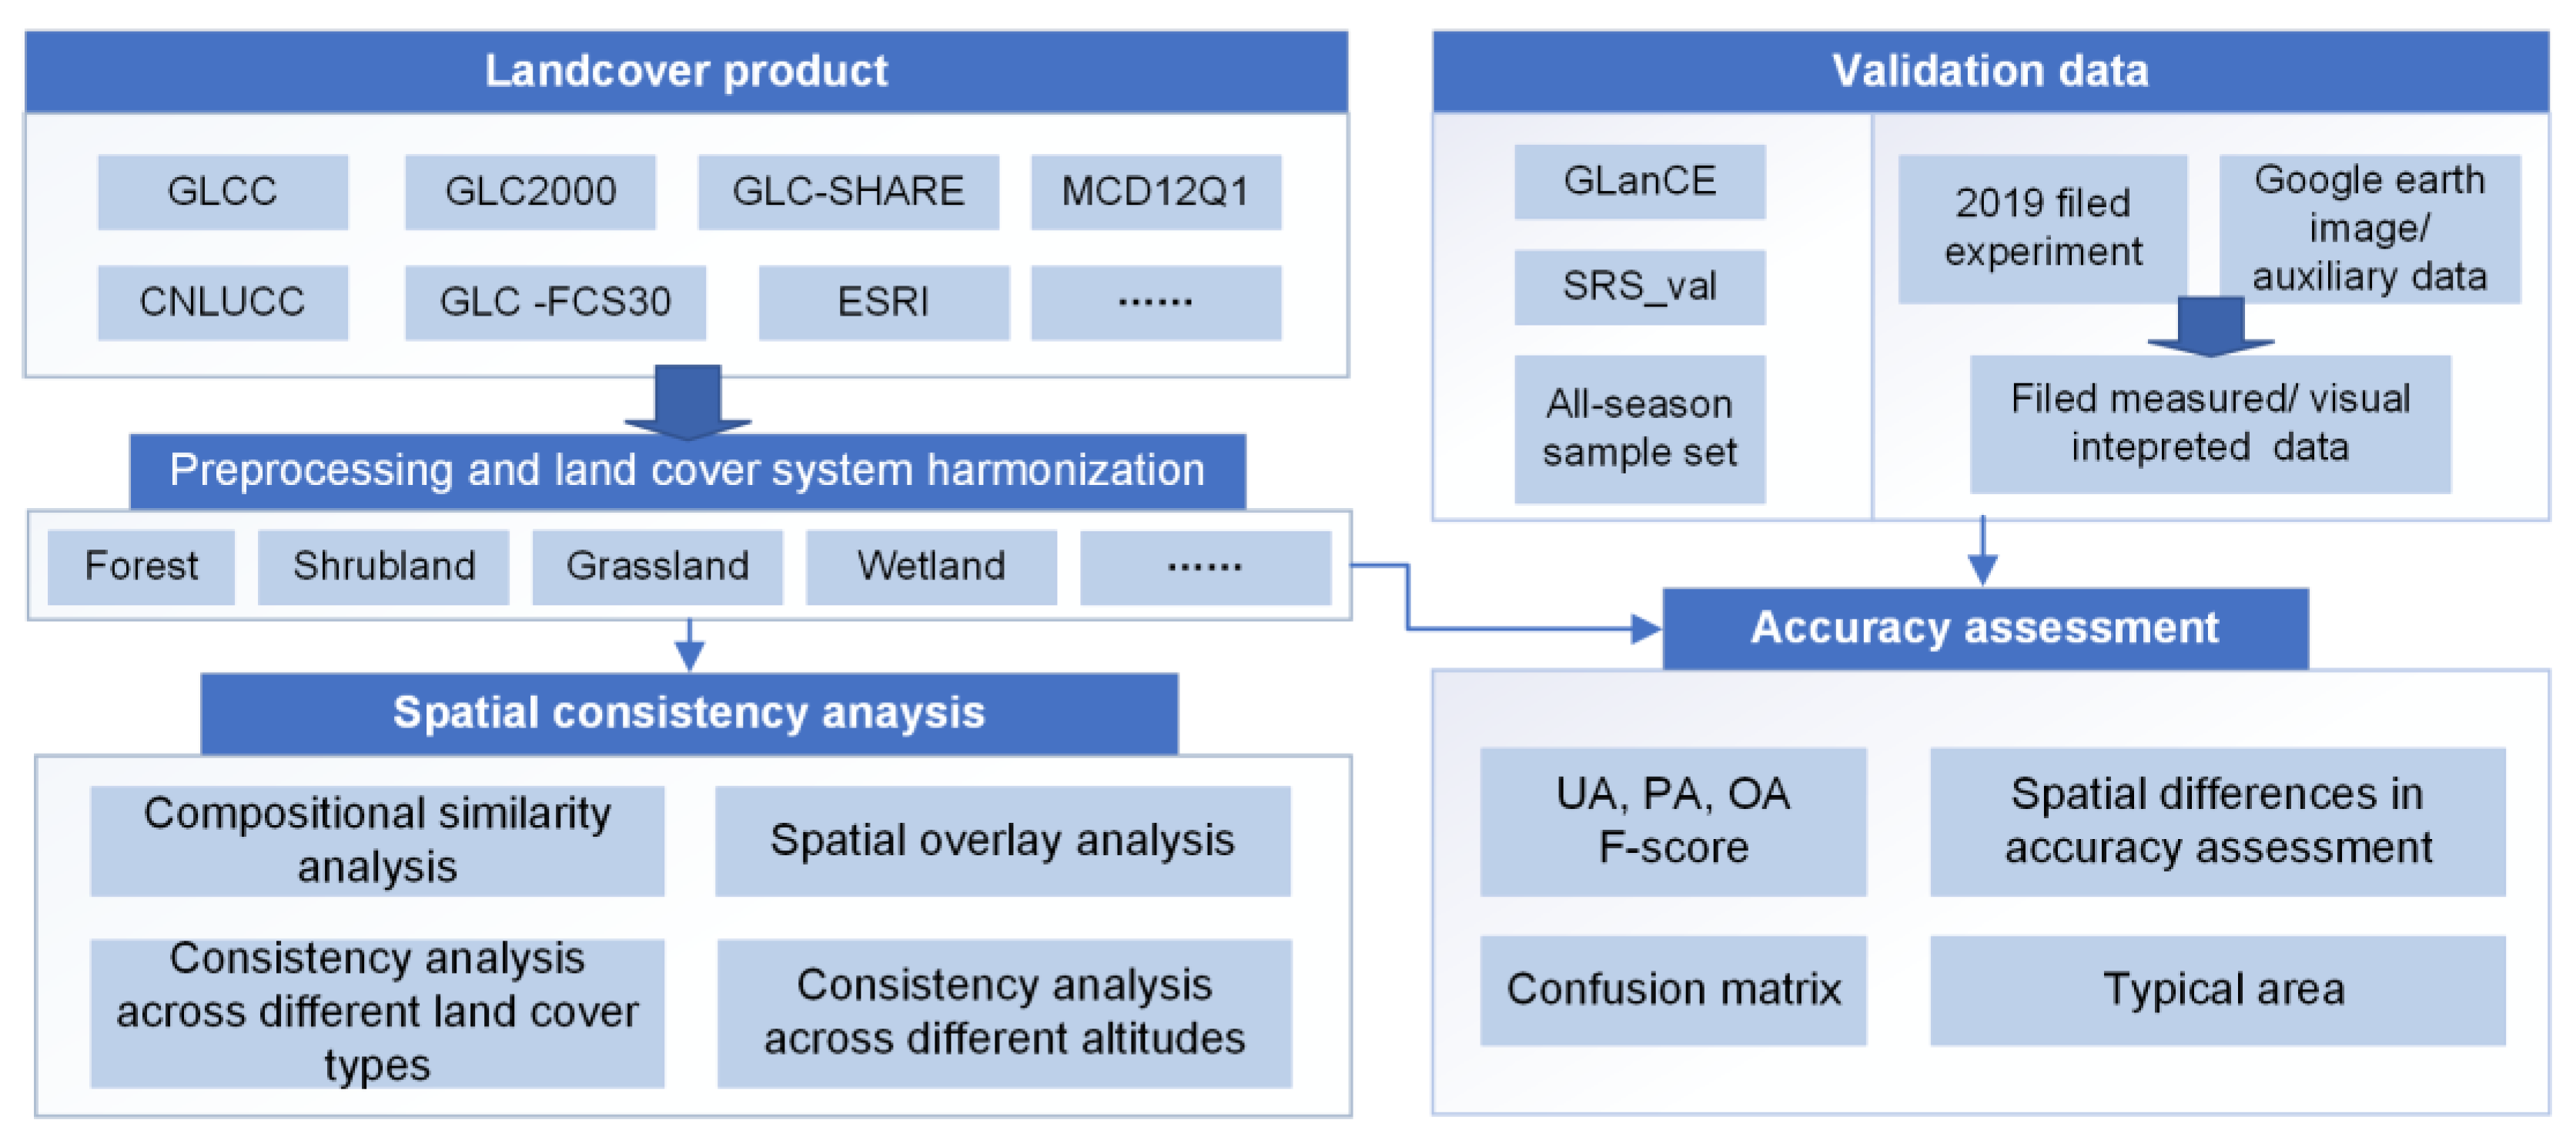
2. Materials and Methods

2.1. Study Area

Our study area included Nyingchi and Shannan prefecture-level cities (Figure 1). This region has the world’s deepest and widest canyon, Yarlung Tsangpo Valley. The altitude in the area varies significantly, from below 100 m in the southern plains of the lower Yarlung Tsangpo River to the highest peak at 7288 m, creating a range of over 7000 m. This area serves as the TP’s largest moisture channel, and due to its topographic conditions, significant north–south hydrothermal differences are observed. The south is humid and rainy, while the north is cold and dry.
These significant hydrothermal differences between the southern and northern regions lead to notable variations in land cover types. In the south, forests dominate, with shrubland, cropland, and built-up land prevalent within valleys. As elevation increases toward the north, the primary land cover transitions from forest and shrubland to grassland, then to bareland and glacial snow. Built-up land, wetland, and cropland are distributed along rivers. It is one of the regions with the highest biodiversity in China.

2.2. Data Source

To provide a clear overview of the data workflow, Figure 2 illustrates the process involved in this study. We first collected and preprocessed the land cover datasets, reclassifying them into nine categories. We then analyzed spatial consistency using compositional similarity and spatial overlay analyses, focusing on elevation and classification consistency. Using confusion matrix analysis on four validation samples, we assessed the overall and type-specific accuracy of the 15 products. Additionally, we examined the substantial differences in classification accuracy between northern and southern regions by analyzing typical grassland and forest areas in each region.

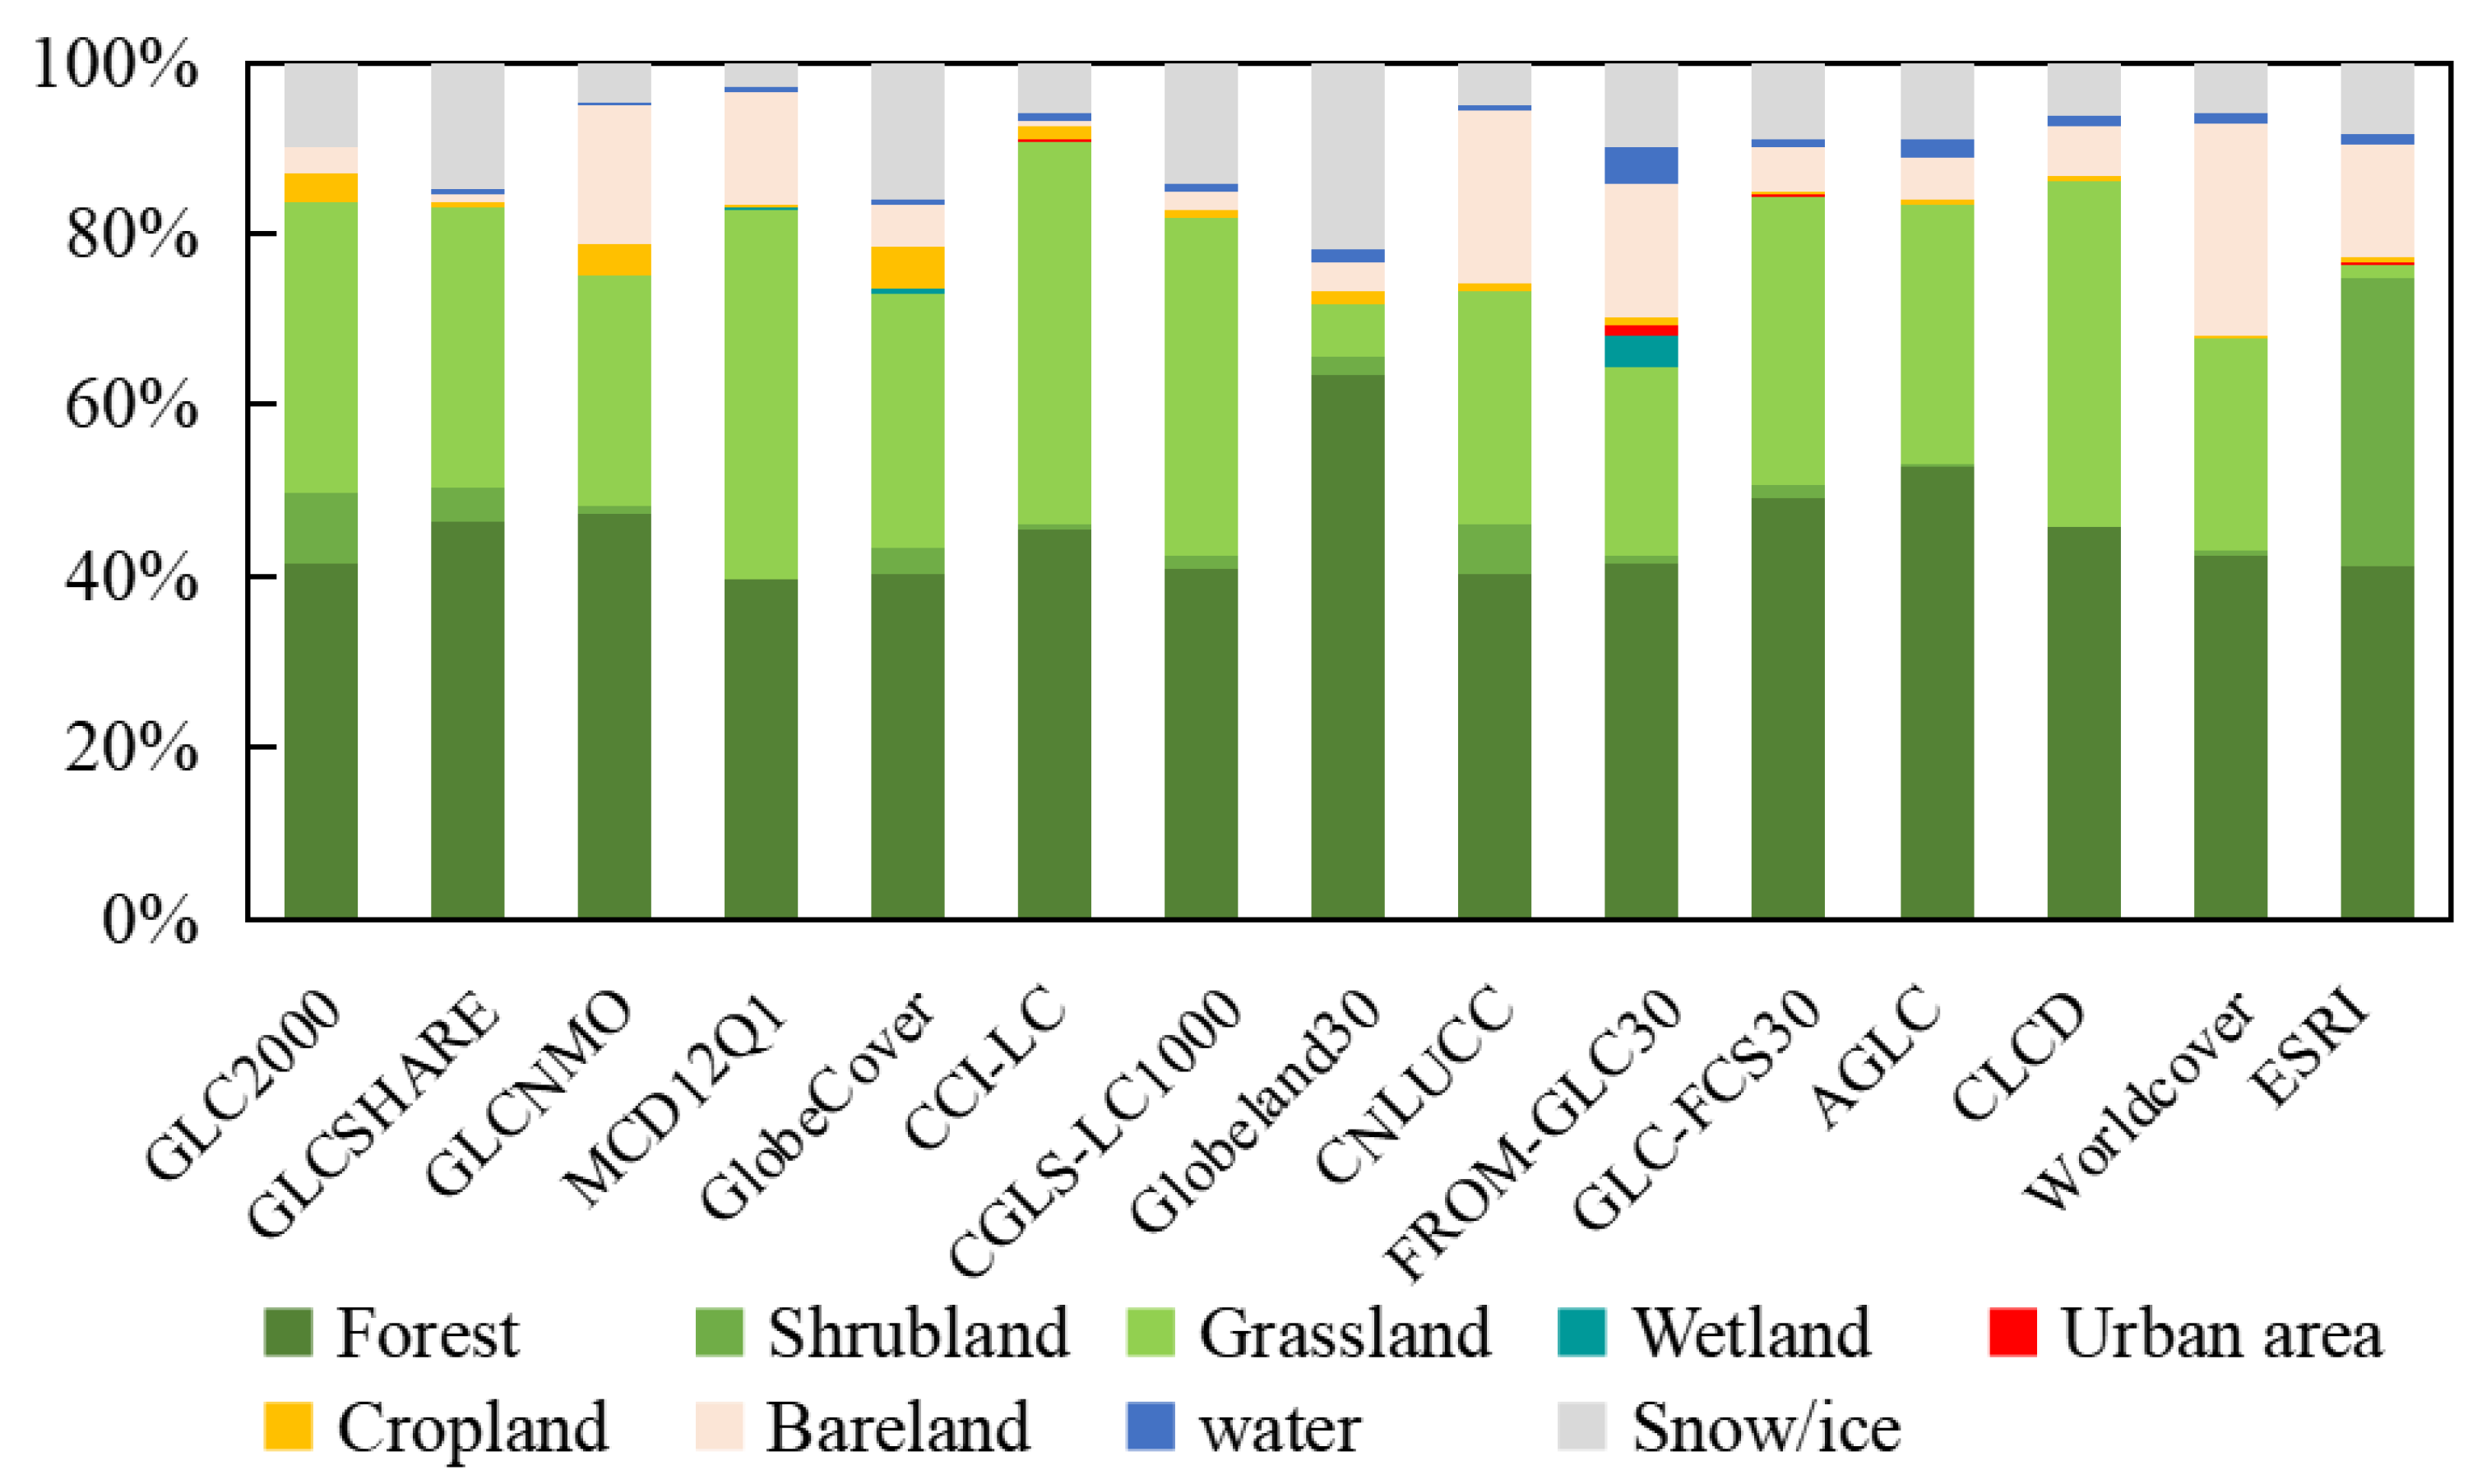
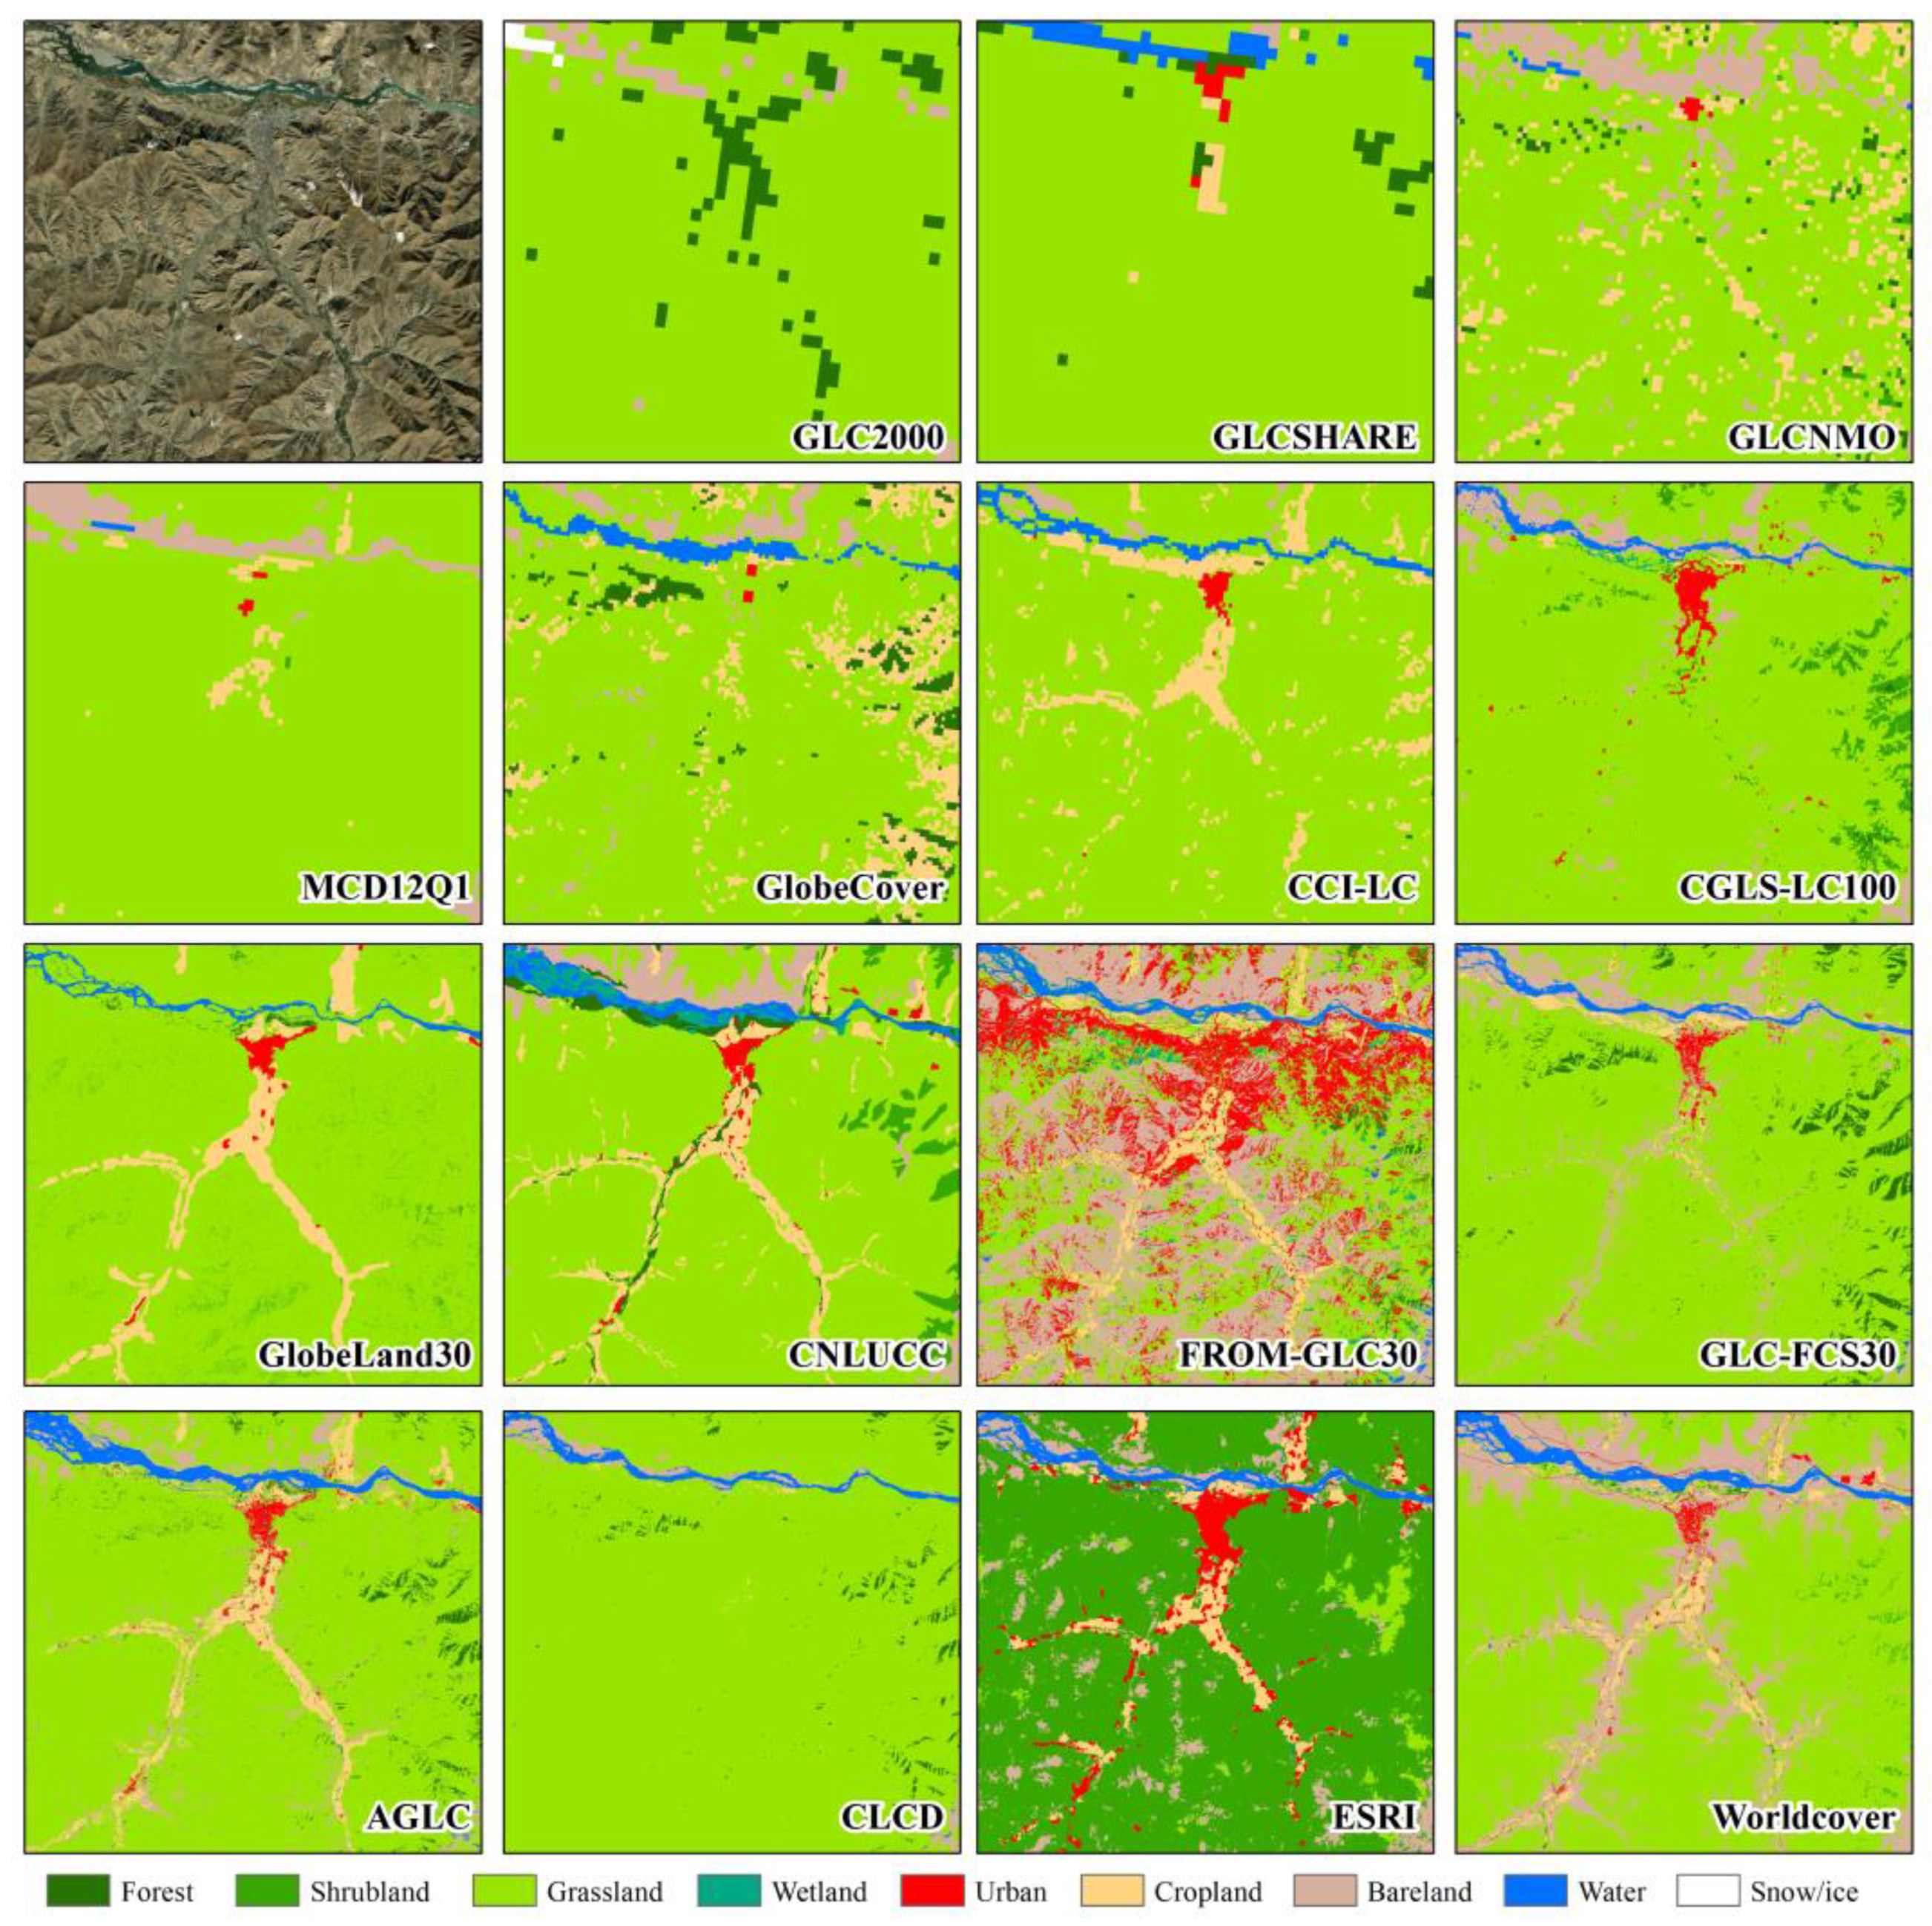
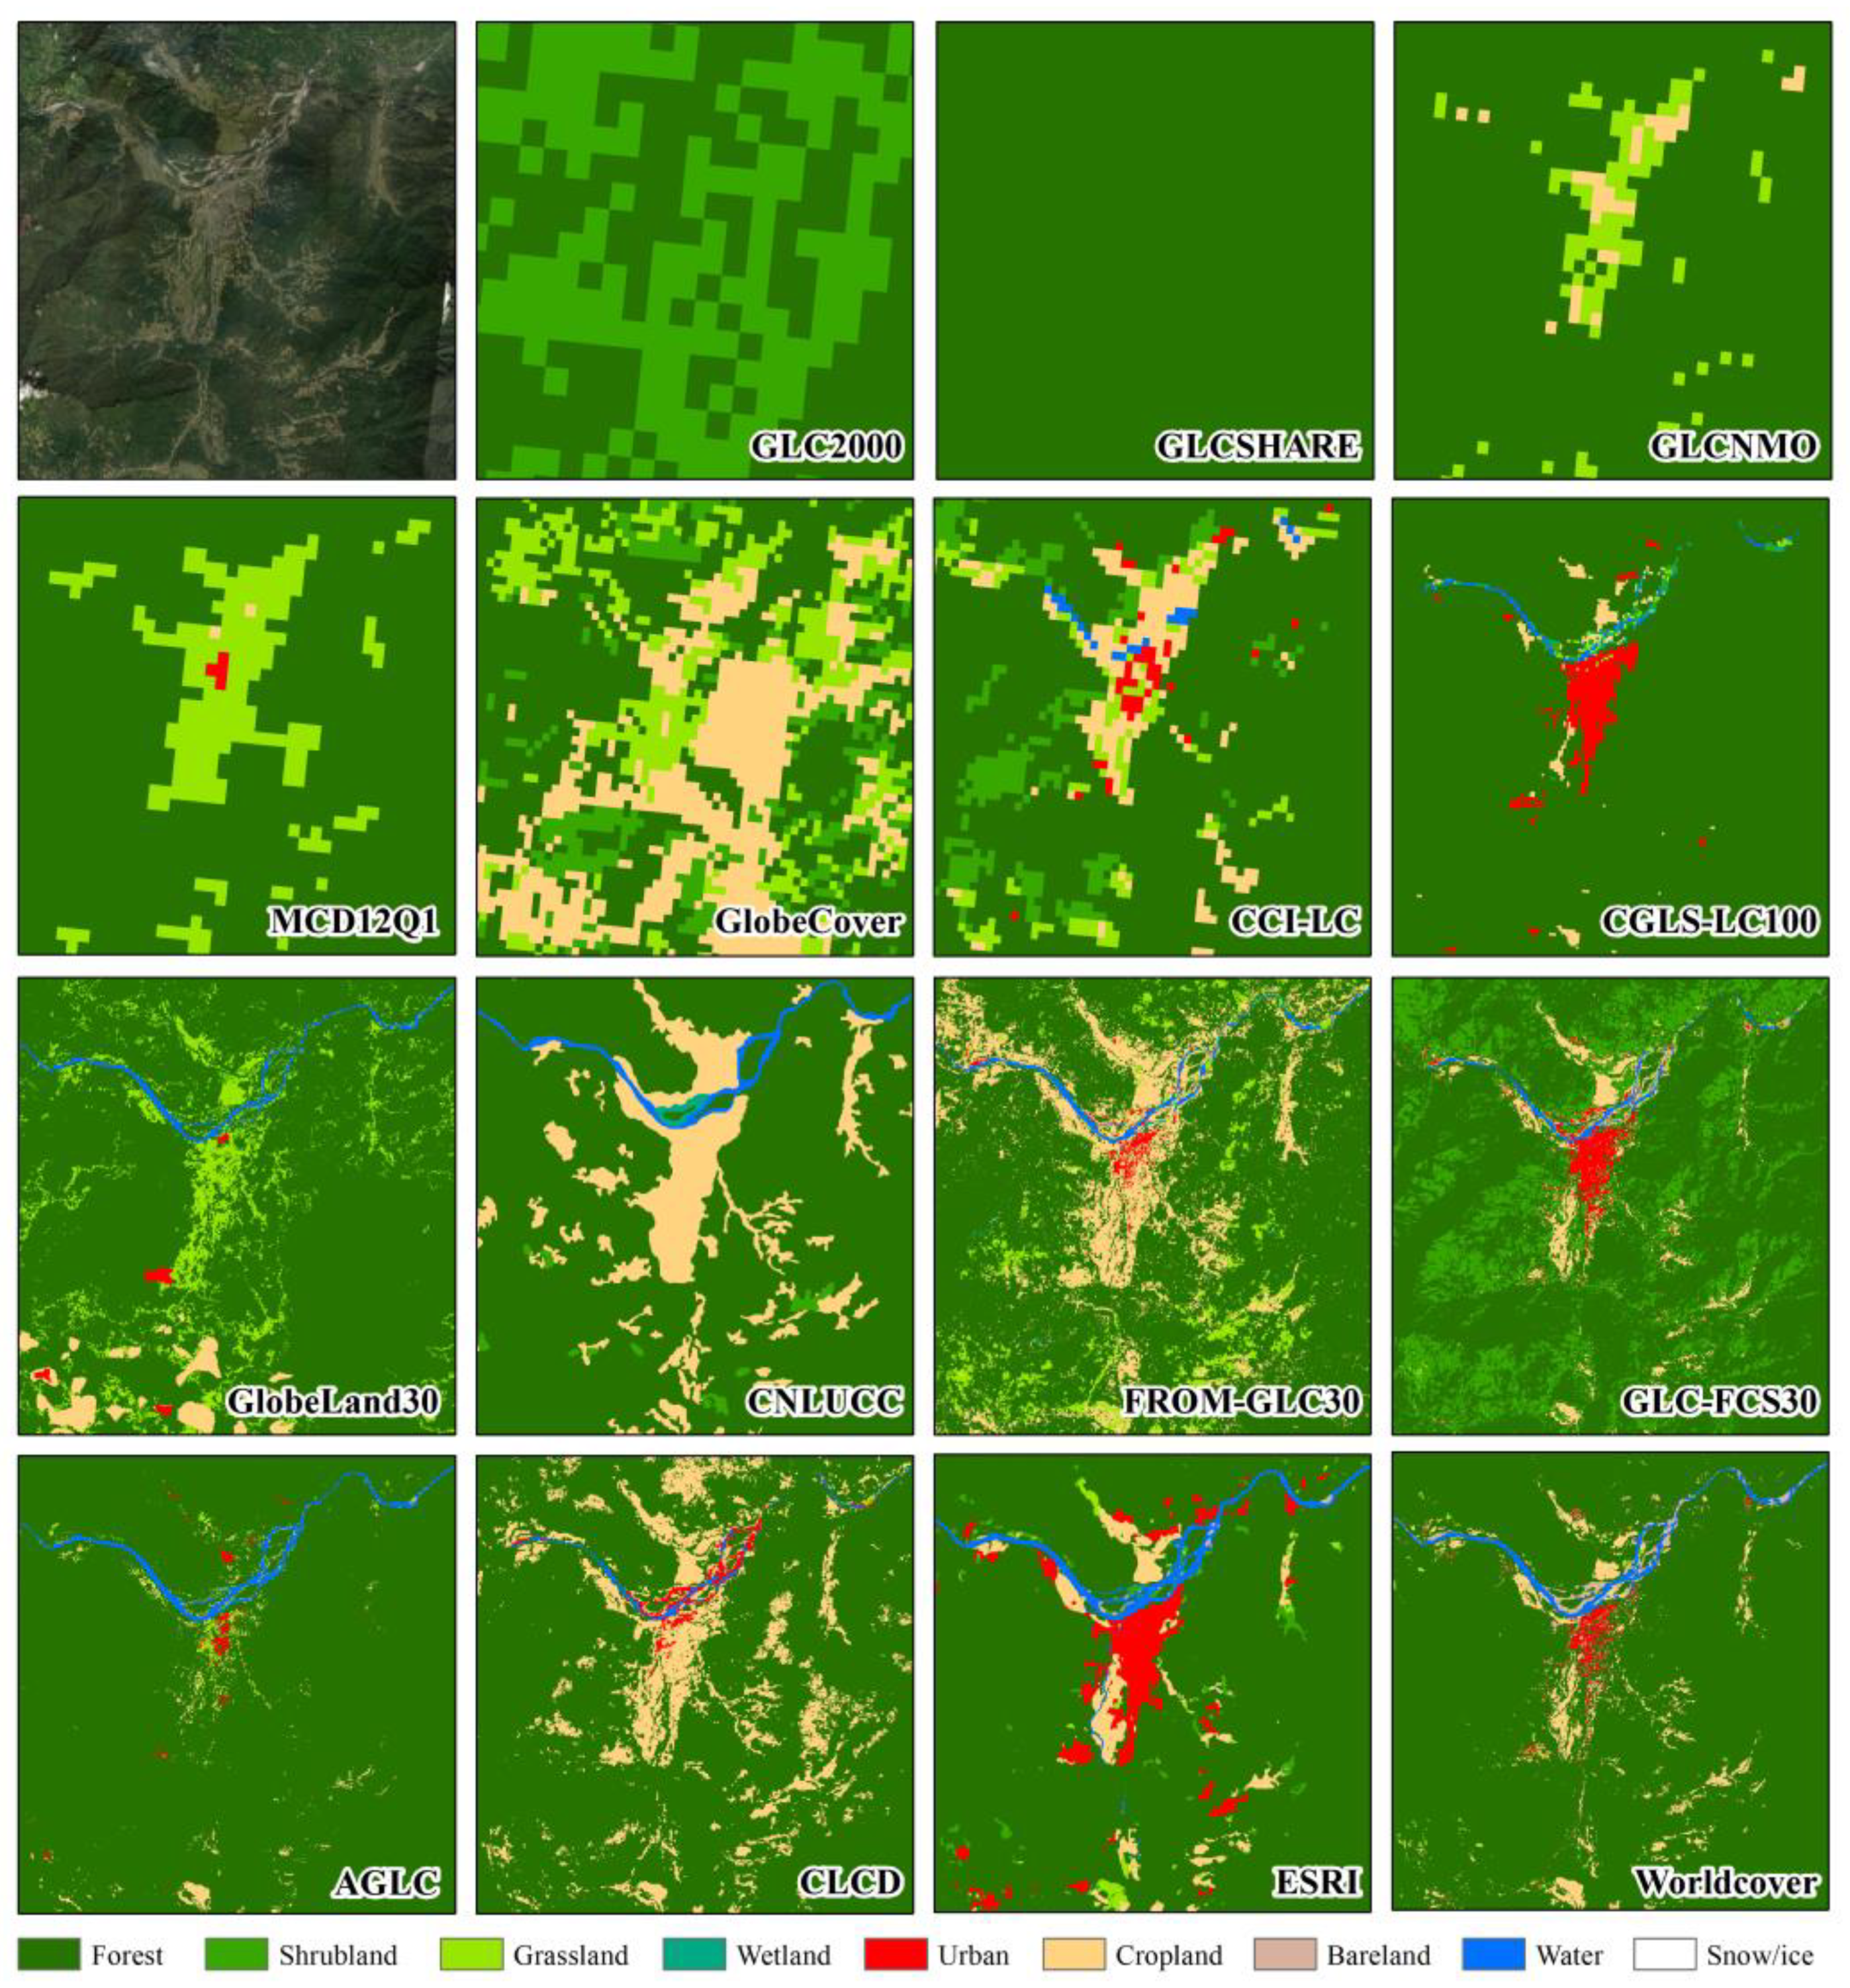
2.2.1. Land Cover Products and Preprocessing

The detailed parameters of the land cover classification products selected for this study are presented in Table 1. For products with multiple years of data, we uniformly utilized the data from 2020, or the nearest available year. The 15 products were merged, clipped, and uniformly projected into Albers equal-area conic projection, with null values removed. To ensure consistency during the analysis, we standardized the resolution of the land cover products. The maximum area aggregation method was employed to upscale the resolution to 1 km. This approach involved sampling the data from fine to coarse resolution and assigning the most frequently occurring type in the input grid to the output grid. For accuracy assessment with validation points, we used the original resolution data, and extracted the corresponding land cover type information at each point location using the nearest neighbor method.
Based on the characteristics of land cover types in this study and the definitions of categories in various products, we merged the categories of 15 land cover products into nine land cover types: forest, shrubland, grassland, wetland, built-up land, cropland, bareland (including sparse vegetation), water, and snow/ice. The merger scheme is shown in Table 2.

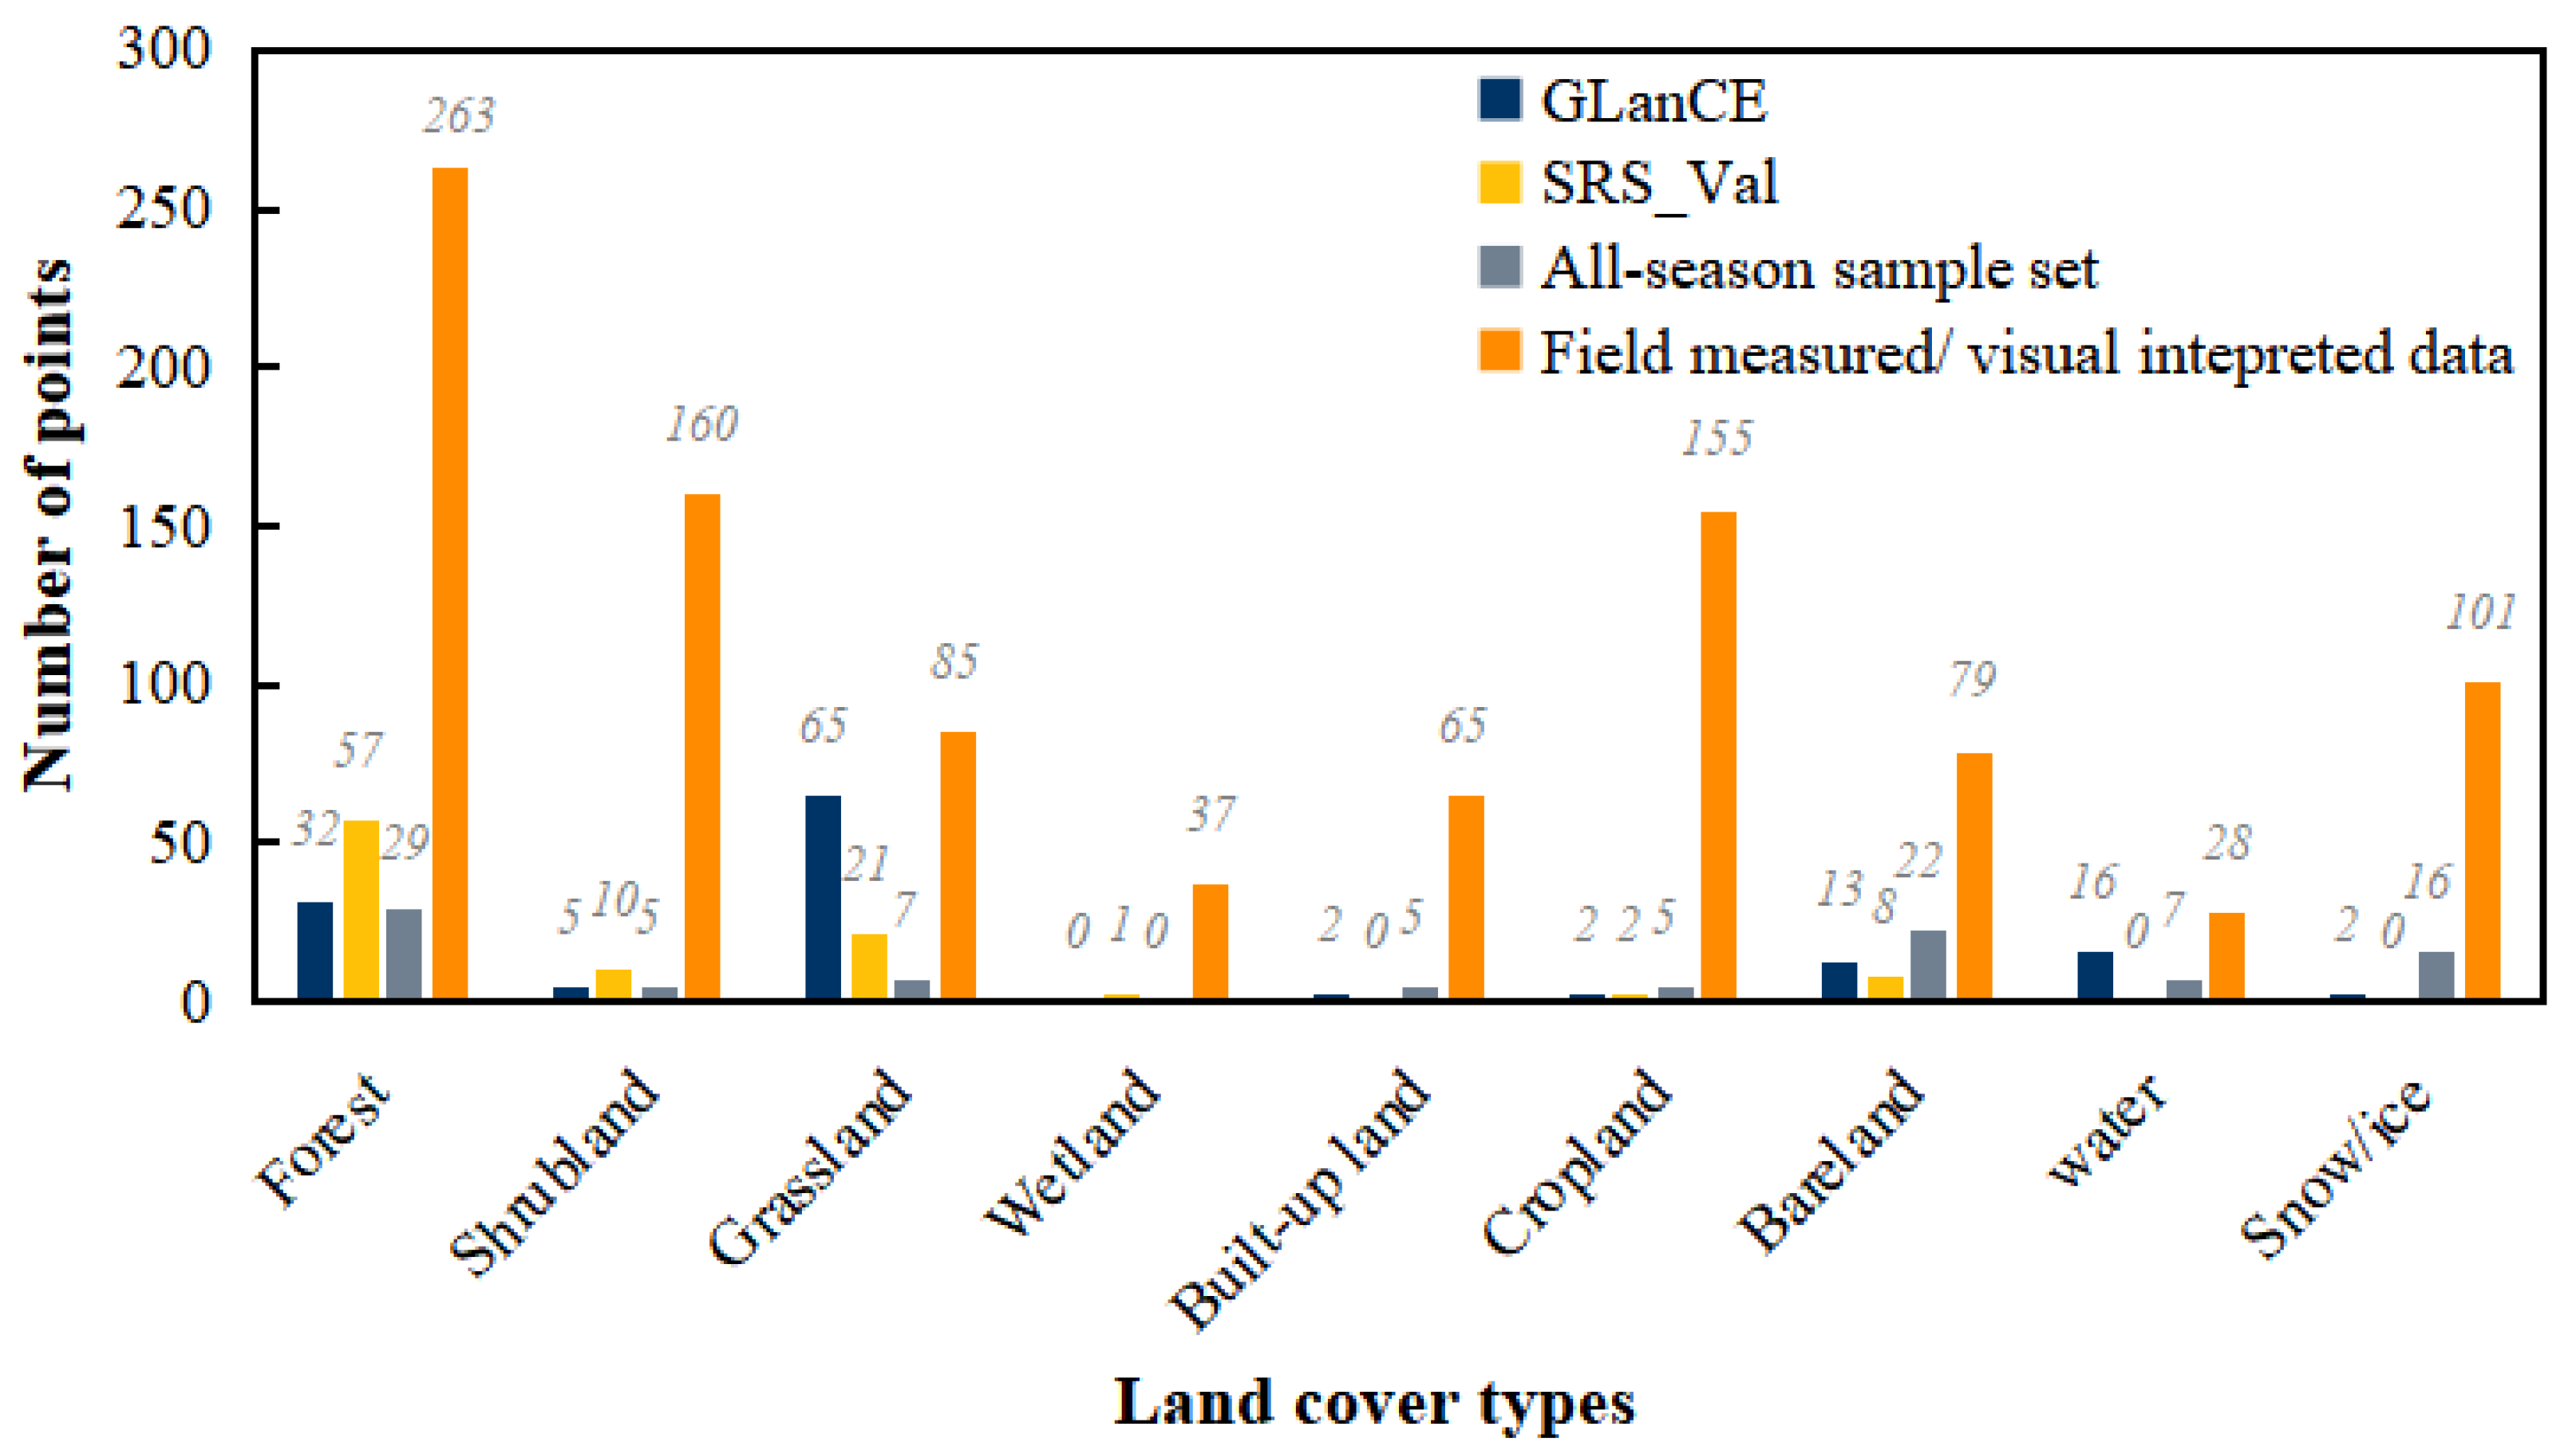
2.2.2. Validation Dataset

In this study, we selected four sets of validation data to verify the accuracy of land cover products:
(1)
GLanCE training sample set [48]: This dataset utilized Google Earth Engine (GEE) and machine learning algorithms, combined with information from existing global land cover sample point datasets, to generate a global training sample dataset. The dataset covers the period from 1984 to 2020, with a spatial resolution of 30 m. It includes seven primary classes and nine secondary classes, providing land cover change information for sample points.
(2)
A dataset based on the stratified equal-area sampling design and the selection of multi-source satellite data for validation samples (SRS_val) [12]: This dataset was collected for the year 2020. An interpretation program was designed to obtain global validation samples by several experts through repeated interpretation using multiple remote sensing images and auxiliary data. It includes 16 land cover types.
(3)
The first all-season sample set for mapping global land cover [49]: This dataset covers Landsat 8 images from 2014 to 2015, interpreted by multiple experts. The samples record spectral reflectance information for each season and provide representative coverage, including both training and validation samples. It consists of 30 secondary classes and 11 primary classes.
(4)
Field-measured samples combined with visual interpretation points: We conducted field surveys in Nyingchi and Shannan in April and May 2019. Primarily using the roadside sampling method, we recorded one sample every 10 km to ensure an even distribution of sampling points. For each sample point, land cover information was recorded in 8 directions to provide spectral information for later point selection. Random sampling was then conducted across the study area, using high-resolution imagery from Google Earth and auxiliary datasets to categorize the sample points. A total of 740 samples were obtained.
For the existing datasets, we visually checked the data using Google Earth images and removed duplicated points, points with heterogeneous land cover types, and points with obvious mistakes. For GLanCE, we manually deleted points to constrain data density. Finally, we obtained 137 points for GLanCE, 99 points for SRS_val, and 96 points for the all-season sample set (Figure 3).

2.3. Methodology

2.3.1. Consistency Analysis

In this study, we first employed compositional similarity analysis to compare the consistency of different land cover types in their respective proportions:
R X Y = k = 1 9 ( X k X ¯ ) ( Y k Y ¯ ) k = 1 9 ( X k X ¯ ) 2 k = 1 9 ( Y k Y ¯ ) 2
where R X Y represents the correlation coefficient between land cover products X and Y for each type proportion (a coefficient closer to 1 indicates a stronger correlation), k denotes the land cover type, X k represents the proportion of type k in product X, and X ¯ denotes the average proportion of each type ( Y k   a n d   Y ¯ have similar meanings).
Subsequently, at the pixel level, the spatial overlay method was employed to further analyze consistency. This method utilizes spatial overlay to establish correspondences between different products on a pixel-by-pixel basis. Consistency is defined as follows: 1–5 indicates low consistency, 6–10 indicates moderate consistency, and 11–15 indicates high consistency.

2.3.2. Accuracy Assessment

Constructing a confusion matrix is the most commonly used method in land cover product assessment, and the main parameters we used include overall accuracy (OA), producer accuracy (PA), user accuracy (UA), and F-score, which represents the balance of PA and UA [50]:
U A = X i i X i +
P A = X i i X + i
O A = i = 1 n X i i N 2
F s c o r e = 2 U . A . ×   P . A . U . A . +   P . A .
where i is the land cover type, X i i refers to the number of points that were correctly classified, X i + refers to the number of points classified as i , and X + i is the actual number of i in the validation data, and N is the total number of validation samples. It is important to note that for land cover types with fewer than 10 samples, PA, UA, and F-score are omitted from the presentation to mitigate potential errors arising from small sample sizes. These metrics were exclusively considered during the calculation of OA and construction of the confusion matrix.

3. Results

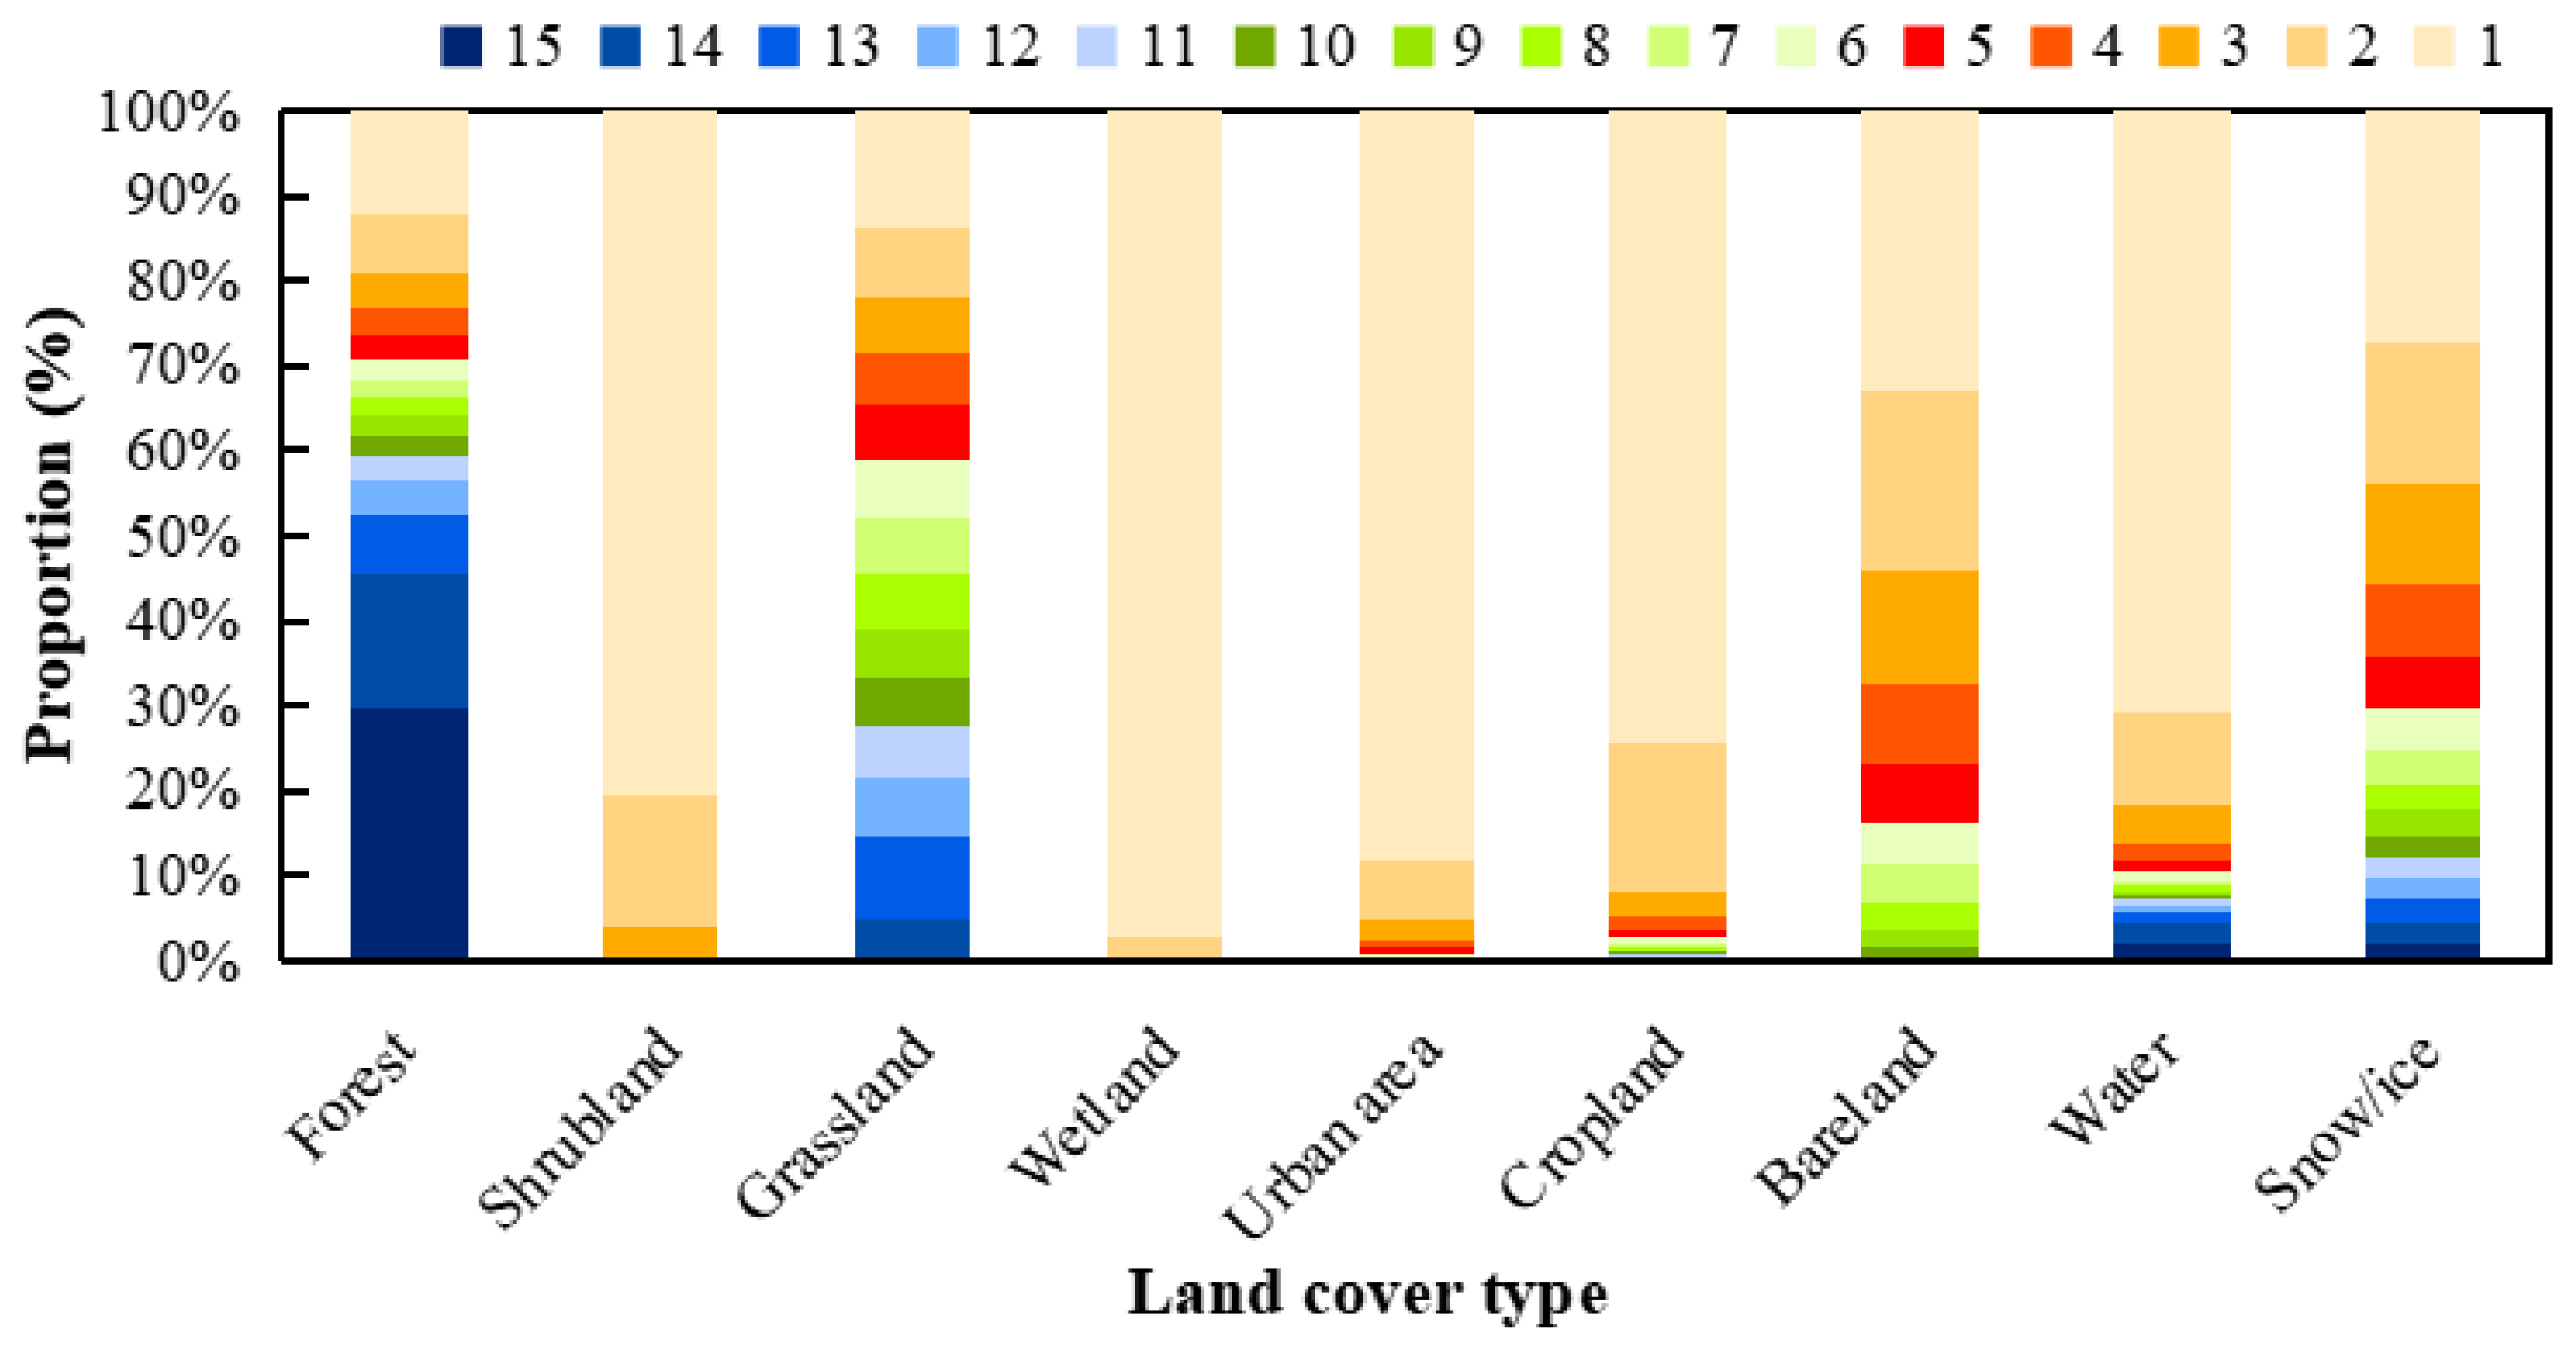
3.1. Data Consistency Analysis

As forests constitute the primary land cover type on the southeastern TP, the proportions obtained from 15 products are relatively consistent, fluctuating around 40%, with only GlobeLand30 exceeding 60% (Figure 4). However, there are significant differences in the proportions of grassland, bareland, and snow/ice. The proportions of water, wetlands, and built-up land are notably higher in the FROM-GLC30 product compared to others.
Through spatial map comparisons, the overall distributions of different land cover products appear to have similar trends, with forests dominating the southeastern part and grasslands dominating the northwestern part (Figure 5). However, differences still exist in certain local regions. For example, compared to other products, the GLC2000, GLCNMO, and GlobeCover classifications show much higher proportions of cropland, as depicted in yellow in Figure 4. The distribution of bareland also varies in the central region of the study area, particularly near snow-covered areas, where some products classify these areas as bareland while others classify them as grassland. In contrast to other products, FROM-GLC30 classifies large areas in the northwest as bareland. Additionally, the proportion of shrubland is notably higher in the ESRI product compared with others. The extent of snow/ice cover also varies, with GLCSHARE, GlobeCover, and GlobeLand30 showing significantly larger distribution areas.
Analyzing the correlation coefficients for the proportions of land cover types among the 15 products, it is observed that all 15 products have correlation coefficients generally above 0.8 (Figure 6). However, ESRI shows lower correlation coefficients compared to the other products, indicating significant discrepancies in land cover proportions. Furthermore, a pixel-by-pixel spatial consistency comparison (Figure 7) among the 15 land cover products reveals that regions with high consistency cover approximately 62.92% of the total area, mainly distributed in the southern and western regions. Moderate consistency areas account for 34.73% of the total area, occurring primarily in transitional land cover regions. In contrast, in regions near the crest line in Shannan and most high-altitude areas of the Yarlung Tsangpo Valley in Nyingchi, the inconsistency of land cover products is notably high (indicated by red and orange in the map for low-consistency areas) (Figure 7).
Analyzing the distribution of product inconsistency with altitude (Figure 8) reveals that in low-altitude areas below 200 m, product consistency is low. Between 200 and 3400 m, consistency grows as altitude increases. In low-altitude areas with strong human activity, land cover is more complex and surface fragmentation greater, which affects classification accuracy [51]. Conversely, in higher altitude regions unsuitable for human development, land cover types are more uniform, resulting in more stable classification results. Between 2800 and 4400 m, spatial inconsistency intensifies as altitude increases. This is attributed to the transitional zones from subalpine coniferous forests to subalpine shrubs and alpine meadows, or from mountain shrub meadows to alpine grasslands. Inconsistency then decreases, with a slight increase again between 4800 and 5400 m. Inconsistency also varies greatly among different land cover types (Figure 9). For instance, shrubland, wetland, built-up land, and cropland exhibit minimal consistency among the 15 classification products, indicating significant spatial differences. Forests, on the other hand, show higher consistency. However, for grassland, bareland, water, and snow cover, there are both areas of consistent classification and many areas with inconsistent classification.

3.2. Result of Accuracy Assessment

Overall, high-resolution land cover products exhibit higher OA compared to medium-resolution land cover products (Figure 10a). Among products with a resolution lower than 100 m, CGLS-LC100 demonstrates higher accuracy across four sample sets. For higher resolution products, outcomes varied depending on the validation sample sets. The products with the highest detected accuracy are CLCD via GLanCE, GLC-FCS30 via SRS_Val, FROM-GLC30 via the all-season sample set, ESRI via visual interpretation and field samples, and Worldcover via the average OA calculated from the four datasets. OA from visual interpretation and field sample point validation is lower than that of the other three products. This is primarily due to the deliberate inclusion of certain error-prone features during our field and visual interpretation point selection, such as shrubland, cropland, and built-up land (Figure 2). The average value of the four datasets shows that the OA of the 15 products ranges between 50.97% and 73.50% (red line in Figure 10a).
We conducted a statistical analysis on the PA and UA for nine land cover types across 15 land cover datasets (Figure 10b,c). It can be observed that for forest, water, and snow/ice, both PA and UA are relatively high. Grassland exhibits higher PA than UA, indicating a prevalent commission error for grassland in the products compared to omission errors. Conversely, UA is higher for cropland, bareland, and built-up land, suggesting a higher incidence of omission errors for these types. Both PA and UA for shrubland and wetland are consistently low across the 15 datasets.
Higher-resolution products generally yield higher overall F-scores across land cover types (Figure 10d–l). They tend to have relatively high classification accuracy for forests, water bodies, and snow/ice. Products with a 30 m resolution can achieve an F-score of around 0.8 for forests. The lower F-score for water in lower-resolution products may be due to narrow water channels not being recognized. Snow/ice typically scores above 0.6. The lowest accuracy is observed for shrubland and wetland, with shrubland scoring below 0.6 and wetland below 0.2. Accuracy for grassland varies notably across datasets, with visual interpretation and field validation generally yielding lower scores due to misclassification, especially where shrubland is mistaken for grassland. The CGLS-LC100 product with a 100 m resolution exhibits a high accuracy for bareland. For built-up land and cropland, only visual interpretation and field validation results are available. For built-up land, ESRI scores the highest, with an F-score exceeding 0.9, and FROM-GLC30 performs better for cultivated land.
As a 10 m land cover product, ESRI provides good classification accuracy for shrubland, built-up land, cropland, bareland, and water. It significantly outperforms other land cover products in accuracy for built-up areas, which can help in selecting samples for subsequent classifications. However, for grasslands, ESRI shows a low classification accuracy across all three datasets, with a producer’s accuracy of only 0.15, indicating that only 15% of grasslands are correctly identified. By comparison, Worldcover has much higher classification accuracy for grassland.
We combined all validation sample sets and analyzed the confusion matrix of the 15 products (Figure 11). The accuracy for forest, water, and glaciers/snow is relatively high. The lower accuracy for glaciers is primarily due to misclassification with surrounding bareland, which is related to the timing of the image selection. One prominent issue across all products is commission error regarding grassland, where bareland, wetland, shrubland, and cropland are often mistakenly classified as grassland. For products with coarser resolutions (see [1,2,3,4,5,6]), forests are prone to misclassification due to resolution issues. Products with coarser resolutions cannot finely depict features such as croplands and built-up areas within forests. Among these coarser-resolution products, CGLS-LC100 has the highest accuracy; however, due to its resolution limitation, its classification accuracy for built-up land and cropland is low, with all wetlands classified as grasslands and confusion between bareland, shrubland, and grassland.
Among products with a 30 m resolution, apart from the grassland misclassification issue, GlobeLand30 misclassified bareland as grassland; CNLUCC tended to misclassify cropland as forests; FROM-GLC30 primarily misclassified shrubland, grassland, and built-up areas as bareland; wetlands in GLCFCS30 were often classified as grassland or cropland; AGLC tended to misclassify shrubland, wetland, built-up land, and cropland as forest; and CLCD had low classification accuracy for built-up land and shrubland. As for products with a 10 m resolution, ESRI’s main issue was the misclassification of grassland, wetlands, cropland, and bareland as shrubland; in particular, 72% of grassland was classified as shrubland, whereas the northern part of the study area is primarily grassland. Some built-up land, grassland, and shrubland were misclassified as bareland in WorldCover, while cropland was easily confused with grassland.

3.3. Differences between Northern and Southern Regions

The crest line divides the study area into northern and southern regions (Figure 1). Land cover types on the northern and southern slopes are significantly influenced by differences in water–heat conditions and terrain. We further analyzed the consistency and accuracy of land cover products on both sides separately. According to the results of the consistency analysis, it can be observed that land cover products have notably higher consistency in the southern region than in the northern region, with high-consistency areas accounting for up to 82.94% (Figure 12). This is because the primary land cover type in the southern region is forest, characterized by steep terrain and significant elevation variations. The distribution of land cover transition zones is narrow, and human activities are mainly concentrated in valley areas. Therefore, less than 20% of the area exhibits low classification accuracy. Conversely, the terrain in the northern region is relatively gentle, with gradual topographical changes and a broader distribution of transition zones. Additionally, there is a wider range of vegetation types that are easily confused during classification. As a result, the proportion of high-consistency areas is lower (52.29%) than in the southern region, while the proportion of areas with moderate consistency is higher. When examining the classification accuracy for the southern and northern slopes specifically, it is evident that overall accuracy is higher for the southern slope compared to the northern slope.
The following is a comparison of 15 land cover products in typical areas of the northern (Figure 13) and southern regions (Figure 14) of the study area. The first area is located near the Yarlung Tsangpo River, characterized by grasslands and shrublands as the primary land cover types, with cropland and built-up areas distributed in gentle river valleys. FROM-GLC30 and ESRI differ significantly from other products. FROM-GLC30 identifies areas classified as grassland that other land cover products classify as built-up areas, while ESRI primarily identifies grassland as shrubland. In comparison, it is more difficult for products with coarser resolution (30 m, 10 m) to identify the characteristics of water bodies, built-up areas, and cropland, which is related to the resolution limitations. Cropland identified in GLCNMO, GlobeCover, and CCI-LC is more dispersed. By comparison, 30 m and 10 m products generally identify built-up land and water more accurately. Built-up land and cropland are missing in CLCD. GLC-FCS30 fails to correctly identify cropland, similarly to CGLS-LC100. Differences in land cover definitions also result in inconsistencies in bareland and shrubland distribution, such as WorldCover categorizing more riverbanks as bareland.
Forests dominate the southern region, with built-up land in the central area surrounded by cropland and shrubland. There was significant inconsistency among the 15 products in identifying built-up land and cropland. Products with coarser resolution have difficulty recognizing detailed information. Among them, CGLS-LC00, similarly to its performance in the northern region, can identify built-up land, but its ability to identify cropland is poor. GlobeLand30 and AGLC fail to identify built-up land and cropland in the central area, while CNLUCC cannot accurately identify built-up land. For fragmented patches in the forest, different products classify them variously as cropland, grassland, or shrubland. Products exhibit varying levels of accuracy in the northern and southern regions. For example, GlobeLand30, AGLC, and CNLUCC provide more detailed information in the northern region but perform poorly in the southern region. Furthermore, pixel-based classification products often contain noise information. Therefore, when conducting land cover analysis in this area, it is advisable to use multiple land cover products to mitigate the limitations of individual products across the entire study area.

4. Discussion

4.1. Factors Causing Low Consistency and Accuracy

On the southeastern TP, land cover products with low consistency account for 37.08%. Several factors contribute to these inconsistencies. Differences in classification schemes are one of the main reasons for the discrepancy [2]. For example, in bareland classification, we made a detailed list of specific land cover types (e.g., bare soil, bare rock, sparse vegetation, mosses, lichen) and merged them into bareland in each product, noting their proportions (Table A1). Regarding the definition of bareland, vegetation cover ranges from 1% to 15%, corresponding to extracted areas ranging from less than 1% (GLCSHARE, fc < 10%; CCI-LC, fc < 15%) to more than 20% (CNLUCC, fc < 5%). Even for products with similar thresholds, such as FROM-GLC30 and GLCSHRE, where both use a vegetation cover threshold of less than 10%, the former accounts for 15.52%, and the latter for 0.81%. In studies of rocky desertification areas in southwestern China, the proportion of bareland varies by as much as a factor of two [28]. On the plateau, bareland is the second largest land cover type after grassland [52]. Adopting a more consistent definition across products would help in understanding land cover changes on the plateau. Theses inconsistencies among classification schemes are not unique to bareland. Unclear definitions between bareland, grassland, and shrubland lead to high inconsistency among them. This issue is prevalent in northwestern [10] and southwestern China [28], the Qiangtang Plateau [25], and Europe [53]. For instance, the definition of shrubland in the ENVI product is unclear, resulting in a much higher proportion of shrubland compared to other land cover products. This issue was also mentioned in a global-scale study by Zhao et al. [29].
Additionally, the quality, timing, and preprocessing of data sources affect the accuracy and consistency of land cover products. The study region serves as a major moisture pathway in Tibet, resulting in frequent and severe cloud contamination, which affects data quality and hinders accurate classification [54]. Differences in sensors, spatial resolution, data processing method, and registration errors can also lead to inconsistencies in classification results. Land cover products vary not only in their acquisition years but also in the season of selected image data, which impacts the classification of land cover types with significant interannual and seasonal variations, such as snow/ice at high altitudes, and water and bareland in the northern Yarlung Tsangpo region.
Complex terrain further exacerbates classification difficulties. Shadows cast by mountains can lead to the same object having different spectral signatures or different objects having similar spectral signatures. Shadows from forests and snow/ice may be misclassified as water bodies. The large variation in altitude in this area and the transitional zone for land cover lead to significant vertical changes, making it prone to misclassification. The terrain significantly fragments the land cover, and past studies have shown that the area of land cover types affects classification accuracy. In the southern part of the study area, shifting smallholder cultivation (specifically jhum) [32] remains the main land use type, and small cropland areas and rapid land use changes cause areas near villages to exhibit strong inconsistency, with a mixture of cropland, shrublands, and forests. Xue et al. [19] found that in regions with widespread croplands on plains, the consistency of different land cover products is higher. In contrast, in southern China, where smallholder farms dominate, cropland areas are small and fragmented, resulting in lower consistency.

4.2. Suggestions for Future Land Cover Classification

It is essential to standardize the classification system and supplement it with field data for classification on the southeastern TP. The applicability of global (or national) products is inevitably affected in local areas [55]. Currently, existing products do not sufficiently describe the distribution of shrubland across the southeastern TP. Shrubland is a transitional land cover type, situated not only between grassland and forest, but also between areas of high and low human activity. Many secondary shrubland areas result from human activities such as deforestation and cropland abandonment. Shrubland on the southeastern TP is often confused with cropland, grasslands, wetland, and bareland. Our field samples demonstrate the difficulty in correctly identifying shrubland with land cover products (Table 3). For example, rose shrubs often exist on the edges of forests and are prone to be confused with forests and grasslands (point 1). Shrubs in low-altitude areas, such as Cotoneaster shrubs (point 3) and Caragana shrubs (point 4), have low coverage and are easily classified as grassland or bareland. Even though rhododendron shrubs in high-altitude areas have high coverage, their small size, which allows them to adapt to the harsh environment at high altitudes, makes them easily classified as grasslands (point 2). Therefore, when utilizing land cover products or engaging in reclassification on the study area, it is advisable to collect field sampling points to understand their spectral characteristics and use auxiliary information (such as water–heat conditions, terrain information, vegetation type maps) to revise/reclassify shrubland.
Considering the issue of misclassification between bareland, grassland, and shrubland, future classification studies should further incorporate time series data into classification models. This is especially important in mountainous and cloudy regions, where integrating multi-source remote sensing information (MODIS, Landsat, Sentinel) into time series data can help address data gaps. Additionally, low classification accuracy was found for highland wetlands in this study. A previous study found that the OA of wetland in China was only 32% [56]. Due to the widespread distribution of cropland near water bodies, the transition between wetland and cropland is narrow, making it difficult to distinguish [57], while optical and thermal data may not well capture water under vegetation, thus the derived wetland area will be less than the actual condition [56]. In addition, these global/national scale products may not obtain enough samples of wetlands on the plateau [2]. In the future, attempts can be made to incorporate seasonal information, radar data, and field samples to distinguish wetland from other land cover types.

4.3. Shortcomings and Prospects of This Study

The quantity and quality of validation sample points affect the evaluation results. Our field surveys and Google Earth imagery selection emphasized certain types deemed important, such as built-up land and cropland associated with human activities, as well as wetland and shrubland, which are challenging to classify accurately. Globally shared datasets have limited sample points, especially for types with smaller areas, leading to insufficient sample sizes. Future studies should employ more scientific sampling methods to validate product accuracy. The quality of the samples can also introduce errors in the validation of land cover product accuracy. Although we manually checked all sample points for four validation datasets, it is difficult to guarantee that the selected sample points remain homogeneous beyond a range of 100 m, especially for cropland and built-up land in this sparsely populated area. This may have resulted in a lower OA for products with a low resolution during our assessment. The study compared the primary types of land cover products, while the classification systems of some products contain secondary classes that were not discussed. Further research is needed to obtain finer validation samples for accuracy assessment. Additionally, in the future, we will attempt to use methods such as graphically weighted regression to spatially express the errors and explore the differences in errors caused by the north-south variations.

5. Conclusions

In this study, we conducted accuracy assessments and consistency analyses of 15 land cover products on the southeastern TP. Although the product consistency seems relatively high (62.9% for high consistency), the assessment was mainly concentrated in the southern part of the study area, which is mainly covered by forest. Using four sample sets for the accuracy assessment, we found a relatively high accuracy for forests, while in the northern region, due to the misclassification of grassland as other land cover types, the products’ consistency and accuracy were low. The classification systems of existing land cover products are designed for global research. However, the uniqueness of vegetation on the southeastern TP results in significant differences between products when defining land cover types. The accuracy for related land cover types (bareland, grassland, shrubland) was relatively low. Therefore, it is necessary to incorporate more field survey points in future studies to assist with classification, especially in wetland and shrubland areas. Given the extensive geographical expanse and sparse human population in mountainous areas, coupled with their rugged terrain, the distribution of land cover types is profoundly impacted by human activities (i.e., built-up land, cropland) and appears fragmented, yielding lower classification accuracy. Thus, it is suggested that revisions be undertaken by integrating datasets from ESRI, FROM-GLC30, and other products or by engaging in more nuanced classification endeavors. The findings of this research can serve as a reference for land cover classification studies of the southeastern TP and surrounding areas.

Author Contributions

Conceptualization, funding acquisition, project administration, supervision, Y.Z.; Formal analysis, writing—original draft, methodology, B.Z.; Visualization, B.Z. and B.W.; Writing—review and editing, L.L. (Linshan, Liu), L.L. (Lanhui, Li) and D.G. All authors have read and agreed to the published version of the manuscript.

Funding

The study was funded by the Second Tibetan Plateau Scientific Expedition and Research (Grant No. 2019QZKK0603) and the National Science Foundation of China (Grant No. 42101099).

Data Availability Statement

No new data were created or analyzed in this study. Data sharing is not applicable to this article.

Acknowledgments

We thank Jianzhong Yan, Shihai Wu, Changjun Gu, Danhui Liu, Xuemin Xu, Jialihasi Jaynes, Mengke Zule, Lobsang Gyatso, Phuntsok, and Buchung for their kind help during the field experiment on the southeastern TP in 2019.

Conflicts of Interest

The authors declare no conflicts of interest.

Appendix A

Table A1. The definition of bareland and sparsely vegetated land of different land cover data.
ProductValueDescriptionPercentage (%)Total
Percentage (%)
GLC200014The main layer consists of sparse herbaceous vegetation. The crown cover is between (20-10) and 1%. The sparseness of the vegetation may be further specified. // The main layer consists of sparse shrubs. The crown cover is between (20-10) and 1%. The sparseness of the vegetation may be further specified1.863.15
19Primarily non-vegetated areas containing less than 4% vegetation during at least 10 months a year. The environment is influenced by the edaphic substratum. The cover is natural. Included are areas like bare rock and sands1.29
GLC-SHARE8This class includes any geographic areas where the cover of natural vegetation is between 2% and 10%. This includes permanently or regularly flooded areas0.190.81
9This class includes any geographic area dominated by natural abiotic surfaces (bare soil, sand, rocks, etc.) where the natural vegetation is absent or almost absent (covers less than 2%). The class includes areas regularly flooded by inland water (lake shores, river banks, salt flats, etc.). It excludes coastal areas affected by the tidal movement of salt water0.62
GLCNMO10Sparse herbaceous vegetation // sparse woody vegetation15.7716
16Consolidated material(s)0.23
17Unconsolidated material(s)0.00
MCD12Q116At least 60% of area is non-vegetated barren (sand, rock, soil) areas with less than 10% vegetation13.1813.18
GlobeCover150Sparse (<15%) vegetation (woody vegetation, shrubs, grassland)04.84
200Bare areas4.83
CCI-LC140Lichens and mosses-0.65
150Sparse vegetation (tree shrub herbaceous cover) (<15%)0.02
151Sparse tree (<15%)-
152Sparse shrub (<15%)-
153Sparse herbaceous cover (<15%)-
200Bare areas0.6
201Consolidated bare areas0.02
202Unconsolidated bare areas0.01
CGLS-LC10060Lands with exposed soil, sand, or rocks that never have more than 10% vegetated cover at any time of the year.11.5311.53
100Moss and lichen0
Globeland3070covered by lichens, mosses, perennial cold-resistant herbaceous plants, and shrubs in cold and high-altitude environments, including shrub tundra, graminoid tundra, wetland tundra, alpine tundra, and bare-ground tundra.-2.36
90Natural land cover with vegetation coverage of less than 10%, including deserts, sandy areas, gravel lands, bare rocks, saline-alkali lands, etc.2.36
CNLUCC61Sand area refers to land surface covered by sand, with vegetation coverage below 5%, including deserts, but excluding sand deserts within water systems.0.1920.16
62Gobi refers to land surface predominantly covered by gravel stones, with vegetation coverage below 5%.-
63Saline-alkali land refers to land where salts and alkalis accumulate on the surface, vegetation is sparse, and only highly salt-tolerant plants can grow0.02
65Bareland refers to land surface covered by soil, with vegetation coverage below 5%-
66Bareland refers to land surface covered by rocks or pebbles, with vegetation coverage below 5%19.95
FROM-GLC309Bareland. Vegetation cover < 10%15.5215.52
GLC-FC30140Lichens and mosses-5.12
150Sparse vegetation (fc < 15%)0.01
152Sparse shrubland (fc < 15%)-
153Sparse herbaceous (fc < 15%)-
200Bare areas5.1
201Consolidated bare areas0
202Unconsolidated bare areas0
AGLC70Tundra refers to low-lying vegetation outside the tree line in a high-cold climate environment, covered by lichens, mosses, perennial grasses, and small shrubs. It includes shrub tundra, graminoid tundra, wetland tundra, bare-ground tundra, and mixed tundra0.054.93
90Bareland refers to land with vegetation coverage below 10%, including deserts, sandy areas, gravel lands, bare rocks, saline-alkali lands, and biological crusts4.88
CLCD7-5.885.88
ESRI8Areas of rock or soil with very sparse to no vegetation for the entire year; large areas of sand and desert with no to little vegetation; examples: exposed rock or soil, desert and sand dunes, dry salt flats/pans, dried lake beds, mines13.0813.08
Worldcover60Bare/sparse vegetation. Lands with exposed soil, sand, or rocks and never more than 10% vegetated cover at any time of the year10.5224.64
100Moss and lichen. Land covered with lichens and/or mosses. Lichens are composite organisms formed from the symbiotic association of fungi and algae. Mosses contain photo-autotrophic land plants without true leaves, stems, or roots but with leaf-and stemlike organs14.12

References

  1. Riebsame, W.E.; Meyer, W.B.; Turner, B.L. Modeling land use and cover as part of global environmental change. Clim. Chang. 1994, 28, 45–64. [Google Scholar] [CrossRef]
  2. Yang, Y.; Xiao, P.; Feng, X.; Li, H. Accuracy assessment of seven global land cover datasets over China. ISPRS J. Photogramm. Remote Sens. 2017, 125, 156–173. [Google Scholar] [CrossRef]
  3. Loveland, T.R.; Belward, A.S. The IGBP-DIS global 1 km land cover data set, DISCover: First results. Int. J. Remote Sens. 1997, 18, 3289–3295. [Google Scholar] [CrossRef]
  4. Loveland, T.R.; Reed, B.C.; Brown, J.F.; Ohlen, D.O.; Zhu, Z.; Yang, L.; Merchant, J.W. Development of a global land cover characteristics database and IGBP DISCover from 1 km AVHRR data. Int. J. Remote Sens. 2000, 21, 1303–1330. [Google Scholar] [CrossRef]
  5. Hansen, M.C.; Defries, R.S.; Townshend, J.R.G.; Sohlberg, R. Global land cover classification at 1 km spatial resolution using a classification tree approach. Int. J. Remote Sens. 2000, 21, 1331–1364. [Google Scholar] [CrossRef]
  6. Chen, J.; Chen, J.; Liao, A.; Cao, X.; Chen, L.; Chen, X.; He, C.; Han, G.; Peng, S.; Lu, M.; et al. Global land cover mapping at 30m resolution: A POK-based operational approach. ISPRS J. Photogramm. Remote Sens. 2015, 103, 7–27. [Google Scholar] [CrossRef]
  7. Zanaga, D.; Van De Kerchove, R.; De Keersmaecker, W.; Souverijns, N.; Brockmann, C.; Quast, R.; Wevers, J.; Grosu, A.; Paccini, A.; Vergnaud, S.; et al. ESA WorldCover 10 m 2020 v100. Available online: https://doi.org/10.5281/zenodo.5571936 (accessed on 24 May 2024).
  8. Brown, C.F.; Brumby, S.P.; Guzder-Williams, B.; Birch, T.; Hyde, S.B.; Mazzariello, J.; Czerwinski, W.; Pasquarella, V.J.; Haertel, R.; Ilyushchenko, S.; et al. Dynamic World, Near real-time global 10 m land use land cover mapping. Sci. Data 2022, 9, 251. [Google Scholar] [CrossRef]
  9. Hua, T.; Zhao, W.; Liu, Y.; Wang, S.; Yang, S. Spatial Consistency Assessments for Global Land-Cover Datasets: A Comparison among GLC2000, CCI LC, MCD12, GLOBCOVER and GLCNMO. Remote Sens. 2018, 10, 1846. [Google Scholar] [CrossRef]
  10. Liu, L.; Zhang, X.; Gao, Y.; Chen, X.; Shuai, X.; Mi, J. Finer-Resolution Mapping of Global Land Cover: Recent Developments, Consistency Analysis, and Prospects. J. Remote Sens. 2021, 2021, 5289697. [Google Scholar] [CrossRef]
  11. Tsendbazar, N.E.; de Bruin, S.; Mora, B.; Schouten, L.; Herold, M. Comparative assessment of thematic accuracy of GLC maps for specific applications using existing reference data. Int. J. Appl. Earth Obs. Geoinf. 2016, 44, 124–135. [Google Scholar] [CrossRef]
  12. Zhao, T.; Zhang, X.; Gao, Y.; Mi, J.; Liu, W.; Wang, J.; Jiang, M.; Liu, L. Assessing the Accuracy and Consistency of Six Fine-Resolution Global Land Cover Products Using a Novel Stratified Random Sampling Validation Dataset. Remote Sens. 2023, 15, 2285. [Google Scholar] [CrossRef]
  13. Ran, Y.; Li, X.; Lu, L. Evaluation of four remote sensing based land cover products over China. Int. J. Remote Sens. 2010, 31, 391–401. [Google Scholar] [CrossRef]
  14. Kaptué Tchuenté, A.T.; Roujean, J.; De Jong, S.M. Comparison and relative quality assessment of the GLC2000, GLOBCOVER, MODIS and ECOCLIMAP land cover data sets at the African continental scale. Int. J. Appl. Earth Obs. Geoinf. 2011, 13, 207–219. [Google Scholar] [CrossRef]
  15. Frey, K.E.; Smith, L.C. How well do we know northern land cover? Comparison of four global vegetation and wetland products with a new ground-truth database for West Siberia. Glob. Biogeochem. Cycles 2007, 21, GB1016. [Google Scholar] [CrossRef]
  16. Kuenzer, C.; Leinenkugel, P.; Vollmuth, M.; Dech, S. Comparing global land-cover products—Implications for geoscience applications: An investigation for the trans-boundary Mekong Basin. Int. J. Remote Sens. 2014, 35, 2752–2779. [Google Scholar] [CrossRef]
  17. Sun, W.; Ding, X.; Su, J.; Mu, X.; Zhang, Y.; Gao, P.; Zhao, G. Land use and cover changes on the Loess Plateau: A comparison of six global or national land use and cover datasets. Land Use Policy 2022, 119, 106165. [Google Scholar] [CrossRef]
  18. Zhai, J.; Xiao, C.; Feng, Z.; Liu, Y. Are there suitable global datasets for monitoring of land use and land cover in the tropics? Evidences from mainland Southeast Asia. Glob. Planet. Chang. 2023, 229, 104233. [Google Scholar] [CrossRef]
  19. Xue, J.; Zhang, X.; Chen, S.; Hu, B.; Wang, N.; Shi, Z. Quantifying the agreement and accuracy characteristics of four satellite-based LULC products for cropland classification in China. J. Integr. Agric. 2024, 23, 283–297. [Google Scholar] [CrossRef]
  20. Xing, H.; Niu, J.; Liu, C.; Chen, B.; Yang, S.; Hou, D.; Zhu, L.; Hao, W.; Li, C. Consistency Analysis and Accuracy Assessment of Eight Global Forest Datasets over Myanmar. Appl. Sci. 2021, 21, 11348. [Google Scholar] [CrossRef]
  21. Bai, Y.; Feng, M.; Jiang, H.; Wang, J.; Zhu, Y.; Liu, Y. Assessing Consistency of Five Global Land Cover Data Sets in China. Remote Sens. 2014, 6, 8739–8759. [Google Scholar] [CrossRef]
  22. Pérez-Hoyos, A.; Rembold, F.; Kerdiles, H.; Gallego, J. Comparison of Global Land Cover Datasets for Cropland Monitoring. Remote Sens. 2017, 9, 1118. [Google Scholar] [CrossRef]
  23. Foody, G.M. Status of land cover classification accuracy assessment. Remote Sens. Environ. 2002, 80, 185–201. [Google Scholar] [CrossRef]
  24. Comber, A.; Fisher, P.; Brunsdon, C.; Khmag, A. Spatial analysis of remote sensing image classification accuracy. Remote Sens. Environ. 2012, 127, 237–246. [Google Scholar] [CrossRef]
  25. Liu, Q.; Zhang, Y.; Liu, L.; Li, L.; Qi, W. The spatial local accuracy of land cover datasets over the Qiangtang Plateau. J. Geogr. Sci. 2019, 29, 1841–1858. [Google Scholar] [CrossRef]
  26. Sun, H.; Zheng, D.; Yao, T.; Zhang, Y. Protection and construction of the national ecological security shelter zone on Tibetan Plateau. Acta Geogr. Sin. 2012, 67, 3–12. [Google Scholar]
  27. Li, S.; Wu, J.; Gong, J.; Li, S. Human footprint in Tibet: Assessing the spatial layout and effectiveness of nature reserves. Sci. Total Environ. 2018, 621, 18–29. [Google Scholar] [CrossRef]
  28. Wang, J.; Yang, X.; Wang, Z.; Cheng, H.; Kang, J.; Tang, H.; Li, Y.; Bian, Z.; Bai, Z. Consistency Analysis and Accuracy Assessment of Three Global Ten-Meter Land Cover Products in Rocky Desertification Region—A Case Study of Southwest China. ISPRS Int. J. Geo-Inf. 2022, 11, 202. [Google Scholar] [CrossRef]
  29. Zhang, C.; Dong, J.; Ge, Q. Quantifying the accuracies of six 30-m cropland datasets over China: A comparison and evaluation analysis. Comput. Electron. Agric. 2022, 197, 106946. [Google Scholar] [CrossRef]
  30. Myers, N.; Mittermeier, R.A.; Mittermeier, C.G.; Da, F.G.; Kent, J. Biodiversity hotspots for conservation priorities. Nature 2000, 403, 853–858. [Google Scholar] [CrossRef]
  31. Zhang, B.; Zhang, Y.; Gu, C.; Wei, B. Land cover classification based on random forest and feature optimism in the Southeast Qinghai-Tibet Plateau. Sci. Geogr. Sin. 2023, 43, 388–397. [Google Scholar]
  32. Lele, N.; Joshi, P.K. Analyzing deforestation rates, spatial forest cover changes and identifying critical areas of forest cover changes in North-East India during 1972–1999. Environ. Monit. Assess. 2009, 156, 159–170. [Google Scholar] [CrossRef] [PubMed]
  33. Deka, J.; Tripathi, O.P.; Khan, M.L.; Srivastava, V.K. Study on land-use and land-cover change dynamics in Eastern Arunachal Pradesh, NE India using remote sensing and GIS. Trop. Ecol. 2019, 60, 199–208. [Google Scholar] [CrossRef]
  34. Su, L.; Guo, Y.; Wu, Y.; Yang, Y. Dynamic change of land use types in Linzhi prefecture of Tibet based on RS and GIS. J. China Agric. Univ. 2019, 24, 170–178. [Google Scholar]
  35. Zhang, Y.; Liu, L.; Li, B.; Zheng, D. Boundary Data of the Tibetan Plateau (2021 Version). Digital Journal of Global Change Data Repository, 2021. Available online: https://doi.org/10.3974/geodb.2021.07.10.V1 (accessed on 26 August 2024).
  36. Bartholomé, E.; Belward, A.S. GLC2000: A new approach to global land cover mapping from Earth observation data. Int. J. Remote Sens. 2005, 26, 1959–1977. [Google Scholar] [CrossRef]
  37. Latham, J.; Cumani, R.; Rosati, I.; Bloise, M. Global Land Cover SHARE (GLC-SHARE) Database Beta-Release Version 1.0-2014. Available online: https://www.fao.org/uploads/media/glc-share-doc.pdf (accessed on 17 June 2024).
  38. Friedl, M.A.; Sulla-Menashe, D.; Tan, B.; Schneider, A.; Ramankutty, N.; Sibley, A.; Huang, X. MODIS Collection 5 global land cover: Algorithm refinements and characterization of new datasets. Remote Sens. Environ. 2010, 114, 168–182. [Google Scholar] [CrossRef]
  39. Ryutaro, T.; Nguyen, T.H.; Toshiyuki, K.; Bayan, A.; Gegen, T.; Dong, X.P. Production of Global Land Cover Data—GLCNMO2008. J. Geogr. Geol. 2014, 6, 99–122. [Google Scholar]
  40. Bicheron, P.; Leroy, M.; Carsten, B. Globcover: A 300 m global land cover product for 2005 using Envisat Meris time series. In Proceedings of the Second International Symposium on Recent Advances in Quantitative Remote Sensing, Enschede, The Netherlands, 8–11 May 2006; pp. 538–542. [Google Scholar]
  41. Defourny, P.; Kirches, G.; Brockmann, C.; Boettcher, M.; Peters, M.; Bontemps, S.; Lamarche, C.; Schlerf, M.; Santoro, M. Land Cover CCI: Product User Guide Version 2. Available online: https://www.esa-landcover-cci.org/?q=webfm_send/84 (accessed on 3 May 2024).
  42. Gong, P.; Wang, J.; Yu, L.; Zhao, Y.; Zhao, Y.; Liang, L.; Niu, Z.; Huang, X.; Fu, H.; Liu, S.; et al. Finer resolution observation and monitoring of global land cover: First mapping results with Landsat TM and ETM+ data. Int. J. Remote Sens. 2013, 34, 2607–2654. [Google Scholar] [CrossRef]
  43. Xu, X.; Liu, J.; Zhang, S.; Li, R.; Yan, C.; Wu, S. China’s Multi-Period Land Use Land Cover Remote Sensing Monitoring Data Set (CNLUCC). Available online: https://www.resdc.cn/ (accessed on 17 June 2024).
  44. Zhang, X.; Liu, L.; Chen, X.; Gao, Y.; Xie, S.; Mi, J. GLC_FCS30: Global land-cover product with fine classification system at 30 m using time-series Landsat imagery. Earth Syst. Sci. Data 2021, 13, 2753–2776. [Google Scholar] [CrossRef]
  45. Xu, X.; Li, B.; Liu, X.; Li, X.; Shi, Q. Mapping annual global land cover changes at a 30 m resolution from 2000 to 2015. Natl. Remote Sens. Bull. 2021, 25, 1896–1916. [Google Scholar]
  46. Yang, J.; Huang, X. The 30 m annual land cover dataset and its dynamics in China from 1990 to 2019. Earth Syst. Sci. Data 2021, 13, 3907–3925. [Google Scholar] [CrossRef]
  47. Karra, K.; Kontgis, C.; Statman-Weil, Z.; Mazzariello, J.C.; Mathis, M.; Brumby, S.P. Global land use/land cover with Sentinel 2 and deep learning. In Proceedings of the 2021 IEEE International Geoscience and Remote Sensing Symposium IGARSS, Brussels, Belgium, 11–16 July 2021; pp. 4704–4707. [Google Scholar]
  48. Stanimirova, R.; Tarrio, K.; Turlej, K.; Mcavoy, K.; Stonebrook, S.; Hu, K.; Arévalo, P.; Bullock, E.L.; Zhang, Y.; Woodcock, C.E.; et al. A global land cover training dataset from 1984 to 2020. Sci. Data 2023, 10, 879. [Google Scholar] [CrossRef]
  49. Li, C.; Gong, P.; Wang, J.; Zhu, Z.; Biging, G.S.; Yuan, C.; Hu, T.; Zhang, H.; Wang, Q.; Li, X.; et al. The first all-season sample set for mapping global land cover with Landsat-8 data. Sci. Bull. 2017, 62, 508–515. [Google Scholar] [CrossRef] [PubMed]
  50. Congalton, R.G. A Review of Assessing the Accuracy of Classifications of Remotely Sensed Data. Remote Sens. Environ. 1991, 37, 35–46. [Google Scholar] [CrossRef]
  51. Chen, Y.; Shao, H.; Li, Y. Consistency analysis and accuracy assessment of multi-source land cover products in the Yangtze River Delta. Trans. Chin. Soc. Agric. Eng. 2021, 37, 142–150. [Google Scholar]
  52. Zhang, Y.; Liu, L.; Wang, Z.; Bai, W.; Ding, M.; Wang, X.; Yan, J.; Xu, E.; Wu, X.; Zhang, B.; et al. Spatial and temporal characteristics of land use and cover changes in the Tibetan Plateau. Chin. Sci. Bull. 2019, 64, 2865–2875. [Google Scholar]
  53. Gao, Y.; Liu, L.; Zhang, X.; Chen, X.; Mi, J.; Xie, S. Consistency Analysis and Accuracy Assessment of Three Global 30-m Land-Cover Products over the European Union using the LUCAS Dataset. Remote Sens. 2020, 12, 3479. [Google Scholar] [CrossRef]
  54. Zhou, Y.; Dong, J.; Liu, J.; Metternicht, G.; Shen, W.; You, N.; Zhao, G.; Xiao, X. Are There Sufficient Landsat Observations for Retrospective and Continuous Monitoring of Land Cover Changes in China? Remote Sens. 2019, 11, 1808. [Google Scholar] [CrossRef]
  55. Kang, J.; Wang, Z.; Sui, L.; Yang, X.; Ma, Y.; Wang, J. Consistency Analysis of Remote Sensing Land Cover Products in the Tropical Rainforest Climate Region: A Case Study of Indonesia. Remote Sens. 2020, 12, 1410. [Google Scholar] [CrossRef]
  56. Zhenguo, N.; Yuxiu, S.; Haiying, Z. Accuracy Assessment of Wetland Categories from the GlobCover2009 Data Over China. Wetl. Sci. 2012, 10, 389–395. [Google Scholar]
  57. Kang, J.; Yang, X.; Wang, Z.; Cheng, H.; Wang, J.; Tang, H.; Li, Y.; Bian, Z.; Bai, Z. Comparison of Three Ten Meter Land Cover Products in a Drought Region: A Case Study in Northwestern China. Land 2022, 11, 427. [Google Scholar] [CrossRef]
Figure 1. Location of the study area, showing: (a) the distribution of the validation sample sets; (b) the distribution of the study area on the TP; and (c) the distribution of the two prefecture-level cities. Red color in (a,b) indicate study area. The boundary of the TP was obtained from the study of Zhang et al. [35].
Remotesensing 16 03219 g001
Figure 2. Flowchart of this study.
Remotesensing 16 03219 g002
Figure 3. Number of validation points for different land cover types.
Remotesensing 16 03219 g003
Figure 4. Comparison of proportions of land cover types for 15 products.
Remotesensing 16 03219 g004
Figure 5. Comparative analysis of spatial distribution for 15 land cover products.
Remotesensing 16 03219 g005
Figure 6. Compositional similarity analysis of 15 products.
Remotesensing 16 03219 g006
Figure 7. Spatial consistency analysis of 15 land cover products on the southeastern TP. Note: For number of datasets showing agreement, full agreement corresponds to a value of 15 (all products indicate the same land cover types), while lowest agreement corresponds to a value of 2 (only 2 products show the same land cover type).
Remotesensing 16 03219 g007
Figure 8. Spatial consistency comparison across different altitudes. Note: Numbers on the top are the number of datasets showing agreement, full agreement corresponds to a value of 15 (all products indicate the same land cover types), while lowest agreement corresponds to a value of 2 (only 2 products show the same land cover type).
Remotesensing 16 03219 g008
Figure 9. Spatial consistency comparison across different land cover types. Note: Numbers on the right indicate spatial consistency of land cover types across 15 datasets: 1 means only one dataset classifies the area as this type, while 15 means all datasets classify it as this type.
Remotesensing 16 03219 g009
Figure 10. Accuracy assessment of 15 products. (a) OA tested by four validation sample sets across 15 land cover products; (b,c) box plots of PA and UA; (dl) F-scores of different land cover products examined by four validation sample sets. Note: Abbreviations used are as follows: 1 (GLC2000), 2 (GLCSHARE), 3 (GLCNMO), 4 (MCD12Q1), 5 (GlobeCover), 6 (CCI-LC), 7 (CGLS-LC100), 8 (Globeland30), 9 (CNLUCC), 10 (FROM-GLC30), 11 (GLC-FCS30), 12 (AGLC), 13 (CLCD), 14 (ESRI), 15 (Worldcover), FR (Forest), SL (Shrubland), GL (Grassland), WL (Wetland), BL (Built-up Land), CL (Cropland), BLD (Bareland), WT (Water), and SI (Snow/Ice).
Remotesensing 16 03219 g010
Figure 11. Confusion matrix analysis of 15 land cover products. Note: Abbreviations used are FR (Forest), SL (Shrubland), GL (Grassland), WL (Wetland), BL (Built-up Land), CL (Cropland), BLD (Bareland), WT (Water), and SI (Snow/Ice).
Remotesensing 16 03219 g011
Figure 12. Spatial consistency and accuracy assessment of 15 land cover products in northern and southern region. Note: Numbers on the bottom of (a) are the number of datasets showing agreement; full agreement corresponds to a value of 15 (all products indicate the same land cover types), while lowest agreement corresponds to a value of 2 (only 2 products show the same land cover type). Abbreviations used in (b,c) are 1 (GLC2000), 2 (GLCSHARE), 3 (GLCNMO), 4 (MCD12Q1), 5 (GlobeCover), 6 (CCI-LC), 7 (CGLS-LC100), 8 (Globeland30), 9 (CNLUCC), 10 (FROM-GLC30), 11 (GLC-FCS30), 12 (AGLC), 13 (CLCD), 14 (ESRI), 15 (Worldcover).
Remotesensing 16 03219 g012
Figure 13. Land cover product comparison in northern region of study area.
Remotesensing 16 03219 g013
Figure 14. Land cover product comparison in southern region of study area.
Remotesensing 16 03219 g014
Table 1. Parameters of land cover products used in this study.
DatasetResolutionAccuracyTimeSatelliteClassification SystemAlgorithmInstitution
GLC2000 [36]1000 m68.61999–2000SPOT4 VEGETATIONFAOLCCS
(22 classes)
Unsupervised classificationJoint Research Center
GLC-SHARE [37]1000 m80.2Various, depending on database sourceVarious, depending on database sourceFAOLCCS
(11 classes)
Data fusionFood and Agriculture Organization
MCD12Q1 [38]500 m71.62020MODISIGBP
(17 classes)
Supervised classification/decision tree/neural networkNational Aeronautics and Space Administration
GLCNMO [39]500 m74.802018MODISFAOLCCS
(20 classes)
Supervised classificationGeospatial Information Authority of Japan
GlobeCover [40]300 m67.52009MERIS FRFAOLCCS
(22 classes)
Unsupervised/supervised classificationEuropean Space Agency (ESA)
CCI-LC [41]300 m71.452015MERIS FR/RR
SPOT-VGT
AVHRR
PROBA-V
FAOLCCS
(22 classes)
Unsupervised classificationESA
CGLS-LC100 [8]100 m80.2 ± 0.72019PROBA-VFAOLCCS
(22 classes)
Random forestEuropean Commission Joint Research Centre
GlobeLand 30 [6]30 m83.502010Landsat TM, ETM7,
HJ-1
10 classesSupervised classificationNational
Geomatics Center
of China
FROM-GLC30 [42]30 m75.822017Landsat10 classesRandom forestTsinghua University
CNLUCC [43]30 m97.22015Landsat 86 primary and 25 secondary classesVisual interpretationChinese Academy of Sciences (CAS)
GLC-FCS30 [44]30 m82.52020Landsat, SentinelFAOLCCS
(30 classes)
Random forestCAS
AGLC [45]30 m76.12015Landsat/ multiple land cover product10 classesData fusion and mutation algorithms, random forestSun Yat-Sen university
CLCD [46]30 m79.312020Landsat9 classesRandom forestWuhan university
ESRI [47]10 m862020Sentinel-210 classesSupervised classification, machine learningEnvironmental
Systems Research
Institute
WorldCover [7]10 m74.42020Sentinel-1/210 classesSupervised classificationESA
Table 2. Class merger scheme for land cover products and validation samples.
ClassTypeGLC2000GLC-SHAREGLCNMOMCD12Q1GlobeCover
1Forest1–6, 9, 10, 1741–61–5, 840, 50, 60, 70, 90, 100, 110
2Shrubland11, 12, 18576, 7130
3Grassland1338, 9, 139, 1020, 30, 120, 140
4Wetland7, 8, 156, 714, 1511160, 170, 180
5Built-up land2211813190
6Cropland16211, 1212, 1411, 14
7Bareland 14, 198, 910, 16, 1716150, 200
8Water20112017210
9Snow/ice21101915220
ClassCCI-LCCGLS-LC100GlobeLand30CNLUCCFROM-GLC30GLC-FC30AGLC
150, 60–62, 70–72, 80–82, 90, 100111–116, 121–1262021, 23, 24251, 52, 61, 62, 71, 72, 81, 82, 91, 9220
2120–122204022412, 120–12240
340, 110, 130303031–33311, 13030
4160, 170, 180905045, 46, 64518050
5190508051–53819080
610–12, 20, 30401011, 12110,2010
7140, 150–153, 200–20260, 10070, 9061–63, 65, 669140, 150, 152, 153, 200, 201, 20270,90
8210806041–43621060
9220701004410220, 250100
ClassCLCDESRIWorldCoverGLanCESRS_ValAll-Season Sample Set
122107–950, 60, 70, 80, 9020
236201012040
343301113030
49490, 95 18050
58750319080
615401210, 2010
77860, 1004–6, 13140, 150, 20070, 90
85180121060
969702220100
Table 3. Shrubland sample points across different scales of imagery, classification results and vegetation composition.
IDSample InformationSatellite ImageUnmanned Aerial Vehicle (UAV) ImageField PhotoVegetation (%)
1Time: 2019/06/09
Longitude: 93.80722°E
Latitude: 28.92575°N
Altitude: 3368 m
Total vegetation cover: 80%
Remotesensing 16 03219 i001Remotesensing 16 03219 i002Remotesensing 16 03219 i003
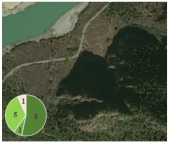
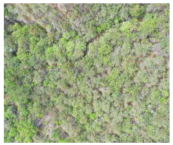
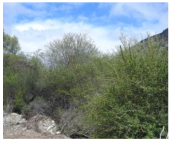
Cotoneaster sp. (30)
Buddleia sp. (20)
Rosa sp. (15)
Berberis sp. (5)
Populus sp. (5)
2Time: 2019/06/11
Longitude: 92.74047°E
Latitude: 29.41755°N
Altitude: 4513 m
Total vegetation cover: 80%
Remotesensing 16 03219 i004Remotesensing 16 03219 i005Remotesensing 16 03219 i006
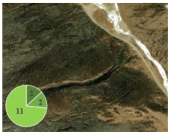
Rhododendron sp. (65)
Lonicera sp. (10)
3Time: 2019/06/19
Longitude: 91.01882°E
Latitude: 28.20329°N
Altitude: 3525 m
Total vegetation cover: 30%
Remotesensing 16 03219 i007Remotesensing 16 03219 i008Remotesensing 16 03219 i009
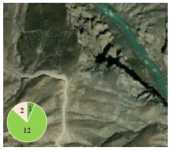
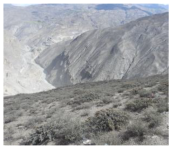
Caragana sp. (7)
Ceratostigma plumbaginoides (3)
Artemisia sp. (20)
4Time: 2019/06/13
Longitude: 91.36045°E
Latitude: 29.31208°N
Altitude: 3569 m
Total vegetation cover: 80%
Remotesensing 16 03219 i010Remotesensing 16 03219 i011Remotesensing 16 03219 i012Sophora moorcroftiana (25)
Note: The pie charts indicate land cover types extracted from 15 products, with the numbers indicating how many sets of products fall into each category. In the sixth column, the vegetation coverage obtained via visual estimation during field surveys is indicated in parentheses after vegetation.
Disclaimer/Publisher’s Note: The statements, opinions and data contained in all publications are solely those of the individual author(s) and contributor(s) and not of MDPI and/or the editor(s). MDPI and/or the editor(s) disclaim responsibility for any injury to people or property resulting from any ideas, methods, instructions or products referred to in the content.

