Abstract
We study the interrelations between salt karst and landscape evolution at the Ze’elim and Hever alluvial fans, Dead Sea (DS), Israel, in an attempt to characterize the ongoing surface and subsurface processes and identify future trends. Using light detection and ranging, interferometric synthetic aperture radar, drone photography, time-lapse cameras, and direct measurements of floodwater levels, we document floodwater recharge through riverbed sinkholes, subsurface salt dissolution, groundwater flow, and brine discharge at shoreline sinkholes during the years 2011–2023. At the Ze’elim fan, most of the surface floodwater drains into streambed sinkholes and discharges at shoreline sinkholes, whereas at the Hever fan, only a small fraction of the floodwater drains into sinkholes, while the majority flows downstream to the DS. This difference is attributed to the low-gradient stream profiles in Ze’elim, which enable water accumulation and recharge in sinkholes and their surrounding depressions, in contrast with the higher-gradient Hever profiles, which yield high-energy floods capable of carrying coarse gravel that eventually fill the sinkholes. The rapid drainage of floodwater into sinkholes also involves slope failure due to pore-pressure drop and cohesion loss within hours after each drainage event. Surface subsidence lineaments detected by InSAR indicate the presence of subsurface dissolution channels between recharge and discharge sites in the two fans and in the nearby Lynch straits. Subsidence and streambed sinkholes occur in most other fans and streams that flow to the DS; however, with the exception of Ze’elim, all other streams show only minor or no recharge along their course. This is due to either the high-gradient profiles, the gravelly sediments, the limited floods, or the lack of conditions for sinkhole development in the other streambeds. Thus, understanding the factors that govern the flood-related karst formation is of great importance for predicting landscape evolution in the DS region and elsewhere and for sinkhole hazard assessment.
1. Introduction
Landscape evolution and drainage patterns are generally controlled by tectonic processes, climatic conditions, and rock and soil properties. In karst regions, the dissolution rates of surface and subsurface rock layers play a dominant role in designing the patterns and rates of landscape evolution (e.g., [1]). Carbonate-dominated environments commonly display internally drained depressions such as sinkholes, dolines, uvalas, or poljes that form over periods of thousands to millions of years. Evaporite karst is characterized by similar features that develop at significantly higher rates, ranging from minutes to years [2,3,4]. Karst evolution commonly affects long-term surface processes such as drainage patterns, depositional history, and thicknesses of alluvial deposits [5,6,7].
The most common hazards associated with karst include sinkholes, flooding, and slope movements [2]. Thus, understanding the underlying processes behind each of these hazards, and particularly their mutual effects and relationships, is of great importance. Sinkholes are the most common manifestations of karst-related catastrophic damage. Their development provides a good illustration of the interconnections between the surface and the subsurface and the development of underground cavities, which commonly migrate upwards until the surface collapses. Floods in karst terrains have gained particular interest in the context of groundwater flooding and/or back-flooding, which occur when subsurface drainage networks are incapable of transmitting large groundwater volumes due to insufficient porosity or permeability of the host rocks (e.g., [8,9,10]). In this respect, sinkhole flooding draws increasing attention for runoff regulation purposes in endorheic karst basins in order to reduce the risk of flooding and improve the quantity and quality of the water drained by sinkholes [11] and references therein. Flooding may also occur after rapid recharge in the karst aquifer, inducing a quick rise of the groundwater level and a prompt discharge increase at permanent or temporary springs [12,13,14,15]. Karst caves may also control the occurrence of slope instabilities. Failures in slopes underlain by evaporites are largely related to enlargement of discontinuities by deep-seated dissolution [16,17,18,19]. In addition to dissolution, water circulation in karst conduits may also induce instability due to high fluid pressures, with the consequent decrease in the normal effective stress and shear strength [2].
The real-time contribution of surface water to subsurface dissolution and erosion and the surface response to these two processes have been rarely documented. Klimchouk and Aksem [20] analyzed the evolving geochemistry of surface water percolating through gypsum karst in Western Ukraine, showing varying conditions of water-rock interaction and dissolution rates within different levels of the cave systems. Avni et al. [3] showed the role of flash floods and streambed sinkholes in the development of subsurface salt karst in one alluvial fan along the Dead Sea (DS). In a subsequent study, Shviro et al. [4] quantified the contribution of flash floods to salt dissolution and land subsidence in several alluvial fans along the DS and showed different modes of subsidence evolution following flash floods. The relationship between discrete flash flood events and sediment budgets, as well as rates of erosion/deposition due to the ongoing DS base level lowering, were quantitatively investigated by Ben Moshe and Lensky [21]. While these previous studies enable a better understanding of basic processes that take place during floodwater-induced evaporite karstification, their expected short- and long-term implications on regional landscape evolution have not been fully addressed.
Sinkholes were first identified along the DS in the early 1980s (e.g., [22,23]). Their primary formation mechanism involves the dissolution of a ~10,000-year-old subsurface salt (halite, NaCl) layer (the “Sinkhole Salt”) due to the replacement of hypersaline groundwater by undersaturated groundwater in response to the ~1 m/yr drop in the DS level [24,25]. The salt layer is present along most of the DS shores at depths between a few meters and more than 50 m below the surface and ranges in thickness from less than 1 m to about 23 m [26]. Sinkholes are formed in the following two main sedimentary environments [24]: (1) Mudflats, which consist mostly of laminated clay-silt-sized clastic lacustrine sediments alternating with authigenic aragonite and gypsum. These sinkholes are classified as suffusion and sagging types [27]. (2) Alluvial fans dominated by consolidated gravel, alternating in places with fine-grained clastic sediments, where they are classified as collapse sinkholes.
Since 2011, growing volumes of floodwater have been recharged through sinkholes that developed within a few streambeds draining to the DS, and a significant increase in land subsidence and in the number of new sinkholes followed each flash flood event [3,4,28,29]. Local streambed drainage reversal due to this new subsidence and sinkhole formation mode was first noticed in 2013 when the upper parts of one of the low-gradient streambeds in the mudflats of the Ze’elim fan were disconnected from the DS base level by a wide subsiding basin that was occupied by more than 100 sinkholes [3]. Hours after each flood, water that recharged in that basin discharged from sinkholes and streambed springs closer to the DS shorelines.
In this study, we compare two major alluvial fans along the western shores of the DS, Ze’elim and Hever (Figure 1), over a period of 12 years (2011–2023). In each area, we use annual light detection and ranging (LiDAR) Digital Surface Models (DSMs) to study the landscape evolution and apply interferometric synthetic aperture radar (InSAR) measurements and drone photography to document the short-term surface response to flash floods. We also use time-lapse cameras (TLCs) to track surface and subsurface water paths and to document real-time subsidence and sinkhole formation. Then, we show similar features in the adjacent area of the Lynch straits south of Ze’elim (Figure 1c), and finally, we discuss the relevance of our observations to current processes and future scenarios at other streambeds along the DS shore and other karst regions worldwide.
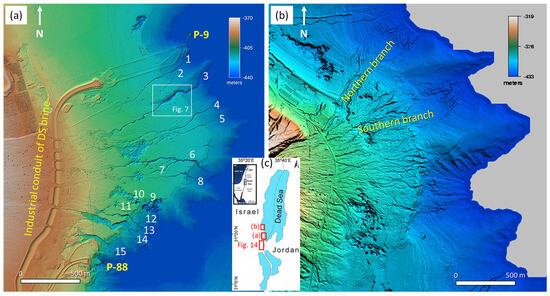
Figure 1.
LiDAR topography of the two study areas draped upon hill−shaded DSMs. (a) Ze’elim fan. Gully numbers (in white) are after [3]. (b) Hever fan. (c) Location maps of the study areas.
2. Geomorphological and Hydrogeological Background
2.1. The Dead Sea (DS) Basin
The DS, the lowest place on the terrestrial globe, is located along the DS Transform (DST), a ~1000-kilometer-long boundary between the Arabian and the African tectonic plates (Figure 1c) (e.g., [30,31]). The DS is separated into the following two water bodies (Figure 1c): (a) A northern water body, which has a relatively deep and flat bottom at ~730 m below sea level (mbsl), and a water level that has declined over the past decades at a rate of >1 m/yr to its current (2024) level of ~439 mbsl. (b) A southern, shallow basin, which is currently occupied by evaporation pans of the Israeli and Jordanian potash companies, with a floor at ~410 mbsl [32,33] and an historic average water level at ~400 mbsl. On the western shore of the DS, the Israeli potash company Dead Sea Works (DSW) conveys brine from the northern basin to the northernmost evaporation pond through a ~12 km long canal. The evaporated brine is then directed from this pond to downstream ponds within the southern basin. On the eastern shore of the DS, the Arab Potash Company pumps brine directly from the northern basin to its first evaporation pond. At the present elevation of the DS, without these evaporation ponds, the southern basin would have already been dry.
The DS and the adjoining groundwater systems are hydraulically interconnected. Close to the shore, groundwater levels respond to lake level change relatively fast (hours to a few days), with response time increasing westwards away from the shore [34]. The DS serves as a base level for most of the region east of the major water divide in Israel and the Palestinian Authority (PA) and west of the major water divide in Jordan. The eastern Judean and Hebron mountains in central Israel and the PA are drained to the DS by 13 major canyons that open into alluvial fans as they emerge from the major fault escarpments of the basin. Two of the larger fans, Ze’elim and Hever, are chosen for this study (Figure 1), both showing important aspects of the interrelations between flash floods and subsurface karst formation. The fans differ in their size, topographic gradient, drainage pattern, and sediment composition, and thus in their specific landscape evolution.
2.2. Ze’elim Fan
The Ze’elim alluvial fan (Figure 1a) drains the largest catchment area (~290 km2) along the eastern Judean and southern Hebron mountains. The distance from the head of the fan in the west, where the stream emerges from the bedrock escarpment to the DS, is ~7.5 km, and the width of the fan at the shoreline is about 4 km. On the western side of the fan, braided gravel channels dominate, developing over the fluvial-lacustrine sequence of the late Pleistocene Lisan Formation [35]. East of the ~−400 m elevation contour line, the fan is composed of mudflats that consist of 20–40 m of alternating layers of clay, aragonite, silt, sand, salt, and gravel of the Holocene Ze’elim Formation, with the ~10,000 years old “Sinkhole Salt” layer at its base [36,37]. A dense network of boreholes recently drilled in the eastern side of the Ze’elim alluvial fan penetrated the salt layer at depths between 5 and 25 m below the surface [26]. The gradient of the major streams in the eastern part of the fan is 1–3% (Figure 2). Significant rainstorms in the catchment area generate flash floods that initiate in the upper Ze’elim basin, flow eastward through the Ze’elim bedrock gorge, and continue downstream through the braided gravel channels and the mudflats towards the DS. Until 2019, the floodwater at the eastern part of the fan were self-channeled to discrete gullies incised in the mudflats, numbered from 1 to 15, from north to south (Figure 1a) [3]. In early 2019, the feeding canal of the DSW, which conveys Dead Sea brines to the industries in the southern basin, was extended northward by 5 km. This section of the canal crosses the entire Ze’elim fan, connecting the new pumping station (P9) in the northern part of the fan with the older canal and pumping station (P88) south of the fan (Figure 1a). To prevent damage to the canal by flash floods, it was entrenched in the alluvial fan, and the floodwater courses were directed to seven overpasses above the canal (Figure 1a and Figure 3b), focusing the flow east of the overpasses into discrete gullies and abandoning others that were previously active.
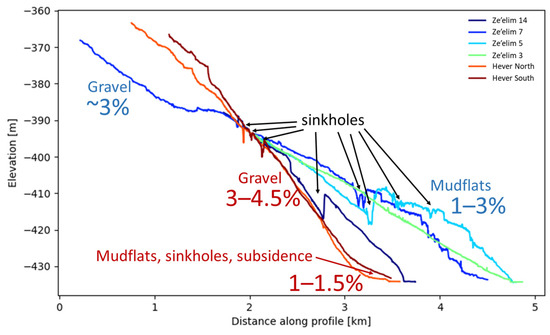
Figure 2.
Elevation profiles along Ze’elim and Hever riverbeds, May 2020. Note the low gradients (1−3%) and fine-grained composition of the Ze’elim riverbeds (blue-green profiles, for location, see Figure 1a), in contrast with the high gradients (3−4.5%) and coarse gravel sediments of the Hever riverbeds (red-brown profiles; for location, see Figure 1b), which decrease to 1−1.5% only at their easternmost parts.
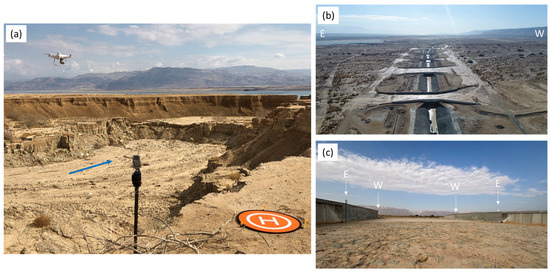
Figure 3.
(a) Time-lapse camera and drone, overlooking gully 14 recharge sinkhole. The blue arrow marks the flow direction from west to east. (b) View south at the DSW canal as floodwater crosses the overpasses. Photo courtesy of DSW. (c) Locations of hydrometers (marked by white arrows) that are installed at an overpass. E and W mark eastern and western hydrometers.
2.3. Hever Fan
A catchment area of ~180 km2 in the north-eastern Hebron Mountains is drained to the DS through the Hever gorge that opens to the Hever fan (Figure 1b). The fan is ~3 km long and ~3 km wide at the shoreline. It consists of alluvial terraces of different elevations and ages and is dominated by braided gravel channels incised into older terraces and soft units of the Lisan and Ze’elim Formations. East of the −430 m elevation contour line, the alluvial deposits of the fan change over to a 300−500 m wide stretch of mudflats that were exposed during the last years due to the DS level drop and are currently incised by new gullies. The gradient of the braided streambeds in Hever fan is 3−4.5% while the gradient of the mudflats is 1−1.5% (Figure 2). Boreholes drilled in the Hever fan about 1 km from the present shoreline penetrated the “Sinkhole Salt” layer at depths of 20−35 m. The current fluvial activity during flash floods occurs along two major stream branches at the northern part of the fan (Figure 1b).
3. Data and Methods
3.1. Airborne LiDAR
Airborne LiDAR, also known as airborne laser swath mapping, uses a laser ranging device, together with information on the position and orientation of the aircraft platform, to determine the x, y, and z coordinates (within a global geodetic reference frame) of ground targets (e.g., [38]). LiDAR data of the DS area were acquired in 2005 (partially), 2011, and annually since 2013, at an average flight height of 700 m, by Optech ALTM 3100 100 kHz, Rigel LMS-Q650 200 kHz, and Optech ORION H300 scanners. The densities of the ground measuring points were at least 4 points/m2. Digital Surface Models (DSMs) for each year were produced from the ground targets (point clouds) at 0.5 m/pixel with vertical accuracy of up to 10 cm for 95% of the ground control points and precision of ±5 cm [28]. These DSMs are used for detection of annual elevation changes, for sinkhole mapping (e.g., [39]), and for InSAR geo-referencing [40,41]. Due to the scarcity of vegetation, we did not carry out any filtering for vegetation, commonly performed for separating off-terrain returns (e.g., tree canopies).
3.2. InSAR
Over the last three decades, InSAR has become a widespread tool to measure subtle displacements of the ground surface (e.g., [42]). We used radar images of the Italian Space Agency COSMO-SkyMed (CSK) and the German Space Agency TerraSAR-X (TSX) satellites with 3 m pixel size, 3.1 cm wavelength (x-band), 16 or 11 days revisit time (CSK or TSX, respectively), and ~2 mm vertical accuracy. The average noise in an interferogram is 1 ± 0.5 mm, including phase noise such as spatial and temporal decorrelation, atmospheric noise, and baseline phase contribution [4]. The detection threshold of new subsidence in an interferogram was empirically found to be ~2.5 mm, about twice the average noise. Phase difference maps (interferograms) were generated for pre-, syn-, and post-flood periods. The airborne LiDAR DSM was used for interferogram geo-referencing and for removal of the topographic phase [40,41]. The interferograms were filtered using an adaptive filter function that is based on the local fringe spectrum [43], with a window size of 16 × 16 pixels. Incoherent areas due to flood-related aggradation, degradation, and sediment mobilization were used to identify surface flow paths and delineate active tributaries along the alluvial fans. Due to the larger pixel size and wavelengths of Sentinel-1 and other C- or L-band images compared to the size of the analyzed features and their expected deformation [40], these radar bands were found unsuitable for the current analysis.
3.3. Drone Photography
Since January 2018, drones have been used to generate high-resolution rectified photographs and digital elevation models of specific study sites for real-time flood documentation and for water sampling in inaccessible areas (Figure 3a). We used two types of drones: Mavik 1 pro (until late 2018) and Phantom 4 pro v2 (since late 2018), at flight elevations ranging between 20 and 50 m. The drone photos were geocoded and mosaicked using the Agisoft PhotoScan Pro v.1.6.4 software. The resulting DEMs had a resolution of 5–8 cm per pixel, while the orthophotos had a resolution of 1.5–2 cm per pixel, with accuracies of 2–5 cm for locations and 2.5–5 cm for altitudes [21].
3.4. Time-Lapse Cameras
Brinno BCC200 TLCs were installed overlooking active gullies and sinkholes in the Ze’elim and Hever fans for direct observations of flash flood events and of the ground and groundwater response thereafter (Figure 3a). Starting with three Ze’elim TLCs in 2014–2015, we added new cameras in the following years in response to the geomorphological changes. The number of installed TLCs progressively increased, reaching nine TLCs in Ze’elim and four TLCs in Hever in late 2023. All cameras were set to 10 or 20 s snapshots. Due to the high sampling rate (30 frames per second), the movies enable capturing water flow events at the different sites with a temporal resolution of about 5 min. The cameras were time-synchronized every month on average, when batteries and memory cards were replaced. All cameras switch off automatically at night.
3.5. Canal Overpass Hydrometers
Seven overpasses were constructed by the DSW above the pumping water canal in the Ze’elim fan. These overpasses focused the braided channels west of the canal to discrete gullies east of the canal (Figure 1a and Figure 3b). Sensors were installed by the DSW across the canal overpasses (Figure 3c), measuring the floodwater levels at 5-min intervals since 1 June 2020. The hydrographs allow precise identification of the flood timing (onset, termination, and fluctuations) and water levels in each overpass for qualitative estimation of its relative intensity. The floodwater level data were generously provided to us by the DSW.
4. Results
4.1. Ze’elim Fan
4.1.1. Landscape Evolution in Response to Flash Floods
Figure S1 shows the elevation changes in the Ze’elim fan between 2014 and 2023, measured by subtraction of the two respective LiDAR DSMs. Besides the new industrial canal and overpasses, one can clearly note significant development of sinkholes and subsidence areas during those years (blue colors). A GIF animation created from successive annual DSMs shows the continuous development of sinkholes, subsidence, and gully incision during the period 2005–2023 (Figure S2). Beginning in winter 2010–2011, floodwater was recharged through sinkholes along gullies 3, 4, and 5 (Figure 1a and Figure S1) and discharged at two briny springs in gullies 3 and 10 close to the shoreline. These events marked the initiation and self-acceleration of a new karst system at the subsurface of the Ze’elim fan [3].
Since 2015, floodwater has been progressively recharged through sinkholes in gullies 6, 7, 10, 12, 13, and 14 (Figure 1a, Figure 3a, Figure 4 and Figure 5). Subsidence zones developed into local drainage depressions within and around these streambed sinkholes, disconnecting the streambeds’ upper parts from the DS base level. Gullies 1, 2, and 10–13 have been disconnected from their upstream feeds in 2018–2019 due to diversions at the newly formed canal overpasses (Figure 1a). Currently, four major sinkhole clusters recharge floodwater across the Ze’elim fan in gullies 5, 6, 7, and 14, while discharge occurs at several sinkholes within gully 10 sinkhole cluster (Figure 5 and Figure 6). Gully 3 flowed uninterrupted all the way down to the DS until 2022 (Figure 2 and Figure S3). Since 2022, sinkholes and subsidence along that gully have developed into a widening and deepening depression that recharges part of the floodwater (Figure 7 and Figure S3).
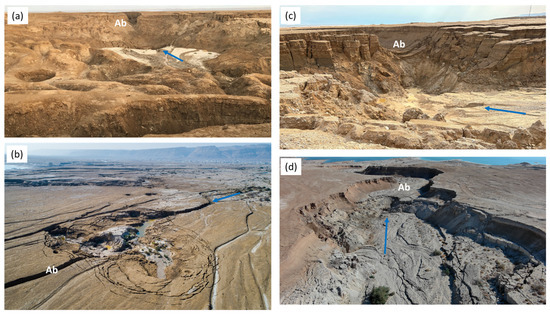
Figure 4.
Photos of recharge sinkholes at Ze’elim fan streambeds. Blue arrows mark the flow direction. Ab—abandoned gullies, overhanging downstream of the recharge sinkholes. For location, see Figure 1a. (a) Gully 6. (b) Gully 7. (c) Gully 13. (d) Gully 14. Drone picture was taken by Liran Ben Moshe.
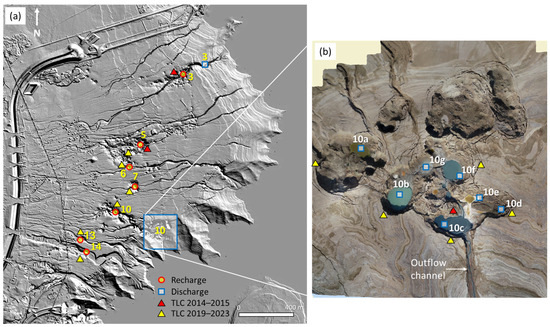
Figure 5.
(a) Floodwater recharge (red circles) and discharge (blue rectangles) sites at the Ze’elim fan. Red and yellow triangles mark locations and operation intervals of the TLCs. Yellow numbers denote gully numbers (after [3]). (b) Drone photograph, 2 January 2020, showing the discharge sinkholes (rectangles) and TLCs (triangles) within and around the shoreline sinkholes of gully 10. Note that not all TLCs operated simultaneously.
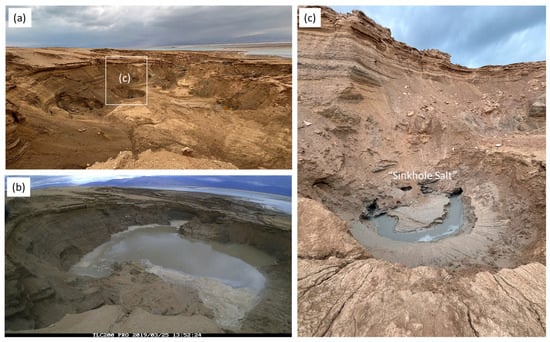
Figure 6.
Discharge sinkhole 10a (see location in Figure 5b). (a) View east, February 2024. (b) TLC picture showing water discharge following the 25 March 2019 flood. (c) The nested sinkhole at the northern wall of the major sinkhole, February 2024, exposing the “Sinkhole Salt” layer (white layers with small cavities), the dissolution channel openings, and groundwater flow.
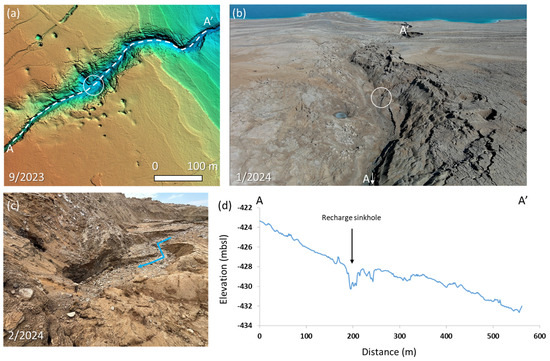
Figure 7.
Sinkholes and subsidence along the course of gully 3. (a) LiDAR DSM, July 2023 (see location in Figure 1). The location of profile A−A’ (panel d) is shown in a dashed white line. The area around the recharge sinkhole is marked by a circle. (b) Drone photograph of the recharge area (sinkhole marked by white circle), January 2024, taken by Liran Ben Moshe. (c) Streambed sinkhole recharging floodwater after the 15.2.2024 flood. (d) Elevation profile A−A’ along the gully, September 2023 (location shown in panel a). Note that this recharge sinkhole does not appear in 2020 (see Ze’elim 3 profile in Figure 2).
During the period 2013–2018, the gully 10 sinkhole cluster expanded progressively to the southeast (Figures S2 and S4). Concurrently, a briny spring < 2 m wide that formed at the shoreline in 2012 widened, deepened, and, with gradual collapse of its margins, evolved to a ~50 m wide discharge sinkhole (Figure S4—white circles in the 2015–2019 panels; Figure S5). In 2018–2019, it coalesced with the eastward expanding cluster into one large mega-sinkhole, through which most of the recharged floodwater of the Ze’elim fan discharges and outflows to the DS through a self-incising channel (Figure 1a, Figure 5, Figures S6 and S7). Minor amounts discharge through shoreline springs (Figure S6b).
During the 7 February 2019 flood, a drone and three TLCs captured a sequence of events starting with floodwater recharged by streambed sinkholes, followed by groundwater level rise and enhanced discharge at the shoreline sinkholes (https://www.youtube.com/watch?v=tfSiwPQfk0k&feature=youtu.be, accessed on 30 August 2024). Following that event, TLCs were progressively positioned at additional recharge and discharge sites (Figure 5, red circles and blue rectangles, respectively), documenting all daylight events since. Four cases of recharge and discharge of floodwater and slope failure are demonstrated by TLCs during or immediately after water level drop in two flood events in 2023 (https://www.youtube.com/watch?v=CqABfWMkiiE, accessed on 30 August 2024).
4.1.2. Subsurface Water Pathways and Dissolution Channels
In 2015, only two recharge sinkholes (upstream gullies 3 and 5) and two discharge sinkholes (downstream gullies 3 and 10c) were active (Figure 5). The elapsed time between recharge at gully 5 and discharge at sinkhole 10c was ~165 min, while the elapsed time of subsurface flow under gully 3 could not be resolved due to the absence of a TLC downstream (Table 1) [3]. A third recharge sinkhole started developing within gully 14, until in late 2018 it expanded to the full width of the streambed and completely blocked the flow downstream (Figure 3a, Figure 4d and Figure S8). The completion of the DSW canal and its overpasses in 2019 focused floodwater on channels 6 and 7 at the expense of other, now disconnected channels. Gully 7 sinkhole cluster widened and deepened dramatically, recharging all its floodwater since winter 2019 (Figure 4b and Figure S4). Gully 6 sinkholes widened and deepened in 2019 and fully recharged floodwater since early 2022 (Figure 4a). The patterns and timing of surface and subsurface flow during each flood are reconstructed by the TLC data and by the floodwater arrival times at the overpass hydrometers (Figure 3c and Figure 8). Floodwater recharge and discharge times during seven flood events between 2015 and 2023 are summarized in Table 1.

Table 1.
Times and peak discharge of floodwater at Ze’elim hydrograph (at the canyon outlet, 6 km upstream) and times of onset of recharge and discharge at sinkholes, based on TLC data. The error in timing is less than 5 min.
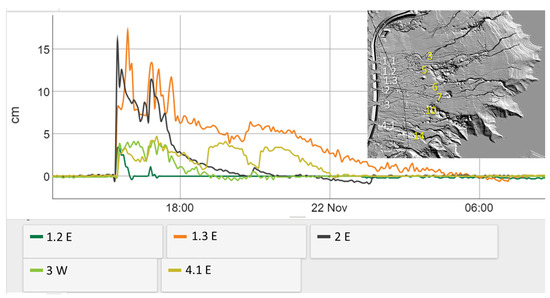
Figure 8.
Water levels at five overpasses during the 21–22 November 2021 flood in Ze’elim. See inset for location. The overpasses are marked by white numbers, and streams are marked by yellow numbers. E and W stand for eastern and western hydrographs, respectively (Figure 3c).
Based on these measurements, two basic observations are noteworthy: (a) The time elapsed between floodwater recharge at gully 14 and discharge at sinkhole 10a (Figure 5) is reduced from ~75 min in 2019 to ~45 min in 2023. The estimated distance between the recharge and discharge points is 750 m (see below), implying that the subsurface flow velocity increased in those years from ~0.6 km/h to about 1 km/h. For comparison, the surface flow velocity between the Ze’elim hydrograph and gully 14 discharge sinkhole, 6.25 km downstream, was 4–6 km/h (Table 1). Subsurface flow time is apparently also reduced between gully 7 and sinkhole 10f (Figure 5) from 50 min in 2020 to 40 min in 2023, but this cannot be fully resolved due to a lack of sufficient measurements. (b) The different flow times and durations at the southern pair (from 14 to 10a) compared to the northern pairs (from 6 and 7 to 10f) (Table 1), and the correlation between the water volumes flowing in and out in each pair, suggest at least two separate subsurface dissolution pathways: a pathway from gully 14 to sinkhole 10a, and pathways from gullies 5, 6, and 7 to sinkhole 10f.
For night events, during which TLC observations are missing, flood arrival times at the overpasses provide additional confirmation of the presence of these separate pathways. For example, during the 21–22 November 2021 event, flow in overpass 1.3 that feeds gullies 5 and 6 continued until 04:40 am (Figure 8). In contrast, flow in all other overpasses (that feed gullies 7, 10, and 14) stopped before midnight. In harmony with these observations, no discharge was evident on the following morning in sinkhole 10a, while vigorous discharge was observed at sinkhole 10f since dawn, indicating that during that event, discharge at sinkhole 10f originated from the recharged floodwater at gullies 5 and 6.
To delineate the subsurface dissolution channels in the Ze’elim fan, we use InSAR measurements. Most prominent is the western Ze’elim subsidence lineament (WZSL) (Figure 9) that meanders over the western margins of the subsurface salt layer [26] and embays eastward into gullies 14 and 10. Close to these gullies, subsidence increases gradually after each winter and decreases in the fall, suggesting that this part of the lineament carries recharged floodwater from the southern gullies to the discharge sinkholes [4]. One branch of this subsurface channel leads to the cluster of sinkholes in gully 10, and a window to its course has been recently unveiled within sinkhole 10a (Figure 6). When the water level dropped after the 18 February 2024 flood, it exposed the subsurface “Sinkhole Salt” layer, the dissolution channel, karst cavities, and the flowing groundwater between them (Figure 6c).
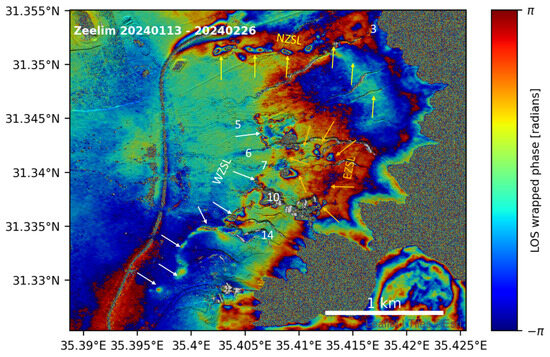
Figure 9.
An interferogram of the Ze’elim fan spanning 44 days in early 2024, showing subsidence lineaments that are interpreted as surface manifestations of subsurface dissolution channels. The two acquisition times are 13 January 2024 and 26 February 2024. WZSL, EZSL, and NZSL stand for western, eastern, and northern Ze’elim subsidence lineaments, shown by white, orange, and yellow arrows, respectively. Gully numbers are marked in white (after [3]).
Further to the north, the WZSL passes 100–150 m west of the recharge sinkholes in gullies 5, 6, and 7, but there is no evidence for a connection between the lineament and these sinkholes. The subsidence areas around these three sinkholes significantly widen towards each other and partly coalesce after each flood (Figure 9), suggesting that subsurface dissolution also develops between them. Circular areas of subsidence, also considered as sinkhole precursory zones (e.g., [40,41]), developed east of gullies 10, 6, and 7 recharge sinkholes (orange arrows in Figure 9), and are most likely related to an evolving eastern Ze’elim subsidence lineament (EZSL). At the southern end of this lineament, a possible connection with the discharge sinkhole 10f (southernmost orange arrow) could be identified. North of gully 3, the salt layer boundary is marked by the ~EW northern Ze’elim subsidence lineament (NZSL) (Figure 9), that crosses gully 3 at its current recharge area (Figure 7). Based on these observations, we propose that three subsurface floodwater paths are currently active in the Ze’elim fan (Figure 10), a southern path from gully 14 to sinkhole 10a, and two paths in the central part of the fan, from gully 7 and gullies 6 and 5 to sinkhole 10f. The monthly evolution of these subsidence lineaments since 2018 can be followed at the Geological Survey of Israel Dead Sea sinkholes and subsidence monitoring website, https://egozi.gsi.gov.il/webapps/hazards/sinkholes_subsidence/, accessed on 30 August 2024.
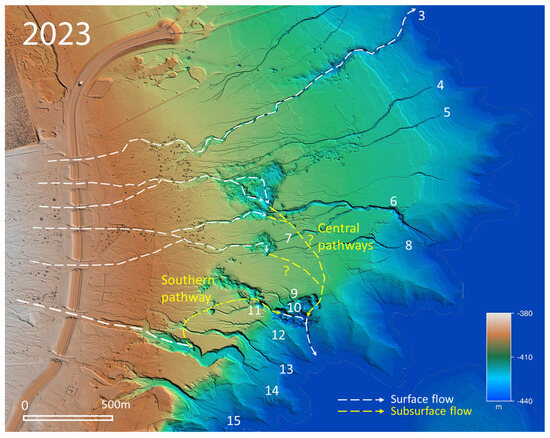
Figure 10.
Surface (dashed white lines) and proposed subsurface water pathways (dashed yellow lines) in Ze’elim: a southern pathway from gully 14 to the western side of sinkhole 10 (10a in Figure 5b), and central pathways from gullies 5, 6, and 7 to the eastern side of sinkhole 10 (10f in Figure 5b). Gully numbers are after [3].
4.2. Hever Fan
About 200 m upstream of Highway 90, the Hever riverbed splits into a northern, NE-flowing branch and a southern, ENE-flowing branch (Figure 1b). The annual changes within this fluvial system include streambed incision, sinkhole-related subsidence, and gravel deposition along the streambeds and within streambed sinkholes (Figure 11). About 400 m east of the road, two clusters of sinkholes and subsidence cross the two stream branches (white ellipses in Figure 11). The northern branch sinkholes are concentrated mainly at the SE margins of the streambed (Figure 11 and Figure 12), allowing a significant fraction of the floodwater to continue downstream, either along parallel braided stream channels (blue arrows in Figure 12) or across the sinkholes. The southern branch sinkholes developed across the entire width of the streambed, generating a ~100 m wide NW-SE trending shallow depression (Figure 11). Here, floodwater temporarily accumulates and recharges, while overflow continues further downstream. Some 600–800 m downstream of these two sinkhole clusters, both stream branches show additional zones of subsidence with shallow (<2 m deep) sinkholes (Figure 11c).
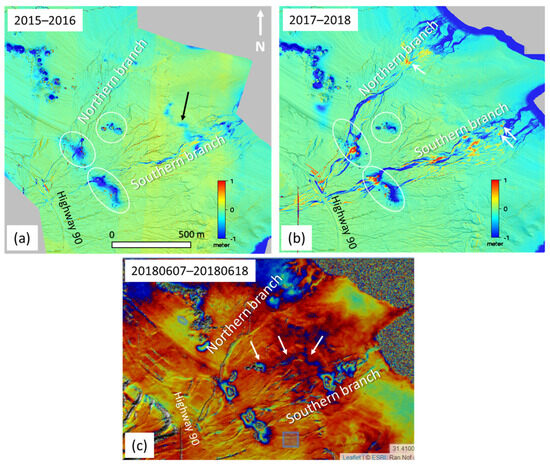
Figure 11.
(a,b) Annual surface elevation changes in the Hever fan, draped upon LiDAR DSMs. River incision, riverbank collapse, subsidence, and sinkholes are displayed by negative (blue) values. Aggradation of alluvial material along the streambeds and within sinkholes is displayed by positive (red) values and by white arrows. White ellipses mark subsidence around sinkhole clusters. The black arrow in (a) points at a meandering subsidence lineament, interpreted as the surface manifestation of a subsurface dissolution channel. (c) Interferogram showing sinkhole-related subsidence (semi-circular fringe colors) and a meandering subsidence lineament (marked by white arrows) that is interpreted as the surface manifestation of a subsurface dissolution channel between the western cluster of recharging sinkholes and the eastern subsidence zone (similar to the lineament in panel a). The acquisition times of the two images are 7 June 2018 and 18 June 2018.
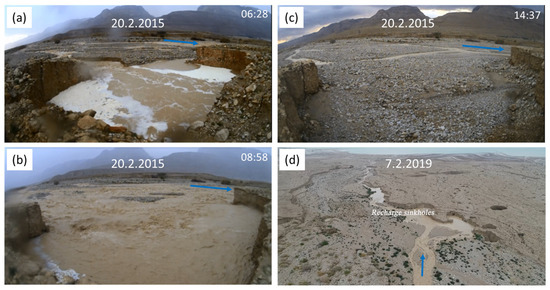
Figure 12.
(a–c) TLC photos showing recharge of floodwater at sinkholes in the northern branch of Hever fan during the 20 February 2015 flood. Blue arrows mark the braided streambed flow direction. Note the water overflow and the filling of the sinkhole with gravel at the final hours of the flood (panels (b) and (c), respectively). (d) Drone picture of 7 February 2019 floodwater drained into recharge sinkholes along the northern Hever branch with overflowing water continuing downstream.
All streambed sinkholes and subsidence sites in Hever respond to flood events. However, while the western (upstream) sites respond by significant high subsidence immediately after the flood events, which decay exponentially thereafter [4], the eastern sites respond by lateral expansion of the subsidence area after each flood with only a minor increase in subsidence rates.
Since winter 2015, TLCs documented flood recharge in streambed sinkholes at the Hever fan (Figure 12). Evidence for groundwater discharge close to the shoreline is less conspicuous and includes seepage of brines from streambed sediments in the days following the flood events (Figure 13a), offshore discharge sinkholes (white arrows in Figure 13b), and “salt chimneys” (Figure 13c). However, in contrast with the Ze’elim observations, the temporal relations between recharge in the western sinkholes and discharge downstream have not been established so far.
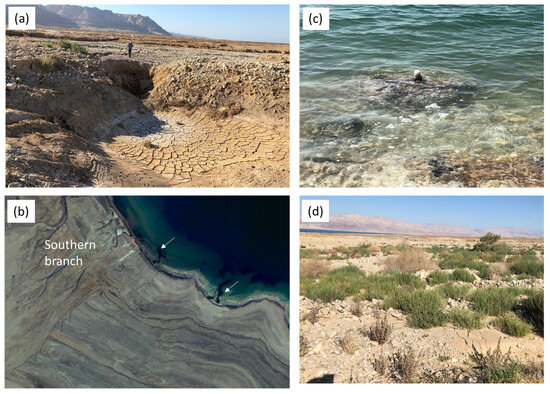
Figure 13.
(a) Discharge sinkholes at the lower part of the southern Hever branch. (b) Offshore discharge sites at the Hever shoreline (white arrows). (c) A small salt chimney 2 m offshore in Hever. (d) Anabasis setifera vegetation at the lower Hever southern streambed. For location, see the black arrow in Figure 11a.
A subsurface dissolution channel between the western and eastern sinkhole sites can be traced by InSAR (Figure 11c). Differential LiDAR DSM detects a less prominent, temporarily active NW-trending subsidence lineament between the two eastern sites (black arrow in Figure 11a). This lineament coincides with a green belt of Anabasis setifera vegetation (that grows under extremely salty conditions) and may infer dissolution of shallow (recent) salt layers by near-surface brines (Figure 13d). In 2023, a new bridge was constructed across the Hever stream on Highway 90, and the flow channel of the southern branch was diverted to the northern branch, increasing the flow volumes in the north and blocking any future flow in the south.
4.3. Subsurface Dissolution Channels in Rahaf Fan—Lynch Straits
Since the mid-1980s, Rahaf floodwater has accumulated behind a dam east of Highway 90 and west of the DSW feeding canal (white ellipses in Figure 14; location in Figure 1c). During rare events of extreme flash floods, overflow is channeled eastward to the lower Rahaf streambed via an overpass over the DSW canal (Figure 14). Until 2019, this was the only overpass across the canal in the entire section between Ze’elim and Rahaf fans. Thus, floodwater in all other riverbeds between the two fans either flowed parallel to the canal levee to the Massada riverbed in the north (Figure 14a) or accumulated, evaporated, or infiltrated within local depressions west of the canal. DSM subtraction maps and InSAR show two distinct patterns of subsidence and sinkholes east of the canal (white arrows in Figure 14): meandering (lower Rahaf meander and southern channel) and linear. Shviro et al. [4] showed that despite the lack of any fluvial activity near the lower Rahaf meander, the subsidence rates in this site show rapid response to floods. It was thus hypothesized that the meandering subsidence was triggered by a buried paleo-channel that provided a rapid groundwater conduit for Rahaf floodwater, enhancing salt dissolution along its course [4]. The sinkhole/subsidence lineaments east of the canal apparently follow the eastward continuations of streambeds from the western side of the canal (Figure 14) and coincide with thickened salt and gravel layers identified in nearby boreholes. We thus suggest that these sinkhole/subsidence lineaments are also due to salt dissolution by subsurface flow along buried channels below and east of the canal.
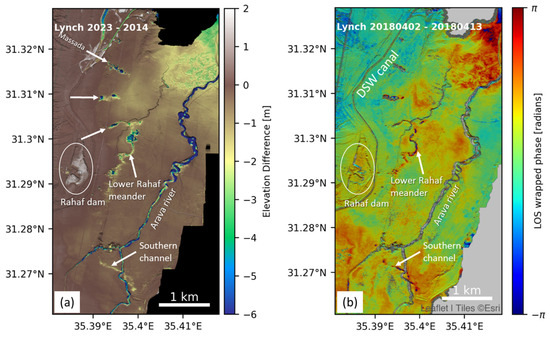
Figure 14.
Linear and meandering subsidence patterns at the Lynch straits (for location, see Figure 1c). (a) Subtraction map of LiDAR DSMs between 2023 and 2014. (b) Interferogram between 2 and 13 April 2018. The white arrows point to subsidence lineaments that are interpreted to form above subsurface salt dissolution channels.
5. Discussion
5.1. Temporal Development of the Shoreline Karst Systems
The aperture, extent, and complexity of subsurface dissolution channels are of major importance in the development of a karst system and in the assessment of its maturity [44,45,46]. The evolution of dissolution channels in highly soluble rocks, such as salt, is determined by the subsurface hydraulic gradients within the voids in the rock (e.g., [47]) and the flux and availability of the dissolving water. Variations in the apertures and gradient of the karst system affect groundwater flow velocity and fluxes from recharge to discharge points. An increase with time of subsurface flow velocity, as observed in Ze’elim (Table 1), may indicate widening of the dissolution conduits. However, as the salt karst channels may be partly filled with groundwater, the time elapsed between recharge and discharge also depends on the volume of the residing water in these channels before and during the flood. If the channels are empty, the recharged water would flow down the entire length of the channel until discharge. Alternately, in cases of filled or partly filled channels, the recharged floodwater will induce pressure on the residing groundwater, and the time from recharge to discharge may be significantly shorter. The southern Ze’elim subsurface pathway (gully 14 to sinkhole 10a) shows a systematic increase in flow velocity throughout the 4 years of measurements (2019–2023) with no fluctuations that may indicate variations in the volumes of the residing water (Table 1). This observation supports the notion that the southern pathway has indeed widened throughout our study period. The central pathway lacks sufficient measurements to reach a similar conclusion.
5.2. Flood-Related Subsidence Mechanisms
Sinkhole clusters in Ze’elim are surrounded by subsiding depressions. Shviro et al. [4] showed a striking similarity between the exponential relaxation patterns of post-flood subsidence along active streambeds and water level decline in nearby boreholes. Considering several possible mechanisms, they attributed the post-flood subsidence relaxation to decreasing dissolution rates due to groundwater level drop and/or to viscoelastic relaxation. Our TLC observations of landslides around the recharging and discharging sinkholes during and immediately after the water level drop suggest that pore pressure drop and cohesion loss in the silty-clayey material play a dominant role in the subsidence mechanism. When water rises, pore pressure in the water-saturated sediments increases, maintaining the overall structure. Subsequently, as the water drains and their level drops, the effective stress (overburden minus pore pressure) increases [48], and the overlying layers respond by subsidence, landslides, or lateral spreading of the slopes near the rapidly draining water bodies (see also: https://www.youtube.com/watch?v=J3kkYWkq_M0, accessed on 30 August 2024). We thus propose that local slope failures due to pore-pressure drop and cohesion loss around recharging and discharging sinkholes dominate during the first hours after each flood, while relaxation due to groundwater level drop and/or viscoelastic effects dominate the deformation around the sinkholes in the following months.
5.3. Dynamics of Flood-Related Karst Evolution and Landscape Changes along the DS
Subsurface floodwater flows both at the Ze’elim and Hever alluvial fans. The large majority of Ze’elim floodwater is currently recharged through deepening and widening depressions around the streambed sinkholes. The recharged water continues eastward at the subsurface, discharging as brines in sinkholes along the DS shoreline shortly after each flood. The groundwater in most of the Ze’elim fan converges into one central discharge area east of the gully 10 depression. Here, a cluster of discharge sinkholes formed and continues to develop and grow at an unprecedented rate. In contrast, a considerable fraction of the Hever floodwater continues to flow at the surface directly to the DS, while only minor amounts of floodwater are recharged by sinkholes and discharge downstream either at shallow streambed sinkholes or at offshore springs.
We attribute the difference between the two fans to their topographic gradients and to the composition of their streambed sediments. The gradients of the lower ~2 km streams at Ze’elim are 1–3% (Figure 2), and the sediments are mostly fine-grained. Thus, the subsiding depressions and sinkholes in Ze’elim collect low-energy floodwater with mostly fine-grained material, which deposits within the depressions and may hold floodwater for short periods of hours to weeks [3]. As soon as new sinkholes open within these depressions, the floodwater in these ponds is rapidly drained to the subsurface. In contrast, the Hever stream gradients are 3–4.5% (Figure 2), carrying mostly coarse gravel that deposits in and around the Hever sinkholes (see positive values in Figure 11b), fills the internal drainage basins, and thus, most floodwater continues downstream at the surface. However, the eastern sinkhole sites in Hever, particularly in the southern branch, occur in the lower-gradient section of the fan (Figure 2 and Figure 11), where mostly fine material accumulated. Ongoing subsidence and ponding in these sites may, depending on the depth of the salt layer, develop with time into depressions deep enough to drain increasing volumes of floodwater. This process has recently stopped in the southern, mud-dominated branch due to its upstream diversion near the new bridge. In the northern branch, the eastern sinkholes formed in more gravelly sediment; the streambed is ~300 m wide, and the subsidence rates around these sinkholes are significantly lower than at the southern branch (Figure 11c). These depressions are thus unlikely to become large and deep enough to collect floodwater and eventually block the Hever fan in a similar manner as in Ze’elim.
Recharge of floodwater into sinkholes is common to most DS streambeds [4], yet its outcomes are different in each stream. We divide the DS streams into three categories. The first includes high-gradient streambeds (>5%) that incise into coarse gravel fans (red symbols in Figure 15; Figure S9). The fraction of recharged floodwater in those streams is minimal, despite the occurrence of sinkholes and subsidence along and across their course (Figure S9), and thus, the vast majority of floodwater continues at the surface to the DS. The second group includes low-gradient (<3%), mud-dominated streams (green symbols in Figure 15; Figure S10). Of these streams, the Og and Qumran streams in northern DS have no sinkholes due to the absence of a subsurface salt layer along their course and thus do not recharge any floodwater. At the southern part of the DS, the Mishmar stream and mudflats have a very low gradient (~1.5%). Its catchment area is small (~30 km2; ~10% of Ze’elim), and thus floods along this stream are relatively rare and small, as also evidenced by the lack of a fan delta. The Mishmar stream branches downstream near Highway 90 (Figure S10). A cluster of sinkholes surrounded by an internal depression developed along the southern branch, draining most of the floodwater along that branch (Figure S10b,c). The northern branch floodwater bypasses the sinkhole cluster, disperses within the low-gradient mudflats, and only rarely reaches the DS (Figure S10a). There is no evidence for water discharge downstream; however, a curvilinear trend of sinkholes and minor subsidence continues eastward from the sinkhole cluster and then northeastward to the DS shoreline, possibly indicating a subsurface dissolution channel (Figure S10a). Aerial photos show signs of underwater springs offshore at the continuation of that line (Figure S10d). The third group of streams has intermediate gradients of 3–5% (yellow symbols in Figure 15). Of these, the Qidron (Figure S11) and Hever are gravel-dominated, and thus most of their floodwater continues as surface runoff (see explanations above; Figure 12). The Tmarim streambed is mud-dominated at its eastern part. Sinkholes developed along the streambed close to the shoreline (Figure S12), yet most floodwater continues at the surface all the way to the DS. Of particular interest is a discharge sinkhole that formed underwater in 2017 and is currently exposed onshore (Figure S12c). The sinkhole resembles in shape the first discharge sinkhole at the Ze’elim shoreline in 2015 (Figure S5b). A new sinkhole is currently forming offshore southeast of sinkhole 3 (Figure S12d). LiDAR and InSAR provide indications for subsurface dissolution paths between sinkholes 1 and 2 and possibly also between sinkholes 1 and 3 (Figure S12a,b). However, as floods in Tmarim are relatively rare and the bathymetry east of the current shoreline steepens considerably (>12% [49]), we anticipate that future upstream incision due to the increased gradient will inhibit the formation of an internal depression sufficiently large to recharge floodwater.
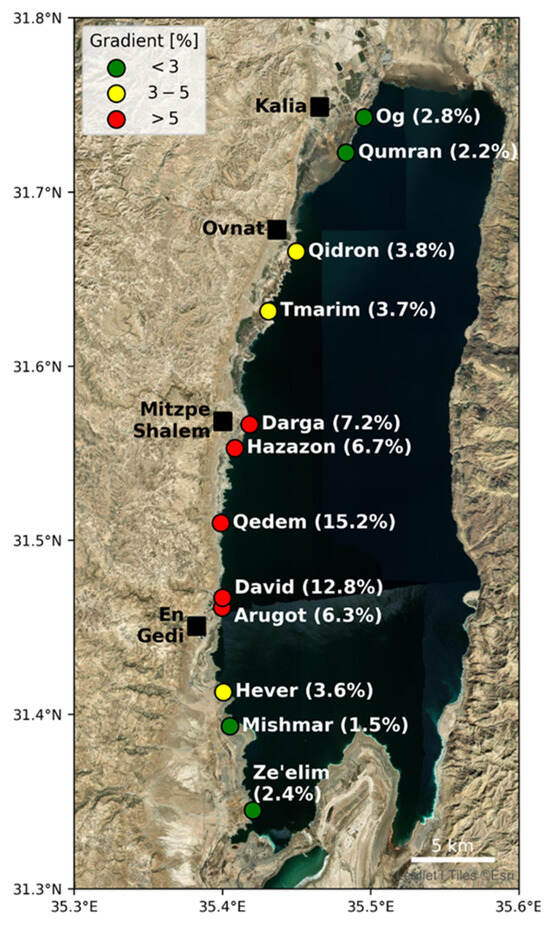
Figure 15.
Stream gradients along the western shoreline of the DS. Color legend distinguishes between low-gradient, mud-dominated streams (green); high-gradient, gravel-dominated streams (red); and intermediate-gradient mixed mud-gravel streams (yellow).
5.4. Implications for Sinkhole Hazard Assessment
Historically, the eastward flowing groundwater in the coastal aquifer of the DS was the major cause of salt dissolution and sinkhole formation. Salt dissolution by groundwater will continue as long as the groundwater level (or the hydraulic head above confined aquifers) remains within or above the salt layer. Thus, when groundwater levels drop below the salt layer, sinkhole formation by groundwater dissolution may terminate. Since 2011, seasonal floodwater that recharges through streambed sinkholes has become an important component in sinkhole formation [3,4]. As salt dissolution by floodwater is independent of the regional groundwater level, it is likely to continue well after groundwater levels drop below the salt layer. Its dissolving effect, however, is limited to the riverbeds and a few hundred-meter-wide zones on each side of their banks [4]. Our study shows that with the exception of Ze’elim, other streams show minor or no recharge along their course. These observations have implications for sinkhole hazard assessment along the DS riverbeds. The updated sinkhole susceptibility map [39] does not take into account any of these considerations, i.e., the effects of salt layer depth, groundwater level drop, or floodwater recharge. Future sinkhole susceptibility maps will have to consider all these parameters. To this end, floodwater recharge plays the most important role. Thus, understanding the factors that determine where and how this process will be operative is an important factor in future planning and sinkhole mitigation along the DS.
6. Summary and Conclusions
Subsurface karst plays a dominant role in landscape development along the Dead Sea shores. Recharge of floodwater by streambed sinkholes, subsurface flow, salt dissolution, and discharge of water near the DS shorelines have accelerated in the last decade, particularly in the Ze’elim alluvial fan. We used long-range (satellite SAR interferometry) and mid-range (airborne LiDAR) techniques to identify the location of the subsurface dissolution channels. Ground-based time-lapse cameras document the spatial and temporal progress of floodwater recharge and discharge, as well as slope failure in the subsiding depressions. In the Ze’elim fan, most of the surface runoff is recharged by sinkholes, and at least two expanding subsurface flow channels were detected. In the Hever fan, only a fraction of the runoff recharges at the streambed sinkholes, and most of the water continues beyond the recharging sinkholes directly to the DS. The different flow regimes in the two fans are attributed to the difference in stream gradients and sediment composition. The low-gradient, mud-dominated Ze’elim streambeds enable water accumulation and recharge in sinkholes, in contrast with the high-gradient coarse gravel streambeds in Hever, which yield high-energy floodwater flow and gravel accumulation within the sinkholes. Most other streambeds along the DS do not recharge floodwater along their courses, due to both high-gradient profiles and gravelly sediments or a lack of conditions for sinkhole formation. There are, however, two exceptions, the Tmarim and Mishmar streams. Both show evidence for floodwater recharge and initial development of subsurface karst; however, the low occurrence of floods in both streams and the expected high bathymetric gradient that will be exposed in Tmarim as DS water-level declines will most likely inhibit the development of significant recharge areas in these streams. Overall, our study provides observations of rapid karst development in salt, which occurs in other karst regions worldwide at different temporal and spatial scales but may affect long-term landscape evolution in a similar manner. Identifying the factors that govern the flood-related sinkhole formation is thus crucial for predicting the geomorphological development of the DS shores or other karst zones and for sinkhole hazard assessment.
Supplementary Materials
The following supporting information can be downloaded at: https://www.mdpi.com/article/10.3390/rs16173294/s1. Figure S1: Surface elevation changes between 2011 and 2023 in the Ze’elim fan, draped upon LiDAR DSM, showing the formation of internal depressions along most of the Ze’elim gullies Gully numbers in white, from north to south, after Avni et al. 2016; Figure S2: GIF animation showing the development of sinkholes, subsidence and gullies at the Ze’elim fan between 2005 and 2023 Provided as a separate file; Figure S3: GIF animation of LiDAR differential maps of the lower section of gully 3 between 2011 and 2023 For location, see Figure S1. Note the depression that developed at the central part of the image since 2022 Provided as a separate file. Figure S4: Elevation maps draped upon hill-shaded DSMs for the years 2011–2019 for the southern part of the Ze’elim Fan. Note the seaward migration of sinkholes in Gully 10 and the widening of the sinkholes in gullies 7 and 14. White circles mark the first shoreline discharge sinkhole (2015). Figure S5: The first shoreline discharge sinkhole in Ze’elim fan. For location, see Figure S4. (a) Oblique aerial photo, 30 September 2014. (b) TLC picture, 20 February 2015. Figure S6: Discharge sinkholes at the lower end of gully 10 and their outflow channel to the DS. For location, see Figure 5. (a) Oblique drone photograph, 7 February 2019. White star marks the location of the first discharge sinkhole in 2015 (Figures S4 and S5). (b) 2023 aerial photo showing the outflow channel and groundwater discharge at the shoreline south of the channel. Figure S7: Time-series of drone-based rectified photographs showing the development of the discharge sinkholes at the lower end of gully 10 between January 2018 and November 2022. Note the evidence for significant overflow from the western sinkhole (black arrows in panels (c) and (d)), which occurred immediately after the exceptional flood event of 26–28 April 2018. Figure S8: (a-e) Drone-based topographic models showing the development of the recharge sinkhole at gully 14 between March 2018 and August 2021. (f) A rectified photograph of the discharge sinkhole site in August 2021. Blue arrows mark the floodwater direction. Note the eastward migration and the deepening of the depression with time. Figure S9: Sinkholes and subsidence across high-gradient riverbeds. For location, see Fig. 15. (a, c, and e) LiDAR change maps between 2011 and 2023 of the Darga, Hazazon and Arugot riverbeds, respectively, showing that river incision and flow continue despite the subsidence. (b, d, and f) Interferograms showing the subsidence across the three streambeds. Figure S10: Sinkholes and subsidence along the Mishmar low-gradient riverbed. For location, see Figure 15. (a) LiDAR change map between 2014 and 2023 showing mild curvilinear subsidence east of the sinkholes (white arrows). Orange arrow marks the crossing point of Highway 90. (b) Zoom on the sinkhole site (see location in panel a), showing the southern braided streambeds draining into sinkholes (blue arrow) and a northern streambed bypassing the sinkholes. The NW-SE lineaments are abandoned shorelines left by the declining waters of the DS (c) View to the east on one of the drained streambeds. Blue arrow marks the flow direction. (d) Aerial photo of the fan shoreline in 2023 showing evidence for underwater springs (marked by white arrow). Figure S11: Sinkholes and subsidence across the Qidron intermediate-gradient gravel riverbed. For location, see Figure 15. (a) LiDAR change maps between 2017 and 2023, showing that river incision and flow continue despite the subsidence. (b) Interferogram showing the subsidence across the streambed. Figure S12: Sinkholes and subsidence along the Tmarim intermediate-gradient mud-dominated streambeds. For location, see Figure 15. (a) LiDAR change maps between 2017 and 2023 showing the NE-striking subsidence strip that connects sinkhole 1 with sinkhole 2. (b) Interferogram showing the subsidence lineaments between sinkholes 1 and 2 and between the northern sinkholes and the shoreline (white arrows). (c) Shoreline sinkhole 3 (location in panel b). (d) Underwater sinkhole (March 2024) southeast of sinkhole 3.
Author Contributions
Conceptualization, G.B. and I.G.; software, R.N.N. and I.S.; writing—original draft preparation, G.B.; writing—review and editing, I.G. and R.N.N.; visualization, G.B., R.N.N. and I.S.; funding acquisition, G.B. and I.G. All authors have read and agreed to the published version of the manuscript.
Funding
The research was funded by the Ministry of Prime Minister, Israel, under Israeli Government decision 3742.
Data Availability Statement
The datasets presented in this article are not readily available because the data are still part of an ongoing study. Requests to access the datasets should be directed to the first author.
Acknowledgments
We highly appreciate the comments made by three anonymous reviewers that significantly improved this paper. We thank the Dead Sea Works for kindly providing the floodwater level data. E. Levy is acknowledged for his contribution to identifying the “Sinkhole Salt” layer distribution at the subsurface and its surface exposure.
Conflicts of Interest
The authors declare no conflicts of interest. The funders had no role in the design of this study, in the collection, analysis, or interpretation of data, in the writing of the manuscript, or in the decision to publish the results.
References
- Frumkin, A. New Developments of Karst Geomorphology Concepts. In Treatise on Geomorphology; Frumkin, A., Ed.; Elsevier: Amsterdam, The Netherlands, 2013; pp. 1–13. ISBN 978-0-08-088522-3. [Google Scholar]
- Gutiérrez, F.; Parise, M.; De Waele, J.; Jourde, H. A Review on Natural and Human-Induced Geohazards and Impacts in Karst. Earth-Sci. Rev. 2014, 138, 61–88. [Google Scholar] [CrossRef]
- Avni, Y.; Lensky, N.; Dente, E.; Shviro, M.; Arav, R.; Gavrieli, I.; Yechieli, Y.; Abelson, M.; Lutzky, H.; Filin, S.; et al. Self-Accelerated Development of Salt Karst during Flash Floods along the Dead Sea Coast, Israel. J. Geophys. Res. Earth Surf. 2016, 121, 17–38. [Google Scholar] [CrossRef]
- Shviro, M.; Haviv, I.; Baer, G. High-Resolution InSAR Constraints on Flood-Related Subsidence and Evaporite Dissolution along the Dead Sea Shores: Interplay between Hydrology and Rheology. Geomorphology 2017, 293, 53–68. [Google Scholar] [CrossRef]
- Gutiérrez, F. Gypsum Karstification Induced Subsidence: Effects on Alluvial Systems and Derived Geohazards (Calatayud Graben, Iberian Range, Spain). Geomorphology 1996, 16, 277–293. [Google Scholar] [CrossRef]
- Benito, G.; Pérez-González, A.; Gutiérrez, F.; Machado, M.J. River Response to Quaternary Subsidence Due to Evaporite Solution (Gállego River, Ebro Basin, Spain). Geomorphology 1998, 22, 243–263. [Google Scholar] [CrossRef]
- Guerrero, J.; Gutiérrez, F.; Lucha, P. Impact of Halite Dissolution Subsidence on Quaternary Fluvial Terrace Development: Case Study of the Huerva River, Ebro Basin, NE Spain. Geomorphology 2008, 100, 164–179. [Google Scholar] [CrossRef]
- Parise, M.; Gunn, J. Natural and Anthropogenic Hazards in Karst Areas: An Introduction. Geol. Soc. Lond. Spec. Publ. 2007, 279, 1–3. [Google Scholar] [CrossRef]
- De Waele, J.; Gutiérrez, F.; Parise, M.; Plan, L. Geomorphology and Natural Hazards in Karst Areas: A Review. Geomorphology 2011, 134, 1–8. [Google Scholar] [CrossRef]
- López-Chicano, M.; Calvache, M.L.; Martín-Rosales, W.; Gisbert, J. Conditioning Factors in Flooding of Karstic Poljes—The Case of the Zafarraya Polje (South Spain). Catena 2002, 49, 331–352. [Google Scholar] [CrossRef]
- Delle Rose, M. Sinkhole Flooding and Aquifer Recharge in Arid to Dry Sub-Humid Regions: A Systematic Review in the Perspective of Climate Change. Hydrology 2022, 9, 25. [Google Scholar] [CrossRef]
- Bonacci, O.; Ljubenkov, I.; Roje-Bonacci, T. Karst Flash Floods: An Example from the Dinaric Karst (Croatia). Nat. Hazards Earth Syst. Sci. 2006, 6, 195–203. [Google Scholar] [CrossRef]
- Bailly-Comte, V.; Jourde, H.; Roesch, A.; Pistre, S. Mediterranean Flash Flood Transfer through Karstic Area. Environ. Geol. 2008, 54, 605–614. [Google Scholar] [CrossRef]
- Bailly-Comte, V.; Jourde, H.; Roesch, A.; Pistre, S.; Batiot-Guilhe, C. Time Series Analyses for Karst/River Interactions Assessment: Case of the Coulazou River (Southern France). J. Hydrol. 2008, 349, 98–114. [Google Scholar] [CrossRef]
- Najib, K.; Jourde, H.; Pistre, S. A Methodology for Extreme Groundwater Surge Predetermination in Carbonate Aquifers: Groundwater Flood Frequency Analysis. J. Hydrol. 2008, 352, 1–15. [Google Scholar] [CrossRef]
- Tsui, P.C.; Cruden, D.M. Deformation Associated with Gypsum Karst in the Salt River Escarpment, Northeastern Alberta. Can. J. Earth Sci. 1984, 21, 949–959. [Google Scholar] [CrossRef]
- Seijmonsbergen, A.C.; De Graaff, L.W.S. Geomorphological Mapping and Geophysical Profiling for the Evaluation of Natural Hazards in an Alpine Catchment. Nat. Hazards Earth Syst. Sci. 2006, 6, 185–193. [Google Scholar] [CrossRef]
- Alberto, W.; Giardino, M.; Martinotti, G.; Tiranti, D. Geomorphological Hazards Related to Deep Dissolution Phenomena in the Western Italian Alps: Distribution, Assessment and Interaction with Human Activities. Eng. Geol. 2008, 99, 147–159. [Google Scholar] [CrossRef]
- Mège, D.; Le Deit, L.; Rango, T.; Korme, T. Gravity Tectonics of Topographic Ridges: Halokinesis and Gravitational Spreading in the Western Ogaden, Ethiopia. Geomorphology 2013, 193, 1–13. [Google Scholar] [CrossRef]
- Klimchouk, A.B.; Aksem, S.D. Hydrochemistry and Solution Rates in Gypsum Karst: Case Study from the Western Ukraine. Environ. Geol. 2005, 48, 307–319. [Google Scholar] [CrossRef]
- Ben Moshe, L.; Lensky, N.G. Geomorphological Response of Alluvial Streams to Flood Events during Base-Level Lowering: Insights from Drone-Based Photogrammetric Surveys in Dead Sea Tributaries. Remote Sens. 2024, 16, 1346. [Google Scholar] [CrossRef]
- Wachs, D.; Yechieli, Y.; Shtivelman, V.; Itamar, A.; Baer, G.; Goldman, M.; Raz, E.; Rybekov, M.; Schattner, U. Formation of Sinkholes along the Dead Sea Shore, Summary of Findings from the First Stage of Research; Geological Survey of Israel Report: Jerusalem, Israel, 2000; p. 49, (In Hebrew, English abstract). [Google Scholar]
- Arkin, Y.; Gilat, A. Dead Sea Sinkholes—An Ever-Developing Hazard. Environ. Geol. 2000, 39, 711–722. [Google Scholar] [CrossRef]
- Abelson, M.; Yechieli, Y.; Crouvi, O.; Baer, G.; Wachs, D.; Bein, A.; Shtivelman, V. Evolution of the Dead Sea Sinkholes. Geol. Soc. Am. Spec. Pap. 2006, 401, 241–253. [Google Scholar] [CrossRef]
- Yechieli, Y.; Abelson, M.; Bein, A.; Crouvi, O.; Shtivelman, V. Sinkhole “Swarms” along the Dead Sea Coast: Reflection of Disturbance of Lake and Adjacent Groundwater Systems. Geol. Soc. Am. Bull. 2006, 118, 1075–1087. [Google Scholar] [CrossRef]
- Baer, G.; Bernstein, M.; Yechieli, Y.; Nof, R.N.; Abelson, M.; Gavrieli, I. Elevation and Thickness of the 11–10 Kyr Old ‘Sinkholes Salt’ Layer in the Dead Sea: Clues to Past Limnology, Paleo-Bathymetry and Lake Levels. J. Paleolimnol. 2023, 70, 159–173. [Google Scholar] [CrossRef]
- Gutiérrez, F.; Cooper, A.H.; Johnson, K.S. Identification, Prediction, and Mitigation of Sinkhole Hazards in Evaporite Karst Areas. Environ. Geol. 2008, 53, 1007–1022. [Google Scholar] [CrossRef]
- Arav, R.; Filin, S.; Avni, Y. Monitoring Changes along Receding Lake Environments. In Proceedings of the FIG Working Week 2012, Rome, Italy, 6–10 May 2012; p. 12. [Google Scholar]
- Filin, S.; Baruch, A.; Morik, S.; Avni, Y.; Marco, S. Use of Airborne Laser Scanning to Characterise Land Degradation Processes—The Dead Sea as a Case Study. Surv. Rev. 2012, 44, 84–90. [Google Scholar] [CrossRef]
- Freund, R. A Model of Structural Development of Israel and Adjacent Areas Since the Upper Cretaceous Times. Geol. Mag. 1965, 102, 189–205. [Google Scholar] [CrossRef]
- Garfunkel, Z. The History and Formation of the Dead Sea Basin. In The Dead Sea: The Lake and Its Setting; Niemi, T.M., Ben Avraham, Z., Gat, J., Eds.; Oxford monographs on geology and geophysics no. 36; Oxford University Press: Oxford, UK, 1997; ISBN 0-19-508703-8. [Google Scholar]
- Neev, D.; Hall, J.K. Geophysical Investigations in the Dead Sea. New Asp. Sediment. Small Ocean. Basins 1979, 23, 209–238. [Google Scholar] [CrossRef]
- Hall, J.K. Digital Topography and Bathymetry of the Area of the Dead Sea Depression. Dyn. Extensional Basins Invers. Tecton. 1996, 266, 177–185. [Google Scholar] [CrossRef]
- Yechieli, Y.; Ronen, D.; Berkowitz, B.; Dershowitz, W.S.; Hadad, A. Aquifer Characteristics Derived From the Interaction Between Water Levels of a Terminal Lake (Dead Sea) and an Adjacent Aquifer. Water Resour. Res. 1995, 31, 893–902. [Google Scholar] [CrossRef]
- Begin, Z.B.; Ehrlich, A.; Nathan, Y. Lake Lisan: The Pleistocene Precursor of the Dead Sea; Geological Survey of Israel Bulletin: Jerusalem, Israel, 1974; Volume 63. [Google Scholar]
- Yechieli, Y.; Magaritz, M.; Levy, Y.; Weber, U.; Kafri, U.; Woelfli, W.; Bonani, G. Late Quaternary Geological History of the Dead Sea Area, Israel. Quat. Res. 1993, 39, 59–67. [Google Scholar] [CrossRef]
- Stein, M.; Torfstein, A.; Gavrieli, I.; Yechieli, Y. Abrupt Aridities and Salt Deposition in the Post-Glacial Dead Sea and Their North Atlantic Connection. Quat. Sci. Rev. 2010, 29, 567–575. [Google Scholar] [CrossRef]
- Glennie, C.L.; Carter, W.E.; Shrestha, R.L.; Dietrich, W.E. Geodetic Imaging with Airborne LiDAR: The Earth’s Surface Revealed. Rep. Prog. Phys. 2013, 76, 086801. [Google Scholar] [CrossRef] [PubMed]
- Abelson, M.; Yechieli, Y.; Nof, R.; Baer, G. Levels of Sinkhole Susceptibility along the Western Coast of the Dead Sea; Geological Survey of Israel: Jerusalem, Israel, 2020; p. 37. [Google Scholar]
- Nof, R.N.; Baer, G.; Ziv, A.; Raz, E.; Atzori, S.; Salvi, S. Sinkhole Precursors along the Dead Sea, Israel, Revealed by SAR Interferometry. Geology 2013, 41, 1019–1022. [Google Scholar] [CrossRef]
- Nof, R.N.; Abelson, M.; Raz, E.; Magen, Y.; Atzori, S.; Salvi, S.; Baer, G. SAR Interferometry for Sinkhole Early Warning and Susceptibility Assessment along the Dead Sea, Israel. Remote Sens. 2019, 11, 89. [Google Scholar] [CrossRef]
- Massonnet, D.; Feigl, K.L. Radar Interferometry and Its Application to Changes in the Earth’s Surface. Rev. Geophys. 1998, 36, 441–500. [Google Scholar] [CrossRef]
- Goldstein, R.M.; Werner, C.L. Radar Interferogram Filtering for Geophysical Applications. Geophys. Res. Lett. 1998, 25, 4035–4038. [Google Scholar] [CrossRef]
- Ford, D.C. Perspectives in Karst Hydrogeology and Cavern Genesis. In Karst Modeling: Special Publication 5; The Karst Waters Institute: Charles Town, WE, USA, 2003; Volume 1, pp. 1–12. [Google Scholar]
- Dreybrodt, W.; Gabrovšek, F. Basic Processes and Mechanisms Governing the Evolution of Karst. Speleogenesis Evol. Karst Aquifers 2003, 1, 115–154. [Google Scholar]
- Benson, R.C.; Yuhr, L.B. Karst Maturity and Development. In Site Characterization in Karst and Pseudokarst Terraines; Springer: Dordrecht, The Netherlands, 2016; pp. 35–40. ISBN 978-94-017-9923-2. [Google Scholar]
- Dreybrodt, W. Models of Karst Development from the Initial State to Maturity. In Processes in Karst Systems; Springer Series in Physical Environment; Springer: Berlin/Heidelberg, Germany, 1988; Volume 4, pp. 218–255. ISBN 978-3-642-83354-0. [Google Scholar]
- Terzaghi, K. Principles of Soil Mechanics. IV. Settlement and Consolidation of Clay. Eng. News-Rec. 1925, 95, 874. [Google Scholar]
- Ben Moshe, L.; Lensky, N.G. Increased Deviation of Dead Sea Tributaries from Steady State and Recommendations for Infrastructure Planning in Changing Conditions; The Geological Survey of Israel: Jerusalem, Israel, 2020; p. 30. (In Hebrew) [Google Scholar]


Disclaimer/Publisher’s Note: The statements, opinions and data contained in all publications are solely those of the individual author(s) and contributor(s) and not of MDPI and/or the editor(s). MDPI and/or the editor(s) disclaim responsibility for any injury to people or property resulting from any ideas, methods, instructions or products referred to in the content. |
© 2024 by the authors. Licensee MDPI, Basel, Switzerland. This article is an open access article distributed under the terms and conditions of the Creative Commons Attribution (CC BY) license (https://creativecommons.org/licenses/by/4.0/).