Article

Assessment of Commercial GNSS Radio Occultation Performance from PlanetiQ Mission

1
Public Works Engineering Department, Faculty of Engineering, Mansoura University, Mansoura 35516, Egypt
2
Geodynamic Department, National Research Institute of Astronomy and Geophysics, Helwan 11421, Egypt
3
Shanghai Astronomical Observatory, Chinese Academy of Sciences, Shanghai 200030, China
4
School of Astronomy and Space Science, University of Chinese Academy of Sciences, Beijing 100049, China
5
Department of Geography and Environmental Sustainability, College of Humanities and Social Sciences, Princess Nourah bint Abdulrahman University, P.O. Box 84428, Riyadh 11671, Saudi Arabia
6
School of Surveying and Land Information Engineering, Henan Polytechnic University, Jiaozuo 454003, China
*
Author to whom correspondence should be addressed.
Remote Sens. 2024, 16(17), 3339; https://doi.org/10.3390/rs16173339 (registering DOI)
Submission received: 28 July 2024 / Revised: 30 August 2024 / Accepted: 6 September 2024 / Published: 8 September 2024
(This article belongs to the Special Issue BDS/GNSS for Earth Observation: Part II)

Abstract

:
Global Navigation Satellite System (GNSS) radio occultation (RO) provides valuable 3-D atmospheric profiles with all-weather, all the time and high accuracy. However, GNSS RO mission data are still limited for global coverage. Currently, more commercial GNSS radio occultation missions are being launched, e.g., PlanetiQ. In this study, we examine the commercial GNSS RO PlanetiQ mission performance in comparison to KOMPSAT-5 and PAZ, including the coverage, SNR, and penetration depth. Additionally, the quality of PlanetiQ RO refractivity profiles is assessed by comparing with the fifth-generation European Centre for Medium-Range Weather Forecasts (ECMWF) atmospheric reanalysis (ERA5) data in October 2023. Our results ensure that the capability of PlanetiQ to track signals from any GNSS satellite is larger than the ability of KOMPSAT-5 and PAZ. The mean L1 SNR for PlanetiQ is significantly larger than that of KOMPSAT-5 and PAZ. Thus, PlanetiQ performs better in sounding the deeper troposphere. Furthermore, PlanetiQ’s average penetration height ranges from 0.16 to 0.49 km in all latitudinal bands over water. Generally, the refractivity profiles from all three missions exhibit a small bias when compared to ERA5-derived refractivity and typically remain below 1% above 800 hPa.

1. Introduction

Global Navigation Satellite System (GNSS) radio occultation (RO) is a remote sensing method that enables low-Earth-orbit (LEO) satellites to capture GNSS signals and use them to determine the Earth’s meteorological characteristics [1,2]. GNSS RO offers unique characteristics such as high vertical resolution, global coverage, high accuracy, long-term stability, and all-weather capability [2,3,4,5]. Global coverage is provided by RO measurements, which include views over the polar regions and seas, which are inaccessible areas for other detection methods like radar and radiosonde [6,7]. Remote sensing using RO is self-calibrated. The RO sensor does not need to be calibrated again after it is installed on an orbiting satellite [6]. As a result, GNSS RO data products have been extensively employed in global climate monitoring [8,9] and numerical weather prediction (NWP) applications [1,10,11,12].
Utilizing the GNSS RO has advanced importance as a satellite remote sensing method for observing the atmosphere, including the ionosphere, stratosphere, and troposphere, since the GPS/Meteorology (GPS/MET) project was launched in 1995 [13]. The GNSS RO technique’s capacity to observe Earth’s atmosphere is demonstrated by the GPS/MET mission’s success. Two GPS RO missions, the German CHAMP and the Argentinean SAC-C, were launched in 2000 after GPS/MET [14].
In addition, several missions, including COSMIC-1, GRACE, CHAMP, and SAC-C/D, have been retired [6]. Further RO observations from commercial missions, as well as those from MetOp, Spanish PAZ, Korea Multi-Purpose Satellite-5 (KOMPSAT-5), COSMIC-2, Sentinel-6, and other missions, have aided in operational NWP and research [2,5,13,15,16]. It is important to note that RO observations can only be obtained at the middle and low latitudes by COSMIC-2, the mission that replaces FORMOSAT-3/COSMIC. COSMIC-2 data cover mainly from 45°N to 45°S; this is because the mission’s six LEO satellites have a low inclination angle (24°) [17], while KOMPSAT-5 and PAZ have a global spatial distribution. Both the GPS and the GLONASS can transmit signals to the COSMIC-2 satellites [18]. For operational NWP applications, COSMIC-2 is the first RO sensor capable of providing routine GLONASS GNSS-RO measurements [19].
The KOMPSAT-5 satellite was launched in 2013 into a sun-synchronous polar orbit. The primary payload of the KOMPSAT-5 mission is a synthetic aperture radar (SAR). The atmospheric occultation and precision orbit determination instrument is a secondary atmospheric RO payload carried by the low-Earth orbiting satellite mission KOMPSAT-5. The nominal altitude of the KOMPSAT-5 satellite is 550 km, with an inclination angle of 97.68 [20]. Data collection was delayed by around 12 h due to receiving ground station network limitations, which made it challenging to use in the numerical weather forecast model [21]. A GPS RO payload is part of the Spanish low-Earth orbiting PAZ satellite program. On 22 February 2018, PAZ was launched into a sun-synchronous polar orbit together with RO and heavy precipitation with PAZ, which was its secondary payload. The data are being delayed significantly because of issues with the satellite’s link to the ground infrastructure [22].
More generally, increasing the number of receiving GNSS RO signal systems from GPS, Galileo, GLONASS, and the Chinese BeiDou Satellite Navigation System (BDS) is an approach used by some GNSS RO missions to increase the number of GNSS RO events and enhance the accuracy of NWP [23]. To deliver additional occultation observations, commercial satellites like Spire and GeoOptics also increased the capacity of their RO satellite network [24]. For instance, the GPS, Galileo, and GLONASS systems transmit occultation signals to the Spire mission. There are also commercial high-gain missions, such as PlanetiQ [25].
PlanetiQ’s satellites carry the fourth generation “Pyxis” RO sensor. Pyxis, the world’s greatest weather sensor, was created by PlanetiQ. The Pyxis RO sensor has almost three times the data gathering capacity compared to previous models while being lighter, smaller, and using less power. All four global GNSS constellations (GPS, GLONASS, Galileo, and BDS) send signals to it [26]. The public GNSS signals from the GPS (L1 and L2), Galileo (E1 and E5), GLONASS (FDMA signals centered at L1 and L2), and BeiDou (B1 and B2) constellations are intended to be received by the Pyxis-RO sensors. PlanetiQ has high-gain antennas that provide very high SNRs across the globe [27]. By utilizing an existing satellite-based relay system in geostationary Earth orbit, the data will have an average latency of less than three minutes. This low latency is essential for evolving weather and space weather forecasting requirements, offering a significant improvement over a typical delivery time [28].
The power of the RO signal diminishes as it gets closer to the Earth’s surface because GNSS radio signals attenuate more with an increase in the density of air and water vapor pressure [29]. One of the key indicators of the quality of RO measurements is the signal–noise ratio (SNR) of the RO signal. The SNR is calculated by dividing the RO signal magnitude by the receiver noise level in the voltage-to-voltage unit ( v / v ) [30,31]. The amplitude of the SNR will be higher when RO signals are stronger or the noise level is lower, which might confirm a higher-quality observation [30]. Deeper penetration of the GNSS-RO measurements is critically limited by the SNR [13,31]. Three key aspects of high SNR are the penetration of lower troposphere sounds, the identification of sharp tops in the atmospheric boundary layer (ABL), and the detection of super-refraction (SR) on top of the ABL [31,32].
In this context, as the GNSS signal passes through the atmosphere, it becomes bent and delayed due to the refractivity gradient [2,33,34]. Basic measurements of important parameters with high vertical resolution, including bending angle (BA), refractivity, temperature, pressure, and water vapor, are provided by GNSS RO through the measurement of signal delay and bend [35,36]. Cumulative BA may be obtained using GNSS measurements and the orbits of LEO and GNSS satellites using geometric optics (GOs) and wave optics (WOs) approaches [34].
Furthermore, the standard relationship between the Doppler frequency (i.e., the time derivative of phase), the impact parameter, and the BA is implemented by the GO retrieval of the BA [37]. Three options are available for WO retrieving BAs: back propagation (BP), canonical transform of the first type applied after BP, and canonical transform of the second type [37]. The first-order ionospheric errors are then eliminated by linearly combining the BAs that were obtained from the two frequencies of the GNSS satellites [5]. The linearly combined BAs are usually subjected to a high-altitude initialization technique to generate “optimized” BAs, which are subsequently utilized by the Abel integration to recover atmospheric refractivity [5,34].
This study aims to analyze the spatial distribution of PlanetiQ and other RO missions (KOMPSAT-5 and PAZ) and investigate the SNR latitudinal distribution for these missions. We used KOMPSAT-5 and PAZ for intercomparison with the PlanetiQ data. This study also investigates the lowest penetration height for PlanetiQ and other RO missions (KOMPSAT-5 and PAZ) and evaluates the refractivity and temperature from these missions with the fifth-generation European Centre for Medium-Range Weather Forecasts (ECMWF) atmospheric reanalysis (ERA5). Additionally, by using this information, future improvements to GNSS RO retrievals and data assimilation will have greater guidance. A limitation of this study is the short time span. This study relies on data from October 2023 alone.
The structure of the paper is as follows: In Section 2, we outline the data products from each of the relevant RO missions and ERA5, the distribution of GNSS RO data, and the RO data processing chain. In Section 3, we discussed the results and analysis. We discuss SNR latitudinal distribution, lowest penetration height, and assessment of the PlanetiQ refractivity and temperature accuracy. In Section 4, we offer our conclusions.

2. Data and Methods

2.1. GNSS-RO Data

This study utilizes RO profiles processed by the COSMIC Data Analysis and Archive Center (CDAAC), which can be accessed through the CDAAC website (http://www.cosmic.ucar.edu, accessed on 1 January 2024). Specifically, we employed the CDAAC atmospheric profiles named “atmPrf” from KOMPSAT-5, PAZ, and PlanetiQ missions. KOMPSAT-5, PAZ, and PlanetiQ RO data in October 2023 are used in the current investigation.
A more uniform distribution of occultation occurrences globally will result in a more consistent and accurate global NWP with respect to geographic distribution. GNSS RO events’ global distribution from KOMPSAT-5 and PAZ observed on DOY 274 in 2023 are illustrated in Figure 1. Additionally, Figure 2 presents the GNSS RO events’ distribution from PlanetiQ also on DOY 274 in 2023. As illustrated in Figure 1, KOMPSAT-5 and PAZ capture signals from GPS only, and RO profiles are scattered globally. The blue dots indicate GPS RO events, the red dots indicate Galileo RO events, the green dots represent GLONASS RO events, and the orange dots represent BDS RO events. As shown in Figure 2, PlanetiQ captures signals from GPS, Galileo, GLONASS, and BDS. Additionally, as presented in Figure 1 and Figure 2, KOMPSAT-5, PAZ, and PlanetiQ provide a global spatial distribution.
Monthly event numbers from KOMPSAT-5, PAZ, and PlanetiQ are shown in Figure 3a. It is anticipated that there will be more observations of Earth’s atmosphere due to the increased number of RO satellites available. For weather research on tropical cyclones and sudden stratospheric warming occurrences, this is therefore highly beneficial [38]. Additionally, Figure 3a highlights PlanetiQ’s capability to track multiple GNSS signals, which broadens the possibilities for global meteorological monitoring. Moreover, the profile number of PlanetiQ with occultation signals coming from GPS and BDS is higher than that of Galileo and GLONASS. Hence, the coverage area of RO events by PlanetiQ from any signal from GPS, Galileo, GLONASS, or BDS is wider than that of KOMPSAT-5 or PAZ.
Additionally, based on the relative movement pattern of the occultation observation, the RO events may be categorized into two modes: rising occultation or setting occultation. Rising and setting profile percentages for PlanetiQ with occultation signals coming from GPS, Galileo, GLONASS, and BDS in October 2023 are depicted in Figure 3b. As illustrated in Figure 3, the percentage of setting RO events for PlanetiQ is greater than the percentage of rising events for all signals coming from GPS, Galileo, GLONASS, and BDS.

2.2. ERA5 Datasets

The fifth generation of global atmospheric reanalysis products is called ERA5 [39]. To validate the accuracy of RO profiles, ERA5 reanalysis data from October 2023 are employed. This dataset, provided by the European Centre for Medium-Range Weather Forecast (ECMWF), offers a horizontal resolution of 0.25° × 0.25° and comprises 37 vertical layers (vertical resolution) from 1000 hPa to 1 hPa. ERA5 reanalysis data can be downloaded from https://www.ecmwf.int/ (accessed on 16 February 2024). The Smith–Weintraub equation is used to determine refractivity N, which is not provided directly by ERA5.

2.3. Methods

L1 SNR is determined by averaging the SNR values of the L1 signal throughout a geometric height range of 60 km to 80 km [40]. According to Ho et al. (2020), increasing SNR can enhance penetration deeper into the lower troposphere and improve data quality [16]. The ionospheric D-layer is covered by the 60–80 km height range, which is ideal for estimating the strength of the signal that would be detected in the absence of an atmosphere [31]. It is high enough to make the attenuation from regular atmospheric refraction insignificant [40]. However, at these altitudes, the ionosphere’s influence can be observed in minor fluctuations that have little effect on the average value [31]. The E-layer, where the amplitude perturbation may be larger, is not reached by this height range [41]. To quantify the signal strength, the average SNR in this height range was introduced in [14].
Refractivity is a function of temperature and pressure in the stratosphere and temperature, moisture, and pressure in the troposphere [42,43]. The ERA5-derived refractivity is calculated as follows by Smith and Weintraub (1953) [44]:
N = 77.6 p T + 3.73 × 10 5 e T 2
where p is the pressure of the atmosphere in hPa, T is the air temperature in K , and e is the water vapor pressure in hPa.
The ERA5-derived refractivity data have a spatial resolution of 0.25° × 0.25° and a temporal resolution of 1 h. The interpolation process begins by first interpolating the ERA5 refractivity data grid to the location of the RO profiles (e.g., 119.3°E, 0.1°N) using bilinear interpolation. Subsequently, the ERA5 refractivity data are interpolated to match the exact observation time of the RO profiles (e.g., 00:30 UTC). The interpolation algorithm integrates the three dimensions (latitude, longitude, and time) using linear interpolation.
Hence, to compare the ERA5-derived refractivity and RO refractivity, we first employ bilinear interpolation, as illustrated before, to map the gridded ERA5 data to the profile locations. Then, for comparing RO refractivity with the 37-layer ERA5 data, we adopt the nearest interpolation to match RO profiles to the ERA5 layers. In this study, bilinear and nearest neighbor interpolation are applied, as they are two fundamental methods commonly used in GNSS- and ERA5-related assessments [45]. Due to the diverse scales of refractivity between the lower and upper atmospheres, we focus on the fractional difference between observed and ERA5-derived refractivity. In this study, the mean fractional bias (MFB) and RMSE (MFR) of refractivity used in the statistical calculations are calculated by the following equations:
M F B k = 1 N k i = 1 N k R r o i , k R e r a 5 i , k R e r a 5 i , k
M F R k = 1 N k i = 1 N k R r o i , k R e r a 5 i , k R e r a 5 i , k 2
where R r o denotes the RO refractivity, and R e r a 5 denotes the ERA5-derived refractivity. N is the total number of observations, and the superscripts i and k are the i th observation and kth layer, respectively. Figure 4 shows the block diagram for the main processing used in this study.

3. Results and Analysis

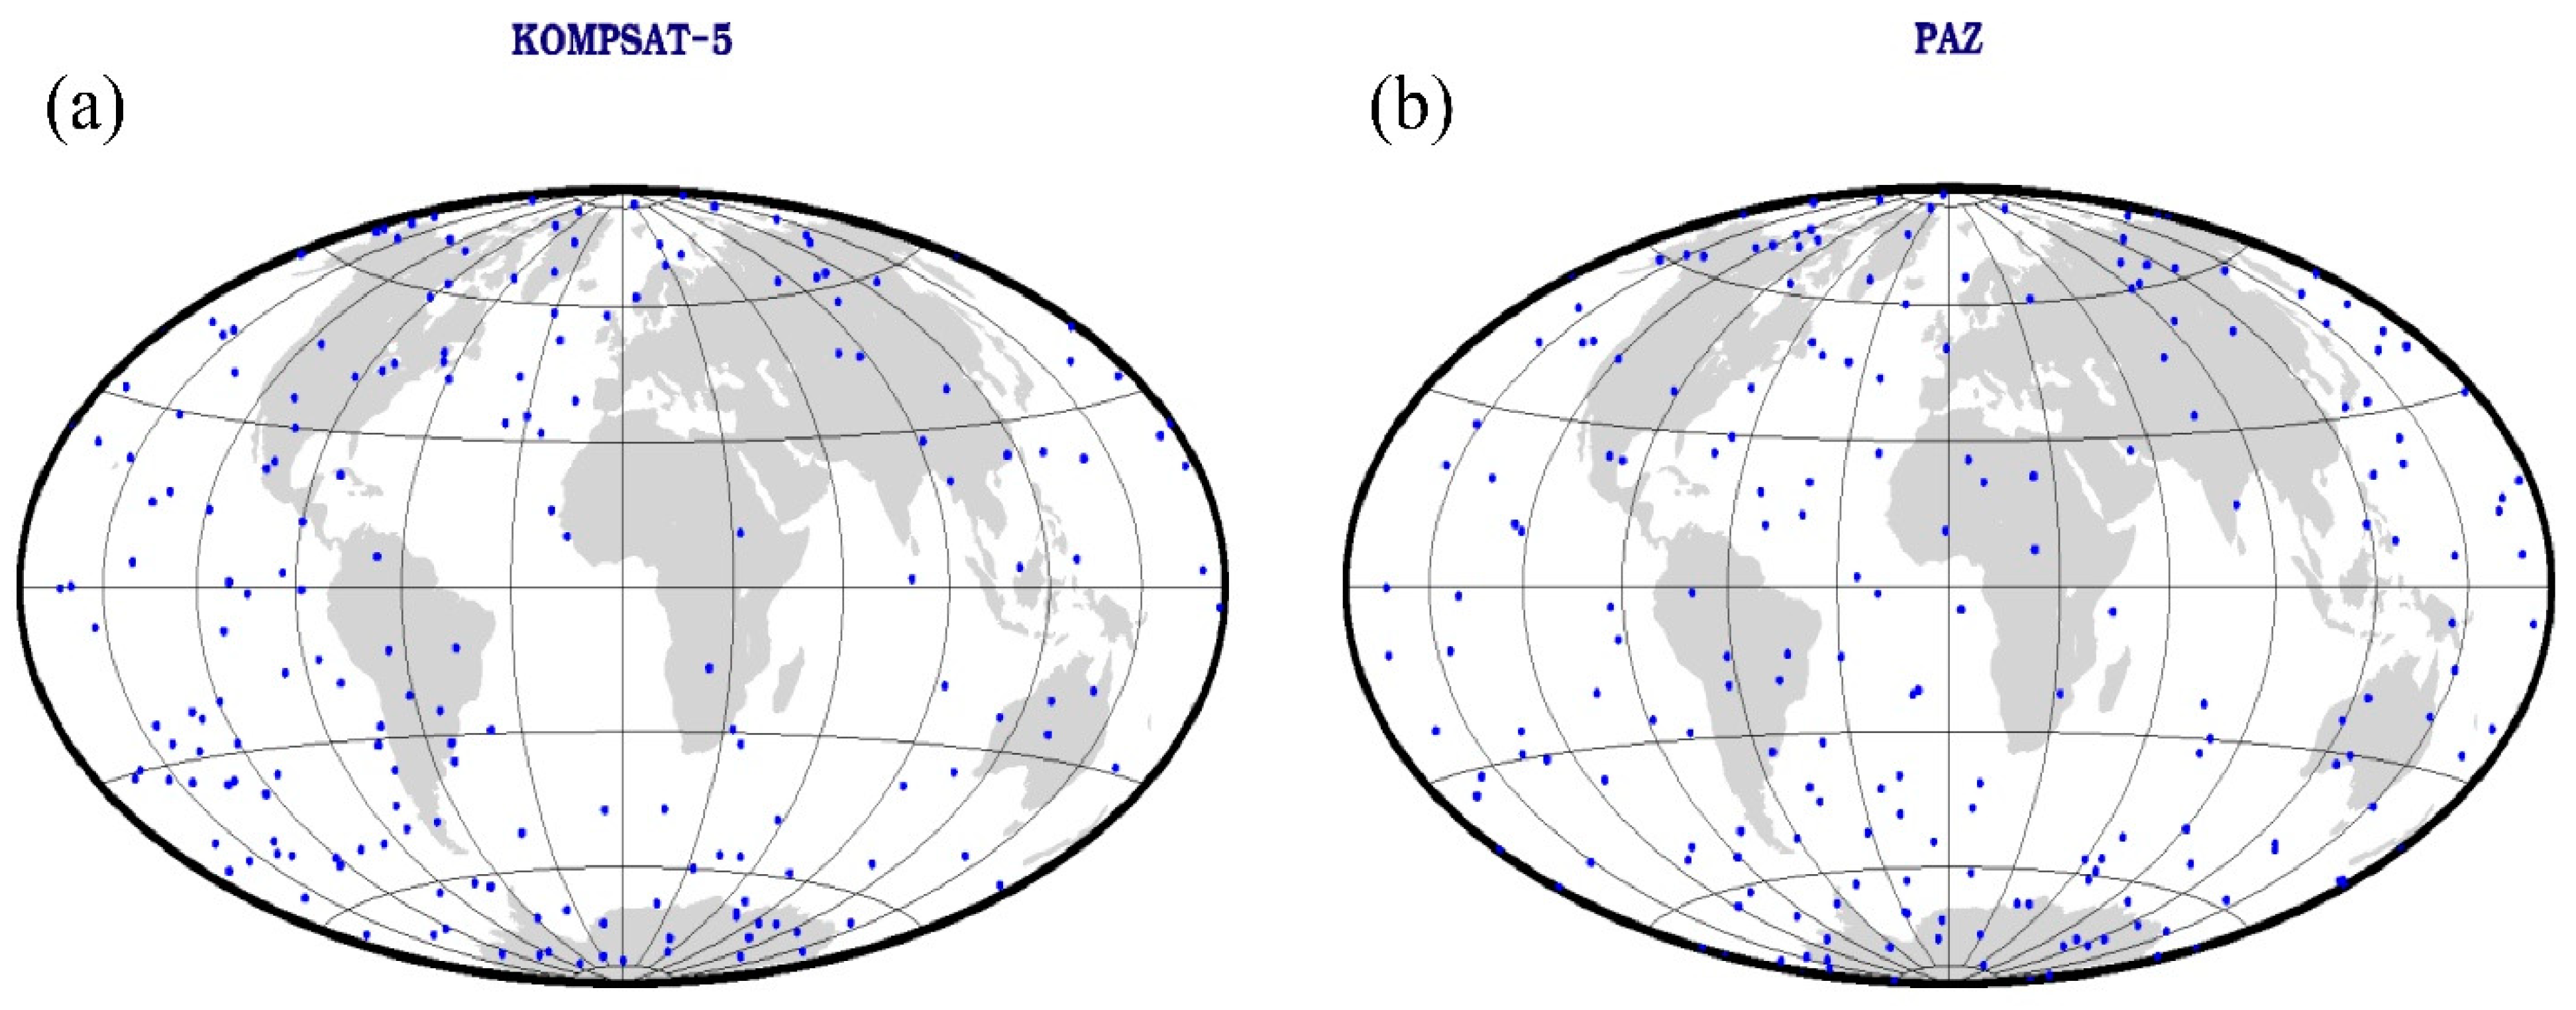
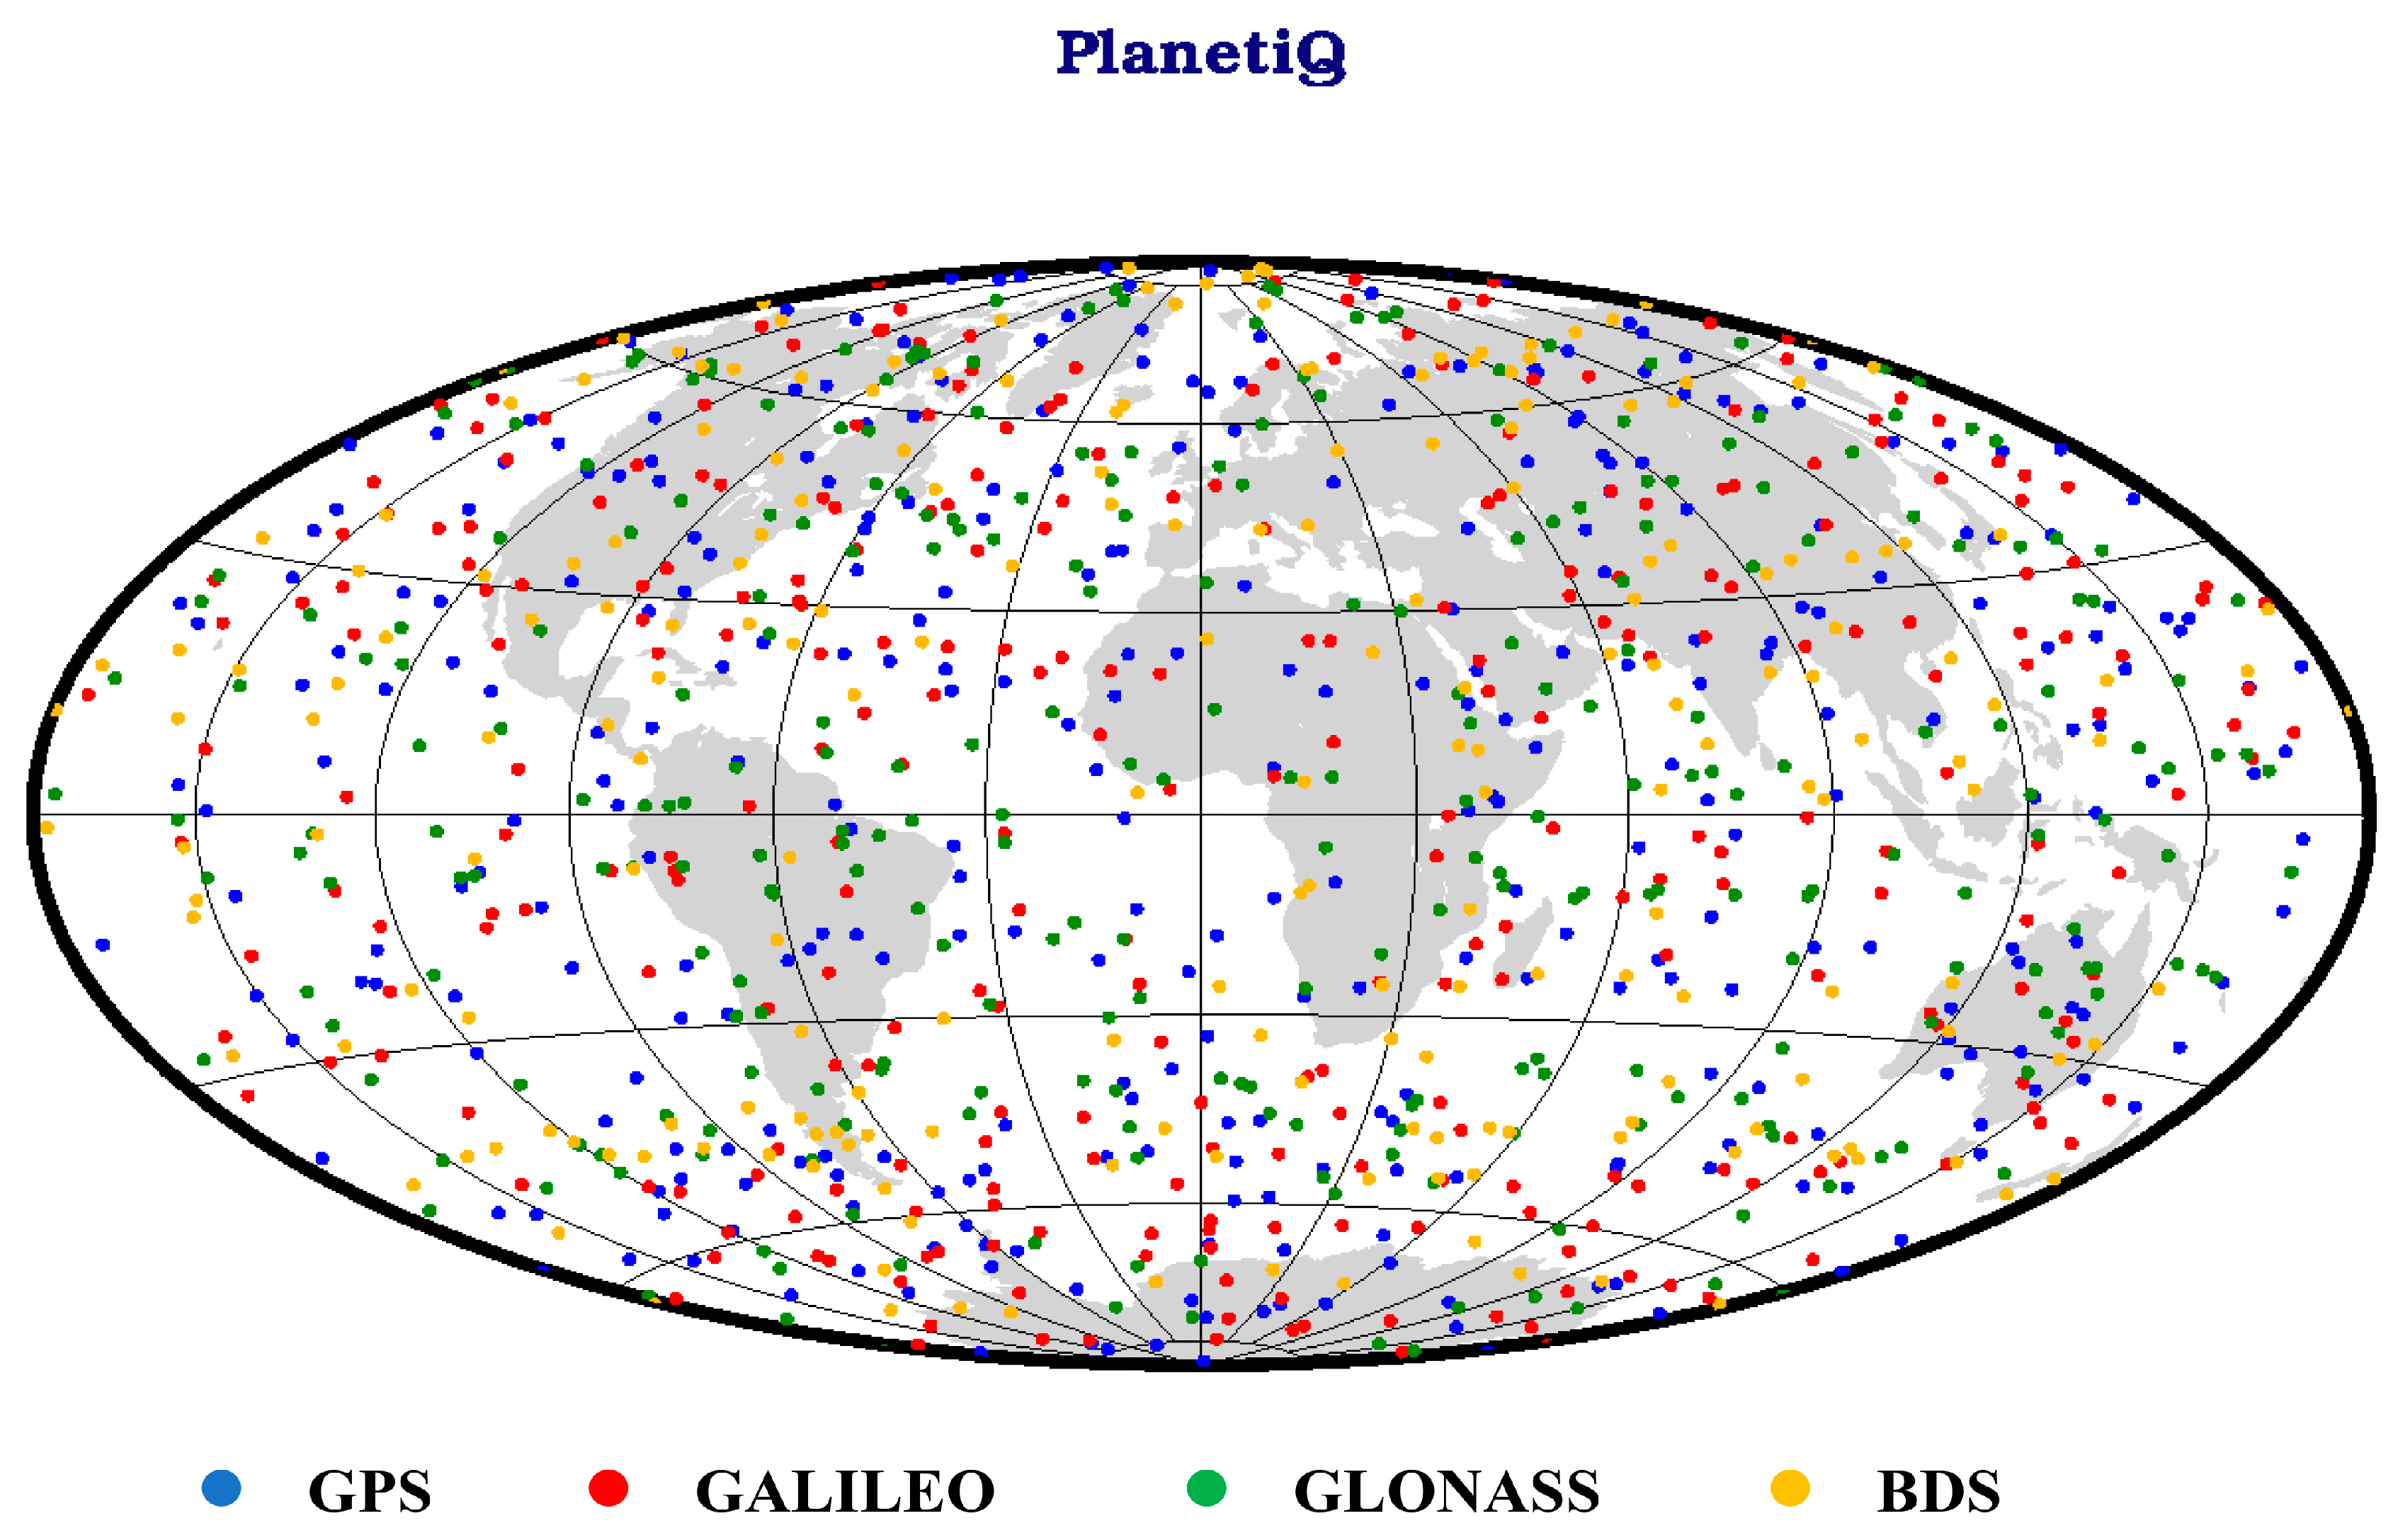
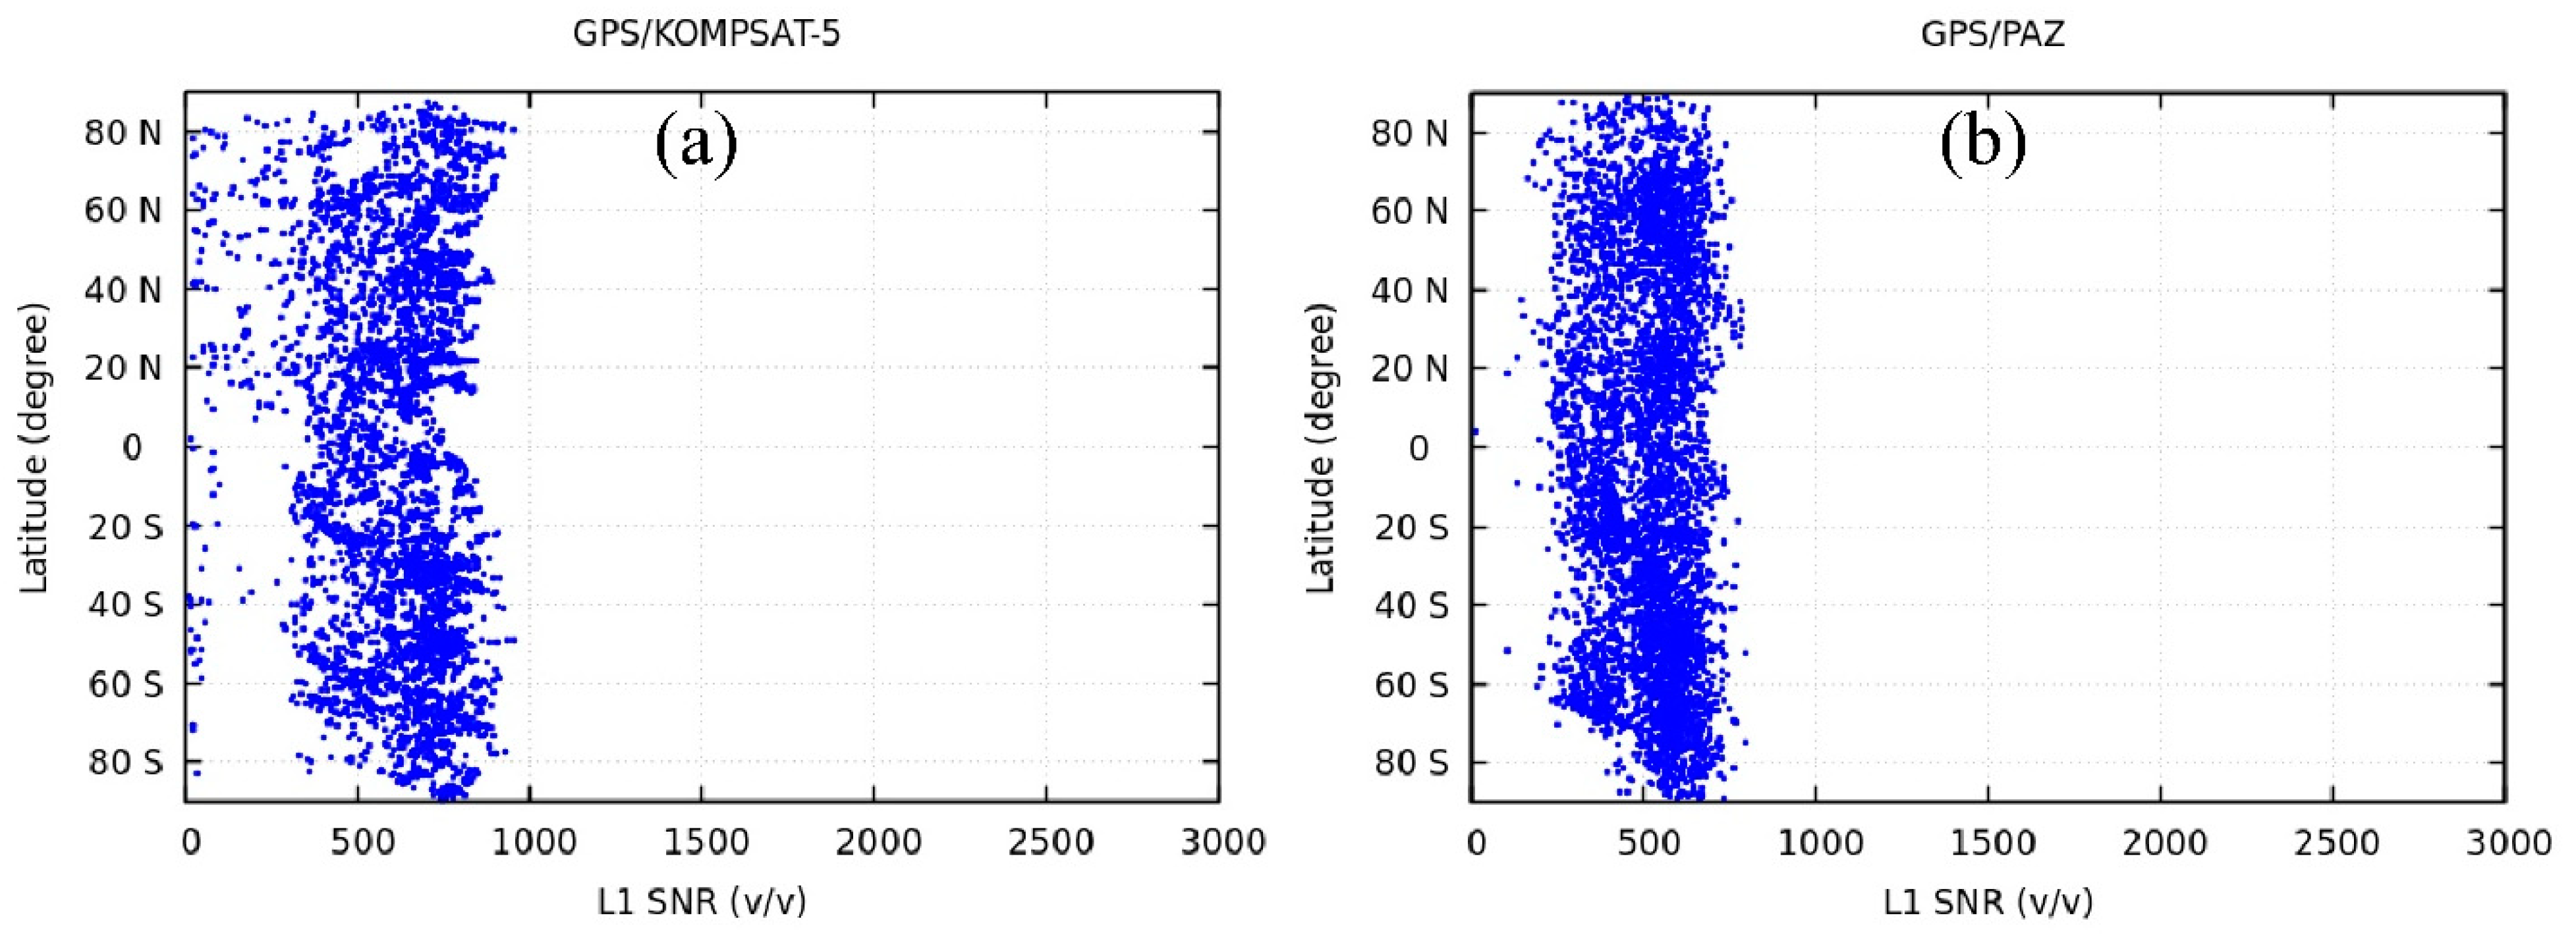
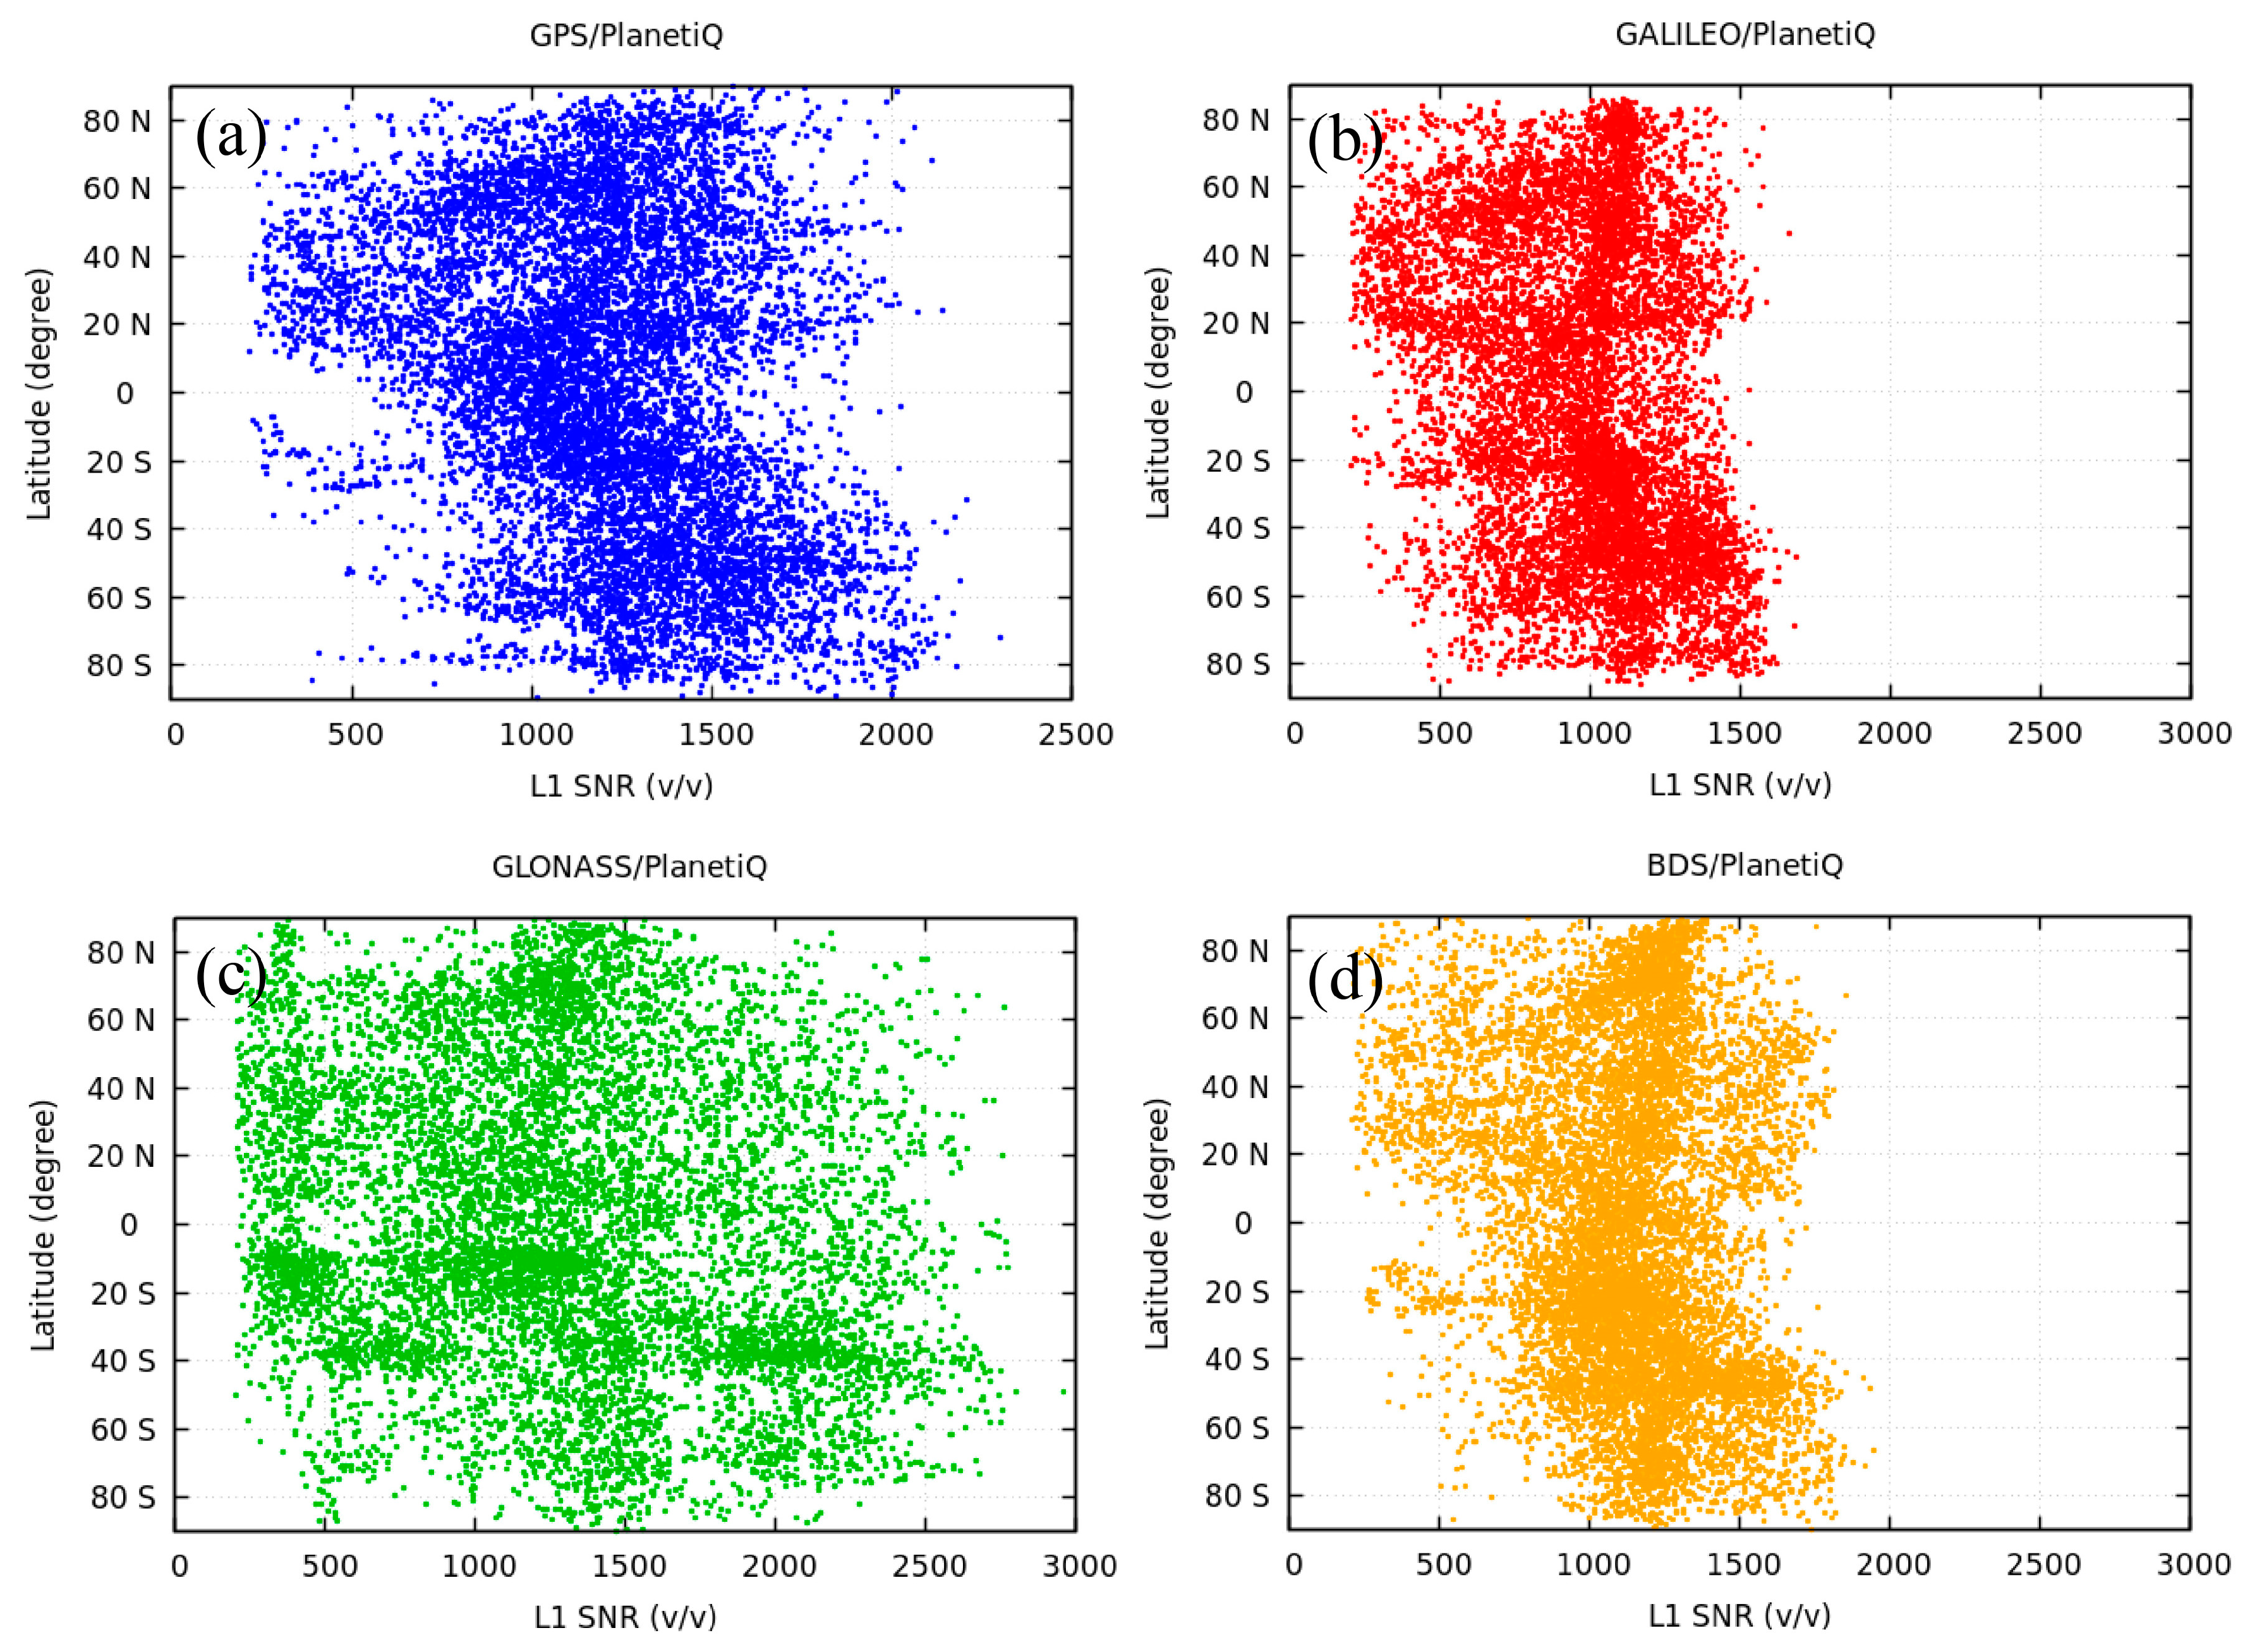
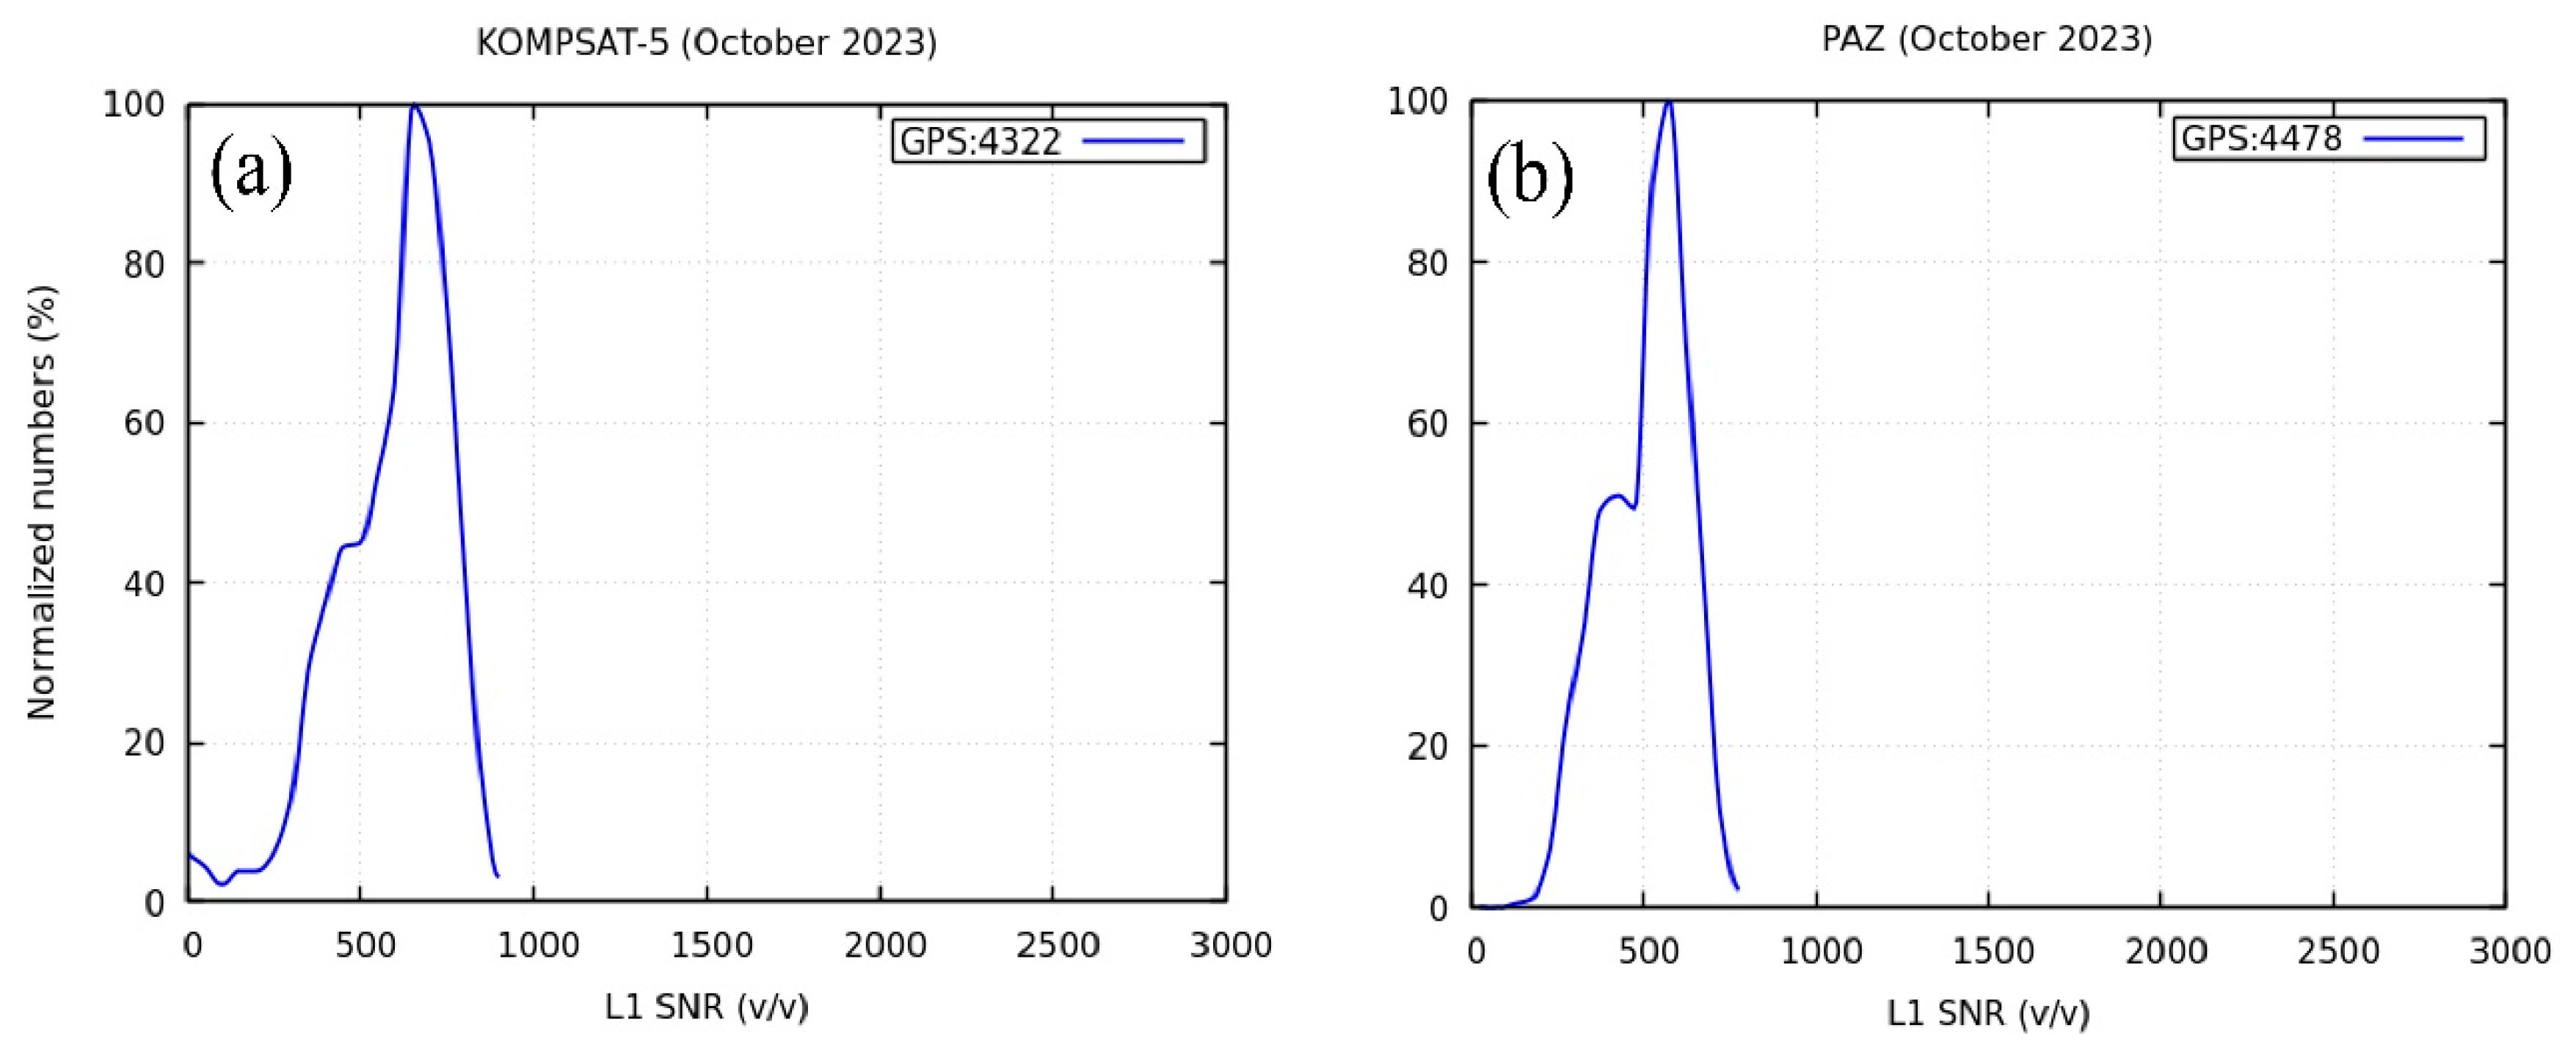
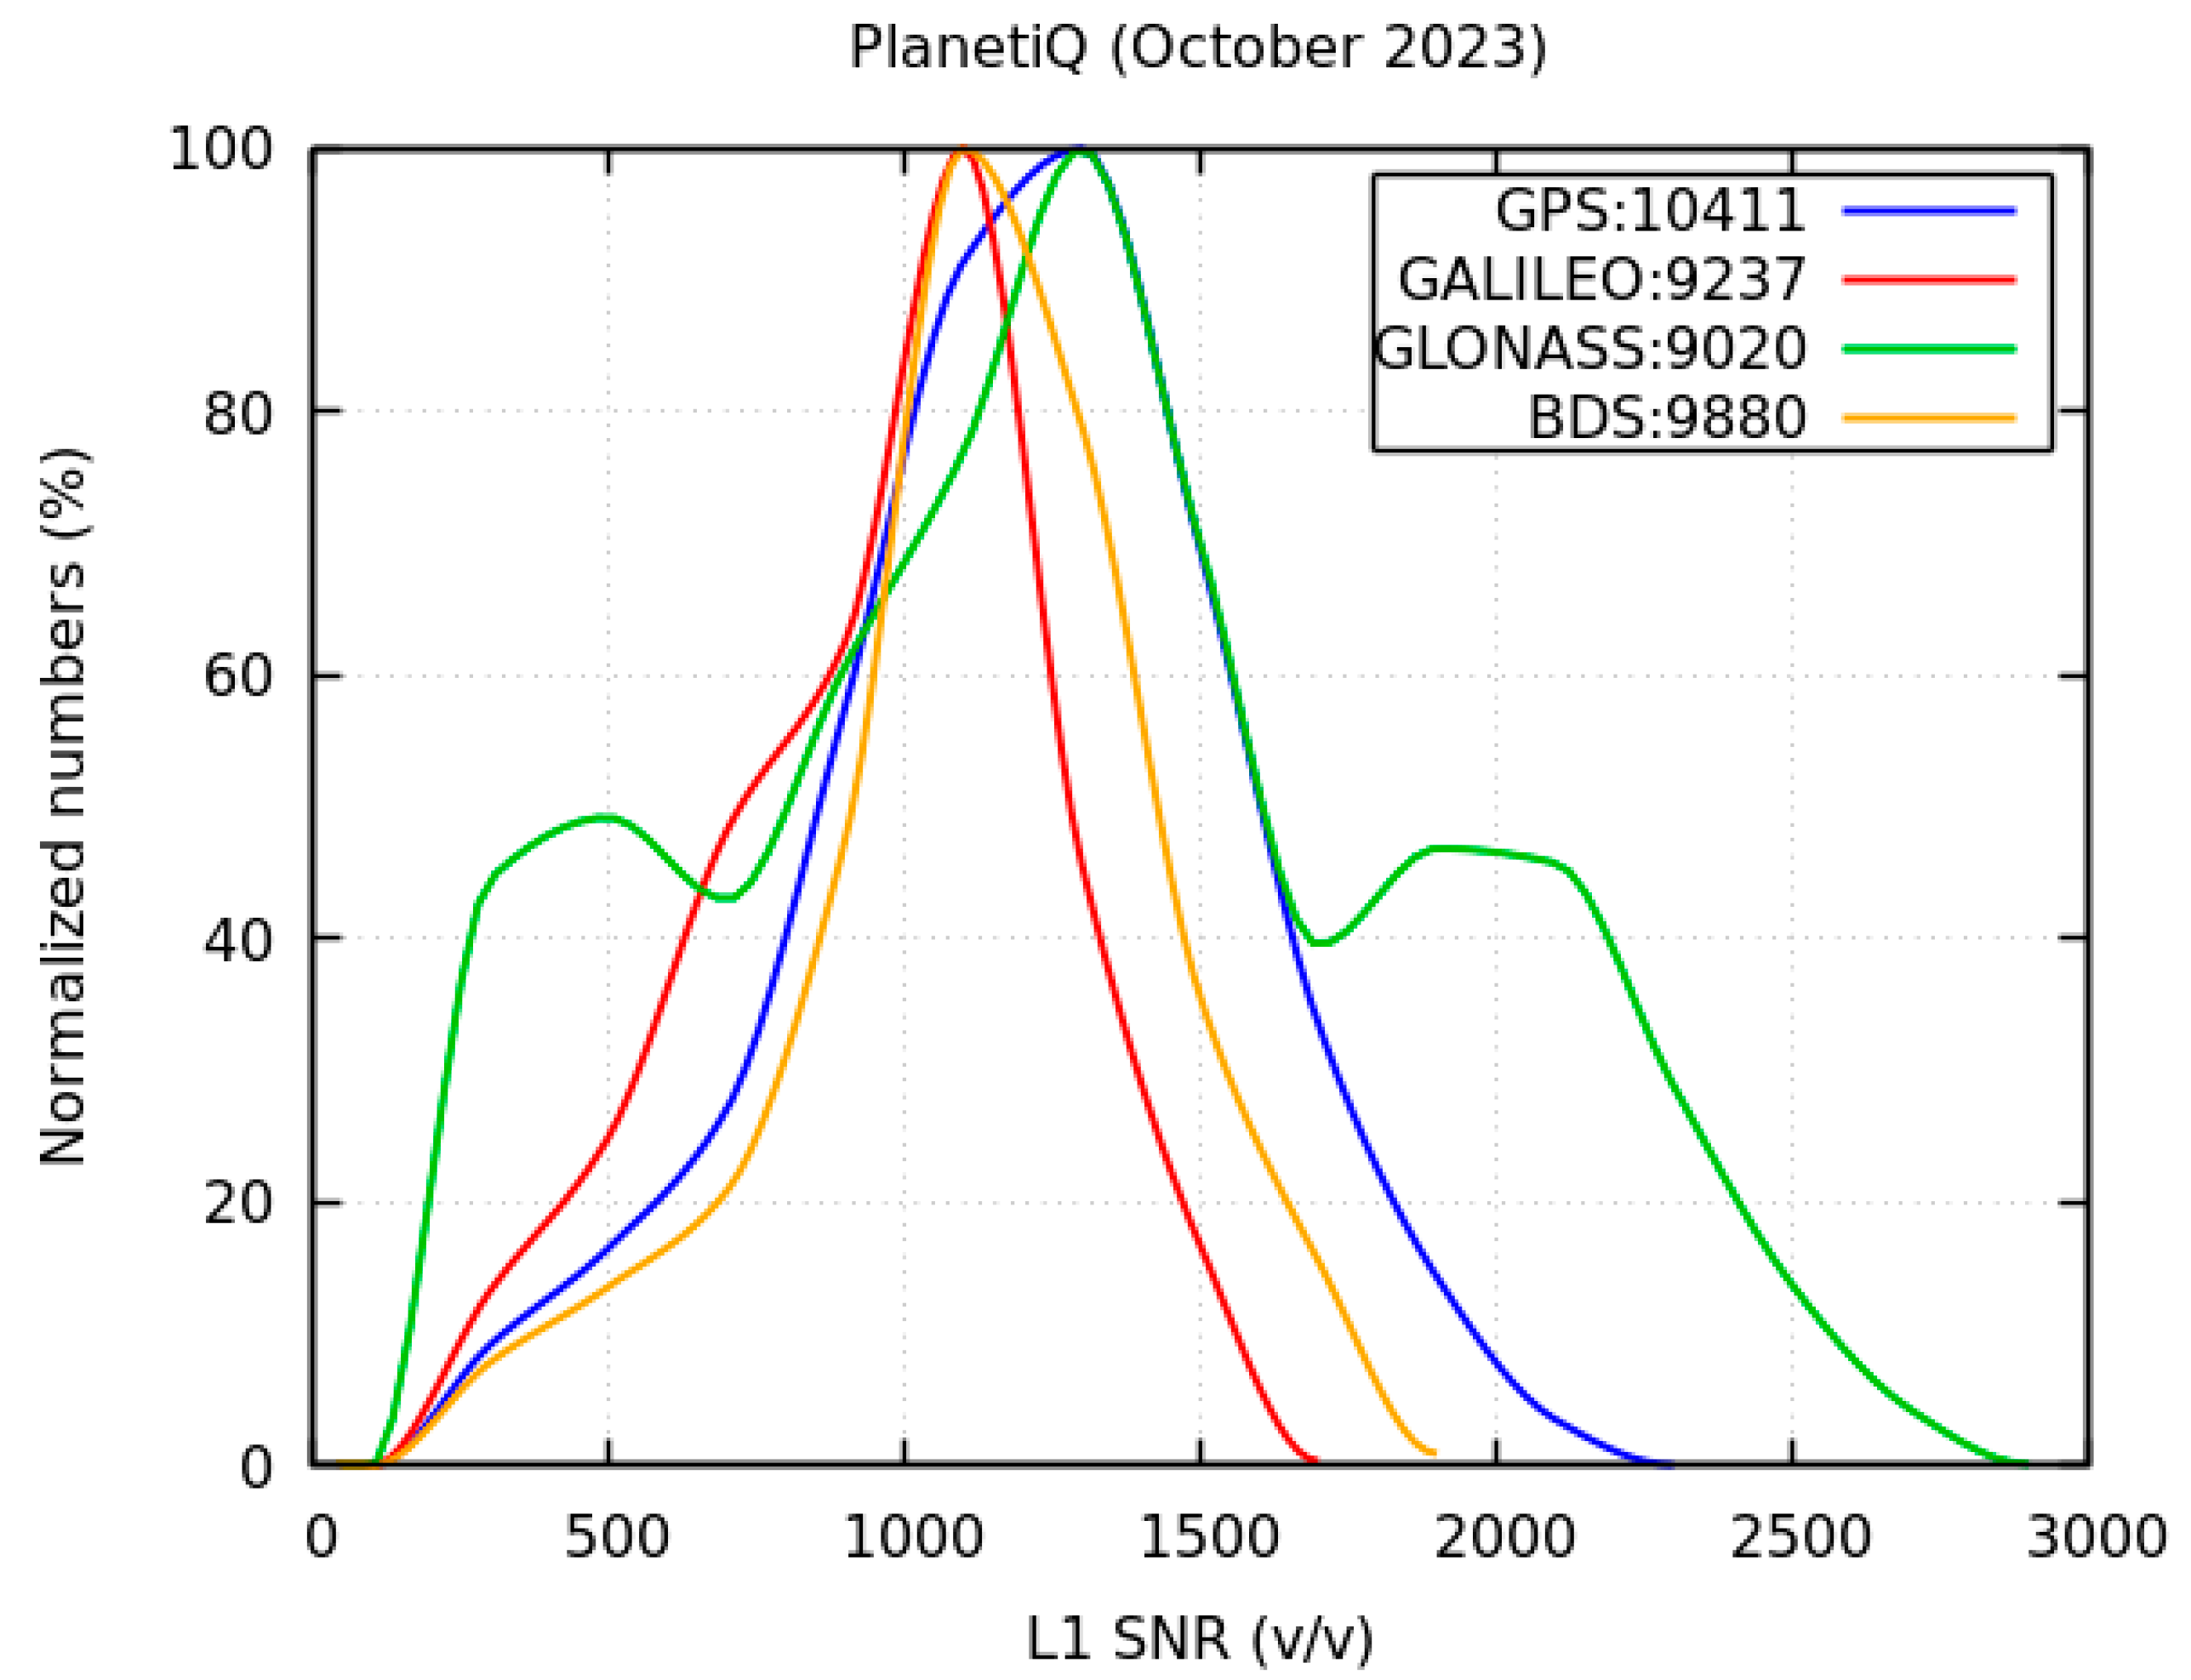
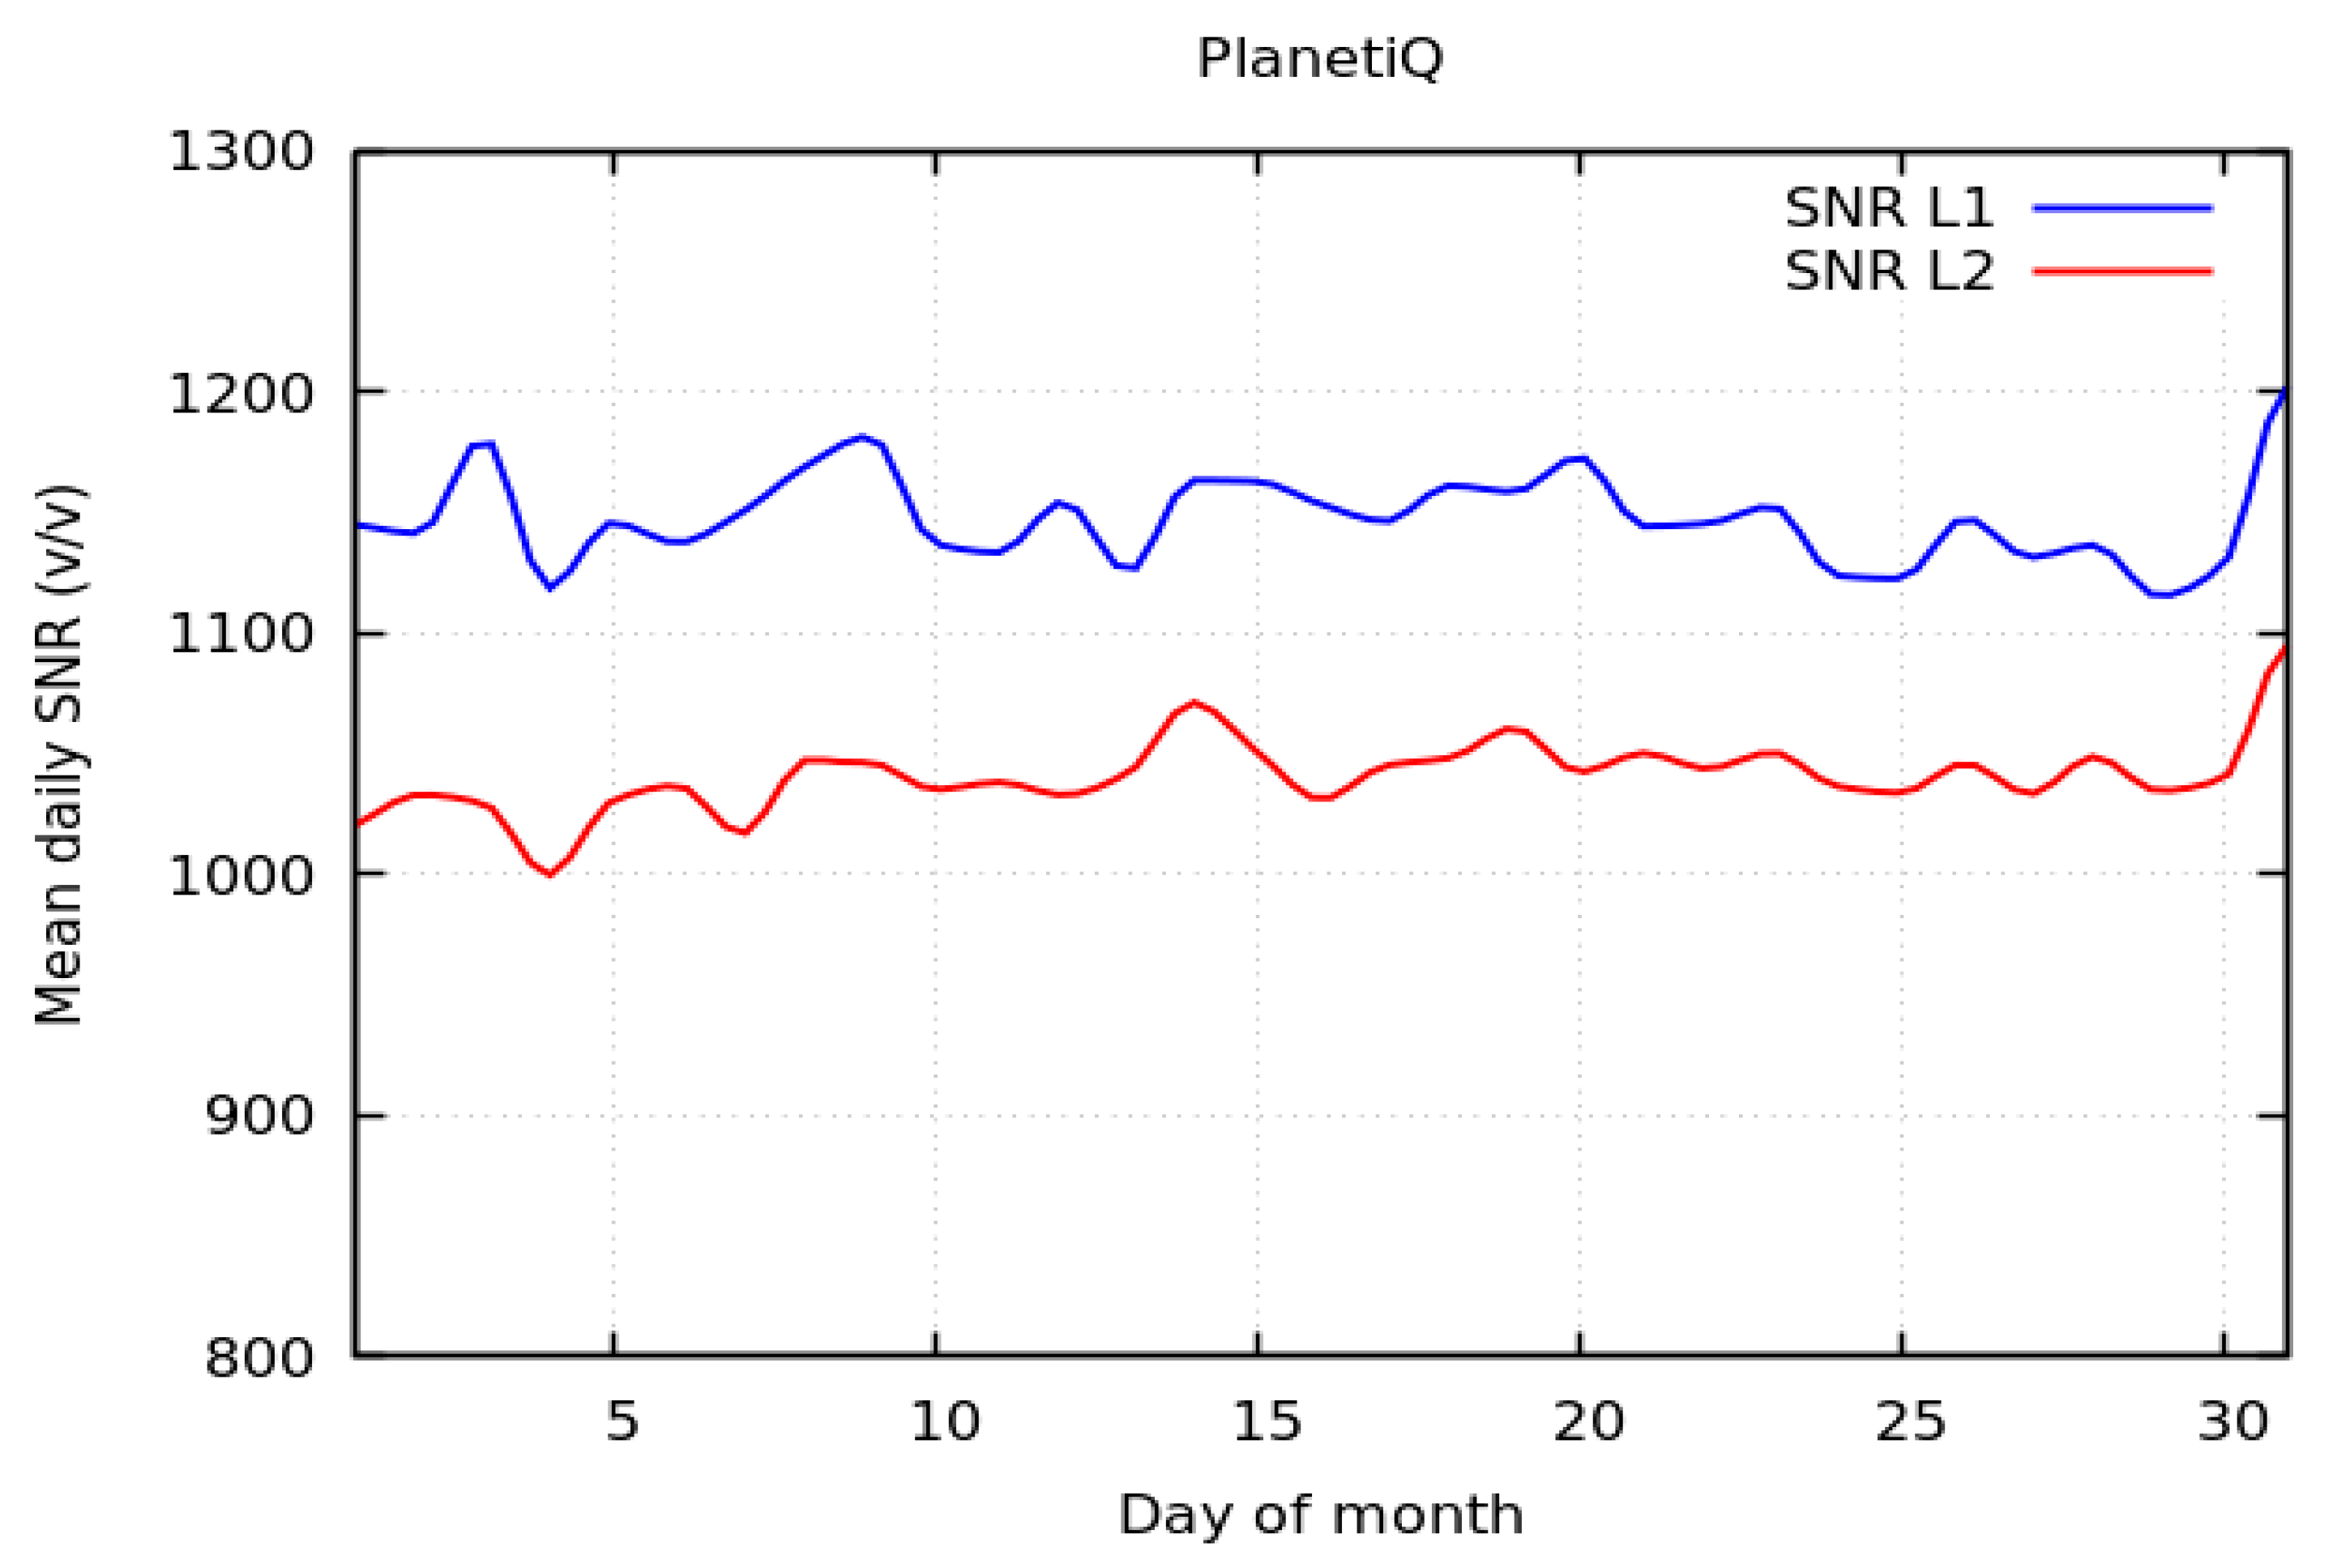
3.1. SNR Latitudinal Distribution

One of the key elements of RO observation is the SNR, which is related to the receivers. Different SNRs among receivers have a direct effect on the accuracy of the refractivity profiles and L1 and L2 BAs, notably when it relates to retrieval uncertainty and penetration height [46].
Typically, the SNR is used to show how strongly RO signals can penetrate the lower troposphere. Signal penetration lower into the atmosphere is often indicated by a greater peak SNR. Figure 5 presents the L1 SNR latitudinal distribution during October 2023 for KOMPSAT-5 and PAZ. Additionally, the L1 SNR latitudinal distribution during October 2023 for PlanetiQ is illustrated in Figure 6. Figure 5 and Figure 6 highlight that SNRs are uniformly distributed at all latitudes. As illustrated in Figure 5, the mean L1 SNR for KOMPSAT-5 and PAZ is 615 v / v and 507 v / v , respectively. The mean L1 SNR for PlanetiQ is 1148 v / v as shown in Figure 6. In summary, the mean L1 SNR for PlanetiQ is significantly larger than that of KOMPSAT-5 and PAZ.
Notably, the mean L1 SNR from GLONASS and GPS for PlanetiQ is larger than that of BDS and Galileo, as presented in Figure 4. Additionally, the mean L1 SNR from GLONASS, GPS, BDS, and GALILEO are 1295 v / v , 1203 v / v , 1124 v / v , and 966 v / v , respectively. PlanetiQ has a superior capability to track signals compared to KOMPSAT-5 and PAZ. These results ensure that the capability of PlanetiQ to track signals from any GNSS satellite is larger than the ability of KOMPSAT-5 and PAZ. As PlanetiQ has L1 SNR values larger than KOMPSAT-5 and PAZ, it is expected to penetrate deeper into the lower troposphere.
Figure 7 and Figure 8 demonstrate the normalized L1 SNR frequency distribution sample numbers (%) for different GNSS emitters. The sample number for each SNR bin normalized to the maximum number of the SNR bin is known as the normalized number. L1 SNR is determined by averaging the SNR values of the L1 signal throughout a geometric height range of 60 to 80 km. The SNR range of PlanetiQ is 200 v / v to about 2900 v / v .
Figure 9 shows the mean daily SNR of PlanetiQ in October 2023. The mean SNR for each of the measured RO profiles throughout the day is used to compute the daily mean. The daily mean SNR for the L1 and L2 bands, respectively, is shown in Figure 9 to be between 1115 and 1202 and between 999 and 1095 v / v .

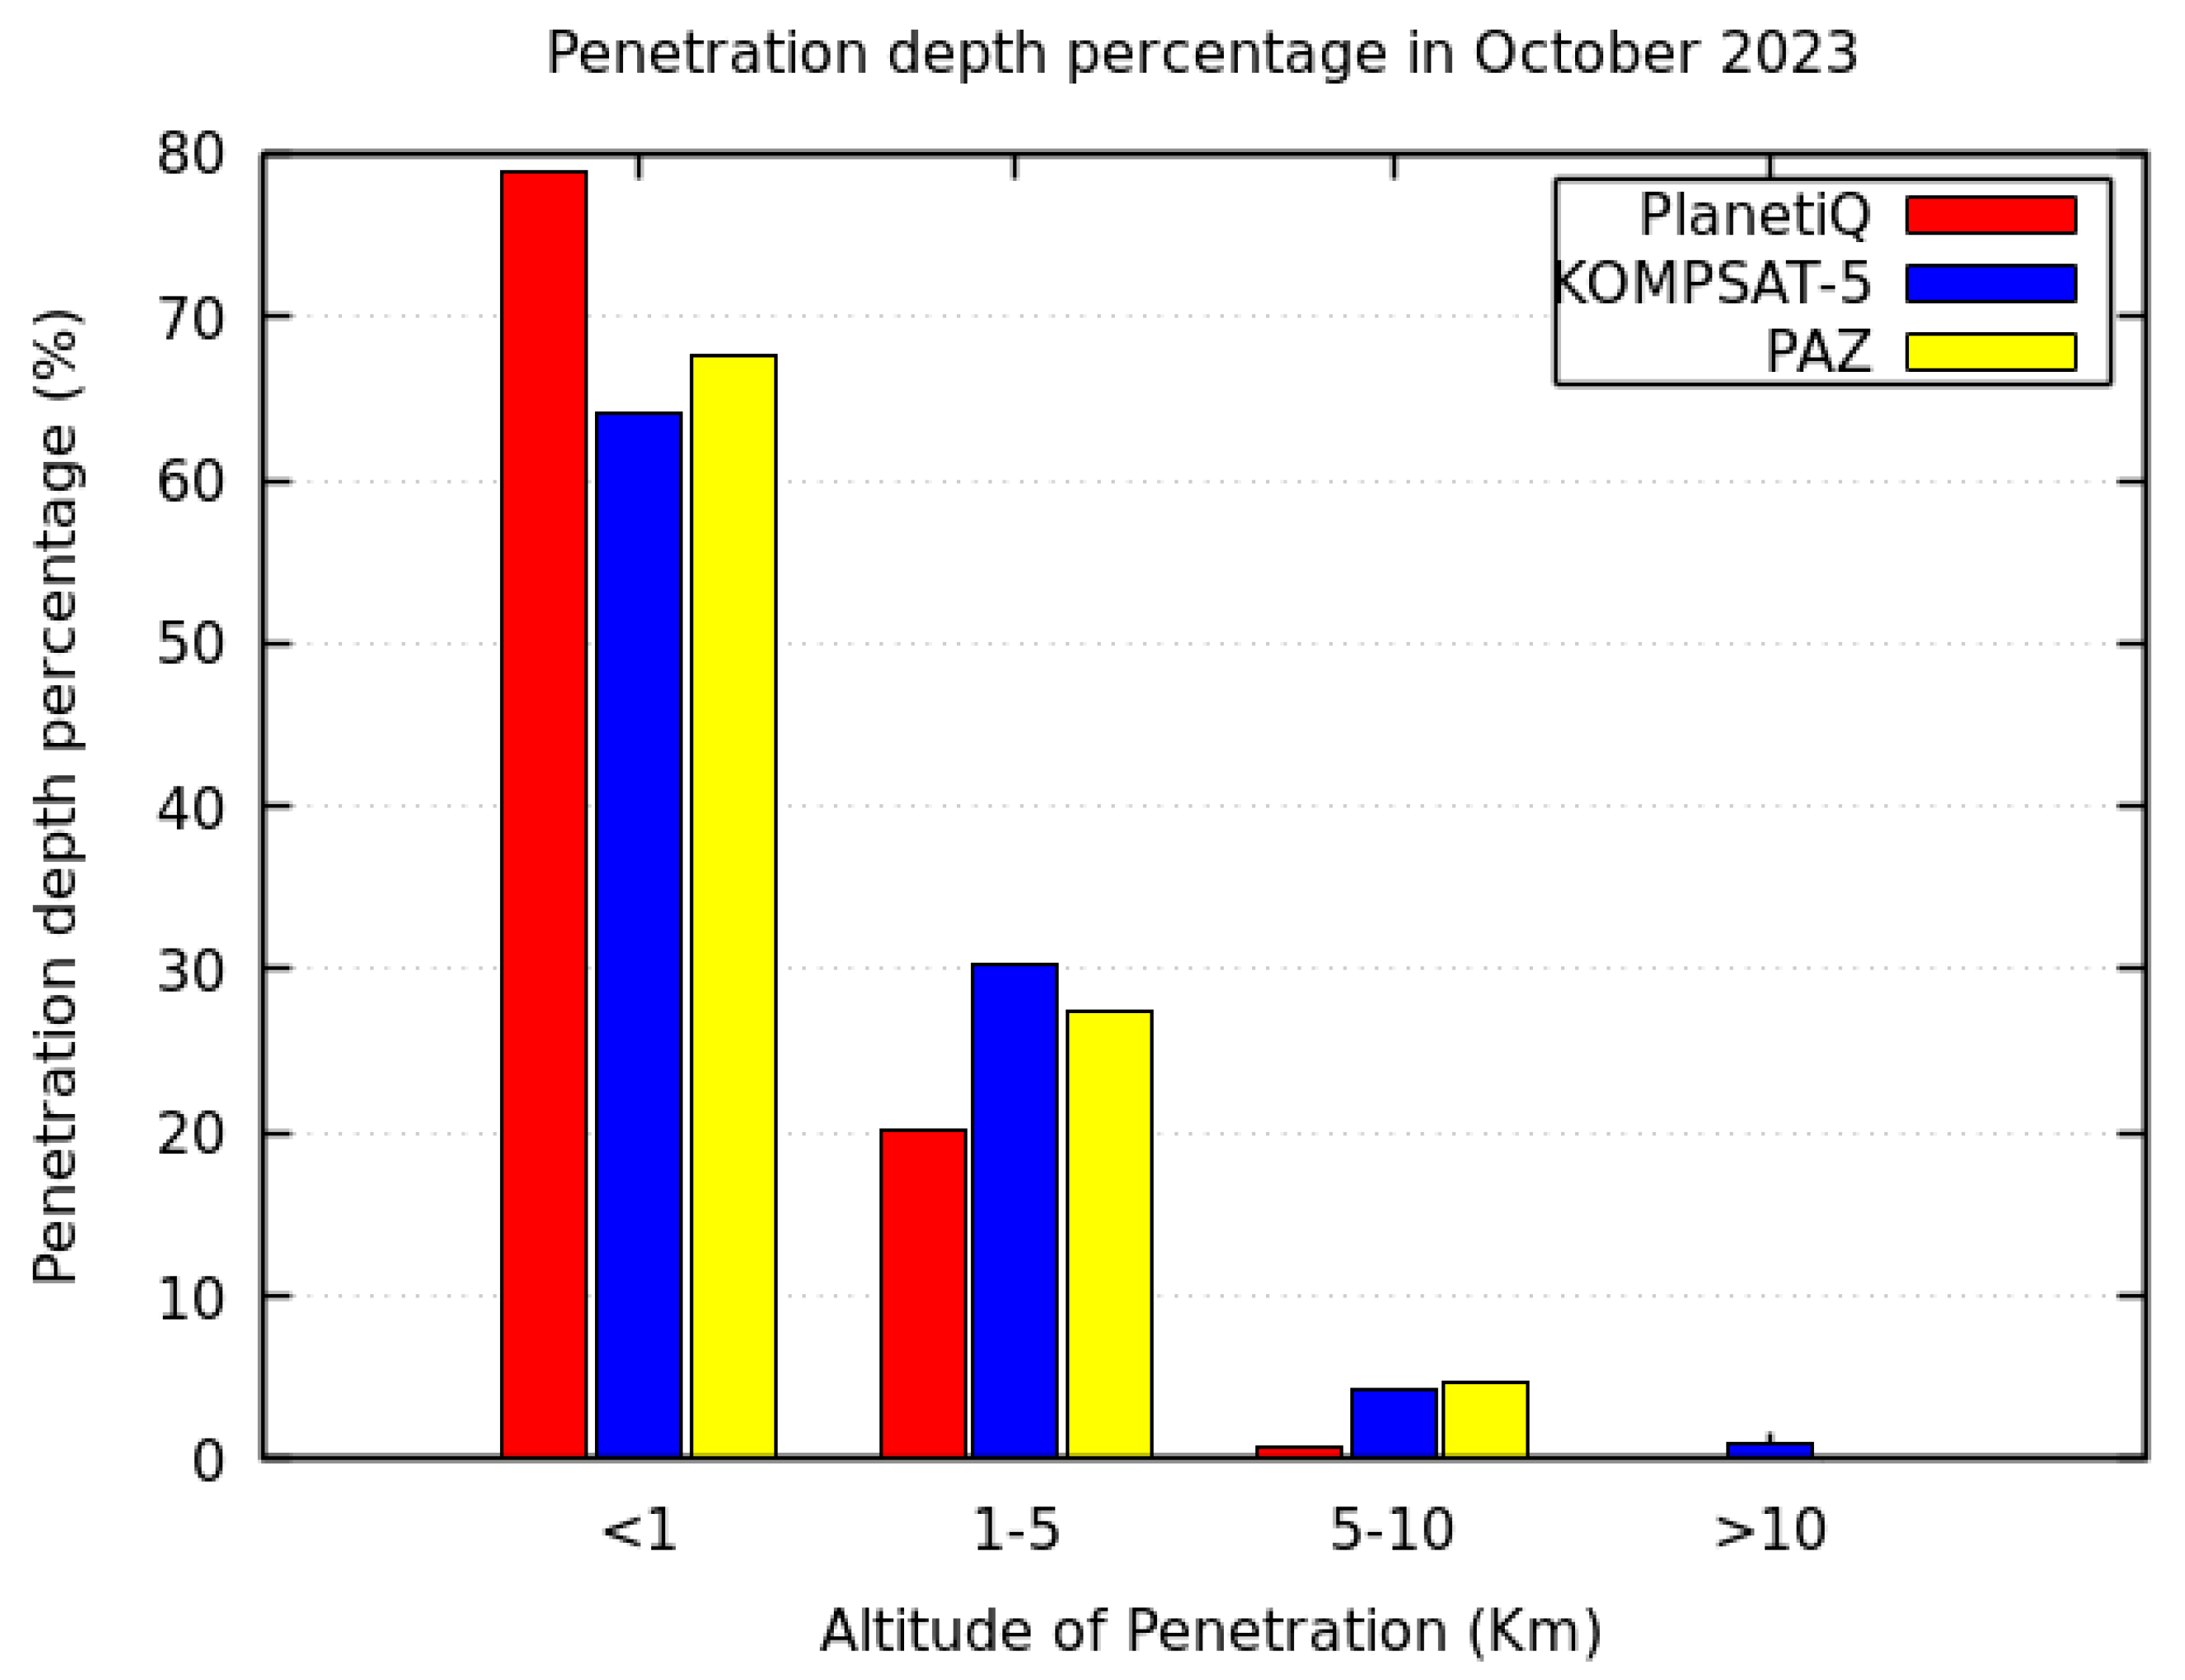
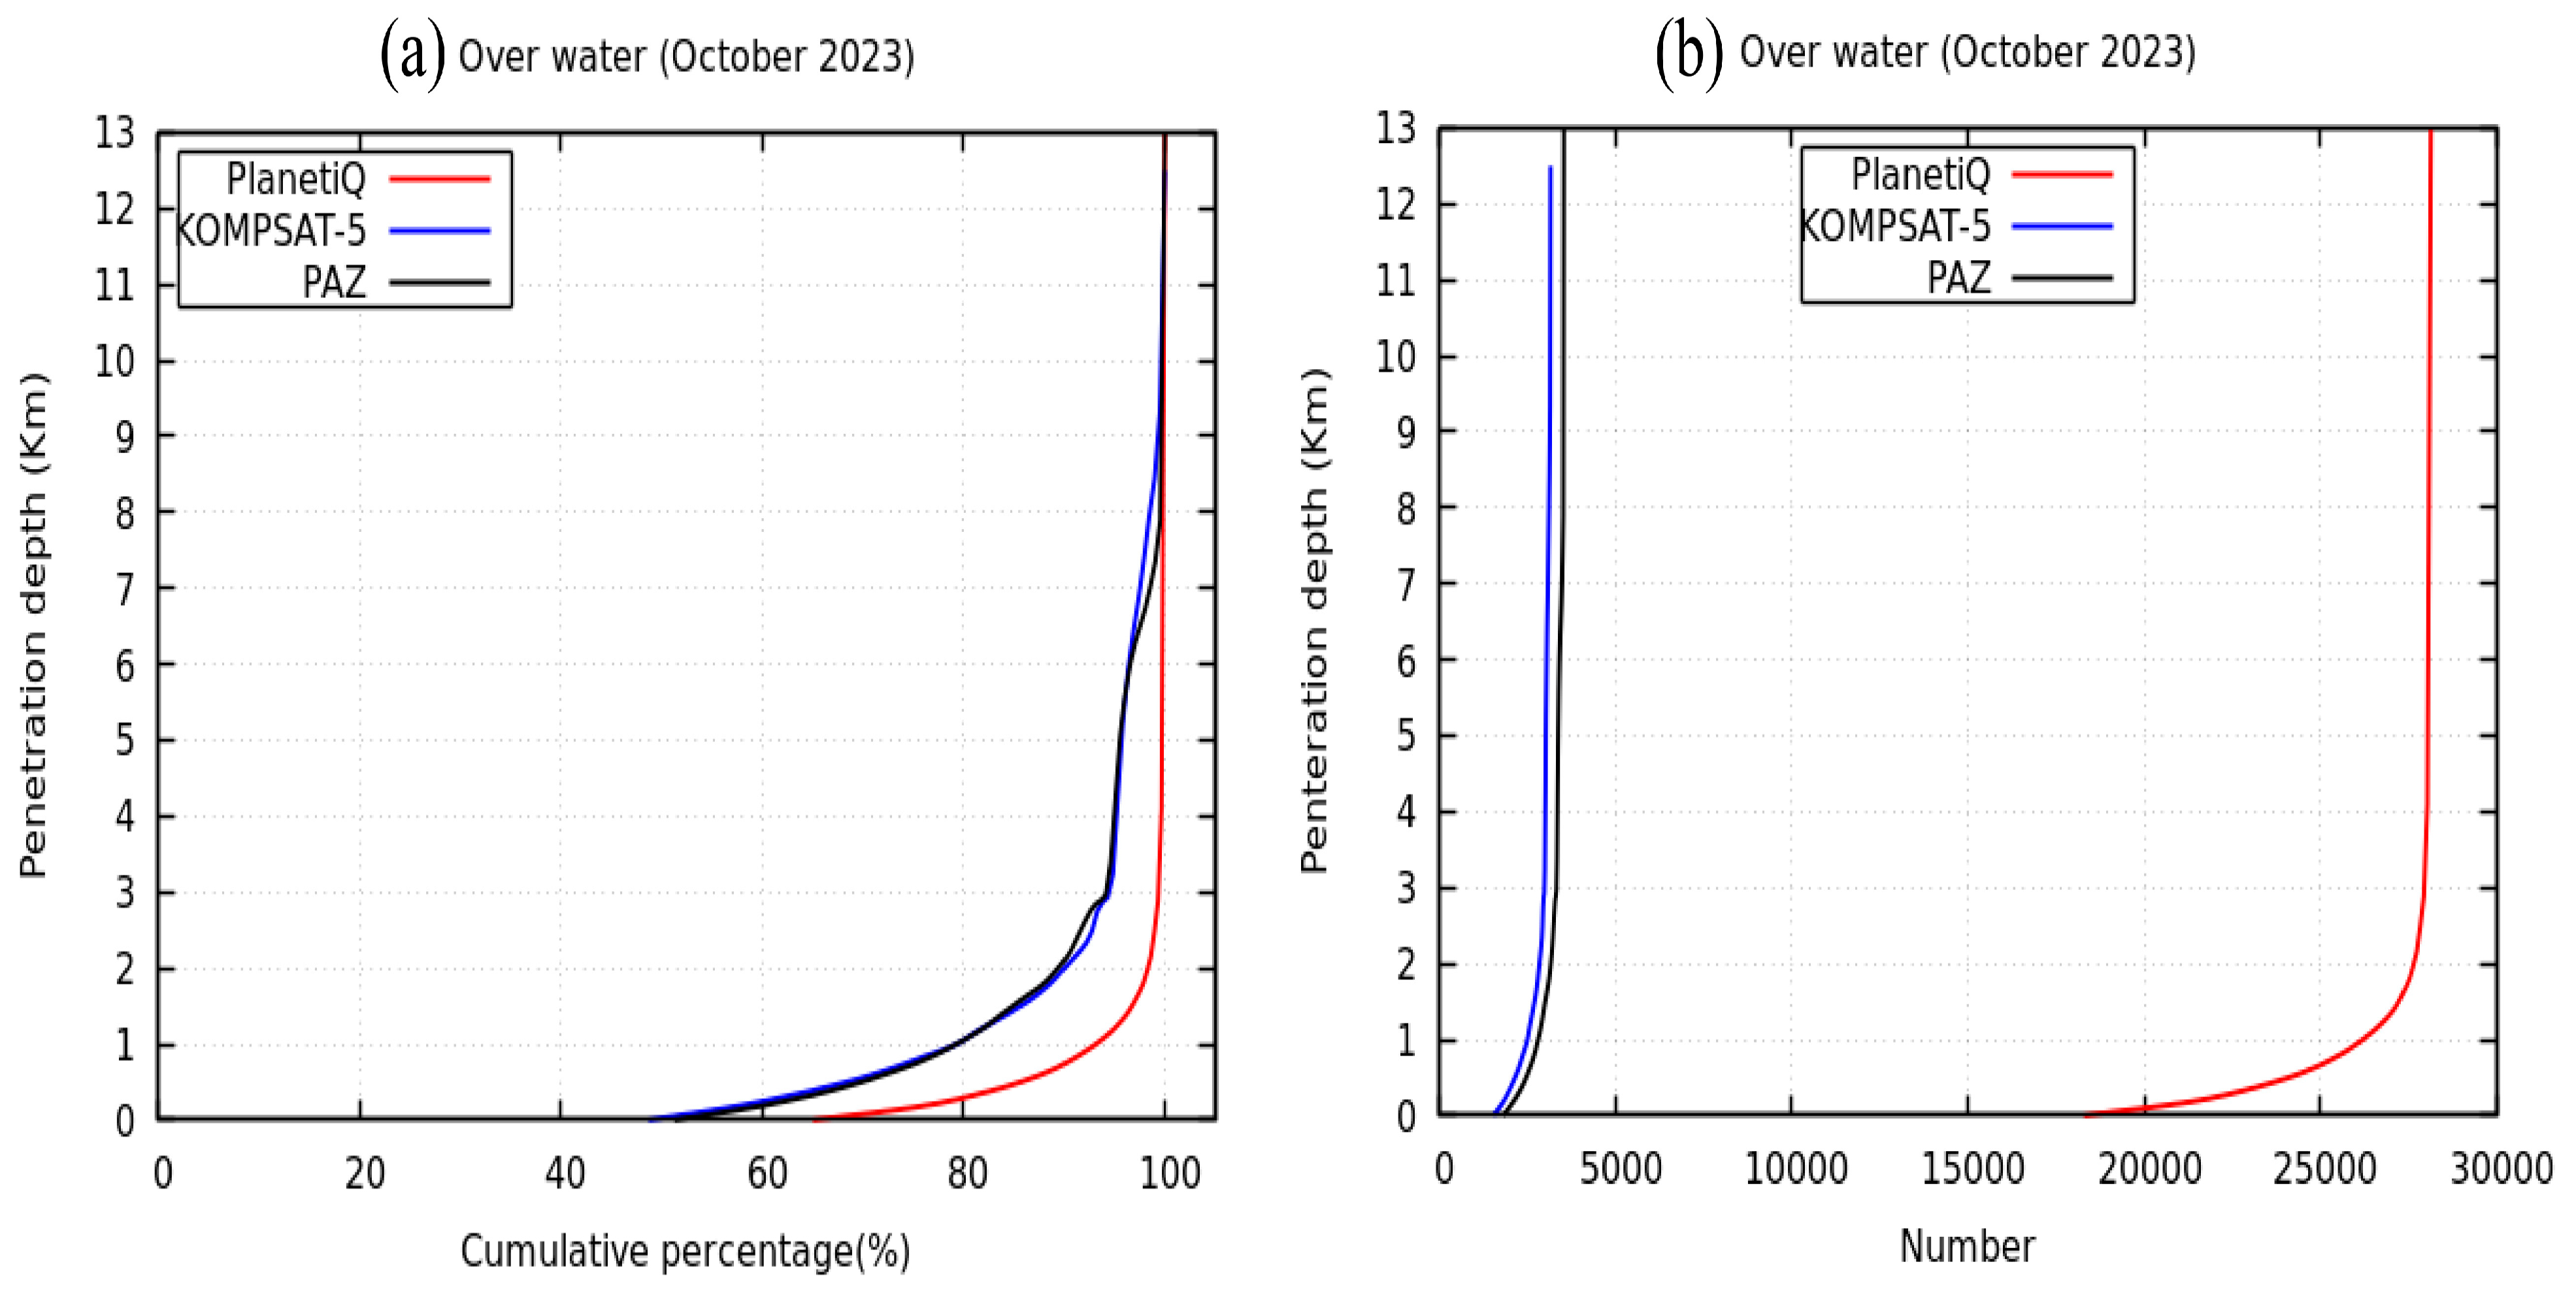
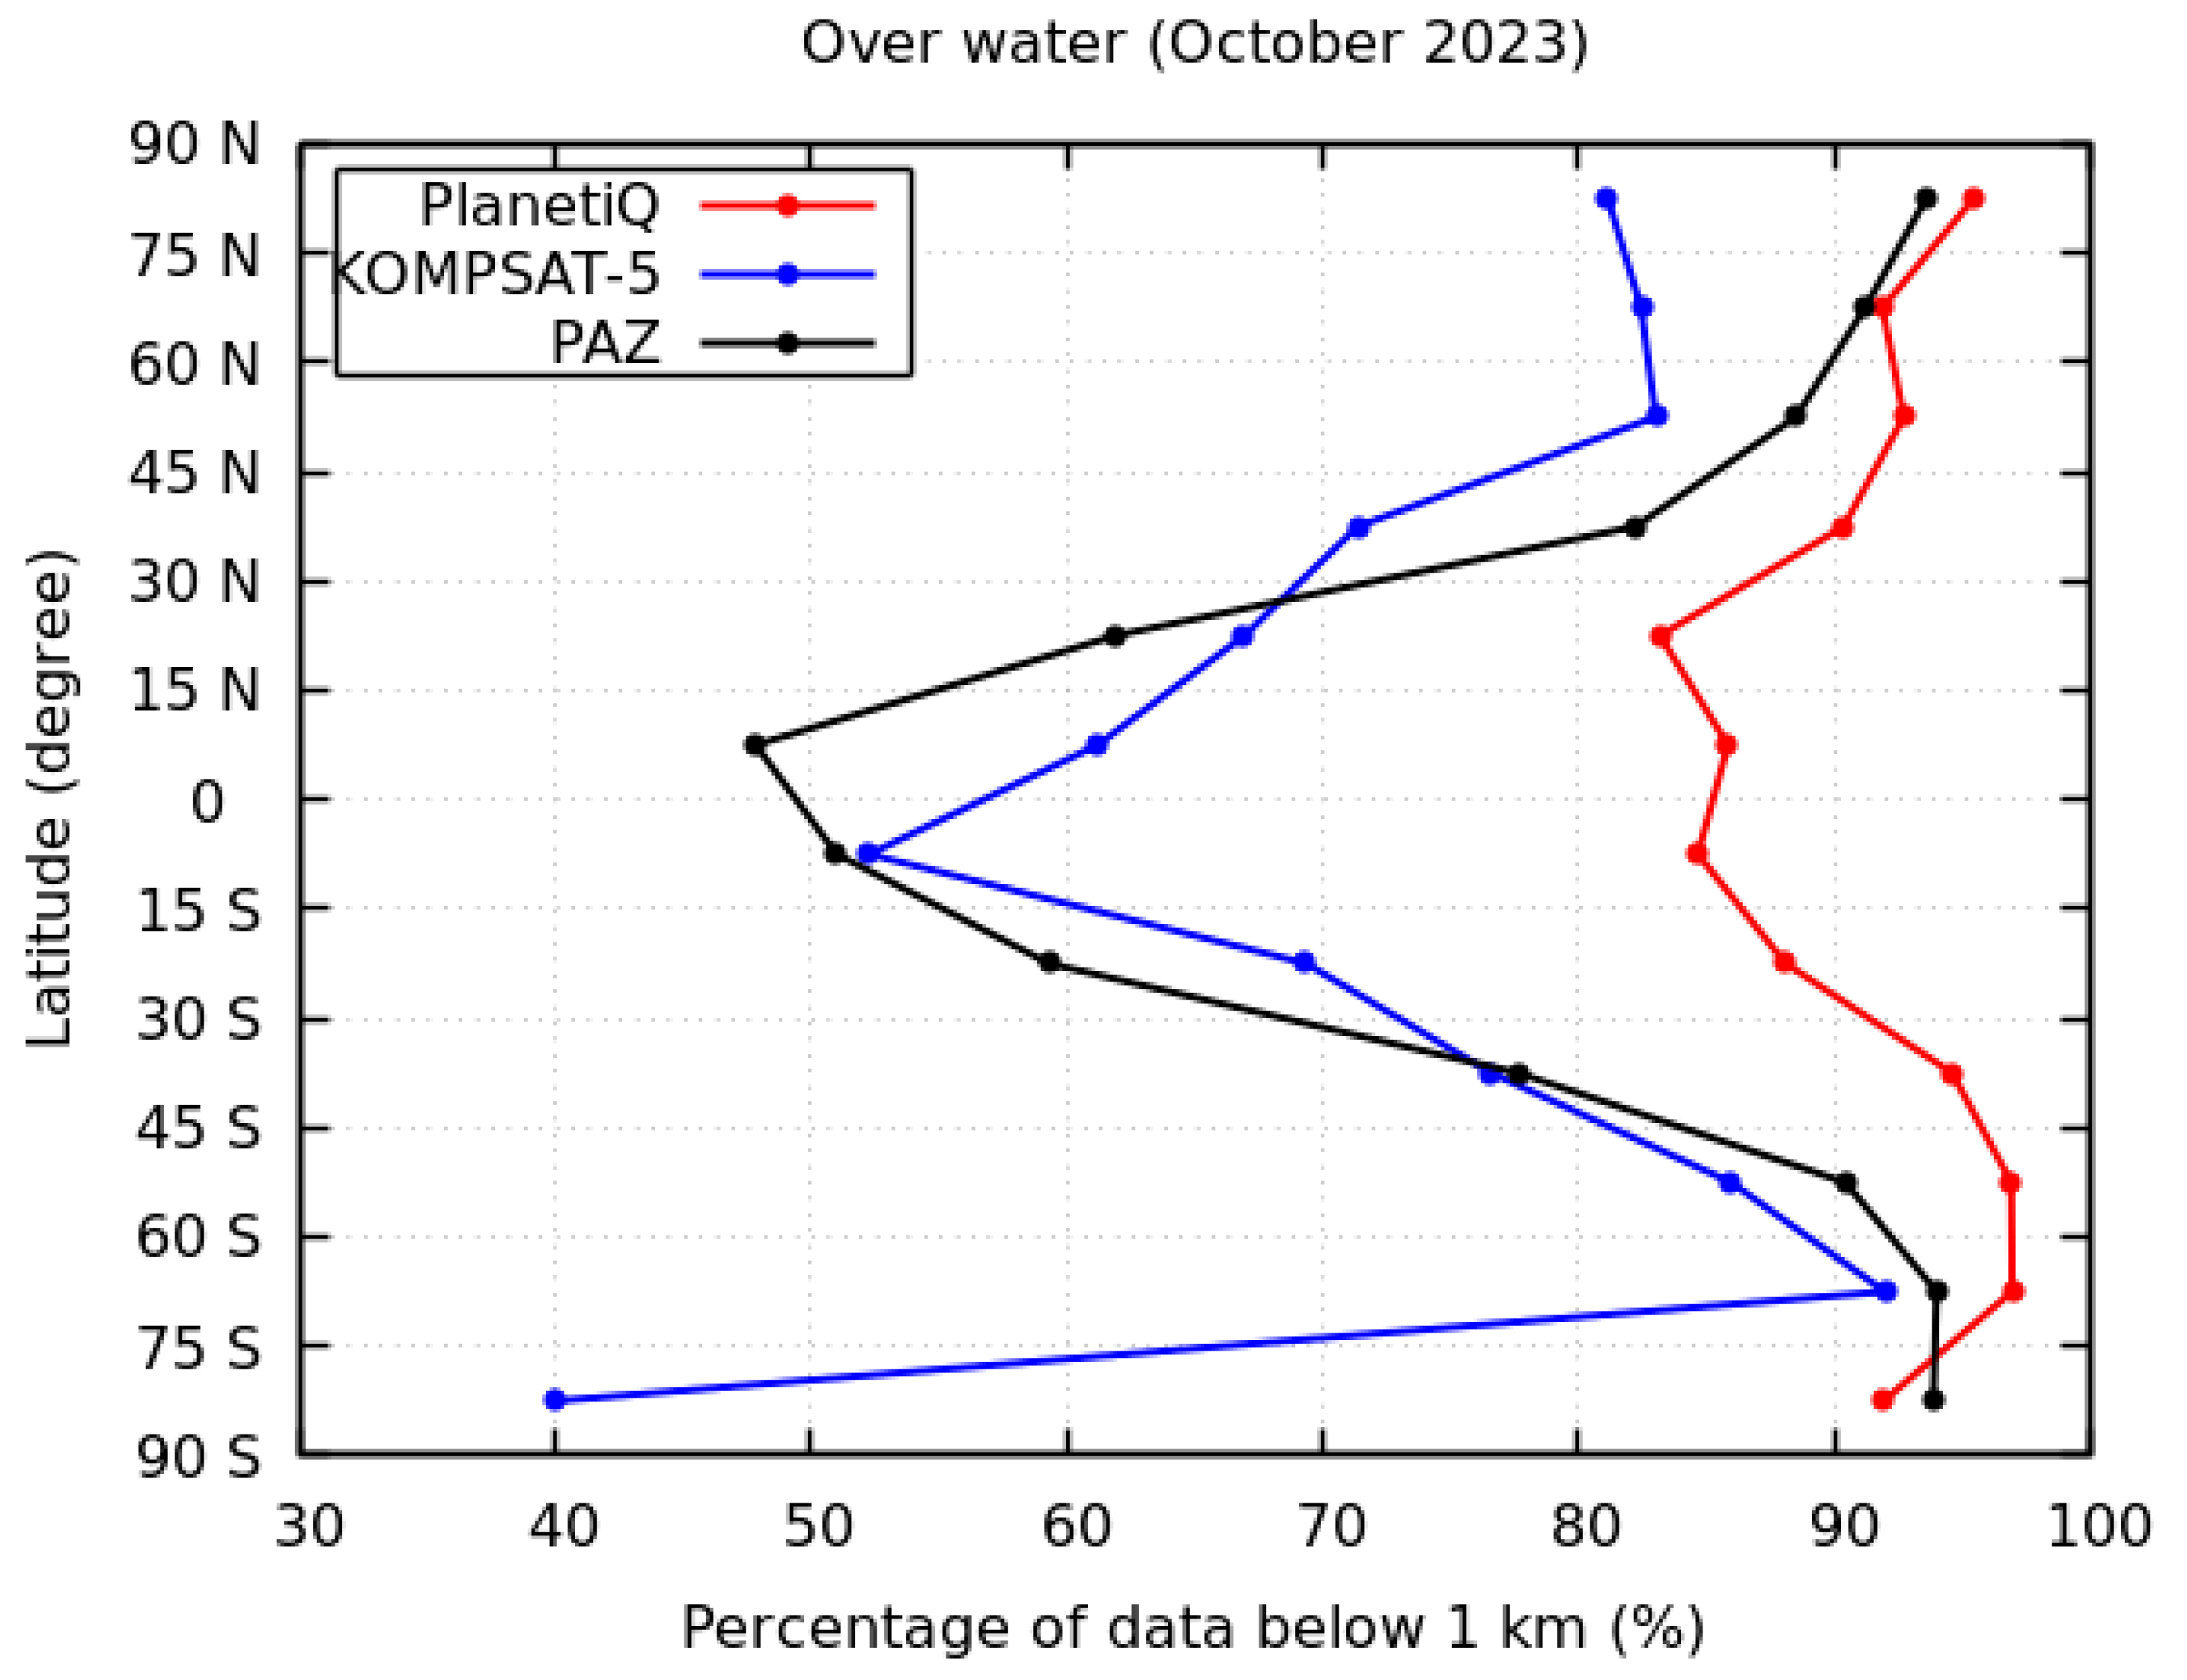
3.2. Lowest Penetration Height

Finding the cut-off height for RO retrievals in RO inversion processes requires using the obtained excess phase and RO tracking information. This guarantees that the RO bending angles and refractivity profiles are optimally recovered [47]. Additionally, for atmospheric science research and NWPs, the lower atmosphere is crucial. The ability of RO observations to offer atmospheric information in the lower troposphere is limited due to the presence of large amounts of water vapor near the surface [48]. Consequently, one of the most significant indicators of the quality of the GNSS RO profile is the penetration of GNSS-RO. RO-based retrieval of important meteorological parameters in the lower troposphere is dependent on how well it can penetrate low altitudes. Gorbunov et al. (2022) and Schreiner et al. (2020) [31,32] have demonstrated that the SNR is an indication of penetration soundings lower into the troposphere and a signal strength indicator. The lowest penetration height of RO tracking is often correlated with the SNR of the data and the dryness of the environment [30]. Higher SNR observations often penetrate deeper than lower SNR observations [16,30]. High SNRs are crucial for figuring out how deep RO sounds can penetrate the moist lower troposphere, as was previously mentioned.
We defined the penetration depth, also known as the penetration altitude, in this research as the lowest height above the surface at which a particular occultation event can have a valid BA. The RO signal is detected significantly closer to the Earth’s surface when the penetration depth is less. Figure 10 illustrates the penetration depth percentage of PlanetiQ, KOMPSAT-5, and PAZ in October 2023. RO measurements show a greater ability to penetrate as altitude decreases. As presented in Figure 10, 78.87% of the PlanetiQ data can reach penetration depths of less than 1 km in the lower troposphere. PlanetiQ can detect the lower troposphere below 1 km better than KOMPSAT-5 and PAZ. The ability of PlanetiQ to penetrate deep in the lowest 100 m of the troposphere is 40.98%. Therefore, the conclusion is that the higher SNR increases the penetration depth of the lower troposphere. The amount that thermal noise contributes to BA errors decreases with increasing SNR.
Mountains and irregular topography along the tracks may have an impact on the RO’s lowest penetration height at a horizontal resolution of 200 km [30]. Only the penetration height over water is displayed here. Figure 11 presents the cumulative RO percentage with a penetration depth of PlanetiQ (red curve), KOMPSAT-5 (blue curve), and PAZ (black curve) over water in October 2023. The penetration percentage of KOMPSAT-5 was similar to that of PAZ, as illustrated in Figure 11. Comparing PlanetiQ to other GNSS RO systems like KOMPSAT-5 and PAZ, it is noteworthy that PlanetiQ has a higher penetration capability. In general, higher SNRs often have lesser penetration depths. For PlanetiQ, KOMPSAT-5, and PAZ, the estimated percentages of RO events that penetrated below 200 m were 65.3%, 48.7%, and 51.3%, respectively.
Table 1 lists the average penetration heights (km) in different latitudinal bands over water for different RO missions in the study period. The PlanetiQ average penetration height is greater than KOMPSAT-5 and PAZ average penetration heights. Additionally, PlanetiQ’s average penetration height ranges from 0.16 to 0.49 km in all latitudinal bands over water. Furthermore, PAZ’s average penetration height is greater than KOMPSAT-5’s average penetration height in all latitude zones except from 30°S to 30°N.
We further examined the proportion of data below 1 km for several missions to statistically compare the penetration capabilities. Figure 12 highlights the percentage of data below 1 km for PlanetiQ (red), KOMPSAT-5 (blue), and PAZ (black) at different latitude zones over water in October 2023. As illustrated in Figure 12, the ability of PlanetiQ to penetrate the lower troposphere increases with an increase in latitude. PlanetiQ can penetrate the lower troposphere below 1 km better than KOMPSAT-5 and PAZ, as shown in Figure 10 and Figure 12. Moreover, in the equatorial region, the ability of KOMPSAT-5 and PAZ to penetrate the lower troposphere below 1 km is significantly less than that of PlanetiQ. Therefore, PlanetiQ has a better performance in sounding the deeper troposphere than KOMPSAT-5 and PAZ.

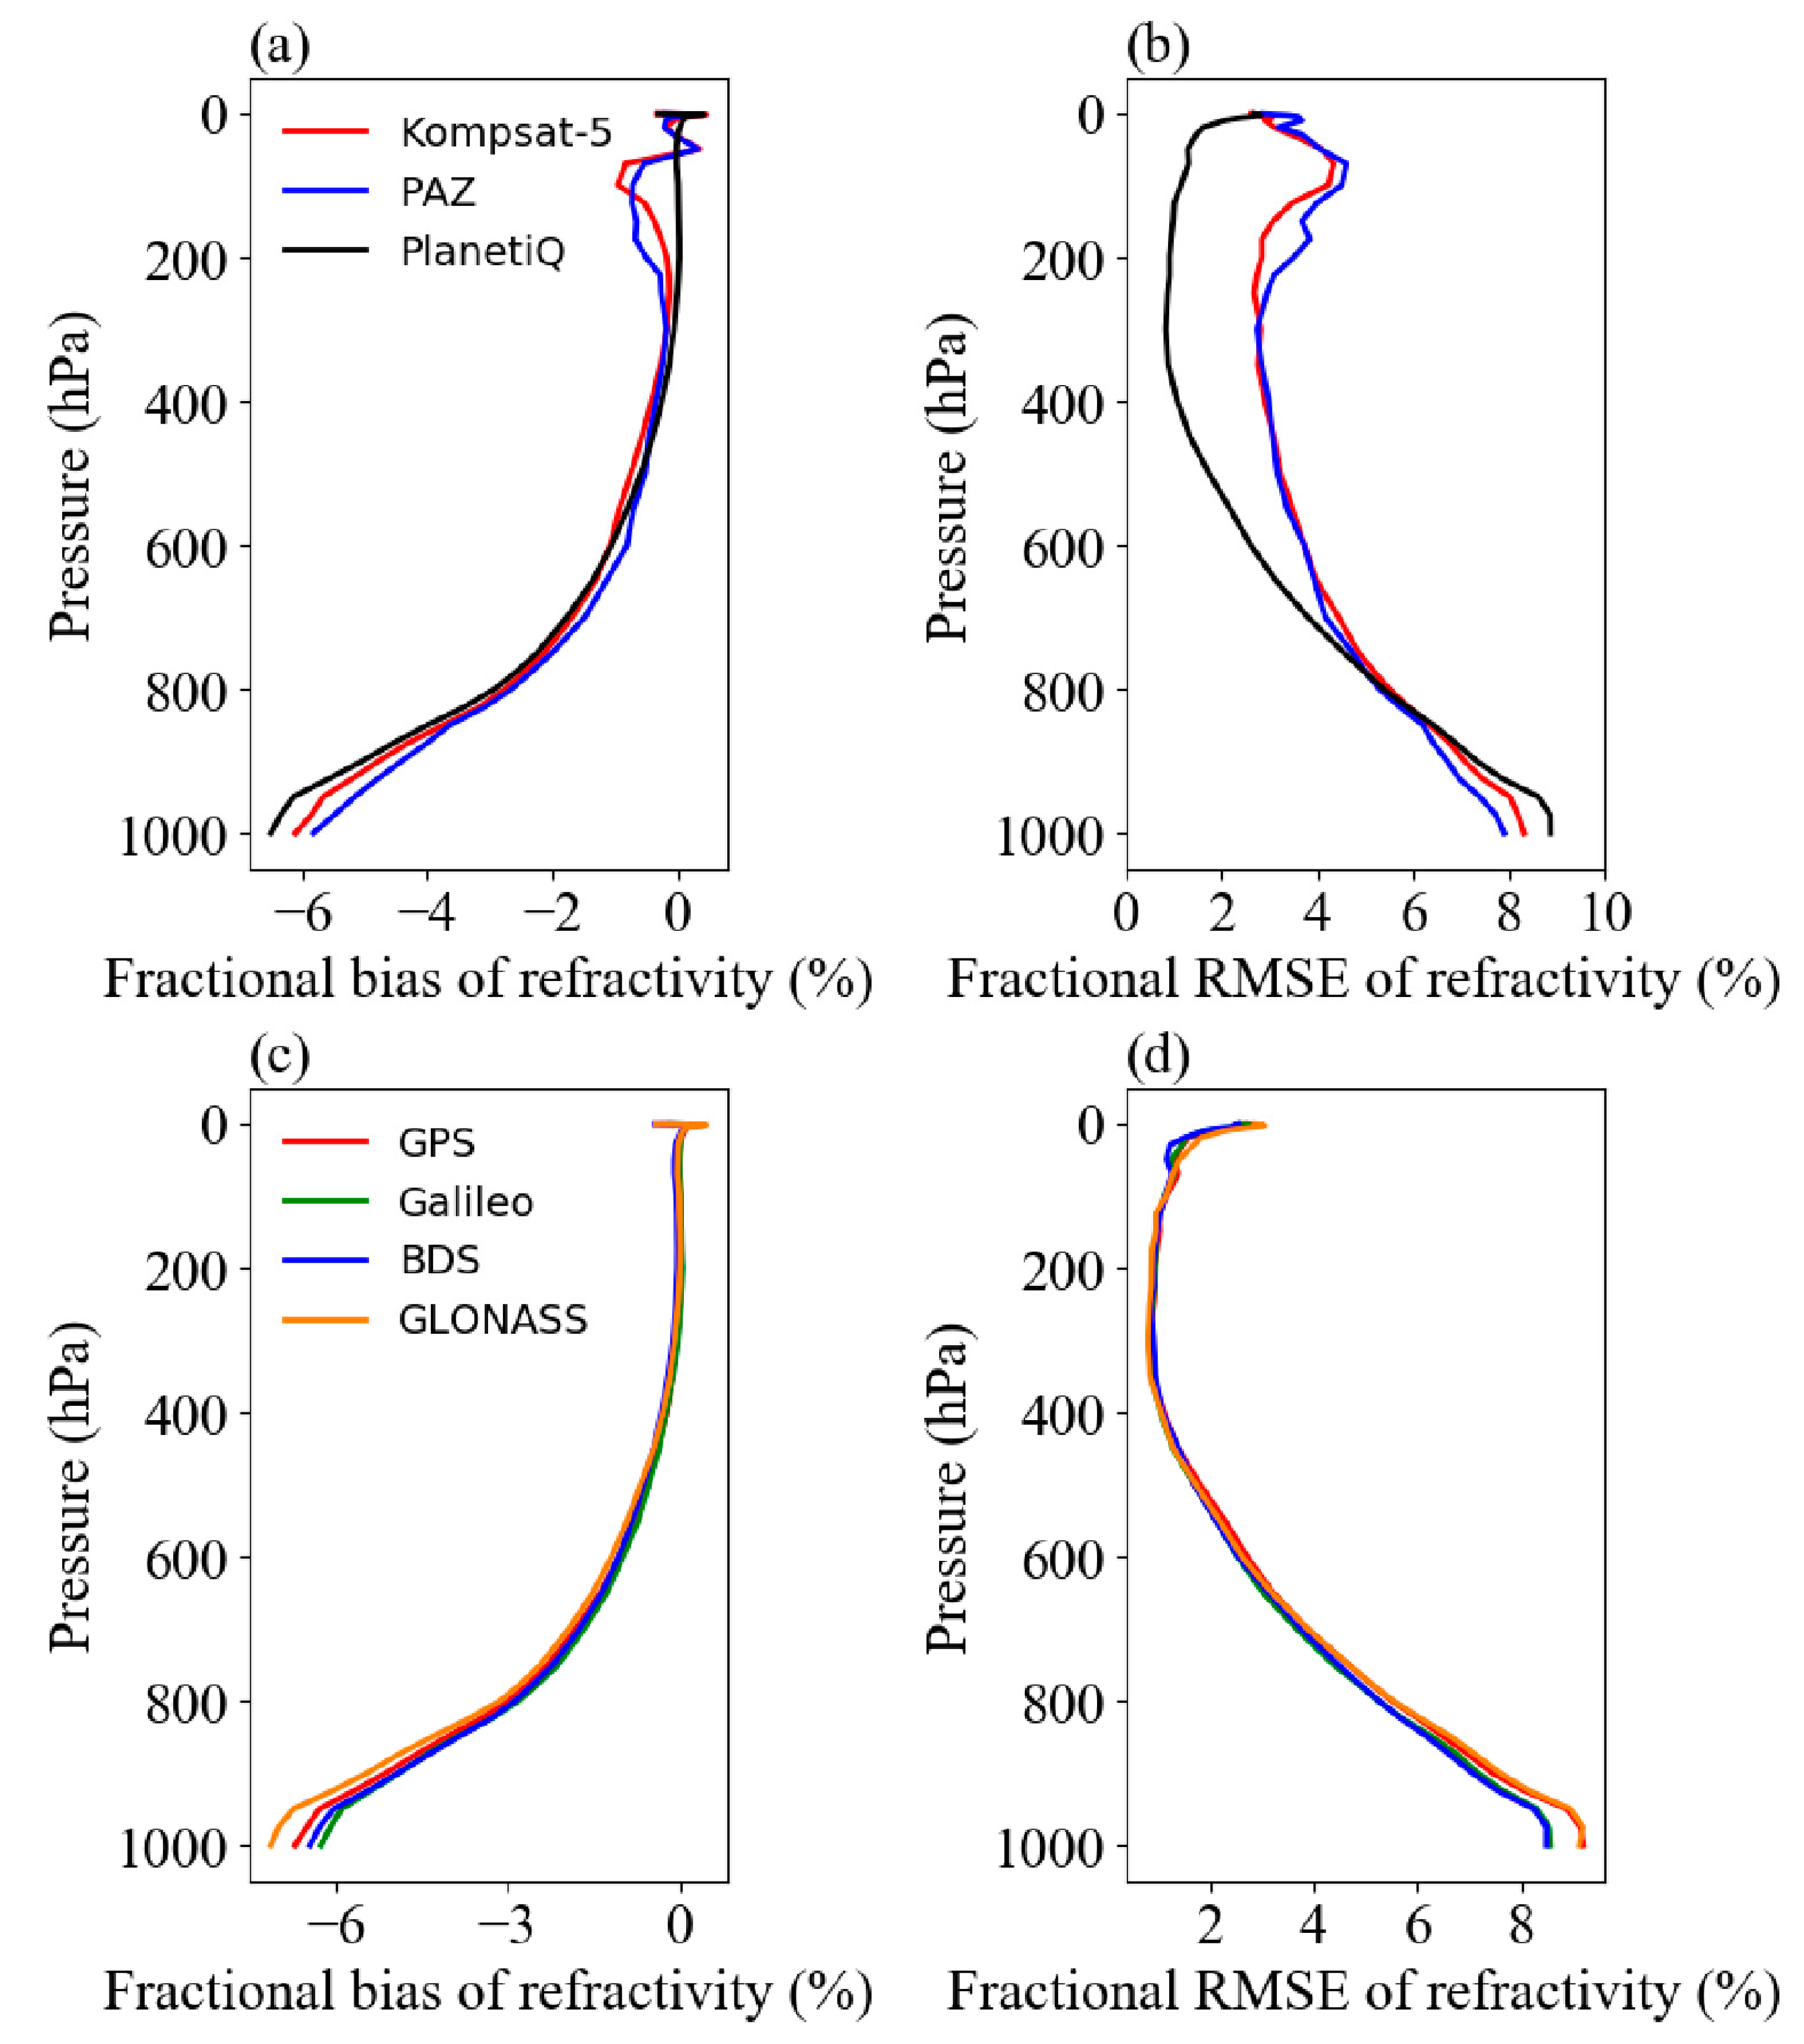
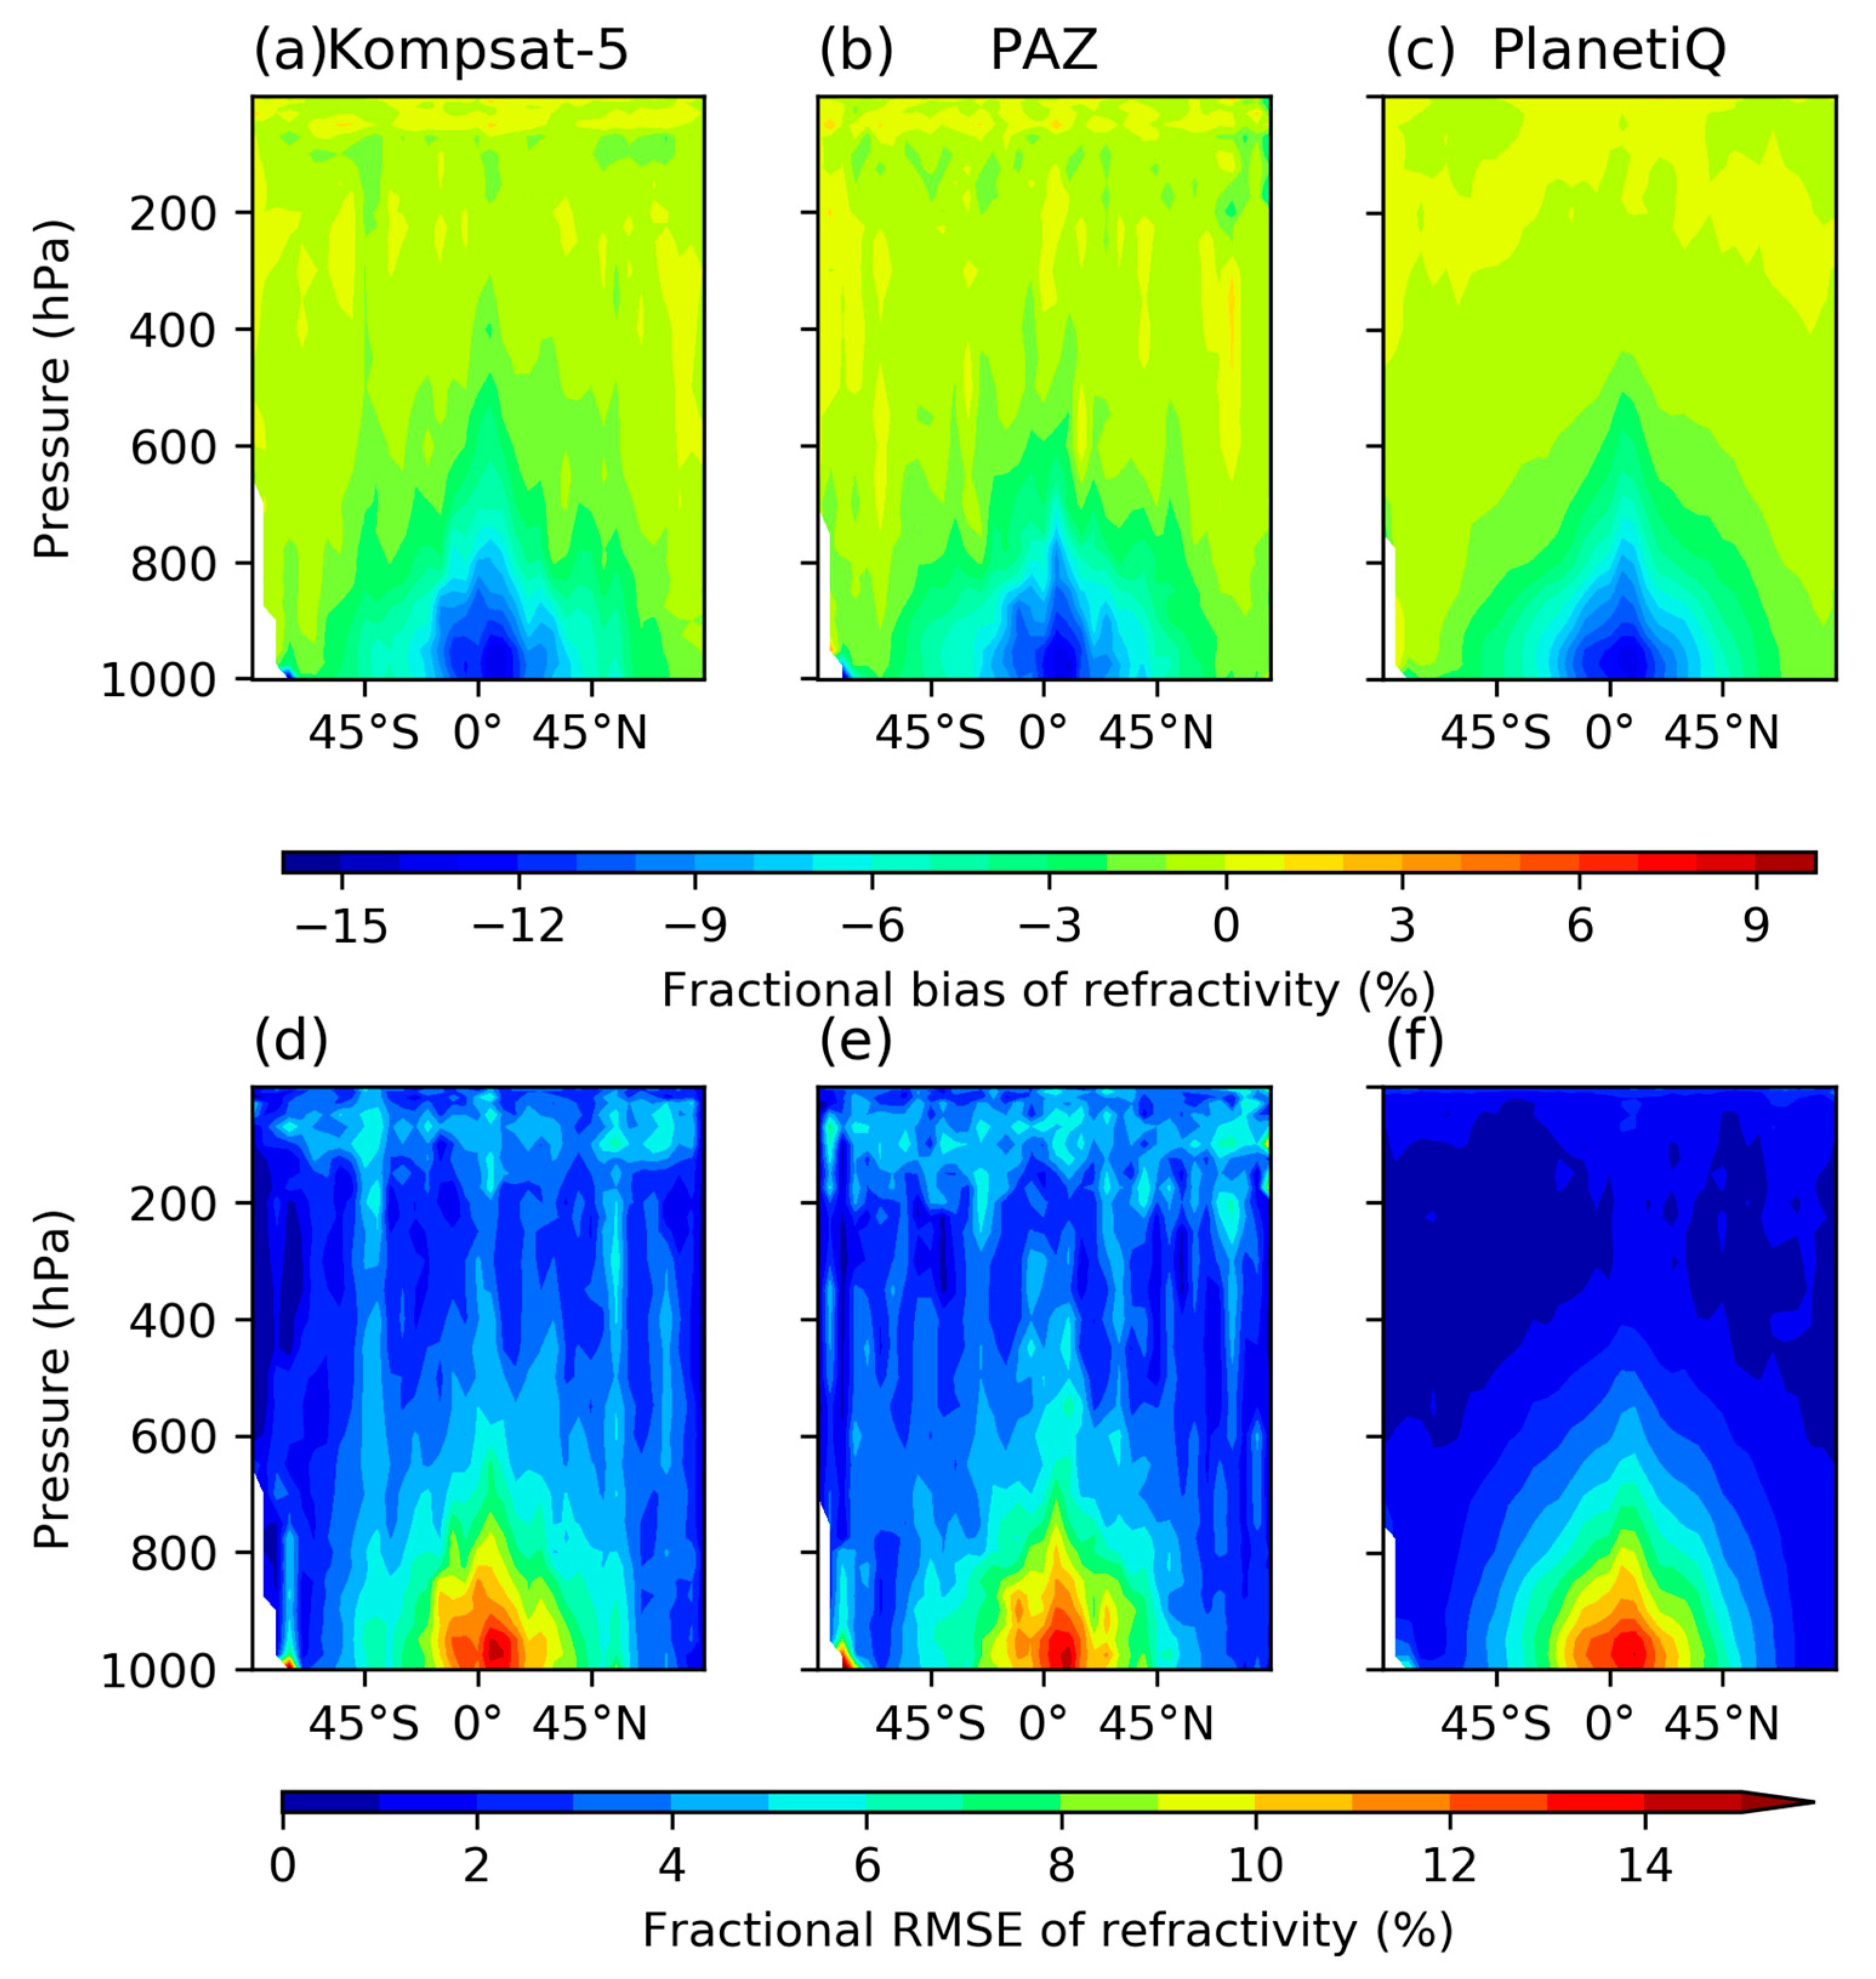
3.3. Assessment of PlanetiQ Refractivity Accuracy

To assess the performance of PlanetiQ, we analyzed the influence of SNR on RO data quality. Additionally, this section compares the PlanetiQ RO measurements with other datasets to evaluate their quality. As previously indicated, we compared the refractivity obtained from the RO data with the refractivity from ERA5. Figure 13 shows the mean fractional bias and RMSE of refractivity for KOMPSAT-5, PAZ, and PlanetiQ in comparison to ERA5-derived refractivity. Generally, refractivity profiles from all three missions exhibit a small bias when compared to ERA5-derived refractivity and typically remain below 1% above 800 hPa. However, below 600 hPa, the bias escalates rapidly, straying very slightly from 1 hPa to 600 hPa. Specifically, PAZ profiles demonstrate less bias than those from KOMPSAT-5 and PlanetiQ, particularly below 400 hPa. Conversely, above 400 hPa, PlanetiQ profiles display significantly less bias compared to KOMPSAT-5 and PAZ profiles. Moreover, this study did not find that the lower SNR RO data led to less precise retrieval results. Refractivity errors rise below 800 hPa for a number of causes, including the presence of water vapor and consequent multipath, greater horizontal gradients.
Regarding the fractional RMSE of profiles, KOMPSAT-5 and PAZ profiles exhibit similar distributions, while PlanetiQ profiles show noticeably fewer errors compared to both KOMPSAT-5 and PAZ profiles. Below 800 hPa, PAZ profiles demonstrate the least RMSE error, whereas PlanetiQ profiles show the highest among the three missions, likely due to the mean bias below 800 hPa. Super-refraction, which happens when the vertical refractivity gradient is beyond the critical value, is the reason for these negative biases [34]. A half-cycle ambiguity when estimating the phase delay, atmospheric ducting, and receiver tracking error were the primary causes of the negative biases in RO refractivity measurements.
However, above 800 hPa, PlanetiQ profiles exhibit significantly smaller RMSE, indicating their accuracy in retrieving atmospheric refractivity, particularly within 2% at most heights above 600 hPa, possibly owing to their higher SNR. Further analysis in Figure 13c,d assesses PlanetiQ profiles from different GNSSs. It reveals that Galileo profiles exhibit the least bias, followed by BD, GPS, and then GLONASS, albeit with small differences. Regarding RMSE, profiles around 400 hPa exhibit the smallest values. Galileo and BD profiles have smaller RMSEs in the lower layers, with minimal differences compared to GPS and GLONASS profiles.
Figure 14 displays cross-sections of fractional bias and RMSEs at different latitudes for profiles obtained from KOMPSAT-5, PAZ, and PlanetiQ. Generally, the results from all three missions exhibit similarity. Fractional bias remains small above 800 hPa, consistent with the findings in Figure 13. However, near 800 hPa, a significant fractional bias is observed from the equator to the middle latitudes, reaching its peak around 10°N. Concerning the fractional RMSE of refractivity, profiles from KOMPSAT-5 and PAZ exhibit larger RMSEs compared to profiles from PlanetiQ. These larger fractional RMSE values are primarily observed in low latitudes, with the highest fractional RMSE occurring near the surface, reaching approximately 15%. However, profiles from PlanetiQ exhibit markedly smaller RMSE values above 500 hPa compared to profiles from KOMPSAT-5 and PAZ.
Given that the PlanetiQ SNR range fluctuates when monitoring several GNSS systems, Figure 15 illustrates cross-sections of fractional bias and RMSE at various latitudes for profiles obtained from PlanetiQ for the GPS, GLONASS, Galileo, and BeiDou signals. Generally, fractional bias remains small above 800 hPa but increases notably at lower layers, particularly near the equator. Minimal differences are observed between the profiles from the four GNSS data sources. Regarding the fractional RMSE, the profiles from PlanetiQ display relatively large errors below 600 hPa, spanning from 45°S to 45°N.
The overall mean fractional bias and RMSEs for these profiles are summarized in Table 2, obtained by averaging the fractional bias and RMSEs for each profile. The maximum fractional refractivity bias is about 1.63% for the GLONASS signals, while the minimum fractional refractivity bias is about 1.42% for the Galileo signals, as listed in Table 2. GLONASS’s RMSE is larger than GPS, Galileo, and BeiDou’s. Additionally, ERA5 overestimates the refractivity more than GNSS RO. In conclusion, there may be major implications for forecast accuracy, model validation, data assimilation, climatic studies, and operational decisions resulting from ERA5’s overestimation of refractivity. Recalibrating ERA5 data using GNSS RO measurements or implementing more advanced methods to reduce refractivity biases could be two possible solutions to this problem. This would contribute to ERA5’s ongoing credibility as a trustworthy and accurate tool for atmospheric science and practical weather forecasting.

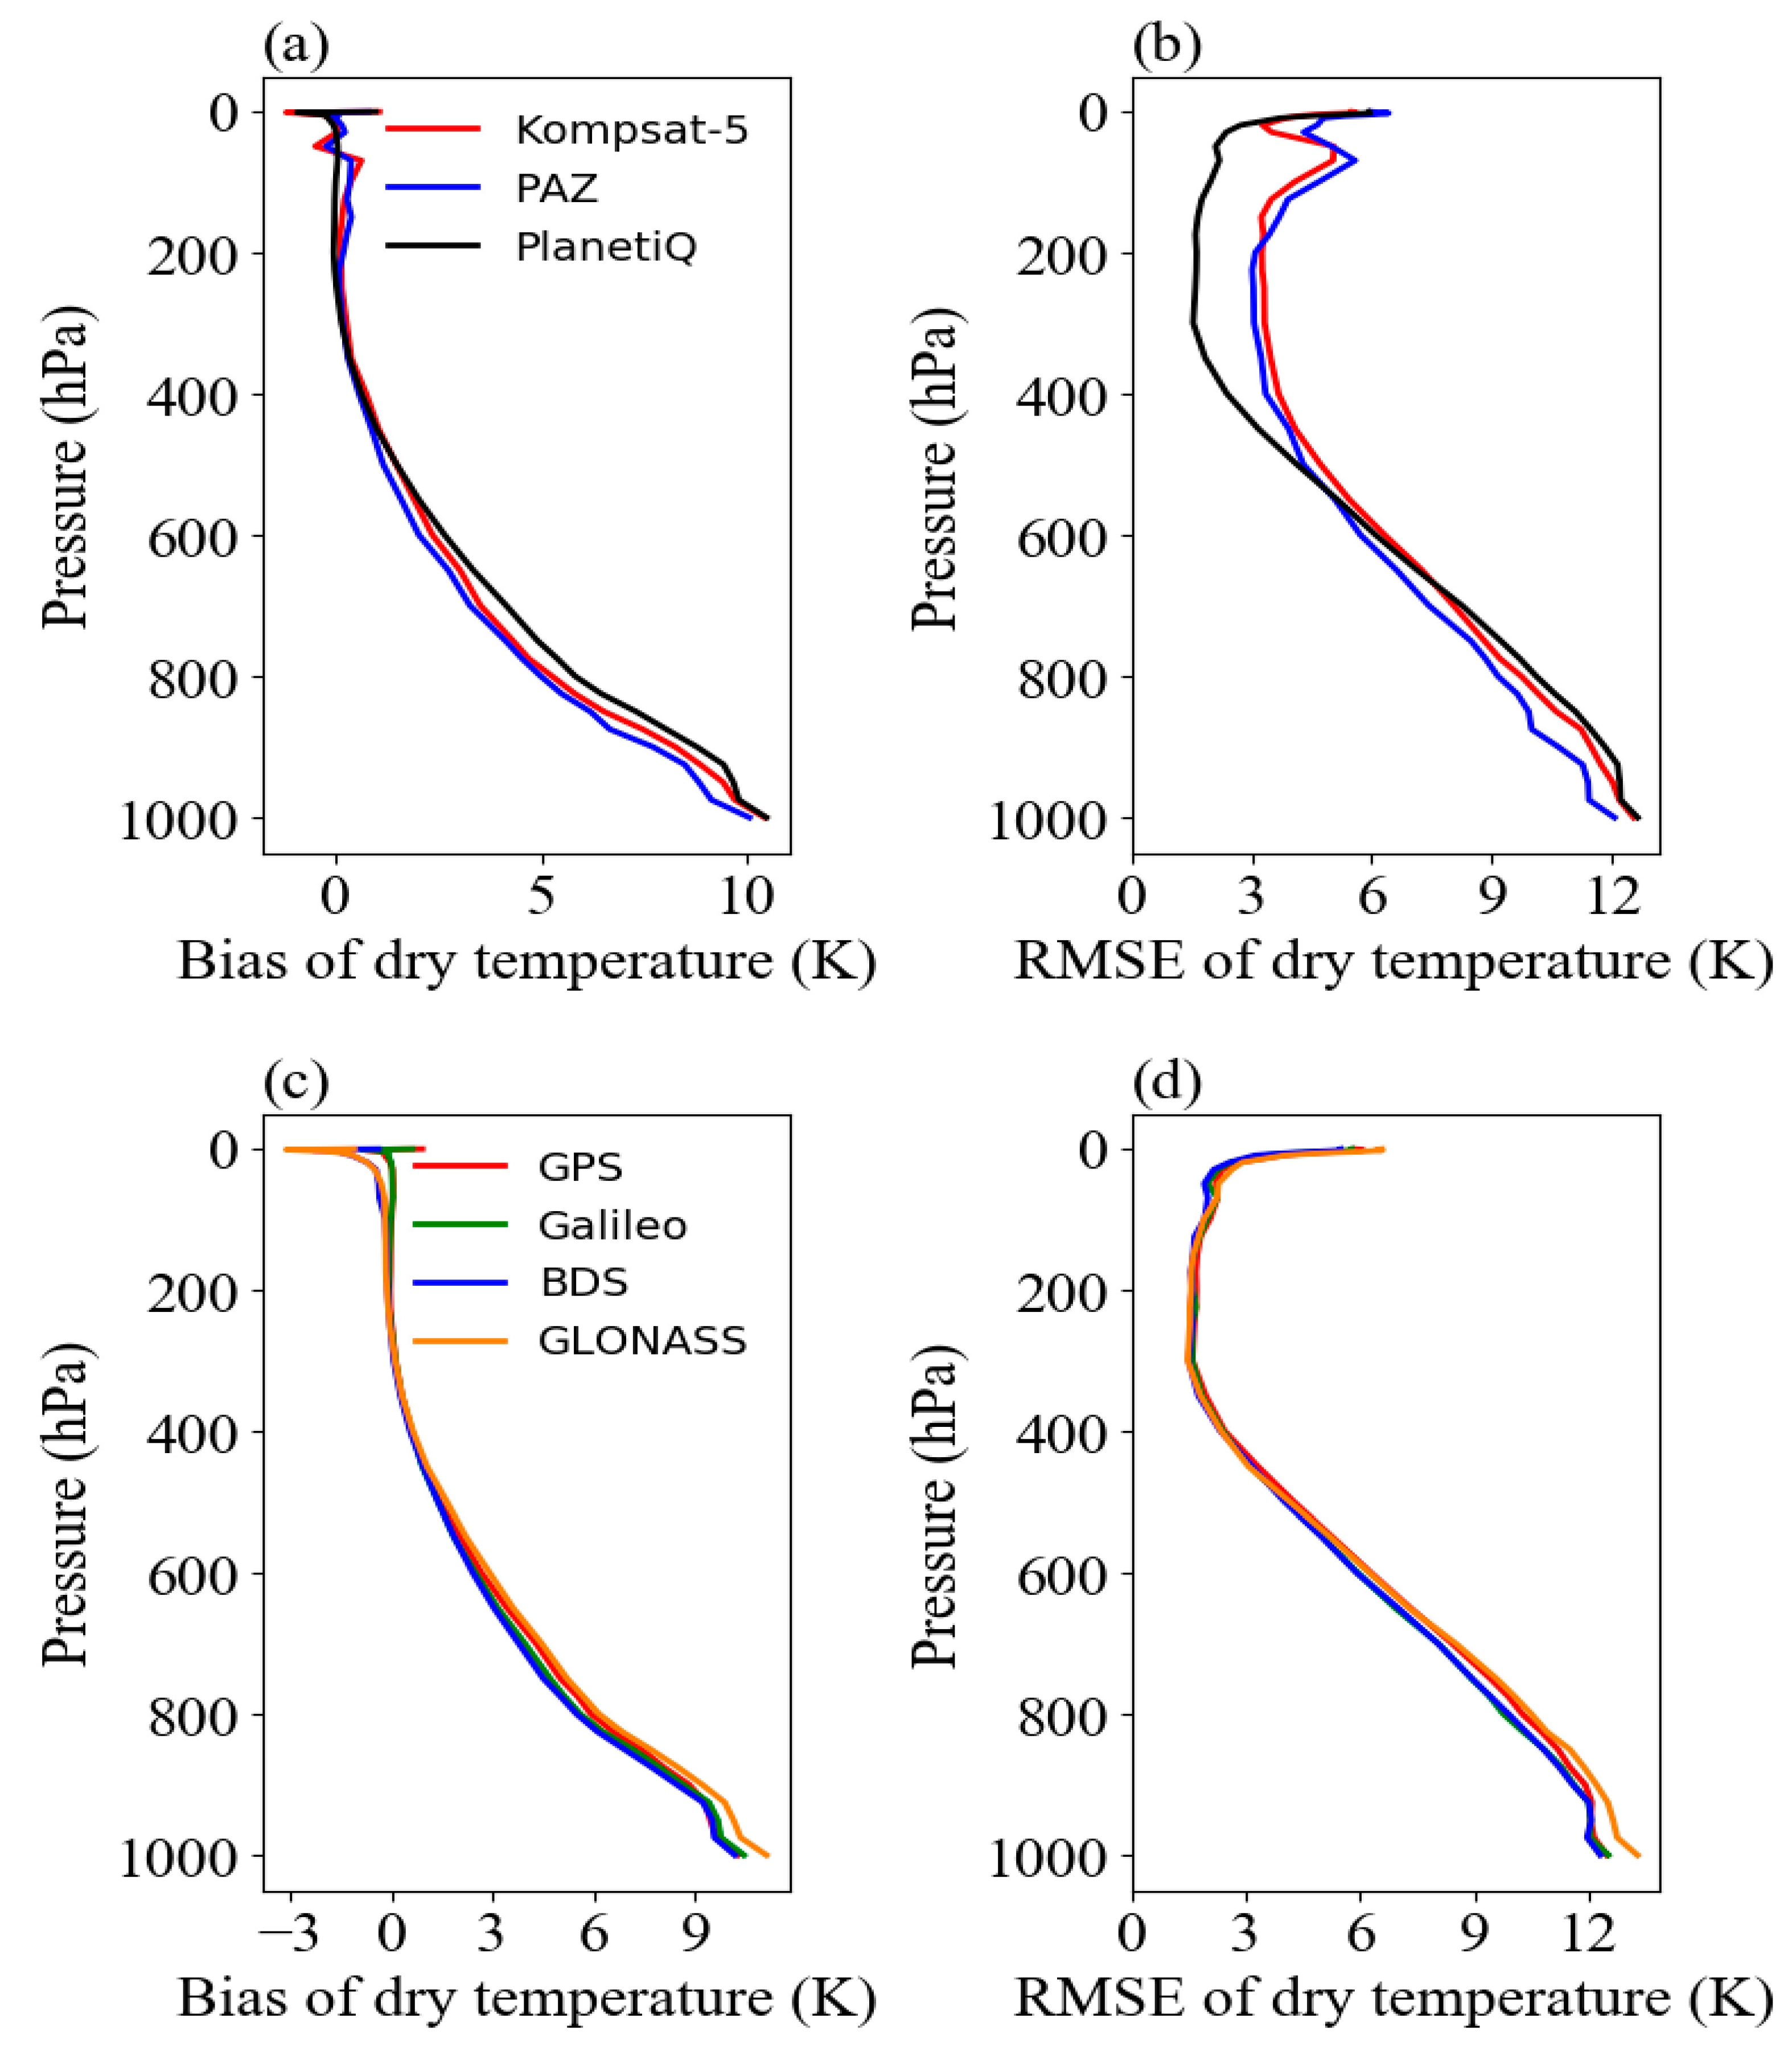
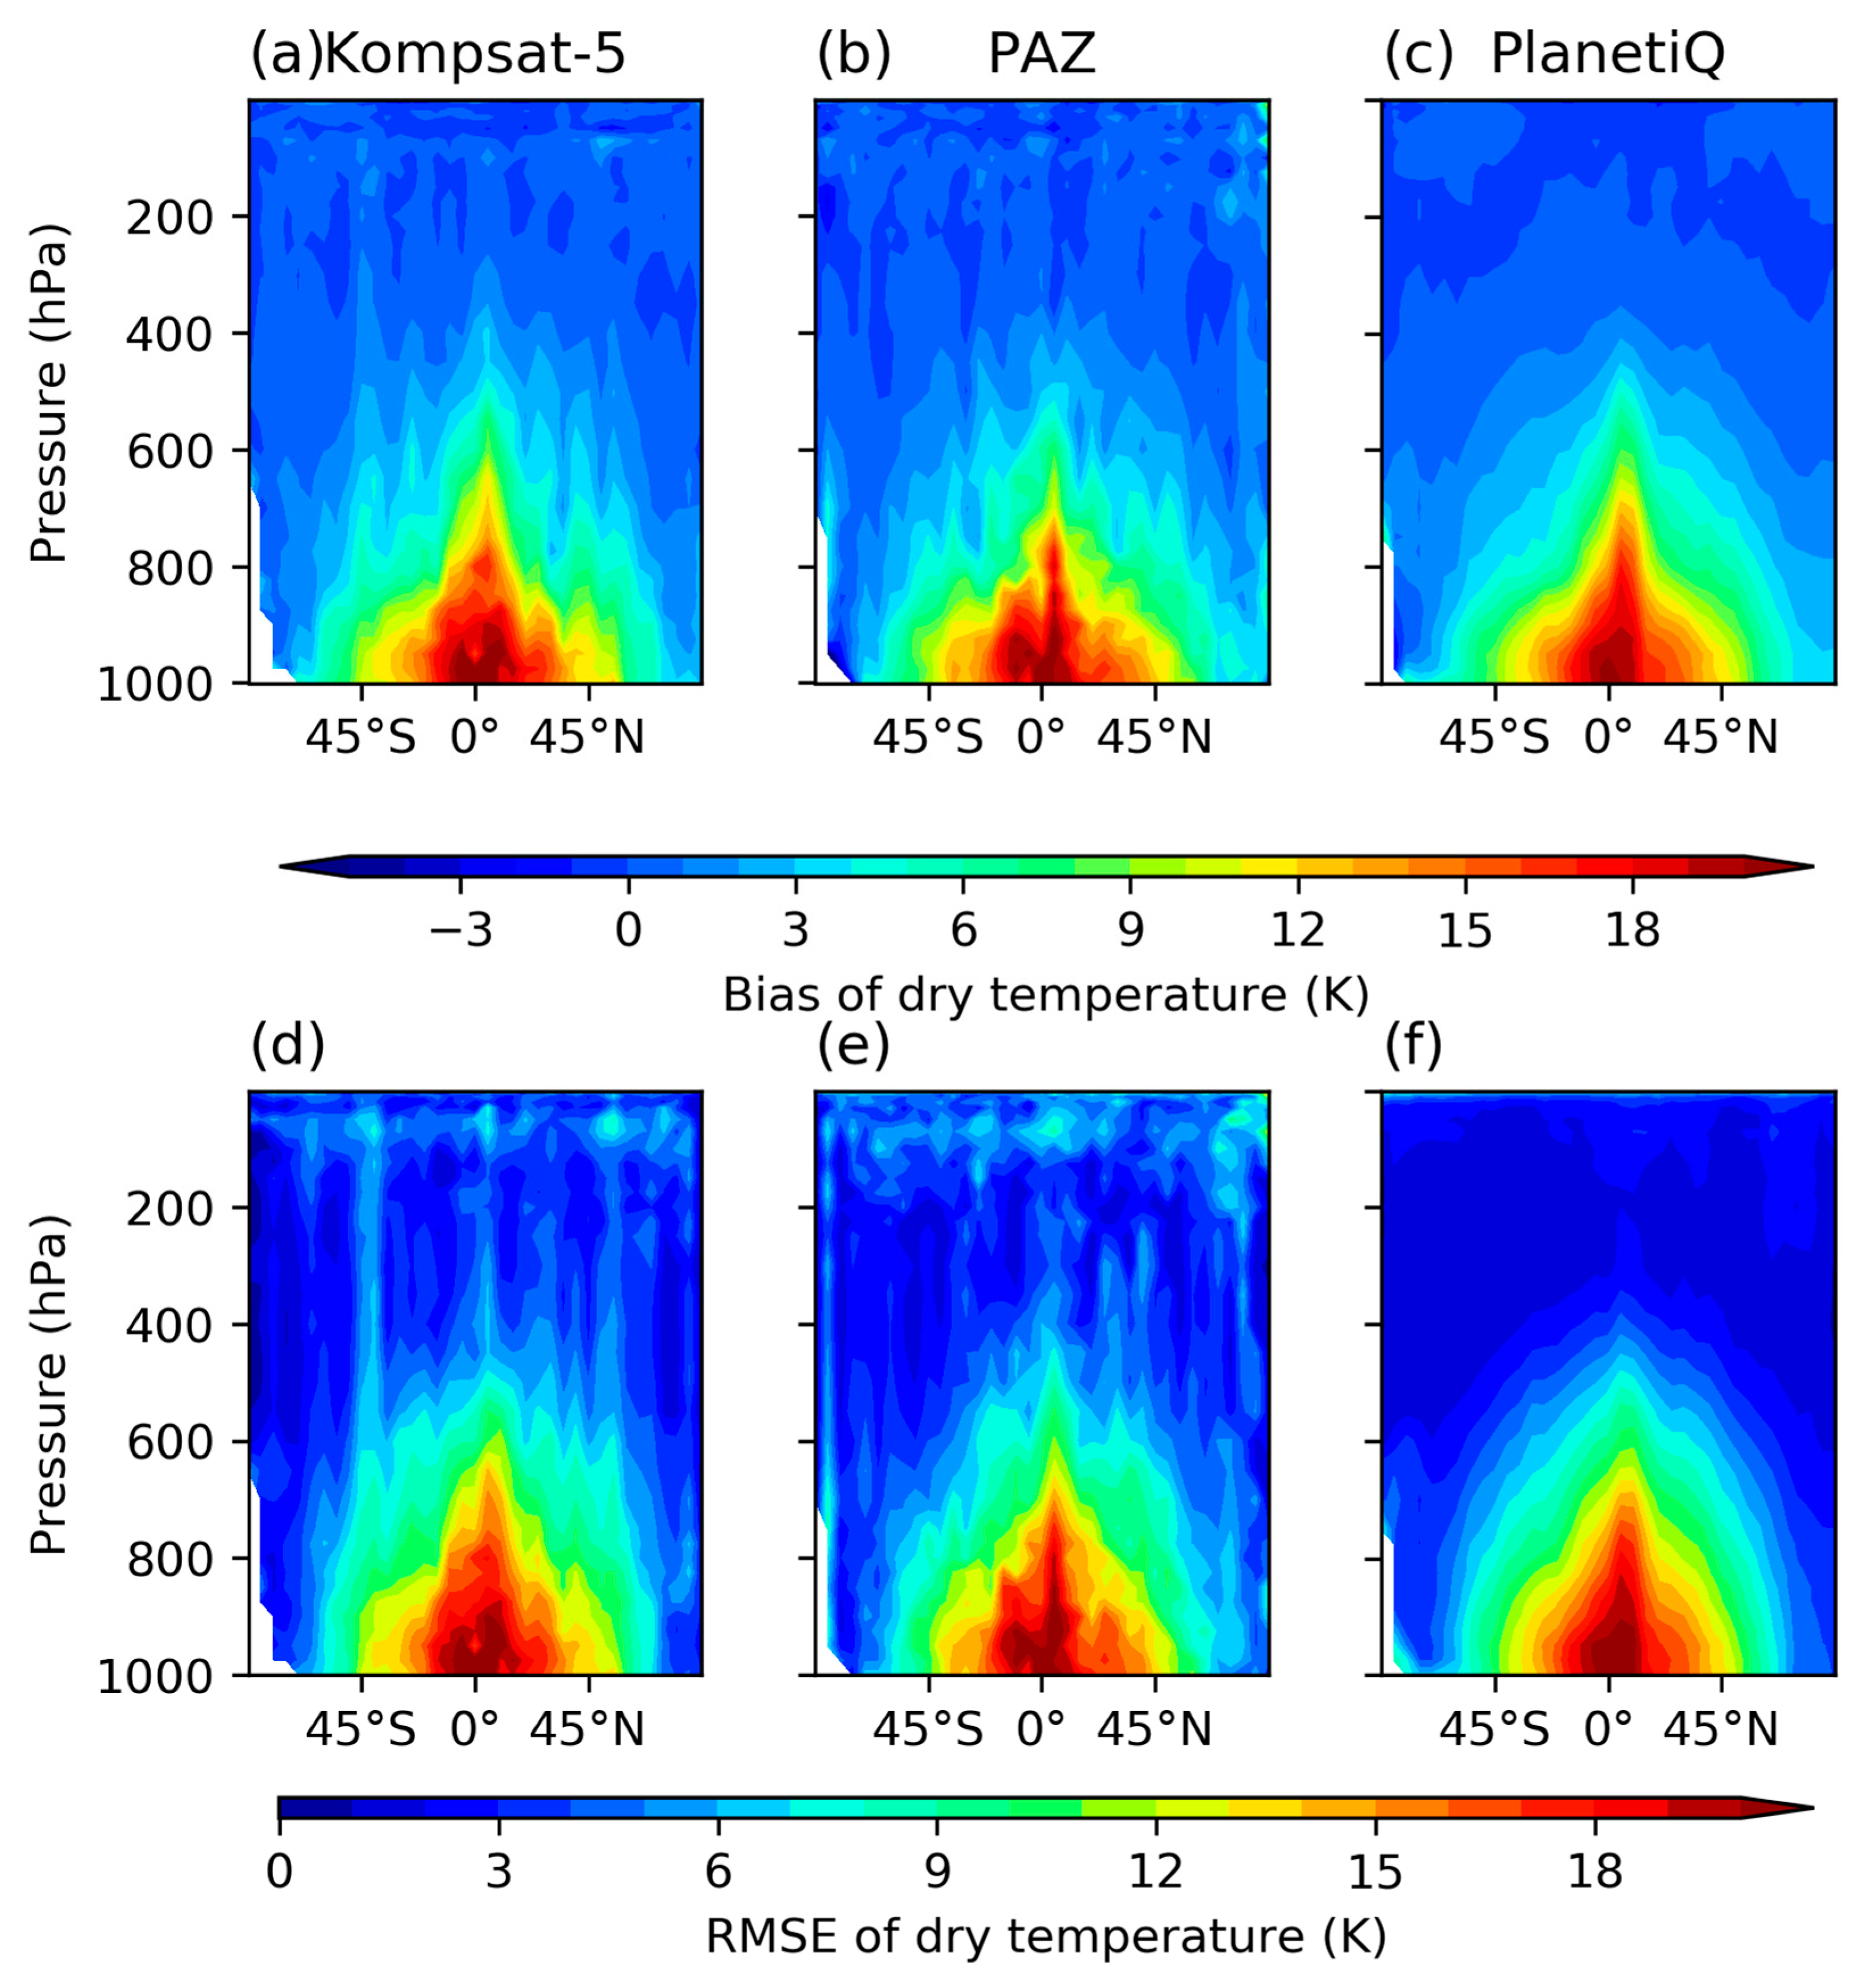
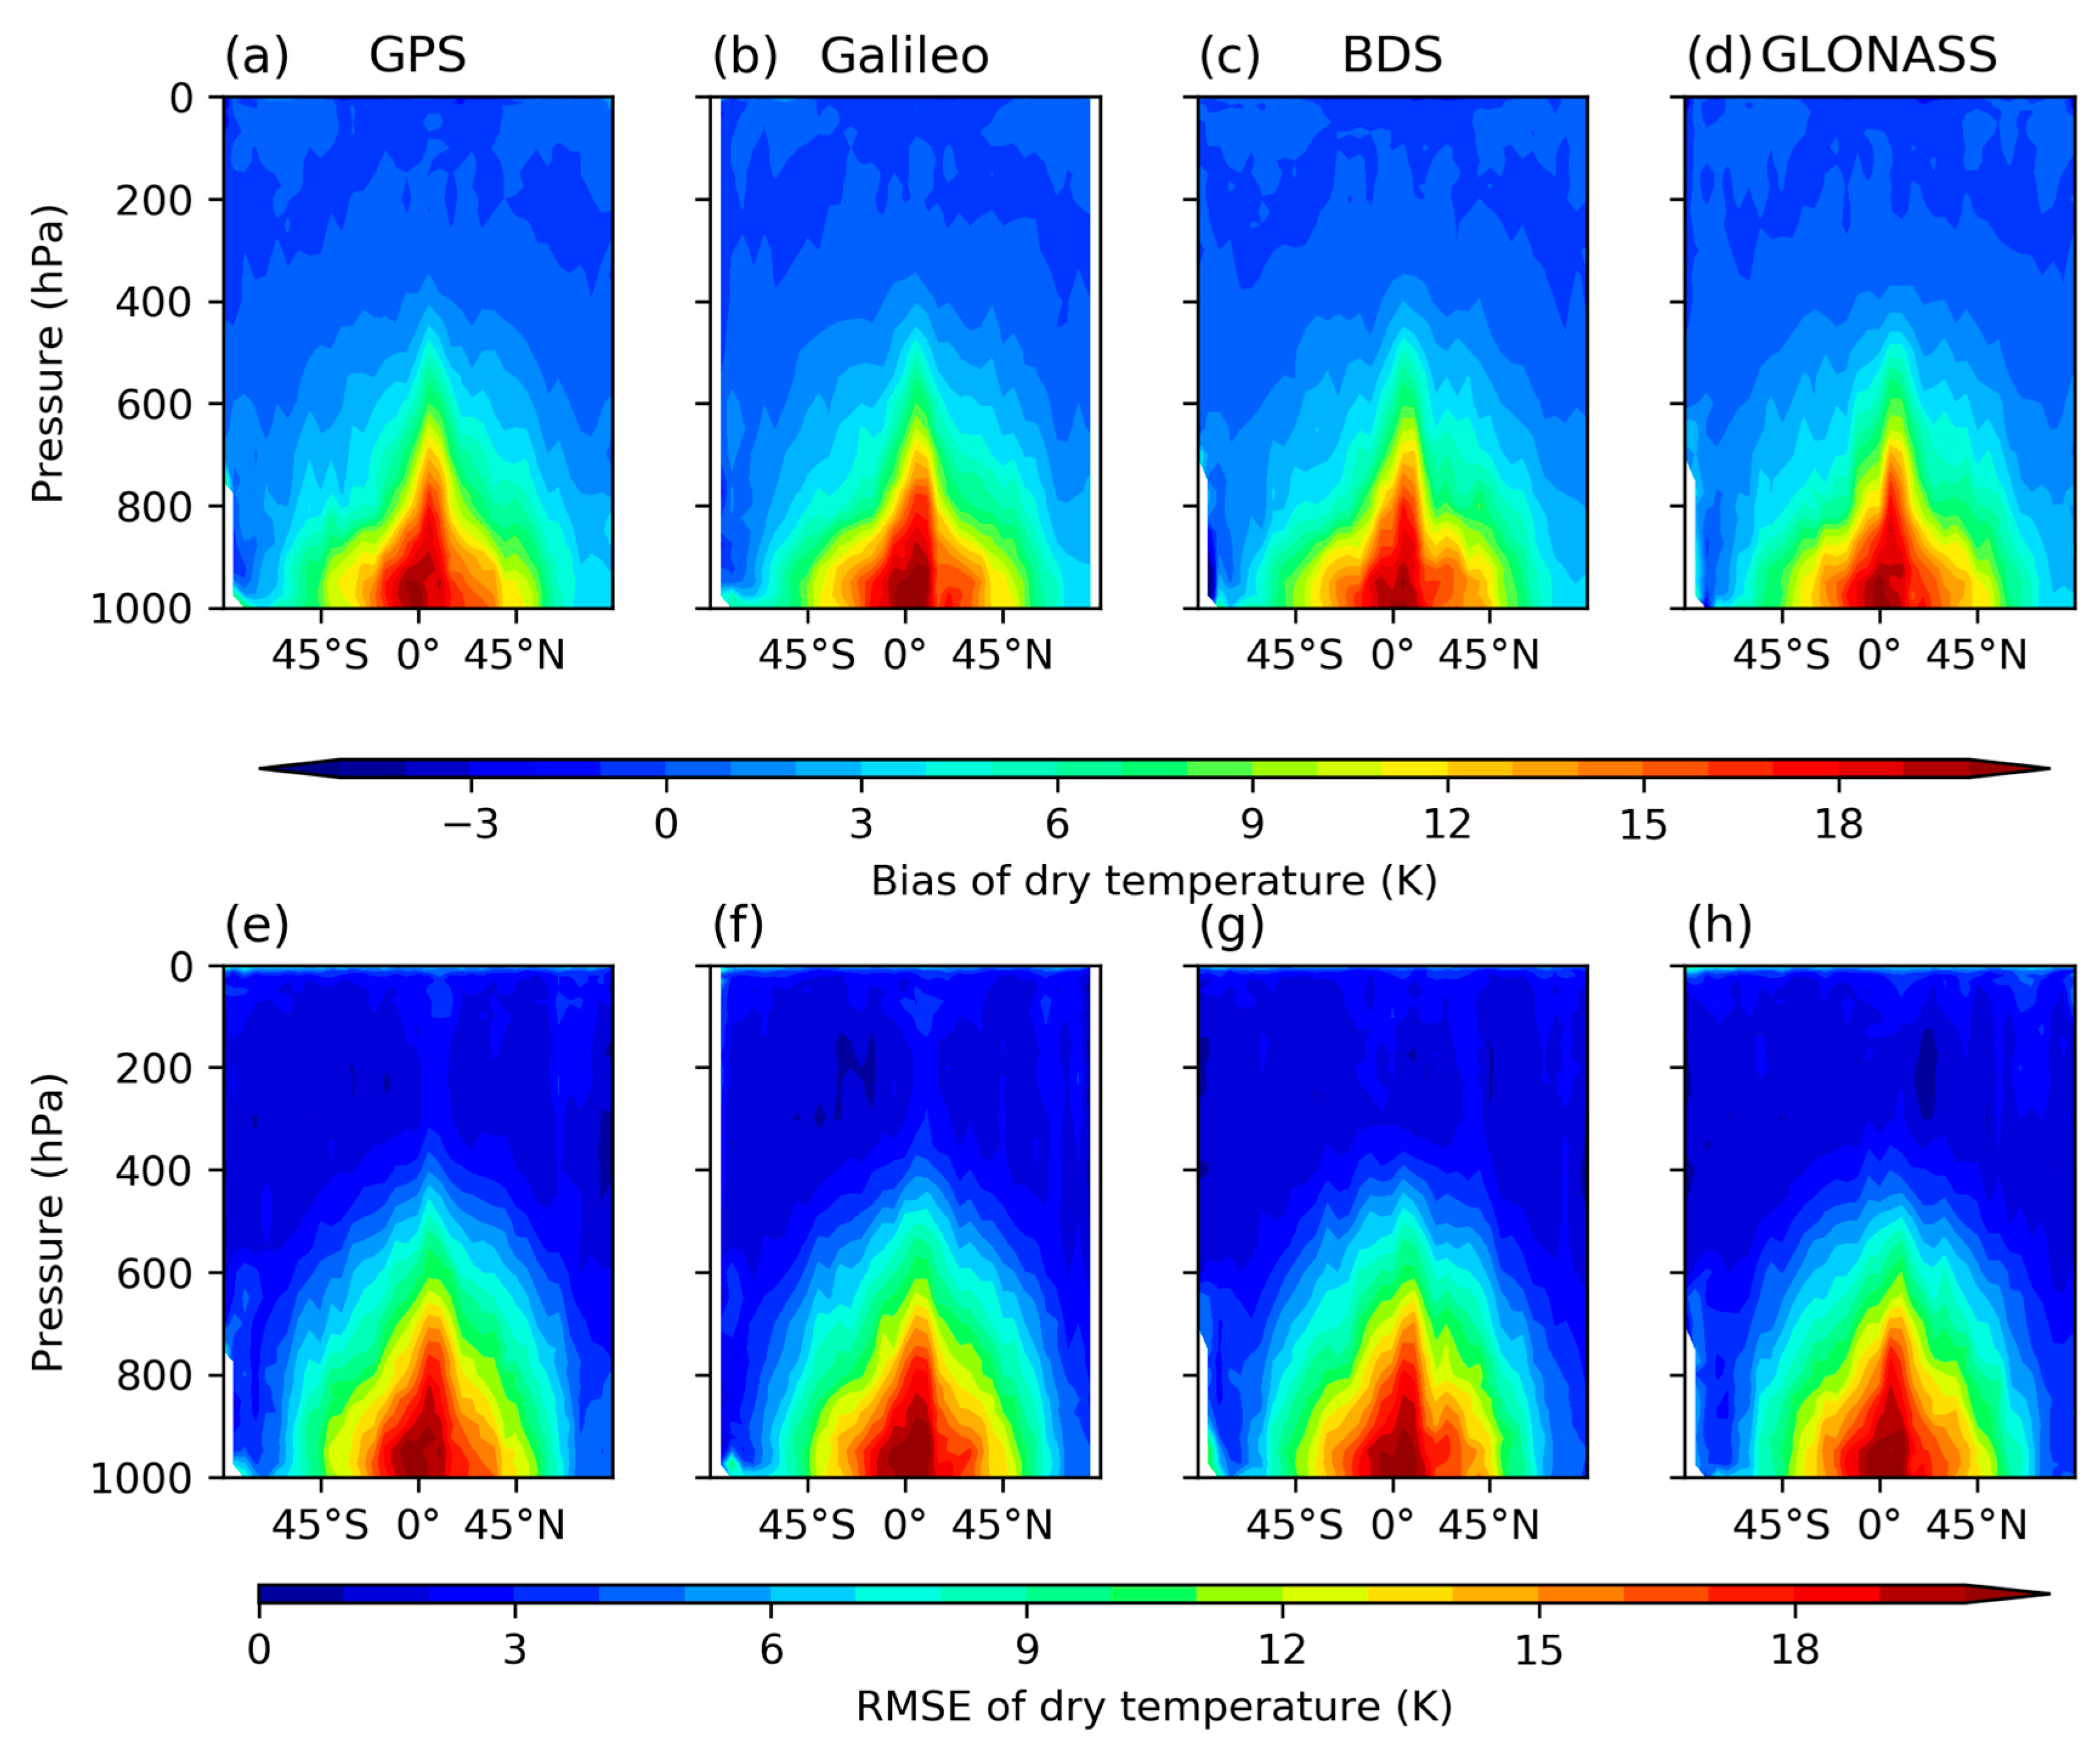
3.4. Assessment of the PlanetiQ Temperature Accuracy

Figure 16 presents the mean bias and RMSE of dry temperature derived from KOMPSAT-5, PAZ, and PlanetiQ missions, against ERA5-derived dry temperatures. Generally, dry temperature profiles from all three missions exhibit minimal bias in comparison to ERA5-derived dry temperatures above 500 hPa. However, below 500 hPa, the bias escalates notably. Overall, PlanetiQ profiles demonstrate lesser bias and RMSE in dry temperatures above 500 hPa compared to KOMPSAT-5 and PAZ profiles, albeit displaying slightly larger errors below this altitude. Subsequent analysis in Figure 16c,d evaluates PlanetiQ profiles derived from various GNSSs, revealing marginal discrepancies among them.
Figure 17 illustrates cross-sectional views of bias and RMSEs of dry temperatures at various latitudes, derived from profiles obtained from KOMPSAT-5, PAZ, and PlanetiQ. Generally, findings from all three missions exhibit similarities, with RMSE distributions closely corresponding to bias distributions. Errors remain minimal above 500 hPa but escalate rapidly below this altitude. Particularly noteworthy is the superior accuracy of dry temperature data from PlanetiQ above 500 hPa compared to that from KOMPSAT-5 and PAZ. Additionally, there are negligible disparities among PlanetiQ profiles sourced from the four GNSS datasets, as depicted in Figure 18.
This study observed significant biases in both refractivity and temperature below 500 hPa, which could be due to the more complex behavior of water vapor in the lower troposphere. Therefore, the direct use of PlanetiQ products for lower troposphere research should be approached with caution. Further studies, particularly on data assimilation, are recommended to correct these systematic biases in the observations.

4. Conclusions

This study aims to assess if PlanetiQ RO is applicable for precise numerical weather forecasting by comparing its data with that from KOMPSAT-5 and PAZ. In this work, in sequence, we examined the coverage, SNRs, and penetration properties of the data from KOMPSAT-5, PAZ, and PlanetiQ. According to our findings, while PlanetiQ captures signals from GPS, Galileo, GLONASS, and BDS, KOMPSAT-5 and PAZ receive signals from GPS alone, and RO profiles are scattered worldwide. With PlanetiQ, the proportion of setting RO events is higher than the percentage of rising events for all signals from GPS, Galileo, GLONASS, and BDS. As PlanetiQ has L1 SNR values larger than KOMPSAT-5 and PAZ, it is expected to penetrate deeper into the lower troposphere. The daily mean SNR for the L1 and L2 bands, respectively, are between 1115 and 1202 and between 999 and 1095 v / v during the study period. For PlanetiQ, KOMPSAT-5, and PAZ, the estimated percentages of RO events that penetrated below 200 m were 65.3%, 48.7%, and 51.3%, respectively. However, the SNR may not be the only parameter that influences RO retrieval uncertainty.
We also evaluated the associated RO refractivity and temperature from PlanetiQ by comparing it with ERA5. Despite KOMPSAT-5 and PAZ having lower SNR values compared to those of PlanetiQ, refractivity profiles from all three missions exhibit a small bias from ERA5 and typically remain below 1% above 800 hPa. Moreover, PAZ profiles present less bias than those from KOMPSAT-5 and PlanetiQ, particularly below 400 hPa. Moreover, this study did not find that the lower SNR RO data led to less precise retrieval outcomes. Additionally, ERA5 overestimates the refractivity more than GNSS RO. For PlanetiQ, GLONASS’s RMSE is larger than GPS, Galileo, and BeiDou’s. These results highlight the important contribution that nanosatellite GNSS RO methods, such as PlanetiQ, provide to the advancement of atmospheric monitoring. It is feasible to conduct long-term environmental monitoring with many ROs if PlanetiQ data are regularly collected and processed. We recommend extending the data time frame to allow for a more comprehensive assessment of the mission’s long-term performance.
These findings demonstrate that high-SNR PlanetiQ radio occultation soundings may improve operational NWPs, offer remarkably valuable data to the international scientific community, and create innovative and intriguing opportunities for investigating the complex tropical atmosphere. However, further analysis is required to assess the advantages of PlanetiQ RO data on an operational NWP forecast. Additionally, we recommend estimating the PlanetiQ BA vertical error uncertainty, which is critical to the RO NWP and is represented by the diagonal components in the error covariance matrix. To employ commercial satellites for NWPs and climate applications, we must closely monitor the inter-consistency of the retrieved data products and the quality of each receiver.

Author Contributions

Conceptualization, M.Z.; methodology, M.Z.; software, M.Z.; validation, Y.W.; formal analysis, M.Z.; investigation, M.Z. and A.M.; resources, M.Z.; data curation, M.Z.; writing—original draft, M.Z. and Y.W.; writing—review and editing, M.Z., A.M., F.F.B.H. and S.J.; visualization, M.Z. and Y.W.; supervision, M.Z.; project administration, M.Z. All authors have read and agreed to the published version of the manuscript.

Funding

This research was funded by the Princess Nourah bint Abdulrahman University Researchers Supporting Project number (PNURSP2024R675), Princess Nourah bint Abdulrahman University, Riyadh, Saudi Arabia.

Data Availability Statement

The GNSS RO data can be downloaded from the COSMIC Data Analysis and Archive Center (CDAAC, http://cdaac-www.cosmic.ucar.edu/, accessed on 1 January 2024).

Acknowledgments

The Authors extend their appreciation to Princess Nourah bint Abdulrahman University Researchers Supporting Project number (PNURSP2024R675), Princess Nourah bint Abdulrahman University, Riyadh, Saudi Arabia.

Conflicts of Interest

The authors declare no conflicts of interest.

References

  1. Liu, C.; Liao, M.; Sun, Y.; Wang, X.; Liang, J.; Hu, X.; Zhang, P.; Yang, G.; Liu, Y.; Wang, J.; et al. Preliminary Assessment of BDS Radio Occultation Retrieval Quality and Coverage Using FY-3E GNOS II Measurements. Remote Sens. 2023, 15, 5011. [Google Scholar] [CrossRef]
  2. Zhran, M.; Mousa, A.; Alshehri, F.; Jin, S. Evaluation of Tropopause Height from Sentinel-6 GNSS Radio Occultation Using Different Methods. Remote Sens. 2023, 15, 5513. [Google Scholar] [CrossRef]
  3. Anthes, R.A. Exploring Earth’s atmosphere with radio occultation: Contributions to weather, climate and space weather. Atmos. Meas. Tech. 2011, 4, 1077–1103. [Google Scholar] [CrossRef]
  4. Steiner, A.K.; Lackner, B.C.; Ladstdter, F.; Scherllin-Pirscher, B.; Foelsche, U.; Kirchengast, G. GPS radio occultation for climate monitoring and change detection. Radio Sci. 2011, 46, 1–17. [Google Scholar] [CrossRef]
  5. Zhran, M.; Mousa, A. Global tropopause height determination using GNSS radio occultation. Egypt. J. Remote Sens. Space Sci. 2023, 26, 317–331. [Google Scholar] [CrossRef]
  6. Bai, W.; Deng, N.; Sun, Y.; Du, Q.; Xia, J.; Wang, X.; Meng, X.; Zhao, D.; Liu, C.; Tan, G.; et al. Applications of gnss-ro to numerical weather prediction and tropical cyclone forecast. Atmosphere 2020, 11, 1204. [Google Scholar] [CrossRef]
  7. Elrahman Yassien, A.; El-Kutb Mousa, A.; Rabah, M.; Saber, A.; Zhran, M. Analysis of spatial and temporal variation of precipitable water vapor using COSMIC radio occultation observations over Egypt. Egypt. J. Remote Sens. Space Sci. 2022, 25, 751–764. [Google Scholar] [CrossRef]
  8. Innerkofler, J.; Kirchengast, G.; Schwärz, M.; Pock, C.; Jäggi, A.; Andres, Y.; Marquardt, C. Precise orbit determination for climate applications of GNSS radio occultation including uncertainty estimation. Remote Sens. 2020, 12, 1180. [Google Scholar] [CrossRef]
  9. Foelsche, U.; Pirscher, B.; Borsche, M.; Kirchengast, G.; Wickert, J. Assessing the climate monitoring utility of radio occupation data: From CHAMP to FORMOSAT-3/COSMIC. Terr. Atmos. Ocean. Sci. 2009, 20, 155–170. [Google Scholar] [CrossRef]
  10. Bauer, P.; Radnóti, G.; Healy, S.; Cardinali, C. GNSS radio occultation constellation observing system experiments. Mon. Weather Rev. 2014, 142, 555–572. [Google Scholar] [CrossRef]
  11. Harnisch, F.; Healy, S.B.; Bauer, P.; English, S.J. Scaling of GNSS radio occultation impact with observation number using an ensemble of data assimilations. Mon. Weather Rev. 2013, 141, 4395–4413. [Google Scholar] [CrossRef]
  12. Anthes, R.; Sjoberg, J.; Feng, X.; Syndergaard, S. Comparison of COSMIC and COSMIC-2 Radio Occultation Refractivity and Bending Angle Uncertainties in August 2006 and 2021. Atmosphere 2022, 13, 790. [Google Scholar] [CrossRef]
  13. Kuo, Y.H.; Wee, T.K.; Sokolovskiy, S.; Rocken, C.; Schreiner, W.; Hunt, D.; Anthes, R.A. Inversion and Error Estimation of GPS Radio Occultation Data. J. Meteorol. Soc. Japan. Ser. II 2004, 82, 507–531. [Google Scholar] [CrossRef]
  14. Zhran, M. An evaluation of GNSS radio occultation atmospheric profiles from Sentinel-6. Egypt. J. Remote Sens. Space Sci. 2023, 26, 654–665. [Google Scholar] [CrossRef]
  15. Ho, S.P.; Zhou, X.; Shao, X.; Zhang, B.; Adhikari, L.; Kireev, S.; He, Y.; Yoe, J.G.; Xia-Serafino, W.; Lynch, E. Initial assessment of the COSMIC-2/FORMOSAT-7 neutral atmosphere data quality in NESDIS/STAR using in situ and satellite data. Remote Sens. 2020, 12, 4099. [Google Scholar] [CrossRef]
  16. Zhang, J.; Xu, X.; Luo, J. Estimating the observation errors of FY-3C radio occultation dataset using the three-cornered hat method. Terr. Atmos. Ocean. Sci. 2023, 34, 22. [Google Scholar] [CrossRef]
  17. Chen, S.Y.; Liu, C.Y.; Huang, C.Y.; Hsu, S.C.; Li, H.W.; Lin, P.H.; Cheng, J.-P.; Huang, C.-Y. An analysis study of formosat-7/cosmic-2 radio occultation data in the troposphere. Remote Sens. 2021, 13, 717. [Google Scholar] [CrossRef]
  18. Shao, X.; Ho, S.P.; Zhang, B.; Cao, C.; Chen, Y. Consistency and stability of SNPP ATMS microwave observations and COSMIC-2 radio occultation over oceans. Remote Sens. 2021, 13, 3754. [Google Scholar] [CrossRef]
  19. Cao, C.; Wang, W.; Lynch, E.; Bai, Y.; Ho, S.P.; Zhang, B. Simultaneous radio occultation for intersatellite comparison of bending angles toward more accurate atmospheric sounding. J. Atmos. Ocean. Technol. 2020, 37, 2307–2320. [Google Scholar] [CrossRef]
  20. Bowler, N.E. An Initial Assessment of the Quality of RO Data from PAZ. ROM SAF Report 36. 2020. Available online: https://rom-saf.eumetsat.int/general-documents/rsr/rsr_36_v11.pdf (accessed on 1 March 2024).
  21. Yang, M.; Meng, X.; Tian, H.; Sun, Y.; Du, Q.; Bai, W.; Wang, B.; Wang, X.; Hu, P.; Tan, G. First Galileo Single-Frequency Occultation Process and Precision Analysis of FengYun3E. Remote Sens. 2023, 15, 4410. [Google Scholar] [CrossRef]
  22. Ho, S.P.; Pedatella, N.; Foelsche, U.; Healy, S.; Weiss, J.P.; Ullman, R. Using Radio Occultation Data for Atmospheric Numerical Weather Prediction, Climate Sciences, and Ionospheric Studies and Initial Results from COSMIC-2, Commercial RO Data, and Recent RO Missions. Bull. Am. Meteorol. Society. Am. Meteorol. Soc. 2022, 103, E2506–E2512. [Google Scholar] [CrossRef]
  23. Kursinski, E.R. Weather & Space Weather RO Data from PlanetiQ Commercial GNSS RO; IROWG: Boulder, CO, USA, 2019. [Google Scholar]
  24. Available online: https://planetiq.com/ (accessed on 1 April 2024).
  25. Kursinski, E.R.; Brandmeyer, J.; Feng, X.; Giesinger, B. PlanetiQ Dual Linear Polarization GNSS Measurements in 2024 for PRO and Surface Reflections. In Proceedings of the 2nd PAZ Polarimetric Radio Occultations User Workshop, Pasadena, CA, USA, 28–29 November 2023. [Google Scholar]
  26. Available online: https://www.eoportal.org/satellite-missions?Mission+type=EO (accessed on 1 April 2024).
  27. Adhikari, L.; Ho, S.P.; Zhou, X. Inverting cosmic-2 phase data to bending angle and refractivity profiles using the full spectrum inversion method. Remote Sens. 2021, 13, 1793. [Google Scholar] [CrossRef]
  28. Ho, S.P.; Zhou, X.; Shao, X.; Chen, Y.; Jing, X.; Miller, W. Using the Commercial GNSS RO Spire Data in the Neutral Atmosphere for Climate and Weather Prediction Studies. Remote Sens. 2023, 15, 4836. [Google Scholar] [CrossRef]
  29. Gorbunov, M.; Irisov, V.; Rocken, C. The Influence of the Signal-to-Noise Ratio Upon Radio Occultation Retrievals. Remote Sens. 2022, 14, 2742. [Google Scholar] [CrossRef]
  30. Schreiner, W.S.; Weiss, J.P.; Anthes, R.A.; Braun, J.; Chu, V.; Fong, J.; Hunt, D.; Kuo, Y.H.; Meehan, T.; Serafino, W.; et al. COSMIC-2 Radio Occultation Constellation: First Results. Geophys. Res. Lett. 2020, 47, e2019GL086841. [Google Scholar] [CrossRef]
  31. Zhran, M.; Mousa, A. Planetary boundary layer height retrieval using GNSS Radio Occultation over Egypt. Egypt. J. Remote Sens. Space Sci. 2022, 25, 551–559. [Google Scholar] [CrossRef]
  32. Wei, J.; Li, Y.; Zhang, K.; Liao, M.; Bai, W.; Liu, C.; Liu, Y.; Wang, X. An evaluation of Fengyun-3C radio occultation atmospheric profiles over 2015–2018. Remote Sens. 2020, 12, 2116. [Google Scholar] [CrossRef]
  33. Yu, X.; Xie, F.; Ao, C.O. Evaluating the lower-tropospheric COSMIC GPS radio occultation sounding quality over the Arctic. Atmos. Meas. Tech. 2018, 11, 2051–2066. [Google Scholar] [CrossRef]
  34. Schreiner, W.; Sokolovskiy, S.; Hunt, D.; Rocken, C. Analysis of GPS radio occultation data from the FORMOSAT-3/COSMIC and Metop/GRAS missions at CDAAC. Atmos. Meas. Tech. 2011, 4, 2255–2272. [Google Scholar] [CrossRef]
  35. Gorbunov, M.E.; Shmakov, A.V.; Leroy, S.S.; Lauritsen, K.B. COSMIC radio occultation processing: Cross-center comparison and validation. J. Atmos. Ocean. Technol. 2011, 28, 737–751. [Google Scholar] [CrossRef]
  36. Lin, C.H.; Lin, J.T.; Chang, L.C.; Liu, J.Y.; Chen, C.H.; Chen, W.H.; Huang, H.H.; Liu, C.H. Observations of global ionospheric responses to the 2009 stratospheric sudden warming event by FORMOSAT-3/COSMIC. J. Geophys. Res. Space Phys. 2012, 117, A06323. [Google Scholar] [CrossRef]
  37. Hersbach, H.; Bell, B.; Berrisford, P.; Hirahara, S.; Horányi, A.; Muñoz-Sabater, J.; Nicolas, J.; Peubey, C.; Radu, R.; Schepers, D.; et al. The ERA5 global reanalysis. Q. J. R. Meteorol. Soc. 2020, 146, 1999–2049. [Google Scholar] [CrossRef]
  38. Gorbunov, M.; Irisov, V.; Rocken, C. Noise Floor and Signal-to-Noise Ratio of Radio Occultation Observations: A Cross-Mission Statistical Comparison. Remote Sens. 2022, 14, 691. [Google Scholar] [CrossRef]
  39. Gorbunov, M.E.; Gurvich, A.S.; Shmakov, A.V. Back-propagation and radio-holographic methods for investigation of sporadic ionospheric E-layers from microlab-1 data. Int. J. Remote Sens. 2002, 23, 675–685. [Google Scholar] [CrossRef]
  40. Yunck, T.P.; Liu, C.-H.; Ware, R. A History of GPS Sounding. Terr. Atmos. Ocean. Sci. 2000, 11, 1–20. [Google Scholar] [CrossRef]
  41. Melbourne, W.G.; Davis, E.S.; Duncan, C.B.; Hajj, G.A.; Hardy, K.R.; Kursinski, E.R.; Meehan, T.K.; Young, L.E.; Yunck, T.P. The Application ofSpaceborne GPS to Atmospheric Limb Sounding and Global Change Monitoring; JPL Publication: La Cañada Flintridge, CA, USA, 1994; pp. 18–94. Available online: https://ntrs.nasa.gov/citations/19960008694 (accessed on 1 April 2024).
  42. Smith, E.K.; Weintraub, S. The Constants in the Equation for Atmospheric Refractive Index at Radio Frequencies. Proc. IRE 1953, 41, 1035–1037. [Google Scholar] [CrossRef]
  43. Chen, Q.; Song, S.; Heise, S.; Liou, Y.A.; Zhu, W.; Zhao, J. Assessment of ZTD derived from ECMWF/NCEP data with GPS ZTD over China. GPS Solut. 2011, 15, 415–425. [Google Scholar] [CrossRef]
  44. Chen, Y.; Shao, X.; Cao, C.; Ho, S.P. Simultaneous radio occultation predictions for inter-satellite comparison of bending angle profiles from COSMIC-2 and geooptics. Remote Sens. 2021, 13, 3644. [Google Scholar] [CrossRef]
  45. Zhang, B.; Ho, S.P.; Cao, C.; Shao, X.; Dong, J.; Chen, Y. Verification and Validation of the COSMIC-2 Excess Phase and Bending Angle Algorithms for Data Quality Assurance at STAR. Remote Sens. 2022, 14, 3288. [Google Scholar] [CrossRef]
  46. Qiu, C.; Wang, X.; Zhou, K.; Zhang, J.; Chen, Y.; Li, H.; Liu, D.; Yuan, H. Comparative Assessment of Spire and COSMIC-2 Radio Occultation Data Quality. Remote Sens. 2023, 15, 5082. [Google Scholar] [CrossRef]
  47. Chang, H.; Lee, J.; Yoon, H.; Morton, Y.J.; Saltman, A. Performance assessment of radio occultation data from GeoOptics by comparing with COSMIC data. Earth Planets Space 2022, 74, 108. [Google Scholar] [CrossRef]
  48. Ao, C.O.; Meehan, T.K.; Hajj, G.A.; Mannucci, A.J.; Beyerle, G. Lower troposphere refractivity bias in GPS occultation retrievals. J. Geophys. Res. Atmos. 2003, 108, 4577. [Google Scholar] [CrossRef]
Figure 1. Occultation events’ global distribution from (a) KOMPSAT-5, including 188 events, and (b) from PAZ including 193 events both from GPS satellites on 1 October 2023.
Remotesensing 16 03339 g001
Figure 2. PlanetiQ occultation events’ global distribution, including 321 events from GPS (blue), 293 events from GALILEO (red), 283 events from GLONASS (green), and 212 events from BDS (orange), on 1 October 2023.
Remotesensing 16 03339 g002
Figure 3. Monthly events number from KOMPSAT-5, PAZ, and PlanetiQ (a) and rising and setting profile percentages for PlanetiQ with occultation signals coming from GPS, Galileo, GLONASS, and BDS (b).
Remotesensing 16 03339 g003
Figure 4. Block diagram for the main processing used in this study.
Remotesensing 16 03339 g004
Figure 5. L1 SNR latitudinal distribution during October 2023 for (a) KOMPSAT-5 and (b) PAZ.
Remotesensing 16 03339 g005
Figure 6. L1 SNR latitudinal distribution for PlanetiQ during October 2023 for (a) GPS, (b) Galileo, (c) GLONASS, and (d) BDS.
Remotesensing 16 03339 g006
Figure 7. The normalized L1 SNR frequency distribution sample numbers (%) for GPS (in blue line) signals on (a) KOMPSAT-5 and (b) PAZ during October 2023. The total number of observations from each GPS satellite is mentioned in the figures.
Remotesensing 16 03339 g007
Figure 8. The normalized L1 SNR frequency distribution sample numbers (%) for GPS (blue line), Galileo (red line), GLONASS (green line), and BDS (orange line) signals during October 2023. The total number of observations from each GNSS satellite is mentioned in the figures.
Remotesensing 16 03339 g008
Figure 9. The mean daily SNR ( v / v ) of PlanetiQ in October 2023.
Remotesensing 16 03339 g009
Figure 10. Penetration depth percentage of PlanetiQ, KOMPSAT-5, and PAZ in October 2023.
Remotesensing 16 03339 g010
Figure 11. (a) The cumulative RO percentage with a penetration depth of PlanetiQ (red), KOMPSAT-5 (blue), and PAZ (black), over water in October 2023 and (b) the corresponding numbers of observations from the surface to 13 km altitude for PlanetiQ, KOMPSAT-5, and PAZ over water in October 2023.
Remotesensing 16 03339 g011
Figure 12. The percentage of data below 1 km for PlanetiQ (red), KOMPSAT-5 (blue), and PAZ (black) at different latitude zones over water in October 2023.
Remotesensing 16 03339 g012
Figure 13. (a) Mean fractional bias of refractivity and(b) Mean fractional RMSE of refractivity for KOMPSAT-5, PAZ, and PlanetiQ. (c) Mean fractional bias of refractivity and (d) Mean fractional RMSE of refractivity for PlanetiQ from different GNSS satellites.
Remotesensing 16 03339 g013
Figure 14. Cross-section of the mean fractional bias in refractivity for (a) KOMPSAT-5, (b) PAZ, and (c) PlanetiQ. Cross-sections of mean fractional RMSE of refractivity for (d) KOMPSAT-5, (e) PAZ, and (f) PlanetiQ.
Remotesensing 16 03339 g014
Figure 15. Cross-section of the mean fractional (ad) bias and (eh) RMSE in refractivity for PlanetiQ from different GNSS satellites. Columns from left to right are profiles from GPS, Galileo, BDS, and GLONASS, respectively.
Remotesensing 16 03339 g015
Figure 16. (a) Mean bias of dry temperature and (b) Mean RMSE of dry temperature for KOMPSAT-5, PAZ, and PlanetiQ. (c) Mean bias of dry temperature and (d) Mean RMSE of dry temperature for PlanetiQ from different GNSS satellites.
Remotesensing 16 03339 g016
Figure 17. Cross-section of the mean bias of dry temperature for (a) KOMPSAT-5, (b) PAZ, and (c) PlanetiQ. Cross-sections of mean RMSE of dry temperature for (d) KOMPSAT-5, (e) PAZ, and (f) PlanetiQ.
Remotesensing 16 03339 g017
Figure 18. Cross-section of the mean (ad) bias and (eh) RMSE of dry temperature for PlanetiQ from different GNSS satellites. Columns from left to right are profiles from GPS, Galileo, BDS, and GLONASS, respectively.
Remotesensing 16 03339 g018
Table 1. The average penetration heights (km) in different latitudinal bands over water for different RO missions.
Mission10°S–10°N10°N–30°N10°S–30°S30°N–45°N30°S–45°S45°N–60°N45°S–60°S60°N–90°N60°S–90°S
PlanetiQ0.390.490.400.360.250.300.210.310.16
KOMPSAT-51.891.221.131.090.870.610.720.640.45
PAZ2.071.681.400.700.680.450.360.420.32
Table 2. Mean fractional bias and RMSEs for refractivity profiles from KOMPSAT-5, PAZ, and PlanetiQ.
KOMPSAT-5PAZPlanetiQ
AllGPSGalileoBDSGLONASS
Bias−1.51−1.45−1.48−1.51−1.42−1.50−1.63
RMSE4.274.363.273.353.183.153.38
Disclaimer/Publisher’s Note: The statements, opinions and data contained in all publications are solely those of the individual author(s) and contributor(s) and not of MDPI and/or the editor(s). MDPI and/or the editor(s) disclaim responsibility for any injury to people or property resulting from any ideas, methods, instructions or products referred to in the content.

