Article

Predicting Carbohydrate Concentrations in Avocado and Macadamia Leaves Using Hyperspectral Imaging with Partial Least Squares Regressions and Artificial Neural Networks

1
Centre for Planetary Health and Food Security, School of Environment and Science, Griffith University, Brisbane, QLD 4111, Australia
2
John Grill Institute for Project Leadership, Faculty of Engineering, School of Project Management, The University of Sydney, K06A-21 Ross Street Building, Sydney, NSW 2037, Australia
3
Functional Agrobiodiversity & Agroecology, Department of Crop Sciences, University of Göttingen, 37077 Göttingen, Germany
4
Department of Agriculture and Fisheries, Queensland Government, Toowoomba, QLD 4350, Australia
5
The New Zealand Institute for Plant & Food Research Limited, Private Bag 3230, Waikato Mail Centre, Hamilton 3240, New Zealand
6
School of Biology and Environmental Science, Queensland University of Technology, GPO Box 2434, Brisbane, QLD 4001, Australia
*
Author to whom correspondence should be addressed.
Remote Sens. 2024, 16(18), 3389; https://doi.org/10.3390/rs16183389
Submission received: 12 July 2024 / Revised: 6 September 2024 / Accepted: 9 September 2024 / Published: 12 September 2024

Abstract

:
Carbohydrate levels are important regulators of the growth and yield of tree crops. Current methods for measuring foliar carbohydrate concentrations are time consuming and laborious, but rapid imaging technologies have emerged with the potential to improve the effectiveness of tree nutrient management. Carbohydrate concentrations were predicted using hyperspectral imaging (400–1000 nm) of leaves of the evergreen tree crops, avocado, and macadamia. Models were developed using partial least squares regression (PLSR) and artificial neural network (ANN) algorithms to predict carbohydrate concentrations. PLSR models had R2 values of 0.51, 0.82, 0.86, and 0.85, and ANN models had R2 values of 0.83, 0.83, 0.78, and 0.86, in predicting starch, sucrose, glucose, and fructose concentrations, respectively, in avocado leaves. PLSR models had R2 values of 0.60, 0.64, 0.91, and 0.95, and ANN models had R2 values of 0.67, 0.82, 0.98, and 0.98, in predicting the same concentrations, respectively, in macadamia leaves. ANN only outperformed PLSR when predicting starch concentrations in avocado leaves and sucrose concentrations in macadamia leaves. Performance differences were possibly associated with nonlinear relationships between carbohydrate concentrations and reflectance values. This study demonstrates that PLSR and ANN models perform well in predicting carbohydrate concentrations in evergreen tree-crop leaves.

1. Introduction

Tree crops are an important contributor to food production for the growing human population [1]. Understanding how crop nutrition limits vegetative growth, flowering and fruit development is essential for maintaining tree-crop yields [2,3,4]. Carbohydrate concentrations and carbohydrate forms play critical roles in regulating vegetative growth, fruit set, and yield of tree crops [5,6,7,8,9,10]. Foliar carbohydrate concentrations are manipulated using girdling, pruning or limb removal to increase fruit set and reduce fruit abscission, but monitoring and measuring foliar carbohydrate concentrations is usually laborious and time consuming [10,11,12]. Alternative rapid-assessment technologies are needed to quantify foliar carbohydrate concentrations in real-time, enabling an agile response in on-farm management practices to increase fruit set and yield.
Hyperspectral imaging (HSI) is emerging as a portable assessment technique that can assess tree nutrition in real time [13,14,15]. Hyperspectral imaging provides both spectral and spatial information, giving this technology an advantage over conventional visible-to-near-infrared (NIR) spectroscopy [16]. Reflectance data are extracted from hyperspectral images and correlated with chemical concentrations obtained from samples [17,18,19,20,21,22]. The foliar concentrations of carbohydrates such as starch, sucrose, glucose, and fructose have been predicted successfully using NIR spectroscopy or HSI in a range of forest tree species and recently in microalgae [23,24,25,26]. HSI has also been developed to predict foliar mineral-nutrient concentrations in tree crops such as apple, avocado, citrus, cocoa, and macadamia, as well as in forest leaf litter [13,15,21,27,28]. However, hyperspectral technology has not yet been developed to predict carbohydrate concentrations in horticultural tree crops.
Hyperspectral imaging produces large datasets and so machine learning techniques have been used to extract information and develop predictive models [21,22,29,30,31,32]. Partial least squares regression (PLSR) and artificial neural network (ANN) are two of the most frequently used modelling methods in HSI and NIR spectroscopy studies [27,33,34,35]. However, the performance of PLSR and ANN in predicting a variable may be affected by various factors. For example, both PLSR and ANN perform well when data are noisy. Linear models such as PLSR are usually preferred over non-linear models such as ANN due to their simplicity; however, linear models have limitations when the relationship between reflectance and measured values is non-linear [34]. ANN may out-perform PLSR for prediction accuracy when the data are noisier and the relationship between reflectance and measured values is non-linear [34,36]. Furthermore, datasets sometimes show sub-clustering and so model development may be required for each sub-cluster to improve prediction accuracy [37]. Using sub-clusters reduces the number of samples, which can reduce the prediction accuracy of PLSR and ANN models [38]. The performance of PLSR and ANN in predicting foliar carbohydrate concentrations of tree crops has not been compared between models using sub-clusters and models that use the entire dataset.
Carbohydrates such as starch, sucrose, glucose and fructose are major forms of carbohydrate storage and supply in plants [39]. Here, we used avocado and macadamia leaves to examine the potential for HSI to predict foliar carbohydrate concentrations in evergreen tree crops. We aimed specifically to (1) determine the potential for HSI to predict starch, sucrose, glucose, and fructose concentrations in avocado and macadamia leaves; (2) compare the performance of PLSR and ANN in predicting starch, sucrose, glucose and fructose concentrations; and (3) compare the reliability of PLSR and ANN models developed using sub-clusters with those developed using entire datasets, examining the effects of sample size on model reliability.

2. Materials and Methods

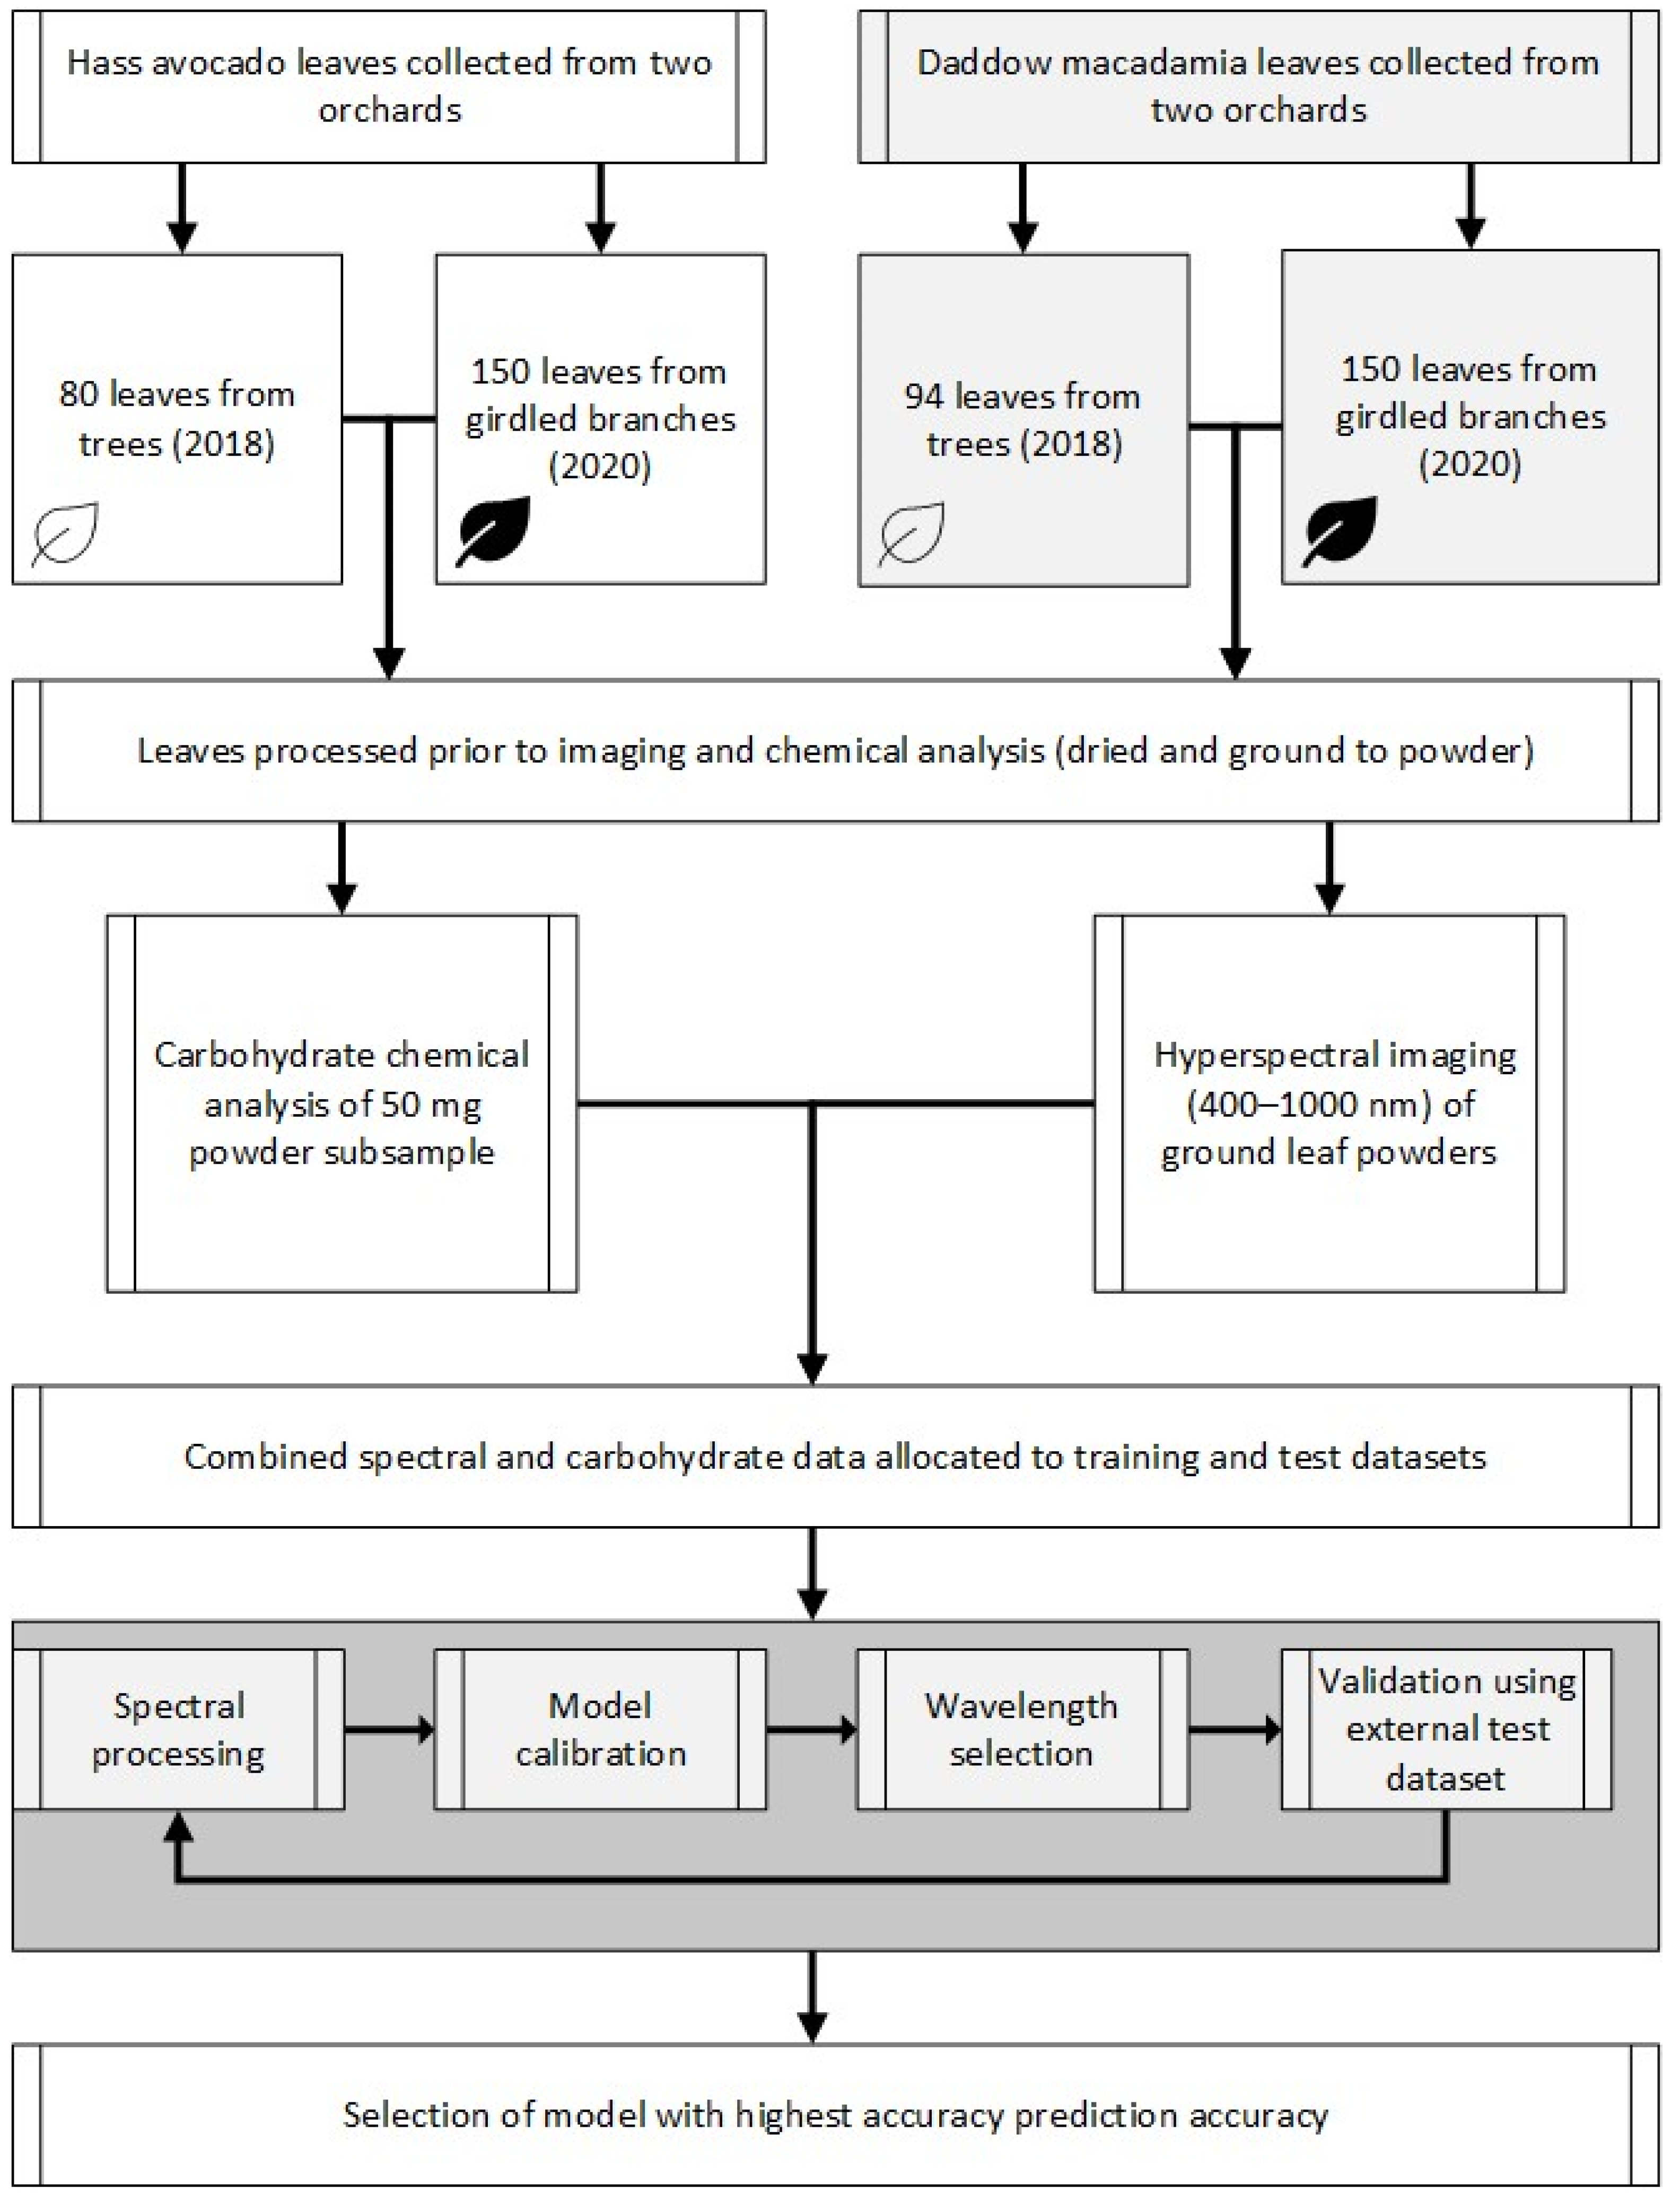
2.1. Sample Collection and Preparation

‘Hass’ avocado leaves were collected from two commercial orchards. Different sampling strategies, such as sample collection from different orchards, different seasons, or different management practices, are used to increase variability in the dataset, which in turn increases model reliability [40,41,42,43,44]. The first orchard was Eastridge (25°13′25″S 152°18′54″E) at Childers, Queensland, Australia. Leaves of ‘Hass’ trees were collected at peak flowering in September 2018 (spring) when the trees were 5 years old and vegetative flushing was minimal. One branch of approximately 1 m length from each of five trees, with the leaves on each branch having a range of maturity levels was collected. The branches, with leaves attached, were immediately placed in water and transported to the laboratory. Then, 10–20 leaves ranging in maturity along each branch were collected, with a total of 80 leaves from the 5 branches. Parts of each leaf were sampled, avoiding the midrib vein. The dried leaf samples were later ground with a mortar and pestle before image collection and carbohydrate analysis.
The second orchard was Simpson Farms (25°08′36″S 152°22′46″E) at Goodwood, Queensland, Australia. Leaves of ‘Hass’ were collected in 2020 when the trees were 4 years old. At this orchard, 1 or 2 branches of approximately 1 m in length from each of 7 trees were girdled, providing 12 branches in total. Branch girdling is commonly used in horticulture to promote starch accumulation in the leaves and so girdling was performed in this study to increase the foliar starch concentrations [45]. Girdling involved removing a 5–6 mm full circumference of bark from the selected branches (Figure 1), which had similar size and moderate crop load [45].
Branches were girdled in January 2020 (summer) and 150 leaves were collected from the branches 5 weeks later. The leaves were collected along the length of the branches to obtain samples representing a wide range of leaf maturity levels and carbohydrate concentrations. The midrib vein was removed immediately after leaf collection, and the leaf samples were placed on dry ice for transport to the laboratory. We stored samples at −70 °C prior to freeze-drying. The dried samples were then ground to homogeneity with a Fritsch Pulverisette 14 variable-speed rotor mill (Fritsch GmbH, Idar-Oberstein, Germany) prior to image collection and carbohydrate analysis. In total, 80 avocado leaf samples were processed from Eastridge in 2018 and 150 avocado leaf samples were processed from Simpson Farms in 2020. Large numbers of samples are used to develop reliable models, but the cost of chemical analysis associated with large numbers of samples may be prohibitive [40]. The models provide robust predictions when data with high variability are collected to train the models, regardless of the sample size used for model development [41].
In addition to avocado leaves, we collected ‘Daddow’ macadamia leaves at peak flowering in September 2018 (spring), when vegetative flushing was minimal, from Alloway orchard (24°56′06″S 152°21′20″E) near Bundaberg, Queensland, Australia. One branch of approximately 1 m length from each of four trees was collected, with the leaves on each branch having a range of maturity levels. The branches, with leaves attached, were immediately placed in water and transported to the laboratory. Then, 17–28 leaves per branch were harvested, with 94 leaves in total. Parts of each leaf were sampled, avoiding the midrib vein, and then freeze dried. The dried samples from each leaf were later ground with a mortar and pestle prior to carbohydrate analysis.
In the same macadamia orchard in January 2020 (summer), one or two branches of approximately 1 m length on each of nine trees were also girdled, using the same girdling method described for avocado (above). In total, 12 macadamia branches were girdled. In total, 150 leaves were collected from the branches, 5 weeks later and samples were processed using the same method used for avocado leaves in 2020 (above). In total, 94 macadamia leaf samples were collected in 2018 and 150 leaf samples were collected in 2020. Sample collection and sample processing is summarized (Figure 2).

2.2. Carbohydrate Analysis

Approximately 50 mg of ground leaf tissue, with mass recorded, was taken from each sample for carbohydrate analysis and the remainder of each sample was used to obtain hyperspectral images. Laboratory analysis of foliar carbohydrate concentrations is typically undertaken using dry ground leaf samples. In addition, dried samples avoid water interference during calibration of chemometric models, allowing for selection of appropriate spectral wavelengths during model development [18]. Therefore, dry ground leaf tissue was used in this study. Then, 5 mL of 80% ethanol was added to the leaf subsample, with the addition of a known quantity of adonitol as an internal standard. The subsample was incubated for 1 h at 60 °C, and was centrifuged at 4200 rpm for 10 min. The supernatant was decanted, the pellet was rinsed with 5 mL of 80% ethanol, and the residual pellet was centrifuged twice more with a further addition of 2.5 mL of 80% ethanol. A final rinse was applied, only for the avocado samples, using a small volume of ice-cold water. A subsample of the combined supernatant from each sample was dried and solubilised in ultrapure water prior to quantification. Sucrose, glucose, and fructose concentrations were quantified against known external standards using a Thermo Scientific DIONEX ICS-5000+ High Pressure Ion Chromatography (HPIC) system (Thermo Fisher Scientific, Waltham, MA, USA) with a CarboPac PA20 column and amino trap guard, using electrochemical detection [39]. Data were extracted using the Thermo Scientific Chromeleon 7.2.10 Chromatography Data System. The leaf starch in the pellet was then quantified using a colorimetric method [10].

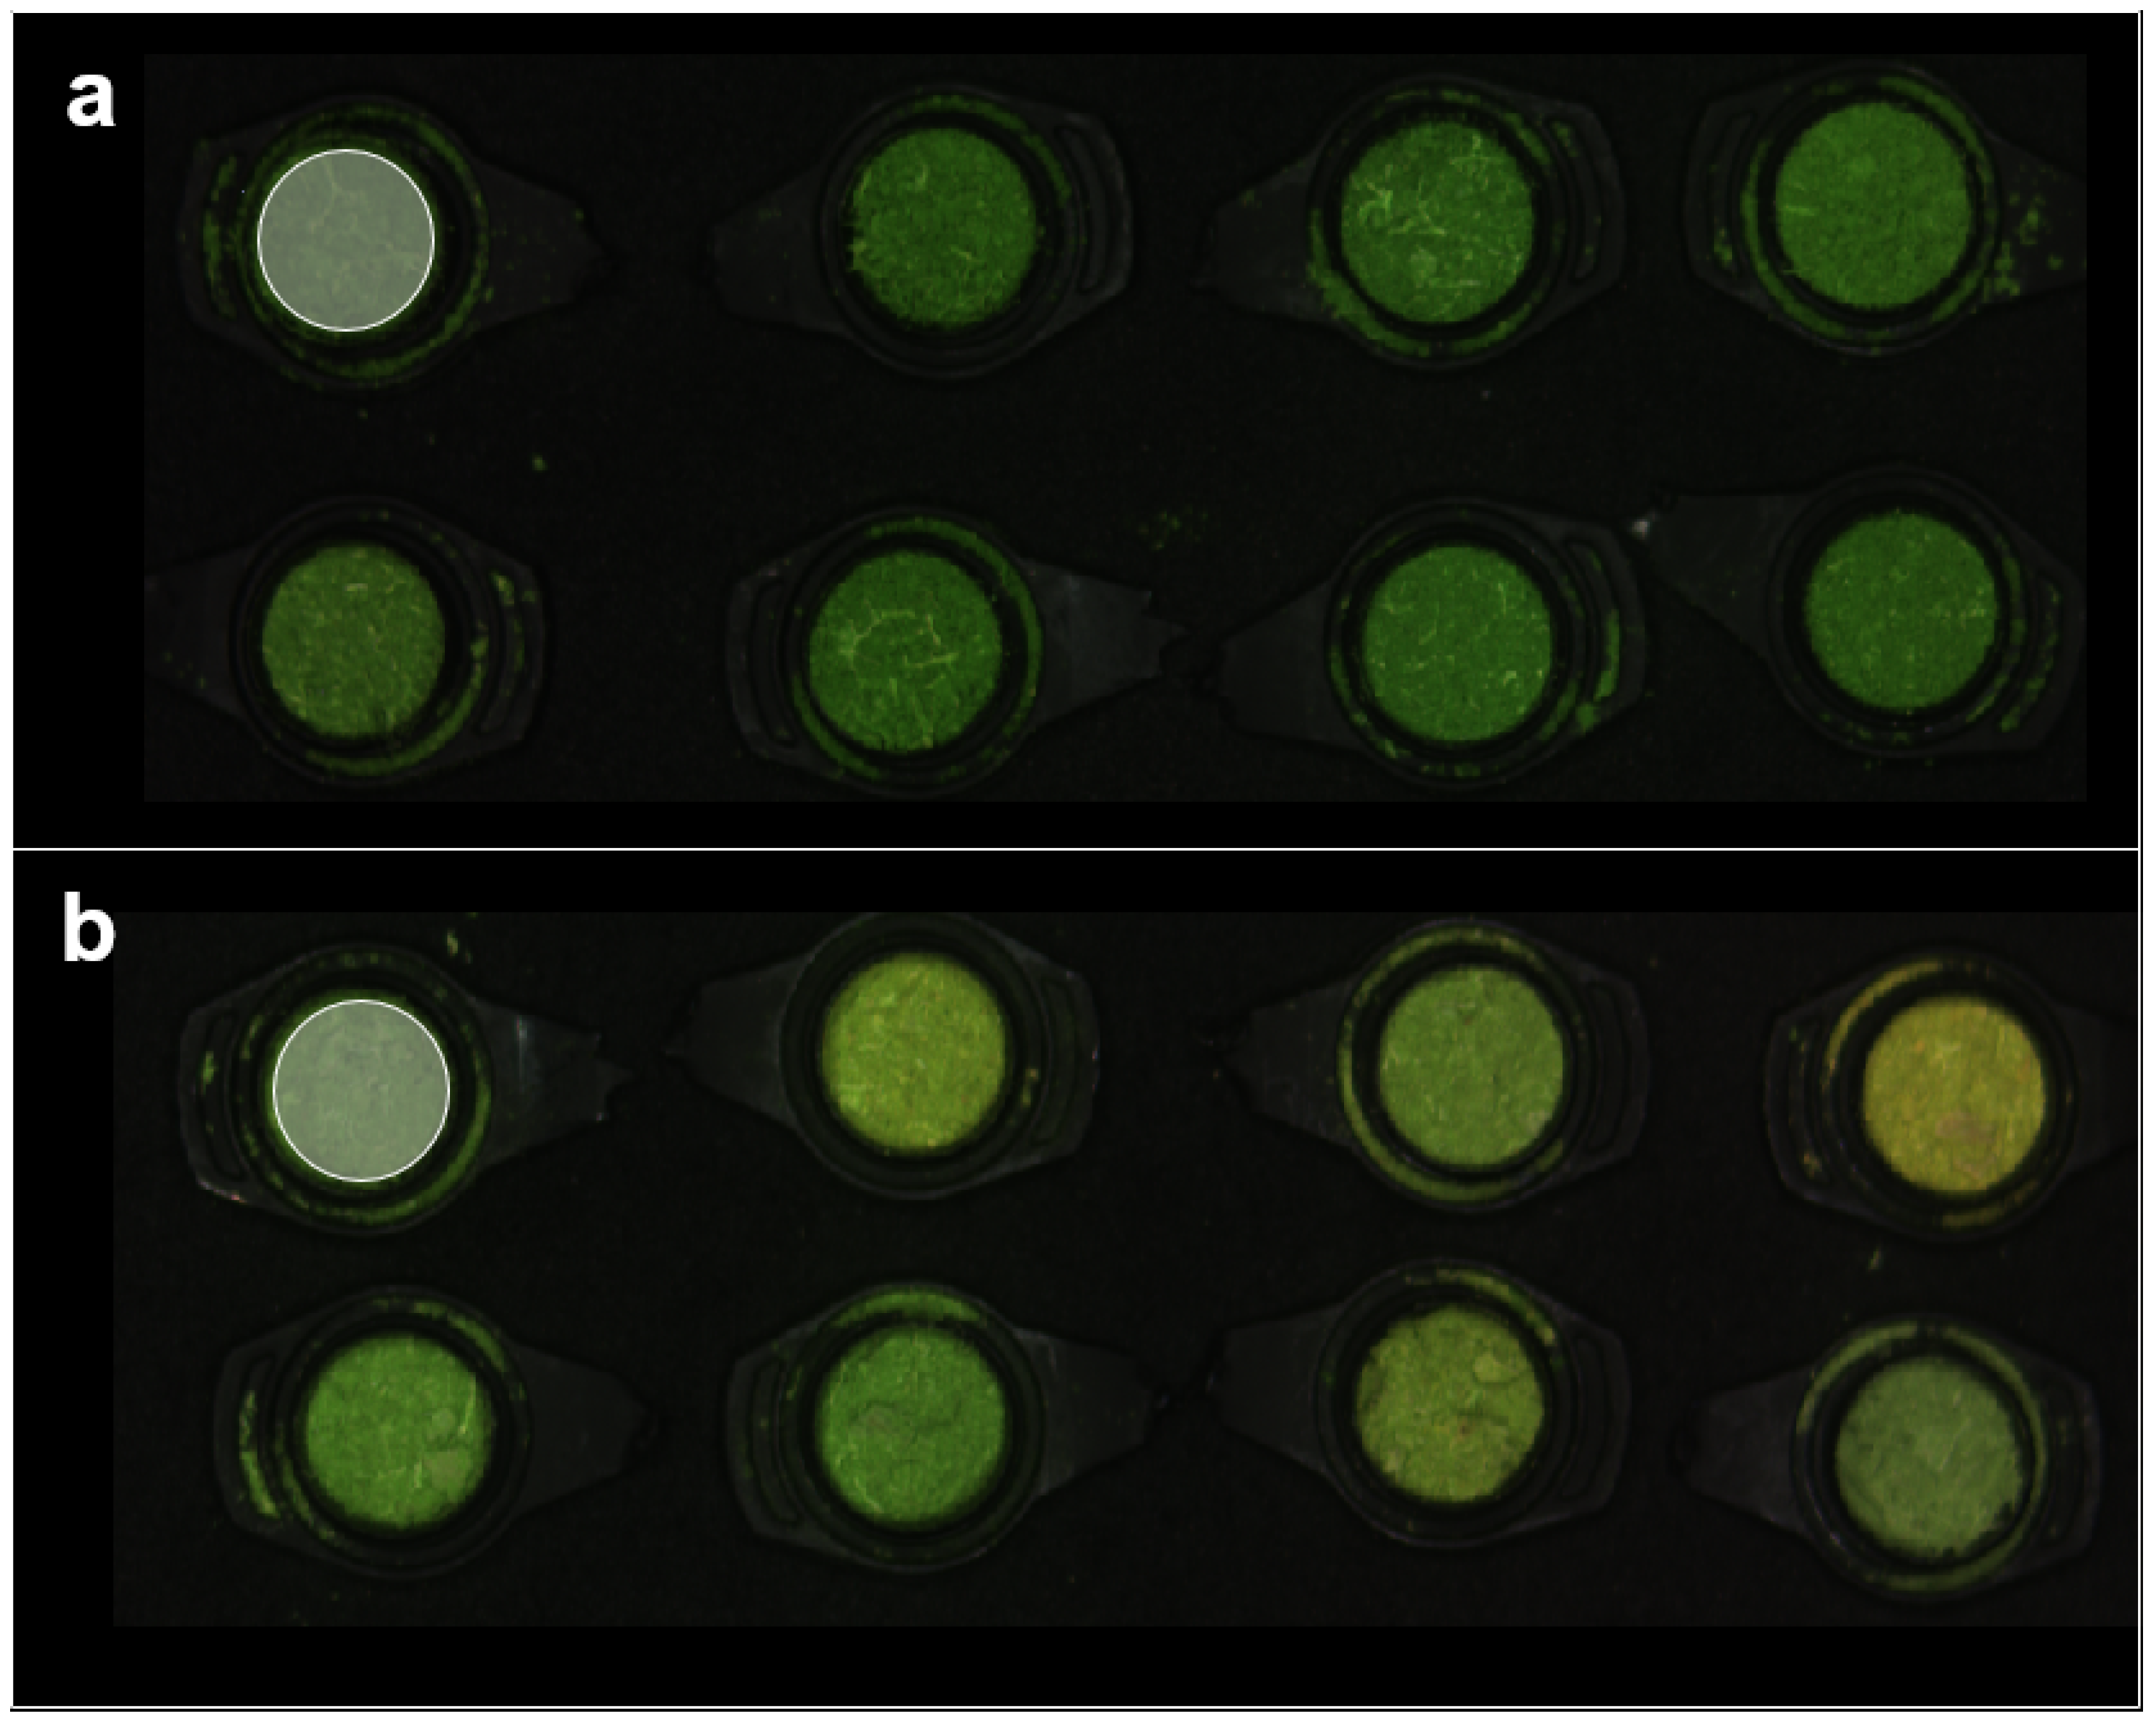
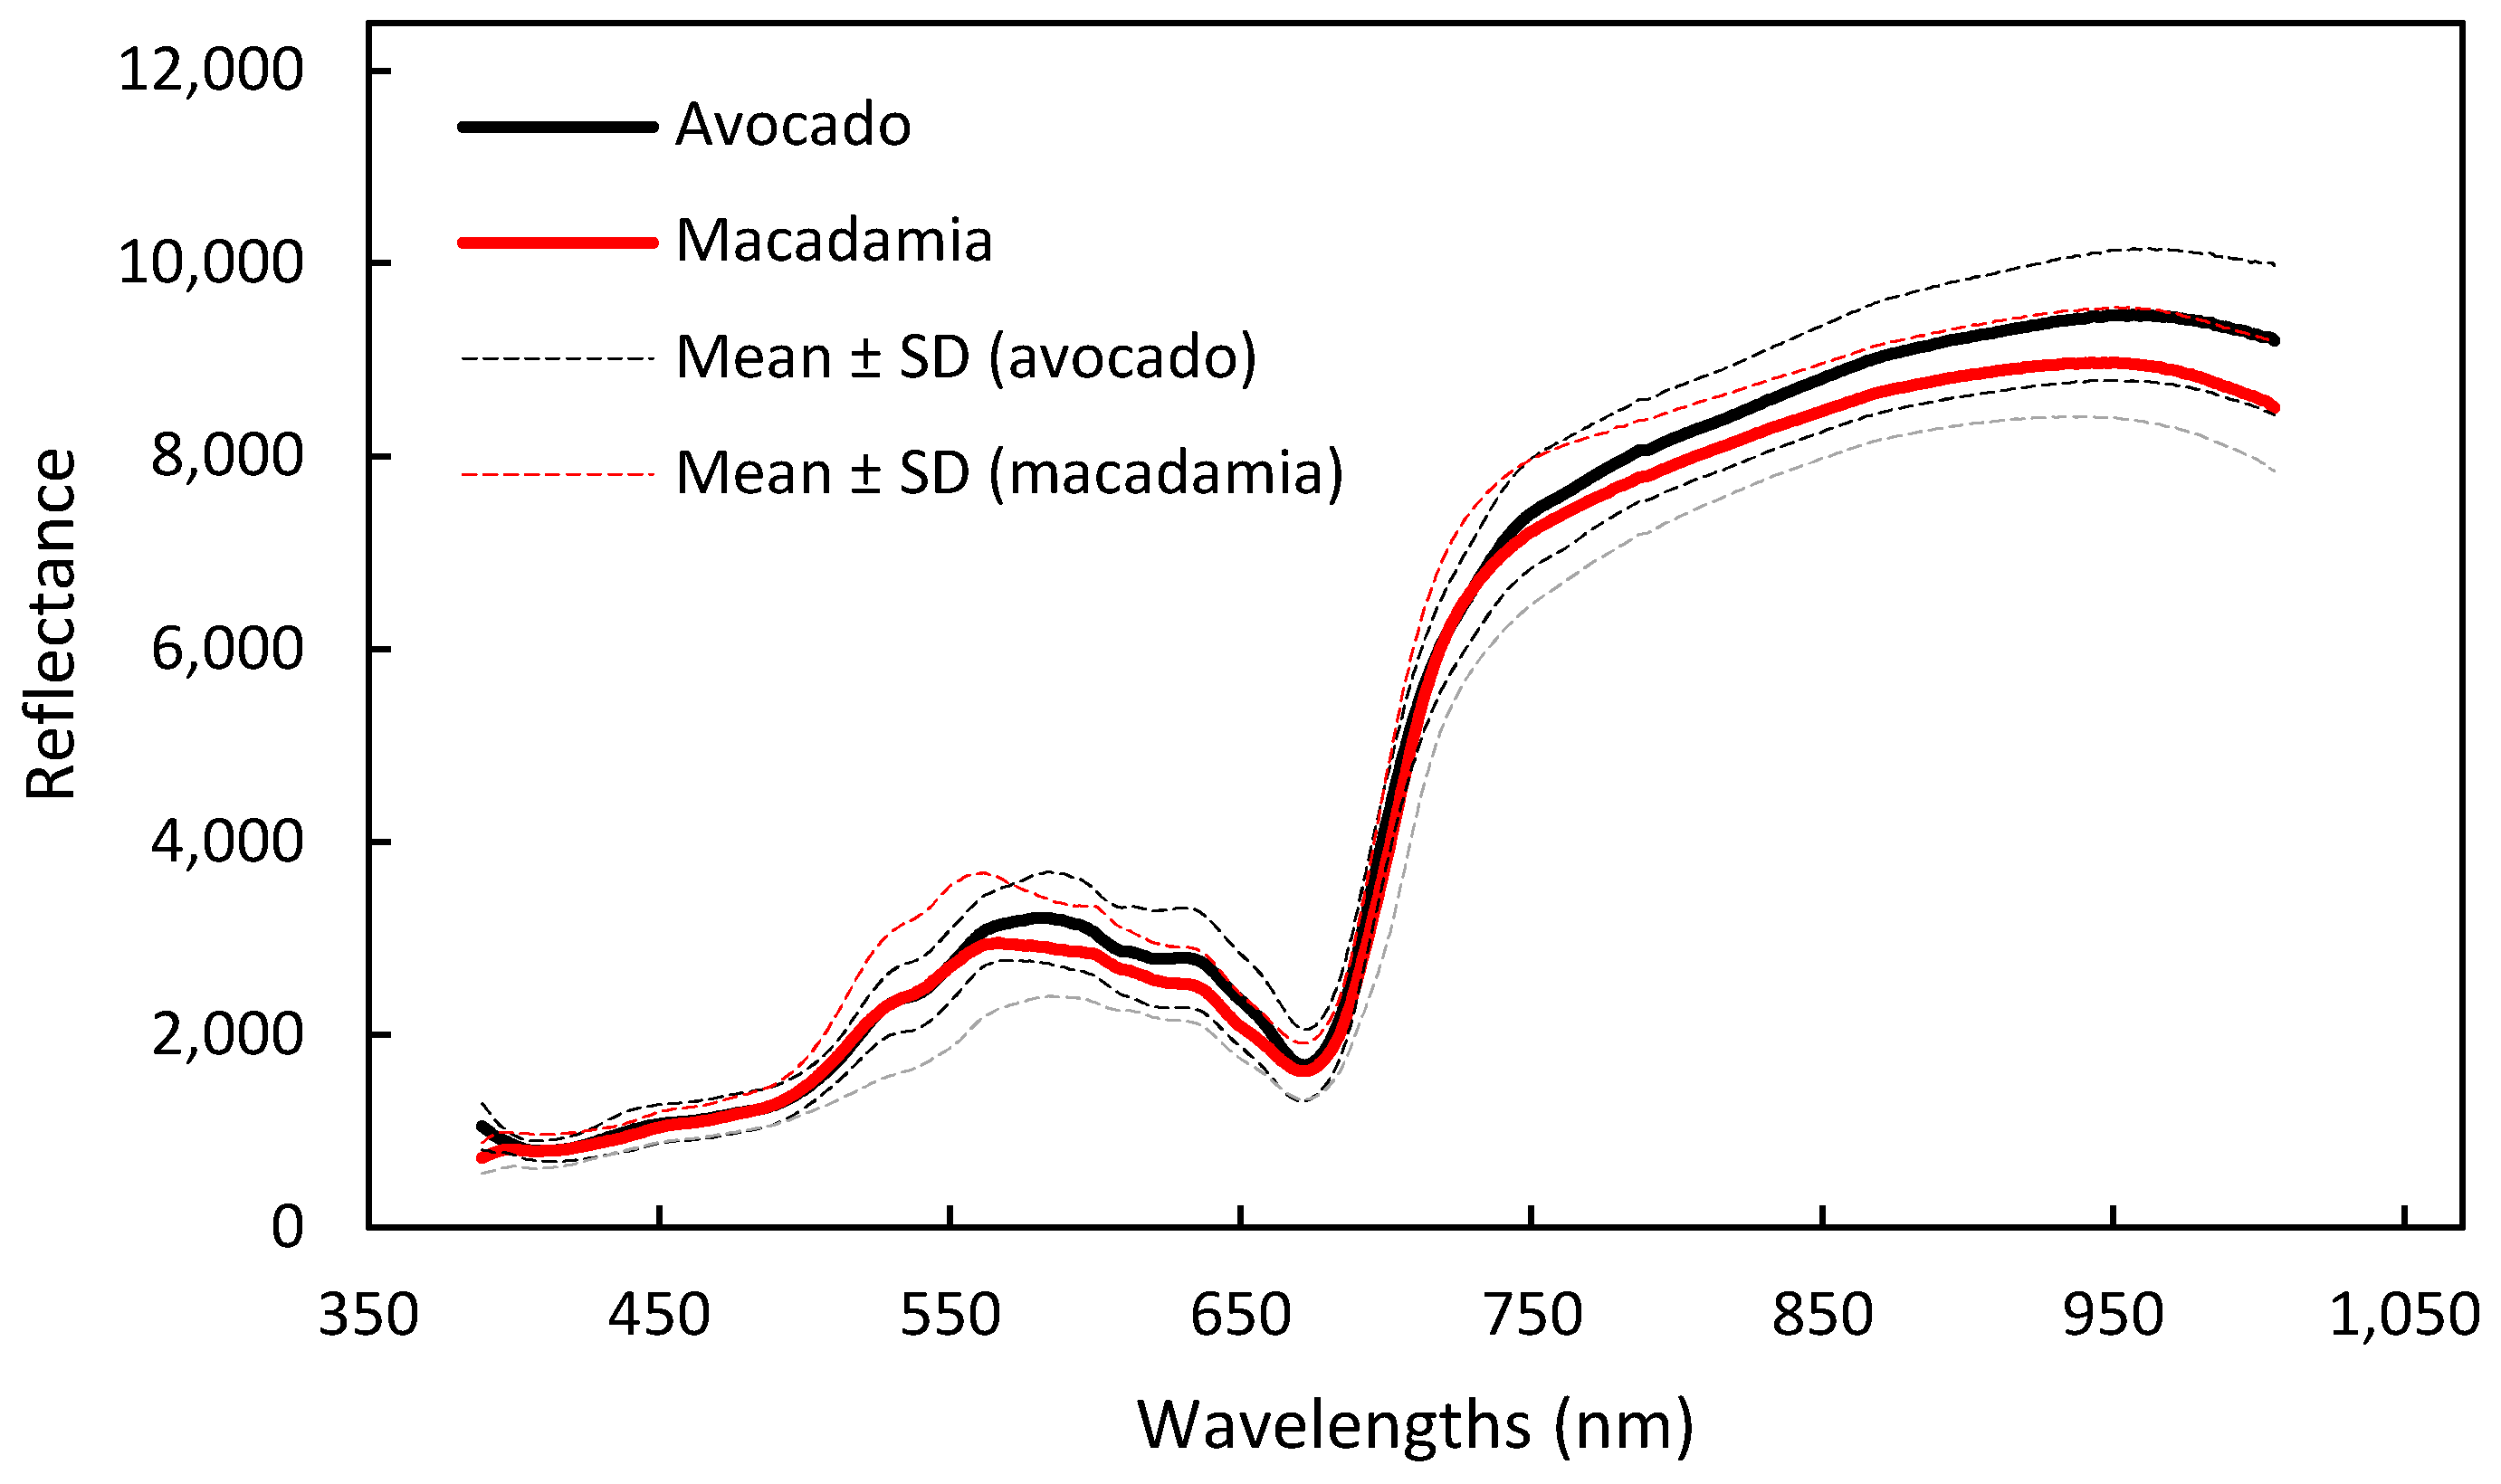
2.3. Hyperspectral Imaging System, Image Acquisition, and Spectral Data Extraction

Images of the 194 avocado and 244 macadamia ground-leaf samples were captured using a 12-bit push-broom hyperspectral camera (Pika XC2, Resonon Inc.; Bozeman, MT, USA). The system collects images that contain 462 wavelengths of spectral data at 1.3 nm resolution in the region between 400 and 1000 nm. The hyperspectral system was calibrated prior to image collection by removing dark current noise (D) and making a white response correction (W) by imaging highly reflective Lambertian material that provides 99% reflectance. Reflectance (R) was then calculated from raw spectral reflectance (I0) using Equation (1):
R = (I0 − D)/(W − D)
Ground leaf samples were placed on a linear translation stage and illuminated using four wide-spectrum quartz-halogen lights. Camera and stage progression were coordinated using SpectrononPro (v2.94) software (Resonon Inc.; Bozeman, MT, USA). Following calibration, images were captured using acquisition settings of 25.52 frames per second and 33.46 ms integration time, with all other settings unchanged from the software defaults. Regions of interest (ROIs) were manually selected using SpectrononPro software by selecting all pixels in the visible surface area of each sample using the native lasso tool, and the mean spectra for each wavelength were extracted and used for further data processing and model development (Figure 3) [46].
The mean reflectance for all pixels selected in a typical ROI is depicted for an avocado and a macadamia leaf sample (Figure 4).

2.4. Model Development, Selection, and Evaluation

Outliers were identified using Hotelling’s T2 test with a 99% confidence level and removed. The remaining data were divided randomly into two independent datasets. One dataset containing 80% of the available data was used for model calibration and one dataset containing 20% of the available data was used as a test dataset for model evaluation [21]. The calibration datasets contained 184 samples for avocado and 196 samples for macadamia, while the test datasets contained 46 samples for avocado and 48 samples for macadamia (Table 1).
PLSR models were developed to correlate the concentrations of starch, sucrose, glucose, and fructose with the spectra of both the avocado and macadamia samples. Full cross-validation (leave-one-out) was used to select the optimal number of latent variables and avoid overfitting [18,47]. Wavelength selection was also applied to remove wavelengths with the lowest β-coefficients [33]. Among the remaining wavelengths, the principal wavelengths were then selected to further simplify and highlight spectral regions that were important for predictions. A wavelength was selected as a principal wavelength when either its β-coefficient was greater than the standard deviation of the model β-coefficients or its variable importance in projection (VIP) was greater than 1.0 [21,48,49]. VIP was calculated using Equation (2):
V I P j = f = 1 F w j f 2 · S S Y f · J S S Y t · F
where VIPj is the importance of the jth wavelength in the model, F is the number of components, Wjf is the loading weight of the corresponding wavelength in the fth component, SSYf is the explained sum of squares of the targeted carbohydrates in the fth component, SSYt is the total sum of squares of the targeted carbohydrate, and J is the total number of wavelengths used in the model. All stages during PLSR model development including outlier detection and removal, wavelength selection, and redevelopment of models were performed using Unscrambler software (Version: 10.5.1; CAMO, Oslo, Norway).
ANN models were also trained with the logistic sigmoid function to predict carbohydrate concentrations using Levenberg–Marquardt backpropagation [50,51]. Determining the optimal number of hidden neurons, prior to developing ANN models, is important to avoid overfitting and underfitting during the training process [52]. We systematically changed the number of hidden layers (between 5 and 10) and selected the number of hidden layers to provide the lowest root mean square error (RMSE) during cross-validation. This number of hidden layers was then used to develop the best-fit ANN model for each corresponding variable. All datasets were examined with cluster analysis to find hidden patterns or sub-clustering. The datasets for sucrose concentration in avocado leaves, and glucose and fructose concentrations in macadamia leaves, had two distinct sub-clusters within the entire dataset. Therefore, two sub-clustered datasets were manually created, sub-clusters 1 and 2, and PLSR and ANN models were developed for each sub-clustered dataset separately. Sub-clusters 1 and 2 for avocado sucrose concentration had 53 and 73 leaf samples, respectively. Sub-clusters 1 and 2 for macadamia glucose concentration had 62 and 160 leaf samples, respectively. Sub-clusters 1 and 2 for macadamia fructose concentration had 72 and 150 leaf samples, respectively.
Random or systematic data partitioning is commonly applied for selecting calibration, validation and test datasets to ensure models are validated with robust datasets (LWT) [41,53]. In the current study, random data partitioning was applied prior to all model development and the models were then cross validated [13,22,33,54,55].
Generally, better model predictions are represented by higher R2 and ratio of prediction to deviation (RPD) values, and lower RMSE values. The R2, RMSE and RPD were calculated using Equations (3)–(5), respectively [21,56]:
R 2 = 1 i = 1 n y i y ^ i 2 i = 1 n y i y ¯ 2
R M S E = i = 1 n y ^ i y ¯ n
R P D = S D t e s t R M S E t e s t
where yi and ŷi are the reference and predicted values, respectively, of the target variables in the ith sample, ȳi is the mean of the reference values, n is the number of samples, SDtest is the standard deviation, and RMSEtest is the root mean square error of the test dataset.
The prediction accuracy of models was assessed using the coefficient of determination of the test dataset (R2test). A model provides the following: (a) screening and approximate quantitative predictions if 0.66 ≤ R2 < 0.82, (b) usable predictions for most applications if 0.82 ≤ R2 < 0.92, (c) usable predictions for most applications including quality assurance if 0.92 ≤ R2 < 0.98, and (d) excellent predictions if R2 ≥ 0.98 [57]. Models were evaluated on the basis that, if 1.5 ≤ RPD < 2.0, then the model is capable of rough estimates for high and low reference values. If 2.0 ≤ RPD < 2.5, the model has moderate predictive ability, if 2.5 ≤ RPD < 3.0, the model has very good predictive ability and if RPD ≥ 3.0, then the model has excellent predictive ability [42,56].

3. Results

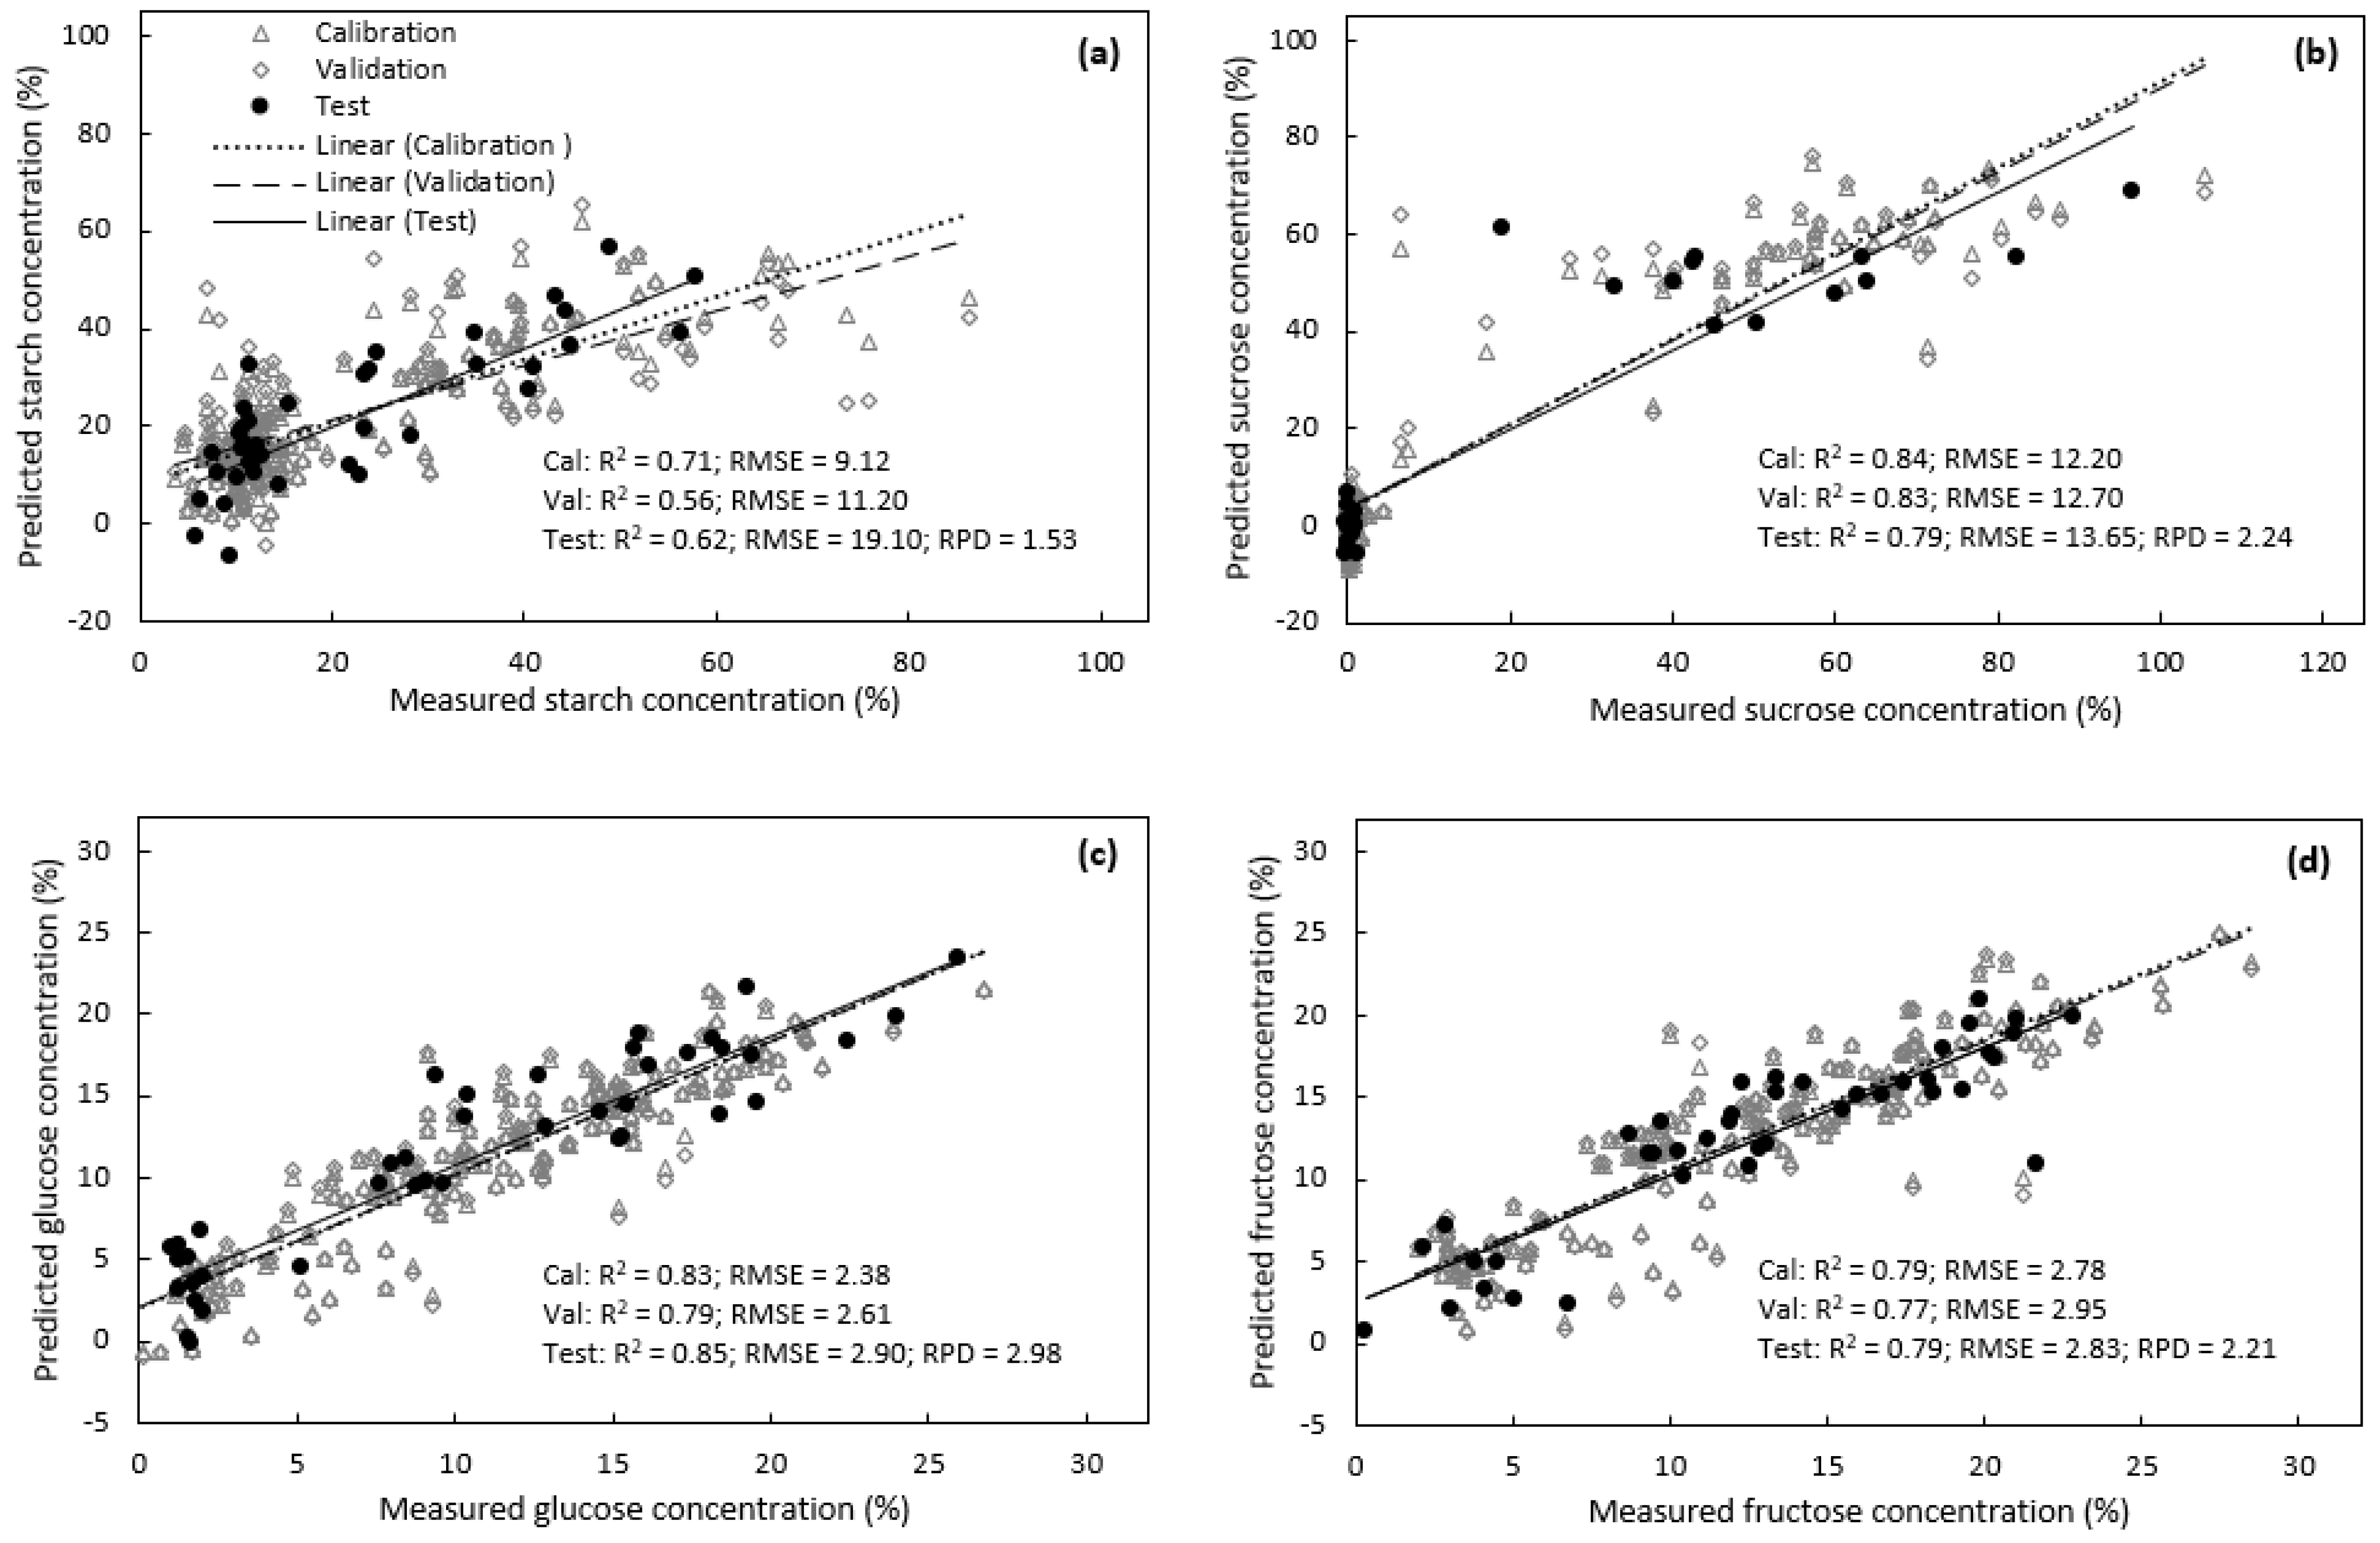
3.1. Prediction of Carbohydrate Concentrations in Avocado Leaves

Starch concentrations were predicted in avocado leaves with R2test = 0.51, RMSEtest = 21.01 and RPD = 1.39 using PLSR (Table 2). However, developing the model using ANN increased the prediction accuracy to R2test = 0.83 and RMSEtest = 15.10 (Table 2). Sucrose concentrations was predicted in avocado leaves with R2test = 0.82, RMSEtest = 12.69 and RPD = 2.41 using PLSR (Table 2). Using ANN provided similar prediction accuracy to PLSR, with R2test = 0.83 and RMSEtest = 14.72. The sucrose concentration data contained two sub-clusters. Both PLSR and ANN provided similar prediction accuracy within each sub-cluster. PLSR and ANN models provided R2test = 0.69 and 0.55 in sub-cluster 1, respectively, and R2test = 0.98 and 0.99 in sub-cluster 2, respectively (Table 2). PLSR using sub-cluster 2 had similar prediction accuracy to using the entire dataset (Table 2).
Glucose and fructose concentrations were successfully predicted in avocado leaves, with R2test values ranging between 0.78 and 0.86, and RMSEtest between 2.46 and 3.66 using both ANN and PLSR models (Table 2). RPDs varied between 0.89 and 2.98 (Table 2). The PLSR model for predicting glucose concentrations provided the highest RPD among all avocado models (Table 2).

3.2. Prediction of Carbohydrate Concentrations in Macadamia Leaves

Starch concentrations were predicted in macadamia leaves with R2test = 0.60, RMSEtest = 2.20 and RPD = 1.57 using PLSR (Table 2). ANN increased the starch prediction accuracy slightly, providing R2test = 0.67 and RPD = 1.17 but provided higher RMSEtest = 3.59 (Table 2). Sucrose concentrations were predicted in macadamia leaves with R2test = 0.64, RMSEtest = 3.89 and RPD = 1.36 using PLSR (Table 2). ANN provided greater prediction accuracy than PLSR, with R2test = 0.82 and RMSEtest = 3.61 (Table 2).
Glucose and fructose concentrations were successfully predicted in macadamia leaves, with R2test values ranging between 0.91 and 0.98, and RMSEtest values ranging between 2.26 and 4.40 for both ANN and PLSR models (Table 2). The RPDs varied between 1.22 and 4.64 (Table 2). The PLSR model provided higher RPD than ANN for predicting both glucose and fructose concentrations (Table 2). Both the glucose and fructose data contained two sub-clusters. PLSR provided better prediction accuracy and model robustness than ANN for each of the sub-clustered datasets of both the glucose and fructose concentrations, i.e., in all four datasets (Table 2). All PLSR models developed using the sub-clustered data provided similar prediction accuracy to their corresponding PLSR models developed using the entire dataset (Table 2).

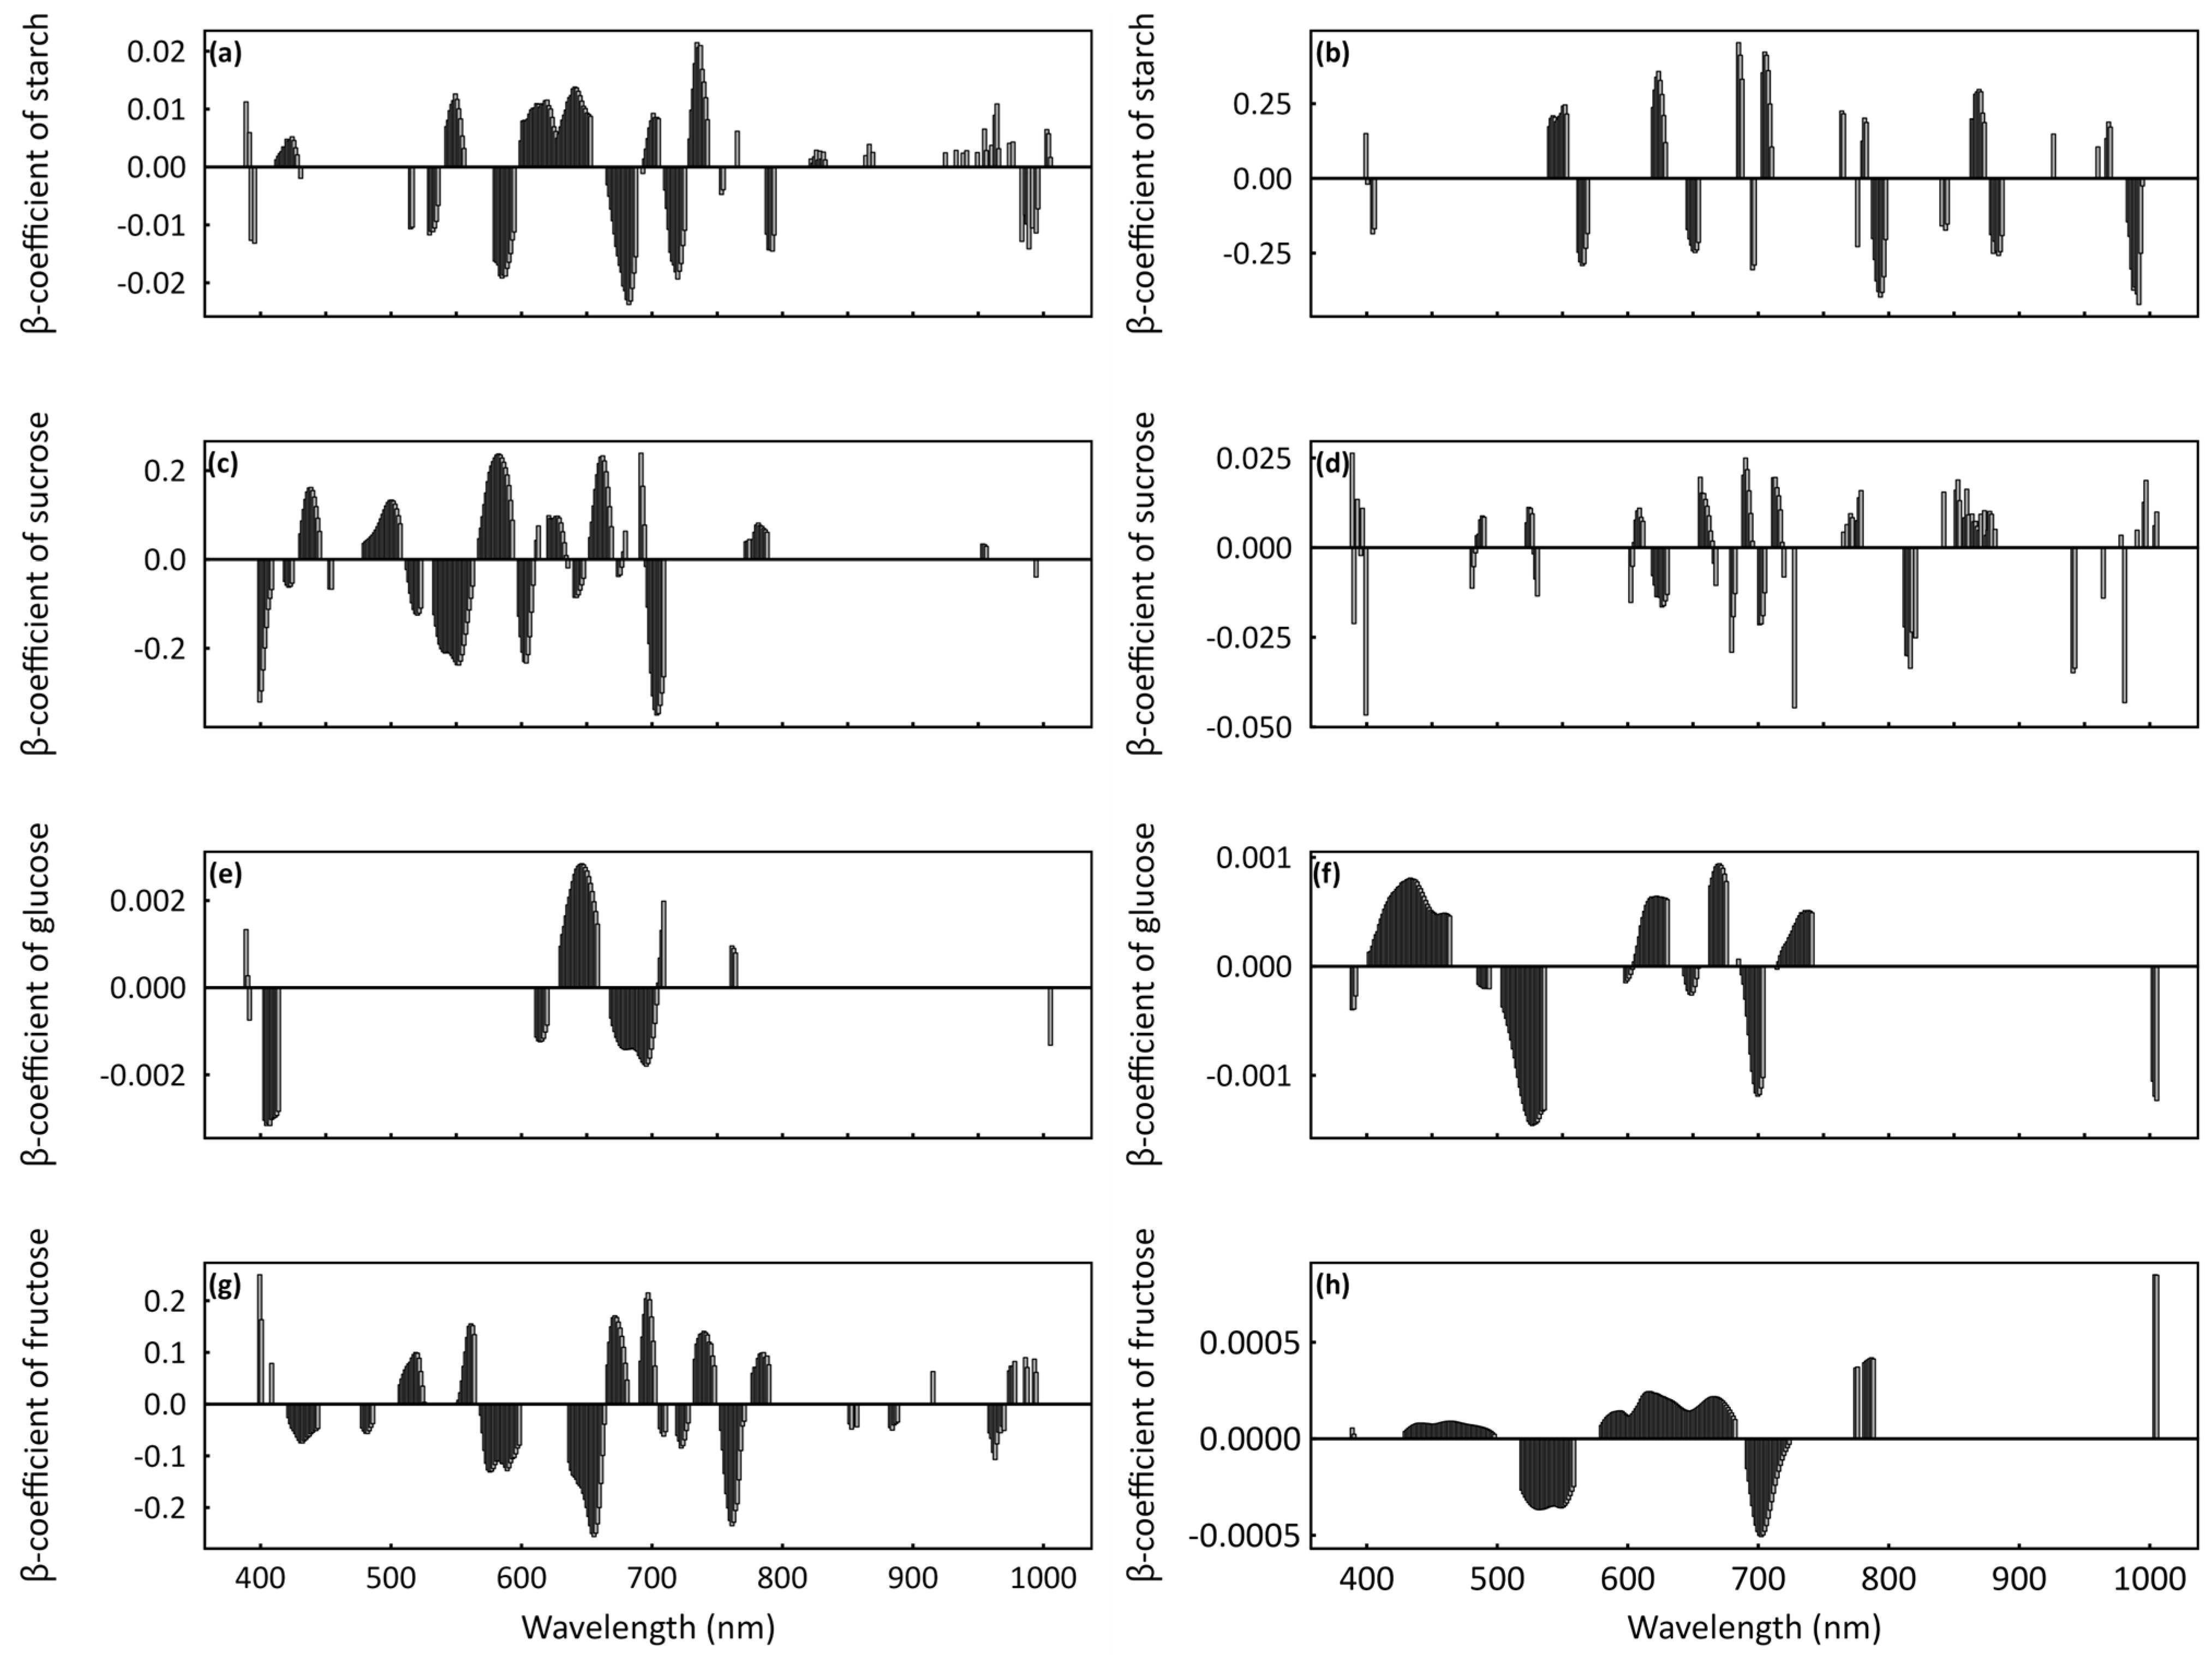
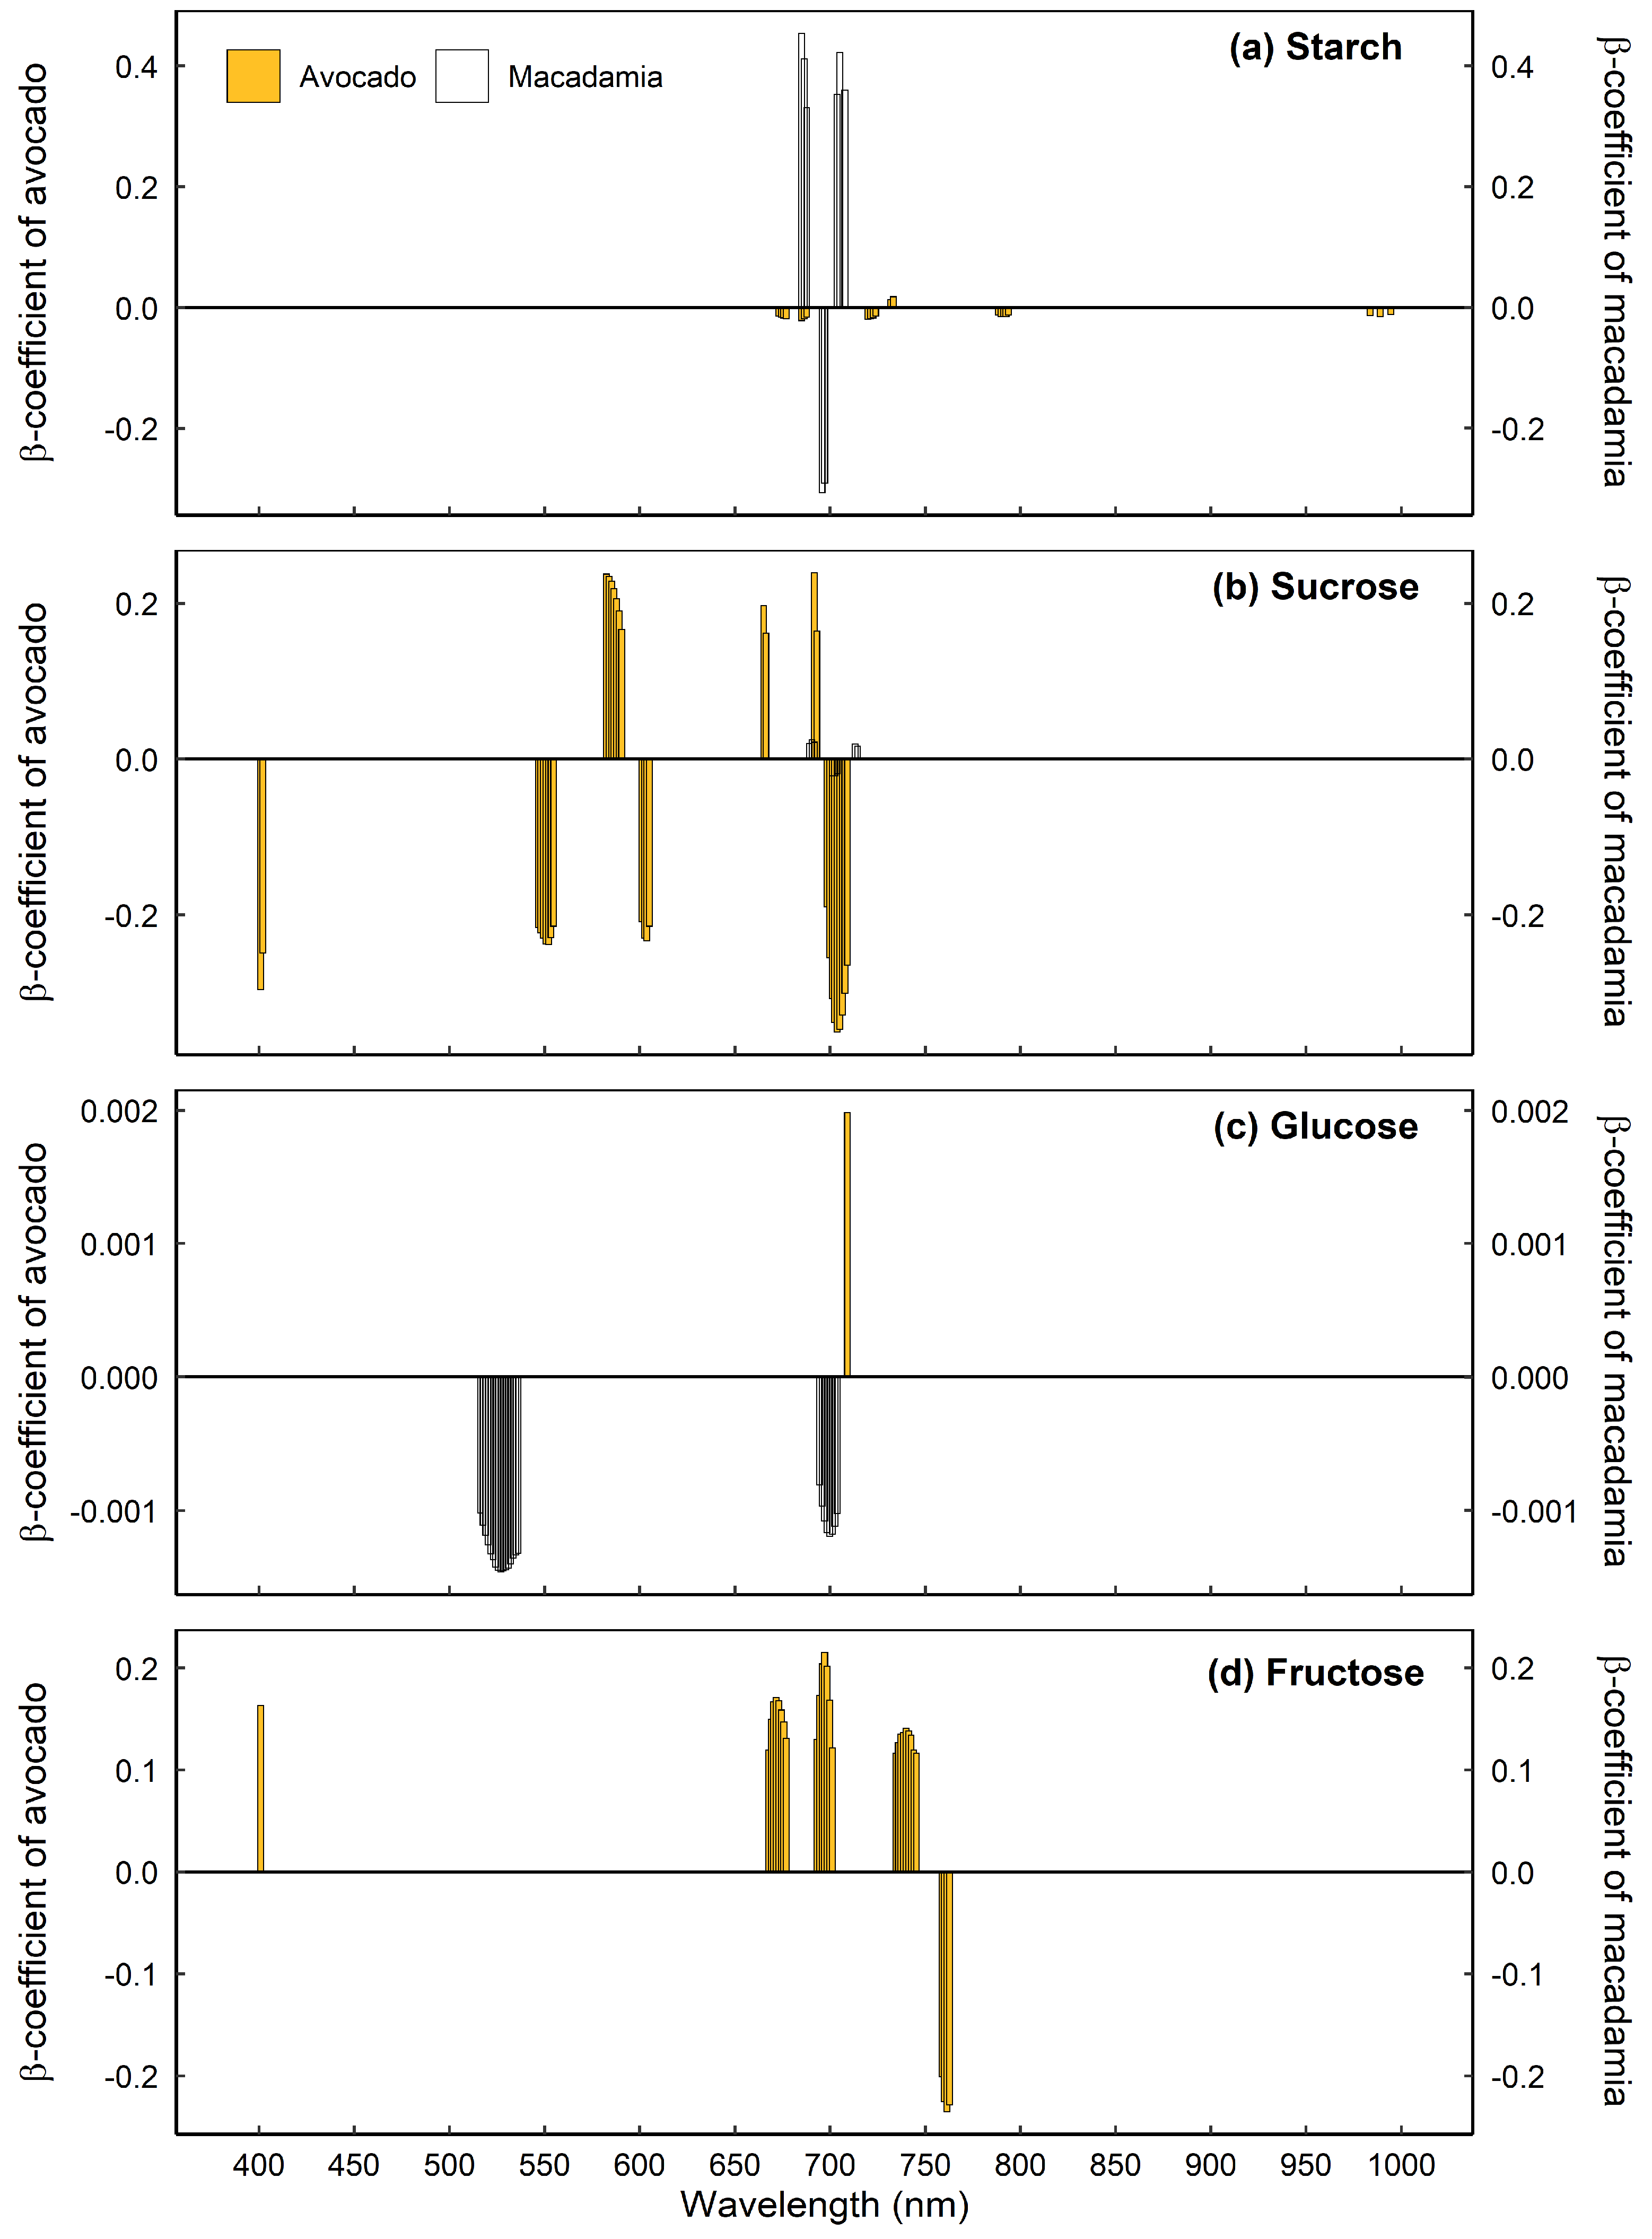
3.3. Important and Overlapping Principal Wavelengths

The models developed after wavelength selection provided similar accuracy in predicting starch, sucrose, glucose, and fructose concentrations than models developed using all 462 wavelengths (Table 2; Figure 5 and Figure 6). The model for predicting glucose concentrations in avocado leaves used 76 wavelengths, which was the fewest wavelengths among all the models (Table 2). The peaks with highest or lowest β-coefficient values were not necessarily overlapping in all regions between the two species (Figure 7). However, we found that some of the principal wavelengths did overlap between species for some of the carbohydrates (Figure 8). For example, the principal wavelengths used to predict starch concentrations were in the 685–708 nm region for both avocado and macadamia leaves (Figure 8). The principal wavelengths for predicting sucrose concentrations had some overlap in the 689–693 nm and 698–714 nm regions between the models used for avocado and macadamia leaves (Figure 8). No overlap of principal wavelengths was found in the models used to predict glucose concentrations (Figure 8). Interestingly, only one principal wavelength, 709 nm, predicted glucose concentrations in avocado leaves (Figure 8). Principal wavelengths in the 693–701 nm regions showed overlap in the models for predicting fructose concentrations between avocado and macadamia leaves (Figure 8).

4. Discussion

Hyperspectral imaging successfully predicted carbohydrate concentrations in avocado and macadamia leaves, with either or both PLSR or ANN models providing high accuracy. The PLSR models developed using sub-clustered data had similar accuracy to the models developed using entire datasets.
The best-fit models provided R2 values between 0.67 and 0.98 for predicting starch, sucrose, glucose, and fructose concentrations. R2 values between 0.67 and 0.98 are useful for providing a range of predictions from screening and approximate quantitative predictions to excellent predictions [57]. Datasets collected across multiple orchards and sampling times are generally considered effective in providing usable variation for modelling [58]. Robust data collection is even more important than the number of samples used to develop the models [41,42]. Small datasets can provide high model robustness when there is high variability within both the internal and external test datasets [41]. The current study had a robust data collection plan to ensure that the datasets contained sufficient variability for model development, including sampling from both girdled and ungirdled branches, sampling two different avocado orchards, and sampling two different years for both avocado and macadamia.
The successful prediction of carbohydrate concentrations could be explained partly by high peaks at wavelength regions that detect C–O, C–H and O–H bonds. The important wavelengths used to predict carbohydrate concentrations were distributed across the electromagnetic spectrum of 400–1000 nm, but specifically at 450–550 nm, 650–750 nm, and 950–1000 nm. Generally, wavelengths in the 800–1000 nm region have been associated with vibrations in the pyranose ring of glucose, and wavelengths in the 980–1150 nm region have been associated with C–O bonds in starch [59]. Calibration models often use the 750 nm, 840 nm, 910 nm, 960 nm, and 985 nm wavelengths, which detect O–H and C–H bond vibrations [60]. Wavelengths of 916 nm and 990 nm have been recommended for predicting carbohydrate concentrations, mainly starch, in potato tubers [26,61]. Absorption at wavelengths between 740 and 750 nm and between 975 and 985 nm is related to different vibrational states of water molecules [62]. Negative correlations between sugar concentration (Brix value) and moisture content can lead to the erroneous selection of moisture bands as the primary variable in a calibration equation, due to the stronger absorption by water compared with that of sugar at these wavelengths [62,63,64]. However, dried samples were used in this study to avoid water interference during calibration of the models, allowing for the selection of appropriate wavelengths.
The PLSR and ANN models had similar accuracy in predicting either starch, sucrose, glucose, or fructose when sample size was not a limiting factor. However, PLSR mostly provided higher accuracy than ANN when sub-clustered data were used to develop the models. Each sub-cluster used only a fraction of the whole dataset [65]. PLSR is commonly used for small datasets, particularly when a linear relationship exists between the reflectance data and the variable values [66]. ANN solves non-linearity issues within a dataset, but a decreasing number of samples reduces the performance of ANN algorithms in predicting a variable [67,68]. The sub-clustered datasets had lower sample numbers than the entire datasets, which may explain why PLSR provided higher accuracy than ANN in predicting carbohydrate concentrations.
There are limitations in using HSI, including relatively high equipment costs, slow imaging speeds compared with RGB or multispectral imagers, and the possibility of collecting noisy data from outdoor settings. Visible to near infrared (VNIR) HSI cameras (400–1000 nm) are the most cost-effective equipment among HSI sensors. Generally, VNIR HSI cameras use silicon (Si) sensors [69]. These are significantly more affordable than indium-gallium-arsenide (InGaAs) sensors, which are used for detecting longer wavelengths. In this study, our models were successfully trained to predict carbohydrate concentrations using a VNIR HSI (Si sensor), which reduces the equipment cost and avoids the strong water-absorption wavelengths, 1930–1940 nm, 1450–1460 nm, and 1375–1385 nm [62]. Identifying the most important wavelengths may help in developing multispectral cameras that are even more affordable than HSI cameras. Reducing the number of wavelengths will also address the issue of slow imaging speed. For example, reducing the number of wavelengths in some of the current models to less than 100 (such as 76 wavelengths for glucose prediction) still provided comparable accuracy to models that used all 462 wavelengths. Future research needs to examine other machine learning techniques that could further shorten the data processing time for real-time applications. HSI also needs to be developed for on-farm applications to overcome environmental factors that affect image collection in outdoor conditions and subsequent model development. Overall, HSI in the VNIR spectral range combined with machine learning techniques was able to predict carbohydrate concentrations in fruit-tree and nut-tree foliage, providing a potential alternative to the traditional wet-chemical methods that are time consuming. The current work has proven the potential of HSI technology in predicting tree nutrition of avocado and macadamia, allowing the research to be expanded to other tree crops.

5. Conclusions

This study has shown that hyperspectral imaging is a useful tool to predict foliar concentrations of carbohydrates in both avocado and macadamia dried tissue. Both PLSR and ANN predicted starch, sucrose, fructose, and glucose concentrations with high accuracy. PLSR provided better prediction accuracy than ANN especially when the number of samples was limited. This study suggests that hyperspectral imaging has the potential to predict carbohydrate concentrations in evergreen tree crops, allowing rapid assessment of tree carbohydrate responses to management practices such as branch girdling or pruning. Rapid assessment of tree carbohydrate responses to orchard operations could lead to improved management of flowering, fruit set, and tree yield.

Author Contributions

Conceptualization, S.H.B., H.M.W. and S.J.T.; methodology, S.H.B., W.K., H.B. and T.P.; validation, S.H.B. and M.B.F.; formal analysis, S.H.B. and M.T.; data curation, S.H.B., I.T., M.B.F. and M.T.; visualization, S.H.B. and M.B.F.; writing—original draft preparation, S.H.B. and M.T.; writing—review and editing, S.H.B., M.T., W.K., I.T., M.B.F., H.J., T.P., J.N., H.M.W. and S.J.T.; supervision, S.H.B., H.B. and S.J.T.; project administration, J.N. and S.J.T.; funding acquisition, S.H.B., H.M.W. and S.J.T. All authors have read and agreed to the published version of the manuscript.

Funding

This research was funded by Project PH16001 of the Hort Frontiers strategic partnership initiative developed by Hort Innovation, with co-investment from Griffith University, Plant and Food Research Limited, University of the Sunshine Coast, and contributions from the Australian Government.

Data Availability Statement

The original contributions presented in the study are included in the article, further inquiries can be directed to the corresponding author. Data will be made available on request with the permission of Hort Innovation.

Acknowledgments

We thank Eastridge Avocado Orchard, Simpson Farms and Alloway Macadamia for providing access to their orchards.

Conflicts of Interest

The authors declare no conflicts of interest.

References

  1. FAO. World Food and Agriculture–Statistical Yearbook 2022; FAO: Rome, Italy, 2022. [Google Scholar]
  2. Bai, Q.; Shen, Y.; Huang, Y. Advances in mineral nutrition transport and signal transduction in Rosaceae fruit quality and postharvest storage. Front. Plant Sci. 2021, 12, 620018. [Google Scholar] [CrossRef] [PubMed]
  3. Huett, D.; Dirou, J. An evaluation of the rationale for fertiliser management of tropical fruit crops. Aust. J. Exp. Agric. 2000, 40, 1137–1143. [Google Scholar] [CrossRef]
  4. Matsuoka, K. Methods for nutrient diagnosis of fruit trees early in the growing season by using simultaneous multi-element analysis. Hortic. J. 2020, 89, 197–207. [Google Scholar] [CrossRef]
  5. Boldingh, H.; Alcaraz, M.; Thorp, T.; Minchin, P.; Gould, N.; Hormaza, J. Carbohydrate and boron content of styles of ‘Hass’ avocado (Persea americana Mill.) flowers at anthesis can affect final fruit set. Sci. Hortic. 2016, 198, 125–131. [Google Scholar] [CrossRef]
  6. Herbert, S.W.; Walton, D.A.; Wallace, H.M. The influence of pollen-parent and carbohydrate availability on macadamia yield and nut size. Sci. Hortic. 2019, 251, 241–246. [Google Scholar] [CrossRef]
  7. Huett, D. Macadamia physiology review: A canopy light response study and literature review. Aust. J. Agric. Res. 2004, 55, 609–624. [Google Scholar] [CrossRef]
  8. McFadyen, L.M.; Robertson, D.; Sedgley, M.; Kristiansen, P.; Olesen, T. Post-pruning shoot growth increases fruit abscission and reduces stem carbohydrates and yield in macadamia. Ann. Bot. 2011, 107, 993–1001. [Google Scholar] [CrossRef]
  9. Olesen, T.; Robertson, D.; Muldoon, S.; Meyer, R. The role of carbohydrate reserves in evergreen tree development, with particular reference to macadamia. Sci. Hortic. 2008, 117, 73–77. [Google Scholar] [CrossRef]
  10. Smith, G.; Clark, C.; Boldingh, H. Seasonal accumulation of starch by components of the kiwifruit vine. Ann. Bot. 1992, 70, 19–25. [Google Scholar] [CrossRef]
  11. Rivas, F.; Gravina, A.; Agustí, M. Girdling effects on fruit set and quantum yield efficiency of PSII in two Citrus cultivars. Tree Physiol. 2007, 27, 527–535. [Google Scholar] [CrossRef]
  12. Boldingh, H.; Pereira, T.; Shepherd, S.; Hewitt, K.; Cooney, J.; Rowan, D.; Hedderley, D.; Jensen, D.; Trower, T.; Richardson, A. Diurnal fluctuations of metabolites in leaves of ‘Zesy002’ kiwifruit. Acta Hortic. 2022, 1322, 155–162. [Google Scholar] [CrossRef]
  13. Hapuarachchi, N.S.; Trueman, S.J.; Kämper, W.; Farrar, M.B.; Wallace, H.M.; Nichols, J.; Bai, S.H. Hyperspectral imaging of adaxial and abaxial leaf surfaces for rapid assessment of foliar nutrient concentrations in Hass avocado. Remote Sens. 2023, 15, 3100. [Google Scholar] [CrossRef]
  14. Watt, M.S.; Buddenbaum, H.; Leonardo, E.M.C.; Estarija, H.J.C.; Bown, H.E.; Gomez-Gallego, M.; Hartley, R.; Massam, P.; Wright, L.; Zarco-Tejada, P.J. Using hyperspectral plant traits linked to photosynthetic efficiency to assess N and P partition. ISPRS J. Photogramm. Remote Sens. 2020, 169, 406–420. [Google Scholar] [CrossRef]
  15. Ye, X.; Abe, S.; Zhang, S. Estimation and mapping of nitrogen content in apple trees at leaf and canopy levels using hyperspectral imaging. Precis. Agric. 2020, 21, 198–225. [Google Scholar] [CrossRef]
  16. Manley, M. Near-infrared spectroscopy and hyperspectral imaging: Non-destructive analysis of biological materials. Chem. Soc. Rev. 2014, 43, 8200–8214. [Google Scholar] [CrossRef]
  17. Farrar, M.B.; Wallace, H.M.; Tahmasbian, I.; Yule, C.M.; Dunn, P.K.; Hosseini Bai, S. Rapid assessment of soil carbon and nutrients following application of organic amendments. Catena 2023, 223, 106928. [Google Scholar] [CrossRef]
  18. Malmir, M.; Tahmasbian, I.; Xu, Z.; Farrar, M.B.; Bai, S.H. Prediction of macronutrients in plant leaves using chemometric analysis and wavelength selection. J. Soils Sediments 2020, 20, 249–259. [Google Scholar] [CrossRef]
  19. Sun, D.-W. Computer Vision Technology for Food Quality Evaluation; Academic Press: Cambridge, MA, USA, 2016. [Google Scholar]
  20. Tahmasbian, I.; Hosseini Bai, S.; Wang, Y.; Boyd, S.; Zhou, J.; Esmaeilani, R.; Xu, Z. Using laboratory-based hyperspectral imaging method to determine carbon functional group distributions in decomposing forest litterfall. Catena 2018, 167, 18–27. [Google Scholar] [CrossRef]
  21. Tahmasbian, I.; Xu, Z.; Boyd, S.; Zhou, J.; Esmaeilani, R.; Che, R.; Hosseini Bai, S. Laboratory-based hyperspectral image analysis for predicting soil carbon, nitrogen and their isotopic compositions. Geoderma 2018, 330, 254–263. [Google Scholar] [CrossRef]
  22. Farrar, M.B.; Omidvar, R.; Nichols, J.; Pelliccia, D.; Lateef Al-Khafaji, S.; Tahmasbian, I.; Hapuarachchi, N.; Hosseini Bai, S. Hyperspectral imaging predicts macadamia nut-in-shell and kernel moisture using machine vision and learning tools. Comput. Electron. Agric. 2024, 224, 109209. [Google Scholar] [CrossRef]
  23. Chu, B.; Li, C.; Wang, S.; Jin, W.; Li, X.; He, G.; Xiao, G. Nondestructive determination and visualization of protein and carbohydrate concentration of Chlorella pyrenoidosa in situ using hyperspectral imaging technique. Comput. Electron. Agric. 2023, 206, 107684. [Google Scholar] [CrossRef]
  24. Ely, K.S.; Burnett, A.C.; Lieberman-Cribbin, W.; Serbin, S.P.; Rogers, A. Spectroscopy can predict key leaf traits associated with source–sink balance and carbon–nitrogen status. J. Exp. Bot. 2019, 70, 1789–1799. [Google Scholar] [CrossRef] [PubMed]
  25. Ramirez, J.A.; Posada, J.M.; Handa, I.T.; Hoch, G.; Vohland, M.; Messier, C.; Reu, B. Near-infrared spectroscopy (NIRS) predicts non-structural carbohydrate concentrations in different tissue types of a broad range of tree species. Methods Ecol. Evol. 2015, 6, 1018–1025. [Google Scholar] [CrossRef]
  26. Wang, F.; Wang, C.; Song, S.; Xie, S.; Kang, F. Study on starch content detection and visualization of potato based on hyperspectral imaging. Food Sci. Nutr. 2021, 9, 4420–4430. [Google Scholar] [CrossRef] [PubMed]
  27. De Silva, A.L.; Trueman, S.J.; Kämper, W.; Wallace, H.M.; Nichols, J.; Hosseini Bai, S. Hyperspectral Imaging of Adaxial and Abaxial Leaf Surfaces as a Predictor of Macadamia Crop Nutrition. Plants 2023, 12, 558. [Google Scholar] [CrossRef]
  28. Liu, Y.; Lyu, Q.; He, S.; Yi, S.; Liu, X.; Xie, R.; Zheng, Y.; Deng, L. Prediction of nitrogen and phosphorus contents in citrus leaves based on hyperspectral imaging. Int. J. Agric. Biol. Eng. 2015, 8, 80–88. [Google Scholar]
  29. Farrar, M.B.; Wallace, H.M.; Brooks, P.; Yule, C.M.; Tahmasbian, I.; Dunn, P.K.; Hosseini Bai, S. A performance evaluation of Vis/NIR hyperspectral imaging to predict curcumin concentration in fresh turmeric rhizomes. Remote Sens. 2021, 13, 1807. [Google Scholar] [CrossRef]
  30. Han, Y.; Liu, Z.; Khoshelham, K.; Bai, S.H. Quality estimation of nuts using deep learning classification of hyperspectral imagery. Comput. Electron. Agric. 2021, 180, 105868. [Google Scholar] [CrossRef]
  31. Tahmasbian, I.; Morgan, N.K.; Hosseini Bai, S.; Dunlop, M.W.; Moss, A.F. Comparison of Hyperspectral Imaging and Near-Infrared Spectroscopy to Determine Nitrogen and Carbon Concentrations in Wheat. Remote Sens. 2021, 13, 1128. [Google Scholar] [CrossRef]
  32. Tahmasbian, I.; Wallace, H.M.; Gama, T.; Bai, S.H. An automated non-destructive prediction of peroxide value and free fatty acid level in mixed nut samples. LWT 2021, 143, 110893. [Google Scholar] [CrossRef]
  33. Kämper, W.; Trueman, S.J.; Tahmasbian, I.; Bai, S.H. Rapid determination of nutrient concentrations in Hass avocado fruit by Vis/NIR hyperspectral imaging of flesh or skin. Remote Sens. 2020, 12, 3409. [Google Scholar] [CrossRef]
  34. Mayr, S.; Beć, K.B.; Grabska, J.; Wiedemair, V.; Pürgy, V.; Popp, M.A.; Bonn, G.K.; Huck, C.W. Challenging handheld NIR spectrometers with moisture analysis in plant matrices: Performance of PLSR vs. GPR vs. ANN modelling. Spectrochim. Acta Part A Mol. Biomol. Spectrosc. 2021, 249, 119342. [Google Scholar] [CrossRef] [PubMed]
  35. Han, Y.; Bai, S.H.; Trueman, S.J.; Khoshelham, K.; Kämper, W. Predicting the ripening time of ‘Hass’ and ‘Shepard’avocado fruit by hyperspectral imaging. Precis. Agric. 2023, 24, 1889–1905. [Google Scholar] [CrossRef]
  36. Larose, D.T.; Larose, C.D. Discovering Knowledge in Data: An Introduction to Data Mining, 2nd ed.; John Wiley & Sons: Hoboken, NJ, USA, 2014. [Google Scholar]
  37. Araújo, S.R.; Wetterlind, J.; Demattê, J.A.M.; Stenberg, B. Improving the prediction performance of a large tropical vis-NIR spectroscopic soil library from Brazil by clustering into smaller subsets or use of data mining calibration techniques. Eur. J. Soil Sci. 2014, 65, 718–729. [Google Scholar] [CrossRef]
  38. Lucà, F.; Conforti, M.; Castrignanò, A.; Matteucci, G.; Buttafuoco, G. Effect of calibration set size on prediction at local scale of soil carbon by Vis-NIR spectroscopy. Geoderma 2017, 288, 175–183. [Google Scholar] [CrossRef]
  39. Boldingh, H.; Richardson, A.; Minchin, P.; MacRae, E. Planteose is a major sugar translocated in Actinidia arguta ‘Hortgem Tahi’. Sci. Hortic. 2015, 193, 261–268. [Google Scholar] [CrossRef]
  40. Rajput, D.; Wang, W.-J.; Chen, C.-C. Evaluation of a decided sample size in machine learning applications. BMC Bioinform. 2023, 24, 48. [Google Scholar] [CrossRef]
  41. Gama, T.; Farrar, M.B.; Tootoonchy, M.; Wallace, H.M.; Trueman, S.J.; Tahmasbian, I.; Bai, S.H. Hyperspectral imaging predicts free fatty acid levels, peroxide values, and linoleic acid and oleic acid concentrations in tree nut kernels. LWT 2024, 199, 116068. [Google Scholar] [CrossRef]
  42. Nicolaï, B.M.; Beullens, K.; Bobelyn, E.; Peirs, A.; Saeys, W.; Theron, K.I.; Lammertyn, J. Nondestructive measurement of fruit and vegetable quality by means of NIR spectroscopy: A review. Postharvest Biol. Technol. 2007, 46, 99–118. [Google Scholar] [CrossRef]
  43. Anderson, N.; Walsh, K.; Subedi, P.; Hayes, C. Achieving robustness across season, location and cultivar for a NIRS model for intact mango fruit dry matter content. Postharvest Biol. Technol. 2020, 168, 111202. [Google Scholar] [CrossRef]
  44. Hapuarachchi, N.S.; Kämper, W.; Wallace, H.M.; Hosseini Bai, S.; Ogbourne, S.M.; Nichols, J.; Trueman, S.J. Boron effects on fruit set, yield, quality and paternity of Hass avocado. Agronomy 2022, 12, 1479. [Google Scholar] [CrossRef]
  45. Davie, S.J.; Stassen, P.J.C.; van der Walt, M.; Snijder, B. Girdling Avocado Trees for Improved Production. In South African Avocado Growers’ Association Yearbook 1995; Institute for Tropical and Subtropical Crops: Nelspruit, South Africa, 1995; pp. 51–53. [Google Scholar]
  46. Bai, S.H.; Tahmasbian, I.; Zhou, J.; Nevenimo, T.; Hannet, G.; Walton, D.; Randall, B.; Gama, T.; Wallace, H.M. A non-destructive determination of peroxide values, total nitrogen and mineral nutrients in an edible tree nut using hyperspectral imaging. Comput. Electron. Agric. 2018, 151, 492–500. [Google Scholar] [CrossRef]
  47. Malmir, M.; Tahmasbian, I.; Xu, Z.; Farrar, M.B.; Bai, S.H. Prediction of soil macro- and micro-elements in sieved and ground air-dried soils using laboratory-based hyperspectral imaging technique. Geoderma 2019, 340, 70–80. [Google Scholar] [CrossRef]
  48. Li, B.; Liew, O.W.; Asundi, A.K. Pre-visual detection of iron and phosphorus deficiency by transformed reflectance spectra. J. Photochem. Photobiol. B Biol. 2006, 85, 131–139. [Google Scholar] [CrossRef] [PubMed]
  49. Wold, S. PLS for Multivariate Linear Modeling. In Chemometric Methods in Molecular Design, 1st ed.; Waterbeemd, H.v.d., Ed.; Wiley VCH: Weinheim, Germany, 1995; Volume 2, pp. 195–218. [Google Scholar]
  50. Huang, H.-H.; He, Q. Nonlinear regression analysis. In International Encyclopedia of Education, 4th ed.; Tierney, R.J., Rizvi, F., Ercikan, K., Eds.; Elsevier: Oxford, UK, 2023; pp. 558–567. [Google Scholar]
  51. Huang, C.; Chang, Y.; Han, L.; Chen, F.; Li, S.; Hong, J. Bandwidth correction of spectral measurement based on Levenberg–Marquardt algorithm with improved Tikhonov regularization. Appl. Opt. 2019, 58, 2166–2173. [Google Scholar] [CrossRef]
  52. Weiss, S.M.; Kulikowski, C.A. Computer Systems That Learn: Classification and Prediction Methods from Statistics, Neural Nets, Machine Learning, and Expert Systems; Morgan Kaufmann Publishers Inc.: Burlington, MA, USA, 1991. [Google Scholar]
  53. Kamruzzaman, M.; Elmasry, G.; Sun, D.W.; Allen, P. Non-destructive prediction and visualization of chemical composition in lamb meat using NIR hyperspectral imaging and multivariate regression. Innov. Food Sci. Emerg. Technol. 2012, 16, 218–226. [Google Scholar] [CrossRef]
  54. Brown, M.B.; Forsythe, A.B. Robust tests for the equality of variances. J. Am. Stat. Assoc. 1974, 69, 364–367. [Google Scholar] [CrossRef]
  55. Gastwirth, J.L.; Gel, Y.R.; Miao, W. The impact of Levene’s test of equality of variances on statistical theory and practice. Stat. Sci. 2009, 24, 343–360. [Google Scholar] [CrossRef]
  56. Saeys, W.; Mouazen, A.M.; Ramon, H. Potential for onsite and online analysis of pig manure using visible and near infrared reflectance spectroscopy. Biosys. Eng. 2005, 91, 393–402. [Google Scholar] [CrossRef]
  57. Williams, P.; Antoniszyn, J.; Manley, M. Near-Infrared Technology: Getting the Best out of Light; African Sun Media: Stellenbosch, South Africa, 2019. [Google Scholar] [CrossRef]
  58. Peirs, A.; Tirry, J.; Verlinden, B.; Darius, P.; Nicolaï, B.M. Effect of biological variability on the robustness of NIR models for soluble solids content of apples. Postharvest Biol. Technol. 2003, 28, 269–280. [Google Scholar] [CrossRef]
  59. Lammers, K.; Arbuckle-Keil, G.; Dighton, J. FT-IR study of the changes in carbohydrate chemistry of three New Jersey pine barrens leaf litters during simulated control burning. Soil Biol. Biochem. 2009, 41, 340–347. [Google Scholar] [CrossRef]
  60. Golic, M.; Walsh, K.; Lawson, P. Short-wavelength near-infrared spectra of sucrose, glucose, and fructose with respect to sugar concentration and temperature. Appl. Spectrosc. 2003, 57, 139–145. [Google Scholar] [CrossRef] [PubMed]
  61. Chen, J.Y.; Miao, Y.; Zhang, H.; Matsunaga, R. Non-destructive determination of carbohydrate content in potatoes using near infrared spectroscopy. J. Near Infrared Spectrosc. 2004, 12, 311–314. [Google Scholar] [CrossRef]
  62. Siesler, H.W.; Ozaki, Y.; Kawata, S.; Heise, H.M. Near-Infrared Spectroscopy: Principles, Instruments, Applications; John Wiley & Sons: Hoboken, NJ, USA, 2001. [Google Scholar] [CrossRef]
  63. Guthrie, J.; Walsh, K. Non-invasive assessment of pineapple and mango fruit quality using near infra-red spectroscopy. Aust. J. Exp. Agric. 1997, 37, 253–263. [Google Scholar] [CrossRef]
  64. Kawano, S.; Watanabe, H.; Iwamoto, M. Determination of sugar content in intact peaches by near infrared spectroscopy with fiber optics in interactance mode. J. Jpn. Soc. Hort. Sci. 1992, 61, 445–451. [Google Scholar] [CrossRef]
  65. Esbensen, K.H.; Swarbrick, B.; Westad, F.; Whitcombe, P.; Anderson, M. Multivariate Data Analysis: An Introduciton to Multivariate Data Analysis, Process Analytical Technology and Quality by Design, 6th ed.; CAMO Software: Oslo, Norway, 2018. [Google Scholar]
  66. Rossel, R.A.V. ParLeS: Software for chemometric analysis of spectroscopic data. Chemom. Intellig. Lab. Syst. 2008, 90, 72–83. [Google Scholar] [CrossRef]
  67. Habibi, V.; Ahmadi, H.; Jafari, M.; Moeini, A. Machine learning and multispectral data-based detection of soil salinity in an arid region, Central Iran. Environ. Monit. Assess. 2020, 192, 759. [Google Scholar] [CrossRef]
  68. Bian, M.; Skidmore, A.; Schlerf, M.; Liu, Y.; Wang, T. Estimating biochemical parameters of tea (Camellia sinensis (L.)) using hyperspectral techniques. Int. Arch. Photogram. Remote. Sens. Spatial Inf. Sci. 2012, XXXIX-B8, 237–241. [Google Scholar] [CrossRef]
  69. Adão, T.; Hruška, J.; Pádua, L.; Bessa, J.; Peres, E.; Morais, R.; Sousa, J.J. Hyperspectral imaging: A review on UAV-based sensors, data processing and applications for agriculture and forestry. Remote Sens. 2017, 9, 1110. [Google Scholar] [CrossRef]
Figure 1. A freshly applied girdle on an avocado branch, shown by a yellow arrow.
Remotesensing 16 03389 g001
Figure 2. Flowchart summarizing the experimental design and the model development and evaluation.
Remotesensing 16 03389 g002
Figure 3. Ground (a) avocado and (b) macadamia leaf samples, showing one shaded region of interest (ROI) for each species where mean spectra were extracted.
Remotesensing 16 03389 g003
Figure 4. The mean corrected relative reflectance of the Vis/NIR spectrum (400–1000 nm) from avocado leaves (n = 210) and macadamia leaves (n = 218). The 100% reflectivity was scaled to 10,000 (integers) by default.
Remotesensing 16 03389 g004
Figure 5. Measured vs. predicted values for (a) starch (%), (b) sucrose (%), (c) glucose (%), and (d) fructose (%) concentrations of avocado leaves using hyperspectral images. Partial least squares regression models were developed after wavelength selection. RMSE: root mean square error; RPD: ratio of prediction to deviation.
Remotesensing 16 03389 g005
Figure 6. Measured vs. predicted values for (a) starch (%), (b) sucrose (%), (c) glucose (%) and (d) fructose (%) concentrations of macadamia leaves using hyperspectral images. Partial least squares regression models were developed after wavelength selection. RPD: ratio of prediction to deviation, RMSE: root mean square error.
Remotesensing 16 03389 g006
Figure 7. β-coefficients of important wavelengths used in partial least squares regression models to predict (a) starch, (c) sucrose, (e) glucose, and (g) fructose concentrations of avocado leaf samples and to predict (b) starch, (d) sucrose, (f) glucose, and (h) fructose concentrations of macadamia leaf samples.
Remotesensing 16 03389 g007
Figure 8. β-coefficients of principal wavelengths identified using variable importance in projection (VIP) and used in models for predicting (a) starch, (b) sucrose, (c) glucose, and (d) fructose concentrations of avocado (amber columns) and macadamia (white columns) leaf samples.
Remotesensing 16 03389 g008
Table 1. Starch (%), sucrose (%), glucose (%), and fructose (%) concentrations in avocado and macadamia leaves that were used to develop hyperspectral models.
KernelsSetAverageSDMinMaxCV
Avocado
StarchCalibration24.3621.713.74139.9289.12
Test25.6929.355.92183.29114.39
SucroseCalibration26.1030.940.02105.32118.54
Test25.9330.620.0396.70118.08
Sucrose 1 *Calibration58.1515.1433.0896.726.04
Test66.4920.2131.13105.330.3
Sucrose 2 *Calibration0.490.740.024.37153
Test6.068.170.0227.241.34
GlucoseCalibration11.225.810.1026.7751.78
Test10.847.451.0325.9868.72
FructoseCalibration12.826.171.9628.4748.12
Test12.826.260.3022.8748.82
Macadamia
StarchCalibration4.664.100.1421.8187.98
Test4.593.080.5012.2067.10
SucroseCalibration6.885.550.1722.0380.66
Test7.966.560.4222.2082.41
GlucoseCalibration27.4614.912.8447.5754.29
Test29.1014.792.9247.2350.82
Glucose 1 *Calibration5.002.682.8420.1753.62
Test6.124.263.5919.8568.67
Glucose 2 *Calibration37.255.4221.8747.5714.55
Test35.483.3228.4341.949.30
FructoseCalibration17.8711.390.6434.0163.73
Test20.2711.100.5933.8654.76
Fructose 1 *Calibration2.482.350.598.9194.81
Test2.703.100.8313.7114.9
Fructose 2 *Calibration26.983.2615.1334.0112.08
Test24.472.6218.9929.2710.68
* 1 and 2 indicate that two sub-clusters of data were used for model development when distinct sub-clusters were observed in the data.
Table 2. Performance of partial least squares regression (PLSR) and artificial neural network (ANN) models in predicting starch (%), sucrose (%), glucose (%) and fructose (%) concentrations in avocado and macadamia leaves using hyperspectral images.
RMSE (%)RMSE (%)RMSE (%)R2R2R2RPD
CalibrationValidationTestCalibrationValidationTestTest
Avocado
StarchPLSR (284)9.1211.2019.100.710.560.621.53
PLSR (462)10.5812.8521.010.640.470.511.39
ANN (462)9.8214.7415.100.900.790.831.98
SucrosePLSR (179)12.2012.7013.650.840.830.792.24
PLSR (462)10.5311.9912.690.880.850.822.41
ANN (462)10.457.5814.720.950.950.831.29
Sucrose 1PLSR (462)15.1511.7820.210.890.710.691.00
ANN (462)5.1513.9419.9094.000.740.551.02
Sucrose 2PLSR (462)6.086.857.280.950.960.981.12
ANN (462)6.036.604.060.990.980.992.01
GlucosePLSR (76)2.382.612.900.830.790.852.98
PLSR (462)2.302.622.500.840.790.862.98
ANN (462)1.212.063.660.980.900.780.89
FructosePLSR (192)2.782.962.830.790.770.792.21
PLSR (462)2.582.952.460.820.770.852.54
ANN (462)1.152.373.390.980.840.861.11
Macadamia
StarchPLSR (93)2.012.162.150.750.720.521.45
PLSR (462)1.902.262.200.780.690.601.57
ANN (462)1.892.163.590.890.610.671.17
SucrosePLSR (111)2.833.403.810.730.620.651.44
PLSR (462)2.673.353.890.760.630.641.36
ANN (462)2.582.563.610.890.920.821.47
GlucosePLSR (166)4.564.874.370.900.890.923.53
PLSR (462)4.324.634.400.910.900.913.51
ANN (462)1.041.622.540.990.990.981.30
Glucose 1PLSR (462)3.591.241.170.960.970.863.64
ANN (462)3.922.453.510.660.970.181.21
Glucose 2PLSR (462)5.424.843.330.810.820.871.00
ANN (462)1.893.074.000.910.820.710.83
FructosePLSR (200)2.973.092.370.930.920.954.68
PLSR (462)2.933.052.600.930.920.954.25
ANN (462)0.652.502.260.990.970.981.22
Fructose 1PLSR (462)2.363.683.100.940.980.991.00
ANN (462)1.210.413.500.910.480.530.89
Fructose 2PLSR (462)3.263.062.610.940.810.861.00
ANN (462)2.911.923.370.670.040.490.78
RMSE: Root mean square error; RPD: ratio of prediction to deviation; Numbers of wavelengths inside parentheses; 1 and 2 represent two sub-clusters of data used for model development.
Disclaimer/Publisher’s Note: The statements, opinions and data contained in all publications are solely those of the individual author(s) and contributor(s) and not of MDPI and/or the editor(s). MDPI and/or the editor(s) disclaim responsibility for any injury to people or property resulting from any ideas, methods, instructions or products referred to in the content.

