
Detection of Coastal Erosion and Progradation in the Colombian ‘Atrato River’ Delta by Using Sentinel-1 Synthetic Aperture Radar Data

 , , ,
, , ,  , ,
, ,  , ,
, ,  , ,
, ,  and
and
Abstract
1. Introduction
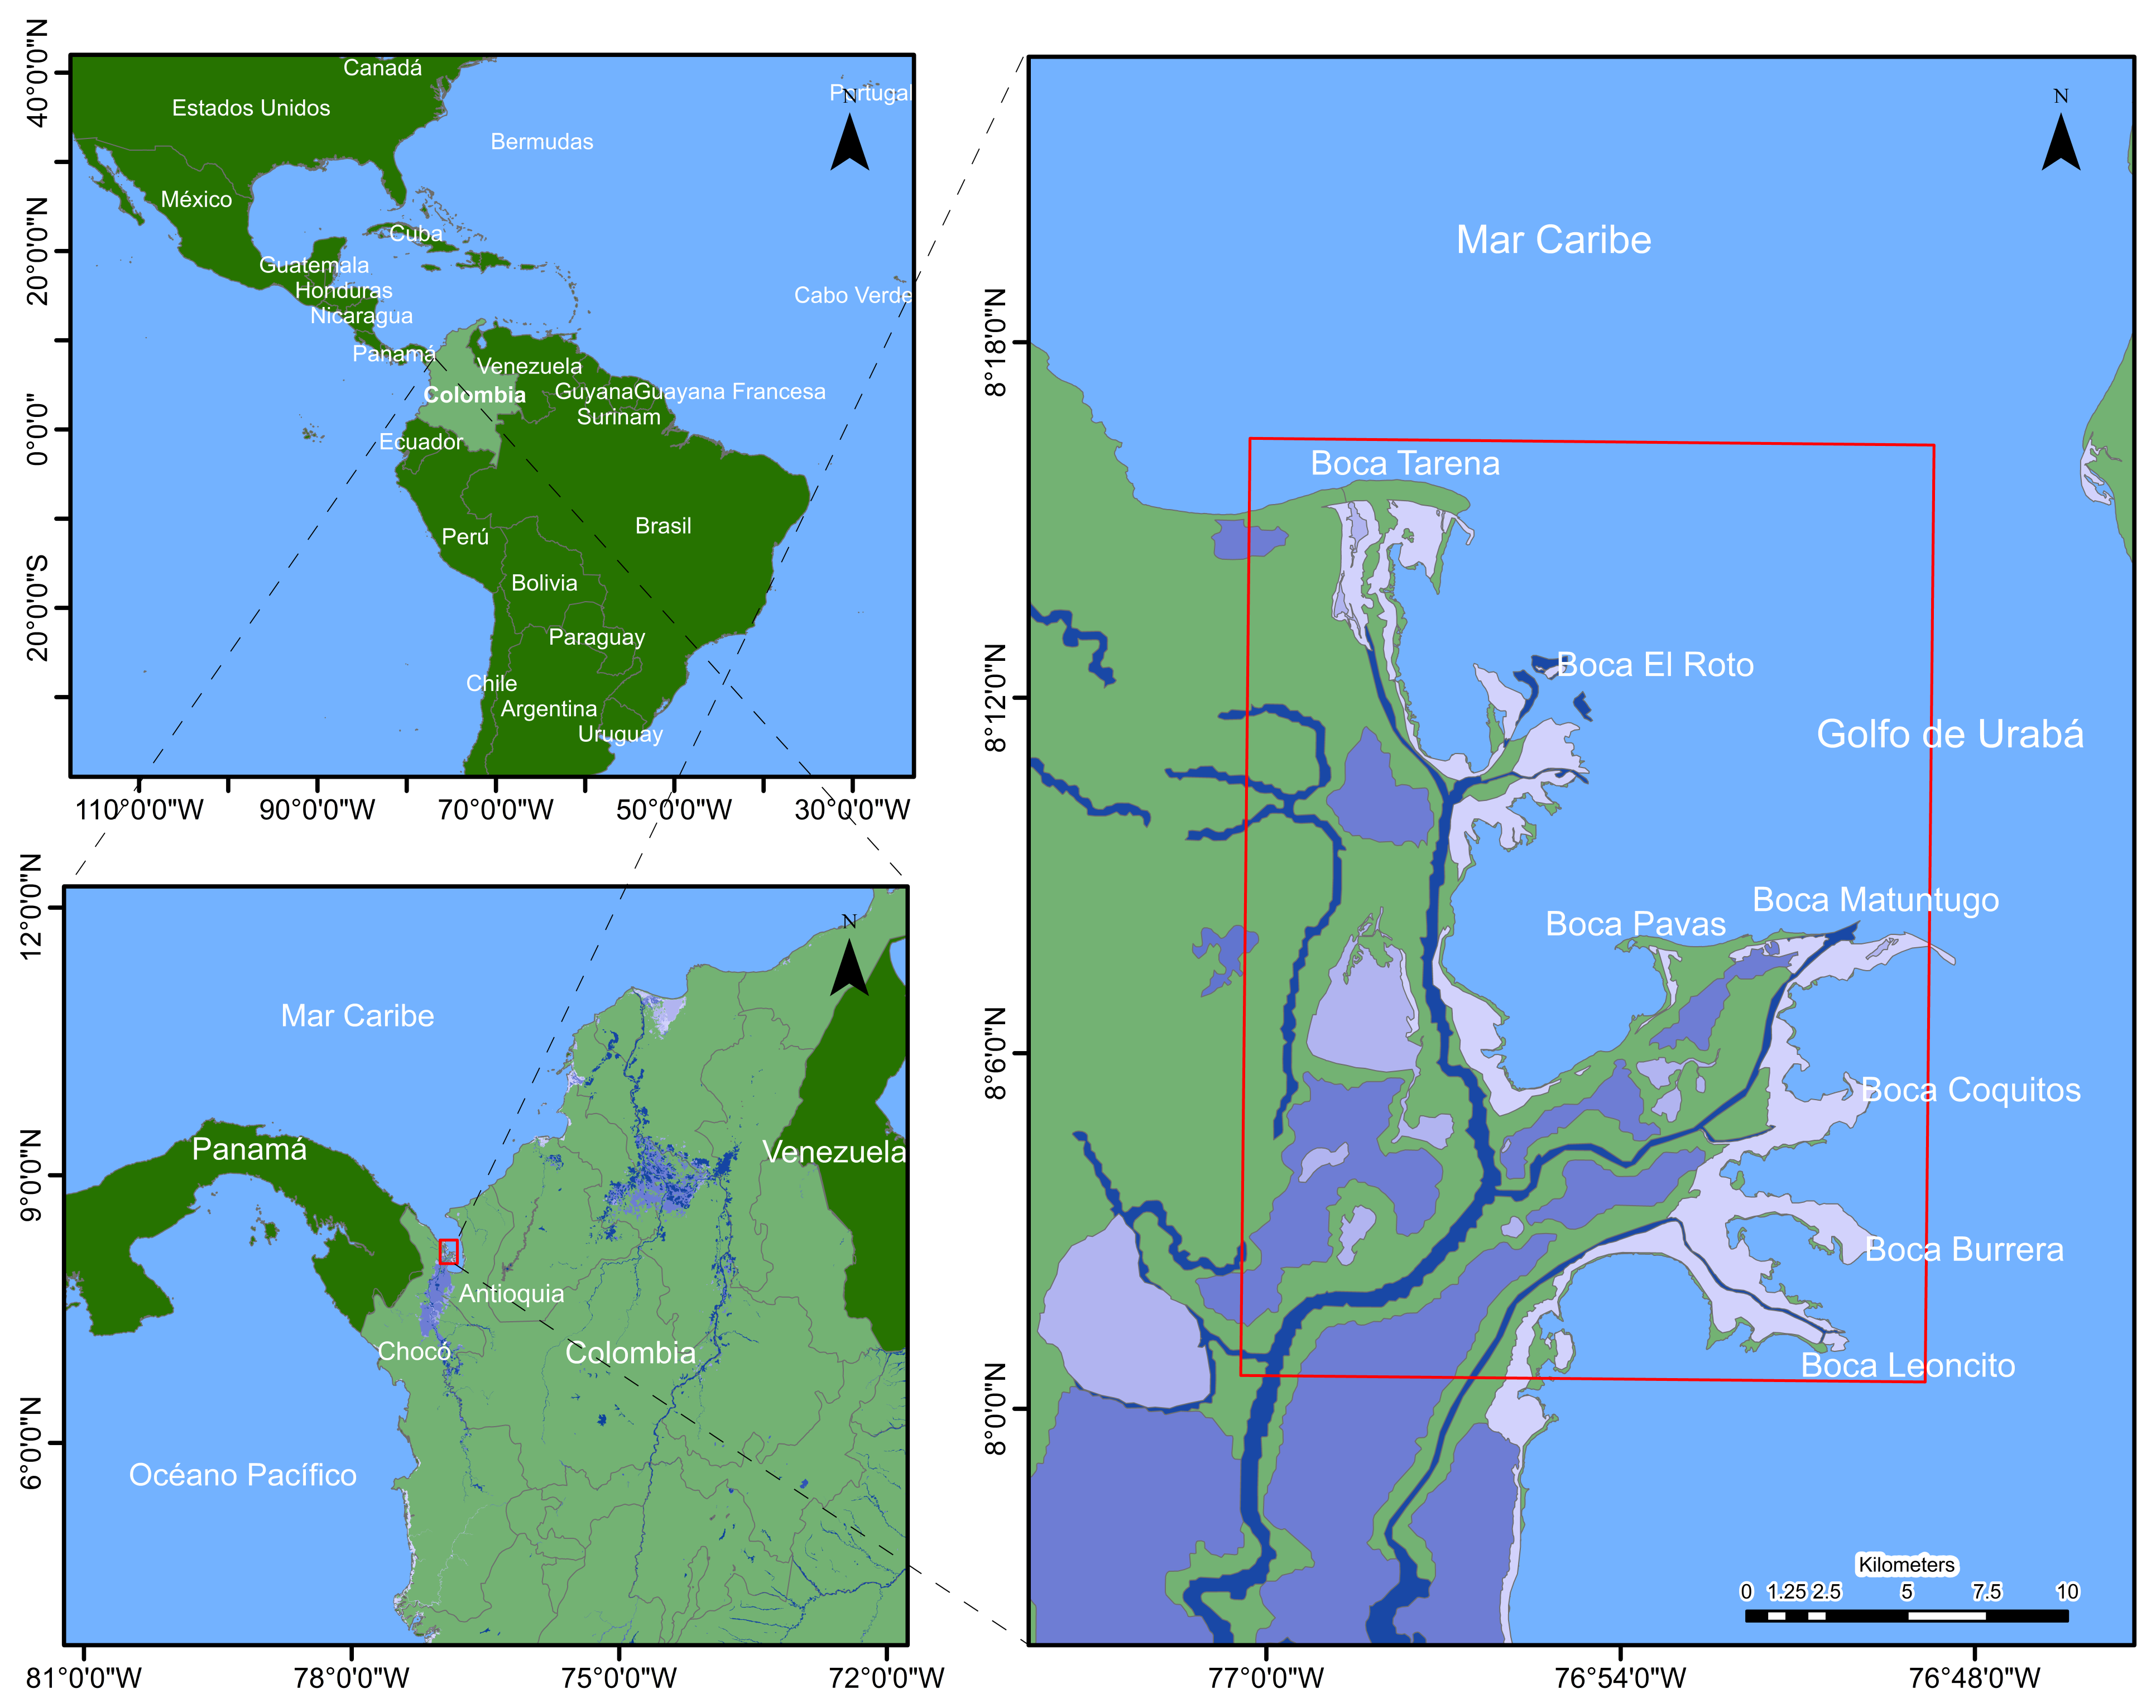
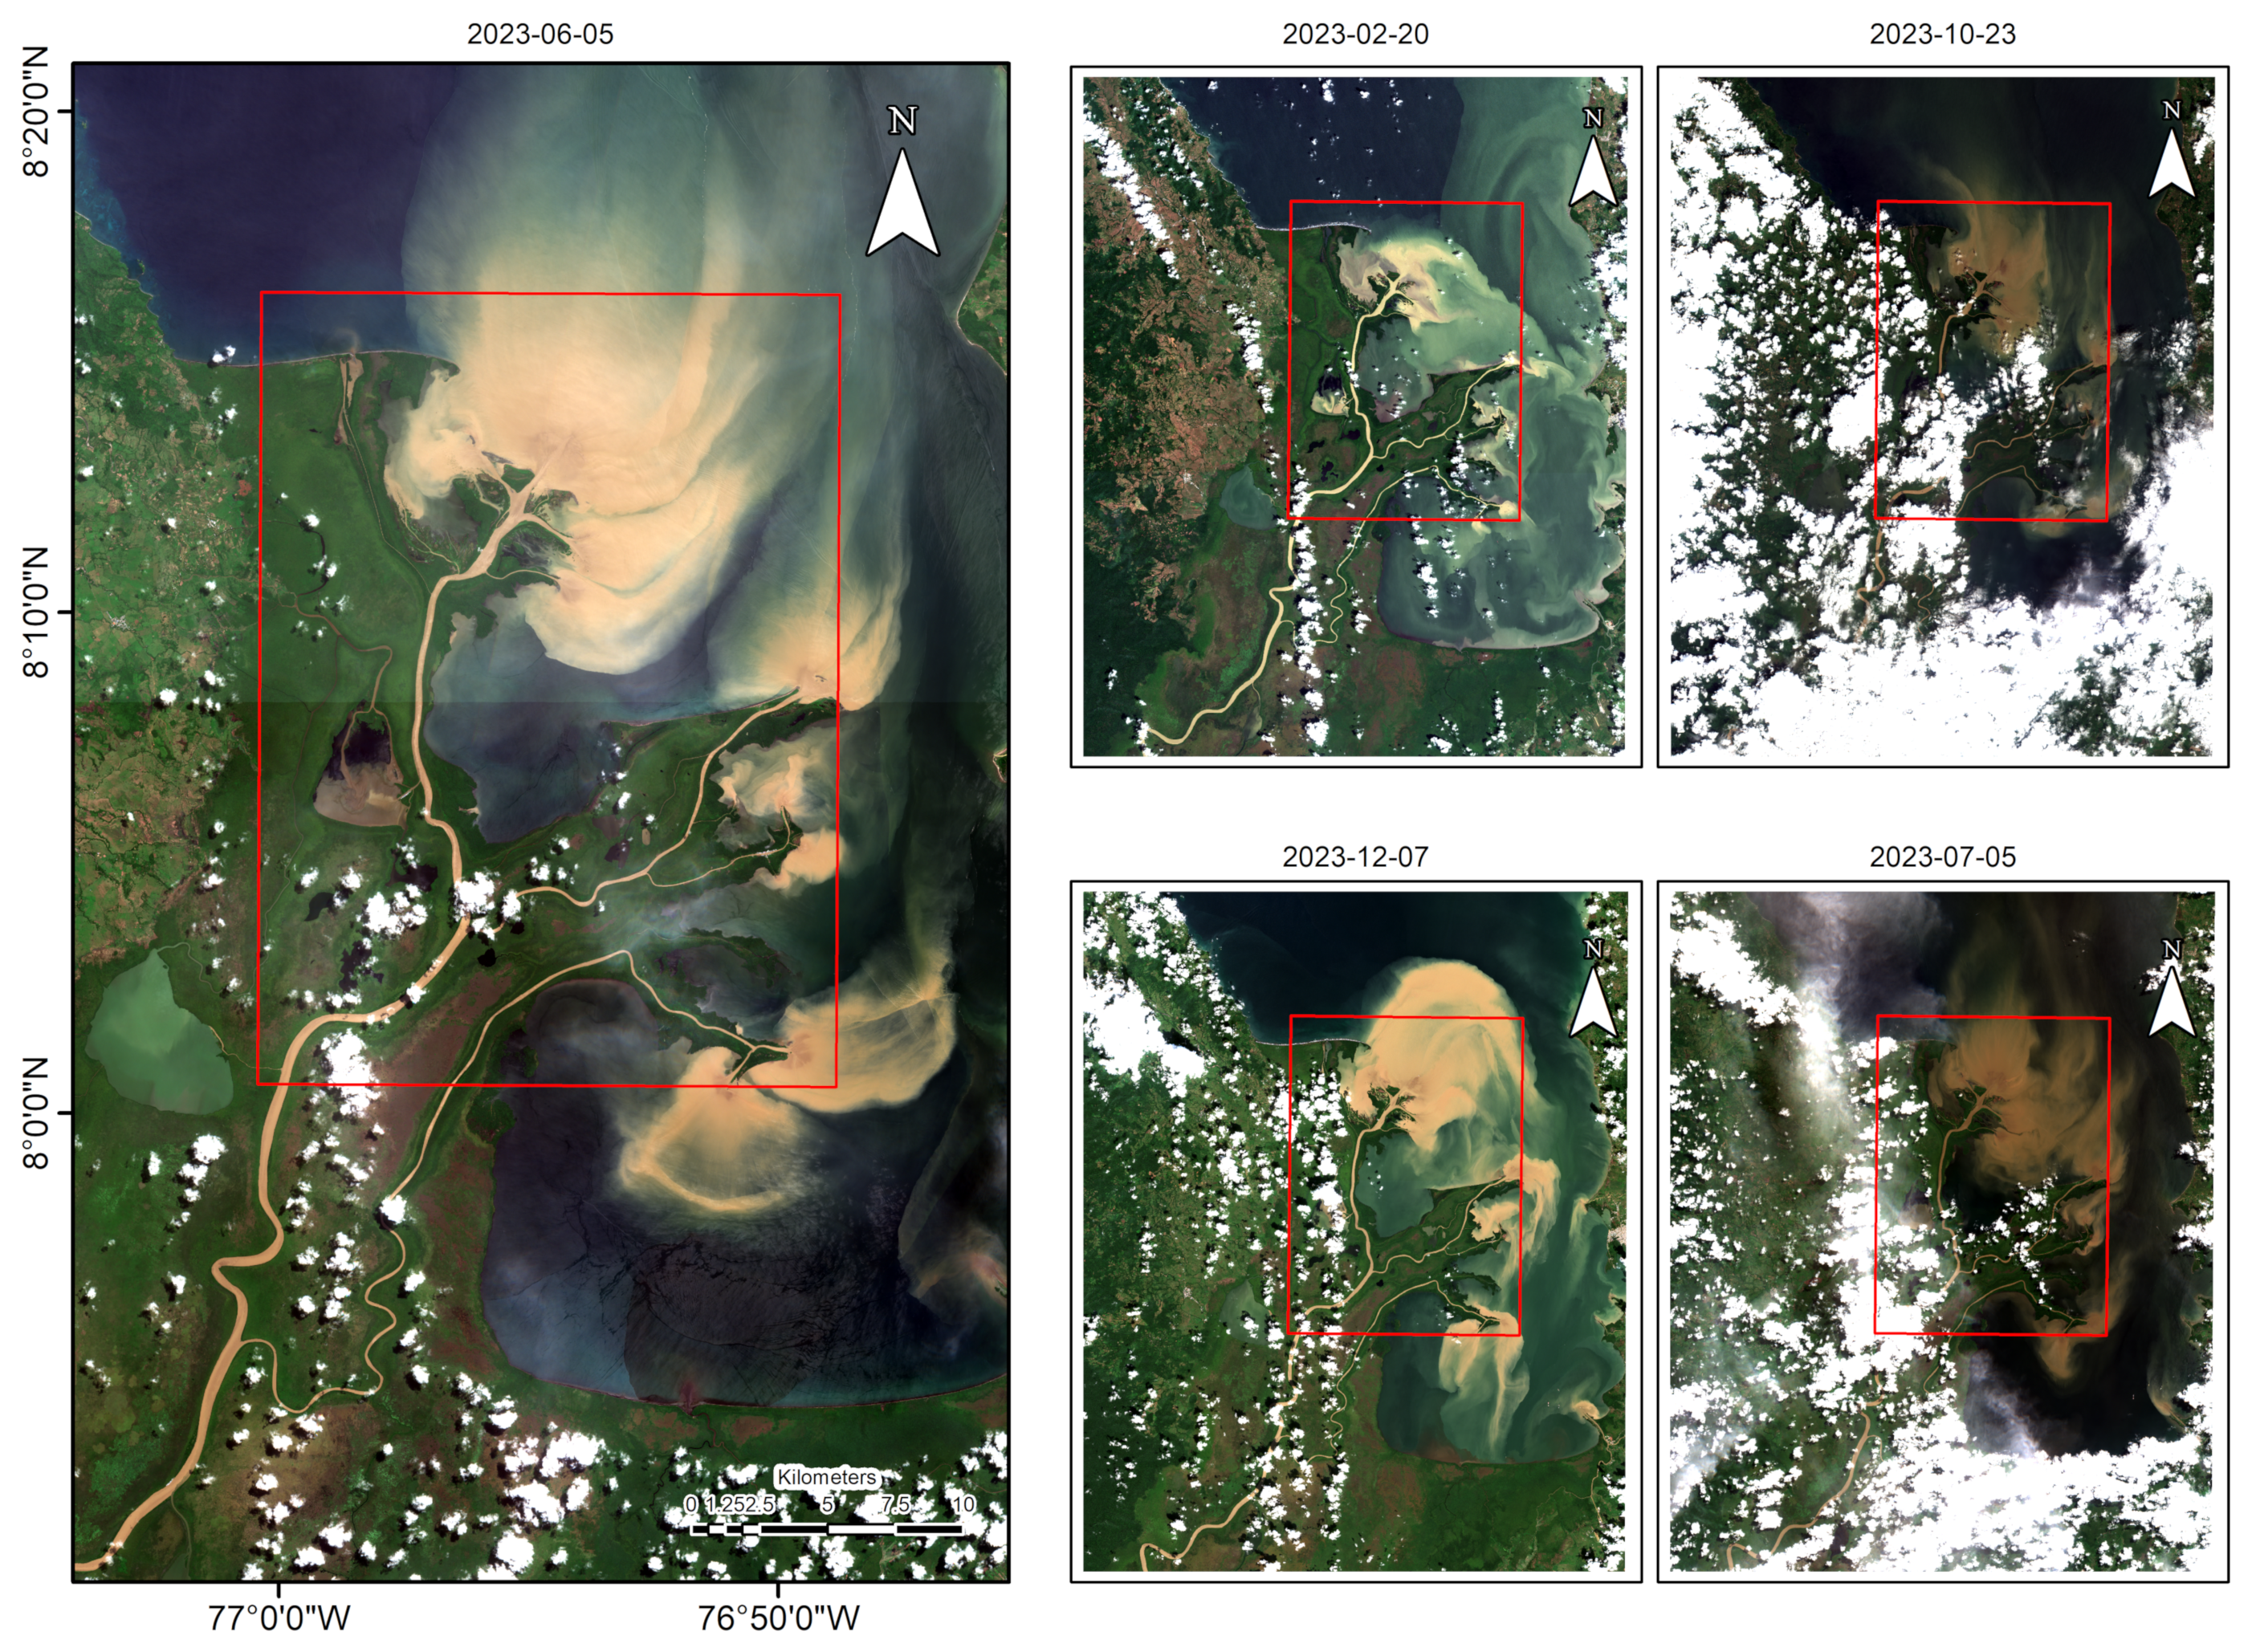
2. The Study Area
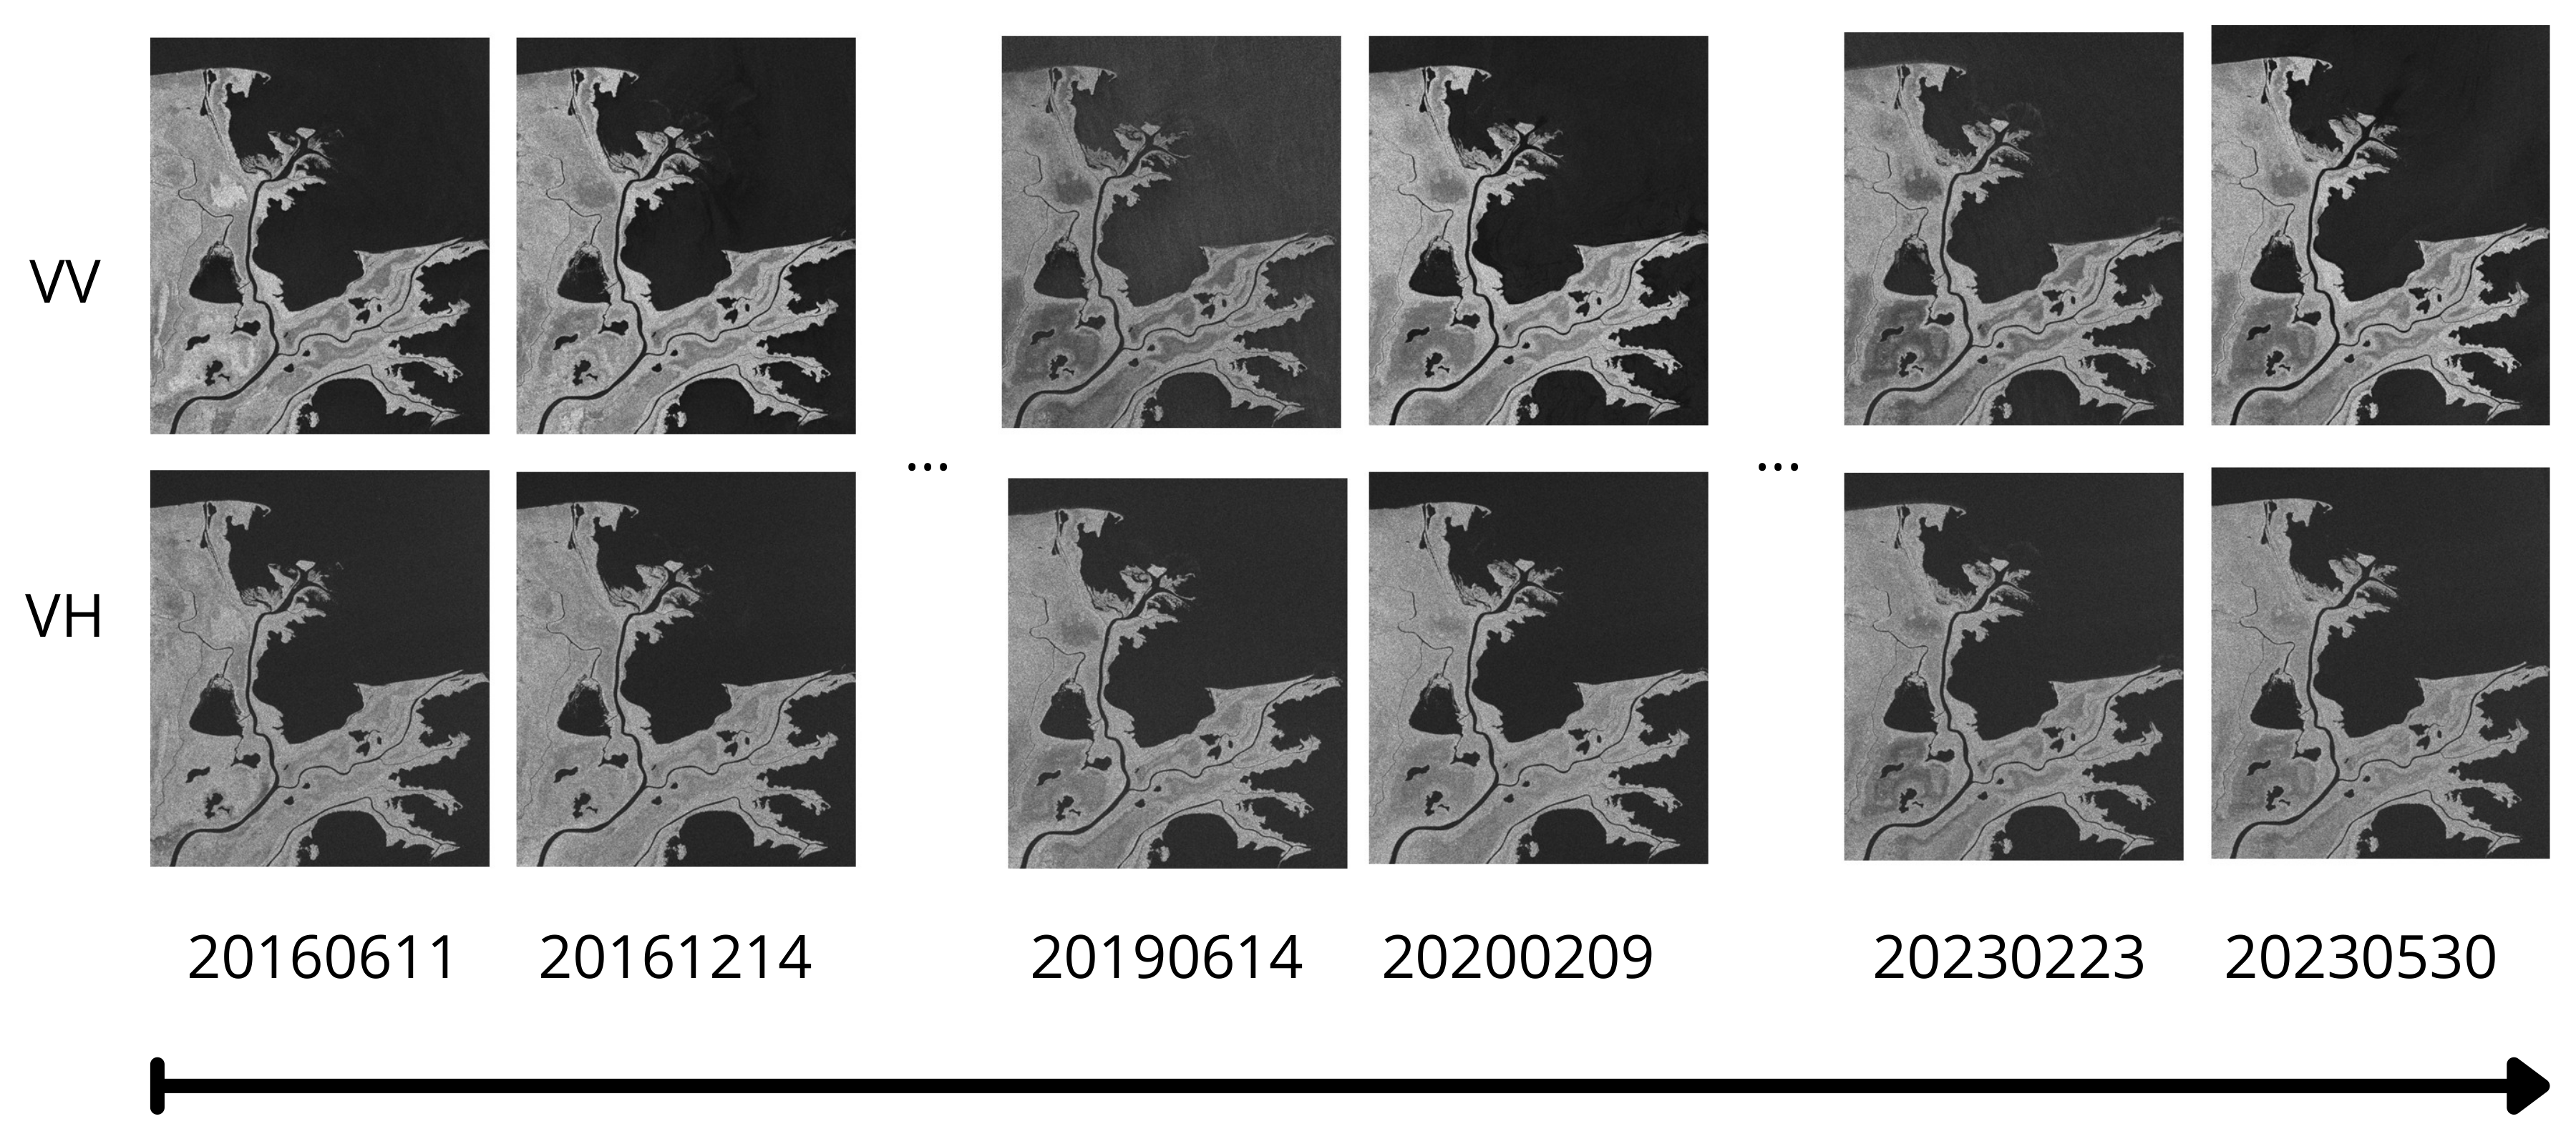
3. Materials
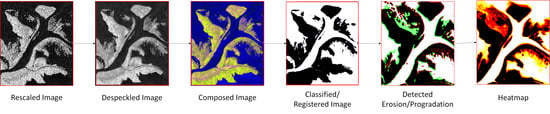
4. Methodology
4.1. Rescale
4.2. Despeckling
4.3. Composing
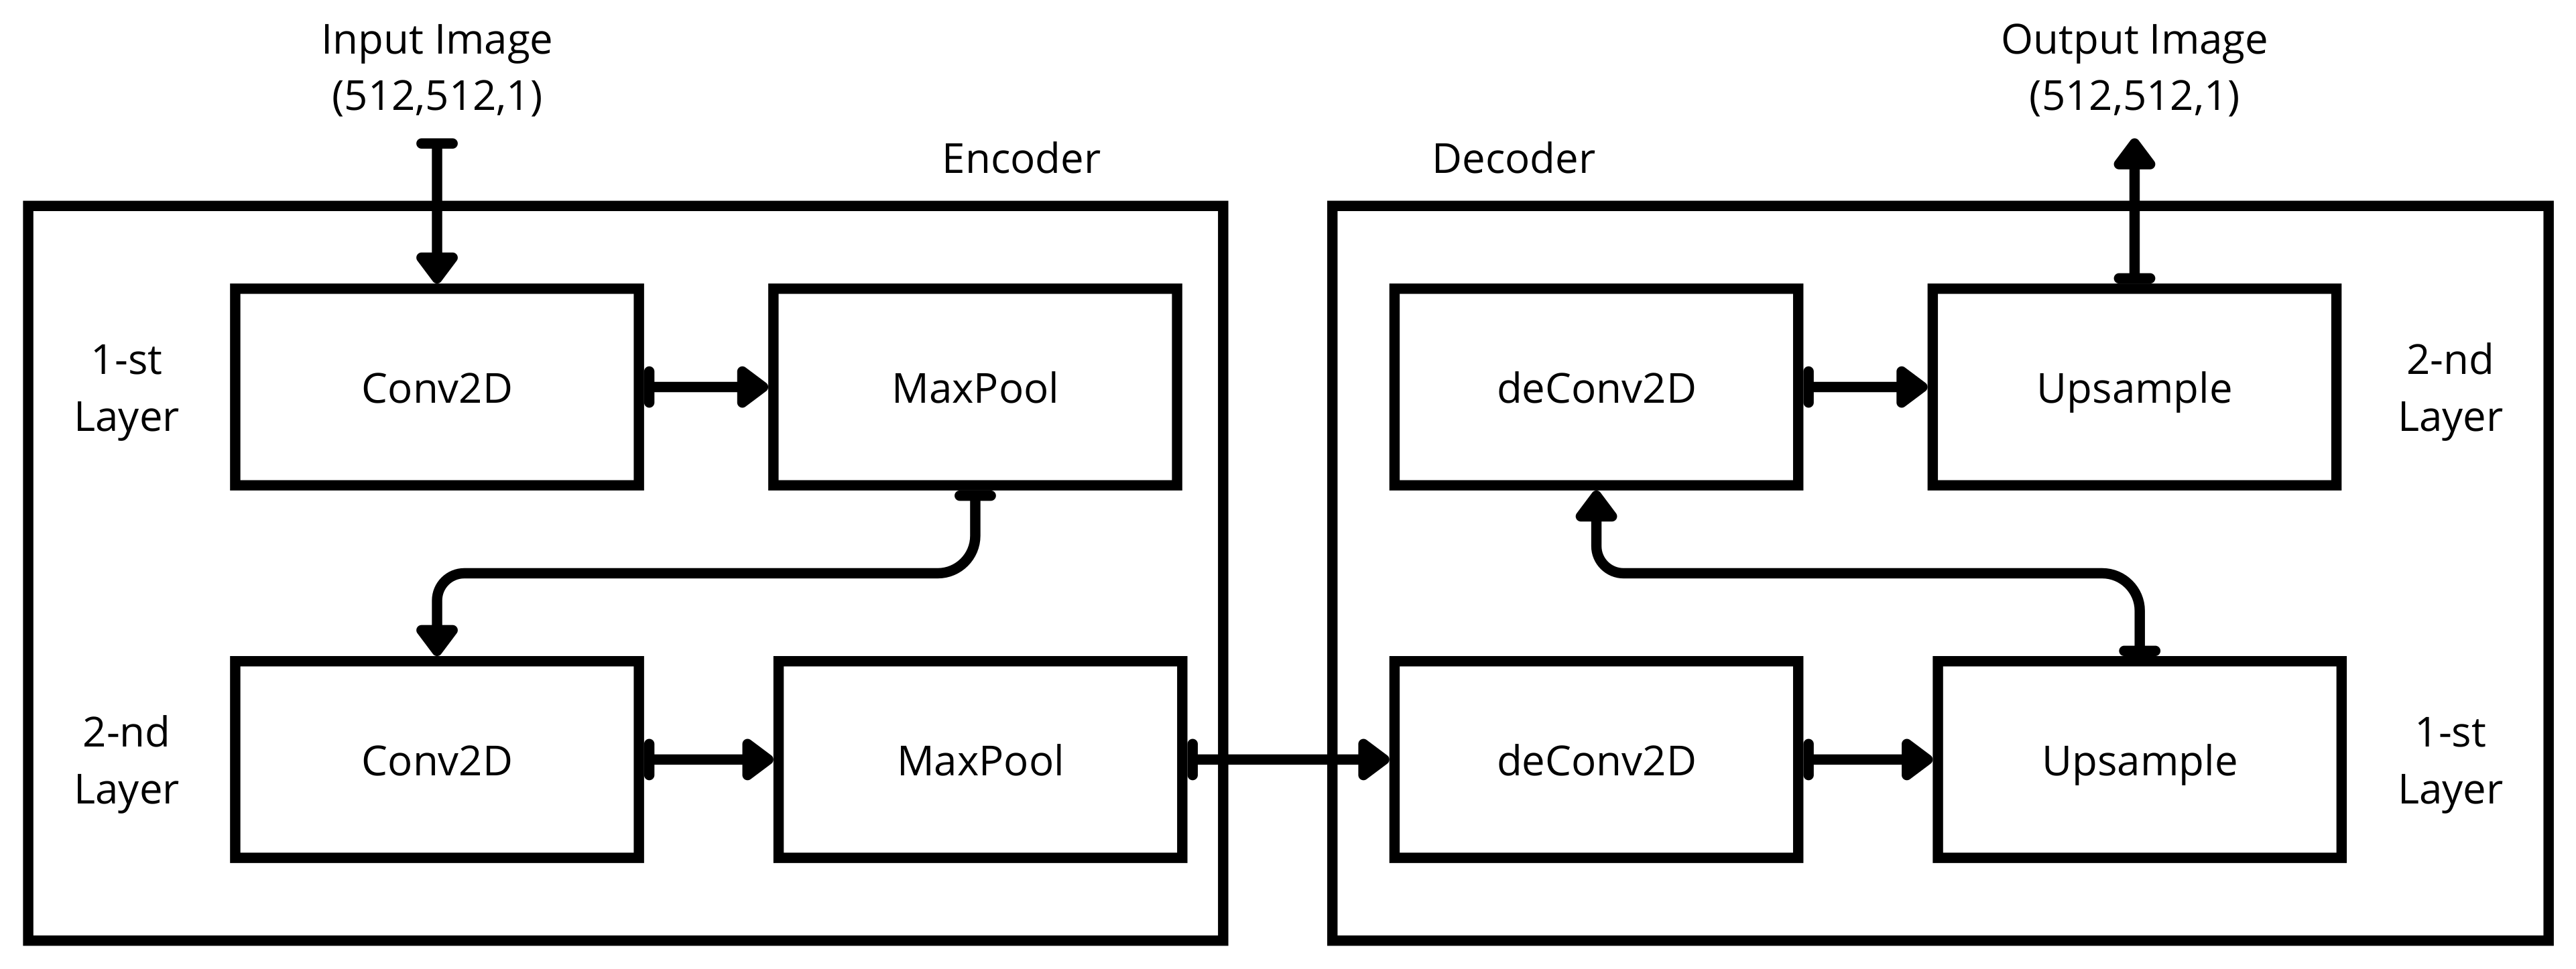
4.4. Classification
4.5. Registration
4.6. Multitemporal Analysis
4.7. Evaluation of Changes in Classified Images
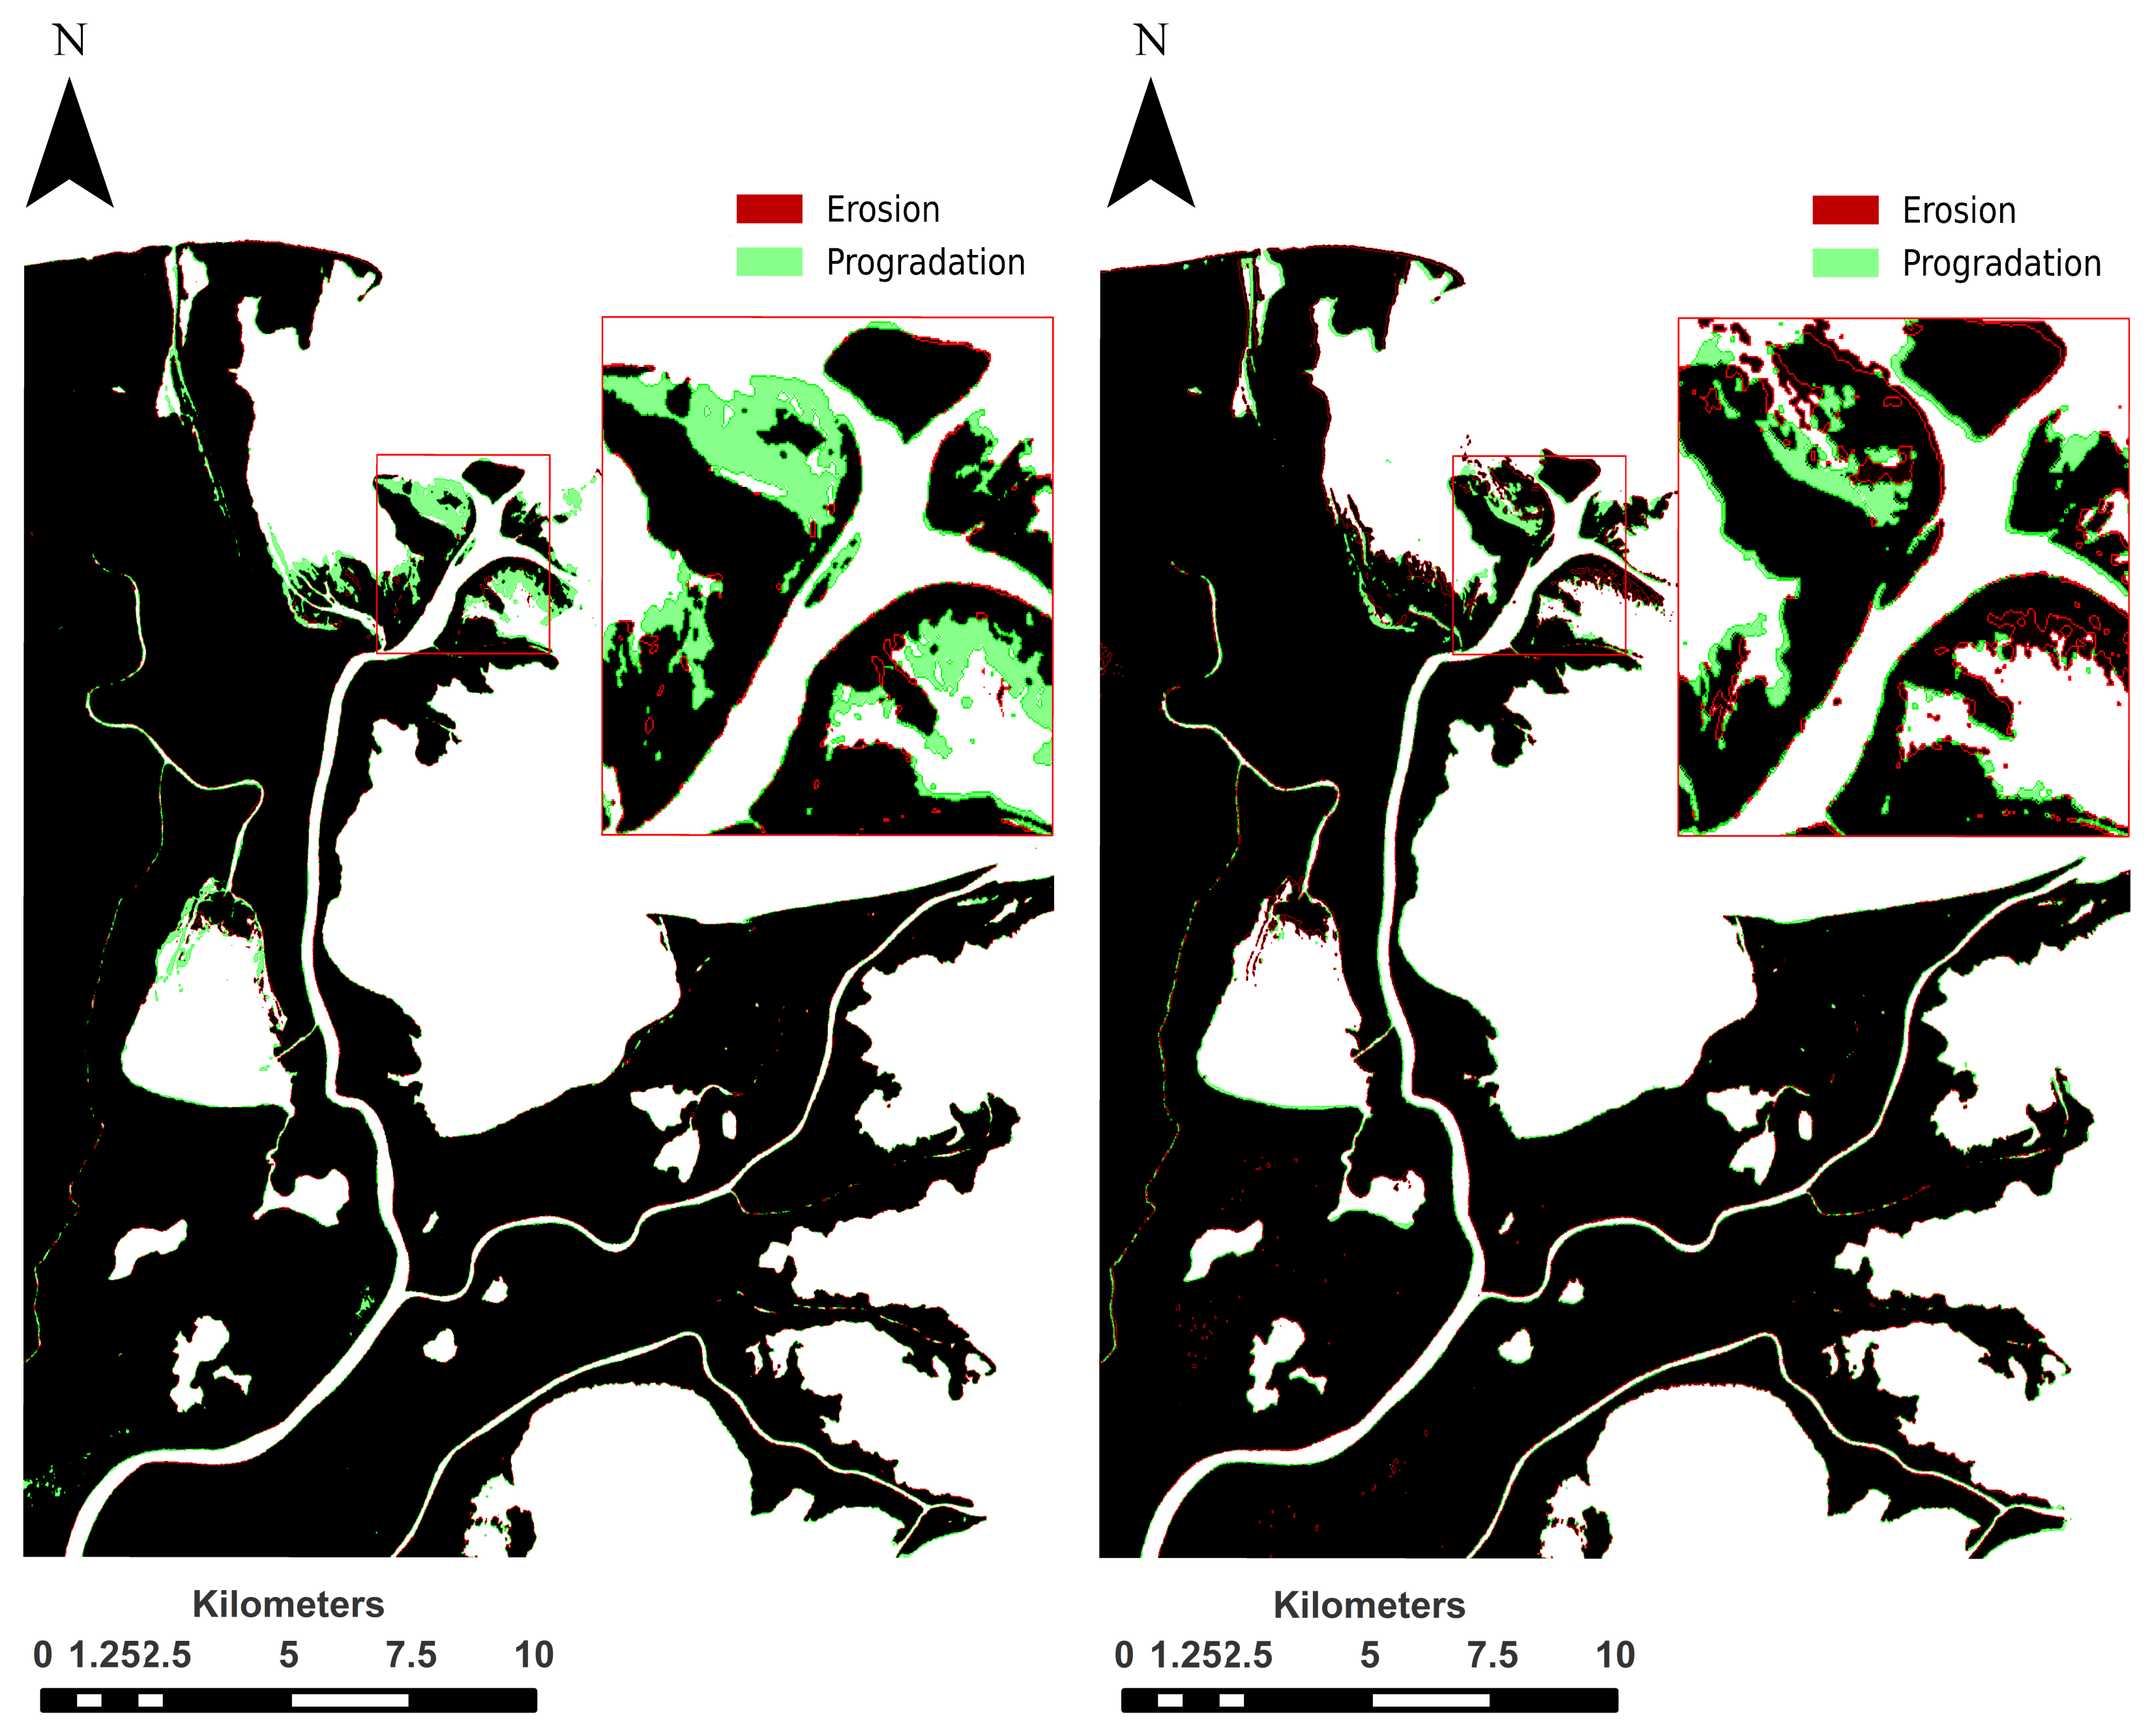
4.8. Erosion/Progradation Detection and Measurement
5. Results
6. Discussion
6.1. Raw SAR Images
6.2. Despeckling
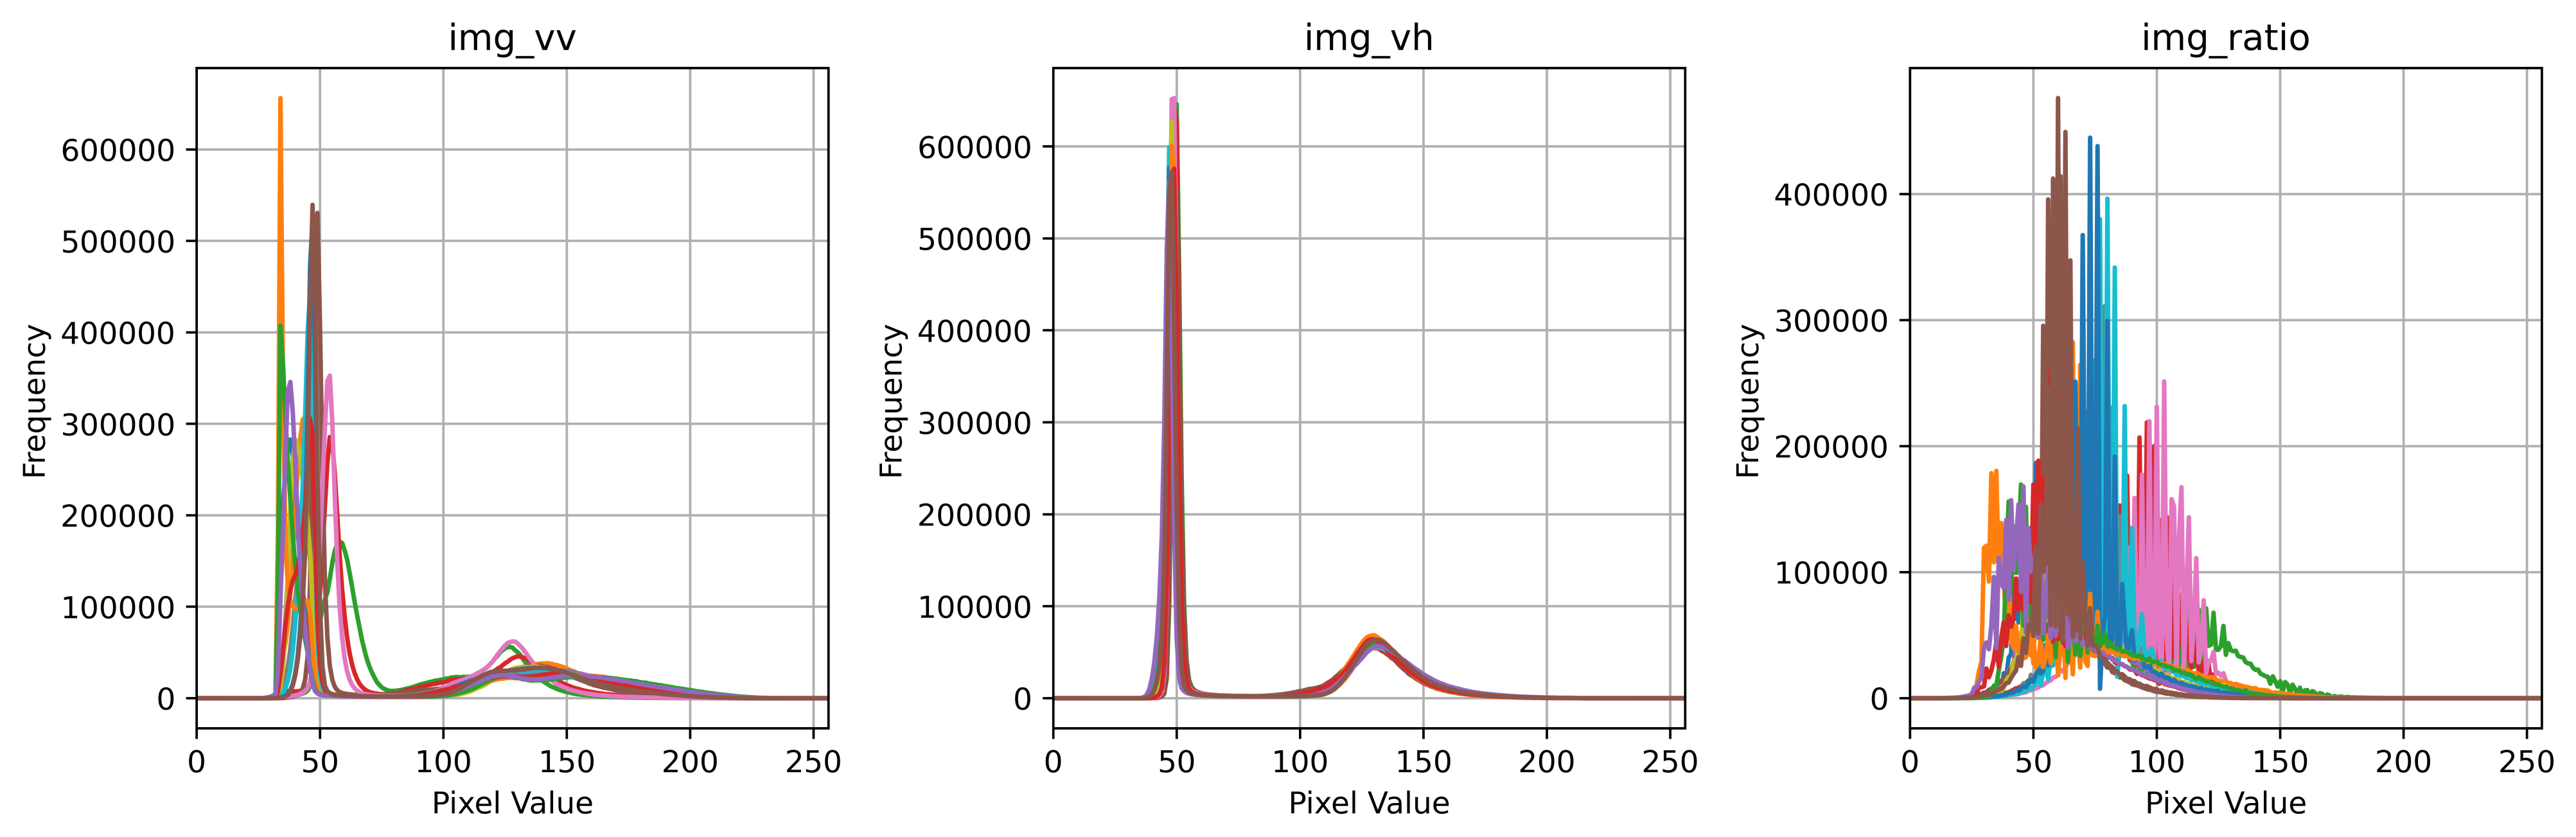
6.3. Composition
6.4. Classification
6.5. Heatmap
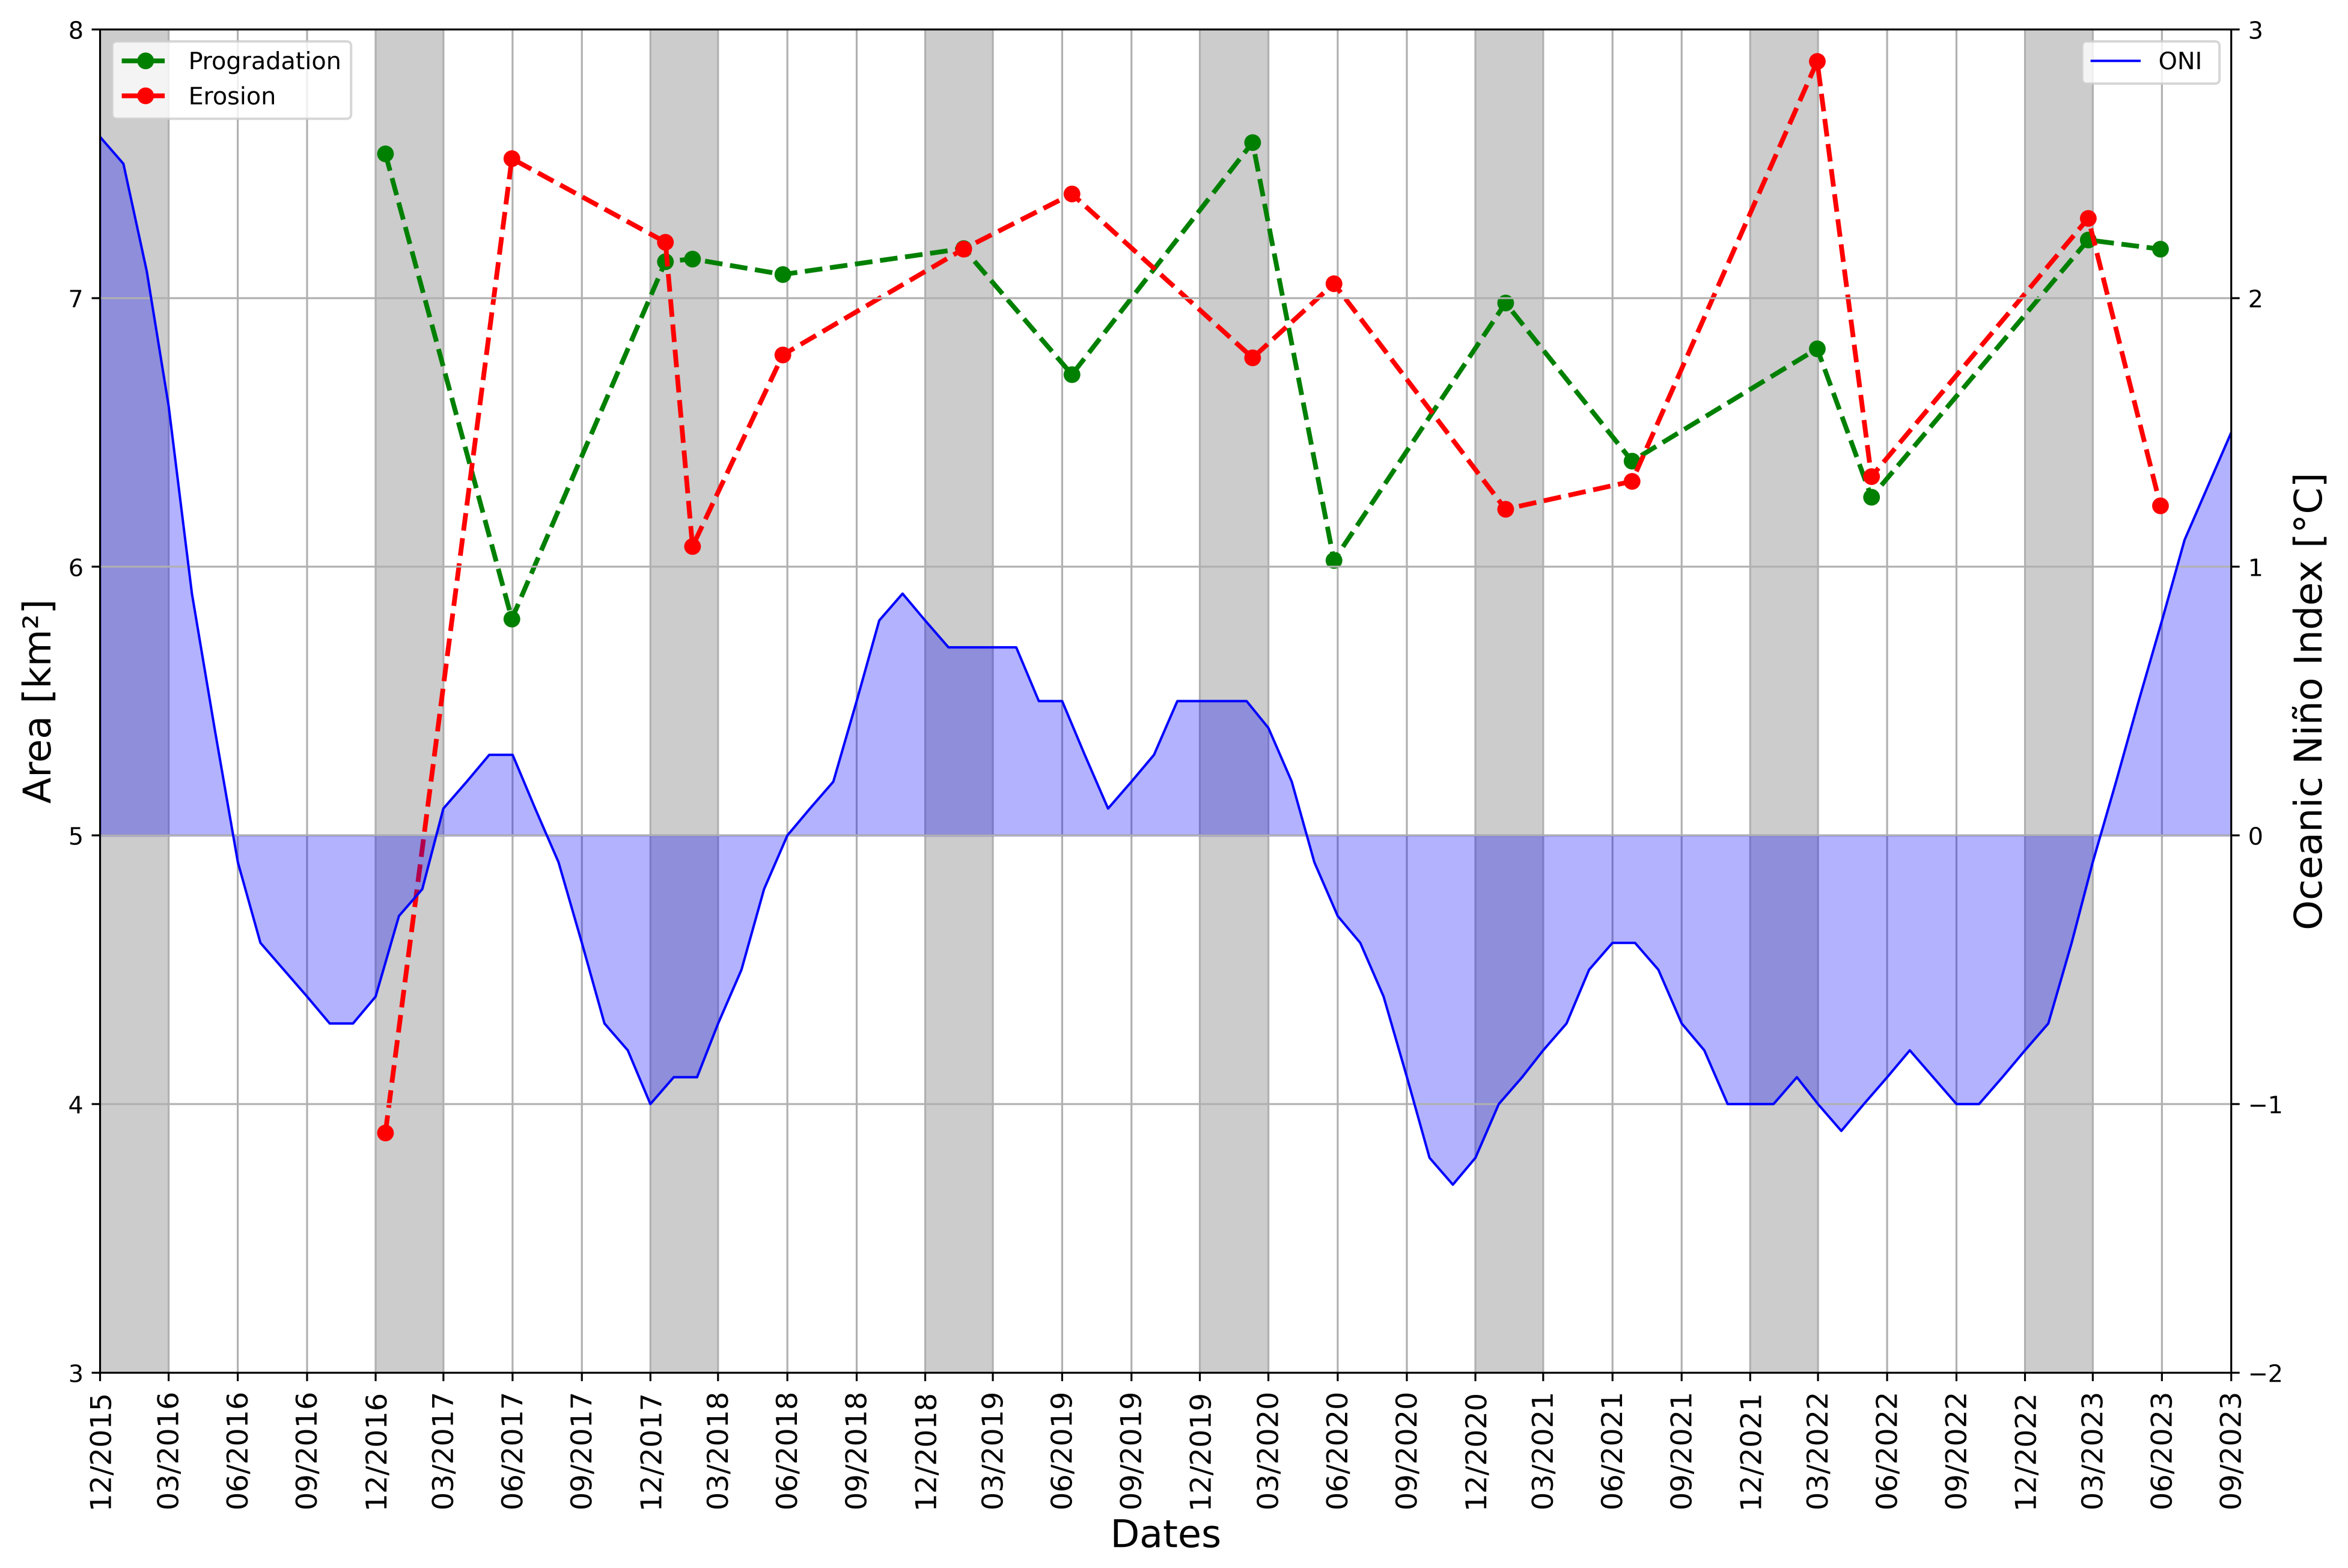
6.6. Erosion and Progradation Time Series
7. Conclusions and Future Work
Author Contributions
Funding
Data Availability Statement
Acknowledgments
Conflicts of Interest
Abbreviations
| SAR | Synthetic Aperture Radar |
| ENL | Equivalent Number of Looks |
| ROI | Region Of Interest |
| GEE | Google Earth Engine |
| DL | Deep Learning |
| SLC | Single Look Complex |
| GRD | Ground Range Detected |
| HD | High Definition |
| OCN | Ocean |
| ONI | Oceanic Niño Index |
| VV | Vertical Vertical |
| VH | Vertical Horizontal |
| SM | Stripmap |
| IW | Interferometric Wide swath |
| EW | Extra-Wide swath |
| ENSO | El Niño Southern Oscillation climate pattern |
References
- IDEAM. Atlas Climatológico de Colombia. 2023. Available online: http://www.ideam.gov.co/AtlasWeb/index.html (accessed on 28 November 2023).
- Instituto de Hidrología Meteorología y Estudios Ambientales IDEAM. La Variabilidad Climática y el Cambio Climático en Colombia. 2018. Available online: https://www.andi.com.co/Uploads/variabilidad.pdf (accessed on 28 November 2023).
- Velez, J.; Betancurth, L.; Cañón-Barriga, J. Erosion and Progradation in the Atrato River Delta: A Spatiotemporal Analysis with Google Earth Engine; Revista Facultad de Ingeniería Universidad de Antioquia: Medellin, Colombia, 2020. [Google Scholar] [CrossRef]
- Court, C.C. Expediente T-5.016.242. 2016. Available online: https://www.corteconstitucional.gov.co/relatoria/2016/t-622-16.htm (accessed on 28 November 2023).
- Instituto de Hidrología Meteorología y Estudios Ambientales IDEAM. Erosión. 2023. Available online: http://www.ideam.gov.co/web/siac/erosion (accessed on 4 January 2024).
- Schlumberger. Progradación. 2024. Available online: https://glossary.slb.com/es/terms/p/progradation (accessed on 4 January 2024).
- Samra, R.A.; Ali, R.R. Applying DSAS tool to detect coastal changes along Nile Delta, Egypt. Egypt. J. Remote. Sens. Space Sci. 2020, 24, 463–470. [Google Scholar]
- Yang, J.; Dai, Z.; Lou, Y.; Mei, X.; Fagherazzi, S. Image-based machine learning for monitoring the dynamics of deltaic islands in the Atchafalaya River Delta Complex between 1991 and 2019. J. Hydrol. 2023, 623, 129814. [Google Scholar] [CrossRef]
- Danchenkov, A.; Nikolay, B.; Ekaterina, B.; Stanislav, M. Foredune defending role: Vulnerability and potential risk through combined satellite and hydrodynamics approach. Remote Sens. Appl. Soc. Environ. 2023, 30, 100934. [Google Scholar] [CrossRef]
- NASA. ASF Data Search. 2023. Available online: https://search.asf.alaska.edu/ (accessed on 28 November 2023).
- ESA. Sentinel-1 Missions. 2023. Available online: https://sentinels.copernicus.eu/web/sentinel/missions/sentinel-1 (accessed on 28 November 2023).
- Blanco-Libreros, J.F. Cambios Globales en los Manglares del Golfo de Urabá (Colombia): Entre la Cambiante líNea Costera y la Frontera Agropecuaria en Expansión. 2016. Available online: https://revistas.udea.edu.co/index.php/actbio/article/view/328978 (accessed on 28 November 2023).
- Restrepo, J.D.; Alvarado, E.M. 11.12—Assessing Major Environmental Issues in the Caribbean and Pacific Coasts of Colombia, South America: An Overview of Fluvial Fluxes, Coral Reef Degradation, and Mangrove Ecosystems Impacted by River Diversion. 2011. Available online: https://www.researchgate.net/publication/275344298_Assessing_Major_Environmental_Issues_in_the_Caribbean_and_Pacific_Coasts_of_Colombia_South_America_An_Overview_of_Fluvial_Fluxes_Coral_Reef_Degradation_and_Mangrove_Ecosystems_Impacted_by_River_Divers (accessed on 28 November 2023).
- Restrepo, J.D.; Kjerfve, B. The Pacific and Caribbean Rivers of Colombia: Water Discharge, Sediment Transport and Dissolved Loads. 2004. Available online: https://link.springer.com/chapter/10.1007/978-3-662-07060-4_14 (accessed on 28 November 2023).
- Codazzi, I.G.A. Geoportal la Información geográfica Colombiana—Colombia en Mapas. 2024. Available online: https://www.colombiaenmapas.gov.co/ (accessed on 10 January 2024).
- Duránn, I.D.C.; Daza, R.J.M. Multitemporal analysis of the flow of sediments using MODIS MYD09 and MOD09 images. Cienc. Ing. Neogranadina 2019. [Google Scholar] [CrossRef]
- Mascolo, L.; Cloude, S.R.; Lopez-Sanchez, J.M. Model-based decomposition of dual-pol SAR data: Application to Sentinel-1. IEEE Trans. Geosci. Remote. Sens. 2021, 60, 5220119. [Google Scholar] [CrossRef]
- Kumar, A.; Das, A.K.; Panigrahi, R.K. Hybrid-Pol Based Three-Component Scattering Model for Analysis of RISAT Data. IEEE J. Sel. Top. Appl. Earth Obs. Remote. Sens. 2017, 10, 5155–5162. [Google Scholar] [CrossRef]
- ESA. Ground Range Detected Sentinel-1. 2023. Available online: https://sentinels.copernicus.eu/web/sentinel/technical-guides/sentinel-1-sar/products-algorithms/level-1-algorithms/ground-range-detected (accessed on 10 January 2024).
- National Centers for Environmental Prediction. ONI—Cold & Warm Episodes by Season. 2023. Available online: https://origin.cpc.ncep.noaa.gov/products/analysis_monitoring/ensostuff/ONI_v5.php (accessed on 28 November 2023).
- Vásquez-Salazar, R.D.; Cardona-Mesa, A.A.; Gómez, L.; Travieso-González, C.M. A new methodology for assessing SAR despeckling filters. TechRxiv 2023. [Google Scholar] [CrossRef]
- ESA. User Guides—Sentinel-1 SAR—Polarimetry—Sentinel Online. 2023. Available online: https://sentinels.copernicus.eu/web/sentinel/user-guides/sentinel-1-sar/product-overview/polarimetry (accessed on 28 November 2023).
- Otsu, N. A Threshold Selection Method from Gray-Level Histograms. IEEE Trans. Syst. Man Cybern. 1979, 9, 62–66. [Google Scholar] [CrossRef]
- Xue, J.H.; Titterington, D.M. t-Tests, F-Tests and Otsu’s Methods for Image Thresholding. IEEE Trans. Image Process. 2011, 20, 2392–2396. [Google Scholar] [CrossRef] [PubMed]
- Rublee, E.; Rabaud, V.; Konolige, K.; Bradski, G.R. ORB: An efficient alternative to SIFT or SURF. In Proceedings of the 2011 International Conference on Computer Vision, Barcelona, Spain, 6–13 November 2011; pp. 2564–2571. [Google Scholar]
- Viswanathan, D. Features from Accelerated Segment Test (FAST). 2011. Available online: https://homepages.inf.ed.ac.uk/rbf/CVonline/LOCAL_COPIES/AV1011/AV1FeaturefromAcceleratedSegmentTest.pdf (accessed on 28 November 2023).
- Díaz, D.P.; Villegas, N. Correlación Canónica Entre índices Macroclimáticos y Variables Meteorológicas de Superficie en Colombia. 2015. Available online: https://revistas.udca.edu.co/index.php/ruadc/article/view/185 (accessed on 28 November 2023).
- Gil, M.M.; Quiceno, N.; Poveda, G. Efecto del ENSO y la NAO Sobre el Ciclo Anual de la Hidrología de Colombia: Análisis de Correlación, Reanálisis de NCEP/NCAR y Modelos de Pronóstico. 1998. Available online: https://repositorio.unal.edu.co/handle/unal/9135 (accessed on 28 November 2023).
- Martínez, J.A.; Arias, P.A.; Castro, C.L.; Chang, H.I.; Ochoa-Moya, C.A. Sea surface temperature-related response of precipitation in northern South America according to a WRF multi-decadal simulation. Int. J. Climatol. 2018, 39, 2136–2155. [Google Scholar] [CrossRef]
- Poveda, G. La Hidroclimatología de Colombia: Una síntesis desde la escala inter-decadal hasta la escala diurna. In Revista de la Academia Colombiana de Ciencias Exactas, Físicas y Naturales; Revista de la Academia Colombiana de Ciencias Exactas: Bogotá, Colombia, 2023. [Google Scholar]
- Poveda, G.; Mesa, O.; Agudelo, P.A.; Álvarez, J.F. Diagnóstico del Ciclo Diurno de la Precipitación en los Andes Tropicales de Colombia. 2002. Available online: https://www.researchgate.net/publication/233971633_Diagnostico_del_Ciclo_Diurno_de_la_Precipitacion_en_los_Andes_Tropicales_de_Colombia (accessed on 28 November 2023).
- Poveda, G.; Mesa, O.J. Feedbacks between Hydrological Processes in Tropical South America and Large-Scale Ocean—Atmospheric Phenomena. J. Clim. 1997, 10, 2690–2702. [Google Scholar] [CrossRef]
- Restrepo, J.C.; Ortíz, J.C.; Pierini, J.O.; Schrottke, K.; Maza, M.; Otero, L.; Aguirre, J. Freshwater discharge into the Caribbean Sea from the rivers of Northwestern South America (Colombia): Magnitude, variability and recent changes. J. Hydrol. 2014, 509, 266–281. [Google Scholar] [CrossRef]
- Du, J.; Kimball, J.S.; Galantowicz, J.F.; Kim, S.; Chan, S.T.K.; Reichle, R.H.; Jones, L.A.; Watts, J.D. Assessing global surface water inundation dynamics using combined satellite information from SMAP, AMSR2 and Landsat. Remote Sens. Environ. 2018, 213, 1–17. [Google Scholar] [CrossRef] [PubMed]
- Pekel, J.F.; Cottam, A.; Gorelick, N.; Belward, A.S. High-resolution mapping of global surface water and its long-term changes. Nature 2016, 540, 418–422. [Google Scholar] [CrossRef] [PubMed]


| Date | Season | Prograd Area [km2] | Eros Area [km2] |
|---|---|---|---|
| 20161214 | dry | 7.62 | 3.93 |
| 20170531 | wet | 5.87 | 7.60 |
| 20171221 | dry | 7.21 | 7.28 |
| 20180126 | dry | 7.22 | 6.14 |
| 20180526 | wet | 7.16 | 6.86 |
| 20190121 | dry | 7.26 | 7.26 |
| 20190614 | wet | 6.79 | 7.47 |
| 20200209 | dry | 7.66 | 6.85 |
| 20200527 | wet | 6.09 | 7.13 |
| 20210110 | dry | 7.06 | 6.28 |
| 20210627 | wet | 6.46 | 6.39 |
| 20220228 | dry | 6.88 | 7.96 |
| 20220511 | wet | 6.33 | 6.40 |
| 20230223 | dry | 7.29 | 7.37 |
| 20230530 | wet | 7.26 | 6.29 |
Disclaimer/Publisher’s Note: The statements, opinions and data contained in all publications are solely those of the individual author(s) and contributor(s) and not of MDPI and/or the editor(s). MDPI and/or the editor(s) disclaim responsibility for any injury to people or property resulting from any ideas, methods, instructions or products referred to in the content. |
© 2024 by the authors. Licensee MDPI, Basel, Switzerland. This article is an open access article distributed under the terms and conditions of the Creative Commons Attribution (CC BY) license (https://creativecommons.org/licenses/by/4.0/).
Share and Cite
Vásquez-Salazar, R.D.; Cardona-Mesa, A.A.; Valdés-Quintero, J.; Olmos-Severiche, C.; Gómez, L.; Travieso-González, C.M.; Díaz-Paz, J.P.; Espinosa-Ovideo, J.E.; Diez-Rendón, L.; Garavito-González, A.F.; et al. Detection of Coastal Erosion and Progradation in the Colombian ‘Atrato River’ Delta by Using Sentinel-1 Synthetic Aperture Radar Data. Remote Sens. 2024, 16, 552. https://doi.org/10.3390/rs16030552
Vásquez-Salazar RD, Cardona-Mesa AA, Valdés-Quintero J, Olmos-Severiche C, Gómez L, Travieso-González CM, Díaz-Paz JP, Espinosa-Ovideo JE, Diez-Rendón L, Garavito-González AF, et al. Detection of Coastal Erosion and Progradation in the Colombian ‘Atrato River’ Delta by Using Sentinel-1 Synthetic Aperture Radar Data. Remote Sensing. 2024; 16(3):552. https://doi.org/10.3390/rs16030552
Chicago/Turabian StyleVásquez-Salazar, Rubén Darío, Ahmed Alejandro Cardona-Mesa, Juan Valdés-Quintero, César Olmos-Severiche, Luis Gómez, Carlos M. Travieso-González, Jean Pierre Díaz-Paz, Jorge Ernesto Espinosa-Ovideo, Lorena Diez-Rendón, Andrés F. Garavito-González, and et al. 2024. "Detection of Coastal Erosion and Progradation in the Colombian ‘Atrato River’ Delta by Using Sentinel-1 Synthetic Aperture Radar Data" Remote Sensing 16, no. 3: 552. https://doi.org/10.3390/rs16030552
APA StyleVásquez-Salazar, R. D., Cardona-Mesa, A. A., Valdés-Quintero, J., Olmos-Severiche, C., Gómez, L., Travieso-González, C. M., Díaz-Paz, J. P., Espinosa-Ovideo, J. E., Diez-Rendón, L., Garavito-González, A. F., & Vásquez-Cano, E. (2024). Detection of Coastal Erosion and Progradation in the Colombian ‘Atrato River’ Delta by Using Sentinel-1 Synthetic Aperture Radar Data. Remote Sensing, 16(3), 552. https://doi.org/10.3390/rs16030552