Article

Individual High-Rise Building Extraction from Single High-Resolution SAR Image Based on Part Model

1
Aerospace Information Research Institute, Chinese Academy of Sciences, Beijing 100094, China
2
Key Laboratory of Technology in Geospatial Information Processing and Application System, Chinese Academy of Sciences, Beijing 100190, China
3
The School of Electronic, Electrical and Communication Engineering, University of Chinese Academy of Sciences, Beijing 100049, China
4
Key Laboratory of Digital Earth Science, Aerospace Information Research Institute, Chinese Academy of Sciences, Beijing 100094, China
*
Author to whom correspondence should be addressed.
Remote Sens. 2024, 16(7), 1278; https://doi.org/10.3390/rs16071278
Submission received: 1 February 2024 / Revised: 3 April 2024 / Accepted: 3 April 2024 / Published: 4 April 2024

Abstract

:
Building extraction plays an important role in urban information analysis, which is helpful for urban planning and disaster monitoring. With the improvement of SAR resolution, rich detailed information in urban areas is revealed, but the discretized features also pose challenges for object detection. This paper addresses the problem of individual high-rise building extraction based on single high-resolution SAR image. Different from previous methods that require building facades to be presented in specific appearances, the proposed method is suitable for extraction of various types of high-rise buildings. After analyzing the SAR images of many types of high-rise buildings, we establish a unified high-rise building part model, on the basis of a scattering mechanism of building structures, to describe the facade characteristics of high-rise buildings, including a facade regularity part, facade bright line part, double bounce part, and their spatial topological relationships. A three-level high-rise building extraction framework, named HRBE-PM, is proposed based on the high-rise building part model. At the pixel level, a modified spot filter is used to extract bright spots and bright lines of different scales simultaneously to obtain salient features. At the structure level, building parts are generated based on the salient features according to semantic information. At the object level, spatial topological information between parts is introduced to generate building hypotheses. We define two indicators, completeness and compactness, to comprehensively evaluate each building hypothesis and select the optimal ones. After postprocessing, the final high-rise building extraction results are obtained. Experiments on two TerraSAR-X images show that the high-rise building extraction precision rate of the HRBE-PM method is above 85.29%, the recall rate is above 82.95%, and the F1-score is above 0.87. The results indicate that the HRBE-PM method can accurately extract individual high-rise buildings higher than 24 m in most dense scenes, regardless of building types.

Graphical Abstract

1. Introduction

Synthetic aperture radar (SAR) plays an important role in earth observation because of its all-time and all-weather characteristics. In recent years, high-resolution (HR) spaceborne SAR sensors (e.g., TerraSAR-X [1], Cosmo-SkyMed [2], and GaoFen-3 [3]) have acquired a large number of SAR images with meter or submeter resolutions, which are widely applied to urban information extraction, such as road detection [4,5], building footprint extraction [6], 3D reconstruction [1,3], building change detection [7], and damage assessment [2,8]. Building extraction is a key step of urban information analysis, which is helpful for urban planning and disaster monitoring. Therefore, building extraction via HR SAR images has been studied extensively. However, this is still an open challenge considering the side-looking geometry of SAR images, characteristics of HR SAR images, and the complex environment of urban scenes.
At present, there are two research interests in building extraction. The first is to extract the building distribution area. By analyzing the statistical characteristics of building SAR amplitude images [9,10,11,12], or learning features of build-up areas through neural networks [13,14], we can determine whether a certain pixel belongs to the building area or not. This method can produce macro-statistics on the development trend of the city, and can also be used for change detection. The other is the extraction of individual buildings [15,16], which can not only obtain the segmentation results of each pixel, but also separate the individual building instances. This is the basis for further obtaining building heights, analyzing building distribution characteristics, etc., and is conducive to obtaining detailed building information. The example of these two research interests is referred to [16]. In this paper, we are interested in extracting multiple types of individual high-rise buildings with dense distribution.
High-rise buildings are an important part of the city and can bring significant social and economic benefits. In China, high-rise buildings refer to residential buildings of more than 10 floors and other civil buildings over 24 m [17]. The extraction of individual high-rise buildings helps to assess the urban development level. Gou et al. [18] detected high-rise buildings based on the local frequency analysis of the layover fringe patterns of InSAR images under the assumption of a rectangular shape. Liu et al. [19] extracted the potential layover areas of high-rise buildings based on the results from an InSAR analysis. Sun et al. [16,20] extracted individual high-rise and low-rise buildings in large scenes successfully based on a neural network by introducing DEM and GIS data. These methods require multi-view images or auxiliary data. The need for a variety of data limits their application and is not suitable in emergency situations. To solve the above problem, building extraction based on a single high-resolution SAR image has attracted more and more attention because of the rich information contained in HR SAR images. In HR SAR images, high-rise buildings usually appear as a combination of discrete highlights and bright lines, which is obviously different from low-rise or large buildings and brings big challenges to building detection and extraction. By comparing simulated SAR images of high-rise buildings with real SAR images, Gernhardt et al. [21] demonstrated that the regular bright spots appearing in layover areas mainly come from corner reflectors of the building facades. Aure et al. [22] and Chen et al. [23,24] extracted and grouped the regularly distributed bright spots on facades to detect high-rise buildings, but this method requires that the building facades strictly conform to a specific pattern of bright spots evenly distributed in range and azimuth direction. Tang et al. [25] detected corner lines along the range direction and corresponding double bounce lines, then analyzed the facade texture to extract high-rise buildings. However, this method only works for layover areas with bright lines.
Different from the existing high-rise building extraction methods in the literature that are only effective for certain high-rise building types, we propose a method suitable for multiple types of high-rise buildings. There are three challenges. Firstly, the improvement in resolution makes the layover area of high-rise building no longer appear as a whole in SAR images, but discretely as a combination of bright spots and bright lines. Secondly, the structure of high-rise buildings is related to their functions, and they differ greatly from each other. This results in the instability of the combination pattern of bright spots and bright lines of high-rise buildings in SAR images. In addition, the occlusion of corner structure will also affect the expression of the regularity of the facade. Thirdly, high-rise buildings are usually densely distributed and may block each other. Roads, trees, and other objects also increase the complexity of the urban scene. To solve the above three problems, we adopt the following methods. Firstly, for the problem of object discretization under HR SAR images, an object description method based on local features is used to extract each component of the target, respectively, and then combine them into the final result. The part model can realize this function well. Since the part model was proposed [26,27], it has been widely used in the automatic target detection field. Tian et al. [28] treated the vehicle as an object composed of multiple salient parts and constructed a probabilistic graph to detect and track vehicles. Yang et al. [29] represented separated targets by a part model and combined them to detect targets. The part model can effectively describe characteristics of different parts within the target and their spatial position relationships, so it is suitable for complex target detection with spatially spread parts. Secondly, to accurately extract various types high-rise buildings from HR SAR images, we establish a unified part-based model for the description of high-rise building amplitude characteristics, which is easy to understand and detect, but also has adaptability to different types of high-rise buildings. Thirdly, to reduce the interference of adjacent buildings, we set rules to generate a variety of building hypotheses, and use the completeness indicator and compactness indicator to measure the building hypotheses to obtain optimal high-rise building extraction results.
This paper studies high-rise buildings whose facades appear as bright spots and bright lines, which are also common characteristics of high-rise buildings in HR SAR images. A high-rise building part model considering the scattering mechanism of building structures is constructed to describe the amplitude features of high-rise buildings in HR SAR images. And then a three-level framework based on the part model is proposed to generate high-rise building hypotheses. Finally, we choose the optimal building hypotheses, under an evaluation system of completeness and compactness indictors, as the extraction result of high-rise buildings. Compared with the existing method, the proposed method is effective for various types of high-rise buildings and suitable for more scenes.
The remainder of this paper is organized as follows. In Section 2, we analyze the scattering properties of high-rise buildings and construct the high-rise building part model. In Section 3, the high-rise building extraction method based on the part model is presented in detail. In Section 4, five datasets from two TerraSAR-X images with different resolutions and optical images used are described, then the extraction results, qualitative and quantitative analysis, and the parameter settings are shown. In Section 5, we discuss the advantages and restrictions of the proposed method, and give possible future research directions. Finally, the conclusions are presented in Section 6.

2. Scattering Property Analysis and Part Model Construction

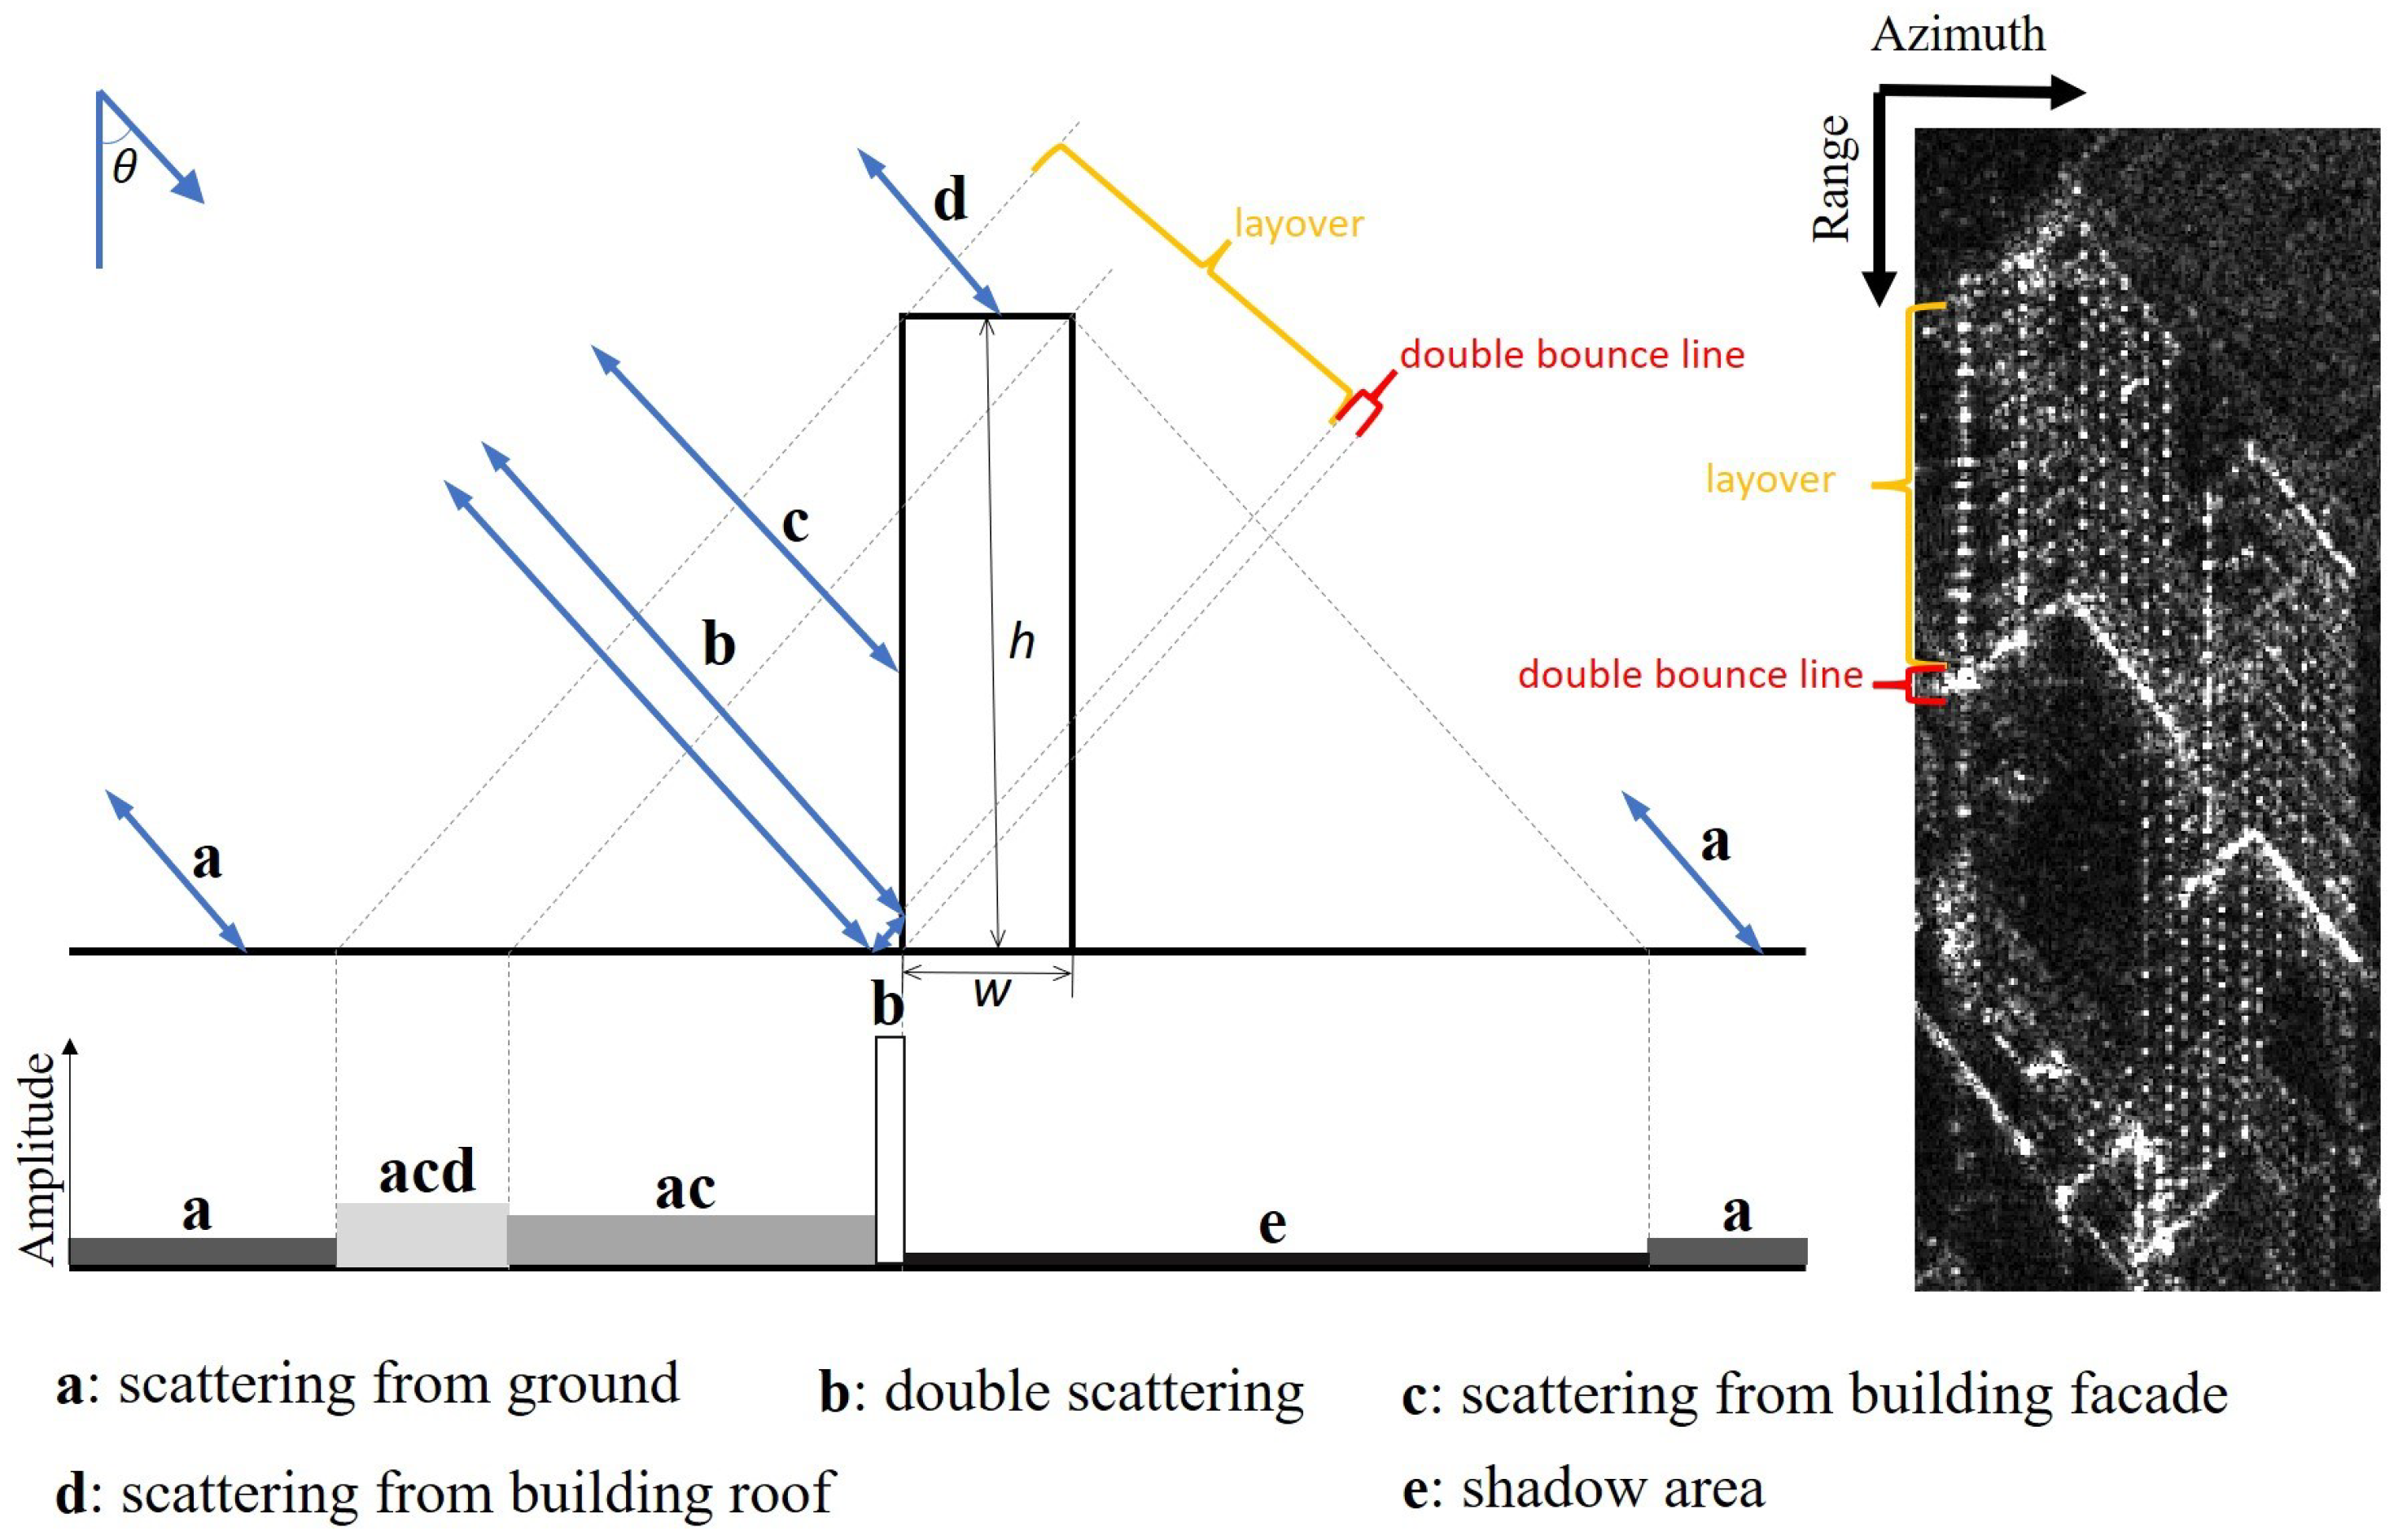
2.1. Scattering Properties of High-Rise Building

In SAR amplitude images, the typical features of buildings are layover, double bounce, and shadow effects arising from the side-looking viewing geometry and ranging properties of SAR sensors [30,31]. For better illustration, Figure 1 gives an example of the backscattering range profile of a simple high-rise building model, which is a rectangular box with width w and height h, being illuminated by radar at incident angle θ . The SAR image on the right gives an example of a high-rise building. In the diagram, a shows returns from ground, b denotes the double bounce backscattering caused by the dihedral formed between the bottom wall of the building and the surrounding ground, c represents the single scattering from the facade of the building, d indicates signals from roof, and e is the shadowing area formed by occlusion. The bottom of Figure 1 shows the relative amplitude of high-rise buildings of different areas in SAR images, and the lighter the color, the higher the amplitude. Considering the height of high-rise buildings, we generally have h w · tan θ , so the layover area is located at the near range end while the double bounce area is located at the far range end [31]. In this figure, acd represents signals returned from the ground, facade, and roof of the building, and ac denotes backscattering from the ground and building facade. In the case of high-rise buildings, the roof signal is usually not obvious and is submerged in the layover area [6]. Due to the double bounce scattering, the dihedral angle formed by the facade–ground intersection is usually imaged as a bright line with significantly high value [32], which can be used as important evidence for building detection [6,33]. But the performance of the double bounce line is influenced by many factors such as building height and orientation [30,31,34,35]. Shadow areas are formed due to buildings blocking radar rays. They usually appear as black areas with low amplitude and can be used for building information inversion [36,37]. However, in dense high-rise building areas, shadows are usually affected by adjacent buildings and difficult to detect.
From the above analysis, the layover area and the double bounce line are significant features of high-rise buildings in HR SAR images and can be used for high-rise building extraction.

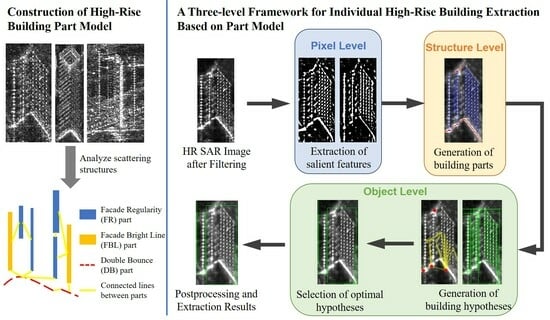
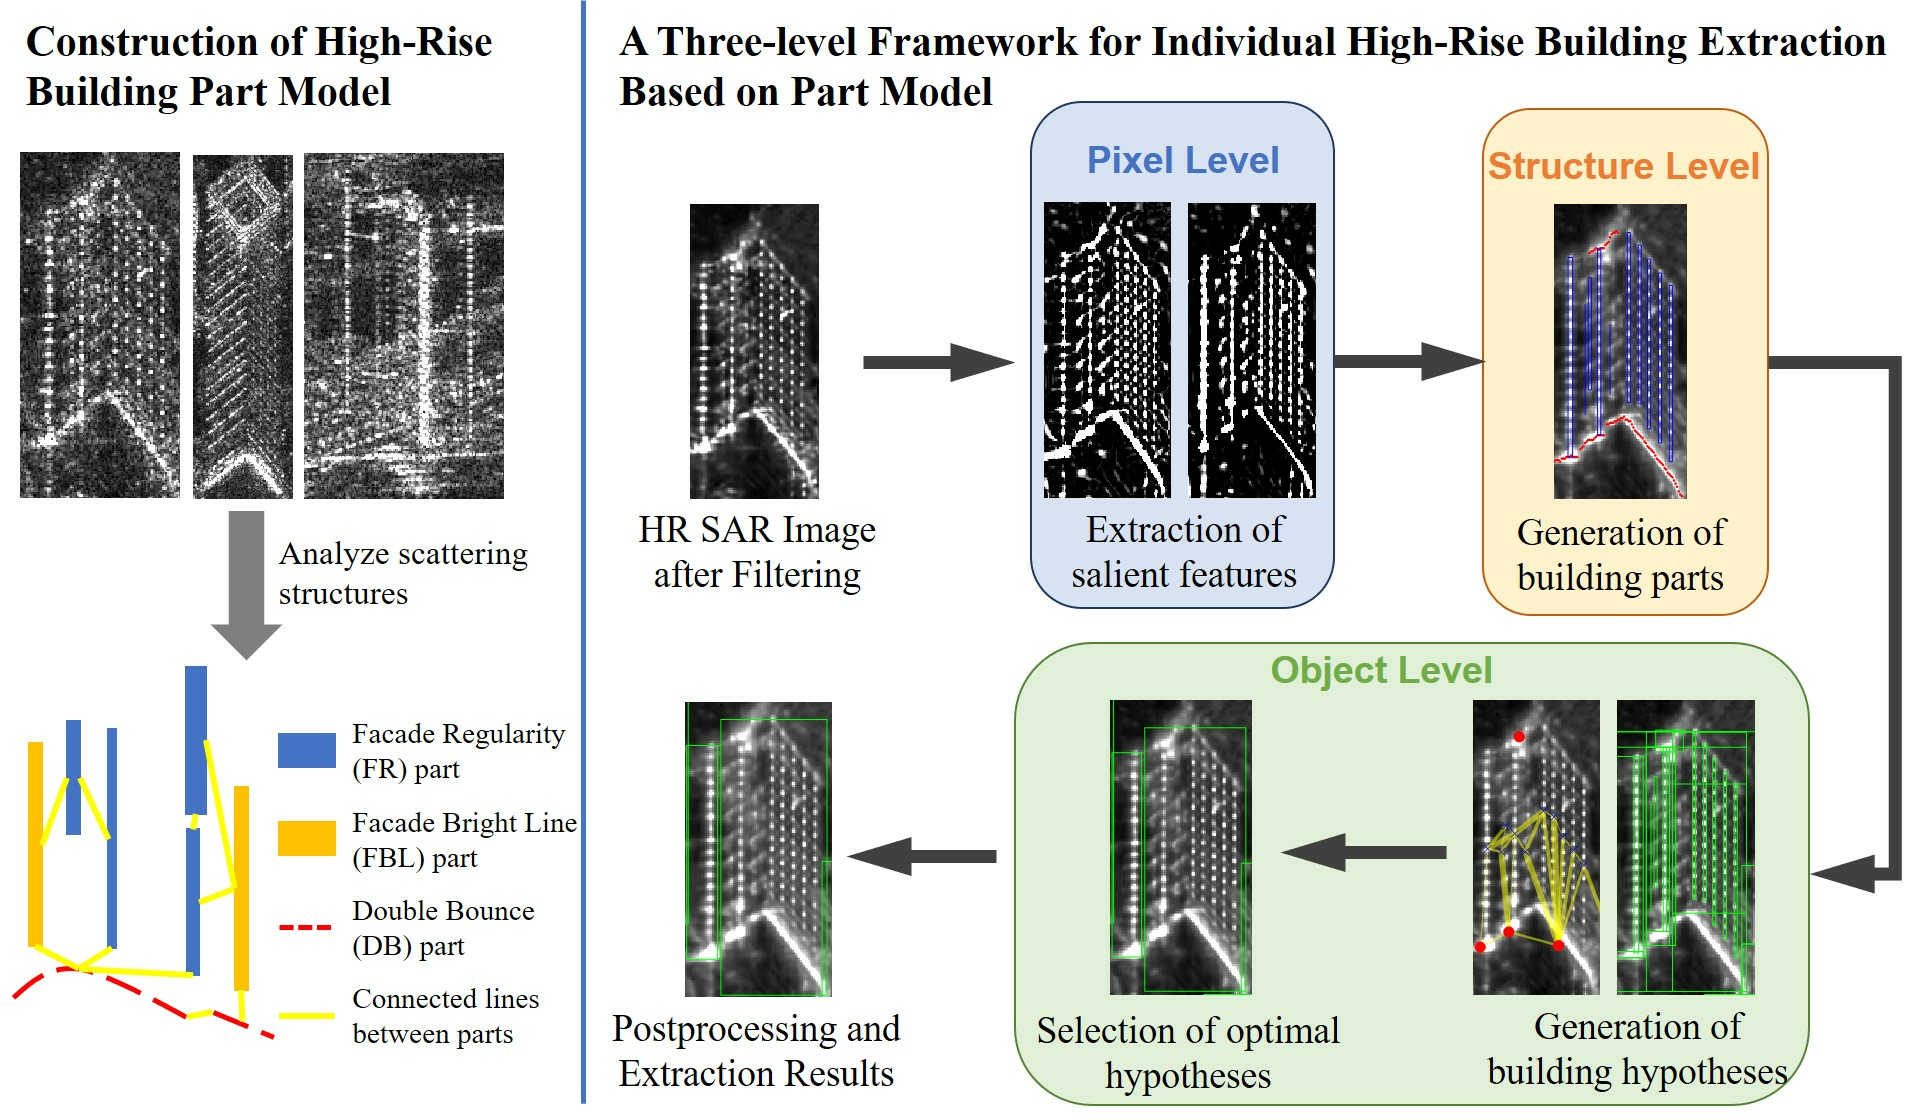
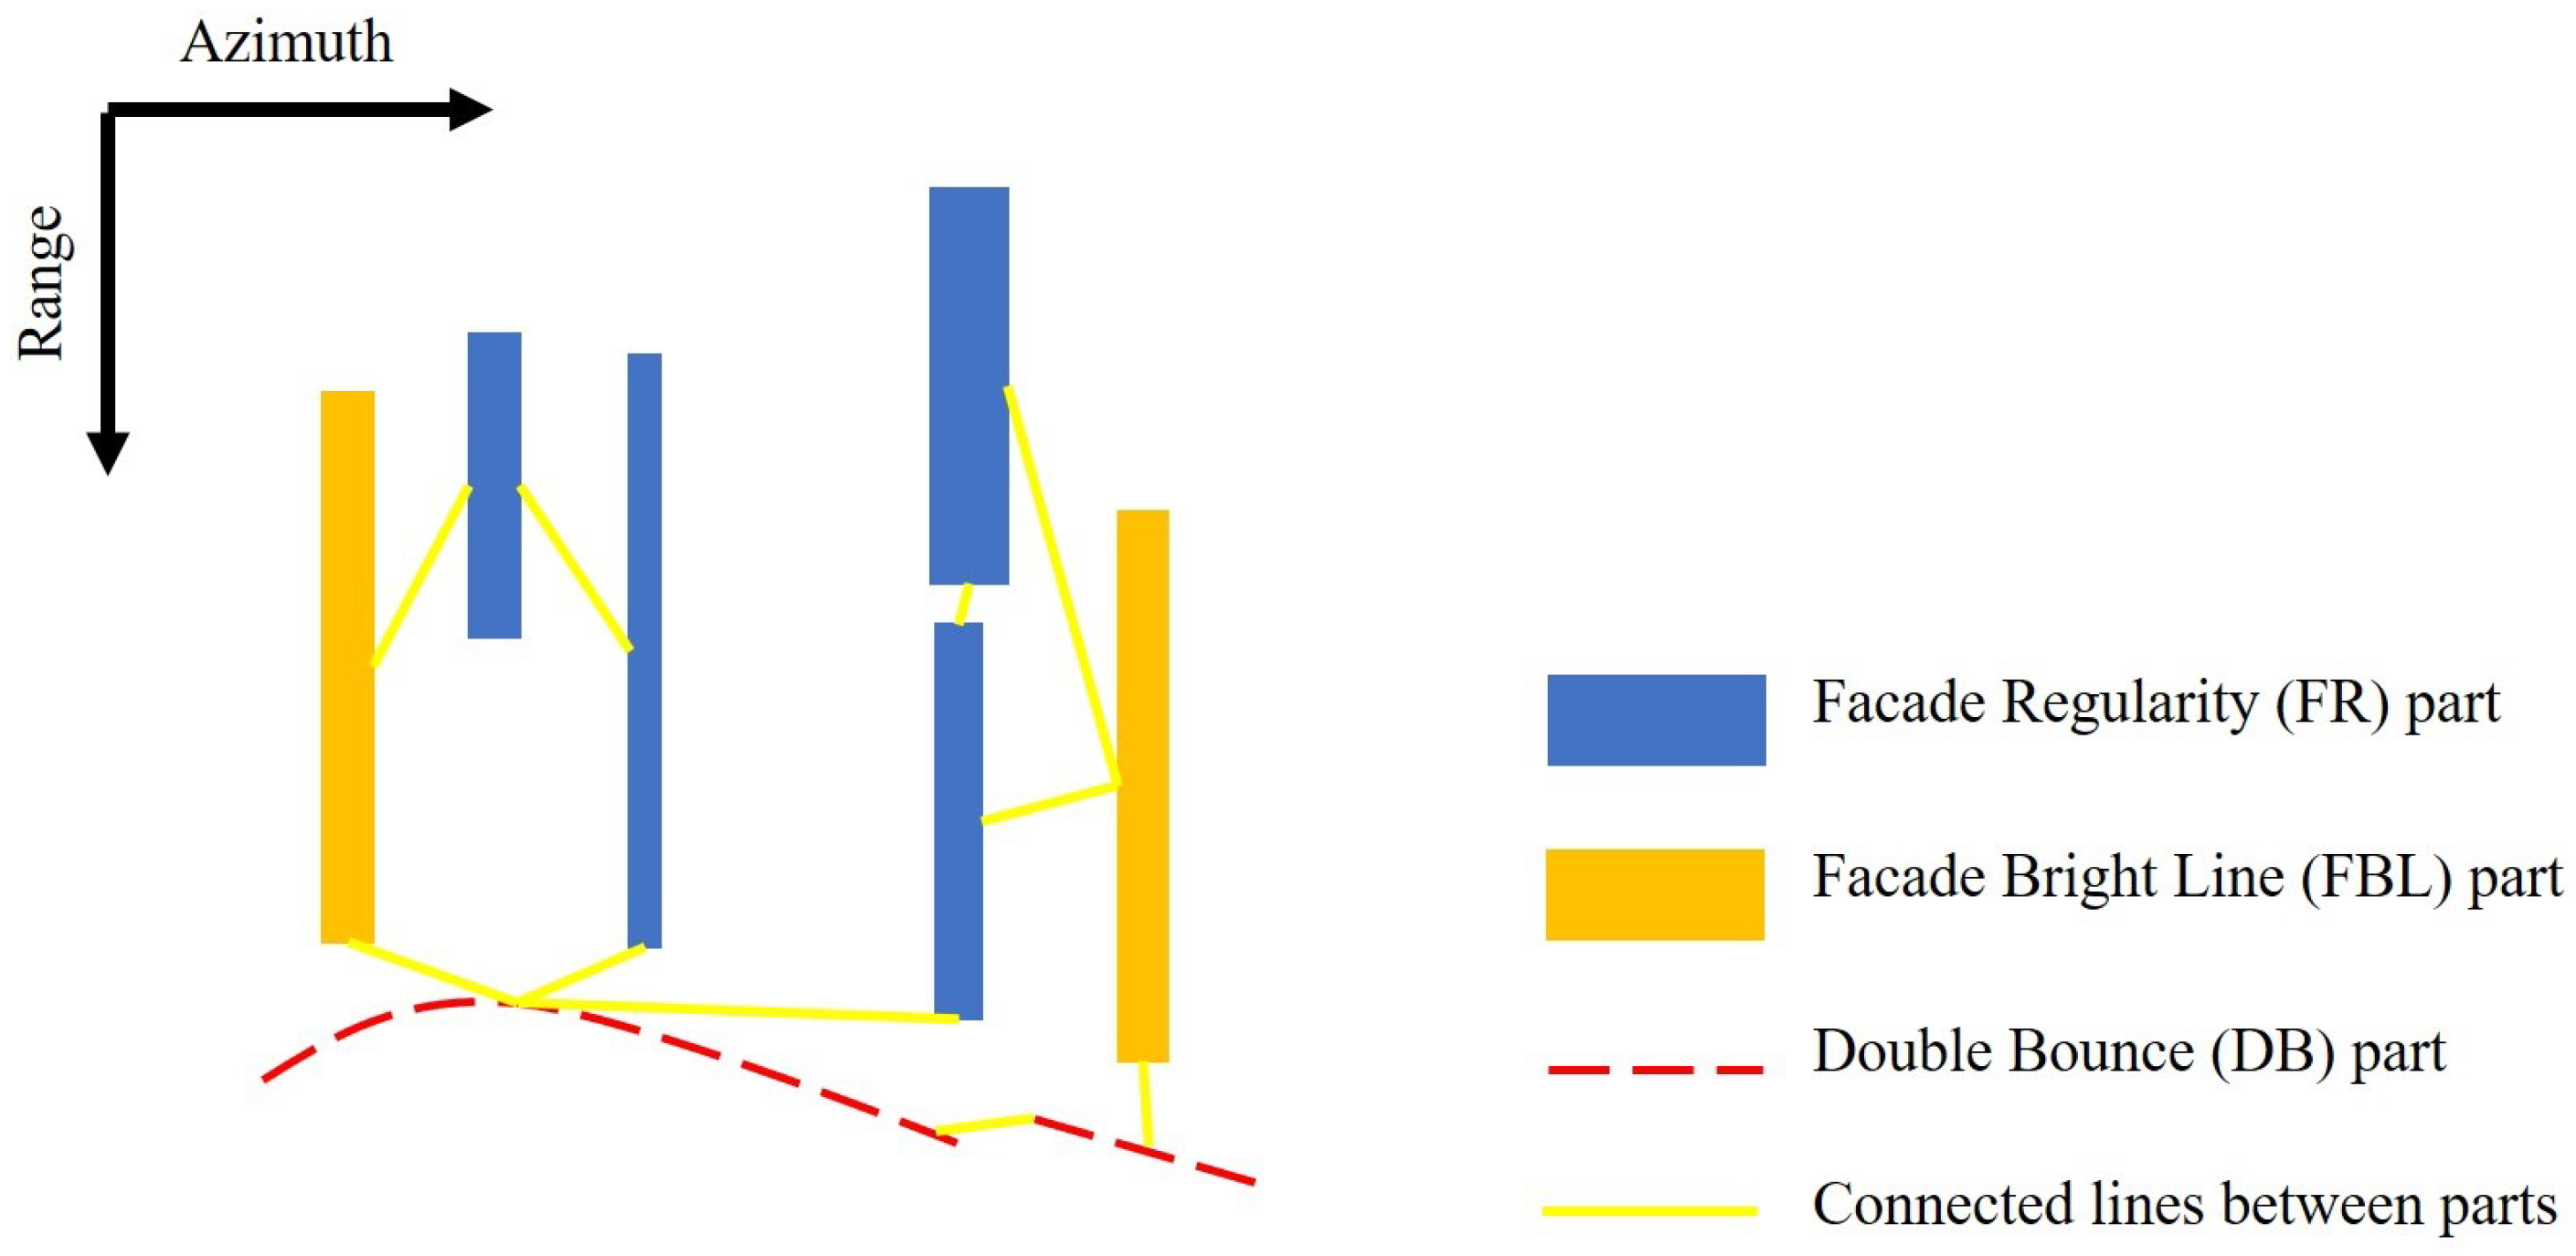
2.2. Construction of High-Rise Building Part Model

In this section, a unified part model, named high-rise building part model, is established to describe the significant amplitude features of high-rise buildings in HR SAR images. The model consists of three kinds of parts and the relative spatial relationships between them. Figure 2 shows a schematic diagram of the model. Three kinds of parts are represented by different colors, and the yellow lines denote the connected lines generated by relative positions of these parts. The analysis and construction process of this model and its specific meaning will be explained in detail next.
In the literature, some part models can be built by learning object properties from images [26,27], which can adapt well to different object types but requires more data for training. Other part models are established by analyzing the characteristics of different parts within the object [28,38], in which case the generated model is fixed and is not suitable for multiple objects. High-rise building part model construction through learning needs a lot of data. Simulation is a possible solution [39,40,41]. However, the complexity of the urban environment and the diverse types and dense distribution of high-rise buildings can hardly be reflected by the current SAR simulation technology [42]. In addition, the interpretability of parts generated by learning may require further study. So, in this paper, we did not choose to build part models through learning, but manually constructed the part model, including the meaning of each part and the spatial topological relationships between them, by analyzing the scattering structures and scattering performance of different types of high-rise buildings in HR SAR images. This enables each part to have a clear semantic meaning, which is easy to understand, and is also conducive to part extraction and the generation of building hypotheses in the next step.
Based on the analysis of scattering properties of high-rise buildings in Section 2.1, we mainly focus on the layover areas and double bounce bright lines. The layover area contains rich information about the structure of building facades. Studies have shown that approximately 50% of long-term coherent scatterers in urban areas are related to building facade [43]. The dihedral and trihedral angles formed by structures, such as windows and balconies, that appear regularly on each floor of the high-rise building facade can cause strong backscattering [21], which appears as discrete bright spots and bright lines in SAR images. Figure 3 shows the SAR images and corresponding optical images of eight types of high-rise building. The range and azimuth resolution of SAR images in Figure 3a–e are 0.58 m and 1.1 m, and the range and azimuth resolution of Figure 3f–h are 0.58 m and 0.23 m, respectively. The shooting angle of high-rise buildings in the optical images is similar to the incident angle of SAR. The footprint of Figure 3a–d is rectangular. In addition to the shops on the first floor, the building in Figure 3a has 16 floors, corresponding to the 16 bright spots along the range direction in the SAR image, indicating that the windows on each floor form an effective scattering structure. The five columns of bright spots along the azimuth’s longer side correspond to the five columns of narrow raised structures on the building facade. In Figure 3b, the building facade has many narrow protruding structures, which form good scattering structures with the windows, creating highlights on the layover under SAR irradiation. It is worth noting that there is one protruding structure every two floors, so the distance between two bright spots along the range direction is the height of two floors. The layover areas in Figure 3c,d are represented as bright lines distributed regularly along the range direction in SAR images. The number of bright lines in Figure 3c is the same as the number of protruding structures on the building facade, with one present on every two floors. The right side of the building in Figure 3d is slightly different from the left side. The right side of the facade is more convex relative to the window plane than the left side, so it appears as an obviously brighter line in the SAR image. The distance between bright lines is one story high. Figure 3e–h have a more diverse footprint. The footprint of Figure 3e is an ellipse. The radar illuminates from the direction perpendicular to the minor axis. No strong echoes are received from the plane facing the radar, but the echoes from the facades on both sides are accumulated to form bright lines with high intensity. The footprint of Figure 3f is a thick cross shape and the facade facing the radar is shown in the optical image. It appears as a combination of regular highlights and bright lines in the SAR image. The highlights are caused by the windows or balconies on each floor, and the bright line is formed by the accumulation of echoes scattered by the facade parallel to the radar illumination direction. Some floors may block the scattering structure, so the regular bright spots are not always continuous. The footprint of Figure 3g is somewhat like a thick “T” shape, and the facade facing the radar is shown in the optical image. The performance of Figure 3g on SAR images is similar to Figure 3f, but the scattering characteristics of the bottom of the building are affected by the trees distributed on nearby roads. The footprint of the Figure 3h is a complex polygon. The radar-facing facade can be divided into four areas, which have diverse appearances in the SAR image due to differences in local incidence angles. Regularly distributed bright spots can be seen in the first and third areas, while the second and fourth areas have no obvious scattering characteristics. Furthermore, the dihedral angle formed by the bottom facade of buildings and the surrounding ground cause multiple scatterings under radar illumination, which manifest as thicker and brighter lines along the azimuth in SAR images. This is clearly visible in Figure 3a–d,f,h; because of the complex structure, Figure 3e does not form double bounce, and due to the obstruction of trees, the double bounce line in Figure 3g is not obvious enough.
Based on the above analysis, considering the building structure and its scattering performance on SAR images, we define the high-rise building part model. It can be seen that building facades usually appear as regularly distributed bright spots and bright lines, which are related to the regular structures of each floor of the building facade, such as windows, balconies, protruding structures, etc., so this part is defined as the facade regularity (FR) part. The bright lines distributed along the range are formed by the accumulation of echoes returned from the facades nearly parallel to the radar illumination direction, or may also be formed by building corner lines. This part is defined as the facade bright line (FBL) part. The thicker and brighter lines distributed along the azimuth formed by multiple scattering at the bottom of the building are defined as the double bounce (DB) part. Moreover, both the FR parts and the FBL parts are in the layover area. Under the side-looking geometry, the layover area is closer to sensors relative to the double bounce area, so we can obtain the spatial topological relationship between the parts, that is, the FR parts and the FBL parts of the same building are usually located at the near range end relative to the DB parts. Furthermore, the FR parts and FBL parts of the same building are distributed in the same range band, while the facade parts and the DB parts are in the same azimuth band. One or more parts that satisfy the above relative spatial relationships under pre-set thresholds form a building hypothesis. It should be noted that a high-rise building does not have to possess the above three parts at the same time, but should possess at least one facade part to reduce the false alarm rate.
Based on the definitions of the part model, we can describe most high-rise buildings with obvious facade features. Unlike existing algorithms that require fixed facade regular patterns [22,23,24,44] or require facades to appear as bright lines [25], this algorithm can more flexibly meet the needs of extracting various types of high-rise buildings.

3. High-Rise Building Extraction Method Based on Part Model

In this article, we propose an individual high-rise building extraction method, named HRBE-PM, which is suitable for a single SAR image with meter or submeter resolution. The building facade, that is, the layover area, should be characterized by obvious features, such as highlights or bright lines. The building height that can be detected must be greater than 24 m. The HRBE-PM method does not impose requirements on the type and spatial distribution of high-rise buildings, but the detection effect would be better in high-rise building areas with simple types and independent distribution.
The proposed HRBE-PM method is mainly divided into six steps and is performed at three levels. The flowchart is shown in Figure 4. First, filtering is performed to reduce the impact of noise. At the pixel level, we operate on pixels to obtain salient point and line features using modified spot detector. At the structure level, we operate on the salient features to generate building parts based on semantic information. At the object level, we combine the building parts based on the topological relationships between them to generate building hypotheses. And then an evaluation system including a completeness and compactness indictor is constructed to select the optimal high-rise building hypotheses. Each step will be explained in detail below.

3.1. Non-Local Filtering

Speckle noise is the inherent multiplicative noise of SAR images [45,46], which affects the interpretation of SAR images. Considering the large amplitude range and rich detail information of urban areas, this paper adopts a non-local filtering algorithm [47], which can better filter the noise while preserving the details of the building structure.

3.2. Extraction of Salient Features

As can be seen from the analysis in Section 2.2, the salient features of buildings in SAR images include bright spots of different sizes and bright lines of different widths and directions. We extract these features by modified spot filter in this step. The spot filter [48,49] is a robust point feature detector that can be used in SAR images. Figure 5a shows the mask of this filter in the case of three shells. The numbers at each point represent the distance from the center point. The center of the filter is moved on to each pixel of the image and for each surrounding shell, the maximum intensity value is determined. The difference between the intensity of the center pixel and the minimum of these maximum values gives the output value for the center pixel, and then a threshold is set for feature extraction. The spot filter can detect point targets of different sizes, and the detectable size depends on the number of shells. However, this detector has poor performance on line features. This paper adjusts the spot filter to achieve simultaneous detection of points and lines of different scales. Figure 5b shows modified spot detector s 0 for bright lines of 0 , in other words, horizontal lines. The gray background indicates the pixels involved in the calculation. The maximum width of the line that can be detected is related to the number of shells. Figure 5c–e are s 90 , s 45 , and s 135 , respectively, with subscripts denoting the angle of detectable lines. In addition to lines, this detector can also work on points. To sum up, the modified detector is valid for bright spots of different sizes and bright lines of different widths and directions at the same time, meeting the needs of detecting salient features of high-rise buildings under HR SAR amplitude images.
In order to facilitate part extraction, we fuse the detection results of the s 0 , s 45 , and s 135 filter to obtain S 1 , and the s 90 filter result is defined as S 2 . For each pixel ( r , a ) , with r denoting range position and a denoting azimuth position,
S 1 ( r , a ) = max ( s 0 ( r , a ) , s 45 ( r , a ) , s 135 ( r , a ) )
S 2 ( r , a ) = s 90 ( r , a )
Then, set threshold T s for salient feature extraction.

3.3. Generation of Building Parts

According to the semantic information, we generate the FR parts and DB parts from S 1 , and generate the FBL parts from S 2 in this step.

3.3.1. Generation of FR Parts

Figure 6 shows a schematic diagram of the generation of FR parts. The scattering structure on each floor of the building may be affected by occlusion, deletion, etc., and the shapes of the bright points and bright lines of every floor displayed on the image are not exactly the same. Therefore, we select the midpoint of the range direction of the salient features to analyze the facade regular pattern, as shown in Figure 6a. Firstly, candidate points of FR parts are determined through voting. Select a point ( r , a ) , count the number of midpoints N within the range [ r L r a n g e 2 , r + L r a n g e 2 ] under a, and calculate the spacing interval I n ( n = 1 , 2 , N 1 ) between these points. Find the mode I m o d e among I n as the interval of this set of data, and count the number of points N u m that meet this interval (an error of 1–2 pixels is allowed). If N u m 4 and N u m N 0.5 are satisfied, the point ( r , a ) is considered to be a candidate point of the FR part and record I m o d e as an interval, as shown in Figure 6b. Then, range grouping is carried out from the near range end to the far range end, as shown in Figure 6c. Select a point ( r , a ) to detect whether there is a candidate point within the interval length, that is, whether there is a candidate point in [ r + I m o d e 1 , r + I m o d e + 1 ] under a. If so, add this point to the range group, and set the interval as the mode of the existing point intervals. The new point is used as the benchmark to continue to detect the next point until no candidate points are continuously detected in two intervals. Then, start azimuth grouping from one side to the other, as shown in Figure 6d. Select a point ( r , a ) , and if there is a candidate in [ r 1 , r + 1 ] under a + 1 , add this point to the azimuth group. Repeat the above process until no candidate points are detected. Finally, the points belonging to the same range group and azimuth group are integrated into a group to obtain the final FR part extraction result, as shown in Figure 6e. Figure 6f shows the extracted five FR parts of the facade. The parts are represented by blue boxes, and the magenta points are the regular points participating in the grouping of parts.

3.3.2. Generation of DB Parts

The DB parts are related to the orientation of the building, so the direction is not fixed. Due to the accumulation of multiple scattering energy, DB parts are usually wide in the range direction and have high amplitudes. In the S 1 filtering result, the region with a range width greater than R d b is selected as the DB part.

3.3.3. Generation of FBL Parts

FBL parts are usually related to the building height and are very long along the range direction in the amplitude image due to the energy accumulation. In the S 2 filtering result, set the region whose range width is greater than R f b l as the FBL part.

3.4. Generation of Building Hypotheses

Based on the generated building parts, we introduce spatial topological information between parts to generate building hypotheses in this section. According to analysis, a high-rise building usually consists of multiple FR, FBL, and DB parts. The FR and FBL parts of the same building are distributed in the same range band, the facade parts and the DB parts are distributed in the same azimuth band, and the facade parts are located at the near range end relative to the DB parts. For the sake of presentation, the graph structure is chosen to illustrate parts and their relationships. Define nodes of the graph as parts, edges as the connection relationship between parts, and weight of edges as the distance between parts. Firstly, we need to calculate the connection relationships between parts that may belong to the same building, as shown in Figure 7. Construct the adjacency matrix A b f to describe the connection relationship between the facade part and the DB part. Detect whether there is a facade component within L b f from each DB part to the near range end, as shown in Figure 7a. If it exists, calculate the shortest distance D b f between them, and set the corresponding edge of A b f as D b f . The adjacency matrix between the DB parts is defined as A b b . The existence of DB parts is detected from each DB part to the far range direction and increasing azimuth direction within L b b , as shown in Figure 7b. If present, the shortest distance D b b between them is recorded in the corresponding position of A b b . Similarly, the relationship adjacency matrix between facade parts is A f f . Detect from each facade part to the increasing range and azimuth direction within L f f , as shown in Figure 7c. If there is a facade part, the shortest distance is recorded in A f f . Through the above three different types of edges, we define the connection relationships between different parts.
The existence of an edge between part nodes means that there may be a connection relationship, so a connected subgraph can be regarded as a high-rise building. However, parts between two close buildings will also generate edges due to meeting distance requirements, causing two adjacent buildings to be detected as one building. Therefore, we need to set distance thresholds for different types of edges on the graph and then generate possible building hypotheses based on connected subgraphs. To generate all building hypotheses, in principle, we need to set a threshold for each distance value, that is, generate all possible subgraphs, but this generates too many subgraphs. To avoid this, three thresholds are set for each type of edge to control the number of building hypotheses generated while being able to generate as many hypotheses as possible. Figure 8 shows some rules of combination of adjacent matrices for building hypothesis generation, where A b f 1 represents the adjacency matrix composed of all edges less than L b f 3 in the A b f matrix, and so on for other matrices. Based on the combination of facade parts and DB parts, the generation of building hypotheses is divided into the following situations:
(a)
All the parts themselves can be seen as hypotheses.
(b)
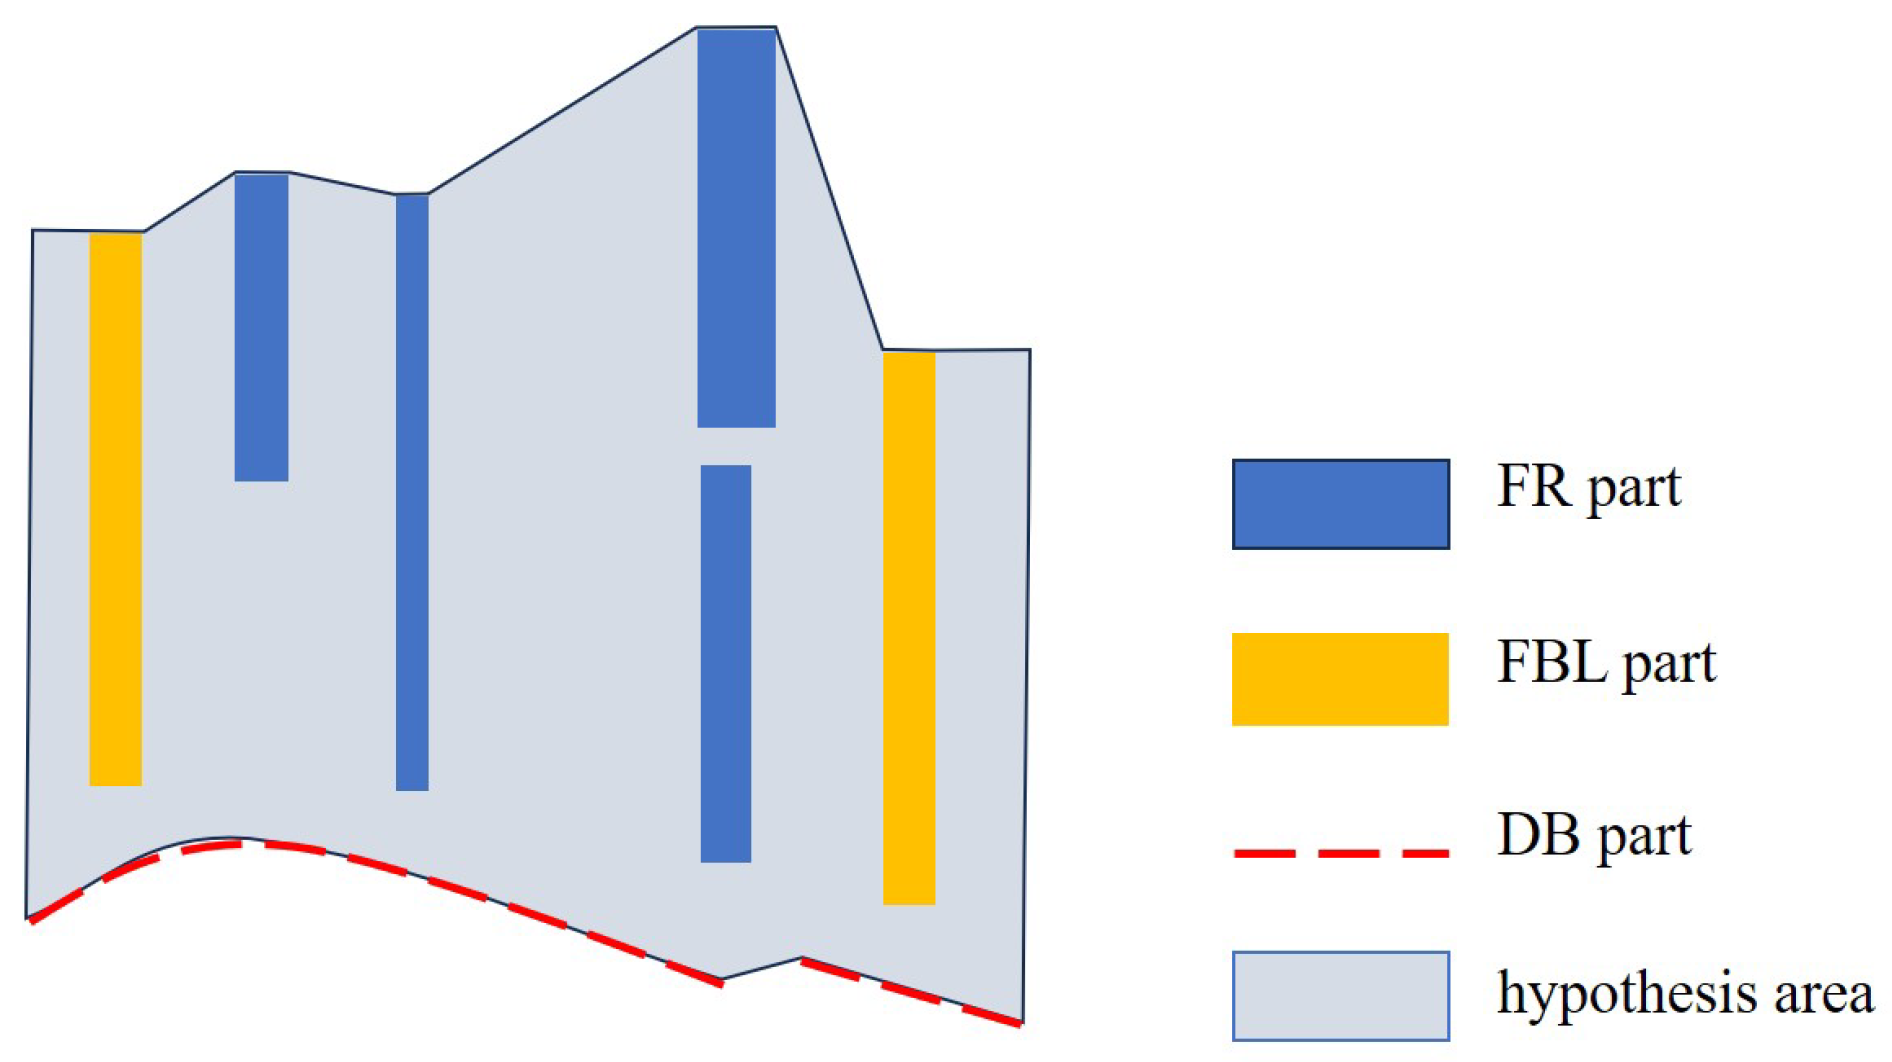
Introduce edges of facade and DB parts, saved in A b f . As shown in the blue part in Figure 8, the connected subgraphs corresponding to the adjacency matrices under three thresholds are calculated to obtain building hypotheses.
(c)
Introduce edges of DB parts, stored in A b b , on the basis of step (b). The rules are shown in the orange part of Figure 8. For example, A b f 1 + A b b 1 means that the edges in A b f that are less than L b f 3 and the edges in A b b that are less than L b b 3 together form an adjacency matrix, and the connected subgraph obtained thereby obtains the building hypotheses. It should be noted that the distances between the DB parts are shorter than the edges of facade and DB parts.
(d)
Introduce edges between facade parts, recorded in A f f , on the basis of step (b). As shown in the green part in Figure 8, the connection subgraph is generated in a similar way to step (c).
All possible building hypotheses are generated by integrating the hypotheses in the above four cases.

3.5. Selection of Optimal Hypotheses

We measure the generated building hypotheses with two criteria to select the optimal hypotheses. To guarantee the structural integrity of buildings, the criterion S c o m p l e t e is defined, relating to the number of edges between parts. A building hypothesis usually contains multiple edges with different weights, which indicate the distance between parts. The more complete the building, the more parts it contains, the more connecting edges between parts and the higher S c o m p l e t e . We use a generic sigmoid function [6] to define the score s i for each edge i:
s i = 1 1 + e α d ( d i d 0.5 )
α d = l n ( 1 0.99 1 ) d 0.99 d 0.5
where d i indicates the distance between parts, in other words, weights of edges, s ( d 0.5 ) = 0.5 and s ( d 0.99 ) = 0.99 . The function s ( d i ) gives values in the rage ( 0 , 1 ) . For each kind of edge, two parameters need to be specified: the value of d 0.99 for which s i returns a high score 0.99 , and d 0.5 corresponding to the center of the sigmoid, implicitly setting the slope of the function. Figure 9a shows an example of the sigmoid. With this function, we convert the large range of d i to ( 0 , 1 ) . Then, the scores of the edges involved in each hypothesis are added to obtain the score of each hypothesis ( s i ) . To better balance with another indicator, we use the exponential function to convert this score value to range ( 0 , 1 ] , and we obtain S c o m p l e t e :
S c o m p l e t e = 1 e γ · ( s i )
where γ is a parameter that adjusts the slope of the curve. Figure 9b shows the function when γ = 0.2 .
In order to separate adjacent buildings, we define S c o m p a c t to describe the compactness of parts involved in a building:
S c o m p a c t = A f a c a d e A a l l
where A a l l is the hypothesis area, and A f a c a d e is the facade area. The definition of S c o m p a c t is shown in Figure 10. The hypothesis area A a l l is the polygonal area formed by the outer contours of the parts that make up the building hypothesis. Nulls between part vertices are interpolated. The facade area A f a c a d e is the sum of the facade part areas. If a hypothesis includes two adjacent buildings, the S c o m p a c t of the hypothesis will be lower than the S c o m p a c t of a single building hypothesis.
The final building hypothesis score is:
S = β · S c o m p l e t e + S c o m p a c t
where β is the parameter adjusting the ratio of the two indicators. The larger the score S, the more credible the building hypothesis is. According to the generated graph in Section 3.4, the entire SAR image is divided into multiple maximum connected subgraphs, and each connected subgraph contains at least one high-rise building. For a maximum connected subgraph, the scores S of all the building hypotheses involved are sorted from large to small, and the optimal building hypotheses are determined according to this sorting. It is particularly important to note that the same part cannot appear in two buildings at the same time. Therefore, the building hypothesis with a smaller score needs to be compared with the already determined building hypotheses with larger scores. If a part conflict occurs, the hypothesis with a smaller score will not be accepted and the next hypothesis will be verified. Until all the building assumptions in the ranking are verified, we obtain the optimal building hypothesis selection results.

3.6. Postprocessing

Since the optimal building hypothesis selection does not consider the nature of the building itself, postprocessing is required to make the high-rise building extraction results more reasonable. We perform postprocessing from the following aspects:
(a)
Remove building hypotheses that contain only DB parts, because these may be bright lines formed by roads or low-rise buildings.
(b)
Remove building hypotheses that are less than 24 m in range direction and less than 3 m in azimuth direction. This considers the definition of high-rise buildings. However, since the building orientation will affect the azimuth size of them, we set a smaller threshold to avoid missed detections.
(c)
Remove hypotheses that are spatially fully subsumed by other building hypotheses. This is usually due to the building facade part being located further away from other parts and not being accepted as a part of the whole building. However, from a spatial perspective, it is very difficult to detect a completely blocked building, so it is removed.
After the above postprocessing, we obtained the final results of high-rise building extraction.

4. Experiments

4.1. Dataset Description

We choose two TerraSAR-X images to test the effectiveness of the proposed method. The fist scene has been acquired in HS (High-Resolution Spotlight) mode in Beijing, China, with a resolution of 0.58 m × 1.1 m (slant range × azimuth). We cut out two areas for experiments, including commercial areas and residential areas, as well as roads, vegetation, and low-rise buildings. The second imaging scene is in Shenzhen, China, in ST (Staring Spotlight) mode, with a resolution of 0.58 m × 0.23 m (slant range × azimuth). Three areas are selected for experiments, which are mainly residential areas and contain 1–3 blocks. Both images are in HH polarization. See Table 1 for specific dataset information. We use the number of building types and the spatial density to characterize the different image data. Based on the number of building types in the imaging scene combined with their significant facade features shown in SAR images, we divided the number of building types from least to most into “several”, “some”, and “many”. According to the SAR incident angle, the actual spatial distribution of the building and its performance on the SAR image, the spatial density is divided into “dense” and “crowd” from light to heavy. To better illustrate the performance of the method in actual scenarios, wide fields where high-rise buildings independently distributed are not selected in this paper.
In addition to SAR images, multi-period optical images of the corresponding areas on Google Earth are used to verify and display the high-rise building extraction results. The optical images of data 1 and 2 shown in Section 4.2.2 were acquired on 21 September 2013. The optical images of data 3, 4, and 5 shown in Section 4.2.2 were acquired on 18 October 2016.

4.2. Results and Evaluations

In this section, we first take data 1 as an example to preliminarily verify the effectiveness of the HRBE-PM method, then carry out qualitative and quantitative evaluation on five datasets.

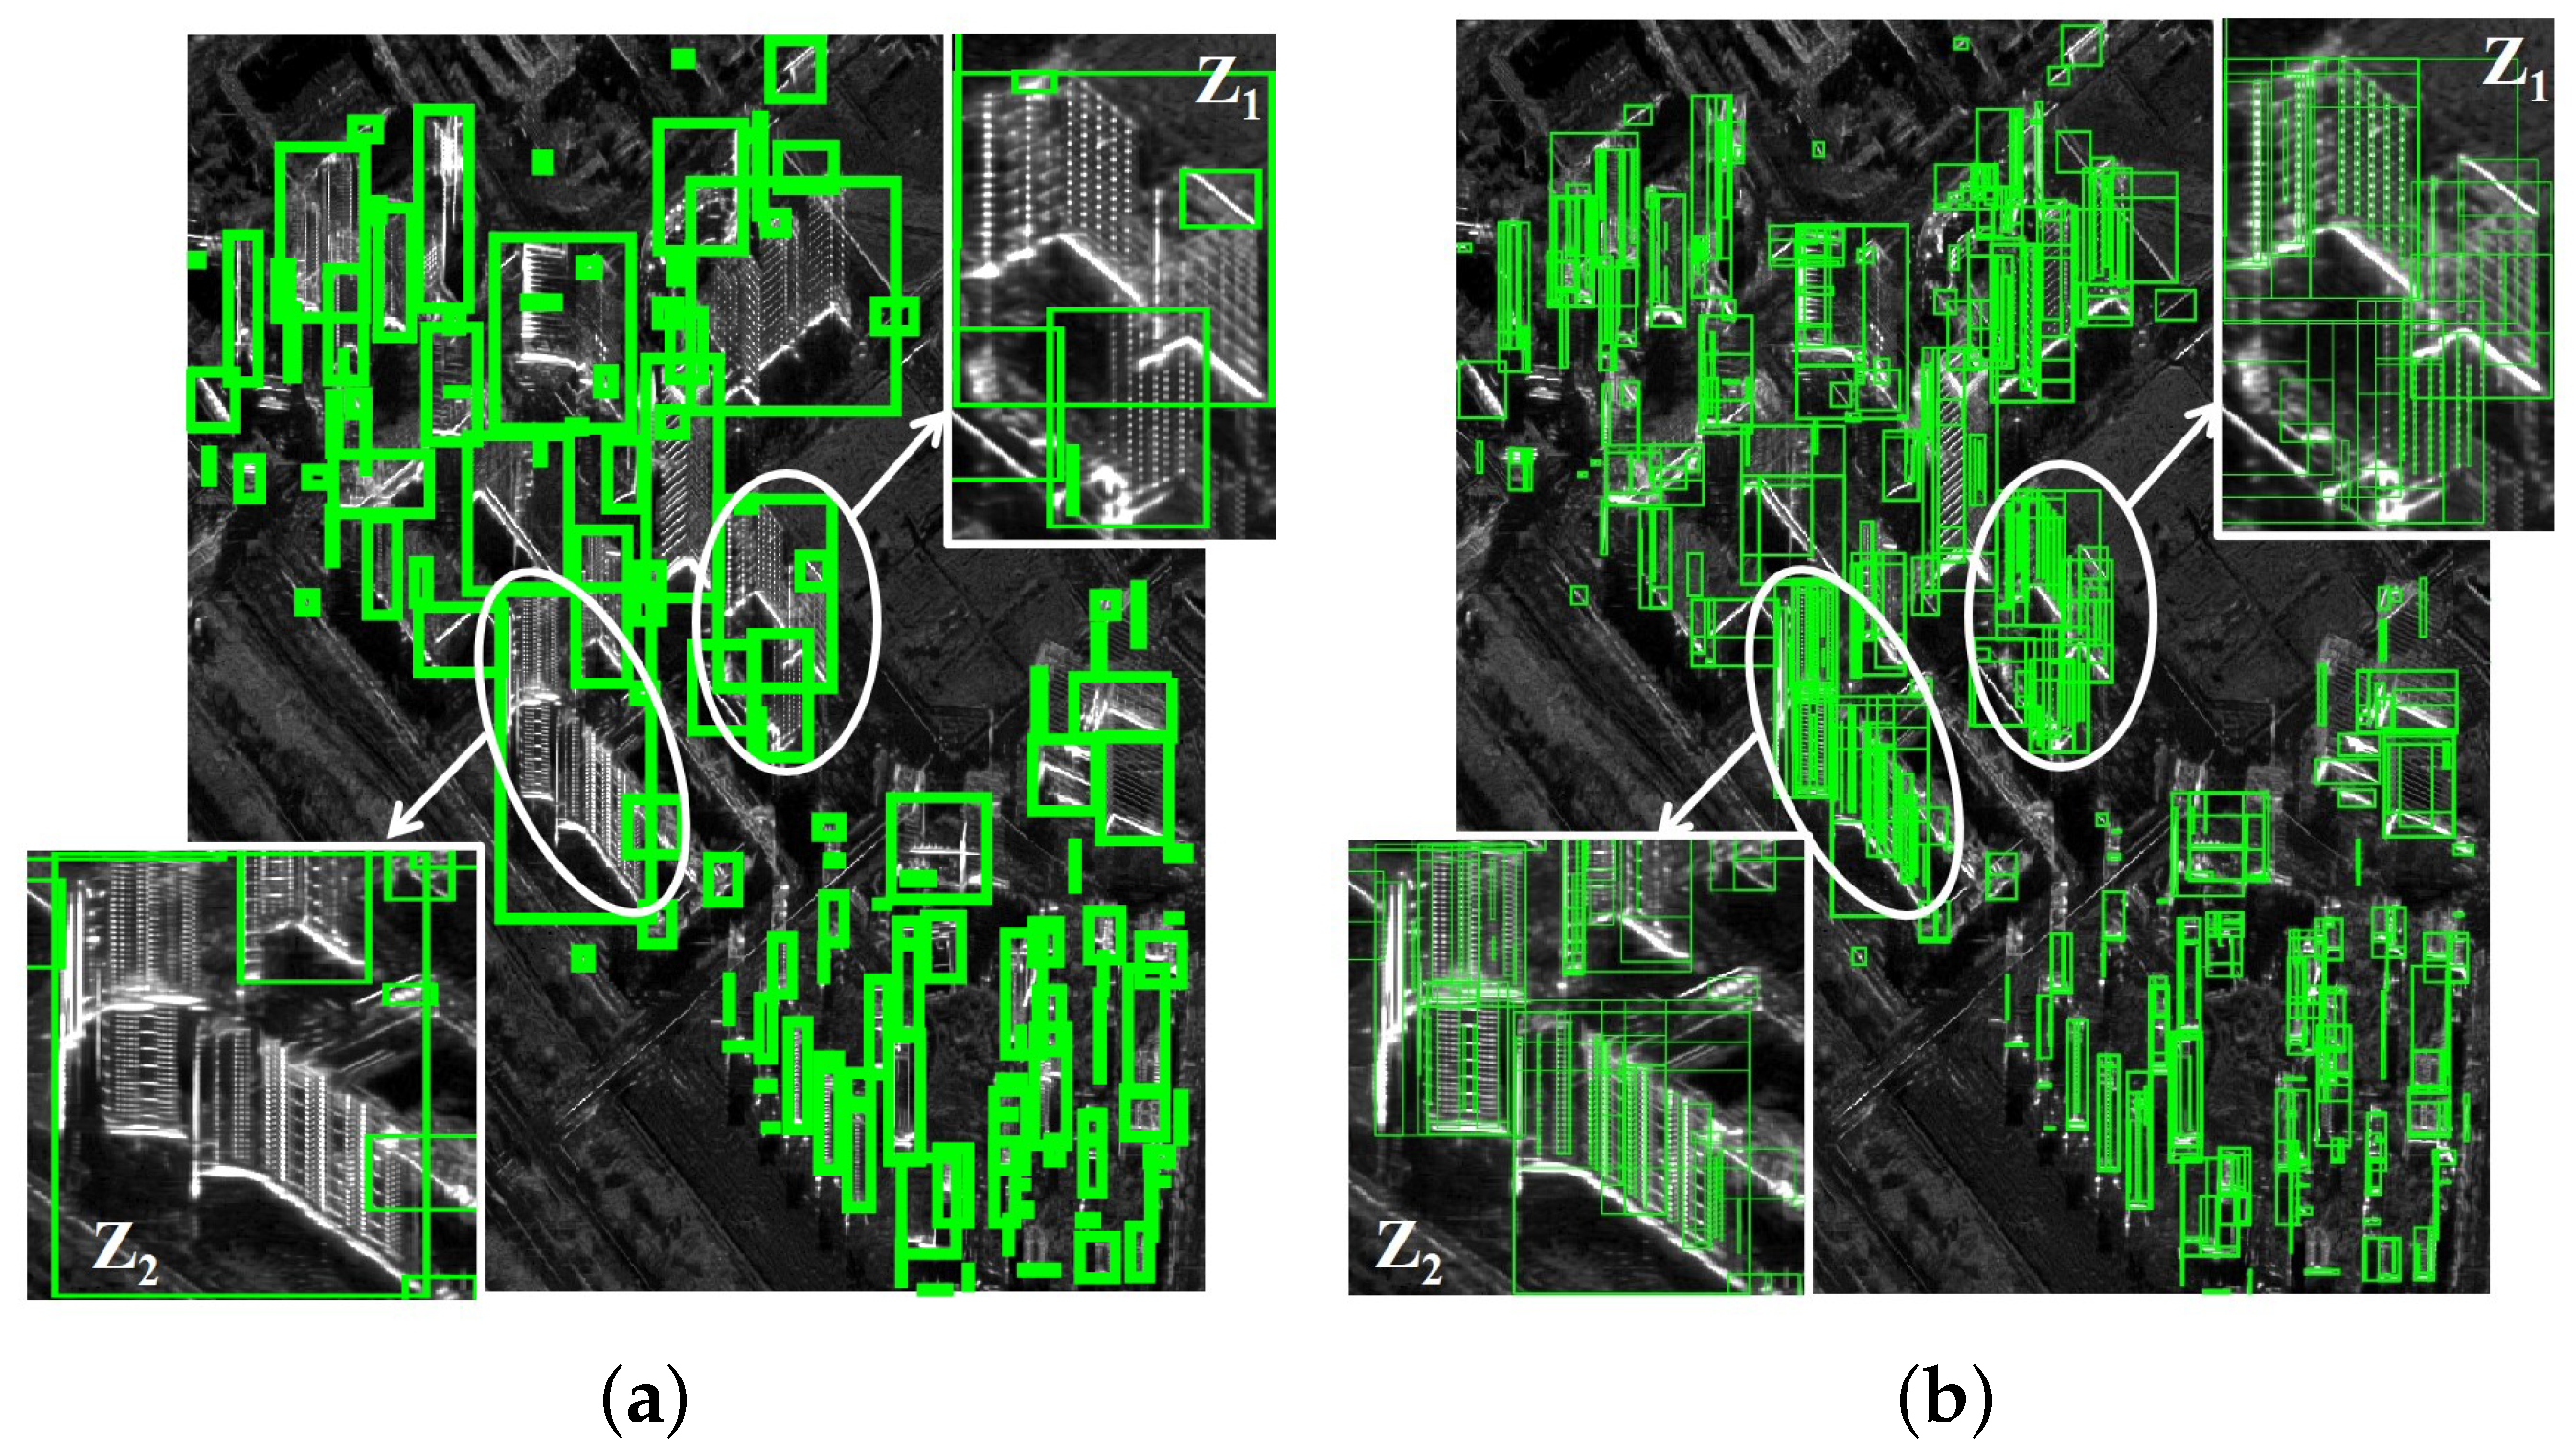
4.2.1. Preliminary Validity Verification

The middle part of data 1 is a commercial area, and the upper left corner and lower right corner are residential areas. There are various building types and they are densely distributed. In this section, data 1 is used as an example to preliminarily verify the validity of the high-rise building model and HRBE-PM method.
Figure 11a shows the building part extraction results of data 1, where the blue box represents the FR part, the orange box represents the FBL part, and the red line represents the DB part. The extraction results in the two white circles, named Z 1 and Z 2 , are enlarged and displayed. It can be seen that the regular bright spots and bright lines commonly distributed along the range direction in high-rise buildings are correctly extracted as FR parts. A total of seven columns of regular bright spots and two columns of incomplete regular bright spots were completely detected for the high-rise building in the upper left corner of the Z 1 area. The facades of the two buildings in the Z 2 area are a combination of regular bright spots and regular short bright lines. This complex situation can also be correctly handled. High-rise buildings in residential areas are mostly detected as FBL parts at this SAR incident angle and building orientation. The detection results of DB parts are mostly bright lines at the bottom of the building, which is consistent with expectations. Figure 11b shows the graph structure based on the part model constructed in Section 3.4. The blue ‘x’ represents the FR part node, the orange cross represents the FBL part node, and the red dot represents the DB part node. The edges between the parts are obtained by setting thresholds according to the relationship shown in Figure 7. They are represented by yellow lines, the width of which represents the distance between the two parts. In Z 1 area, although the top bright lines of the two buildings in the upper half were detected as double bounce bright lines, no effective connection with the facade parts was formed after the topological relationships between parts were introduced. They form a building hypothesis on their own and are eliminated in the postprocessing step without affecting the final high-rise building extraction results. As can be seen from Figure 11, the high-rise building part model proposed in this paper can realize the local feature description of various types of high-rise buildings. And the relative position relationships between parts help to generate possible building hypotheses, verifying the effectiveness of the high-rise building part model.
Graph nodes connected by edges may belong to the same high-rise building. Each maximally connected subgraph is used as the basis for building hypothesis generation. Figure 12a shows the rectangular range of the parts contained in each maximal connected subgraph in Figure 11b on the SAR image. Every thick green box is a maximal connected subgraph. It can be seen from the Z 1 and Z 2 areas that one maximal connected subgraph may contain multiple buildings. Using the method in Section 3.4, based on the spatial topological relationship between parts and the combination rules in Figure 8, all high-rise building hypotheses are further generated as shown in Figure 12b.
According to the building hypothesis evaluation system in Section 3.5, use the indicator S c o m p l e t e and indicator S c o m p a c t to select optimal building hypotheses. The results are shown in Figure 13a. Most of the high-rise buildings can be effectively extracted, and the adjacent buildings can be distinguished on the basis of ensuring integrity, which indicates the effectiveness of the proposed evaluation system. The two buildings in the upper half of the Z 1 area were detected separately in Figure 13a, but the building in the upper left corner was divided into two buildings. This is because the hypothesis encompassing the entire building has a lower S c o m p a c t , and the larger S c o m p l e t e cannot fully compensate for the difference, resulting in parts of the building scoring higher than the entire building. In the Z 2 area, the distinction between the two buildings is also effectively achieved, but due to the complexity of the shape of the building on the left, the one building is divided into two.
Postprocessing can remove building hypotheses that do not conform to the characteristics of high-rise buildings or are completely covered in spatial distribution. The results are shown in Figure 13b. Building hypotheses that did not meet the required height were removed. Building hypotheses containing only DB parts, such as the upper part of the building on the right side of the Z 1 area, are also removed. Building hypotheses that are completely subsumed under other building hypotheses in space are also removed, for example, the smaller of the two building hypotheses on the left side of Z 2 is removed and a high-rise building is successfully extracted, avoiding the split result.
By displaying the results of key steps in the processing of data 1, we verified the applicability of the high-rise building part model in describing various types of high-rise buildings. The generated building hypothesis results illustrate the validity of the adjacency matrix rules set in Figure 8. The selection results of the optimal building hypotheses verify the rationality of the evaluation system, including indicators S c o m p l e t e and S c o m p a c t . The postprocessing results make the high-rise building results more reasonable and convincing. To further evaluate the robustness of the HRBE-PM method in different scenes, we provide qualitative and quantitative analysis of the results on the five datasets described in Section 4.1.

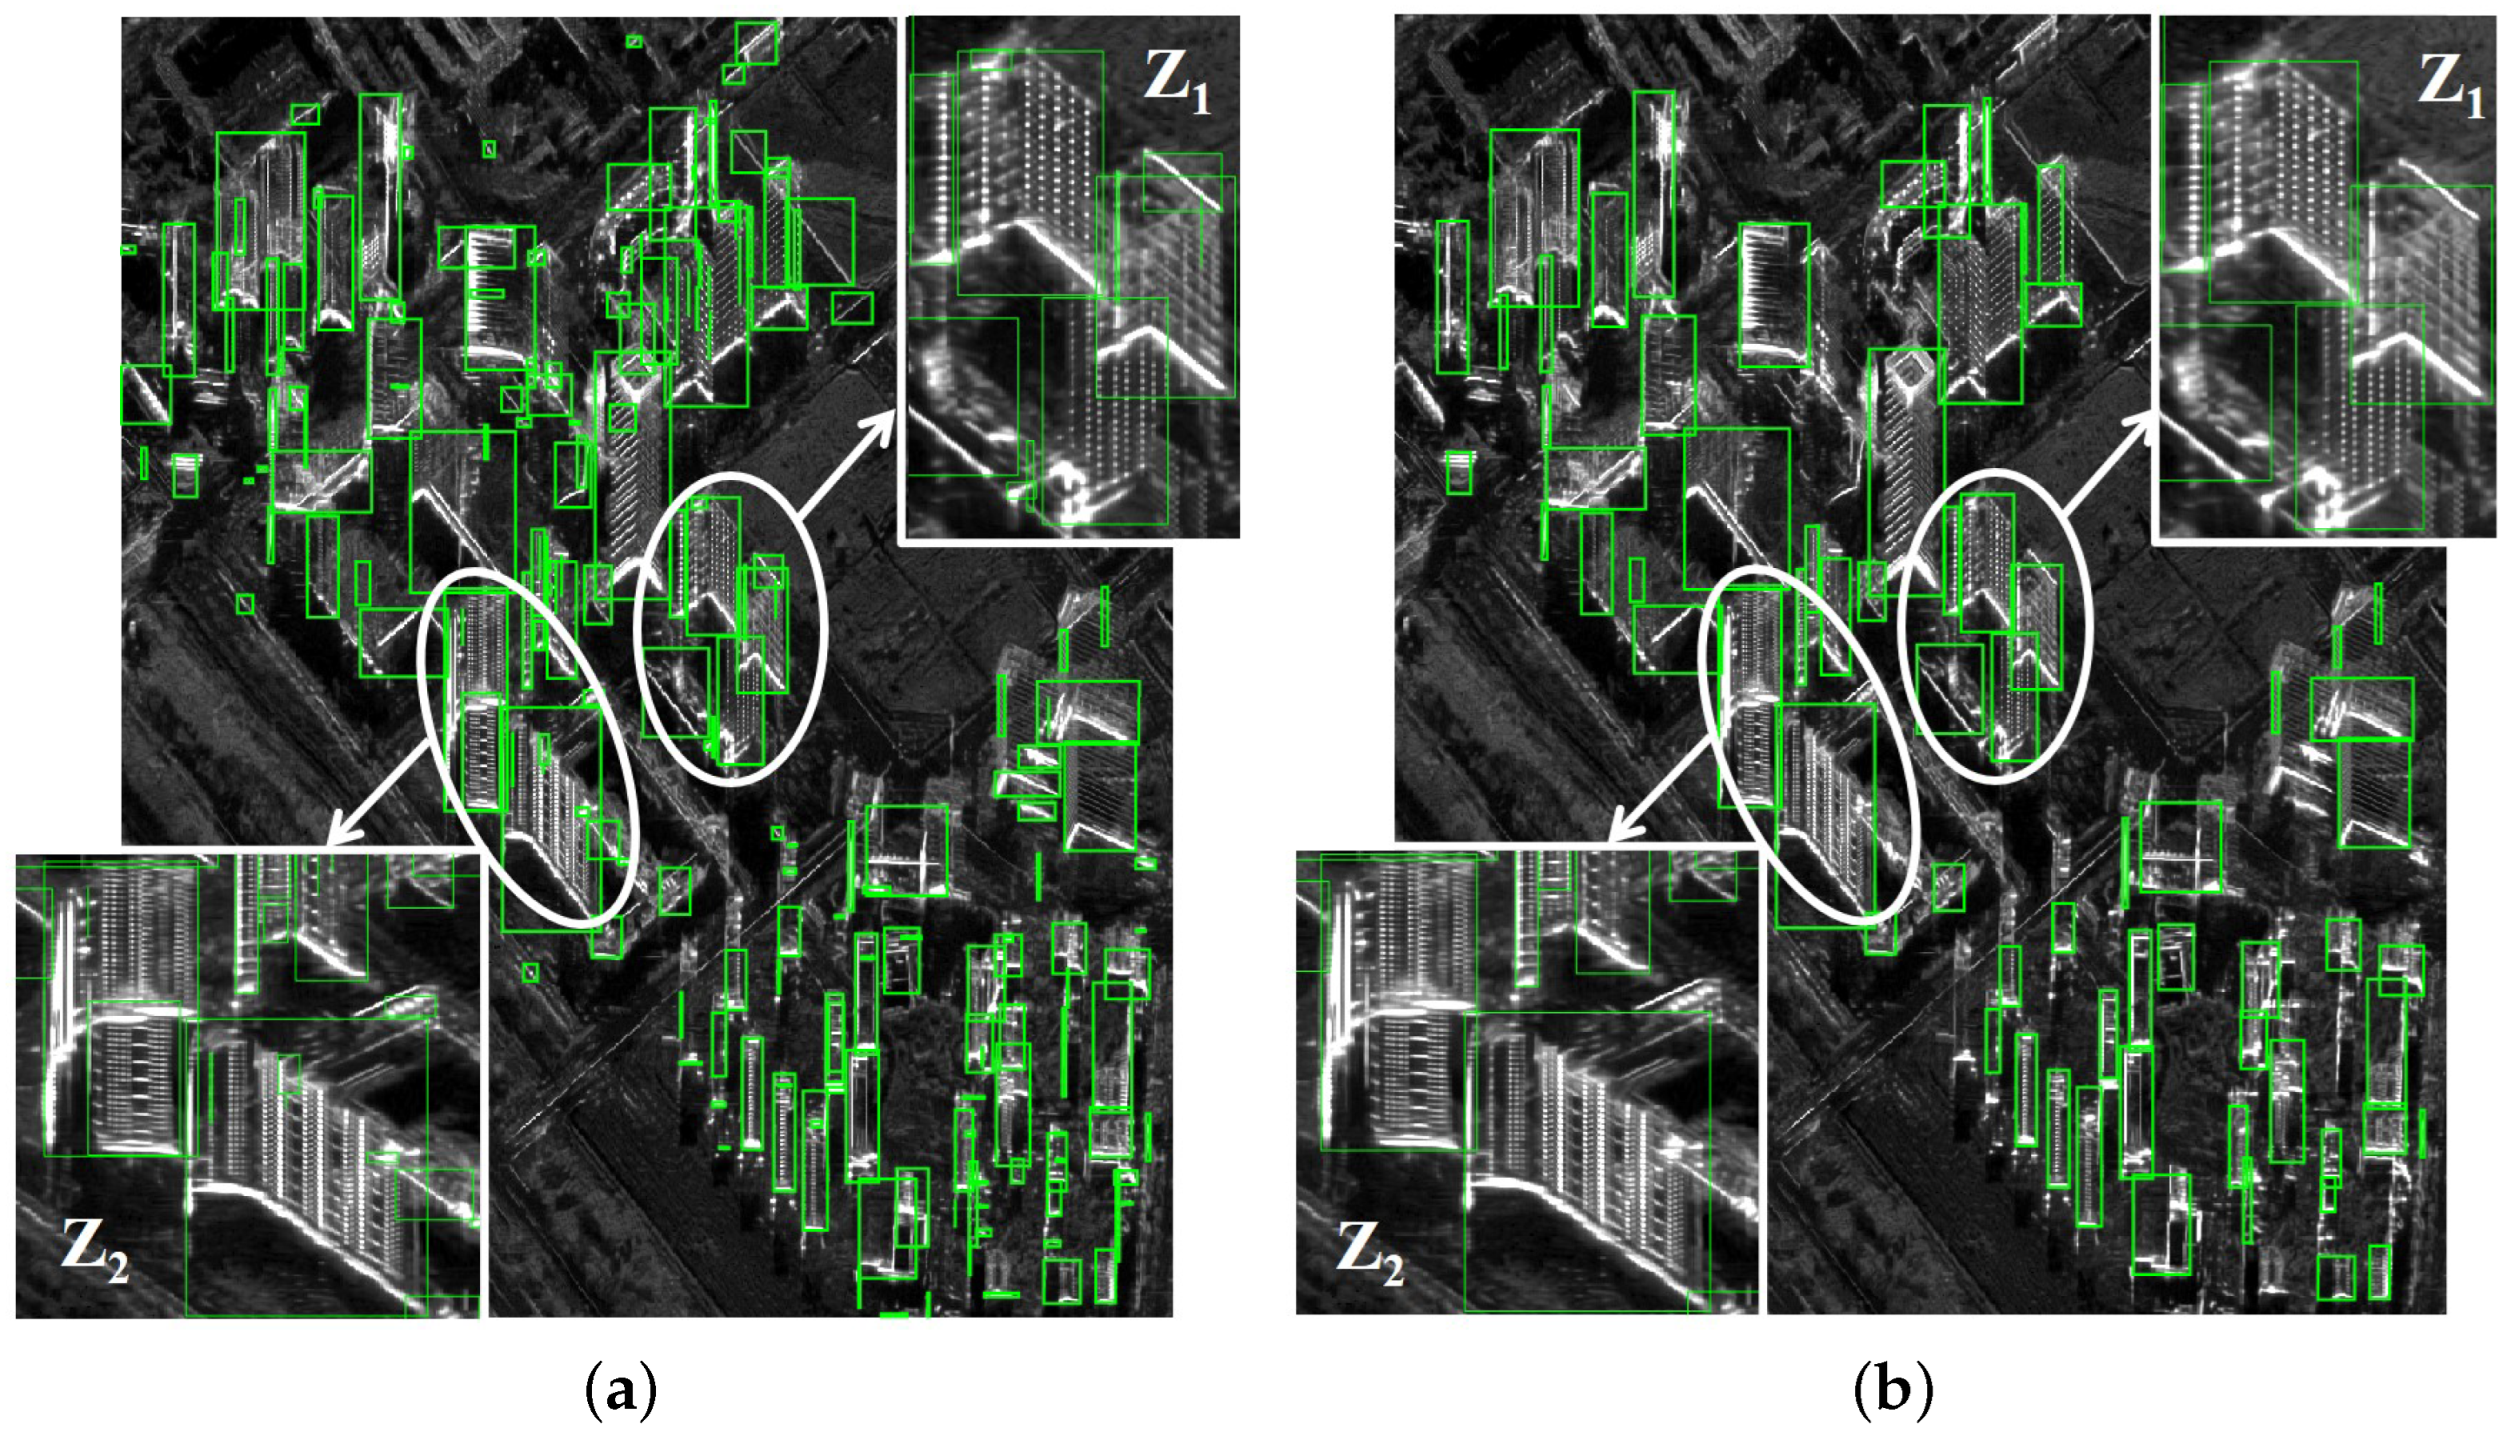
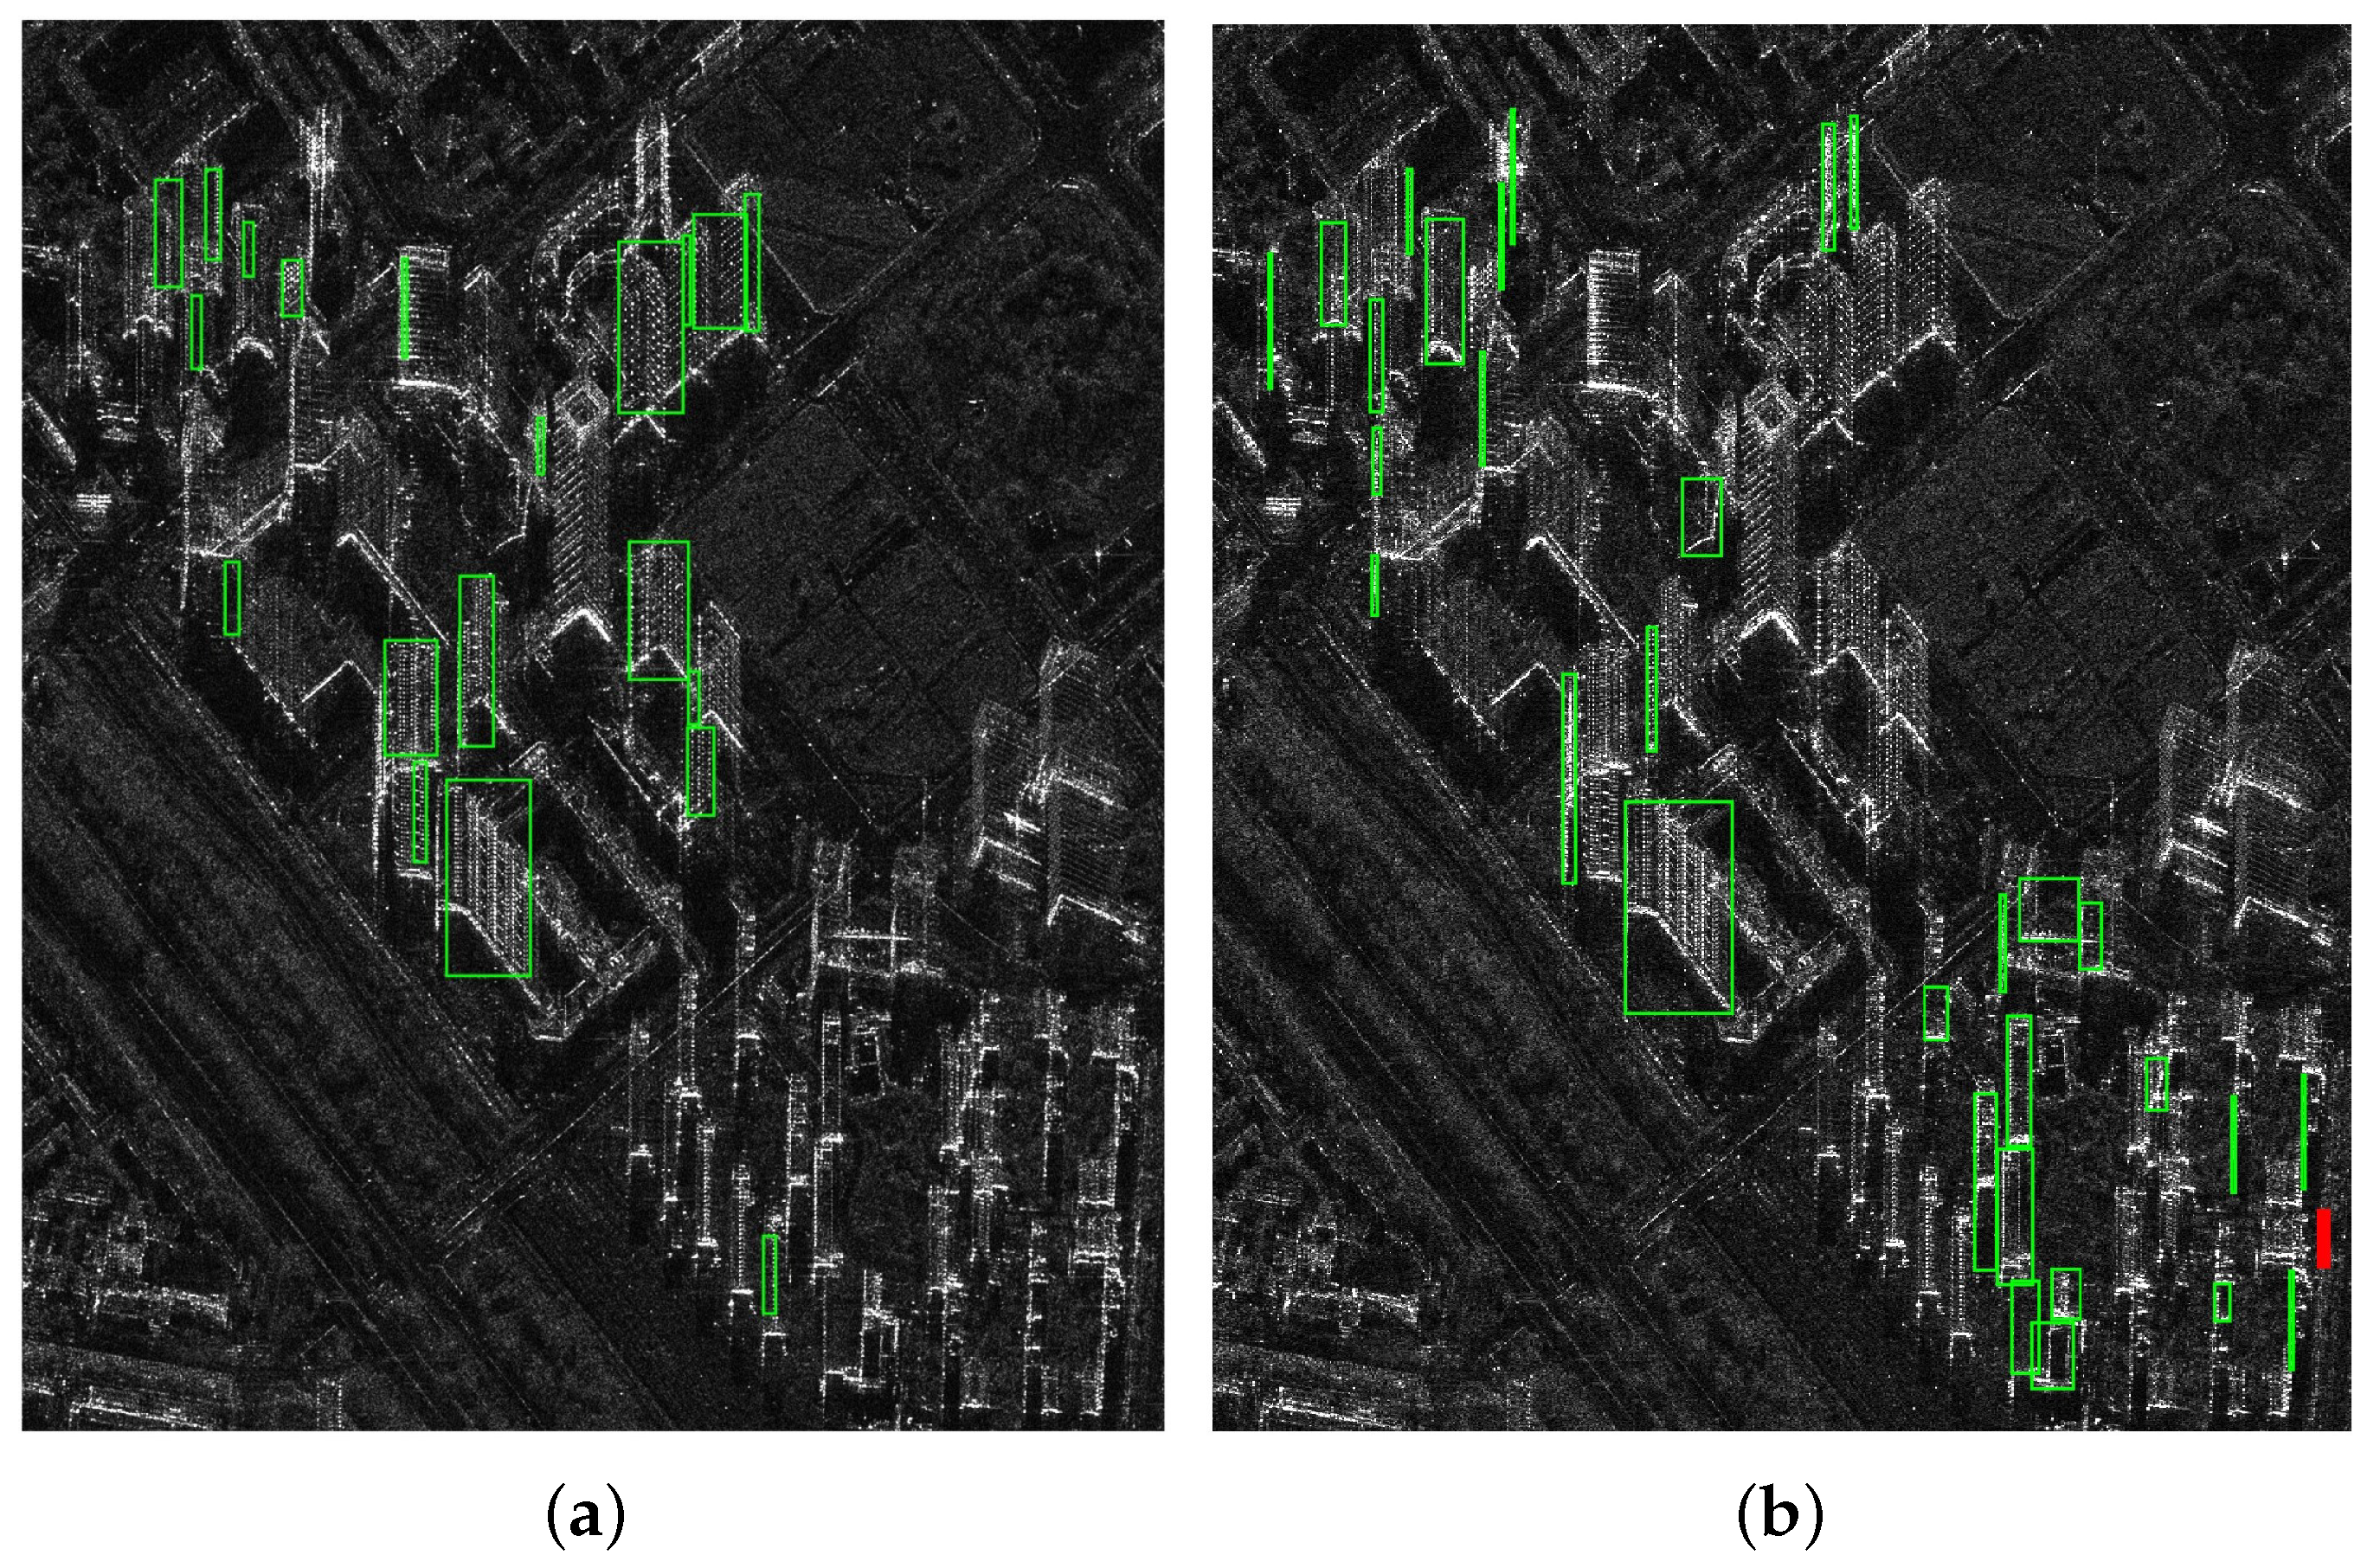
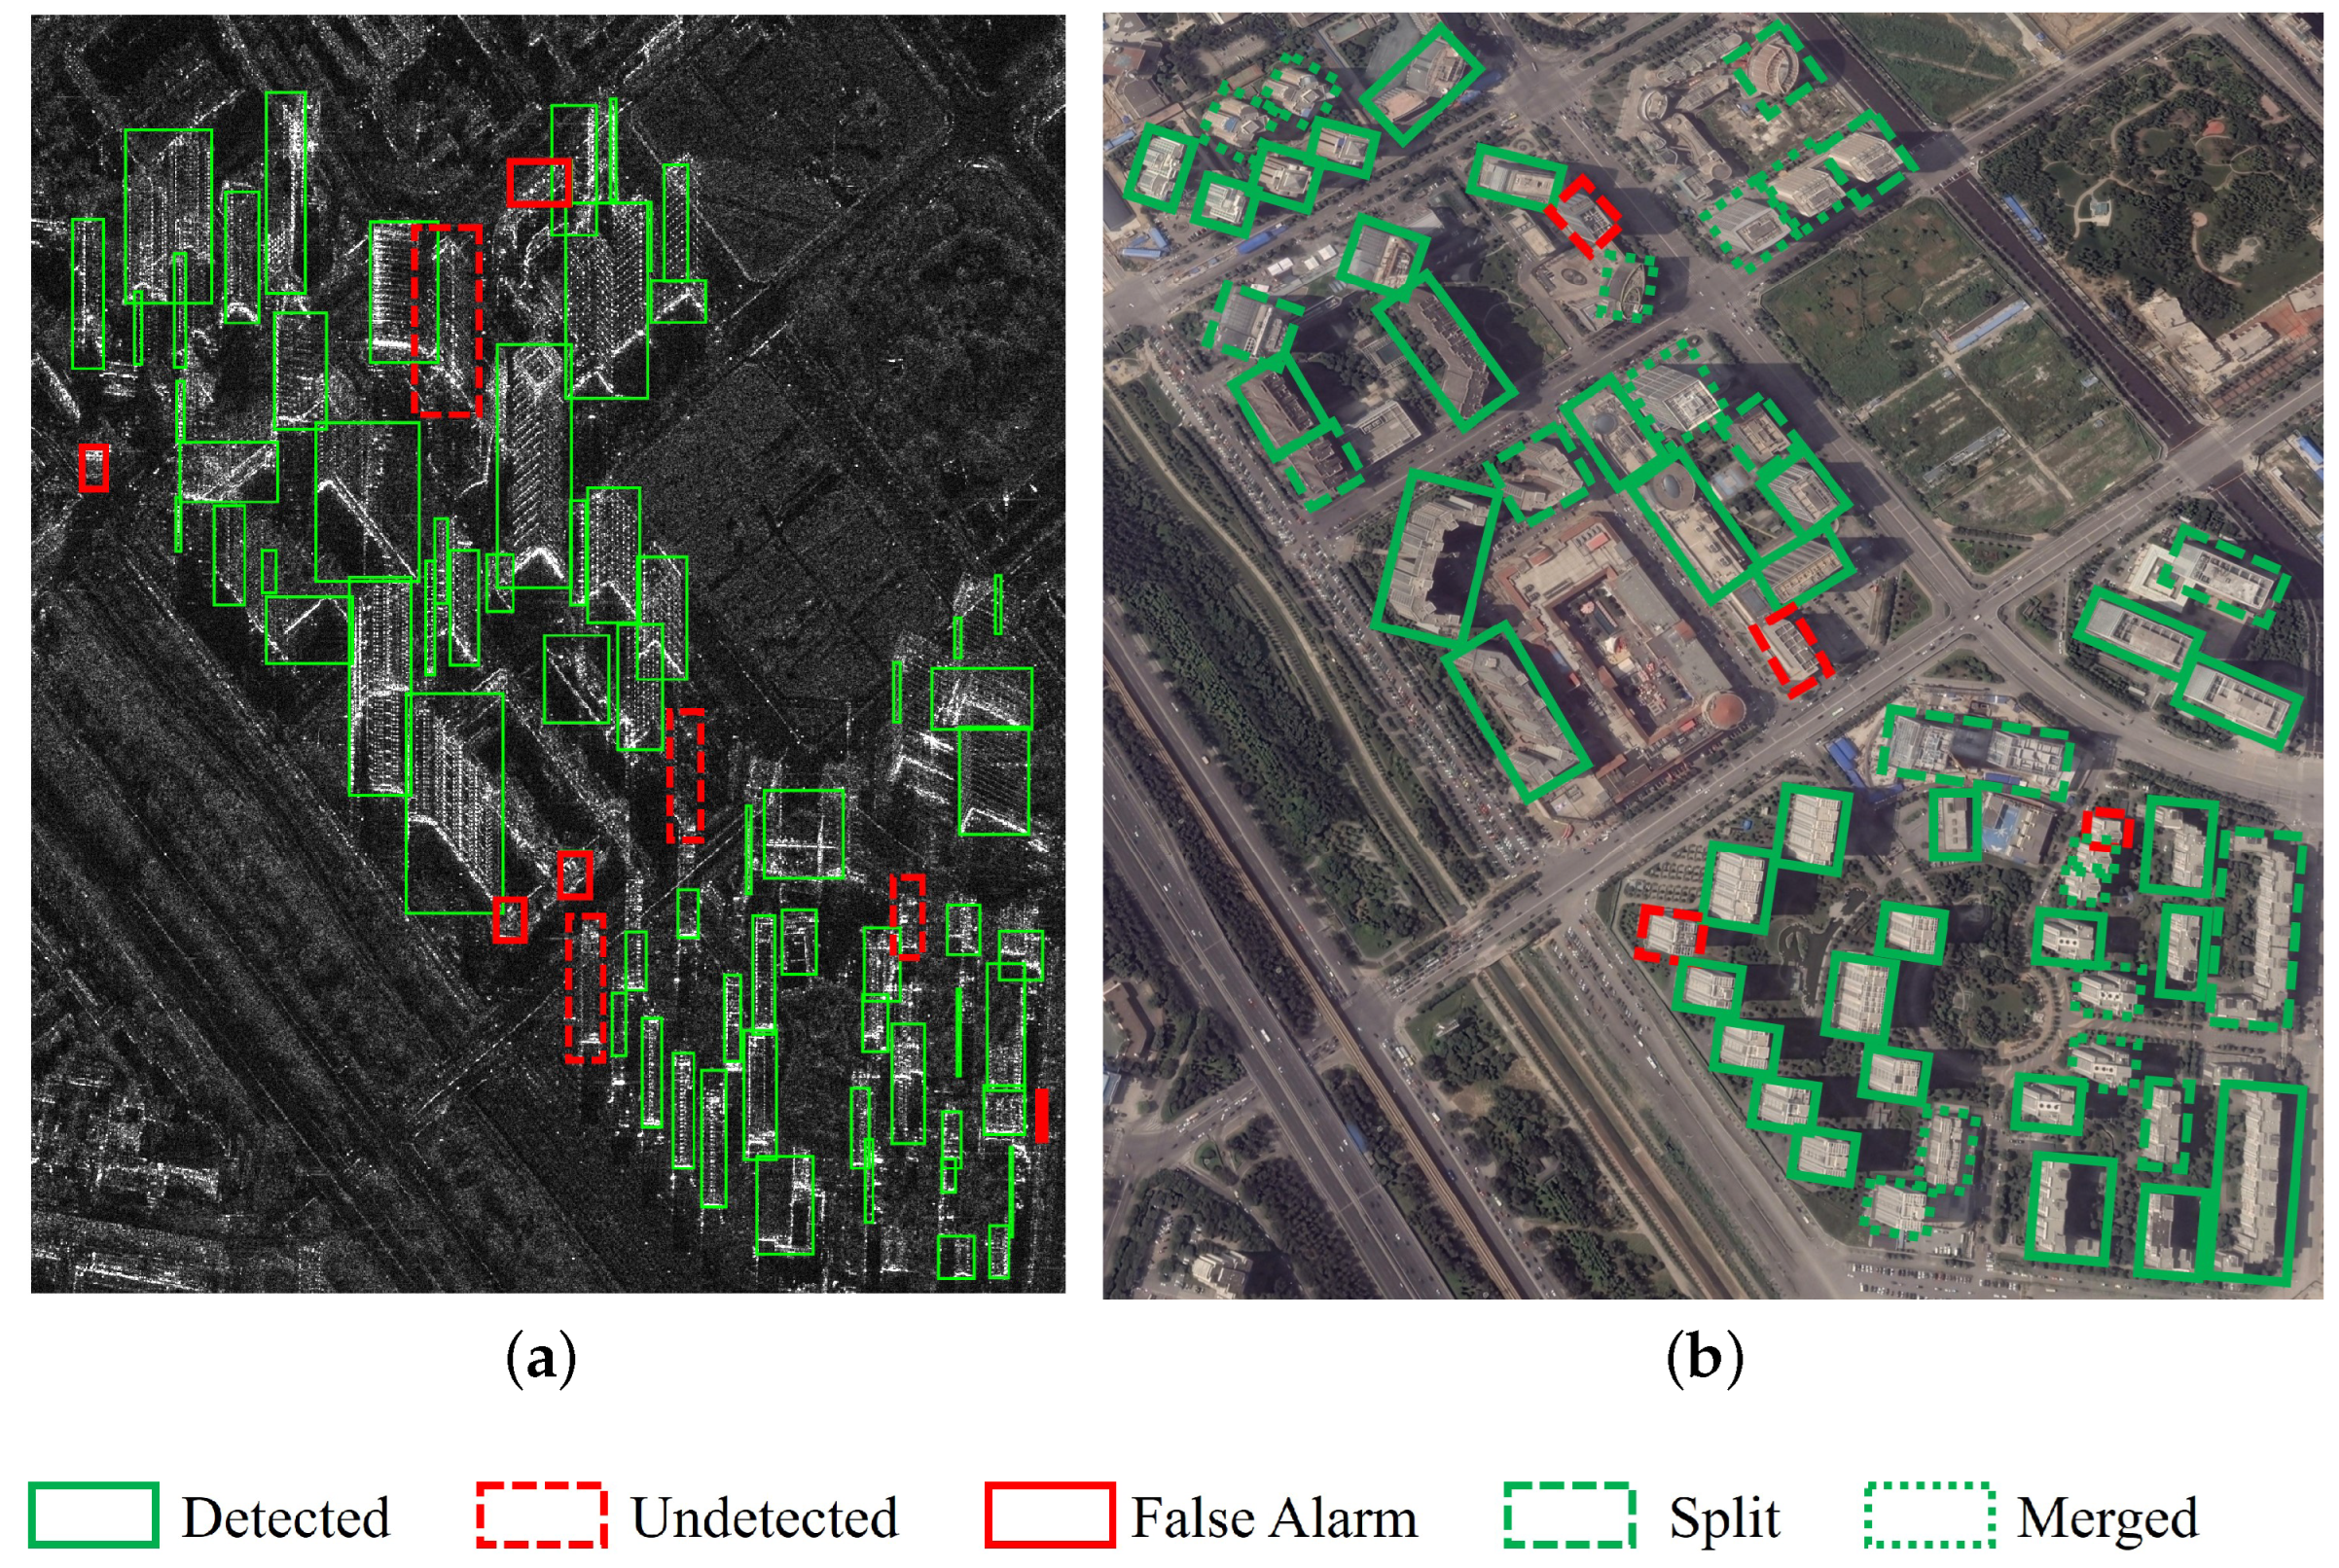
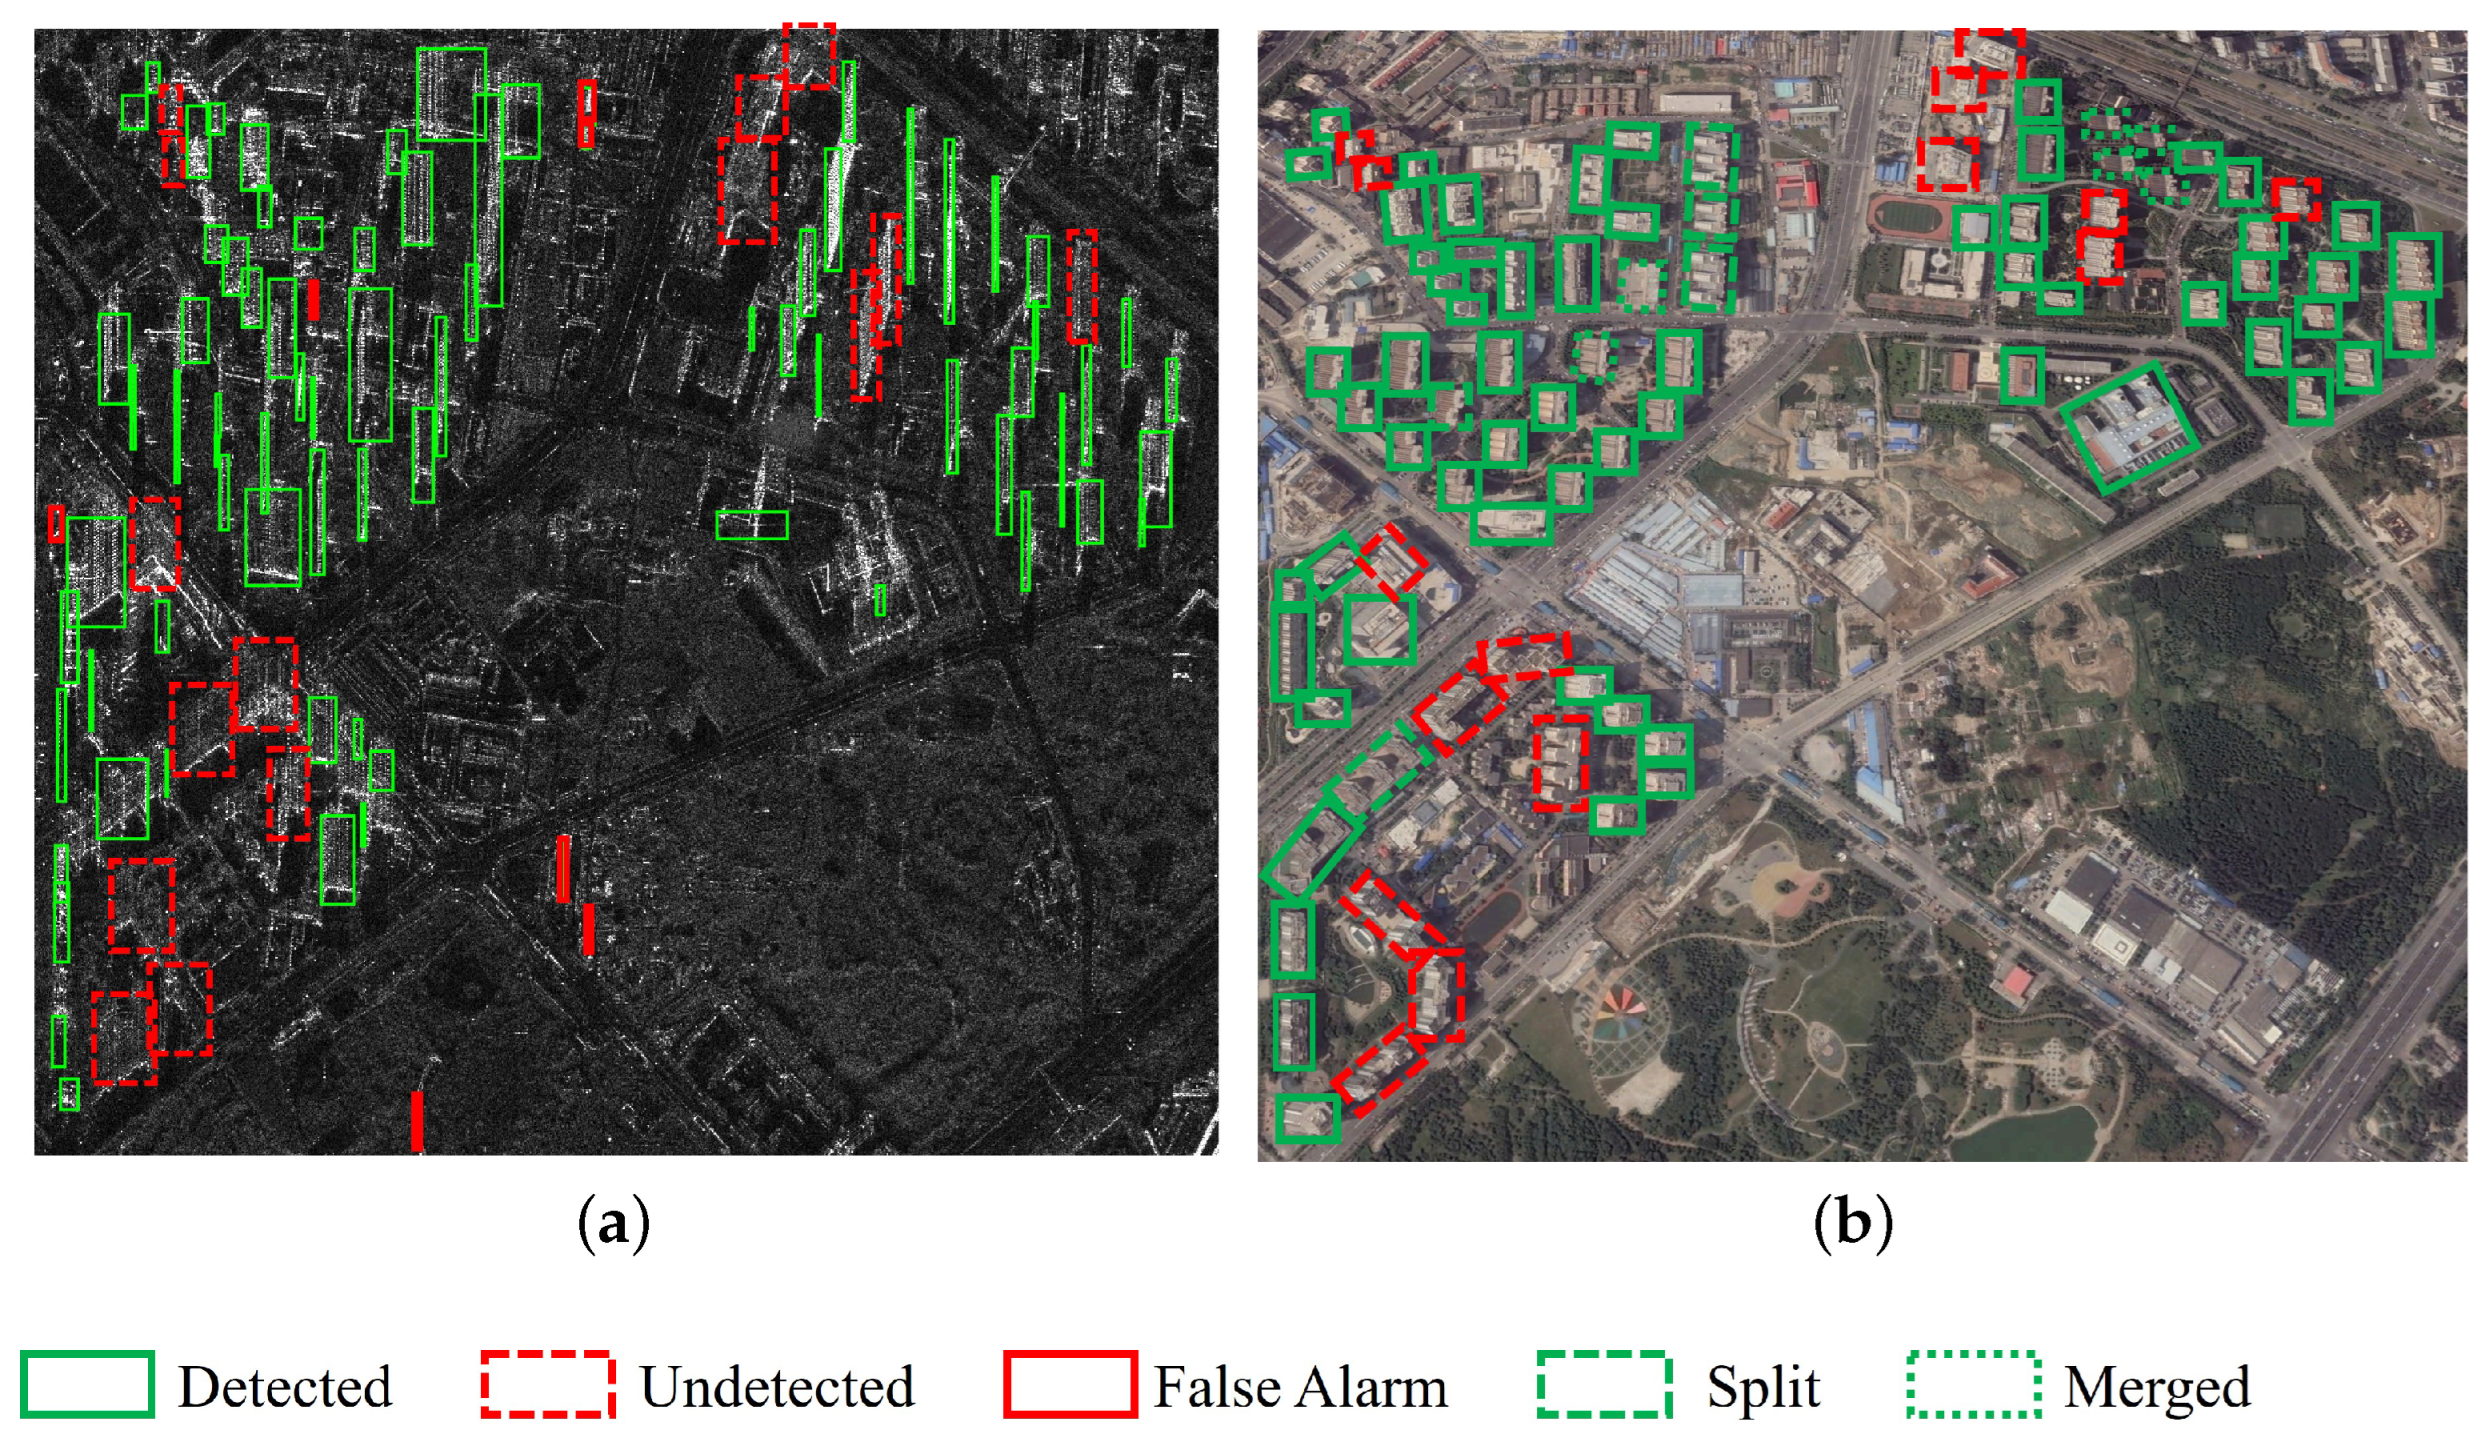
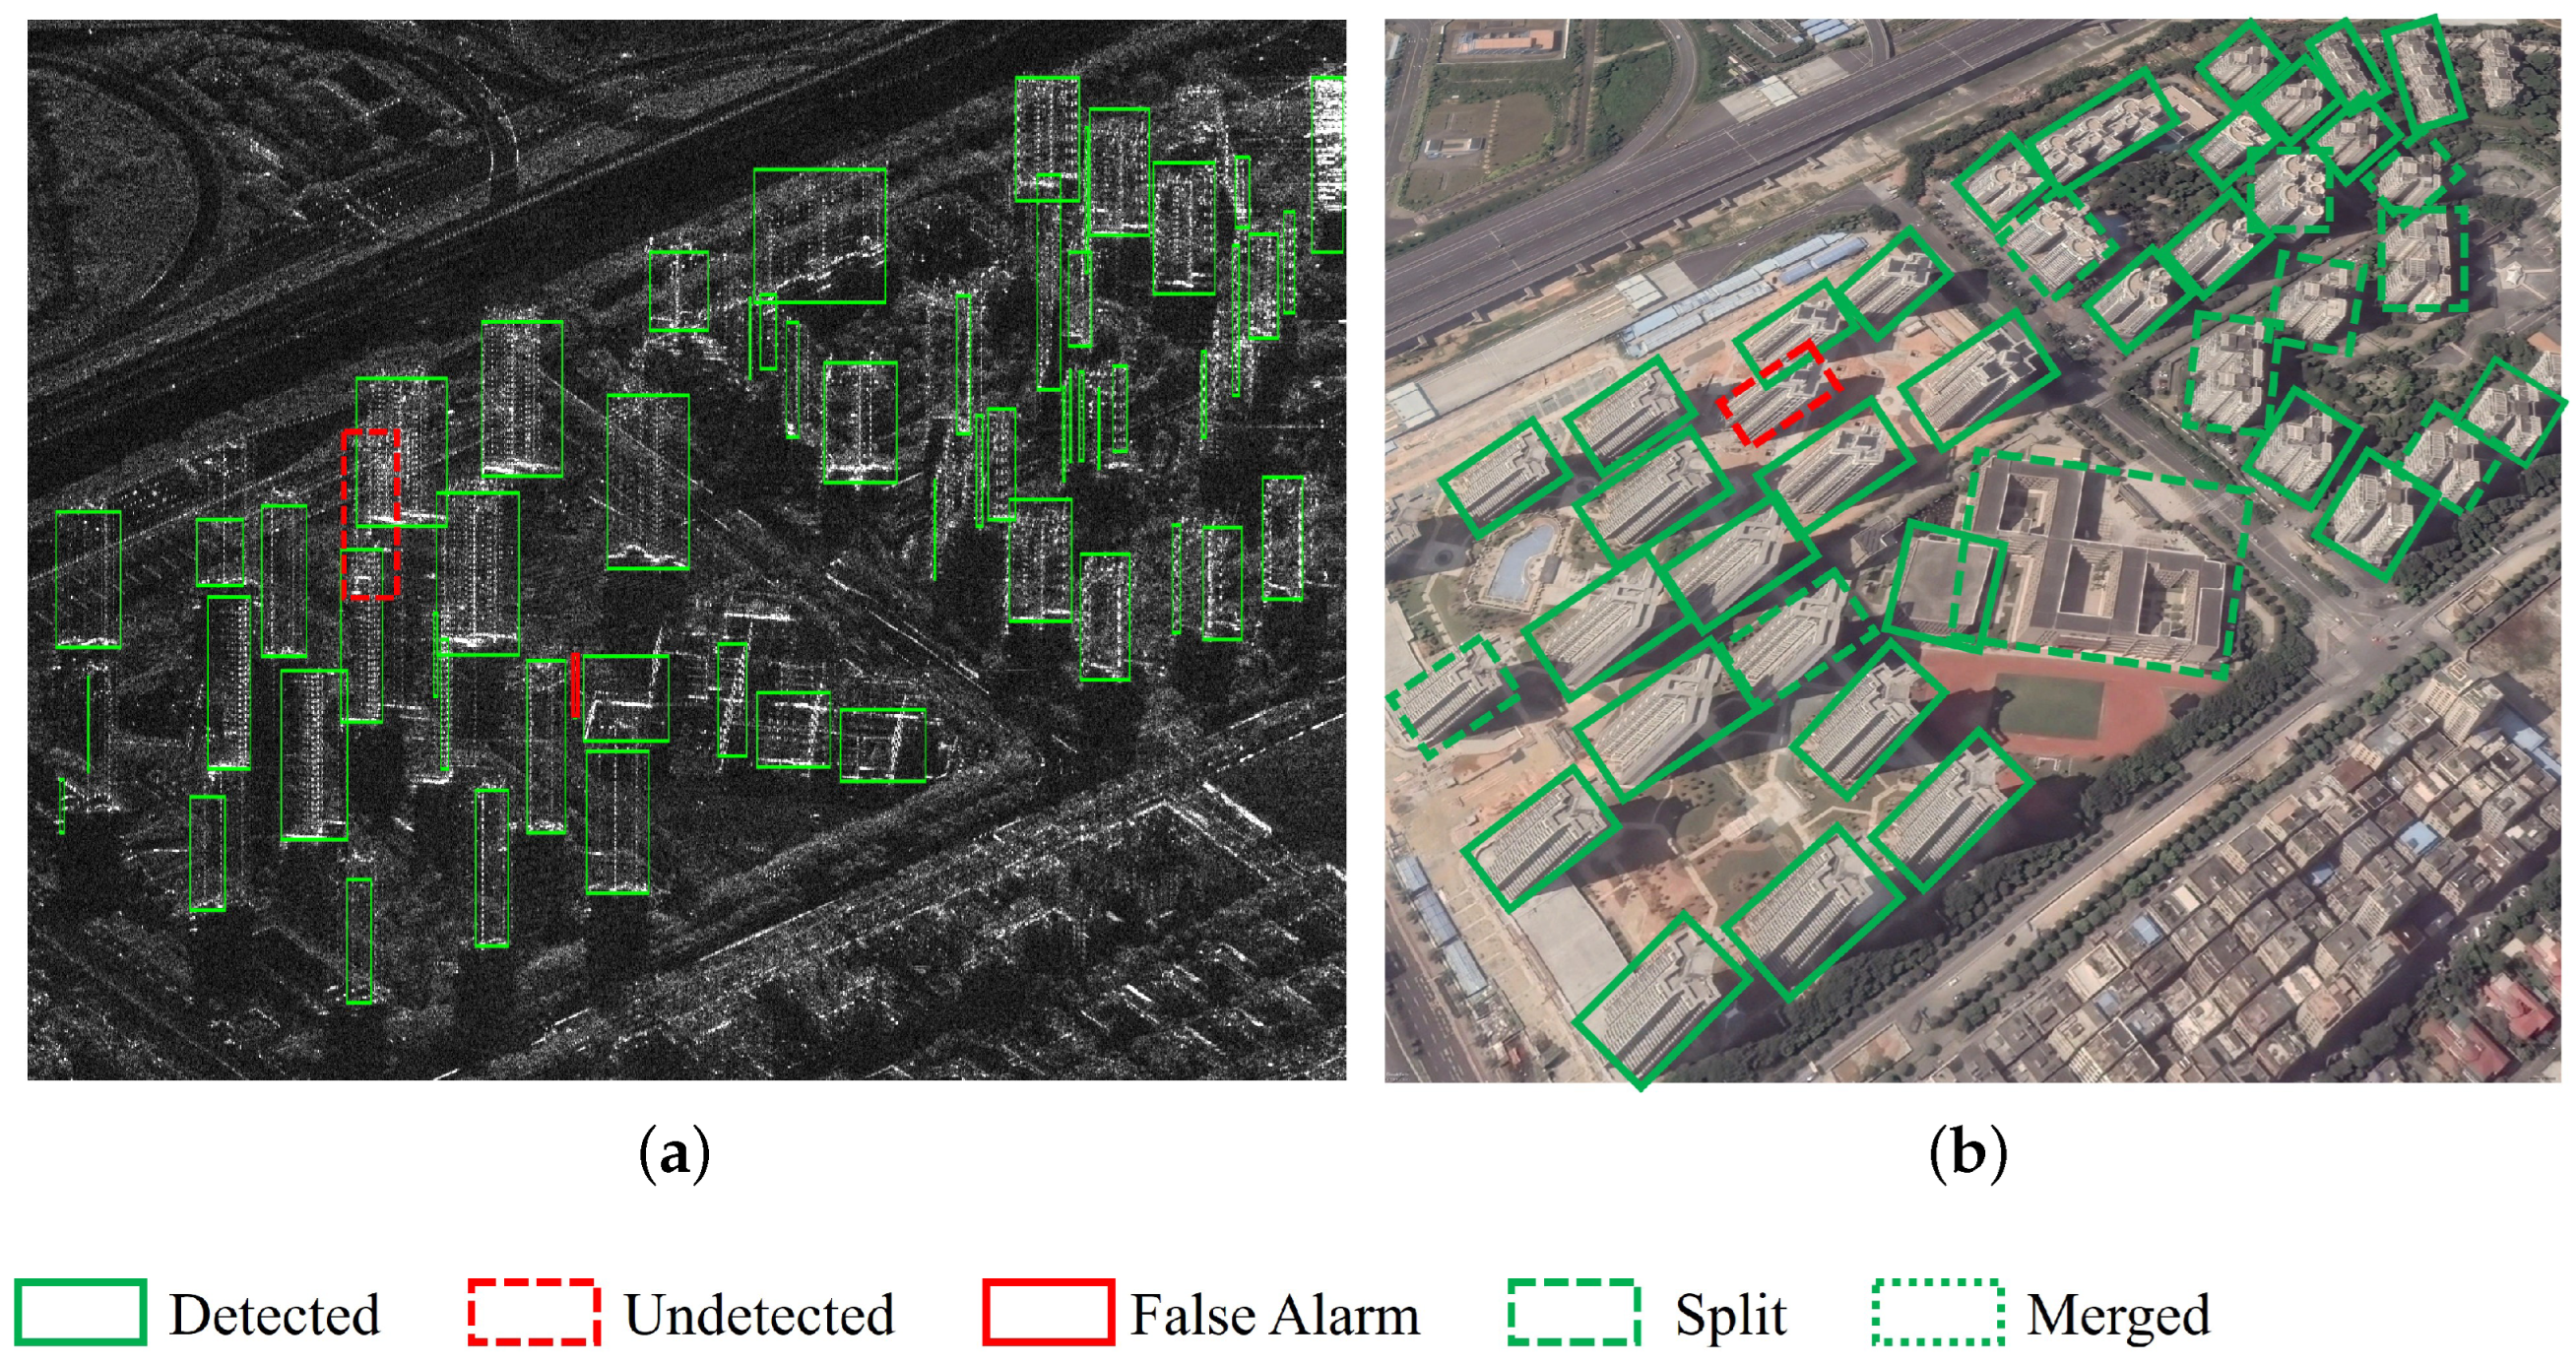
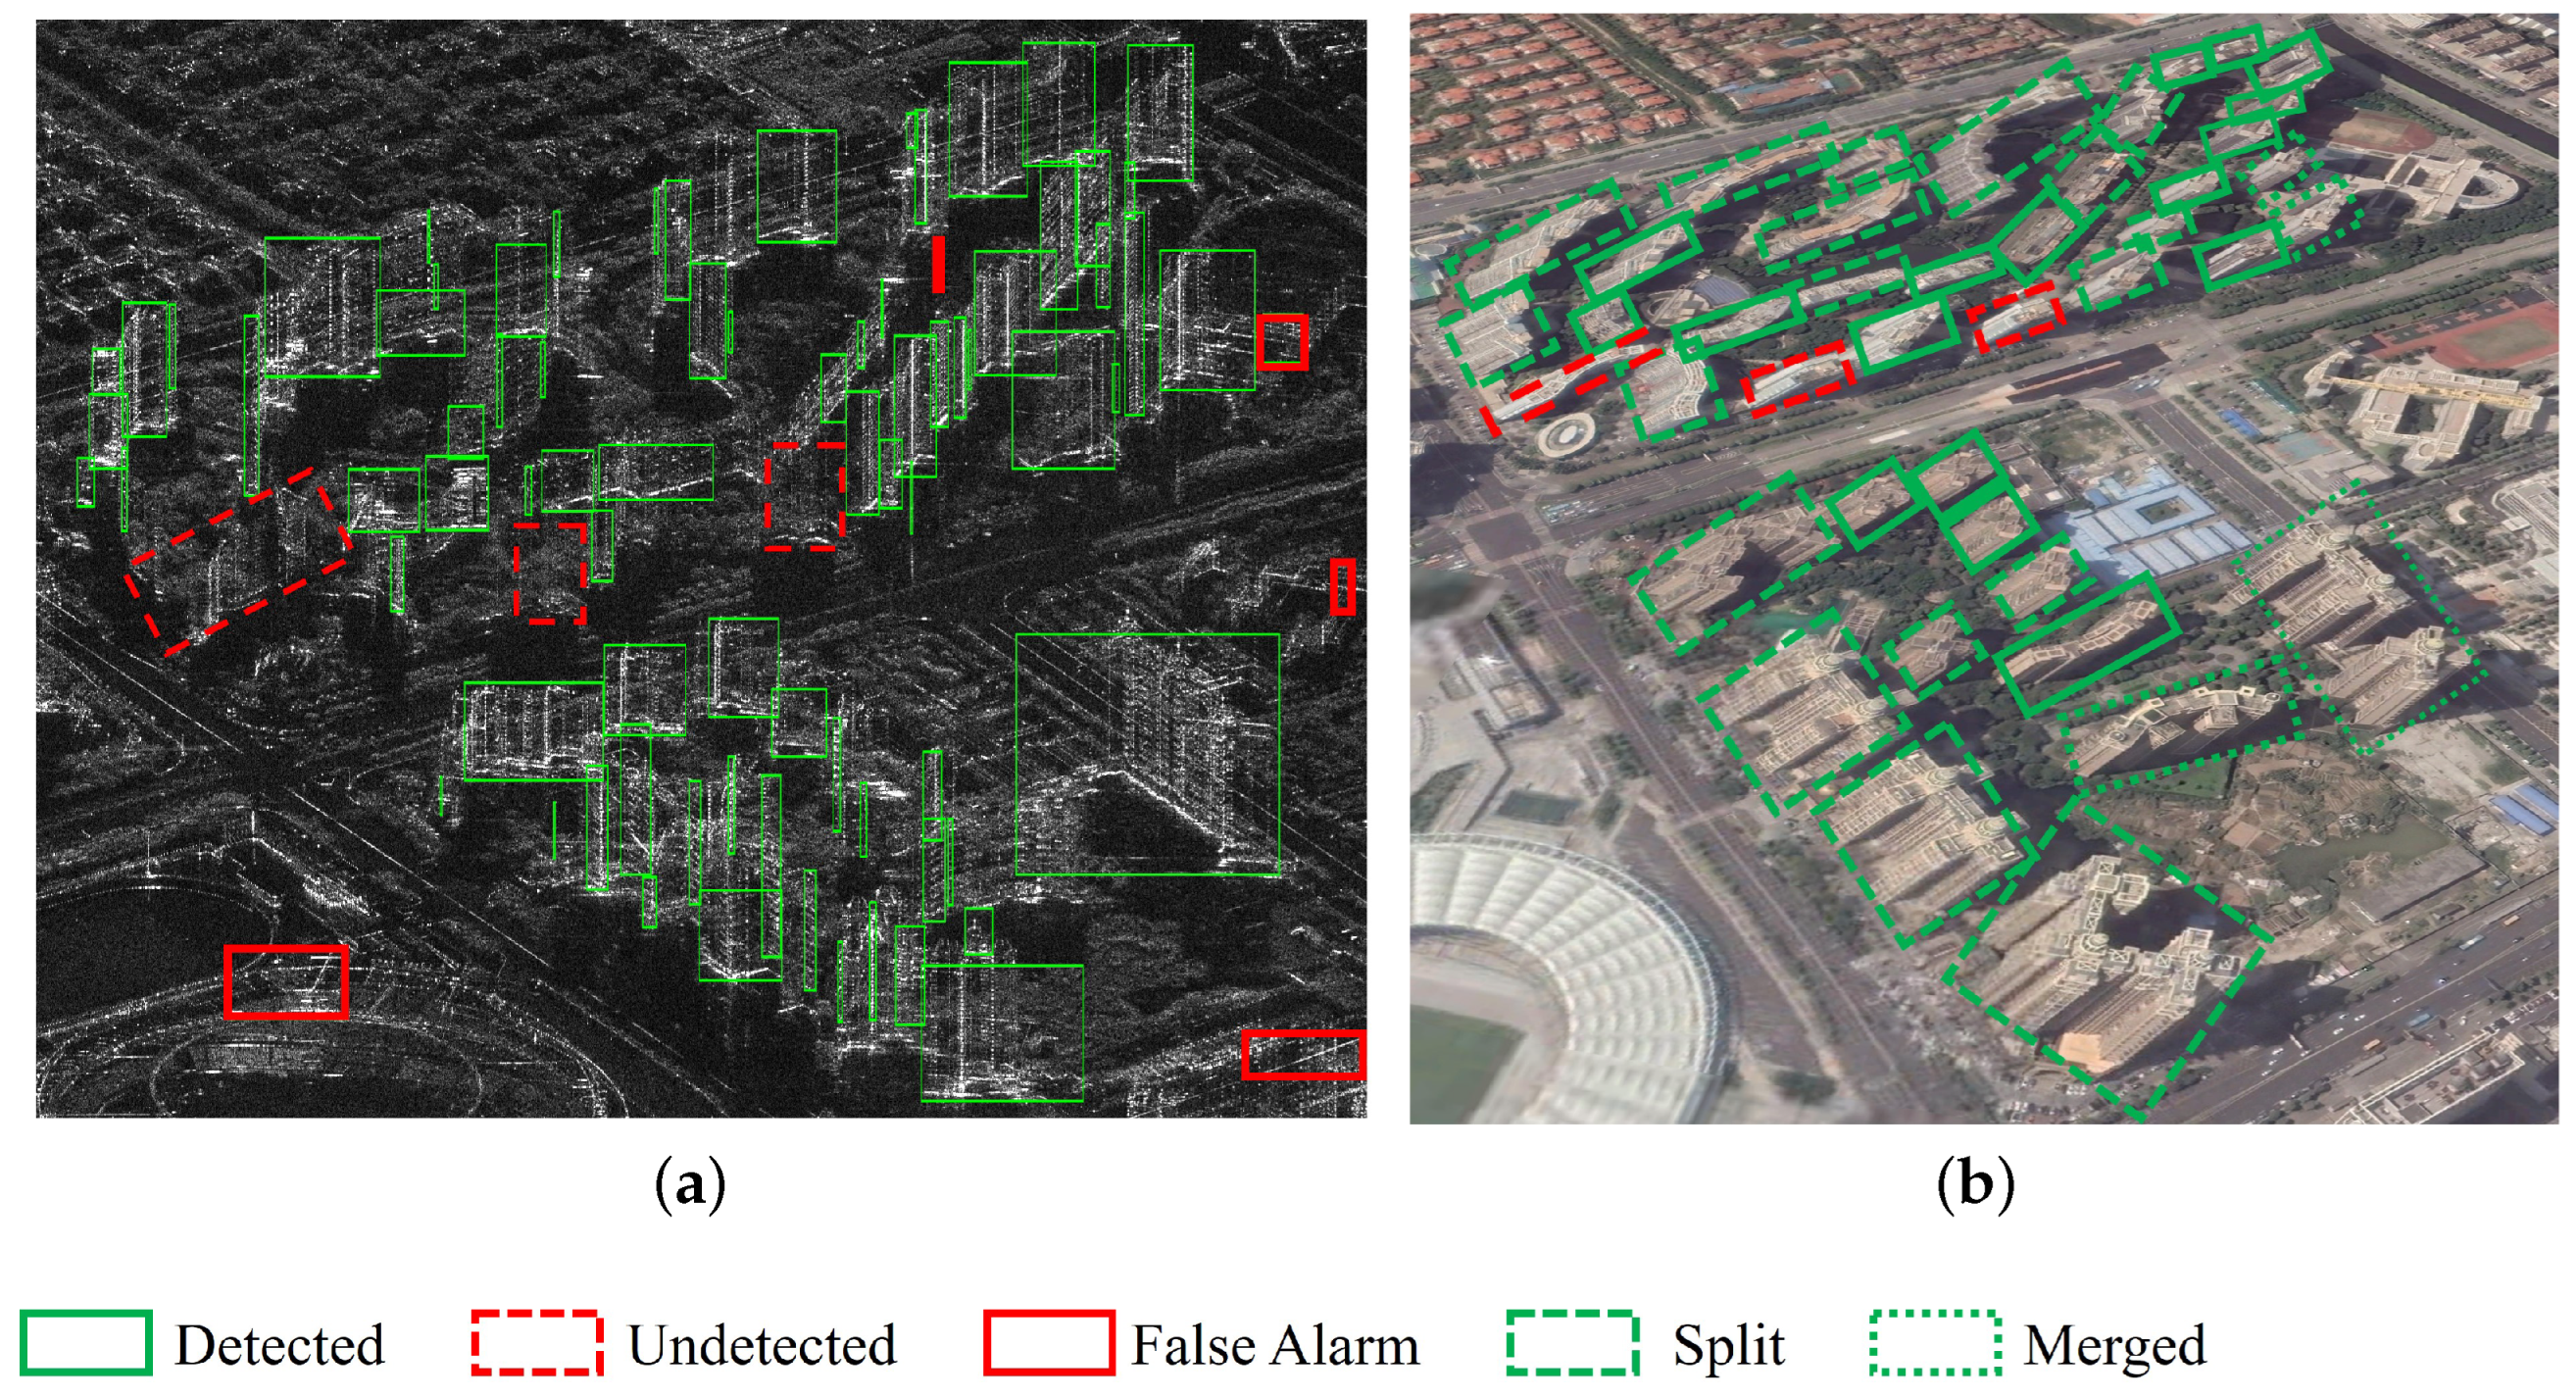
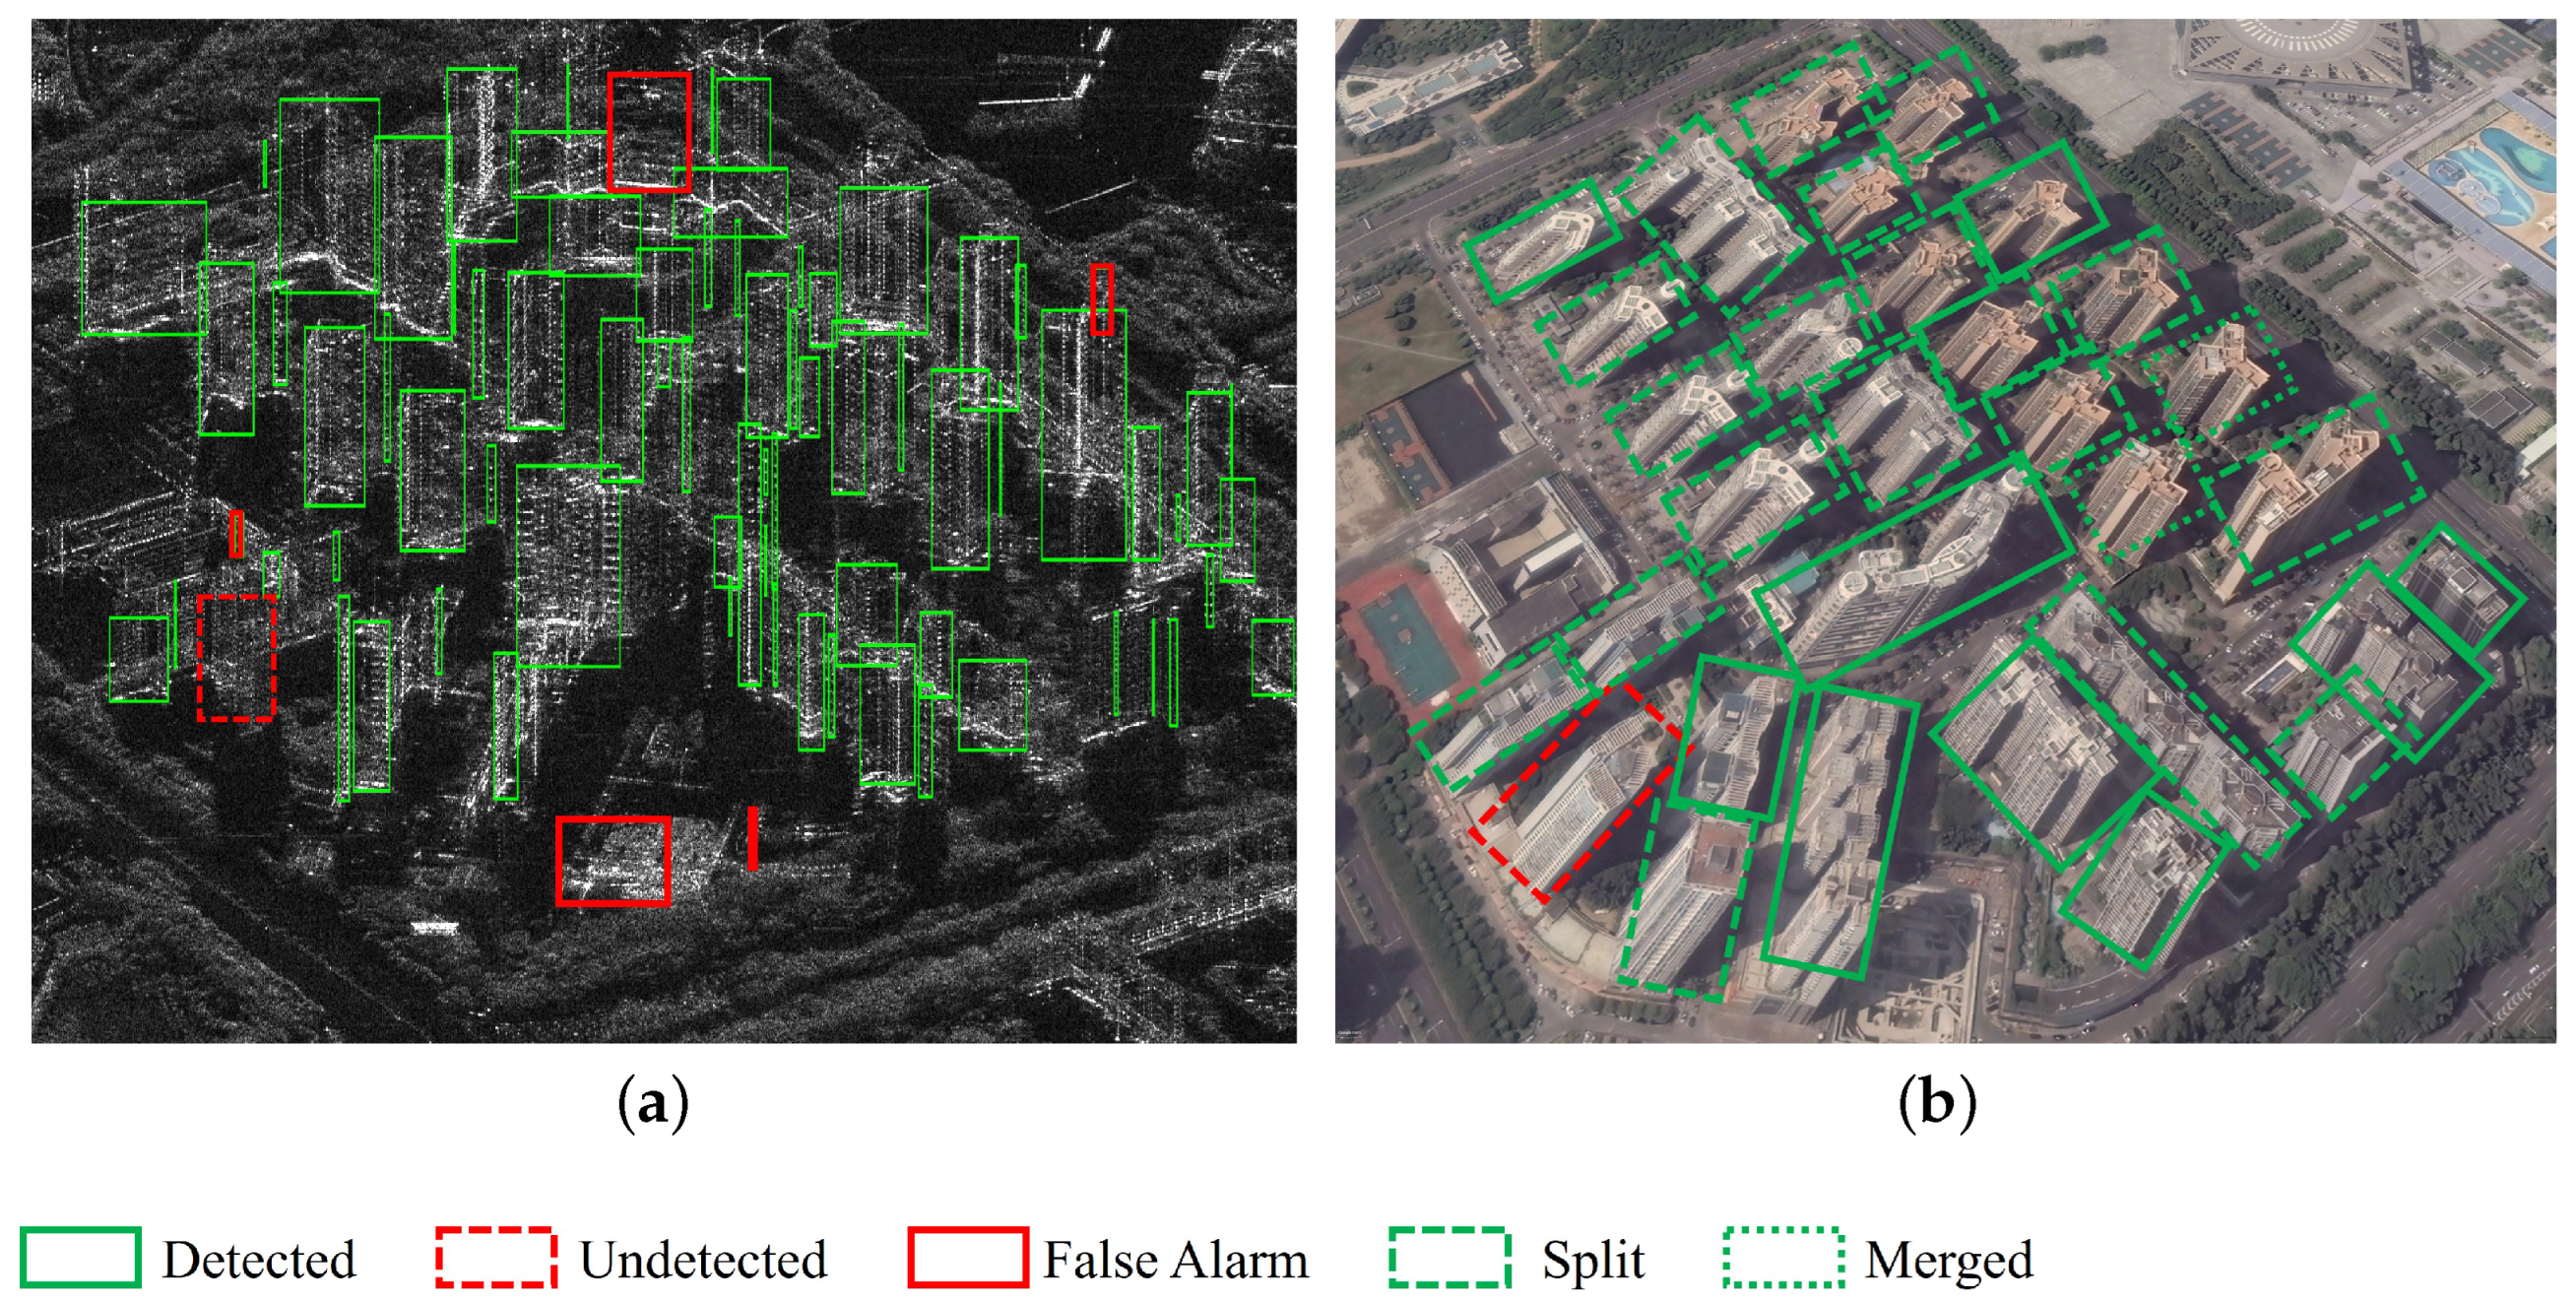
4.2.2. Qualitative Evaluation

In this section, we conduct a qualitative analysis of the results of each experimental data. Figure 14, Figure 15, Figure 16, Figure 17 and Figure 18 shows the high-rise building extraction results using the HRBE-PM method. The left subfigures display the extraction results on SAR images, and the right subfigures are the corresponding high-rise buildings shown in optical images. In these figures, the green solid line box indicates the correctly detected high-rise building, and the red dotted line box represents the undetected building. The red solid line box denotes a false alarm and is marked on SAR images. The green longer dashed box means the split results and is labeled on optical images. The green dotted box represents the merged results and is marked on optical images.
The upper left corner of data 1 in Figure 14 is a residential area with seven high-rise buildings. Due to the close distance between them, two buildings were eventually detected as one. The middle part is a commercial area with various building types. On the SAR image, they appear as long bright azimuth lines distributed along the range direction, bright spots evenly distributed along the range and azimuth directions, etc. Three false alarms were generated due to low-rise buildings. Two undetected objects were caused by fuzzy facade features. The merged results on the upper right of Figure 14 may be due to the close distance and similar appearance of the two adjacent buildings. The lower right part is a residential area. In this part, we can see that our method has better detection results on high-rise buildings that are regularly distributed, have a certain spatial distance, and have obvious facade features. In this case, more complete and accurate detection results can be obtained.
The objects in data 2 in Figure 15 are mostly residential buildings. Since the selected scene area is large, there are various types of buildings. The upper left area has relatively better extraction results. There are more missed detections in the residential areas in the upper right corner and lower left corner. Observing the red dotted box in Figure 15a, we can see that most of the missed detections are because the facades of high-rise buildings do not show salient features in the SAR image. These undetected high-rise buildings can barely be identified through manual observation based on double bounce bright lines and facade textures. The facades of the three buildings on the right side of the figure appear as bright planes. And we can only extract one-pixel-wide FR parts, which are filtered out in the postprocessing step because their azimuth sizes are too narrow. The false alarm at the bottom of Figure 15a is caused by the light poles in the park distributed along the range direction.
The scene of data 3 in Figure 16 is a residential area with several types of buildings, which mostly appear as bright spots distributed along the range direction on SAR images. Due to the relatively loose spatial distribution, there is no excessive interference between buildings on SAR images, so the overall best extraction effect is achieved. The missed detection in Figure 16a is due to the fact that the SAR signal of this building is completely subsumed under the echoes of the two buildings above and below.
Data 4, shown in Figure 17, is a three-block residential area, and there are some different types of high-rise buildings in the scene. The distribution of high-rise buildings in the upper part is extremely dense, and the buildings are distributed along curves. The diversity of building orientations brings difficulty to the extraction of DB parts. Facade parts become the main component of building hypotheses. The undetected results are caused by the non-significant facade representation. The false alarm in the lower left corner of Figure 17 is caused by the special structure of the gymnasium, and those in the lower right corner of Figure 17 are caused by roads at a specific incident angle. The split results deserve attention, and are analyzed together with data 5 in the following.
Data 5, shown in Figure 18, is a residential area in a block, with a total of several types of high-rise buildings. Although high-rise buildings are basically distributed along straight lines, the spatial density is still very high. From Figure 18, most of the high-rise buildings are extracted. The reason for the one missed detection is that the building facade has no obvious bright features. False alarms arise from low-rise buildings or other disturbing elements of the urban area. In data 4 and 5, the proportion of split buildings is high. Carefully observe the corresponding optical images, and we can find that the distribution of buildings in these two areas is very crowded, and they are all residential buildings. The building type occupying the largest proportion in these two areas is a cuboid that is raised in multiple directions, which appears as bright lines or bright spots on the facade with a certain distance along the azimuth direction in the SAR images. Due to the crowded distribution, the double bounce bright lines at the bottom of the buildings at the near range end may be blocked by the top of the buildings at the far range end. Moreover, the vegetation in urban areas will also affect the detection of double bounce bright lines. As a result, with only azimuthally dispersed facade parts and incomplete DB parts, it is easy for a high-rise building to be detected as multiple split buildings.

4.2.3. Quantitative Evaluation

The quantitative evaluation results of the HRBE-PM method are shown in Table 2. We counted the total number of high-rise buildings, the number of correctly extracted buildings, and false alarms in each area by comparison of optical images from multiple periods. Other commonly used indicators were also calculated. The split means that one high-rise building is detected as multiple buildings, and the merged refers to when multiple high-rise buildings are detected as one building. To further validate the extraction performance, evaluation indexes such as Precision, Recall, and F1-score are used:
P r e c i s i o n = T P T P + F P
R e c a l l = T P T P + F N
F 1 - s c o r e = 2 × P r e c i s i o n × R e c a l l P r e c i s i o n + R e c a l l
where TP represents true positive, FP is false positive, and FN stands for false negative. In this paper, TP is the number of buildings successfully extracted, FP is the number of false alarms, and FN is the numbers of buildings undetected.
To sum up, the extraction precision rate of the HRBE-PM method reaches 91.12%, the recall rate is 90.77%, and the F1-score is 0.91. From the results of the five datasets, the extraction precision rate is higher than 85.29%, the recall rate is higher than 82.95%, and the F1-score is higher than 0.87, verifying the effectiveness of the HRBE-PM method. From the perspective of resolution, there are more split results in images with submeter resolution, and there tend to be more merged results under meter resolution. The various types of high-rise buildings did not significantly affect the extraction results, indicating that the HRBE-PM method is highly robust and can be applied to a variety of high-rise buildings with significant facade features. In areas with “crowd” building density, the split results increase significantly, which is also related to the characteristics of residential buildings in the selected data.

4.3. Selection of HRBE-PM Method Parameters

In this section, we discuss how the parameters in the HRBE-PM method are set. Some of them are related to the image resolution, and some have clear physical meanings and can be set a priori. Next, we follow the sequence of experimental steps to illustrate.
In Section 3.2, salient features are extracted. Two parameters need to be set in this step. The first is the number of the shells, which relates to the width of the lines and the size of the points we can detect. Normally, the double bounce lines will be thicker than the bright spots and bright lines on the facade. In order to facilitate the extraction of DB parts, the setting of this parameter needs to be larger than the size of the salient features of the facade. Additionally, the larger the number of shells, the longer the spot filter takes to run. So larger is not always better. It is enough to be able to distinguish DB parts and facade parts. The second parameter that needs to be set is T s . The points whose values in S 1 and S 2 are greater than T s are the extracted salient features. The salient features of high-rise buildings usually have large amplitudes in SAR images. According to the proportion of high-rise building pixels in the test image, T s can take the value of the 8–10% quantile of S 1 and S 2 sorted from large to small. In this paper, we take the number of shells as 7 and T s as the 9 % quantile.
In Section 3.3, high-rise building parts are generated. This step requires setting three parameters. The first one is the voting search range L r a n g e when generating FR parts. This parameter is related to the floor height of high-rise buildings. Define the floor height of high-rise buildings in SAR images as H f l o o r . It can be seen from the analysis in Section 2.2 that the bright features of the facade may appear on every floor or every two floors. Considering that high-rise buildings are usually larger than 10 floors, set L r a n g e to H f l o o r · 2 · 10 . For the dataset used in this paper, H f l o o r is usually 5 pixels, so L r a n g e is set to 100. The second parameter R b d is related to the width of the double bounce lines, and will also be affected by the number of shells set. This parameter can be set slightly smaller to ensure that as many DB parts as possible are extracted, and the impact of falsely detected DB parts will be eliminated when spatial information is introduced. The third parameter, R f b l , is related to the height of the building facade. Set R f b l to 15 m–18 m to accommodate the bright line disconnection. In this paper, R b d is set to 5 pixels and R f b l is set to 17.5 m.
In Section 3.4, building hypotheses are generated. This step requires setting three parameters to limit the maximum distance between different parts. The first parameter L b f limits the maximum distance between facade parts and DB parts. The structure of the bottom 1–2 floors of some buildings is different from other floors and shows different characteristics on SAR images, so it will not be detected as facade parts. Considering this situation, the length of L b f is usually set to the height of 2–3 floors. L b b describes the largest distance between DB parts. Considering the azimuth width of high-rise buildings, L b b can be set to 10 m–12 m. L f f represents the furthest distance between facade parts. It is related to the building structure in the azimuth direction and the floor height in the range direction, which can be set to the height of 2–3 floors. In this paper, we set the L b f to 30 pixels, the L b b to 10 m, and the L f f to 20 pixels.
In Section 3.5, optimal building hypotheses are selected. There are four parameters that need to be set in this step. First, the determination of the sigmoid function Equation (2) requires setting d 0.5 and d 0.99 , and it needs to set, respectively, for the above three types of distance D b f , D b b , and D f f . In this paper, the shorter the distance between parts, the greater the possibility that they belong to the same building, and the greater the output of the sigmoid function. d 0.5 is the distance such that the sigmoid is equal to 0.5 , usually set near the maximum distance. d 0.99 is the value that makes the sigmod equal to 0.99 and can be set to 1–5. Taking D b f as an example, we set d 0.5 to 25 pixels and d 0.5 to 2 pixels. The third parameter is γ of the exp function Equation (3), which controls how much the indicator S c o m p l e t e is affected by the sum of the edge scores ( s i ) . After the sum of edge scores exceeds a certain value, the impact of more edges on the overall score decreases significantly. The larger the γ , the smaller the scoring benefit brought by more edges. Normally, γ takes 0.2 0.3 . In this paper, it is taken as 0.2 . The fourth parameter that needs to be set, β in Equation (5), controls the proportion of the two indicators in the final score. The larger the β , the more important S c o m p l e t e is relative to S c o m p a c t . After many attempts, β can be set to 2–3. In this paper, it is taken as 2.

5. Discussion

In this section, we discuss the advantages and restrictions of the HRBE-PM method, as well as the possible future research directions.
First, the HRBE-PM method is compared with existing high-rise building extraction methods to illustrate the advantages of HRBE-PM in extracting various types of high-rise buildings. There are two high-rise building extraction methods based on single high-resolution SAR image in the literature. One is the high-rise building extraction method in [22,23,24] for buildings whose facades appear as regular highlights evenly distributed in the range and azimuth direction. For convenience, it is represented as HRBE-Reg in this article. The other is the high-rise building extraction method in [25] for buildings with facade corner lines and double bounce bright lines. For convenience, it is expressed as HRBE-CL in this article. Figure 19 shows the high-rise building extraction results of HRBE-Reg and HRBE-CL of data 1. The green box represents the extracted high-rise building, and the red box represents false alarm. Table 3 shows the comparison of quantitative results of these three methods.
As can be seen from Figure 19a, HRBE-Reg is mainly effective for high-rise buildings with regular bright spots on their facades, such as some buildings in the central part of data 1. It cannot detect high-rise buildings with facades appearing as regular bright lines or bright lines along the range direction. The extraction recall rate of HRBE-Reg is only 28.33% for data 1. In comparison, the recall rate of HRBE-CL is slightly higher at 41.67%. HRBE-CL is mainly effective for high-rise buildings with bright lines on their facades, such as some residential buildings in the upper left and lower right corners of data 1, but is ineffective for high-rise buildings with regular bright spots and lines on their facades. The HRBE-PM proposed in this paper achieves a recall rate of 93.33% and an F1-score of 0.93 for multiple types of high-rise buildings in data 1, demonstrating its advantages over existing high-rise building detection methods in extracting various types of high-rise buildings.
Despite satisfactory high-rise building extraction performance under meter and submeter resolutions, HRBE-PM still has some restrictions. For example, as analyzed in Section 4.2.2, HRBE-PM cannot extract high-rise buildings whose facades are non-obvious or appear as bright planes; there may be many split results in dense residential areas. Low-rise buildings, roads, etc., in urban scenes may be identified as high-rise buildings at certain incident angles.
Considering these limitations of HRBE-PM, we will improve it in the following aspects: introducing geographical information such as road networks and river networks to remove false alarms; in addition to the salient features of bright spots and bright lines, introduce plane information to capture the building texture and describe the facade characteristics of high-rise buildings more comprehensively; add parts and rules related to low-rise buildings to detect buildings of different heights at the same time; use a large amount of real and simulated data to train for parts and their relationships instead of defining them manually.

6. Conclusions

In this paper, we propose a high-rise building extraction method suitable for a single HR SAR image. Different from other methods presented in the previous literature that have specific requirements for the facade characteristics of high-rise buildings, the proposed model and method can work for various types of high-rise buildings. This paper has the following main novelties and contributions:
(a)
A unified part model, named high-rise building part model, is constructed to describe high-rise buildings in HR SAR images, including a facade regularity (FR) part, facade bright line (FBL) part, double bounce (DB) part, and spatial topology relationships between them.
(b)
A three-level framework based on the high-rise building part model, named HRBE-PM, is proposed to extract high-rise buildings, which makes full use of semantic and spatial topological information.
(c)
Two evaluation indicators of completeness and compactness are creatively proposed, which can distinguish two adjacent buildings while ensuring the integrity of a single high-rise building.
(d)
The HRBE-PM method does not require any auxiliary data and is suitable for extracting different types of high-rise buildings in most single HR SAR images.
Multiple dataset experiments verified the effectiveness of the HRBE-PM method; the precision rate can reach 85.29%, the recall rate can reach 82.95%, and the F1-score can reach 0.87 even in the worst cases. Experimental results show that the proposed HRBE-PM method can accurately extract high-rise buildings regardless of their types and density using a single HR SAR image in commercial and residential scenes.

Author Contributions

Conceptualization, N.L.; methodology, N.L.; software, N.L.; validation, N.L., X.L. and F.L.; formal analysis, N.L., X.L., W.H. and W.W.; investigation, N.L.; resources, X.L. and W.H.; data curation, W.H. and F.L.; writing—original draft preparation, N.L.; writing—review and editing, N.L., X.L., W.H., F.L. and W.W.; visualization, N.L.; supervision, X.L., W.H., F.L. and W.W.; funding acquisition, W.W. and F.L. All authors have read and agreed to the published version of the manuscript.

Funding

This research was supported by the National Key Research and Development Program of China (2022YFB3902100) and the National Natural Science Foundation of China (62171435).

Data Availability Statement

Data is contained within the article.

Conflicts of Interest

The authors declare no conflicts of interest.

References

  1. Ge, N.; Gonzalez, F.R.; Wang, Y.; Shi, Y.; Zhu, X.X. Spaceborne Staring Spotlight SAR Tomography—A First Demonstration With TerraSAR-X. IEEE J. Sel. Top. Appl. Earth Obs. Remote Sens. 2018, 11, 3743–3756. [Google Scholar] [CrossRef]
  2. Brunner, D.; Lemoine, G.; Bruzzone, L. Earthquake Damage Assessment of Buildings Using VHR Optical and SAR Imagery. IEEE Trans. Geosci. Remote Sens. 2010, 48, 2403–2420. [Google Scholar] [CrossRef]
  3. Lu, H.; Zhang, H.; Deng, Y.; Wang, J.; Yu, W. Building 3-D Reconstruction With a Small Data Stack Using SAR Tomography. IEEE J. Sel. Top. Appl. Earth Obs. Remote Sens. 2020, 13, 2461–2474. [Google Scholar] [CrossRef]
  4. Zhang, X.; Chen, Y.; Jia, M.; Tong, L.; Lu, Y.; Cao, Y. The study of road damage detection based on high-resolution SAR image. In Proceedings of the 2013 IEEE International Geoscience and Remote Sensing Symposium—IGARSS, Melbourne, VIC, Australia, 21–26 July 2013; pp. 2633–2636. [Google Scholar] [CrossRef]
  5. Li, Y.; Zhang, R.; Wu, Y. Road network extraction in high-resolution SAR images based CNN features. In Proceedings of the 2017 IEEE International Geoscience and Remote Sensing Symposium (IGARSS), Fort Worth, TX, USA, 23–28 July 2017; pp. 1664–1667. [Google Scholar] [CrossRef]
  6. Ferro, A.; Brunner, D.; Bruzzone, L. Automatic Detection and Reconstruction of Building Radar Footprints From Single VHR SAR Images. IEEE Trans. Geosci. Remote Sens. 2013, 51, 935–952. [Google Scholar] [CrossRef]
  7. Marin, C.; Bovolo, F.; Bruzzone, L. Building Change Detection in Multitemporal Very High Resolution SAR Images. IEEE Trans. Geosci. Remote Sens. 2015, 53, 2664–2682. [Google Scholar] [CrossRef]
  8. Aimaiti, Y.; Sanon, C.; Koch, M.; Baise, L.G.; Moaveni, B. War Related Building Damage Assessment in Kyiv, Ukraine, Using Sentinel-1 Radar and Sentinel-2 Optical Images. Remote Sens. 2022, 14, 6239. [Google Scholar] [CrossRef]
  9. Wu, W.; Guo, H.; Li, X.; Ferro-Famil, L.; Zhang, L. Urban Land Use Information Extraction Using the Ultrahigh-Resolution Chinese Airborne SAR Imagery. IEEE Trans. Geosci. Remote Sens. 2015, 53, 5583–5599. [Google Scholar] [CrossRef]
  10. Wu, W.; Guo, H.; Li, X. Urban Area Man-Made Target Detection for PolSAR Data Based on a Nonzero-Mean Statistical Model. IEEE Geosci. Remote Sens. Lett. 2014, 11, 1782–1786. [Google Scholar] [CrossRef]
  11. Wu, W.; Li, X.; Guo, H.; Ferro-Famil, L.; Zhang, L. Noncircularity Parameters and Their Potential Applications in UHR MMW SAR Data Sets. IEEE Geosci. Remote Sens. Lett. 2016, 13, 1547–1551. [Google Scholar] [CrossRef]
  12. Liu, Q.; Li, Q.; Yu, W.; Hong, W. Automatic Building Detection for Multi-Aspect SAR Images Based on the Variation Features. Remote Sens. 2022, 14, 1409. [Google Scholar] [CrossRef]
  13. Li, H.; Zhu, F.; Zheng, X.; Liu, M.; Chen, G. MSCDUNet: A Deep Learning Framework for Built-Up Area Change Detection Integrating Multispectral, SAR, and VHR Data. IEEE J. Sel. Top. Appl. Earth Obs. Remote Sens. 2022, 15, 5163–5176. [Google Scholar] [CrossRef]
  14. Shahzad, M.; Maurer, M.; Fraundorfer, F.; Wang, Y.; Zhu, X.X. Buildings Detection in VHR SAR Images Using Fully Convolution Neural Networks. IEEE Trans. Geosci. Remote Sens. 2019, 57, 1100–1116. [Google Scholar] [CrossRef]
  15. Gui, R.; Xu, X.; Dong, H.; Song, C.; Pu, F. Individual Building Extraction from TerraSAR-X Images Based on Ontological Semantic Analysis. Remote Sens. 2016, 8, 708. [Google Scholar] [CrossRef]
  16. Sun, Y.; Hua, Y.; Mou, L.; Zhu, X.X. CG-Net: Conditional GIS-Aware Network for Individual Building Segmentation in VHR SAR Images. IEEE Trans. Geosci. Remote Sens. 2022, 60, 1–15. [Google Scholar] [CrossRef]
  17. Standard JGJ3-2010; Technical Specification for Concrete Structures of Tall Building. China Architecture & Building Press: Beijing, China, 2011.
  18. Guo, R.; Wang, F.; Zang, B.; Jing, G.; Xing, M. High-Rise Building 3D Reconstruction with the Wrapped Interferometric Phase. Sensors 2019, 19, 1439. [Google Scholar] [CrossRef]
  19. Liu, W.; Suzuki, K.; Yamazaki, F. Height estimation for high-rise buildings based on InSAR analysis. In Proceedings of the 2015 Joint Urban Remote Sensing Event (JURSE), Lausanne, Switzerland, 30 March–1 April 2015; pp. 1–4. [Google Scholar] [CrossRef]
  20. Sun, Y.; Mou, L.; Wang, Y.; Montazeri, S.; Zhu, X.X. Large-scale building height retrieval from single SAR imagery based on bounding box regression networks. ISPRS J. Photogramm. Remote Sens. 2022, 184, 79–95. [Google Scholar] [CrossRef]
  21. Gernhardt, S.; Auer, S.; Eder, K. Persistent scatterers at building facades – Evaluation of appearance and localization accuracy. ISPRS J. Photogramm. Remote Sens. 2015, 100, 92–105. [Google Scholar] [CrossRef]
  22. Auer, S.; Gisinger, C.; Tao, J. Characterization of Facade Regularities in High-Resolution SAR Images. IEEE Trans. Geosci. Remote Sens. 2015, 53, 2727–2737. [Google Scholar] [CrossRef]
  23. Chen, J.; Zhang, B.; Wang, C.; Zhang, H.; Wu, F. Building features extraction based on facade regularities using TerraSAR-X ST data. In Proceedings of the 2015 IEEE 5th Asia-Pacific Conference on Synthetic Aperture Radar (APSAR), Singapore, 1–4 September 2015; pp. 325–328. [Google Scholar] [CrossRef]
  24. Chen, J.; Zhang, B.; Wang, C.; Zhang, H.; Wu, F. Building Detection from Urban High-Resolution SAR Image Based on Facade Regularities. In Proceedings of the EUSAR 2016: 11th European Conference on Synthetic Aperture Radar, Hamburg, Germany, 6–9 June 2016; pp. 1–4. [Google Scholar]
  25. Tang, K.; Liu, B.; Zou, B. High-rise building detection in dense urban area based on high resolution SAR images. In Proceedings of the 2016 IEEE International Geoscience and Remote Sensing Symposium (IGARSS), Beijing, China, 10–15 July 2016; pp. 1568–1571. [Google Scholar] [CrossRef]
  26. Felzenszwalb, P.F.; Girshick, R.B.; McAllester, D.; Ramanan, D. Object Detection with Discriminatively Trained Part-Based Models. IEEE Trans. Pattern Anal. Mach. Intell. 2010, 32, 1627–1645. [Google Scholar] [CrossRef]
  27. Felzenszwalb, P.F.; Girshick, R.B.; McAllester, D. Cascade object detection with deformable part models. In Proceedings of the 2010 IEEE Computer Society Conference on Computer Vision and Pattern Recognition, San Francisco, CA, USA, 13–18 June 2010; pp. 2241–2248. [Google Scholar] [CrossRef]
  28. Tian, B.; Li, Y.; Li, B.; Wen, D. Rear-View Vehicle Detection and Tracking by Combining Multiple Parts for Complex Urban Surveillance. IEEE Trans. Intell. Transp. Syst. 2014, 15, 597–606. [Google Scholar] [CrossRef]
  29. Yang, H.; Cao, Z.; Pi, Y.; Liu, S. Target Detection in High-Resolution SAR Images via Searching for Part Models. IEEE Geosci. Remote Sens. Lett. 2017, 14, 664–668. [Google Scholar] [CrossRef]
  30. Thiele, A.; Cadario, E.; Schulz, K.; Soergel, U. Analysis of Gable-Roofed Building Signature in Multiaspect InSAR Data. IEEE Geosci. Remote Sens. Lett. 2010, 7, 83–87. [Google Scholar] [CrossRef]
  31. Brunner, D.; Lemoine, G.; Bruzzone, L.; Greidanus, H. Building Height Retrieval From VHR SAR Imagery Based on an Iterative Simulation and Matching Technique. IEEE Trans. Geosci. Remote Sens. 2010, 48, 1487–1504. [Google Scholar] [CrossRef]
  32. Franceschetti, G.; Iodice, A.; Riccio, D. A canonical problem in electromagnetic backscattering from buildings. IEEE Trans. Geosci. Remote Sens. 2002, 40, 1787–1801. [Google Scholar] [CrossRef]
  33. Zhang, F.; Shao, Y.; Zhang, X.; Balz, T. Building L-shape footprint extraction from high resolution SAR image. In Proceedings of the 2011 Joint Urban Remote Sensing Event, Munich, Germany, 11–13 April 2011; pp. 273–276. [Google Scholar] [CrossRef]
  34. Brunner, D.; Bruzzone, L.; Ferro, A.; Lemoine, G. Analysis of the reliability of the double bounce scattering mechanism for detecting buildings in VHR SAR images. In Proceedings of the 2009 IEEE Radar Conference, Pasadena, CA, USA, 4–8 May 2009; pp. 1–6. [Google Scholar] [CrossRef]
  35. Ferro, A.; Brunner, D.; Bruzzone, L.; Lemoine, G. On the Relationship Between Double Bounce and the Orientation of Buildings in VHR SAR Images. IEEE Geosci. Remote Sens. Lett. 2011, 8, 612–616. [Google Scholar] [CrossRef]
  36. Tison, C.; Tupin, F.; Maitre, H. Retrieval of building shapes from shadows in high resolution SAR interferometric images. In Proceedings of the IGARSS 2004—2004 IEEE International Geoscience and Remote Sensing Symposium, Anchorage, AK, USA, 20–24 September 2004; Volume 3, pp. 1788–1791. [Google Scholar] [CrossRef]
  37. Ok, A.O. Automated detection of buildings from single VHR multispectral images using shadow information and graph cuts. ISPRS J. Photogramm. Remote Sens. 2013, 86, 21–40. [Google Scholar] [CrossRef]
  38. Li, Y.; Tian, B.; Li, B.; Xiong, G.; Zhu, F.; Wang, K. Vehicle detection with a part-based model for complex traffic conditions. In Proceedings of the 2013 IEEE International Conference on Vehicular Electronics and Safety, Dongguan, China, 28–30 July 2013; pp. 110–113. [Google Scholar] [CrossRef]
  39. Ødegaard, N.; Knapskog, A.O.; Cochin, C.; Louvigne, J.C. Classification of ships using real and simulated data in a convolutional neural network. In Proceedings of the 2016 IEEE Radar Conference (RadarConf), Philadelphia, PA, USA, 2–6 May 2016; pp. 1–6. [Google Scholar] [CrossRef]
  40. Malmgren-Hansen, D.; Kusk, A.; Dall, J.; Nielsen, A.A.; Engholm, R.; Skriver, H. Improving SAR Automatic Target Recognition Models With Transfer Learning From Simulated Data. IEEE Geosci. Remote Sens. Lett. 2017, 14, 1484–1488. [Google Scholar] [CrossRef]
  41. Qian, K.; Wang, Y.; Shi, Y.; Zhu, X.X. γ-Net: Superresolving SAR Tomographic Inversion via Deep Learning. IEEE Trans. Geosci. Remote Sens. 2022, 60, 1–16. [Google Scholar] [CrossRef]
  42. Zhu, X.X.; Montazeri, S.; Ali, M.; Hua, Y.; Wang, Y.; Mou, L.; Shi, Y.; Xu, F.; Bamler, R. Deep Learning Meets SAR: Concepts, models, pitfalls, and perspectives. IEEE Geosci. Remote Sens. Mag. 2021, 9, 143–172. [Google Scholar] [CrossRef]
  43. Gernhardt, S. High Precision 3D Localization and Motion Analysis of Persistent Scatterers Using Meter-Resolution Radar Satellite Data. Ph.D. Thesis, Technische Universität München, Munich, Germany, 2011. [Google Scholar]
  44. Schunert, A.; Soergel, U. Grouping of Persistent Scatterers in high-resolution SAR data of urban scenes. ISPRS J. Photogramm. Remote Sens. 2012, 73, 80–88. [Google Scholar] [CrossRef]
  45. Lee, J.S. Speckle analysis and smoothing of synthetic aperture radar images. Comput. Graph. Image Process. 1981, 17, 24–32. [Google Scholar] [CrossRef]
  46. Frost, V.S.; Stiles, J.A.; Shanmugan, K.S.; Holtzman, J.C. A Model for Radar Images and Its Application to Adaptive Digital Filtering of Multiplicative Noise. IEEE Trans. Pattern Anal. Mach. Intell. 1982; PAMI-4, 157–166. [Google Scholar] [CrossRef]
  47. Xu, B.; Cui, Y.; Li, Z.; Yang, J. An Iterative SAR Image Filtering Method Using Nonlocal Sparse Model. IEEE Geosci. Remote Sens. Lett. 2015, 12, 1635–1639. [Google Scholar] [CrossRef]
  48. Kohnle, A.; Neuwirth, R.; Schuberth, W.; Stein, K.; Hoehn, D.H.; Gabler, R.; Hofmann, L.; Euing, W. Evaluation of essential design criteria for IRST systems. In Proceedings of the Infrared Technology XIX; Andresen, B.F., Shepherd, F.D., Eds.; International Society for Optics and Photonics, SPIE: Bellingham, WA, USA, 1993; Volume 2020, pp. 76–92. [Google Scholar] [CrossRef]
  49. Michaelsen, E.; Stilla, U. Estimating urban activity on high-resolution thermal image sequences aided by large scale vector maps. In Proceedings of the IEEE/ISPRS Joint Workshop on Remote Sensing and Data Fusion over Urban Areas (Cat. No.01EX482), Rome, Italy, 8–9 November 2001; pp. 25–29. [Google Scholar] [CrossRef]
Figure 1. Scattering profile for a high-rise building with width w and height h. The SAR image on the right is used to understand layover and double bounce line. The legend is at the bottom. The gray values at the bottom of the figure correspond to the relative amplitudes.
Remotesensing 16 01278 g001
Figure 2. Schematic diagram of high-rise building part model. The legend is on the right.
Remotesensing 16 01278 g002
Figure 3. Display of HR SAR images and corresponding optical images of different types of high-rise buildings. The range and azimuth resolution of SAR images in (ae) are 0.58 m and 1.1 m, and the range and azimuth resolution of (fh) are 0.58 m and 0.23 m, respectively. Optical images of (ae) were captured by the author, and optical images of (fh) were obtained from Baidu Map Street View.
Remotesensing 16 01278 g003
Figure 4. Flowchat of the proposed method.
Remotesensing 16 01278 g004
Figure 5. Traditional and modified spot detector. (a). The traditional spot filter. (b). Modified spot detector for lines of 0 , named s 0 . (c). Modified spot detector for lines of 90 , named s 90 . (d). Modified spot detector for lines of 45 , named s 45 . (e). Modified spot detector for lines of 135 , named s 135 .
Remotesensing 16 01278 g005
Figure 6. Schematic diagram of FR part generation. (a) Midpoint selection in range direction. The white region is salient features and the magenta points are midpoints. (b) Selection of candidate points by voting. (c). Range grouping. (d) Azimuth grouping. (e) FR part extraction by integrating range grouping result and azimuth grouping result. (f) Five FR part extraction results. The blue box denotes FR part, and the magenta points are points involved in FR parts.
Remotesensing 16 01278 g006
Figure 7. Possible connection relationships between parts. The legend is on the right. (a) Detect facade parts from every DB part to near range end within L b f . (b) Detect DB parts from every DB part to far range end and increasing azimuth direction within L b b . (c) Detect facade parts from every facade part to far range end and increasing azimuth direction within L f f .
Remotesensing 16 01278 g007
Figure 8. Rules of combination of adjacent matrices for building hypothesis generation. The ✔ means corresponding adjacency matrices can be combined to generate a new adjacency matrix. Based on the new adjacency matrix, the connected subgraph is extracted, that is, the generation of building hypotheses.
Remotesensing 16 01278 g008
Figure 9. Example of functions in Equations (2) and (3). (a) Sigmoid function curve when d 0.5 = 25 and d 0.99 = 2 . (b) Function curve of Equation (3) when γ = 0.2 .
Remotesensing 16 01278 g009
Figure 10. Definition of indicator S c o m p a c t . The legend is on the right.
Remotesensing 16 01278 g010
Figure 11. Results of generated building parts and the corresponding graph of data 1. The results in the two white circles are enlarged and named Z 1 and Z 2 , respectively. The legend is at the bottom. (a) Results of generated building parts of data 1. (b) The corresponding graph structure of data 1.
Remotesensing 16 01278 g011
Figure 12. Results of maximal connected subgraph and generated building hypotheses of data 1. The results in the two white circles are enlarged and named Z 1 and Z 2 , respectively. (a) Results of maximal connected subgraph of data 1. Each thick green rectangle box represents the range of a maximal connected subgraph. (b) Generated building hypotheses of data 1. Each thin green rectangle box represents the range of a generated building hypothesis.
Remotesensing 16 01278 g012
Figure 13. Results of selection of optimal building hypotheses and postprocessing of data 1. The results in the two white circles are enlarged and named Z 1 and Z 2 , respectively. (a) Results after selection of optimal building hypotheses. (b) Results after postprocessing.
Remotesensing 16 01278 g013
Figure 14. The extraction result of data 1 (central latitude: 39°59′21.71″N central longitude: 116°28′42.96″E). The legend is at the bottom. (a) Extracted buildings on SAR image. (b) High-rise buildings in corresponding optical image.
Remotesensing 16 01278 g014
Figure 15. The extraction result of data 2 (central latitude: 39°58′30.13″N central longitude: 116°26′32.39″E). The legend is at the bottom. (a) Extracted buildings on SAR image. (b) High-rise buildings in corresponding optical image.
Remotesensing 16 01278 g015
Figure 16. The extraction result of data 3 (central latitude: 22°33′54.51″N central longitude: 113°51′23.61″E). The legend is at the bottom. (a) Extracted buildings on SAR image. (b) High-rise buildings in corresponding optical image.
Remotesensing 16 01278 g016
Figure 17. The extraction result of data 4 (central latitude: 22°33′43.71″N central longitude: 113°52′21.70″E). The legend is at the bottom. (a) Extracted buildings on SAR image. (b) High-rise buildings in corresponding optical image.
Remotesensing 16 01278 g017
Figure 18. The extraction result of data 5 (central latitude: 22°33′41.97″N central longitude: 113°52′57.26″E). The legend is at the bottom. (a) Extracted buildings on SAR image. (b) High-rise buildings in corresponding optical image.
Remotesensing 16 01278 g018
Figure 19. The high-rise building extraction results of HRBE-Reg and HRBE-CL on data 1. The green box represents a high-rise building, and the red box means false alarm. (a) Extraction results of HRBE-Reg. (b) Extraction results of HRBE-CL.
Remotesensing 16 01278 g019
Table 1. Basic information and characteristics of the experimental data from TerraSAR-X images.
Scene NumberScene LocationImage ModeAcquisition DateResolution *Dataset NumberImage Size (Pixels)Building Types NumberSpatial Density
1BeijingHS201307250.58 m × 1.1 m11660×1295manydense
21790×1880manydense
2ShenzhenST201608130.58 m × 0.23 m3950×3100severaldense
41340×3340somecrowd
51010×2746severalcrowd
* The resolution is shown in slant range × azimuth.
Table 2. Quantitative evaluation of the HRBE-PM method.
Dataset NumberNumber of BuildingsExtractionFalse AlarmsSplitMergedPrecision (%)Recall (%)F1-Score
160565101291.8093.330.93
2887375691.2582.950.87
34039110097.5097.500.98
44239518488.6492.860.91
53029521285.2996.670.91
Sum *26023623642491.1290.770.91
* Sum up the extracted results for data 1–5.
Table 3. Quantitative evaluation of the three methods on data 1.
Extraction MethodNumber of BuildingsExtractionFalse AlarmsSplitMergedPrecision (%) Recall (%)F1-Score
HRBE-Reg601704010028.330.44
HRBE-CL602515096.1541.670.58
HRBE-PM60565101291.8093.330.93
Disclaimer/Publisher’s Note: The statements, opinions and data contained in all publications are solely those of the individual author(s) and contributor(s) and not of MDPI and/or the editor(s). MDPI and/or the editor(s) disclaim responsibility for any injury to people or property resulting from any ideas, methods, instructions or products referred to in the content.

