Article

PRISMA Hyperspectral Remote Sensing Data for Mapping Alteration Minerals in Sar-e-Châh-e-Shur Region, Birjand, Iran

by
Jabar Habashi
1,
Hadi Jamshid Moghadam
1,
Majid Mohammady Oskouei
1,
Amin Beiranvand Pour
2,* and
Mazlan Hashim
3
1
Faculty of Mining Engineering, Sahand University of Technology, Tabriz 51335-1996, Iran
2
Institute of Oceanography and Environment (INOS), Higher Institution Center of Excellence (HICoE) in Marine Science, University Malaysia Terengganu (UMT), Kuala Nerus 21030, Malaysia
3
Faculty of Built Environment & Surveying, Universiti Teknologi Malaysia UTM, Johor Bahru 81310, Malaysia
*
Author to whom correspondence should be addressed.
Remote Sens. 2024, 16(7), 1277; https://doi.org/10.3390/rs16071277
Submission received: 4 March 2024 / Revised: 28 March 2024 / Accepted: 3 April 2024 / Published: 4 April 2024

Abstract

:
Remote sensing satellite imagery consistently provides valuable and frequent information, enabling the exploration of mineral resources across immense, remote and harsh domains. Recent developments in spaceborne hyperspectral remote sensing have opened avenues to support diverse remote sensing applications, particularly in the realm of mineral exploration. This study evaluates the capabilities of the PRecursore IperSpettrale della Missione Applicativa (PRISMA) hyperspectral satellite data for mapping alteration minerals using the Matched Filtering Unmixing (MFU) approach in the Sar-e-châh-e-shur, Birjand, Iran. Minerals such as richterite, augite, psilomelane, ilmenite, kaolinite, smectite, mirabilite, muscovite, and chlorite were identified using the vertex component analysis (VCA) technique. Subsequently, alteration mineral maps of the study area were generated using a matched filtering technique. Additionally, through the integration of X-ray diffraction (XRD) analysis, thin section examination, geochemical study of stream sediments, and interpretation of geological maps, potential alteration mineralization zones were delineated in the study area. Ultimately, the validation process, which included comparing the maps with the findings derived from the PRISMA remote sensing study, was conducted using the normal score equation. Thus, our results yielded a normalized score of 3.42 out of 4, signifying an 85.71% agreement with the regional geological characteristics of the study area. The results of this investigation highlight the substantial potential of the PRISMA dataset for systematic alteration mineral mapping and consequent exploration of ore minerals, specifically in challenging and inaccessible terrains.

1. Introduction

Hyperspectral remote sensing imagery has an exceptional ability to capture both the visual image and spectral details of targeted objects, simultaneously. The images contain numerous closely arranged and narrow spectral bands in the visible near-infrared (VNIR) to short-wave infrared (SWIR) regions [1,2]. Alteration mineral mapping is a crucial stage for ore mineral exploration and cost-effective management of mineral exploration campaigns. Alteration minerals exhibit distinctive spectral properties determined by their unique chemical bonding and physical attributes within the spectral span of 0.4 to 2.5 µm [3]. The pixels within hyperspectral images represent a spectral vector containing reflectance values within a particular wavelength region. This enables the extraction of spectral attributes of the mineral objects within the corresponding image pixel. On the other hand, multispectral remote sensing captures reflected energy across a wider but limited number of spectral bands [4]. Consequently, various minerals might exhibit similar spectral attributes using multispectral imagery. Thus, hyperspectral imagery, encompassing contiguous and comprehensive spectral capabilities, provides a more precise characterization of alteration minerals compared to multispectral remote sensing [2].
Recently, various hyperspectral sensors have been operating in the realm of mineral exploration, including (i) airborne hyperspectral sensors (e.g., the airborne visible/infrared imaging spectrometer next generation), (ii) spaceborne hyperspectral sensors (e.g., Hyperion and PRISMA), (iii) hyperspectral sensors integrated onto unmanned aerial vehicles, and (iv) handheld spectral sensors like analytical spectral devices [5]. The PRISMA spaceborne hyperspectral sensor, developed by the Italian Space Agency (ASI), was launched on 22 March 2019 and operates within a sun-synchronous orbit with a 29-day relook period [6]. It enables the capture of images with a superior signal-to-noise ratio (SNR) compared to the Hyperion sensor. Essentially, it serves as a satellite-based earth observation mission designed to provide spectroscopic imagery, fostering the development of innovative methods and applications for the management and analysis of ore mineral resources [2,7,8,9,10]. The coexistence of minerals with similar spectral properties often leads to spectral mixing, resulting in overlapping absorption regions and highly correlated spectra [11,12]. Light scattering effects further complicate spectral signatures [13]. These challenges, including diverse spectral features and limited ground samples, hinder the function of image processing algorithms and remote sensing sensors. Addressing these issues, the use of PRISMA hyperspectral imagery in mineral exploration across various geographic and geological settings highlights the adaptability and effectiveness of PRISMA imagery in overcoming challenges posed by spectral mixing, light scattering effects, and intricate spectral patterns [2,7,8,9,10].
The Principal Component Analysis (PCA), Minimum Noise Fraction (MNF), Independent Component Analysis (ICA), Adaptive Coherence Estimator (ACE), Random Forest (RF), XGboost (XGB), Support Vector Machine (SVM) and many other machine-learning-based classification algorithms were used for processing PRISMA data in mapping alteration minerals, identifying economic mineralization prospects, delineating dolomitization, obtaining high-quality reflectance estimations and achieving high-accuracy lithological mapping [2,7,8,9,10,14,15,16,17,18,19]. Additionally, novel approaches and algorithms such as the spectral hourglass, iterative informed spectral unmixing technique, fuzzy logic approach, GIS-based algorithm, and informed linear mixing model were implemented to PRISMA data to determine the potential of the dataset for automated alteration mineral identification in diverse environments [20,21,22,23,24,25]. The use of different algorithms and techniques further enhances the potential of the PRISMA dataset in various applications. These studies exclusively highlighted the versatility and effectiveness of PRISMA hyperspectral imagery in various geological applications from ore mineral exploration to lithological mapping.
The Sistan zone of eastern Iran, particularly in the Sar-e-châh-e-shur region (Figure 1A,B), exhibits significant potential for various ore mineralizations, including copper, zinc, and asbestos. Despite its geological richness, there exists a conspicuous absence of hyperspectral remote sensing analysis, explicitly tailored for alteration mineral mapping in this area. This research, therefore, endeavors to bridge this critical gap by pioneering the utilization of hyperspectral PRISMA imagery for mineral exploration in the Sar-e-châh-e-shur region by harnessing the capabilities of the PRISMA hyperspectral sensor. Therefore, the main objectives of this study include: (i) to detect alteration minerals utilizing the VNIR and SWIR bands of PRISMA imagery by applying the Matched Filtering Unmixing (MFU) approach, (ii) to assess the accuracy and reliability of alteration mineral mapping through comparisons with (XRD) analysis, thin section examination, geochemical study of stream sediments, and interpretation of geological maps, and (iii) to delineated the spatial distribution and abundance of potential alteration mineralization zones in the study area. By achieving these aims, this study seeks to enhance comprehension of the mineral resources available and enable well-informed decision making in the context of mineral exploration and resource management initiatives specific to the Sar-e-châh-e-shur region.

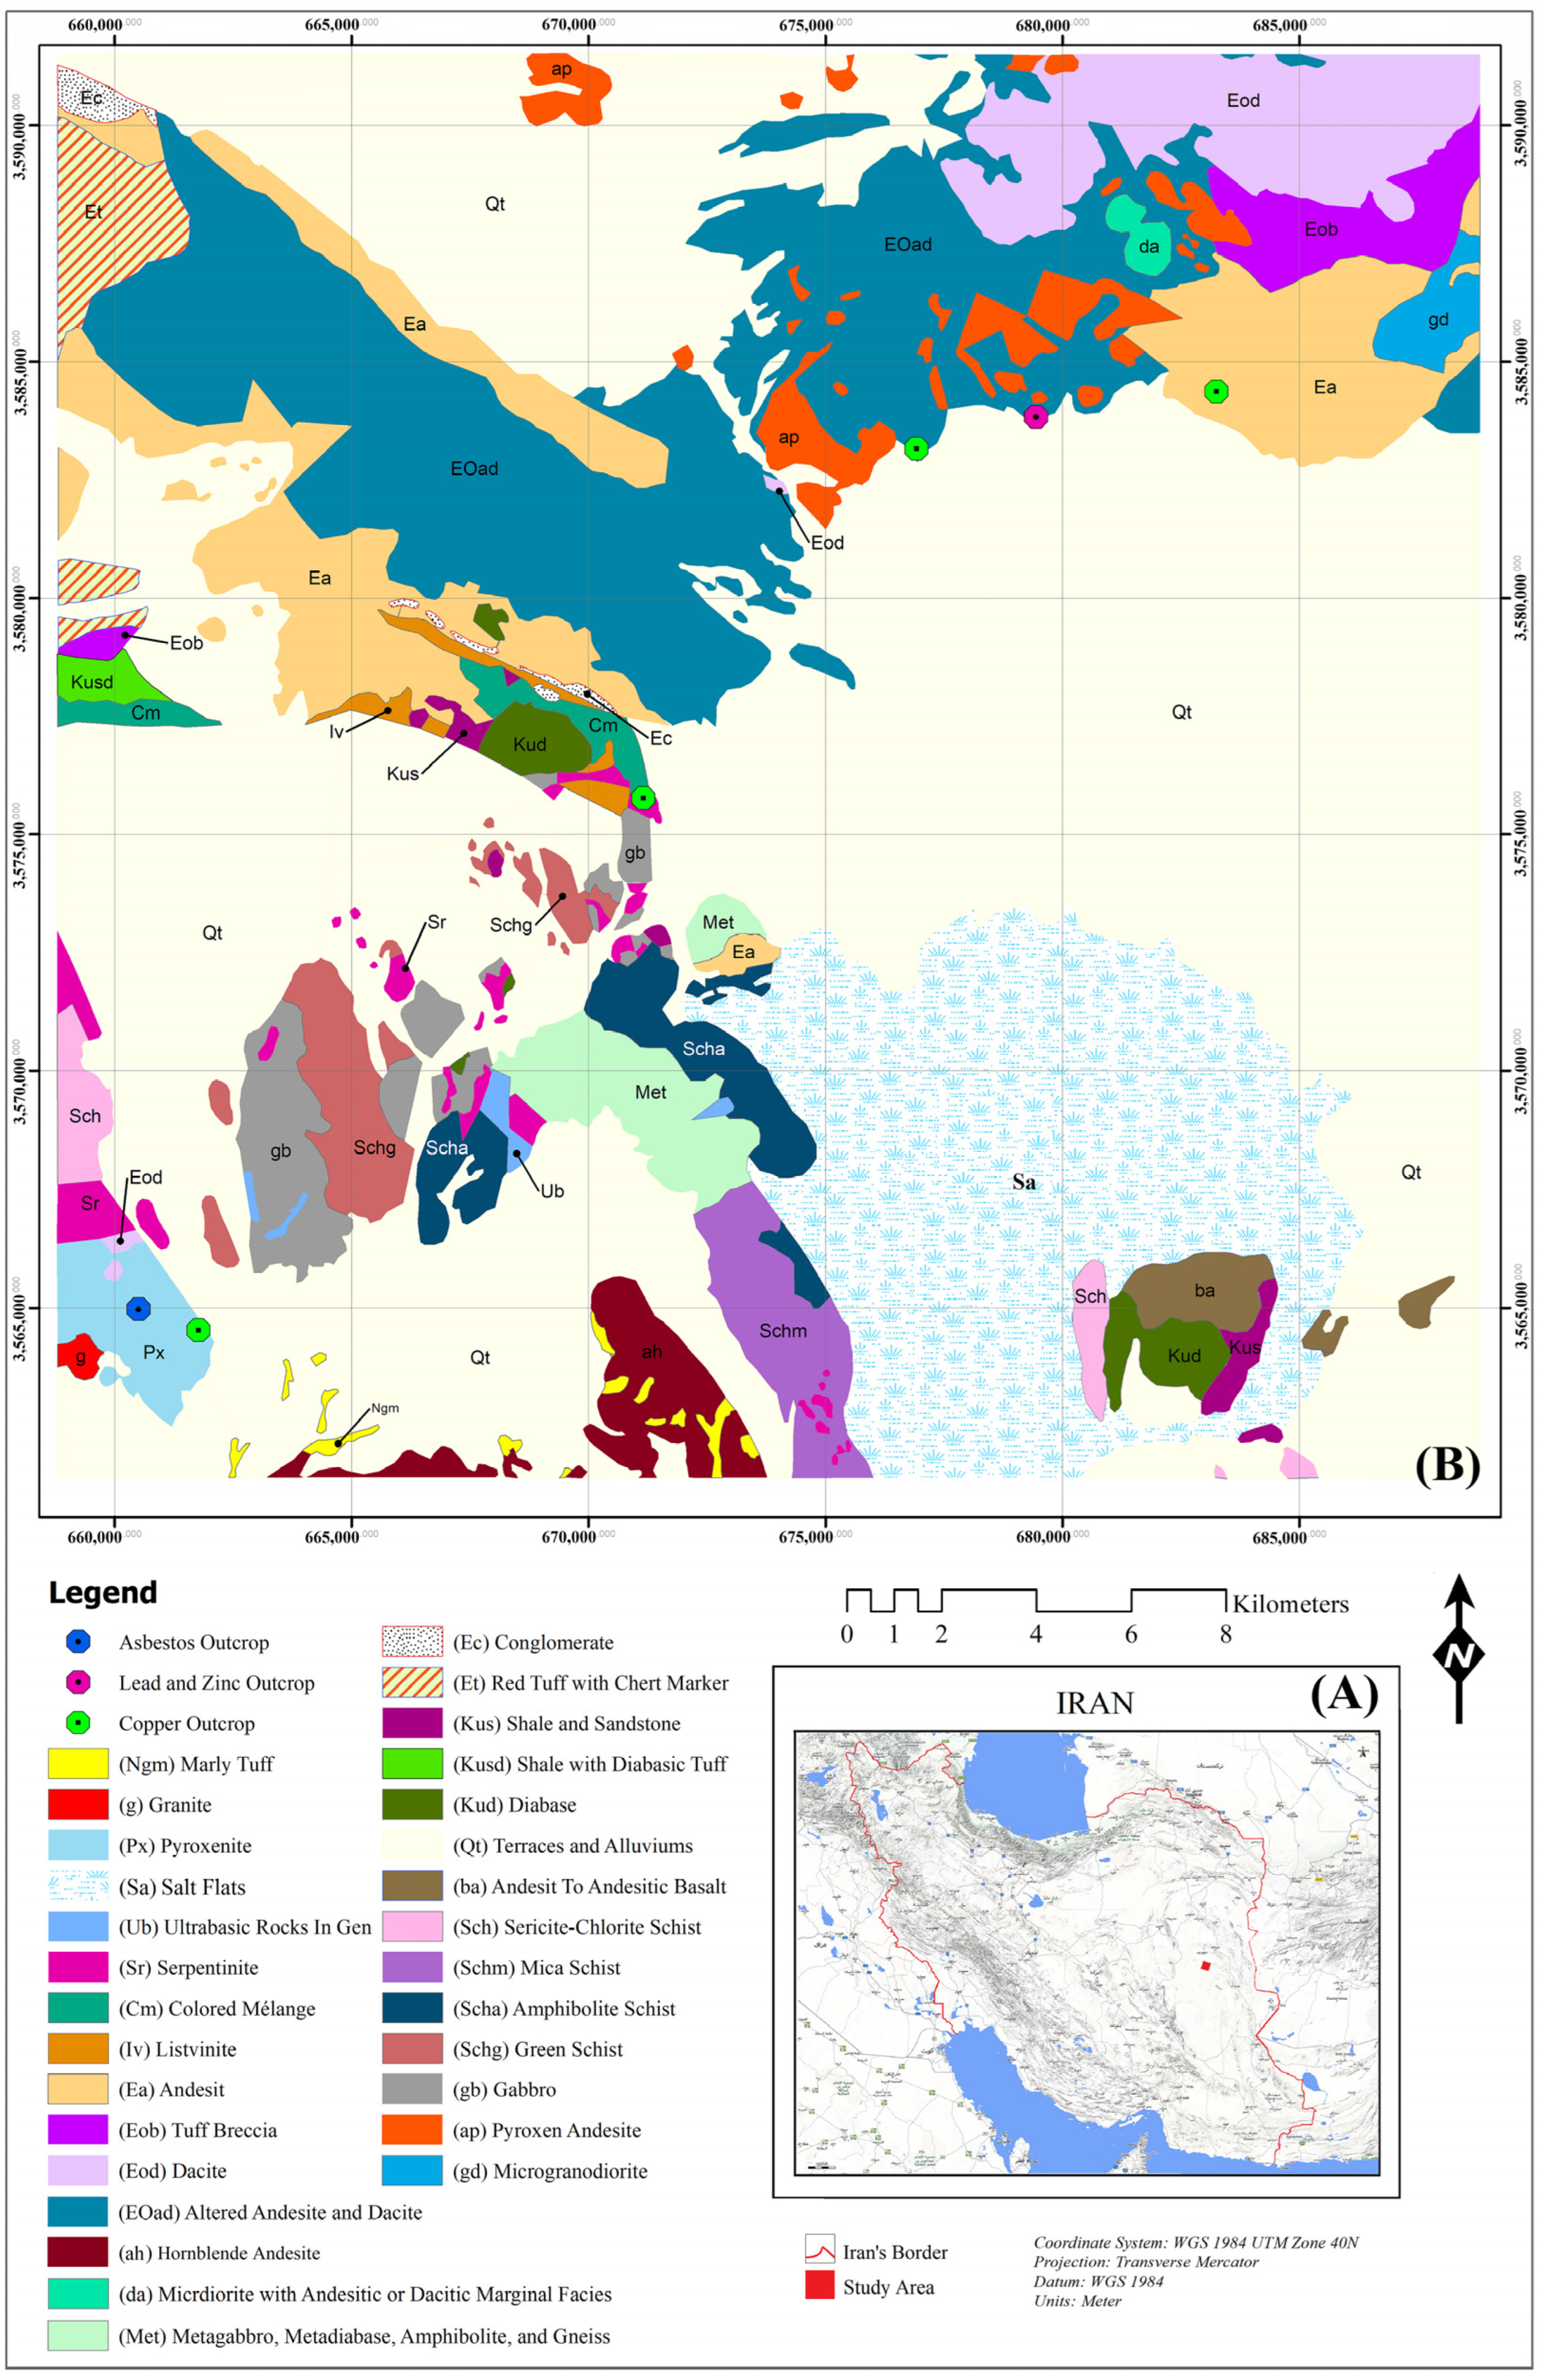
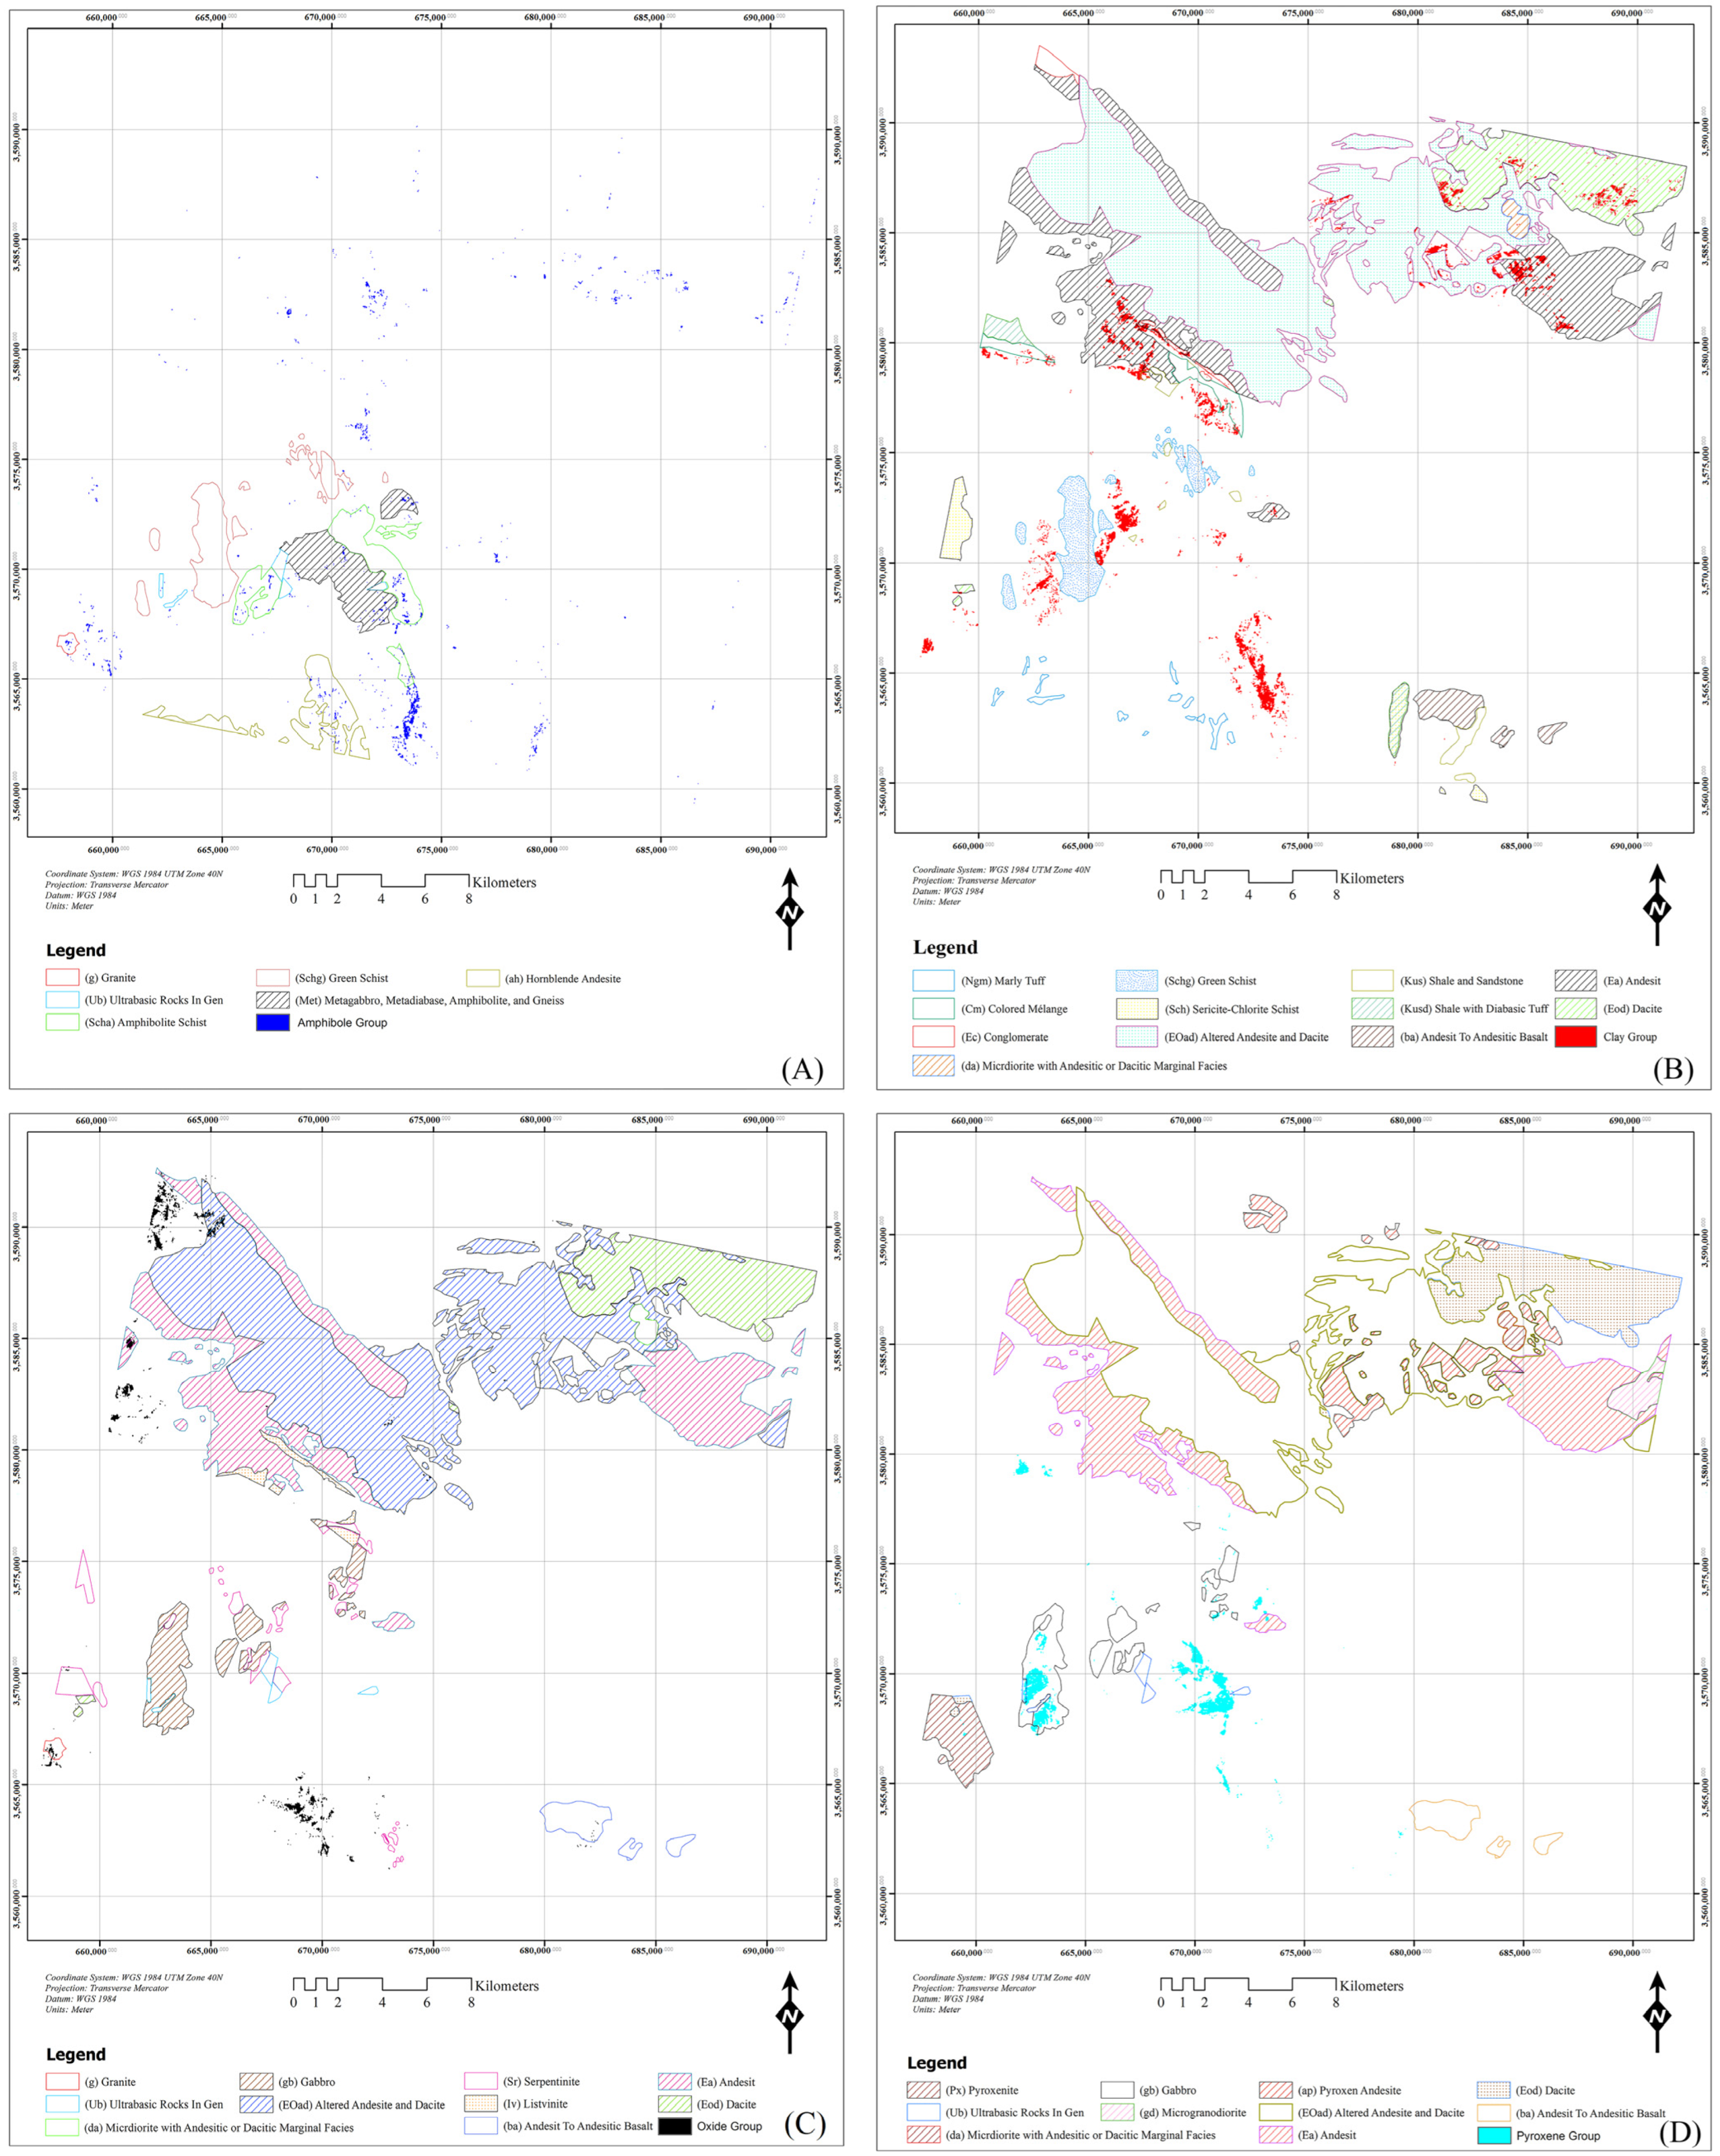
2. Geology of the Study Area

The Sar-e-châh-e-shur region is situated within Birjand, east of Iran, encompassing geographical coordinates spanning from 32.14° to 32.46°N and 58.66° to 59.04°E (Figure 1A,B). This region is part of the Sistan Structural Zone within the Lut Block, which is marked by significant geological shifts, widespread volcanic activities, and a high potential for ore mineralization, especially copper mineralization [26]. Figure 1B shows the simplified geological map of the study area. Predominantly, the geological formations comprise Eocene–Oligocene volcanic rocks, intermingled with semi-deep acidic to intermediate alkali calc-alkaline rocks exhibiting porphyritic textures. These volcanic formations include dacite, diorite, granite, dolerite dikes, diabase, gabbro, and olivine basalt. Additionally, sedimentary rocks such as shale, sandstone, oolitic limestone, limestone, and conglomerate, as well as metamorphic rock types like gneiss, metagabbro, metadiabase, amphibolite schist, chlorite schist, and phyllite, contribute to the geological composition. The intrusion of these bodies has induced varying degrees of metamorphism in the adjacent rocks, ranging from low to high levels [27].
The majority of rock formations in the area exhibit syncline and anticlinal folds, with the northern and northeastern sectors of the region displaying the highest concentration of faults and fractures. Notably, the rocks in the northeastern segment of the map have undergone significant alteration, ranging from moderate to intense. Regarding mineral indicators within this study area, prominent copper mineralizations include Chah-e-Tuni, Homich, and Fasson [28].

3. Materials and Methods

3.1. PRISMA Data Characteristics
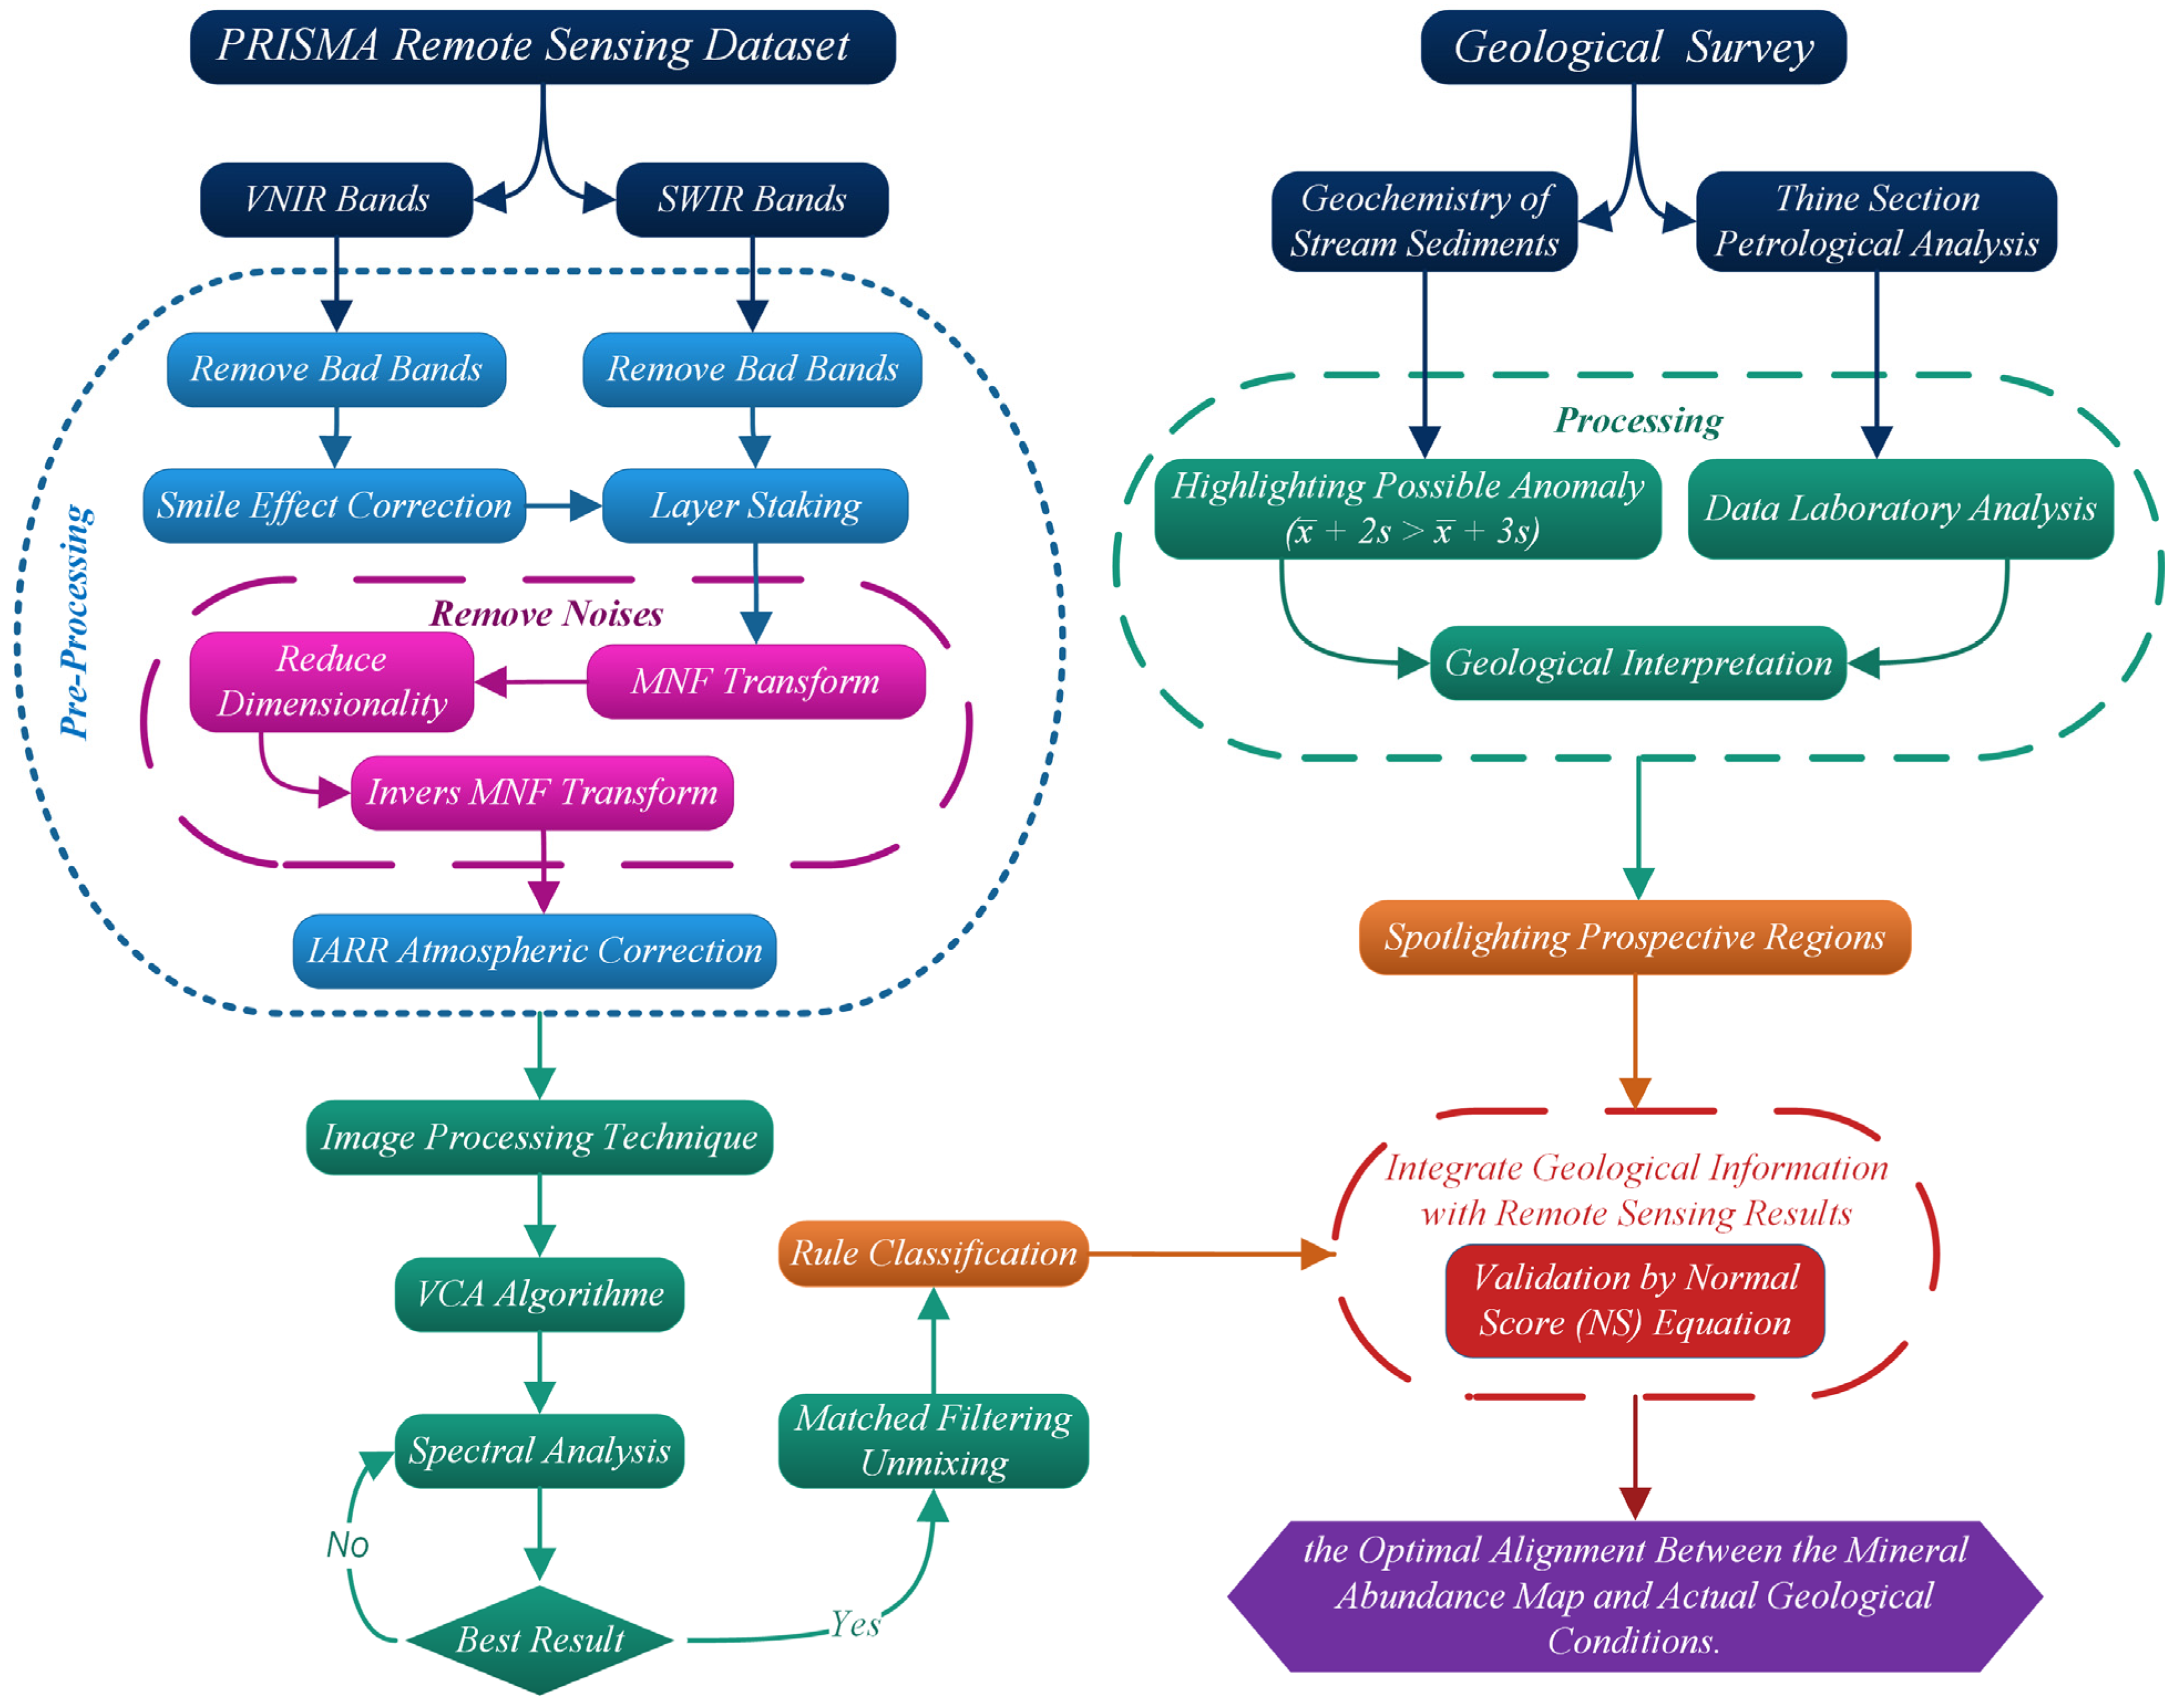
The PRISMA satellite was launched by the Italian Space Agency (ASI) on 22 March 2019 and is expected to remain operational for 5 years [6]. PRISMA is categorized as a small-size satellite, encompassing both hyperspectral imaging capabilities and a medium-resolution panchromatic imager. The PRISMA hyperspectral sensor, which shares the same name as the satellite mission, utilizes prisms to capture the dispersion of incoming energy using the “Pushbroom” image scanning technique. The captured hyperspectral images comprise 239 bands ranging from visible/near-infrared (VNIR) to shortwave infrared (SWIR), with 66 bands within the VNIR range and 173 bands within the SWIR range. Additionally, nine bands are captured in the overlapping wavelength region of VNIR and SWIR. These images offer a spatial coverage of 30 km × 30 km with a spatial resolution of 30 m. The spectral separation among the bands is less than 12 nm. Furthermore, the panchromatic imagery is provided at a 5 m spatial resolution [26,27,29]. For this study, a cloud-free level 2D PRISMA (PRS_L2D_STD_20210213065351_20210213065356_0001) dataset for the Sar-e-châh-e-shur region was obtained from ASI’s eoPortal on 13 February 2021. Detailed specifications of the PRISMA dataset are outlined in Table 1.

3.2. Methodology

In this analysis, the methodology involves a series of stages that are meticulously designed to reveal significant spectral information from the PRISMA dataset. Each step is crafted to ensure accuracy and reliability in the analysis, fostering a comprehensive understanding of hydrothermal alteration minerals in the Sar-e-châh-e-shur region. The sequential steps undertaken in this analysis are depicted in Figure 2. The processing of PRISMA datasets involved the use of several software tools. Specifically, ENVI (Environment for Visualizing Images) version 5.6 (http://www.exelisvis.com (accessed on 22 July 2020), Harris Geospatial Solutions), ArcGIS Pro version 3.0.1 (Esri, Redlands, CA, USA), and Anaconda 3-2023.09 were utilized for data analysis and processing. The methodological stages are summarized as follows. (1) Pre-processing: this stage begins with rigorous pre-processing, where essential corrections are applied and bad bands are removed. This foundational step lays the cornerstone for subsequent analyses, ensuring data integrity and quality. (2) Segregation and demarcation of spectral signatures using vertex component analysis (VCA) algorithm: the VCA algorithm is used to extract endmembers from hyperspectral data through unsupervised analysis [28]. It leverages the geometry of the simplex formed by the mixing of spectral signatures to efficiently identify endmembers and their abundance fractions. (3) Determination of endmember types: spectral characteristics gleaned from the VCA algorithm were used to determine endmember types, unveiling the diverse components inherent to the geological background. (4) Mineral distribution mapping: leveraging the unmixing match filtering (MF) technique, mineral distribution maps are meticulously crafted, illuminating the presence and abundance of specific minerals across the region. (5) Using geological and geochemical data for validation: the used methodology was validated using precise ICP-OES laboratory analysis on stream sediments and geological data. The obtained results were integrated with the map generated using remote sensing techniques. The evaluation of the findings was meticulously conducted by applying the normalized score equation, guaranteeing the strength and dependability of the conclusions. The validation process ensured the robustness and reliability of the research outcomes. The details of each stage were deliberated in the following subsections.

3.2.1. Pre-Processing

The essence of remote sensing lies in the intricate journey of solar radiation through the atmosphere before reaching the sensor, leading to remotely sensed images containing both atmospheric and surface data. Achieving precise surface reflectance measurements demands diligent pre-processing, necessitating a deep understanding of variables such as atmospheric effects and sensor limits.
Given the utilization of L2D PRISMA data, significant processing steps have been undertaken on this dataset. However, owing to the specific nature of these data and the necessity to assess the Earth’s surface reflection, certain bands within this dataset prove unsuitable for mineral remote sensing studies [30,31]. These bands exhibit heightened sensitivity to water vapor, resulting in substantial absorptions within the spectral profile. Notably, the absorption characteristics spanning (913 nm to 979 nm), (1078 nm to 1185 nm), (1317 nm to 1491 nm), and (1775 nm to 2044 nm) diminish the efficacy of absorption ranges crucial for mineralogical investigations [31]. Hence, the primary course of action entails the exclusion of these bands from further analysis. Figure 3 illustrates the spectral profile of a pixel in the PRISMA images before and after the removal of bad bands. It showcases how the adjustments in the spectral profile enhanced the effectiveness of absorption ranges [32,33].
The spectral smile, also known as spectral curvature or shadow effect, poses a common challenge in push-broom sensor instruments. This distortion originates from variations in the depression angle relative to the field position, causing a deviation in wavelength from the designated central wavelength across the spectral domain. This deviation correlates with the pixel position along the swath. Essentially, the central wavelength of the bands gradually changes across the width of the image, forming a smooth curve that often peaks at the midpoint, resembling a smile, hence the name [34]. Despite appearing minor, these shifts, ranging from 2.6 to 3.6 nm in the visible and near-infrared (VNIR) range and approximately 1 nm in the short-wave infrared (SWIR) range, can significantly impact the diagnostic absorption and reflection. Hence, addressing the spectral smile effect is crucial when interpreting hyperspectral imagery data, particularly in applications involving mineral identification and other detailed spectral analyses [35,36]. For this reason, implementing column mean adjustments in the Minimum Noise Fraction (MNF) space technique has been proposed as a solution to mitigate this issue. The MNF adjustment method is especially noteworthy for its effective noise reduction capabilities, making it a suitable approach for correcting the smile effect, as employed in this study [35].
In the final step, given the scarcity of direct measurements for atmospheric properties, diverse techniques, including Quick Atmospheric Correction (QUAC) [37], Fast Line-of-sight Atmospheric Analysis of Spectral Hypercubes (FLAASH) [37], Internal Average Relative Reflectance (IARR) correction [38], Log Residuals [39], etc. are employed to infer them from hyperspectral radiance data. These inferred properties serve as inputs for accurate models of atmospheric radiation transfer, enabling estimation of true surface reflectance [40]. According to the explanation provided, the IARR correction was implemented to the PRISMA datasets used in this study. This calibration serves as a powerful means to enhance the strength of reflection and absorption, also known as IARR, by standardizing images based on the average spectrum of the scene. This approach proves especially beneficial in converting hyperspectral data to relative reflectance, particularly in areas where ground measurements are scarce. Its effectiveness is most notable in arid landscapes without vegetation, where the average scene spectrum serves as the reference spectrum for division into the spectrum of each pixel in the image. Figure 4 depicts the spectral signature of a pixel in the PRISMA images before and after applying the IARR correction. It demonstrates the changes in the pixel’s spectral properties caused by the correction process.

3.2.2. Image Processing Techniques

Endmember Extraction

The extraction of a signature matrix involves the process of endmember extraction and was achieved using a geometric algorithm. Specifically, the vertex component analysis (VCA) method, which relies on the presence of pure pixels, was utilized for this purpose. It is an algorithm to separate linear mixtures of endmember spectra [28]. The VCA is an unsupervised algorithm that operates by iteratively projecting data onto a direction orthogonal to the subspace spanned by the endmembers already determined. It identifies endmembers as the extreme points of these projections and continues the process until all endmembers are identified [41]. VCA performs better than the Pixel Purity Index (PPI) algorithm and is comparable to or better than the N-FINDR algorithm, while requiring significantly less computational complexity compared to N-FINDR [42]. Using this approach alongside the Python code, supplied by Nascimento (J) and Dias (J), 8 endmembers were successfully identified in this analysis.
The spectral signatures extracted were compared against the spectral library supplied by the United States Geological Survey (USGS) to determine mineral compositions. Two techniques, the Spectral Angle Mapper (SAM) and Spectral Feature Fitting (SFF) were employed for this purpose. These methods utilize spectral similarity techniques to assess the likeness between an unknown spectrum and reference spectra within the library. SAM measures similarity by calculating the angle between endmembers and reference spectra [43,44], whereas SFF evaluates similarity by scrutinizing the physical shape of absorption features in conjunction with band-to-band calculations [45,46,47,48,49,50]. In addition, some adjustments were made to the USGS spectral library to align with the wavelengths of the specified useful PRISMA bands that were identified during the pre-processing stage. Subsequently, SAM and SFF were employed to compare unknown spectra with reference spectra, resulting in matching scores ranging from 0 to 1. Minerals exhibiting the highest SAM + SFF scores, confirmed through visual inspection, were attributed to the unknown endmembers. Consequently, 8 endmember spectra were extracted from the PRISMA dataset and identified for the study area. Figure 5 displays the corresponding comparative spectral curves between the detected endmembers in this analysis and the mineral spectral library provided by the USGS.

Unmixing

The utilization of matched filtering (MF) typically stands as a pivotal technique for swiftly and efficiently detecting specific materials within an image scene. This method employs a partial unmixing approach, strategically maximizing the response of user-defined end members while concurrently suppressing the signal from the composite unknown background. The result is a precise matching of known spectral signatures, offering a rapid means of material identification without the necessity of exhaustive knowledge about all the end members present in the scene [51]. One of the key advantages of MF is that it does not require knowledge of all endmembers, which are the pure components in the image. This makes it a flexible and efficient tool for hyperspectral image analysis. Moreover, the MF approach can be combined with concepts of convex geometry to improve its performance. The priority of MF for unmixing hyperspectral images is driven by its flexibility, efficiency, and ability to handle complex scenarios where the target is frequently present in the image [51]. To execute this algorithm, the eight identified spectral signatures are exclusively inputted into the computational framework. Consequently, the algorithm efficiently identified pixels within the PRISMA data that closely matched these specified spectra. This selective approach not only streamlined the computational process but also ensured a targeted and precise analysis of the image scene.

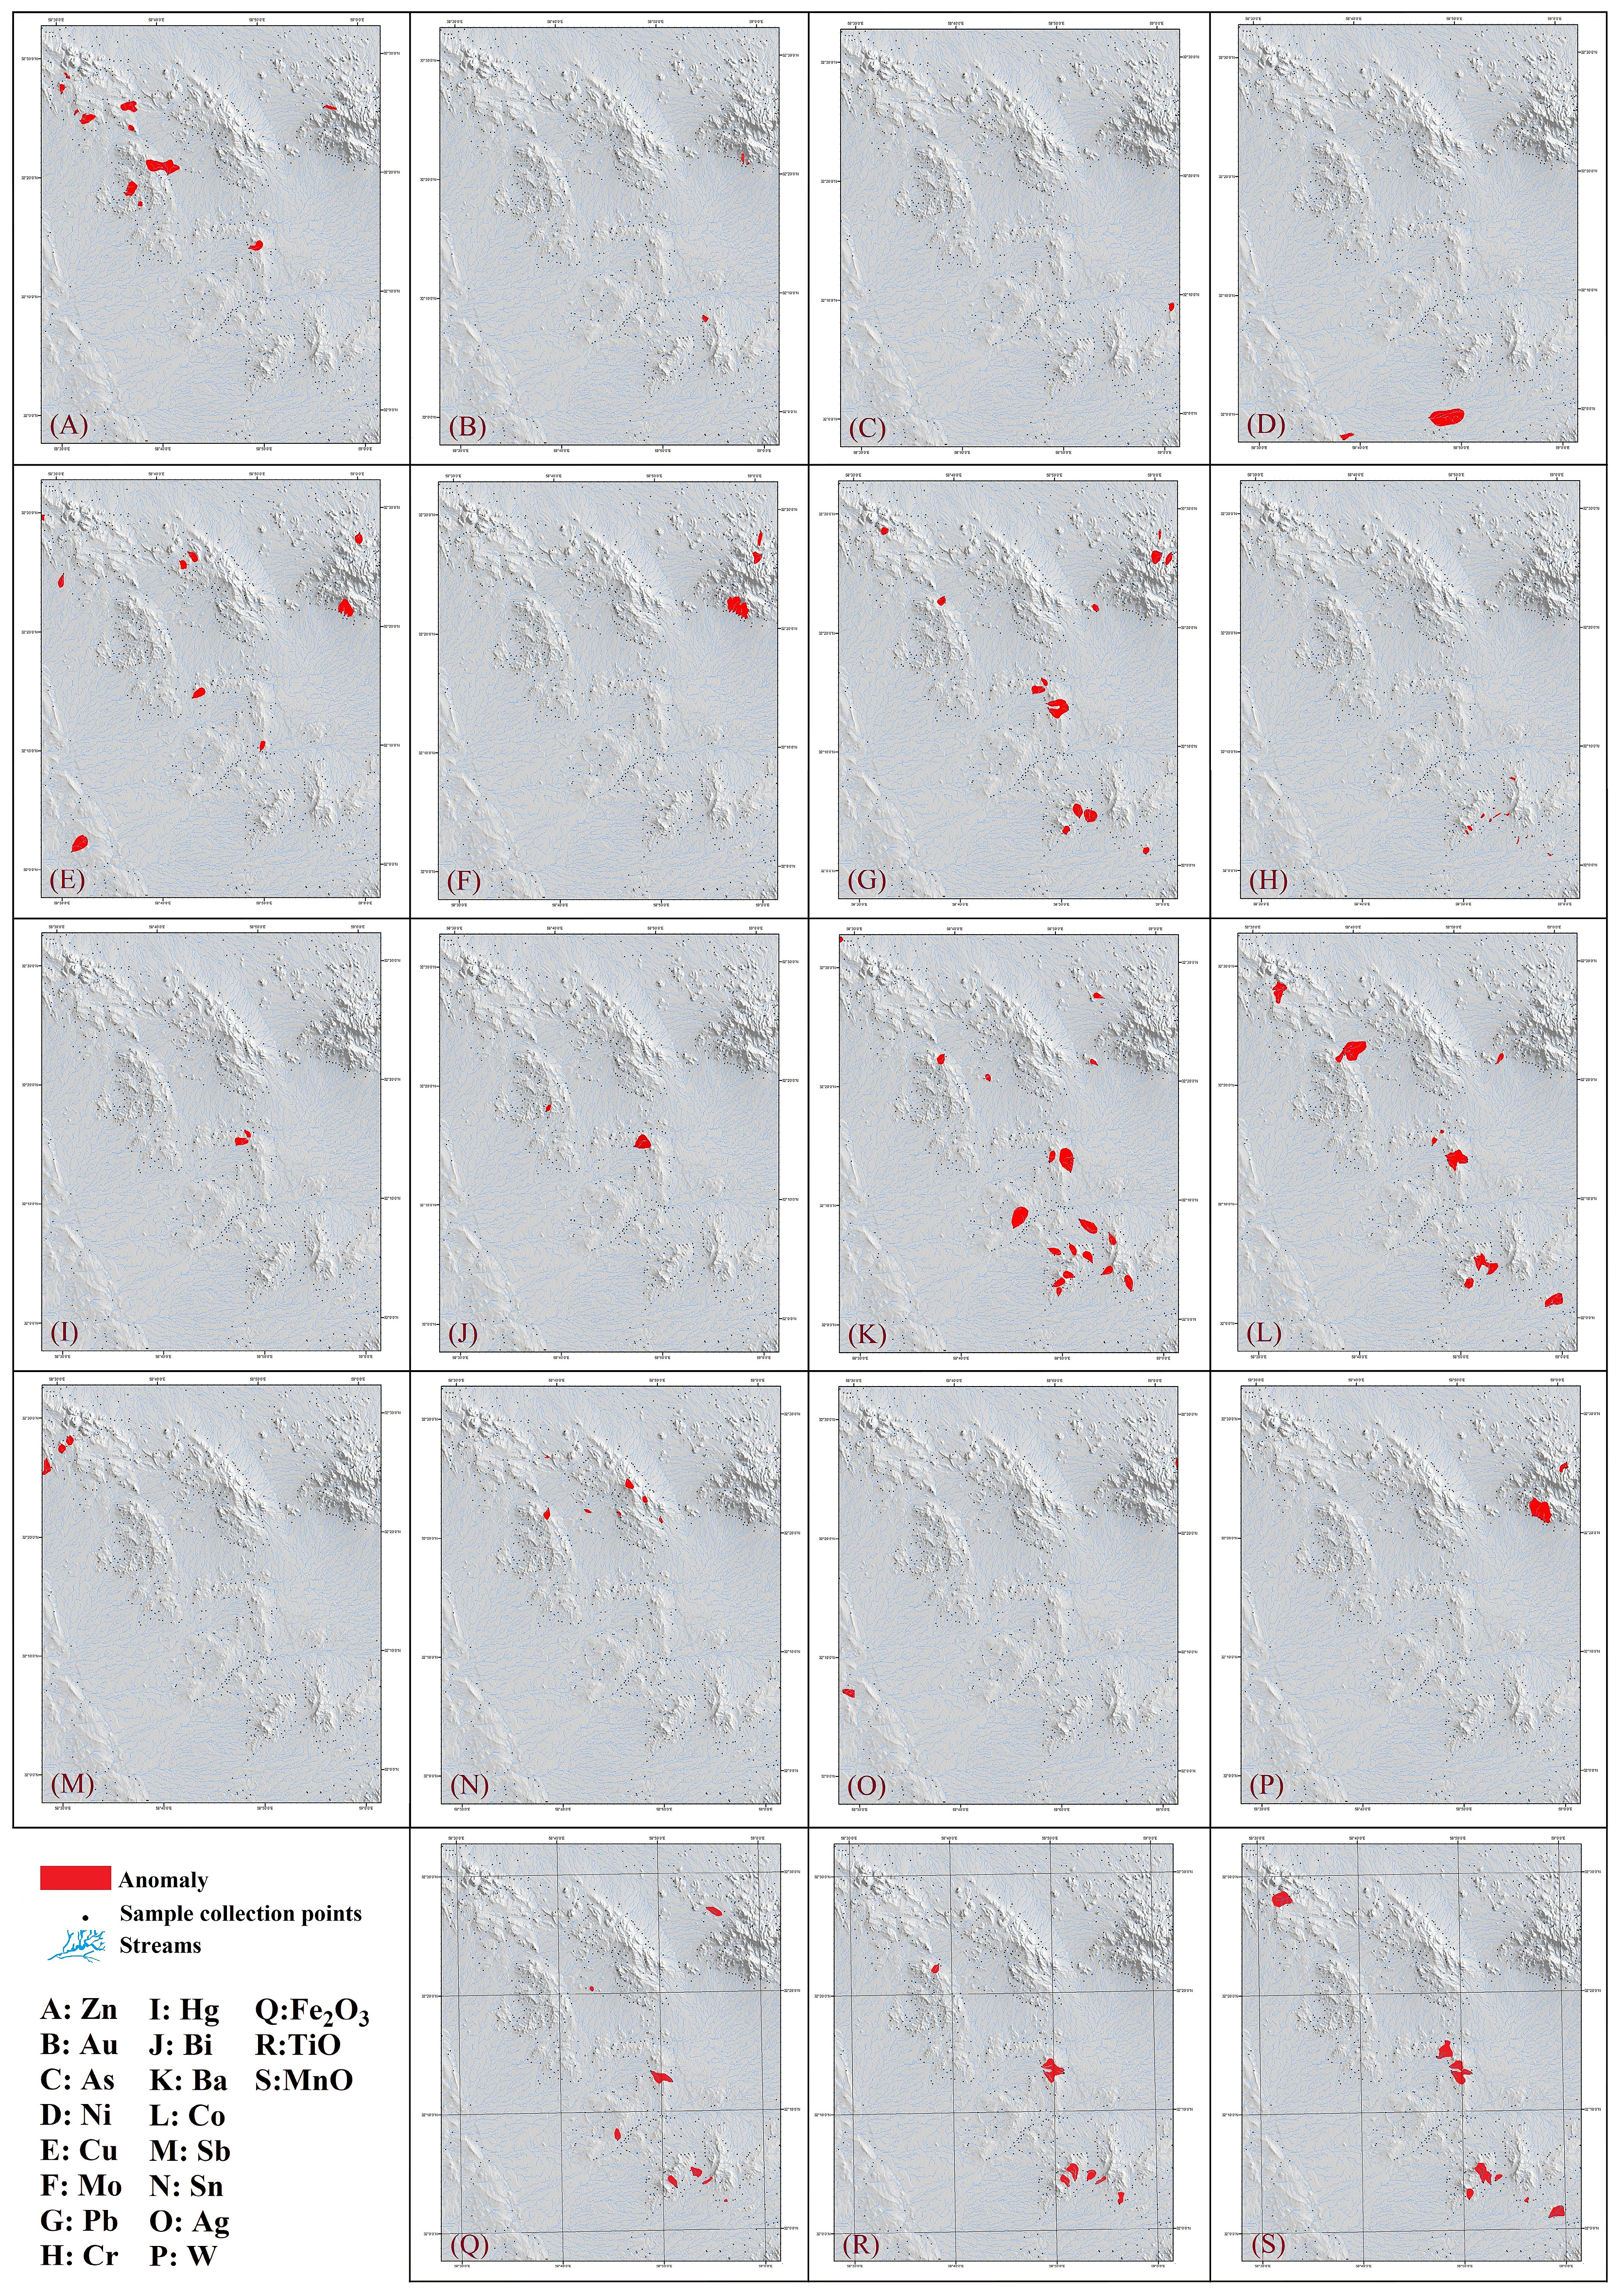
3.2.3. Geological, Geochemical, and Laboratory Analysis

Geological fieldwork (20 September 2023) was undertaken in the Sar-e-Châh-e-Shur area to validate the image processing analysis employed in this study. The fieldwork primarily was centered around significant rock exposure sites in the Sar-e-Châh-e-Shur region. GPS coordinates were obtained using a Garmin Map 64 s handheld GPS device, offering an average accuracy of 3 m. Detailed field documentation, including photographs capturing geomorphological features, exposed lithological formations, and weathered rocks, was compiled. Additionally, rock specimens were gathered from weathered lithological units for subsequent laboratory analysis. The mineralogical laboratory at Sahand University of Technology, Tabriz, Iran, facilitated the creation of polished thin sections, which were then scrutinized using an OLYMPUS CX31P polarizing microscope. Furthermore, a comprehensive geochemical analysis was conducted utilizing the ICP-OES device at the Geological Survey of Iran (GSI), employing a 19-element package analysis. X-ray diffraction (XRD) analyses were performed on bulk powder samples at the laboratory of Sahand University of Technology, Tabriz, Iran, using an X-ray Diffractometer (XRDynamic 500’s TruBeam™ concept model, Anton Paar GmbH, Graz, Austria), aiding in the identification of fine-grained minerals. Pathfinder elements are recognized as pivotal geochemical indicators utilized to ascertain the presence of valuable minerals or ores. They are often associated with specific types of mineralization, and their identification in geological samples serves as a guiding principle for prospecting and exploration endeavors. The term “Pathfinder” signifies their role in evaluating expansive areas for mineral potential, thereby excluding potentially barren regions from potential zones. Exemplary Pathfinder Elements (EPEs) include trace elements or minerals commonly associated with distinct types of ore deposits. Analyzing these elements is a widespread practice in the fields of geochemistry and mineral exploration [52,53,54,55,56,57,58,59,60,61,62,63]. In this investigation, a total of 574 samples of stream sediments spanning the entire region were meticulously gathered and analyzed. These samples were prepared by the Geological Survey of Iran (GSI) using the ICP-OES method to scrutinize 19 EPEs. Areas falling within the range of possible anomalies ( x ¯ + 2 s > x ¯ + 3 s )   are considered indicative of potential mineralization [64,65,66,67]. Here, the (‘ x ¯ ’) denotes the average, and ‘s’ represents the standard deviation.

4. Results

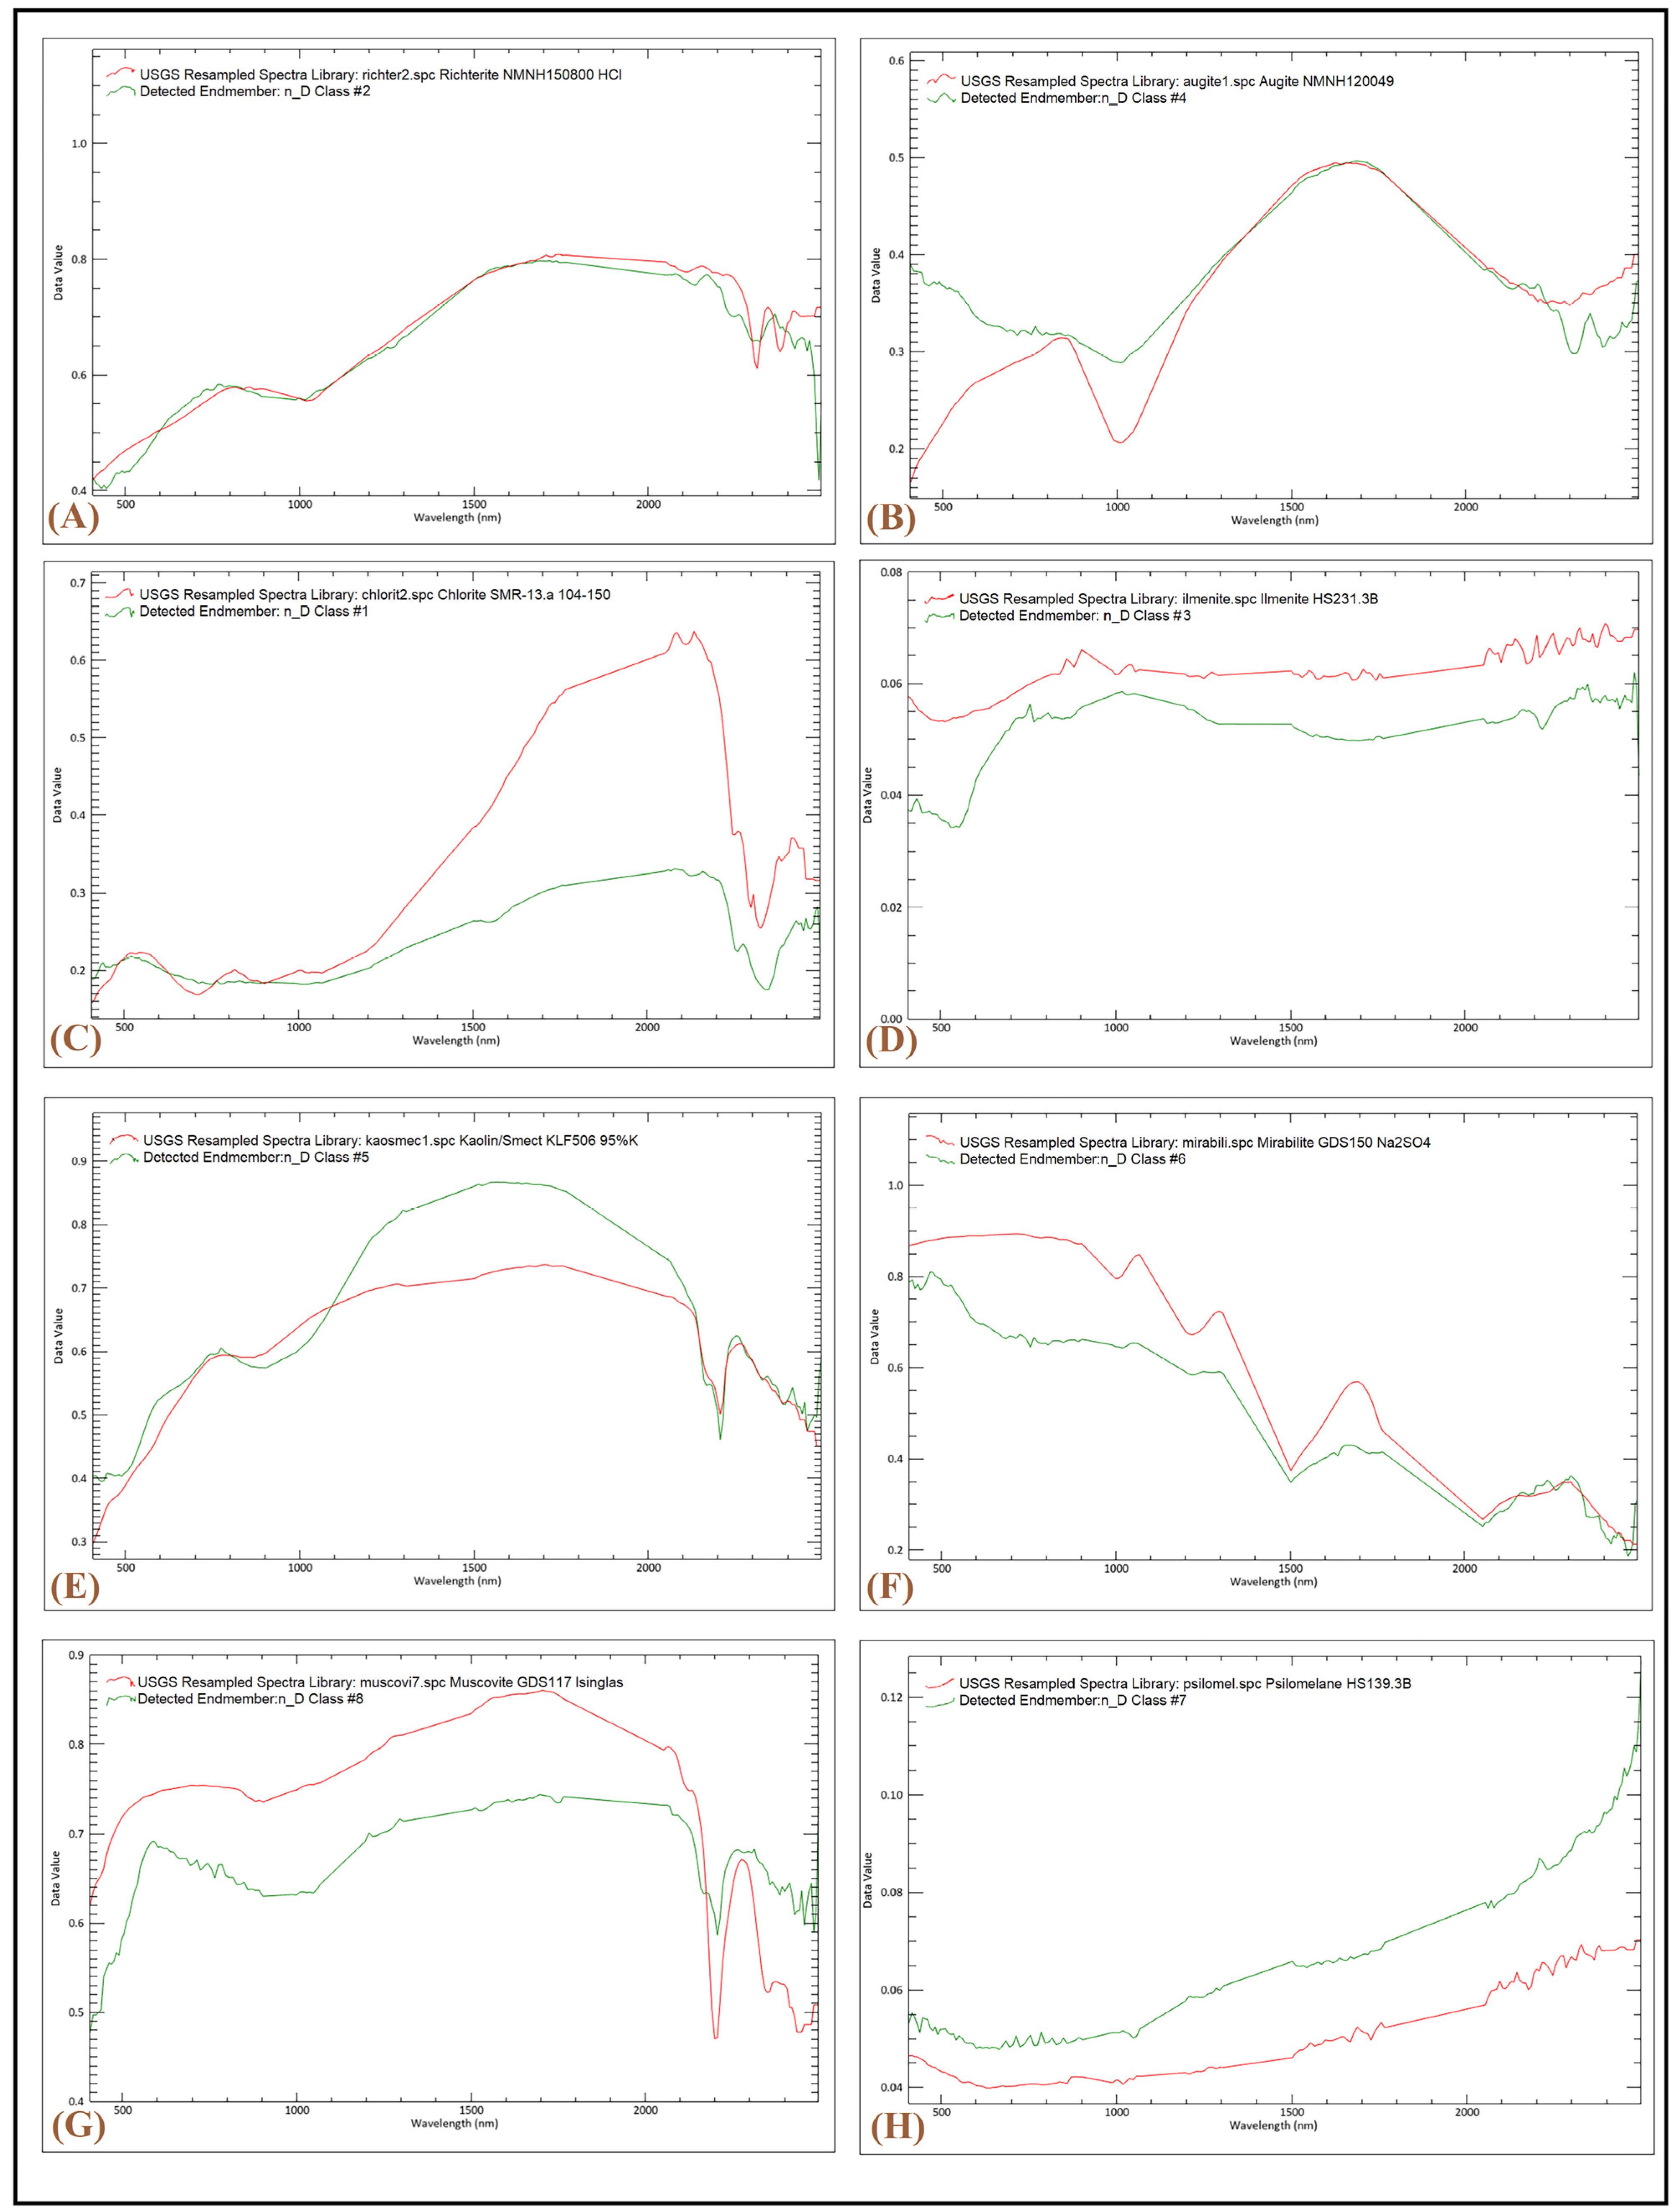
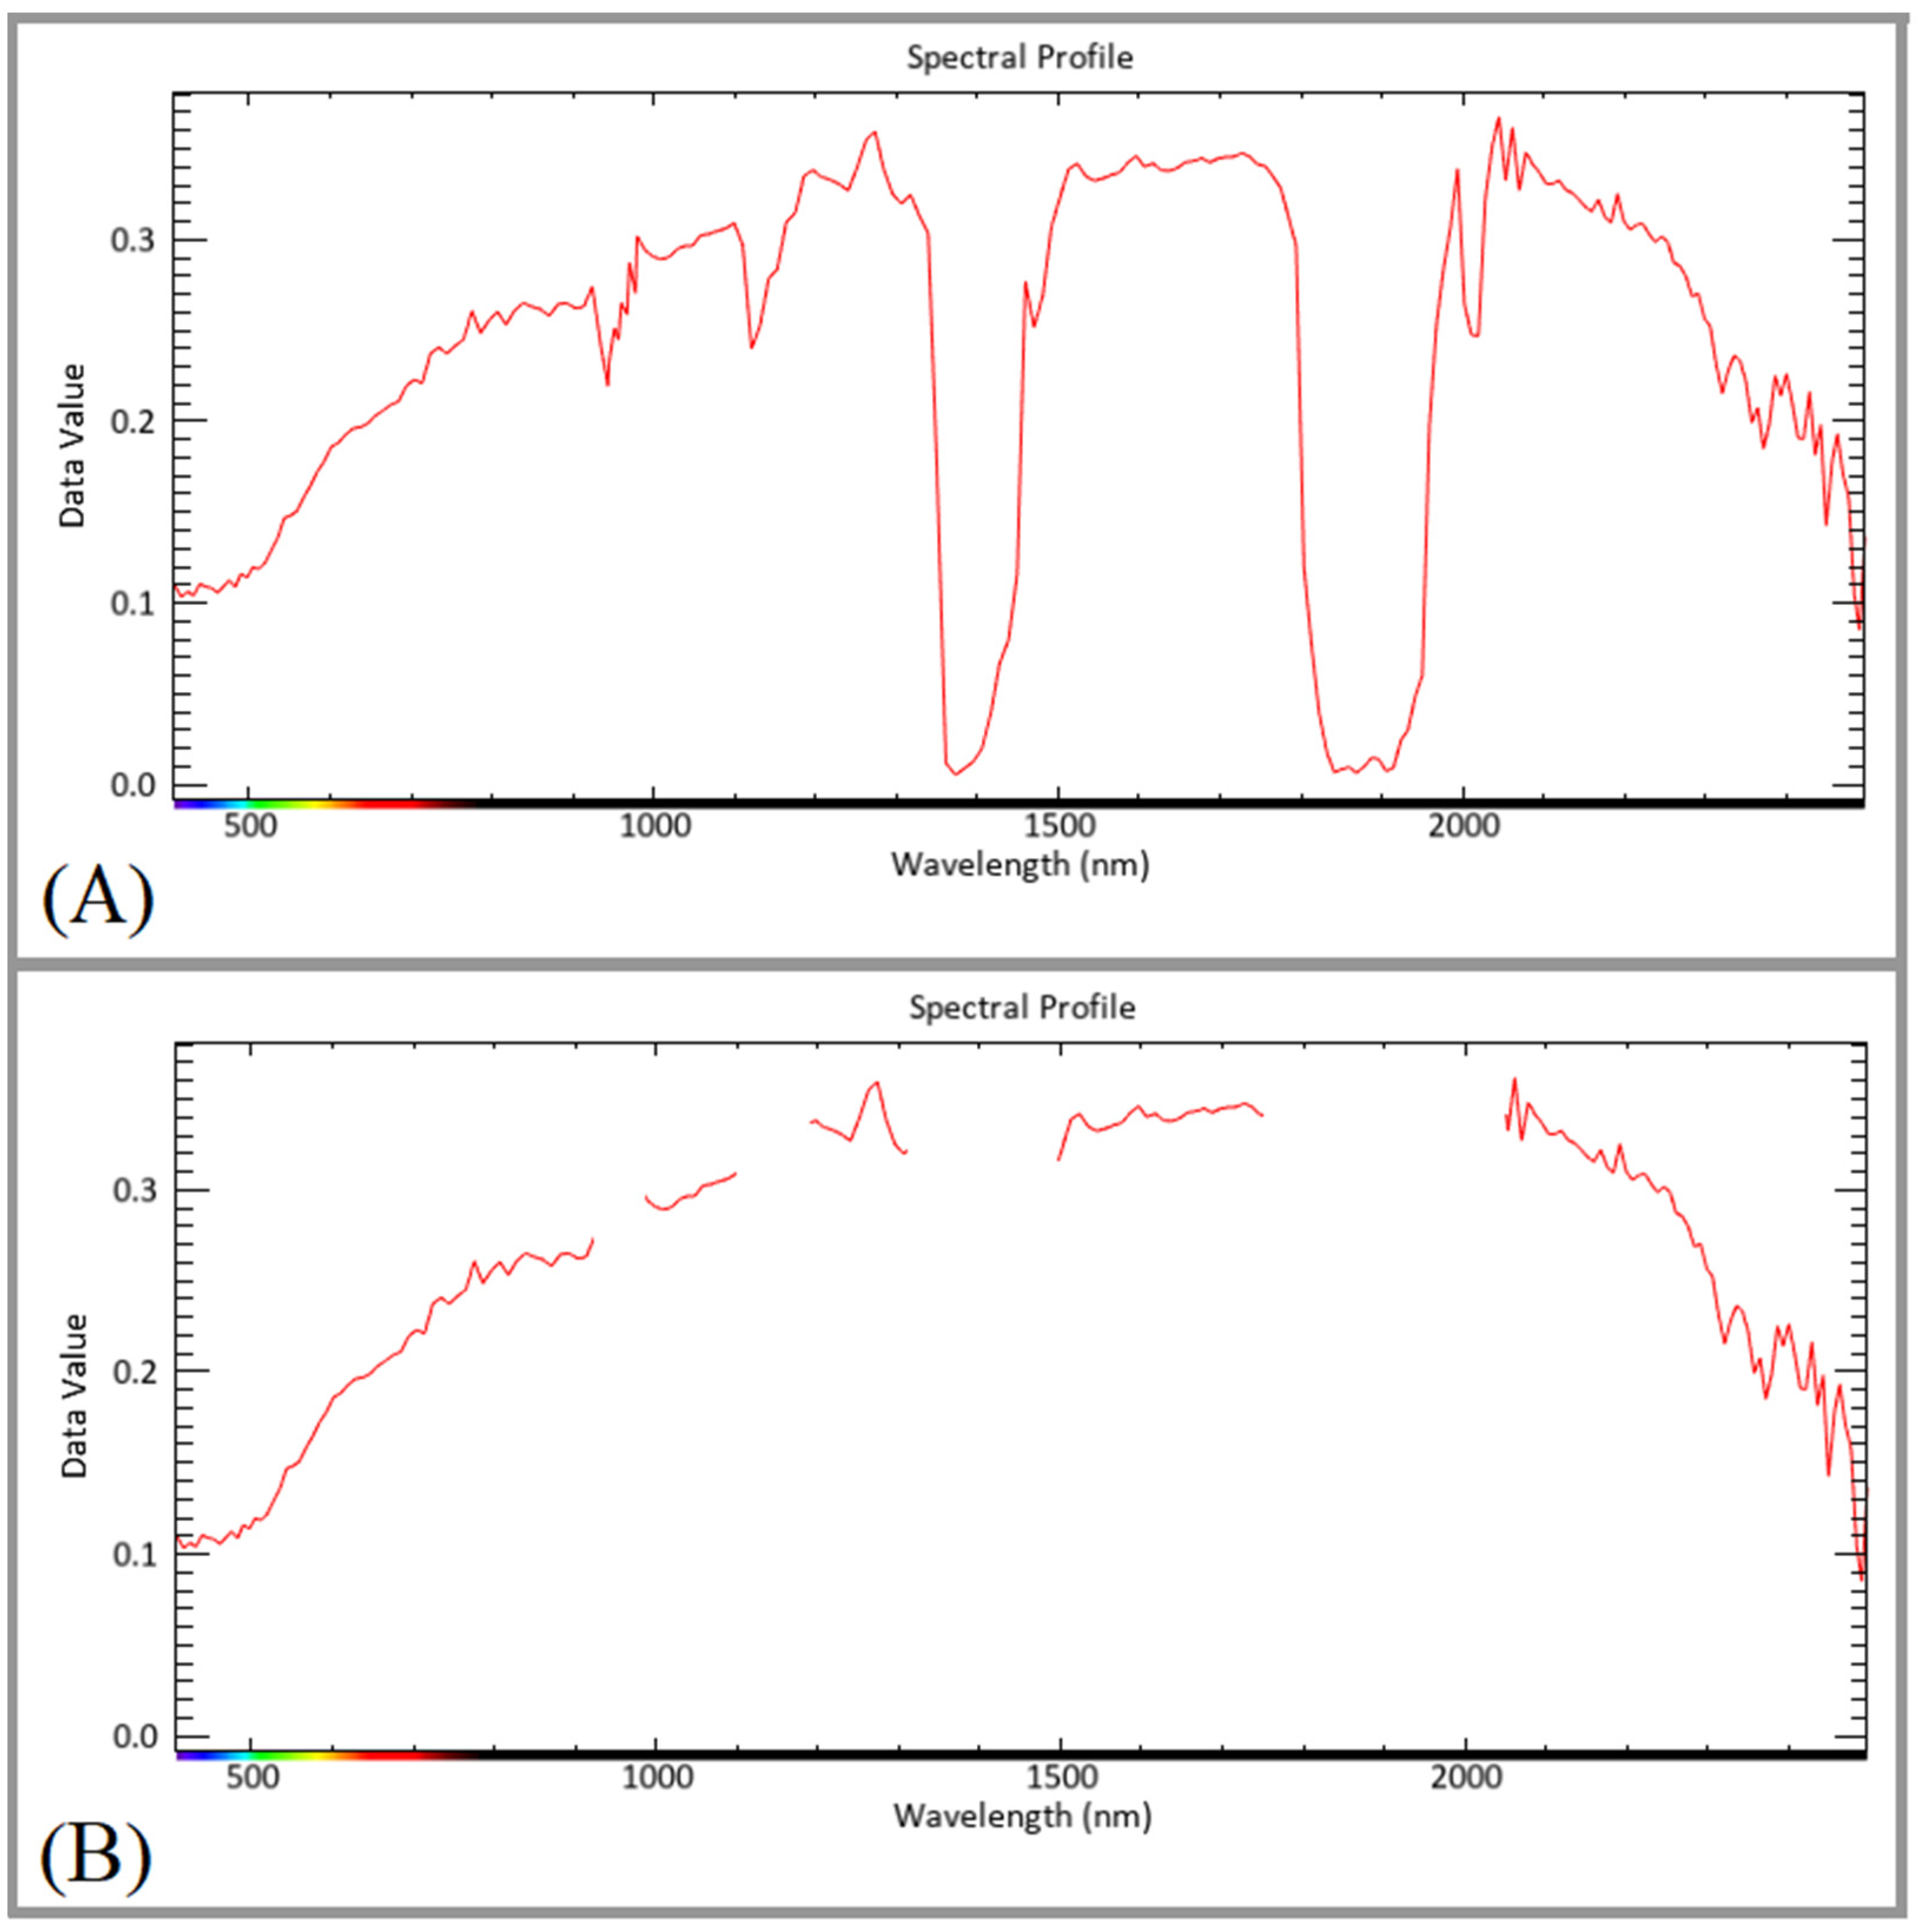
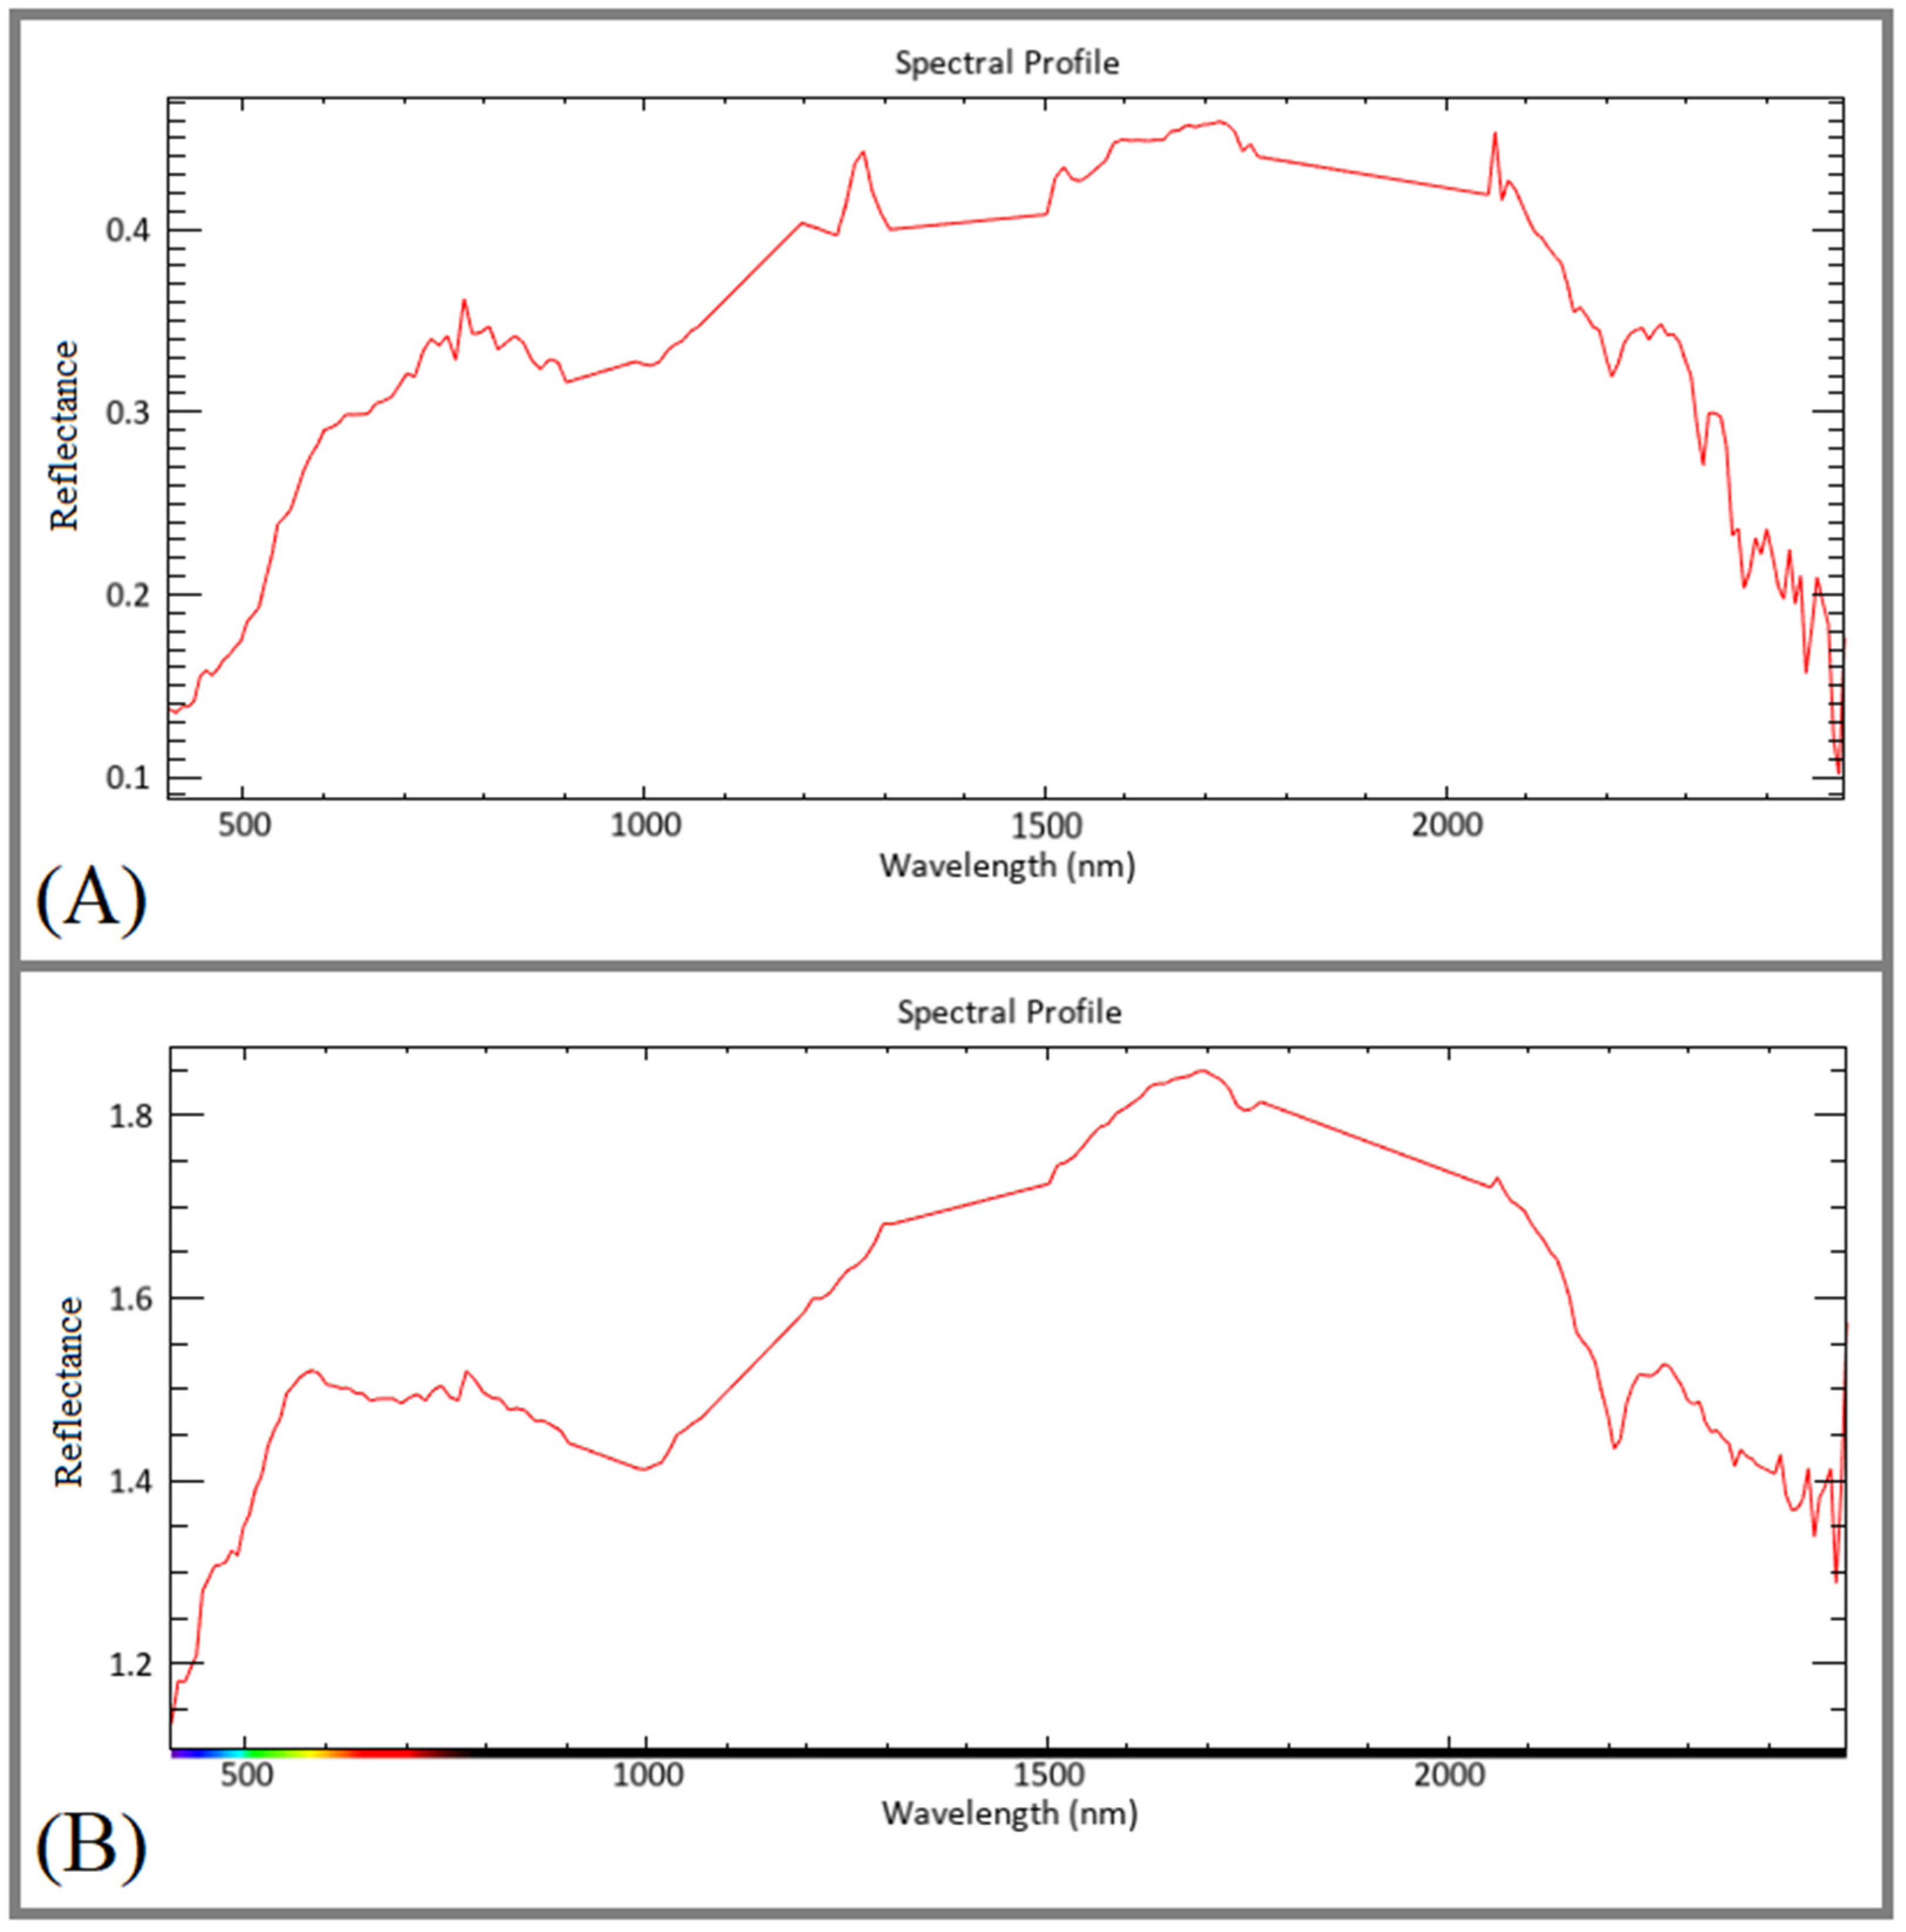
4.1. Spectral Analysis of Detected Endmembers

Figure 5A–H presents distinct absorption features and trends for each of the identified endmembers in this analysis, indicating a favorable alignment with the mineral’s spectra extracted from the USGS spectral library. Figure 5A displays recognizable absorption features at 1.05 μm and 2.30 μm, showing trends similar to richterite (sodium–calcium amphiboles: Na(NaCa)Mg5(Si8O22)(OH)2). Figure 5B presents recognizable absorption features at 1.05 μm and 2.30 μm, along with a noticeable strong reflectance feature at 1.7 μm, matching augite. Figure 5C exhibits prominent Fe, Mg-OH double absorption features at 2.30–2.365 μm, along with discernible iron absorption at 0.85–0.97 μm, characterizing spectral properties associated with chlorite. Figure 5D shows recognizable absorption features at 0.55 μm, matching trends akin to ilmenite. Figure 5E displays slight iron absorption at 0.85–0.97 μm and absorption features at 2.25 μm and 2.35 μm, matching trends similar to kaolinite–smectite. Figure 5F shows recognizable absorption features at 1.22 μm, 1.50 μm, and 2.05 μm, with trends similar to mirabilite (Na2SO4·10H2O). Figure 5G illustrates a major Al-OH absorption feature around 2.20 μm, attributable to muscovite. Figure 5H exhibits trends similar to psilomelane (known as black hematite Ba(Mn2+)(Mn4+)8O16(OH)4 or as (Ba,H2O)2Mn5O10) [12,68,69,70].

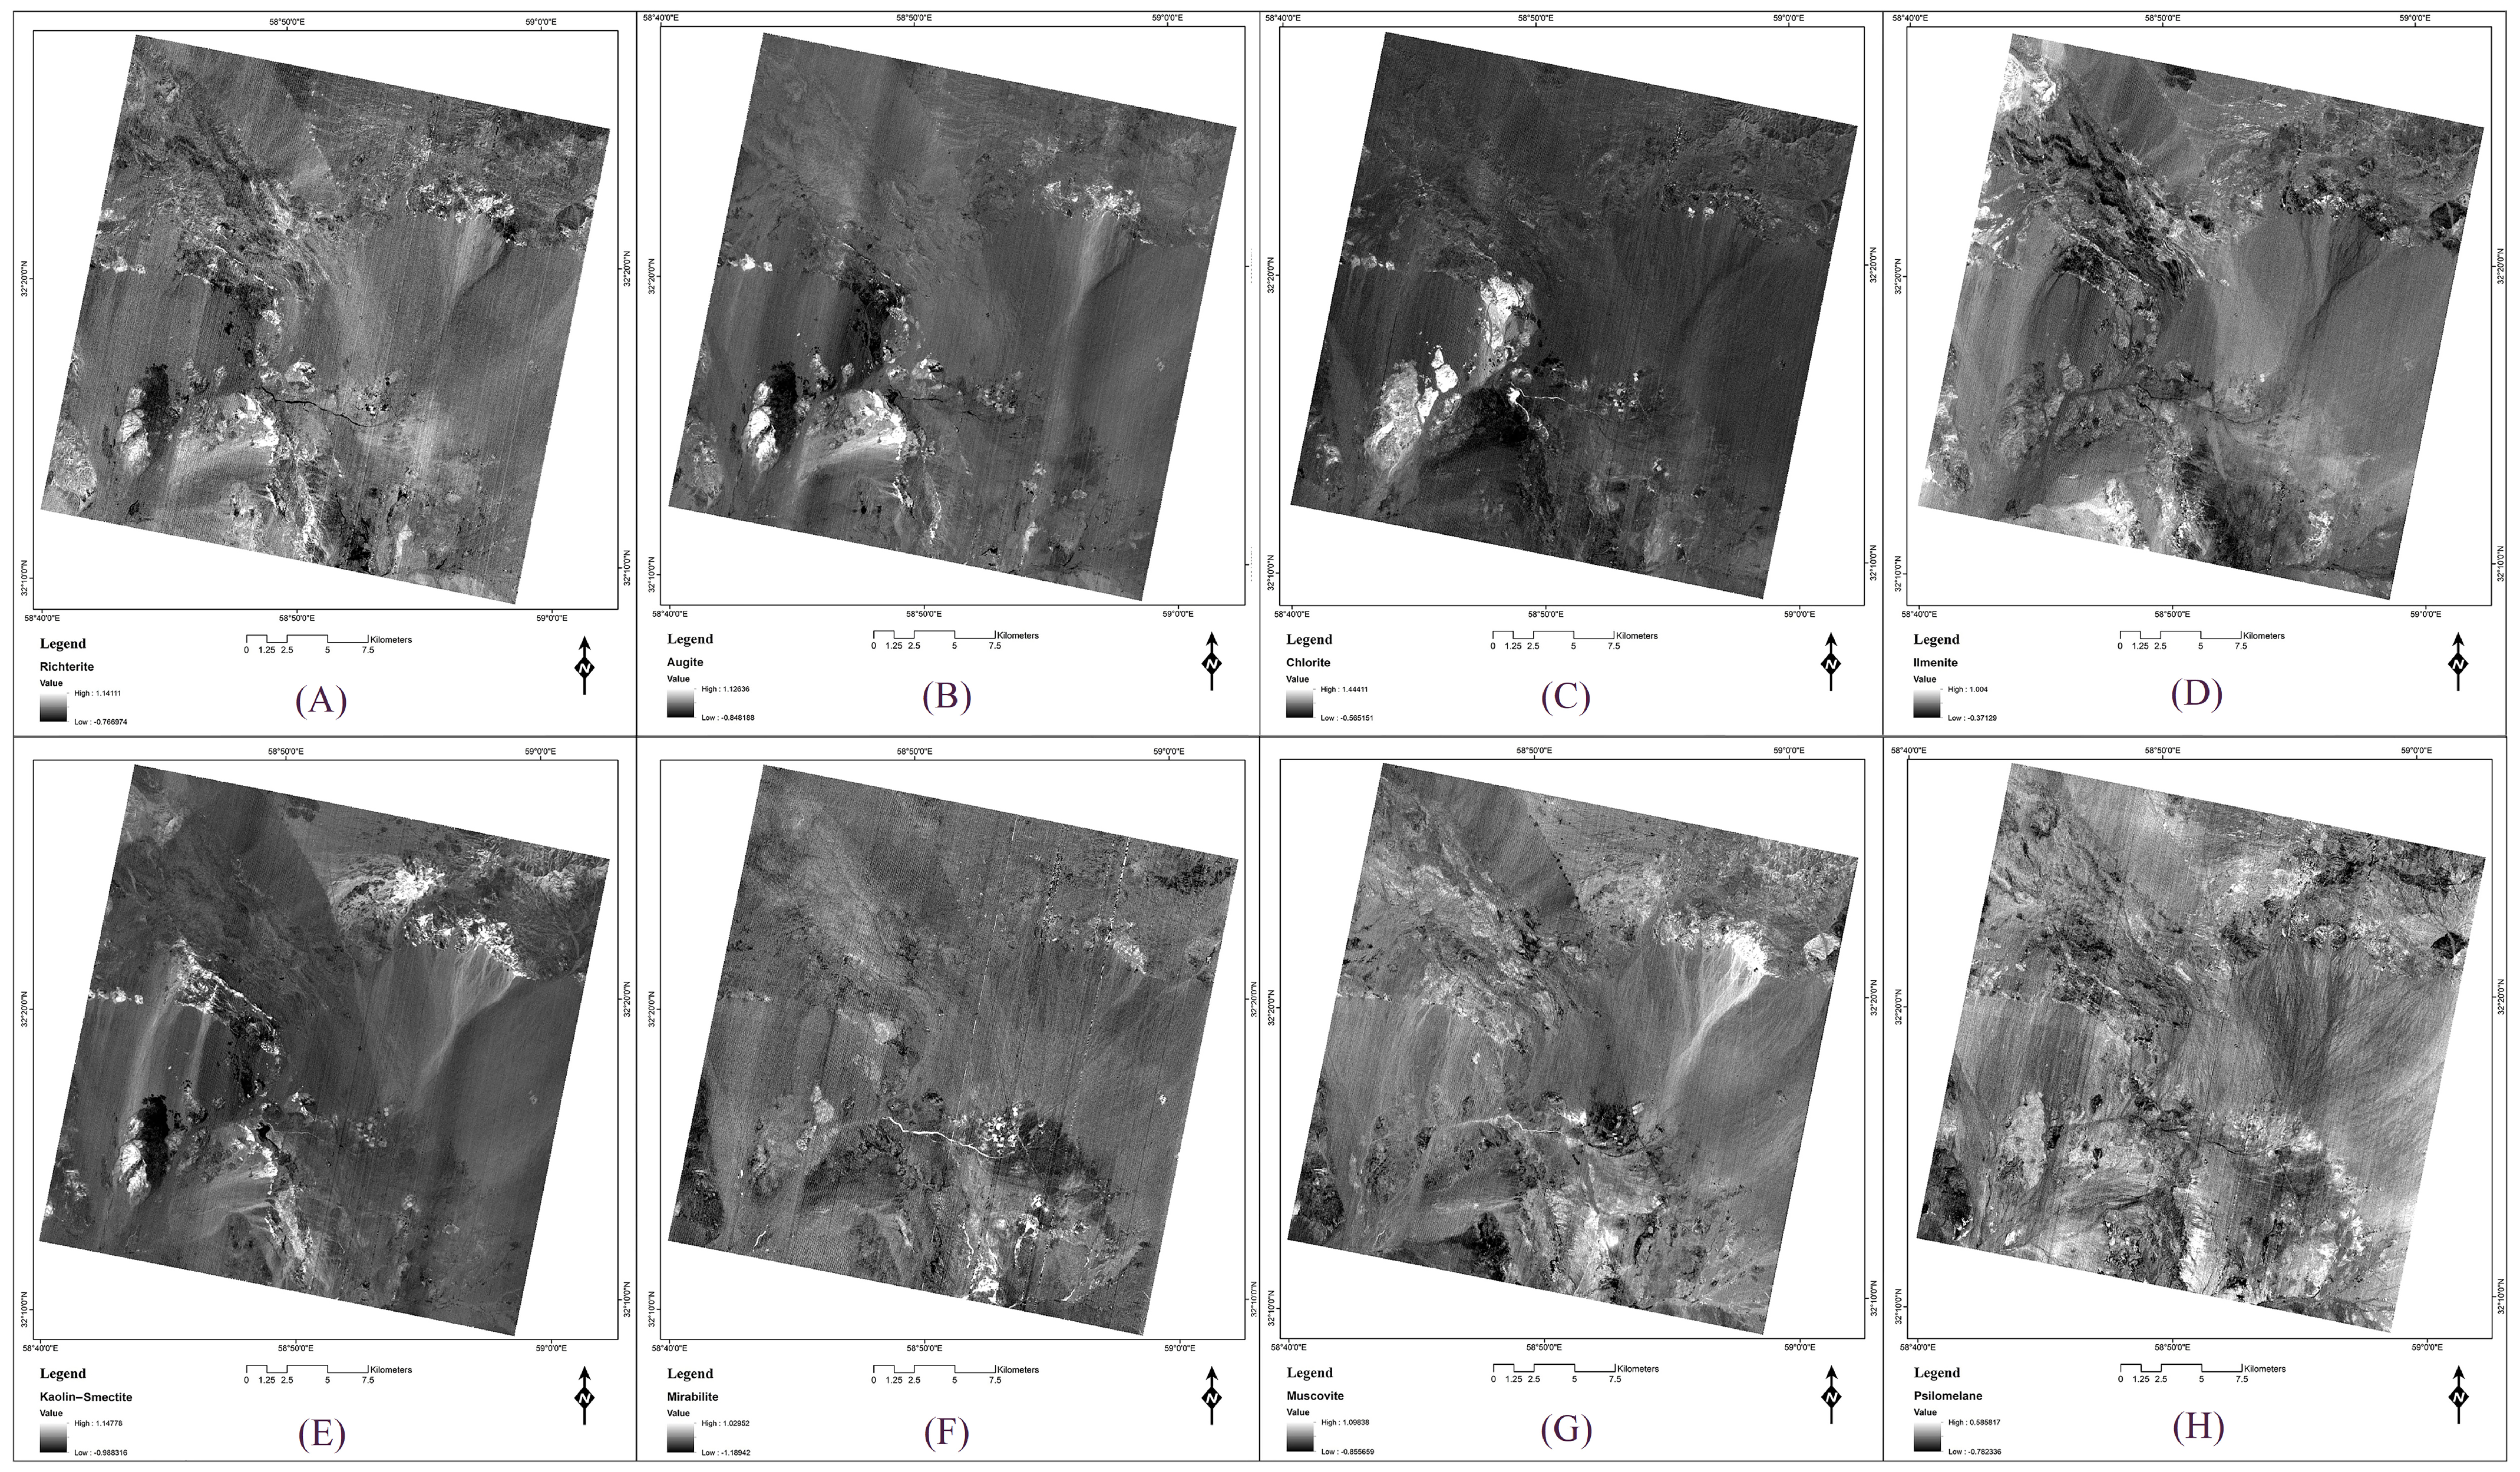
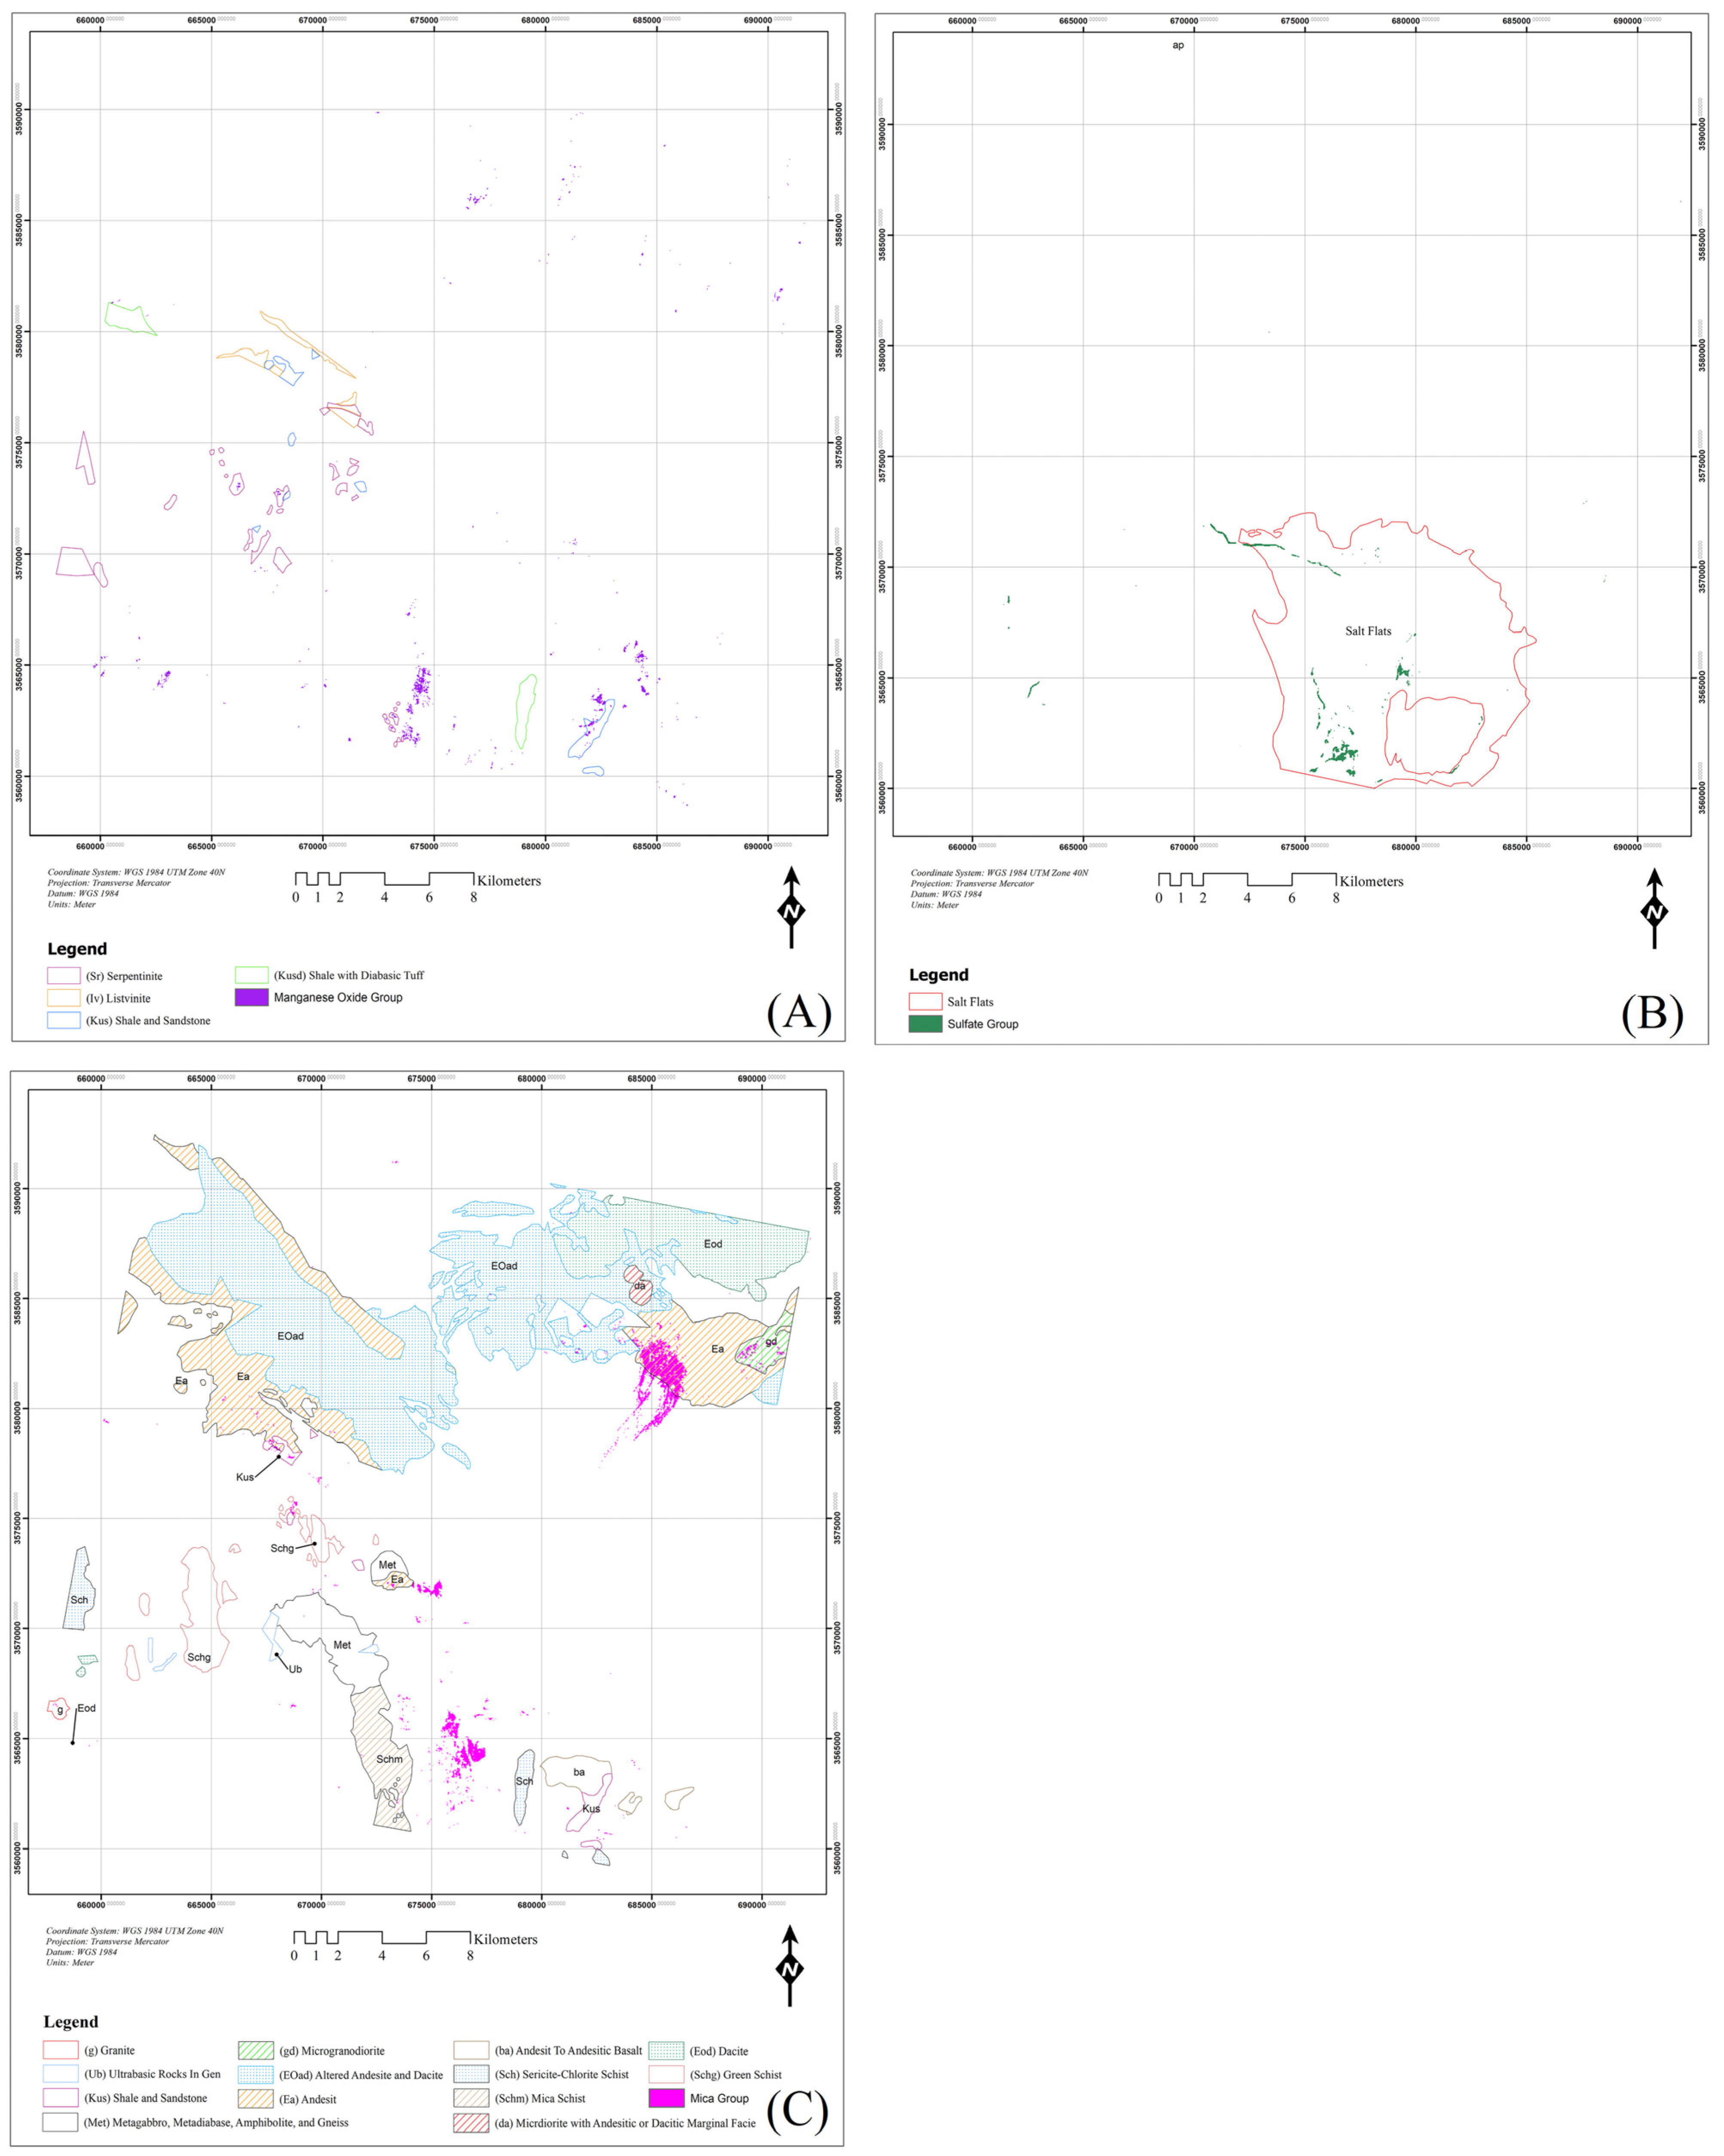
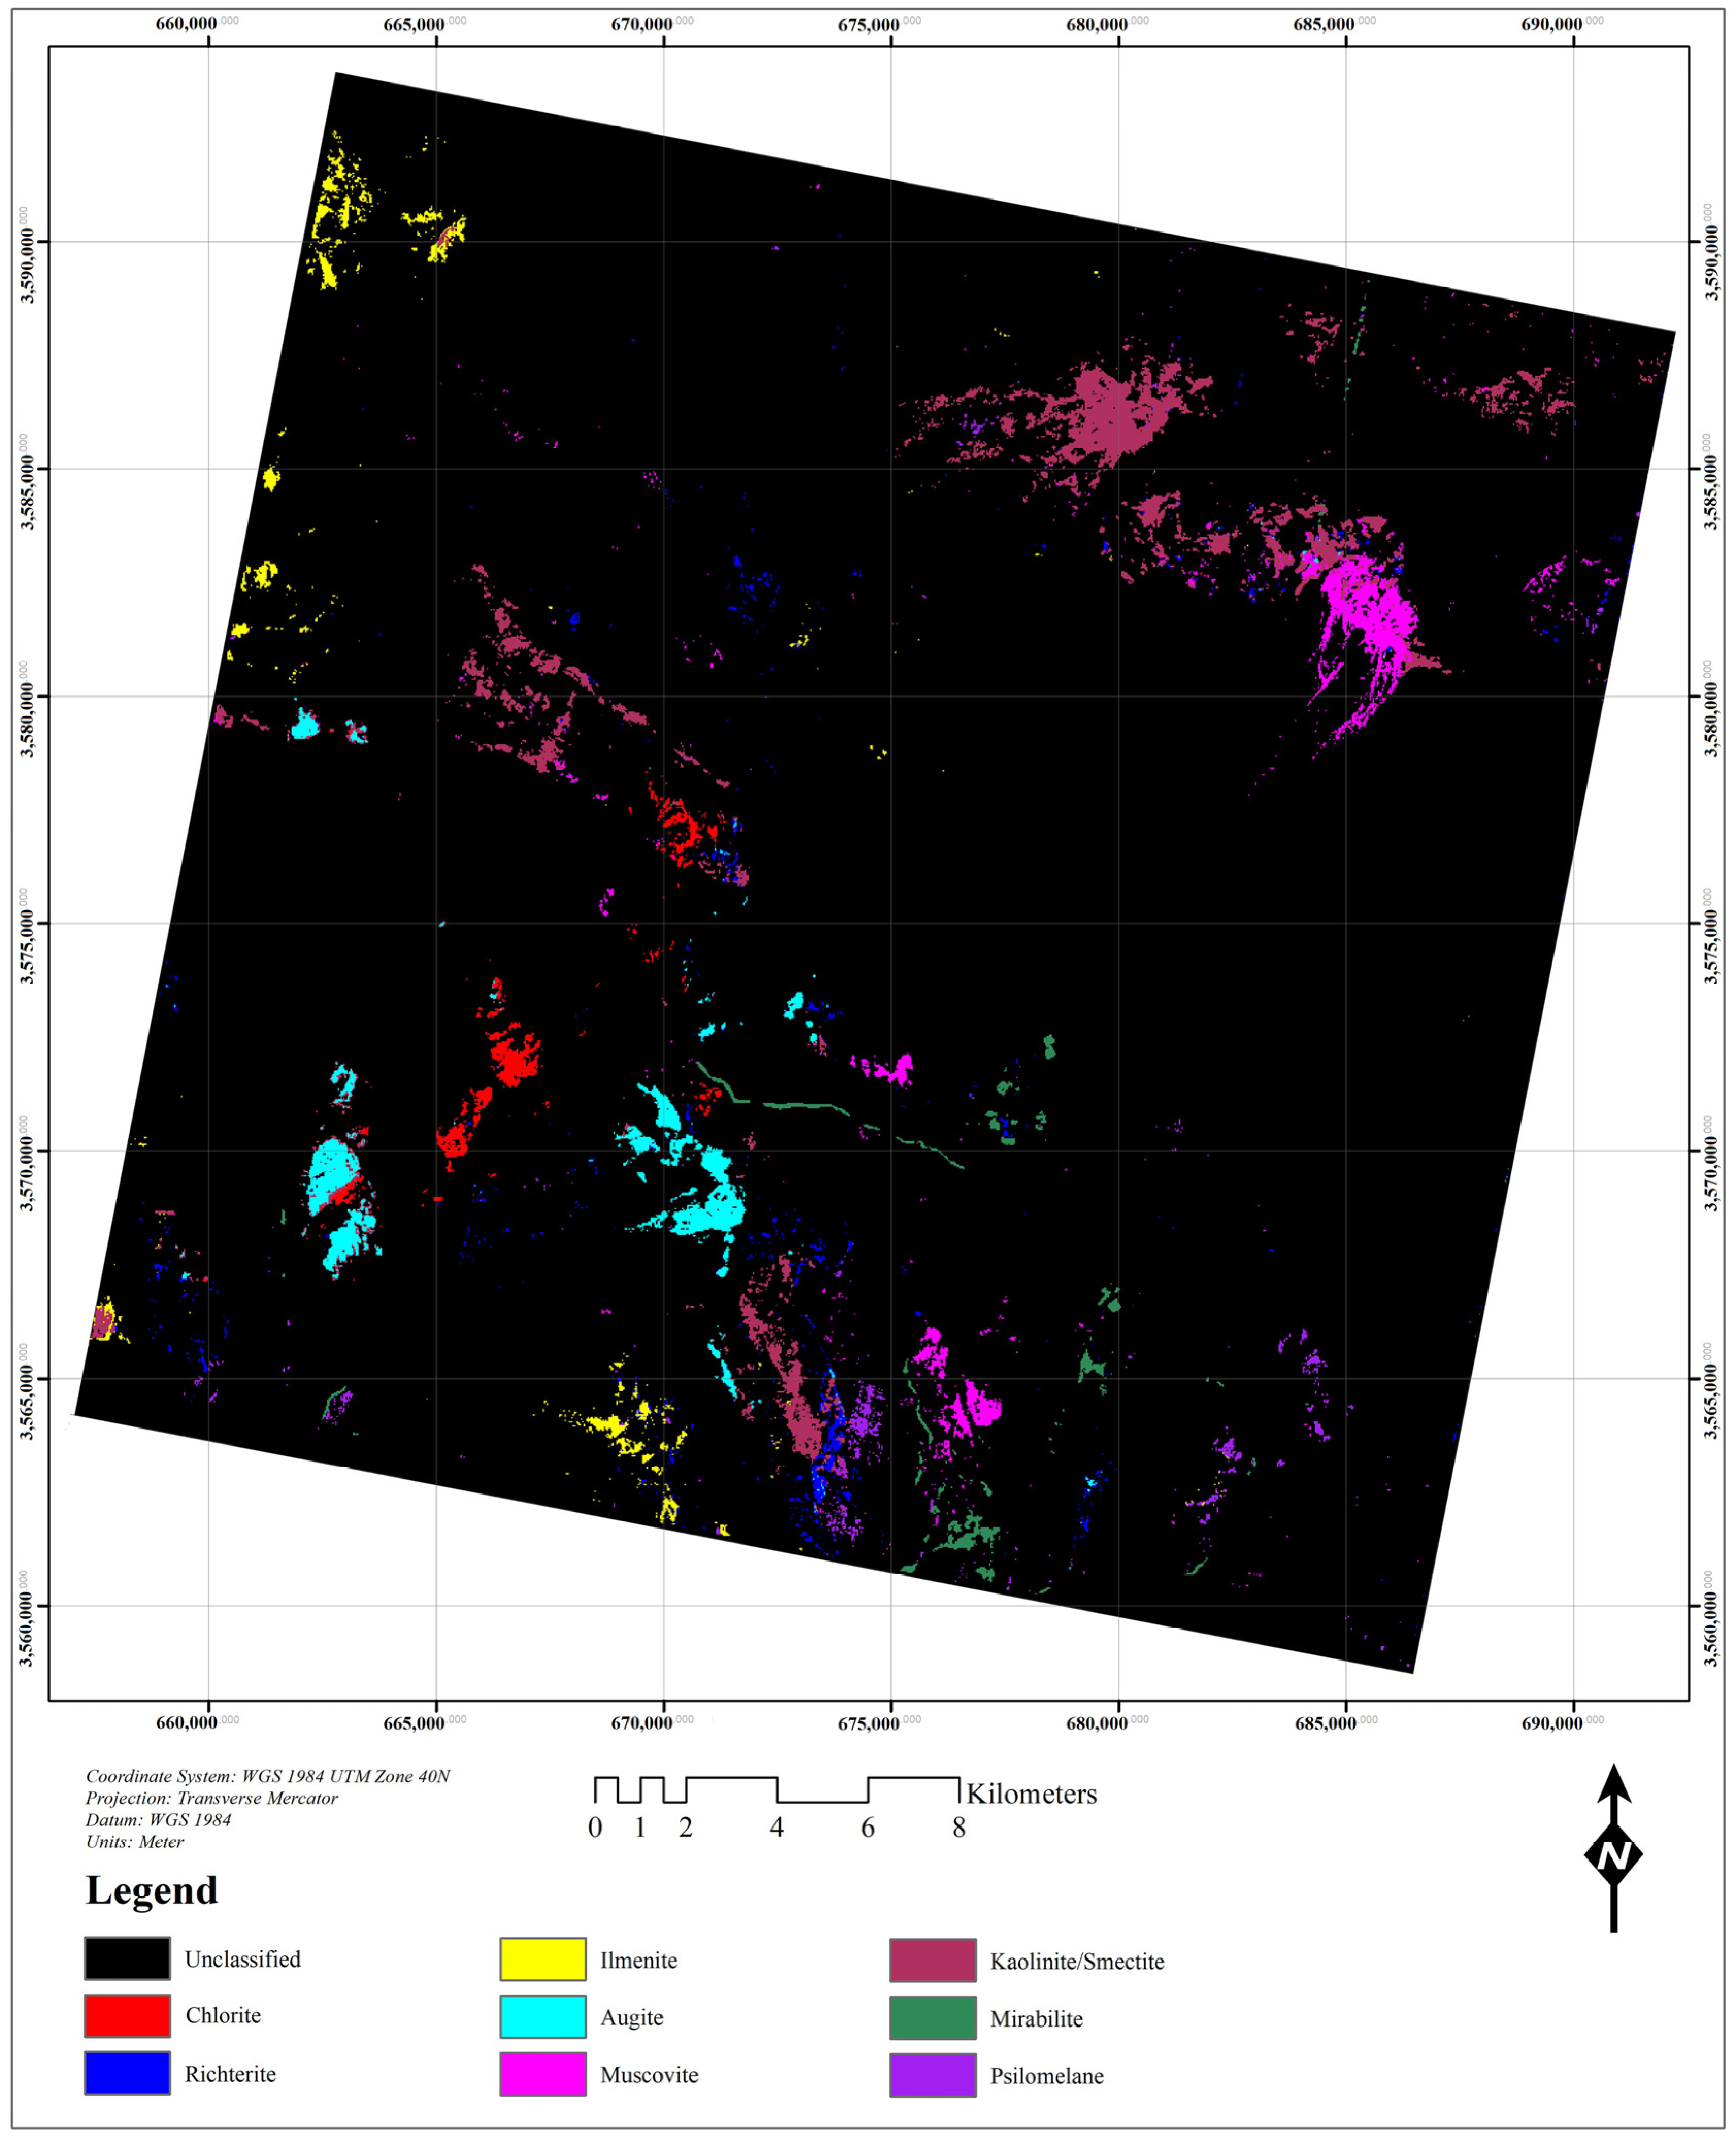
4.2. Mapping Alteration Minerals

Different lithological formations exhibit typical mineral compositions, which are distinguishable through the MF rule images derived from PRISMA data. Figure 6A–H shows the rule images generated using the MF algorithm, which depicts the endmember minerals derived from PRISMA spectral bands for the Sar-e-Châh-e-Shur region. The bright pixels signify a high surface abundance of specific alteration minerals associated with distinct lithological units. In Figure 6A, richterite is primarily mineral detected in Mica Schist (Schm) and metagabbro, metadiabase, amphibolite, and gneiss (Met) formations, implying metamorphic alterations within these lithological units. In Figure 6B, augite is identified as associated with metagabbro, metadiabase, amphibolite, gneiss (Met), gabbro (gb), Mica Schist (Schm), Colored mélange (Cm), and andesite (Ea) formations, reflecting its presence in various metamorphic and igneous contexts. In Figure 6C, chlorite is predominantly observed within formations such as diabase (Kud), gabbro (gb), Pyroxene Andesite (ap), Pyroxenite (Px), Amphibole schist (Scha), and green schist (Schg). The presence of chlorite indicates propylitic alteration processes within these lithological units. In Figure 6D, ilmenite is notably found within formations like Red tuff with chert marker (Et), granite (g), hornblende andesite (ah), and andesite (Ea), indicating associations with specific igneous and metamorphic processes. In Figure 6E, kaolin–smectite is distributed across altered andesite and dacite (EOad), andesite (Ea), gabbro (gb), metagabbro, metadiabase, amphibolite, and gneiss (Met), granite (g), Colored mélange (Cm), Listvinite (Iv), serpentinite (Sr), and Mica Schist (Schm) formations, indicating argillic alteration processes and mineralogical transformations within these lithological units. In Figure 6F, mirabilite is typically confined within salt flats (Sa) formations, indicative of evaporite deposits and saline environments. In Figure 6G, muscovite is present within andesite (Ea), granite (g), and gabbro (gd) formations, suggesting occurrences in both igneous and metamorphic terrains, hinting at phyllic alteration processes within these lithological units. In Figure 6H, psilomelane is encountered within altered andesite and dacite (EOad), Pyroxene Andesite (ap), andesite to andesitic basalt (ba), shale and sandstone (Kus), marly tuff (Ngm), and Pyroxenite (Px) formations, suggesting associations with diverse sedimentary and volcanic activities and supergene alteration processes.
The bright pixels within particular lithological units highlight the spatial distribution of alteration minerals, providing a valuable recognition of hydrothermal alteration zones associated with potential ore mineralization. In the subsequent analysis, the top 5% of the statistical community within each pixel was identified, thereby pinpointing the purest pixels serving as representatives of endmembers for classification purposes on rule images. Figure 7 shows the MF classification map of the alteration minerals for the study area. In Figure 7, richterite is linked with granite (g), hornblende andesite (ah), Amphibole schist (scha), metagabbro, metadiabase, amphibolite, and gneiss (Met), as well as altered andesite and dacite (Eoad) in the northwestern sector. Augite is linked with gabbro (gb) in the southwestern sector, while it is associated with metagabbro, metadiabase, amphibolite, and gneiss (Met) in the southern and central sectors (Figure 7). Additionally, augite is found in association with Colored mélange (Cm) in the western sector. Chlorite and kaolin/smectite are correlated with andesite (Ea) and shale with diabasic tuff (Kusd) in the northern sector, while they are associated with Mica Schist (Schm) and gabbro (gb) in the central and western sectors. Ilmenite is found in association with altered andesite and dacite (EOad) and andesite (Ea) in the northwestern sector, as well as hornblende andesite (ah), and marly tuff (Ngm) in the southern sector. Mirabilite is linked with salt flats (Sa) in the central sector (Figure 7). Muscovite is correlated with andesite (Ea) in the northeastern sector and with salt flats (Sa) in the central sector. Psilomelane is found in association with serpentinite (Sr) in the western sector, with shale and sandstone (kus) in the southeastern sector, and with drainages in the eastern part of salt flats (Sa).

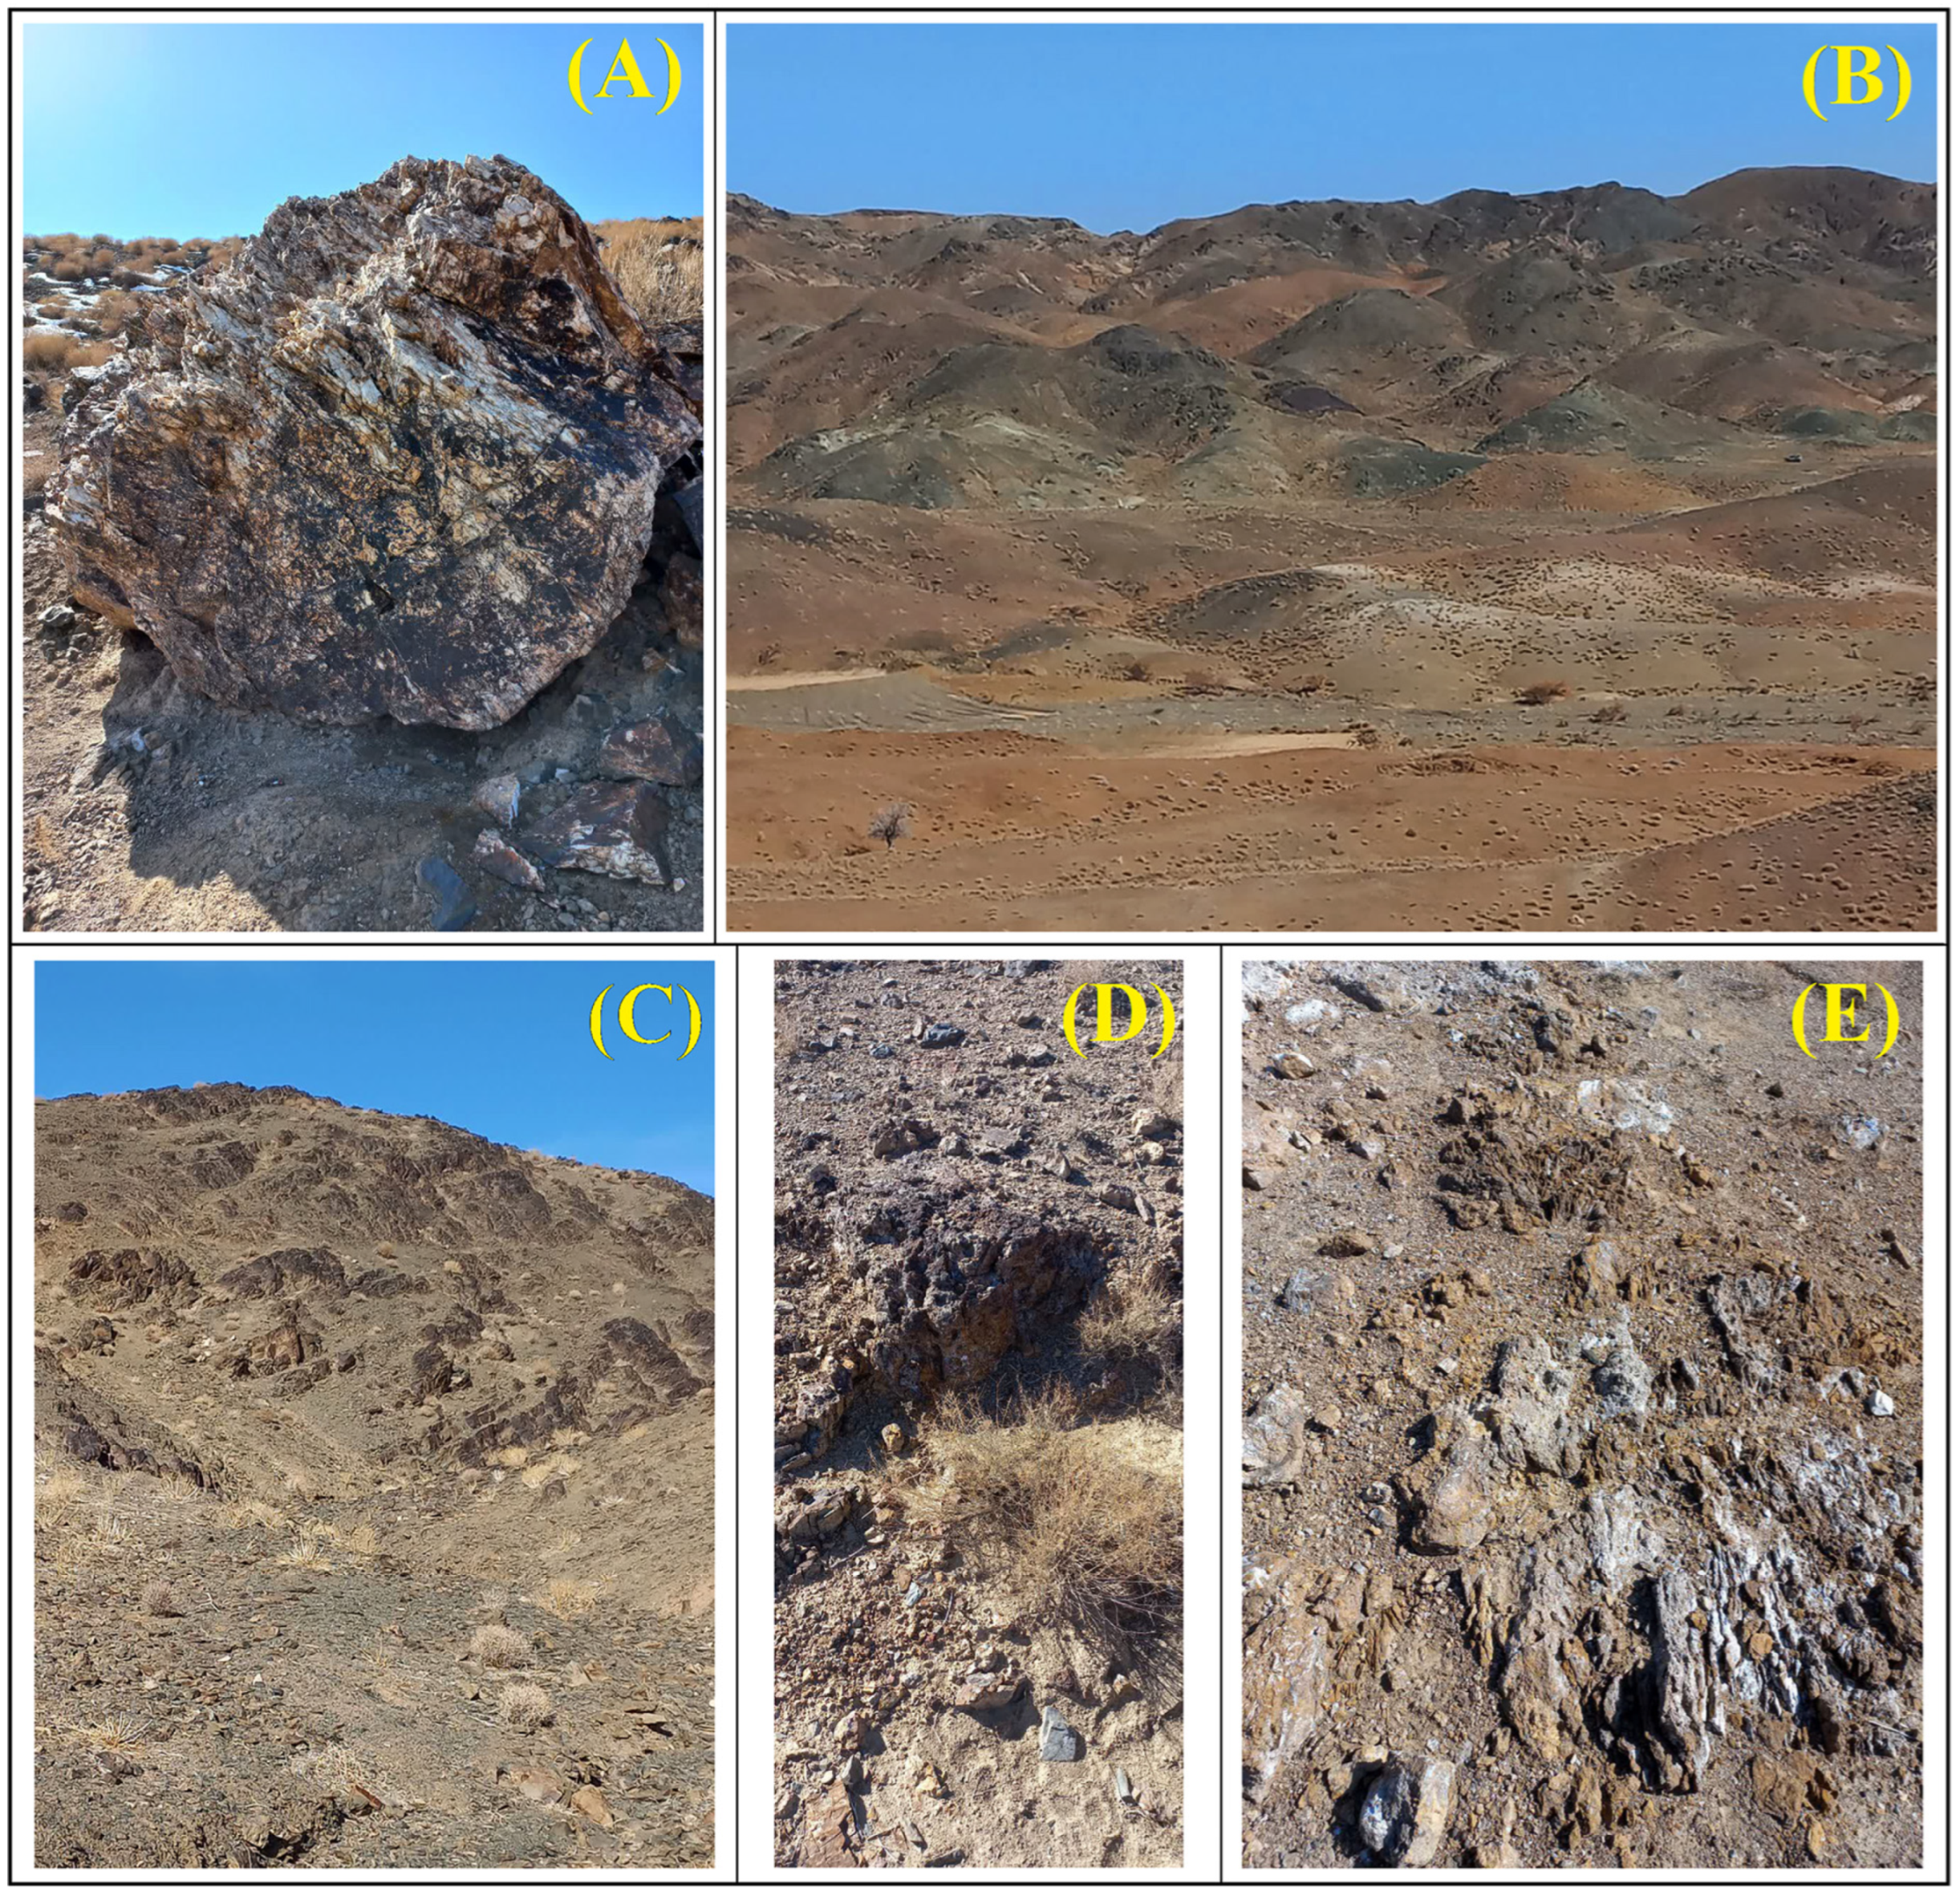
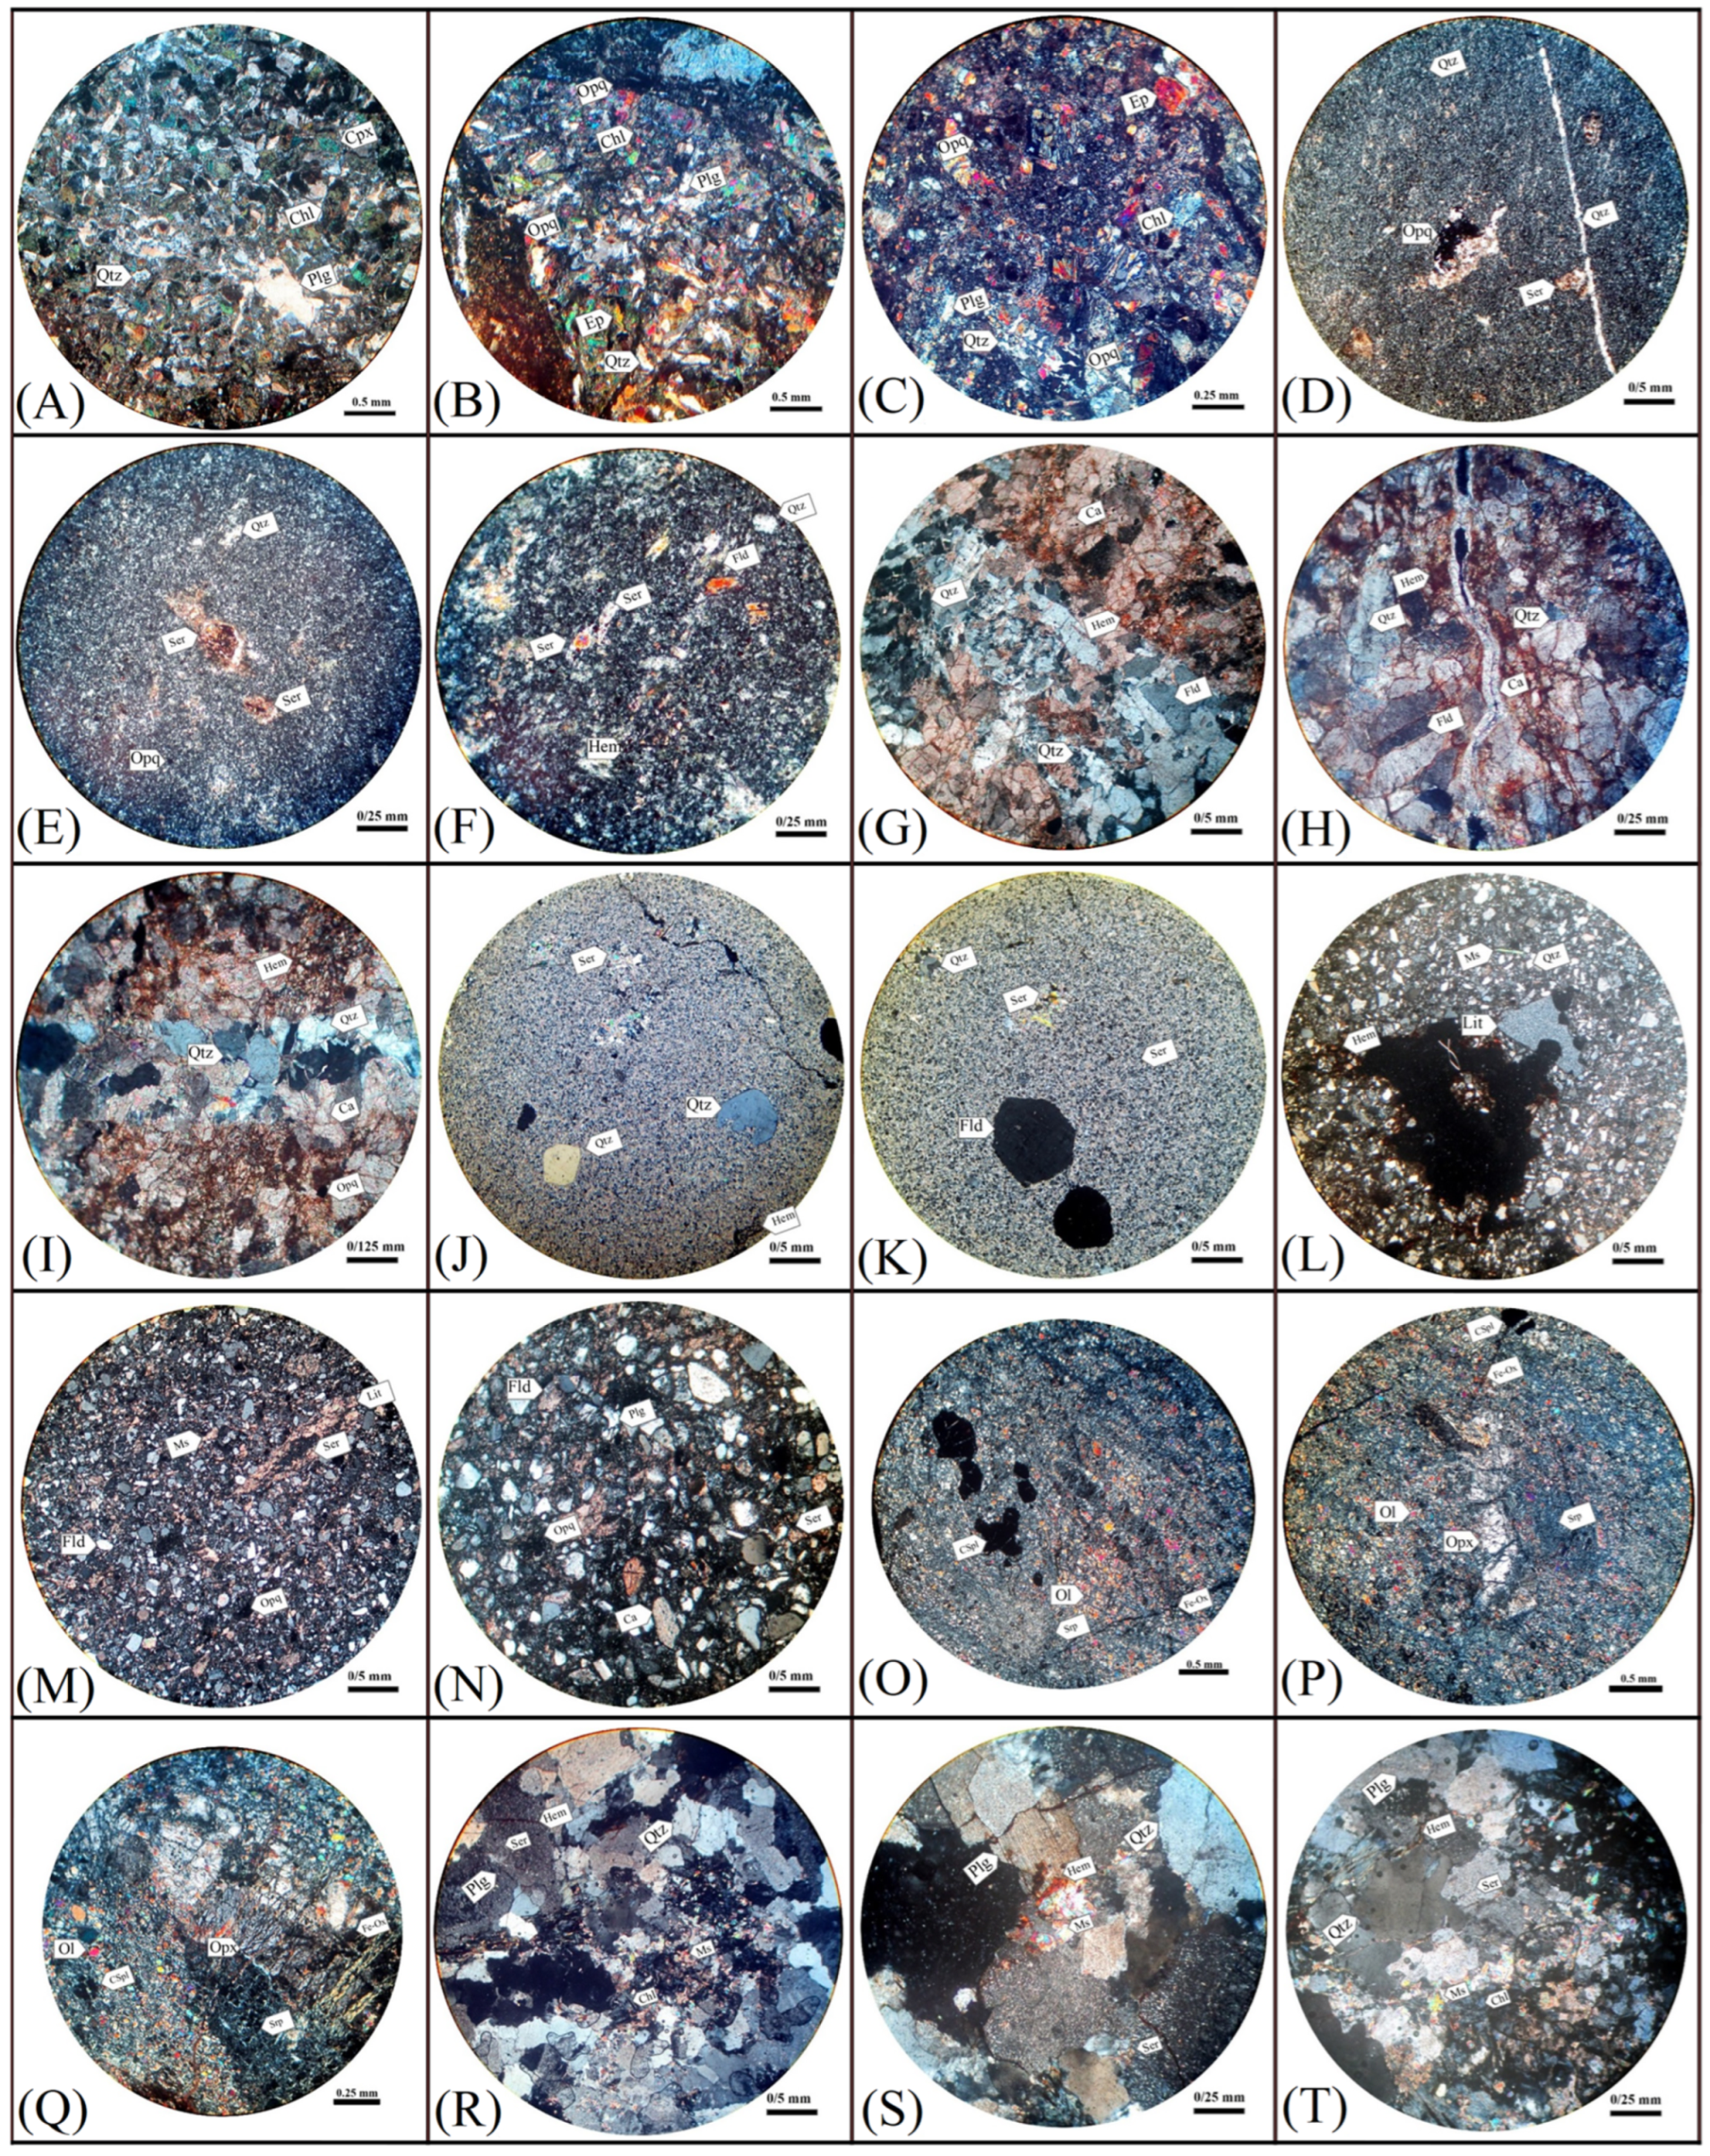
4.3. Fieldwork and Laboratory Analysis

Following the identification of alteration minerals using the analysis of PRISMA data, a field excursion was undertaken in the study area. The presence of alteration minerals was verified through field inspections and collecting samples from lithological units for petrographic study and XRD analysis. Figure 8A–E shows the exposed lithological units containing ore mineralizations and alteration minerals in the study area.
A comprehensive petrographic study on 20 thin sections from various locations and lithological units was subsequently conducted and shown in Figure 9A–T. Figure 9A–C depicts an intergranular-textured diorite–gabbro containing hornblende, plagioclase, clinopyroxene, and a limited amount of plagioclase minerals. The hornblende minerals have undergone some degree of chloritization and epidotization. Chlorite and epidote minerals have primarily appeared within the fractures due to the transformation and alteration of pyroxene, hornblende, and opaque minerals. Figure 9D–F displays a fine-grained tuff containing phenoclasts of mafic minerals that exhibits sericitization and opacification. Additionally, this sample is intersected by quartz veins. It can be described as somewhat sericitic and argillic. Figure 9G–I exhibits crystallized and silicified limestone comprised of calcite and quartz minerals. Quartz–feldspar veins traverse the background, and iron oxide has also formed within the joints. Alterations of both carbonate and oxide types are evident in this thin section. Figure 9J,K depicts a rhyolite sample containing quartz phenocrysts with corrosion gulf and alkaline feldspar. The alkaline feldspar has undergone sericitic and argillization, and iron oxide can be observed in some joints. Figure 9L–N displays Greywacke sandstone containing fragments of angular to semi-rounded quartz, lithic, muscovite, and feldspar. Iron oxide has also formed within the joints in this thin section. Figure 9O–Q represents a harzburgite sample containing remnants of primary minerals such as olivine, orthopyroxene, and cream spinel, which have undergone strong serpentinization. Additionally, iron oxide is visible in some joints of the background. Figure 9R–T illustrates a granite sample consisting of plagioclase and quartz minerals, along with a mafic mineral that has been significantly chloritized and opacified. Muscovite is also present in the sample. Plagioclase has undergone some degree of sericitization, and minor minerals such as zircon and sphene are also observed.
A total of 20 samples were also carefully selected for the XRD analysis. The findings from the XRD analysis exhibited significant consistency with the outcomes of the PRISMA remote sensing investigations. Table 2 illustrates the mineral phases identified from the X-ray diffraction spectrum of the collected samples. The findings obtained through the petrographic and XRD analysis provided in-depth insights into the mineralogical composition and diverse alterations evident in the rock samples investigated within the study area. These discoveries played a pivotal role in facilitating geological interpretation and validating the geological map showcased in Table 3.
A total of 574 samples of stream sediments were analyzed using the precise ICP-OES method to scrutinize 19 EPEs and oxides. The results of the elemental analyses, including Zn, Au, As, Ni, Cu, Mo, Pb, Cr, Hg, Bi, Ba, Co, Sb, Sn, Ag, W, MnO, TiO, and Fe2O3, are presented in Figure 10A–S. Regions falling within the scope of a possible anomaly ( x ¯ + 2 s > x ¯ + 3 s )   are highlighted in red color. These findings offer valuable insights into element anomalies within the geological units of the region, specifically identifying areas with potential anomalies. This geochemical analysis significantly contributes to our understanding of the chemical and geological characteristics inherent to the region.

5. Discussion

The capability of PRISMA hyperspectral satellite data was evaluated to map alteration minerals in the in the Sar-e-châh-e-shur, the Sistan zone of eastern Iran. Several maps of alteration minerals showing spatial distribution of richterite, augite, psilomelane, ilmenite, kaolinite, smectite, mirabilite, muscovite, and chlorite were generated using the VCA algorithm and MFU technique. The X-ray analysis, thin section examination, geochemical study of stream sediments, and interpretation of geological maps were used to verify the outcomes. Accordingly, alteration mineral maps derived from PRISMA are specifically inclusive compared to previous studies using ASTER multispectral data in the study region [71,72,73,74]. In addition, some previous studies accentuated that PRISMA datasets contain great capability providing valuable insights for hydrothermal alteration mapping of ore mineralizations in metallogenic provinces around the world [2,7,8,9,14,15,16,17,18,19,20,21,22,23,24,25,75,76]. The escalating challenges associated with mineral exploration underscore the critical need for innovative strategies, particularly in the identification of high-potential zones and subsequent campaigns. PRISMA hyperspectral remote sensing emerges as a new technology in this domain, providing comprehensive hyperspectral data for hydrothermal alteration mapping with unparalleled precision [75,76,77,78]. However, to effectively leverage PRISMA hyperspectral remote sensing data, rigorous validation processes are indispensable to ensure the accuracy and reliability of the results before committing substantial resources to specialized studies. In the broader context of PRISMA hyperspectral remote sensing, validation assumes paramount significance. It serves multifaceted purposes, including data accuracy verification, result precision enhancement, method and algorithm evaluation, and optimization of classification outcomes [79,80].
In this investigation, the initial step aimed to enhance the accuracy of PRISMA results involved the classification of identified minerals into distinct mineralogy groups based on mineralogical data. Subsequently, this process notably improved the interpretation of the abundance maps. Detailed information regarding these mineral groups is outlined in Table 3. Moreover, anomalies found in stream sediments and detailed petrographic study and XRD analysis were meticulously correlated with the lithological units prevalent in the study region. The outcome of this data integration is shown in Table 4. This exhaustive interpretation enabled the identification of areas prone to containing the detected mineral groups. Following this, geological maps underwent meticulous scrutiny to identify potential occurrences of each mineral group and feasible ore mineralization.
In this study, geological information was integrated with PRISMA alteration abundance maps, aiming to assess the correlation between classified alteration minerals and geological formations. This process significantly deepened our understanding of the geological aspects while augmenting the accuracy of alteration minerals identification and feasible ore mineralization. Figure 11A–D and Figure 12A–C show the integration of the PRISMA alteration abundance maps with the geological map and the information derived from laboratory analysis. This data integration for the lithologies of amphibole schist (Scha) and metagabbro, metadiabase, amphibolite, and gneiss (Met) can provide valuable insights into potential ore mineralization (Figure 11A). In amphibole schist, the presence of elements like Pb, Co, and Ba suggests a probable association with hydrothermal alteration deposits, while the presence of MnO hints at the potential for metamorphic deposits. Similarly, the Met lithologies, which contain elements such as Zn, Co, and Pb, also imply potential connections to hydrothermal alteration deposits. Additionally, the occurrence of MnO in Met lithologies suggests an affinity for metamorphic deposits. Given that amphibole minerals are commonly found in skarn deposits, hydrothermal alteration deposits, and metamorphic deposits, and that amphibolite and pyroxene are carriers and concentrators of zinc possibly associated with Pb-Zn and iron ore deposits, it is reasonable to speculate that both amphibole schist (Scha)and metagabbro, metadiabase, amphibolite, and gneiss (Met) lithologies may coexist in zones, where Pb-Zn and iron mineralization occur. However, comprehensive geological investigations and mineralogical analyses are imperative to confirm the presence and economic feasibility of such mineral deposits in particular zones.
Unveiling the presence of argillic, propylitic, and phyllic hydrothermal alterations within the study area (Figure 11B and Figure 12C) shows that the argillic and propylitic, are accurately associated with the clay mineral group, notably observed within the altered andesite and dacite (EOad) rock unit and the andesite (Ea) rock unit. Additionally, the acknowledgment of phyllic alteration linked to the mica group within the Ea is duly noted. Correspondingly, the detection of W, Mo, Cu, and Au geochemical anomalies within the andesite (Ea) and altered andesite and dacite (EOad) lithological units suggests the potential of copper and gold mineralization, which is exactly matched with the spatial location of the Shadan porphyry gold–copper deposit. This deposit, comprising 27 million tons and containing 0.55 g per ton of gold, is categorized as a porphyry gold–copper deposit owing to its low copper mineralization content. The mineralization is characterized by a mineral mass extending several hundred meters and associated with vertically oriented pipe-like intrusions spanning several hundred meters [103].
A compelling correlation between the oxide group in altered andesite and dacite (EOad), may reveal a significant Sn (tin) anomaly (see Figure 11C). Similarly, geochemical anomalies of TiO2 (titanium dioxide), MnO (manganese oxide), and Fe2O3 (iron oxide) have been identified within the Mica Schist unit (Schm), aligning well with the remote sensing findings and suggesting the presence of oxide minerals. Consequently, the oxide group is associated with both altered andesite and aacite (EOad) and Mica Schist (Schm) lithologies, offering promising prospects for a diverse range of oxide ore mineralization. The pyroxene minerals group was typically found with pyroxenite (Px), gabbro (gb), and Ultrabasic (Ub) lithological units and the potential zones of copper and gold mineralization in the study area (Figure 11D, see Figure 11B and Figure 12C). Generally, in porphyry copper deposits, skarn deposits, and volcanic-hosted massive sulfide deposits, pyroxene minerals are commonly found along with the occurrences of copper mineralization [103].
The manganese oxide group is commonly found alongside serpentinite (Sr) as well as shale and sandstone (kus) in the study area (Figure 12A). These lithological unit formations were not initially considered as potential single-element anomalies. Field investigations have confirmed the presence of manganese oxide group as desert varnish in these lithological units. In Figure 12B, the central sector, known as salt flats (Sa), characterized by arid conditions and high evaporation rates, is conducive to the formation of salt flats. The presence of sulfate minerals in this part of the study area was further supported by field checking, which verified the remote sensing identification of the sulfate group.
After interpreting the integrated maps of mineral abundance and perspective geological maps illustrated in Figure 11A–D and Figure 12A–C, a critical aspect of this analysis involved validating the coherence of these maps with relevant geological references. To accomplish this goal, the scoring system to evaluate the alignment of abundance maps with actual geological features, the normalized score (NS) equation [71] was implemented, which offers a quantitative framework derived from qualitative evaluations. This equation facilitates the conversion of qualitative assessments into numerical metrics, thereby establishing an objective basis for analysis [71].
Central to the NS equation are two key parameters: “C” represents the coverage level of desired geological units, while “E” reflects the accuracy level of estimation, these parameters indicate the degree of alignment between classification algorithm predictions and actual geological conditions. Notably, specific values for “C” and “E” were referenced from Table 5, which outlines predefined benchmarks for accuracy assessment. To provide a comprehensive understanding of the NS, we employed the normalized score percentage (NSP) formula, elaborating on the outcomes in Table 6.
N S = 1 n C n × E n N
N S P = 25 × N S
0 N S 4
0 N S P 100
where,
NS = Normal score;
NSP = Normal score percentage;
C = Compliance;
E = Estimate;
n = The class number;
And N = The number of maps used for category classification validation.
This supplementary analysis enhances the interpretability of results, offering insights into the reliability and fidelity of hyperspectral remote sensing methodologies. Derived from the data presented in Table 6, the results of the MF algorithm classification yielded a normalized score of 3.42 out of 4. This indicates an 85.71% agreement with the geological map that is specific to the area, which is considered to be a satisfactory and commendable outcome. Consequently, alteration mapping results derived from PRISMA hyperspectral data are specifically comprehensive and accurate in this study. Hence, PRISMA datasets have prodigious aptitude supplying applicable information for hydrothermal alteration mapping and consequent mineral exploration in the Sistan zone of eastern Iran, particularly in the Sar-e-châh-e-shur region.

6. Conclusions

This study illustrates the applicability of hyperspectral PRISMA data in alteration mineral mapping for mineral exploration in the Sar-e-Châh-e-Shur area, Birjand, Iran. By meticulously adjusting and preprocessing the PRISMA data, the VCA algorithm identified spectral signatures related to alteration minerals, which were then validated using the USGS spectral library. The PRISMA data underwent classification using the MFU algorithm. The analysis revealed a diverse spectrum of mineral groups, including the clay group, amphibole group, oxide group, pyroxene group, mica group, sulfate minerals, and manganese oxide group. Integration of the PRISMA alteration mapping results with the geological map and laboratory data discovered feasible ore mineralizations associated with alteration mineral groups. This integration provides valuable insights for Pb-Zn and iron mineralization in amphibole schist and meta-gabbro units, copper and gold deposits associated with andesite and schist units, diverse mineralization occurrences in altered andesite, dacite, Mica Schist, gabbro, and Ultrabasic units. However, comprehensive geological (e.g., spectroradiometer measurements) and geophysical (e.g., gravity, magnetic, magnetotelluric, induced polarization (IP) methods) and geochemical (e.g., metal grading) assessments are essential to confirm the economic feasibility of the ore mineralizations in the identified high-potential zones. Each identification underwent rigorous validation via the NS equation, ensuring the precision and reliability of the detected alteration mineral compositions. The use of the NS equation for validation highlighted its effectiveness as a quantitative framework for evaluating the accuracy and reliability of PRISMA outputs. This validation framework showed potential for adaptation and application across diverse geographical contexts, thereby enhancing the credibility of hyperspectral PRISMA remote sensing analysis. By presenting a comprehensive methodology for alteration mineral identification and validation, this study illuminates the way for future research aimed at optimizing mineral resource exploration. In fact, this study represents a pioneering approach to mineral exploration by harnessing the power of PRISMA hyperspectral remote sensing imagery. More than just a case study, this work has significant implications for global mineral exploration. It offers a unique integration of PRISMA alteration mapping with geological maps and laboratory data to uncover potential ore mineralizations, providing invaluable insights into potential mineral deposits. By demonstrating the potential and versatility of PRISMA hyperspectral remote sensing imagery, this study paves the path for future research and innovation in mineral exploration, potentially transforming the field in the years to come. This contribution emphasizes the transformative role of PRISMA hyperspectral remote sensing imagery for mineral exploration in metallogenic provinces around the world. It is recommended to continue to refine and expand the hyperspectral methodologies, and we can edge closer to unlocking the full potential of PRISMA hyperspectral remote sensing imagery in addressing the mounting challenges of mineral exploration globally.

Author Contributions

Conceptualization, J.H., H.J.M. and M.M.O.; methodology, J.H.; software, J.H.; validation, J.H., H.J.M. and M.M.O.; formal analysis, J.H.; investigation, J.H.; data curation, J.H., H.J.M. and M.M.O.; writing—original draft preparation, J.H.; writing—review and editing, A.B.P. and M.H.; visualization, J.H.; supervision, H.J.M. and M.M.O. All authors have read and agreed to the published version of the manuscript.

Funding

This research received no external funding.

Data Availability Statement

Data are contained within the article.

Acknowledgments

The authors appreciate Sahand University of Technology, Tabriz, Iran for providing support and facilities for this study. Additionally, the Institute of Oceanography and Environment (INOS), Universiti Malaysia Terengganu (UMT) and Universiti Teknologi Malaysia are acknowledged.

Conflicts of Interest

The authors declare no conflicts of interest.

References

  1. Ghamisi, P.; Plaza, J.; Chen, Y.; Li, J.; Plaza, A.J. Advanced Spectral Classifiers for Hyperspectral Images: A review. IEEE Geosci. Remote Sens. Mag. 2017, 5, 8–32. [Google Scholar] [CrossRef]
  2. Agrawal, N.; Govil, H.; Mishra, G.; Gupta, M.; Srivastava, P.K. Evaluating the Performance of PRISMA Shortwave Infrared Imaging Sensor for Mapping Hydrothermally Altered and Weathered Minerals Using the Machine Learning Paradigm. Remote Sens. 2023, 15, 3133. [Google Scholar] [CrossRef]
  3. Mishra, G.; Govil, H.; Srivastava, P.K. Identification of Malachite and Alteration Minerals Using Airborne AVIRIS-NG Hy-perspectral Data. Quat. Sci. Adv. 2021, 4, 100036. [Google Scholar] [CrossRef]
  4. Abdelsalam, M.G.; Stern, R.J.; Berhane, W.G. Mapping gossans in arid regions with Landsat TM and SIR-C images: The Beddaho Alteration Zone in northern Eritrea. J. Afr. Earth Sci. 2000, 30, 903–916. [Google Scholar] [CrossRef]
  5. Qian, S.-E. Hyperspectral Satellites, Evolution, and Development History. IEEE J. Sel. Top. Appl. Earth Obs. Remote Sens. 2021, 14, 7032–7056. [Google Scholar] [CrossRef]
  6. Loizzo, R.; Daraio, M.; Guarini, R.; Longo, F.; Lorusso, R.; Dini, L.; Lopinto, E. Prisma Mission Status and Perspective. In Proceedings of the IGARSS 2019—2019 IEEE International Geoscience and Remote Sensing Symposium, Yokohama, Japan, 28 July–2 August 2019; pp. 4503–4506. [Google Scholar]
  7. Esmaeili, M.; Fathianpour, N.; Soltani-Mohammadi, S. PRISMA hyperspectral imagery for mapping alteration zones associated with Kuhpanj porphyry copper deposit, Southern Iran. Eur. J. Remote Sens. 2024, 57, 2299369. [Google Scholar] [CrossRef]
  8. Bedini, E.; Chen, J. Application of PRISMA satellite hyperspectral imagery to mineral alteration mapping at Cuprite, Nevada, USA. J. Hyperspectral Remote Sens. 2020, 10, 87–94. [Google Scholar] [CrossRef]
  9. Tripathi, P.; Garg, R.D. Feature extraction of DESIS and PRISMA hyperspectral remote sensing datasets for geological applications. ISPR—Int. Arch. Photogramm. Remote Sens. Spat. Inf. Sci. 2021, 44, 169–173. [Google Scholar] [CrossRef]
  10. Chirico, R.; Mondillo, N.; Laukamp, C.; Mormone, A.; Di Martire, D.; Novellino, A.; Balassone, G. Mapping hydrothermal and supergene alteration zones associated with carbonate-hosted Zn-Pb deposits by using PRISMA satellite imagery supported by field-based hyperspectral data, mineralogical and geochemical analysis. Ore Geol. Rev. 2023, 152, 105244. [Google Scholar] [CrossRef]
  11. Pour, A.B.; Park, Y.; Crispini, L.; Läufer, A.; Hong, J.K.; Park, T.-Y.S.; Zoheir, B.; Pradhan, B.; Muslim, A.M.; Hossain, M.S.; et al. Mapping Listvenite Occurrences in the Damage Zones of Northern Victoria Land, Antarctica Using ASTER Satellite Remote Sensing Data. Remote Sens. 2019, 11, 1408. [Google Scholar] [CrossRef]
  12. Pour, A.B.; Sekandari, M.; Rahmani, O.; Crispini, L.; Läufer, A.; Park, Y.; Hong, J.K.; Pradhan, B.; Hashim, M.; Hossain, M.S.; et al. Identification of Phyllosilicates in the Antarctic Environment Using ASTER Satellite Data: Case Study from the Mesa Range, Campbell and Priestley Glaciers, Northern Victoria Land. Remote Sens. 2020, 13, 38. [Google Scholar] [CrossRef]
  13. Iwasaki, A.; Tonooka, H. Validation of a crosstalk correction algorithm for ASTER/SWIR. IEEE Trans. Geosci. Remote Sens. 2005, 43, 2747–2751. [Google Scholar] [CrossRef]
  14. Bedini, E.; Chen, J. Prospection for economic mineralization using PRISMA satellite hyperspectral remote sensing imagery: An example from central East Greenland. J. Hyperspectral Remote Sens. 2022, 12, 124–130. [Google Scholar] [CrossRef]
  15. Shebl, A.; Abriha, D.; Fahil, A.S.; El-Dokouny, H.A.; Elrasheed, A.A.; Csámer, Á. PRISMA hyperspectral data for lithological mapping in the Egyptian Eastern Desert: Evaluating the support vector machine, random forest, and XG boost machine learning algorithms. Ore Geol. Rev. 2023, 161, 105652. [Google Scholar] [CrossRef]
  16. Romaniello, V.; Silvestri, M.; Buongiorno, M.F.; Musacchio, M. Comparison of PRISMA Data with Model Simulations, Hyperion Reflectance and Field Spectrometer Measurements on ‘Piano delle Concazze’ (Mt. Etna, Italy). Sensors 2020, 20, 7224. [Google Scholar] [CrossRef]
  17. Kasmaeeyazdi, S.; Braga, R.; Tinti, F.; Mandanici, E. Mapping Bauxite Mining Residues Using Remote Sensing Techniques. Mater. Proc. 2021, 5, 5091. [Google Scholar] [CrossRef]
  18. Tripathi, P.; Garg, R.D. Potential of DESIS and PRISMA hyperspectral remote sensing data in rock classification and mineral identification: A case study for Banswara in Rajasthan, India. Environ. Monit. Assess. 2023, 195, 575. [Google Scholar] [CrossRef]
  19. Benhalouche, F.Z.; Benabbou, O.; Kebir, L.W.; Bennia, A.; Karoui, M.S.; Deville, Y. An Informed NMF-Based Unmixing Ap-proach for Mineral Detection and Mapping in the Algerian Central Hoggar Using PRISMA Remote Sensing Hyperspectral Data. In Proceedings of the 2021 IEEE International Geoscience and Remote Sensing Symposium IGARSS, Brussels, Belgium, 11–16 July 2021; pp. 1863–1866. [Google Scholar]
  20. Santos, D.; Cardoso-Fernandes, J.; Campos de Lima, A.M.; Teodoro, A.C.M. The Potential of Spectral Unmixing Method Ap-plied to PRISMA Hyperspectral Images in the Identification of Li Minerals: An Evaluation for Prospecting Purposes. In Proceedings of the Earth Resources and Environmental Remote Sensing/GIS Applications XIII, Berlin, Germany, 26 October 2022; Volume 12268, p. 43. [Google Scholar]
  21. Benhalouche, F.Z.; Benabbou, O.; Karoui, M.S.; Kebir, L.W.; Bennia, A.; Deville, Y. Minerals Detection and Mapping in the Southwestern Algeria Gara-Djebilet Region with a Multistage Informed NMF-Based Unmixing Approach Using Prisma Remote Sensing Hyperspectral Data. In Proceedings of the IGARSS 2022—2022 IEEE International Geoscience and Remote Sensing Symposium, Kuala Lumpur, Malaysia, 17–22 July 2022; pp. 6422–6425. [Google Scholar]
  22. Cardoso-Fernandes, J.; Santos, D.; Lima, A.; Teodoro, A.C. Assessing the PRISMA Potential for Mineral Exploration to Vector Low-Grade Lithium Deposits. In Proceedings of the IGARSS 2022—2022 IEEE International Geoscience and Remote Sensing Symposium, Kuala Lumpur, Malaysia, 17–22 July 2022; pp. 5985–5988. [Google Scholar]
  23. Rialland, R.; Carrère, V.; Marion, R.; Soussen, C. Identification of minerals from hyperspectral imaging based on a fuzzy logic approach. In Proceedings of the Algorithms, Technologies, and Applications for Multispectral and Hyperspectral Imaging XXVII, Online, 21 April 2021. [Google Scholar]
  24. Massi, A.; Ortolani, M.; Brunetti, A.; Mazzanti, P. Vibrational Spectral Line Detection in GIS Environment for Mineral Mapping Applications of Hyperspectral Data of the PRISMA Satellite. In Proceedings of the IGARSS 2023—2023 IEEE International Geoscience and Remote Sensing Symposium, Pasadena, CA, USA, 16–21 July 2023; pp. 1644–1647. [Google Scholar]
  25. Benhalouche, F.Z.; Benabbou, O.; Yahia, O.; Karoui, M.S.; Deville, Y.; Kebir, L.W.; Bennia, A. New Informed Linear Mixing Model and NMF-Based Unmixing Method Addressing Spectral Variability with an Application to Mineral Detection and Mapping Using Prisma Hyperspectral Remote Sensing Data. In Proceedings of the IGARSS 2023—2023 IEEE International Geoscience and Remote Sensing Symposium, Pasadena, CA, USA, 16–21 July 2023; pp. 7539–7542. [Google Scholar]
  26. Chiavetta, U.; Camarretta, N.; Garfı, V.; Ottaviano, M.; Chirici, G.; Vizzarri, M.; Marchetti, M. Harmonized forest categories in central Italy. J. Maps 2016, 12, 98–100. [Google Scholar] [CrossRef]
  27. Loizzo, R.; Guarini, R.; Longo, F.; Scopa, T.; Formaro, R.; Facchinetti, C.; Varacalli, G. Prisma: The Italian Hyperspectral Mission. In Proceedings of the IGARSS 2018—2018 IEEE International Geoscience and Remote Sensing Symposium, Valencia, Spain, 22–27 July 2018; pp. 175–178. [Google Scholar]
  28. Karthikeyan, M.; Vasuki, A. Spectral Unmixing with Vertex Component Analysis. In Proceedings of the 2015 3rd International Conference on Signal Processing, Communication and Networking (ICSCN), Chennai, India, 26–28 March 2015; pp. 1–7. [Google Scholar]
  29. Vangi, E.; D’amico, G.; Francini, S.; Giannetti, F.; Lasserre, B.; Marchetti, M.; Chirici, G. The New Hyperspectral Satellite PRISMA: Imagery for Forest Types Discrimination. Sensors 2021, 21, 1182. [Google Scholar] [CrossRef]
  30. Karimzadeh, S.; Tangestani, M.H.; Fonseca, A. The synergistic use of WorldView-3 and EO1-Hyperion data for the identification of lineaments and hydrothermal alteration minerals in the Chadormalu iron oxide-apatite deposit area, Central Iran. Earth Sci. Inform. 2023, 16, 2573–2593. [Google Scholar] [CrossRef]
  31. Chen, L.; Sui, X.; Liu, R.; Chen, H.; Li, Y.; Zhang, X.; Chen, H. Mapping Alteration Minerals Using ZY-1 02D Hyperspectral Remote Sensing Data in Coalbed Methane Enrichment Areas. Remote Sens. 2023, 15, 3590. [Google Scholar] [CrossRef]
  32. Ji, L.; Wang, L.; Geng, X. An Automatic Bad Band Pre-Removal Method for Hyperspectral Imagery. IEEE J. Sel. Top. Appl. Earth Obs. Remote Sens. 2019, 12, 4985–4994. [Google Scholar] [CrossRef]
  33. Sun, W.; Du, Q. Hyperspectral Band Selection: A Review. IEEE Geosci. Remote Sens. Mag. 2019, 7, 118–139. [Google Scholar] [CrossRef]
  34. Ceamanos, X.; Doute, S. Spectral Smile Correction of CRISM/MRO Hyperspectral Images. IEEE Trans. Geosci. Remote Sens. 2010, 48, 3951–3959. [Google Scholar] [CrossRef]
  35. Moghadam, H.J.; Oskouei, M.M.; Nouri, T. Unmixing of hyperspectral data for mineral detection using a hybrid method, Sar Chah-e Shur, Iran. Arab. J. Geosci. 2020, 13, 1041. [Google Scholar] [CrossRef]
  36. Mohammady Oskouei, M.; Babakan, S. Role of Smile Correction in Mineral Detection on Hyperion Data. J. Min. Environ. 2016, 7, 261–272. [Google Scholar] [CrossRef]
  37. Vibhute, A.D.; Kale, K.V.; Dhumal, R.K.; Mehrotra, S.C. Hyperspectral imaging data atmospheric correction challenges and solutions using QUAC and FLAASH algorithms. In Proceedings of the 2015 International Conference on Man and Machine Interfacing (MAMI), Bhubaneswar, India, 17–19 December 2015; pp. 1–6. [Google Scholar]
  38. He, Q.; Wu, J.; Wang, G.; Liu, C.; Tao, T. Comparative Study on Atmospheric Correction Methods of Visible and Near-Infrared Hyperspectral Image. In Proceedings of the Selected Papers from Conferences of the Photoelectronic Technology Committee of the Chinese Society of Astronautics 2014, Part I, Chengdu, China, 4 March 2015; Volume 9521, p. 95211L. [Google Scholar] [CrossRef]
  39. Kayadibi, O. Evaluation of Imaging Spectroscopy and Atmospheric Correction of Multispectral Images (Aster and Landsat 7 ETM+). In Proceedings of the 5th International Conference on Recent Advances in Space Technologies—RAST2011, Istanbul, Turkey, 9–11 June 2011; pp. 154–159. [Google Scholar]
  40. Gao, B.-C.; Montes, M.J.; Davis, C.O.; Goetz, A.F. Atmospheric correction algorithms for hyperspectral remote sensing data of land and ocean. Remote Sens. Environ. 2009, 113, S17–S24. [Google Scholar] [CrossRef]
  41. Heylen, R.; Parente, M.; Scheunders, P. Pixel Purity Vertex Component Analysis. In Proceedings of the 2017 IEEE International Geoscience and Remote Sensing Symposium (IGARSS), Fort Worth, TX, USA, 23–28 July 2017; pp. 213–216. [Google Scholar]
  42. Nascimento, J.; Dias, J. Vertex component analysis: A fast algorithm to unmix hyperspectral data. IEEE Trans. Geosci. Remote Sens. 2005, 43, 898–910. [Google Scholar] [CrossRef]
  43. Boardman, J. SIPS User’s Guide Spectral Image Processing System, Version 1.2; Center for the Study of Earth from Space: Boulder, CO, USA, 1992. [Google Scholar]
  44. Kruse, F.A.; Lefkoff, A.B.; Boardman, J.W.; Heidebrecht, K.B.; Shapiro, A.T.; Barloon, P.J.; Goetz, A.F.H. The spectral image processing system (SIPS)—Interactive visualization and analysis of imaging spectrometer data. Remote Sens. Environ. 1993, 44, 145–163. [Google Scholar] [CrossRef]
  45. Clark, R.N.; Gallagher, A.J.; Swayze, G.A. Material Absorption Band Depth Mapping of Imaging Spectrometer Data Using a Complete Band Shape Least-Squares Fit with Library Reference Spectra. In Proceedings of the Second Airborne Visible/Infrared Imaging Spectrometer (AVIRIS) Workshop; JPL Publication 90-54: Pasadena, CA, USA, 1990; Volume 90, pp. 176–186. [Google Scholar]
  46. Clark, R.N.; Swayze, G.A.; Gallagher, A.; Gorelick, N.; Kruse, F.A. Mapping with Imaging Spectrometer Data Using the Complete Band Shape Least-Squares Algorithm Simultaneously Fit to Multiple Spectral Features from Multiple Materials. In Proceedings of the Third Airborne Visible/Infrared Imaging Spectrometer (AVIRIS) Workshop; Jet Pro-pulsion Laboratory Publication: Pasadena, CA, USA, 1991; Volume 42, pp. 2–3. [Google Scholar]
  47. Clark, R.N.; Swayze, G.A.; Gallagher, A. Mapping the Mineralogy and Lithology of Canyonlands, Utah with Imaging Spec-trometer Data and the Multiple Spectral Feature Mapping Algorithm. In Proceedings of the JPL, Summaries of the Third Annual JPL Airborne Geoscience Workshop; JPL Publication: Pasadena, CA, USA, 1992; Volume 1. [Google Scholar]
  48. Clark, R.N.; Swayze, G.A. Mapping Minerals, Amorphous Materials, Environmental Materials, Vegetation, Water, Ice and Snow, and Other Materials: The USGS Tricorder Algorithm. In Proceedings of the JPL, Summaries of the Fifth Annual JPL Airborne Earth Science Workshop; JPL Publication: Pasadena, CA, USA, 1995; Volume 1. [Google Scholar]
  49. Crowley, J.K.; Clark, R.N. AVIRIS Study of Death Valley Evaporite Deposits Using Least-Squares Band-Fitting Methods. In Proceedings of the JPL, Summaries of the Third Annual JPL Airborne Geoscience Workshop; JPL Publication: Pasadena, CA, USA, 1992; Volume 1. [Google Scholar]
  50. Swayze, G.A.; Clark, R.N. Spectral Identification of Minerals Using Imaging Spectrometry Data: Evaluating the Effects of Signal to Noise and Spectral Resolution Using the Tricorder Algorithm. In Proceedings of the Summaries of the 5th Annual JPL Airborne Earth Science Workshop; JPL Publication: Pasadena, CA, USA, 1995; pp. 91–95. [Google Scholar]
  51. Boardman, J.W.; Kruse, F.A.; Green, R.O. Mapping Target Signatures via Partial Unmixing of AVIRIS Data. In Proceedings of the Summaries of the Fifth Annual JPL Airborne Earth Science Workshop; JPL Publication: Pasadena, CA, USA, 1995; Volume 1. [Google Scholar]
  52. Nude, P.M.; Asigri, J.M.; Yidana, S.M.; Arhin, E.; Foli, G.; Kutu, J.M. Identifying Pathfinder Elements for Gold in Multi-Element Soil Geochemical Data from the Wa-Lawra Belt, Northwest Ghana: A Multivariate Statistical Approach. Int. J. Geosci. 2012, 03, 62–70. [Google Scholar] [CrossRef]
  53. Balaram, V.; Sawant, S.S. Indicator Minerals, Pathfinder Elements, and Portable Analytical Instruments in Mineral Exploration Studies. Minerals 2022, 12, 394. [Google Scholar] [CrossRef]
  54. Cohen, N.E.; Brooks, R.R.; Reeves, R.D. Pathfinders in geochemical prospecting for uranium in New Zealand. Econ. Geol. 1969, 64, 519–525. [Google Scholar] [CrossRef]
  55. Joyce, N.; Layton-Matthews, D.; Kyser, K.; Leybourne, M.; Ansdell, K.; Kotzer, T.; Quirt, D.; Zaluski, G. Alteration mineralogy and pathfinder element inventory in the footprint of the McArthur River unconformity-related uranium deposit, Canada. Can. Miner. 2021, 59, 985–1019. [Google Scholar] [CrossRef]
  56. Makvandi, S.; Beaudoin, G.; McClenaghan, M.B.; Quirt, D.; Ledru, P. PCA of Fe-oxides MLA data as an advanced tool in provenance discrimination and indicator mineral exploration: Case study from bedrock and till from the Kiggavik U deposits area (Nunavut, Canada). J. Geochem. Explor. 2018, 197, 199–211. [Google Scholar] [CrossRef]
  57. Trueman, D.L. Exploration for Rare-Element Granitic Pegmatites. In Short Course in Granitic Pegmatites in Science and Industry; Mineralogical Association of Canada: Québec, QC, Canada, 1982; Volume 8, pp. 463–493. [Google Scholar]
  58. McClenaghan, M.; Parkhill, M.; Pronk, A.; Sinclair, W. Indicator mineral and till geochemical signatures of the Mount Pleasant W-Mo-Bi and Sn-Zn-In deposits, New Brunswick, Canada. J. Geochem. Explor. 2017, 172, 151–166. [Google Scholar] [CrossRef]
  59. Gale, G.H. Vectoring volcanogenic massive sulphide deposits using rare earth elements and other pathfinder elements at the Ruttan mine, Manitoba (NTS 63B5). In Report of Activities 2003, Manitoba Industry, Trade and Mines; Manitoba Geological Survey: Brandon, MB, Canada, 2003; pp. 54–73. [Google Scholar]
  60. Hale, M. Pathfinder applications of arsenic, antimony and bismuth in geochemical exploration. J. Geochem. Explor. 1981, 15, 307–323. [Google Scholar] [CrossRef]
  61. Layton-Matthews, D.; McClenaghan, M.B. Current Techniques and Applications of Mineral Chemistry to Mineral Exploration; Examples from Glaciated Terrain: A Review. Minerals 2021, 12, 59. [Google Scholar] [CrossRef]
  62. McClenaghan, M.B.; Cabri, L.J. Review of gold and platinum group element (PGE) indicator minerals methods for surficial sediment sampling. Geochem. Explor. Environ. Anal. 2011, 11, 251–263. [Google Scholar] [CrossRef]
  63. Korshunova, V.A.; Charykova, M.V. Mobile Forms of Gold and Pathfinder Elements in Surface Sediments at the Novye Peski Gold Deposit and in the Piilola Prospecting Area (Karelia Region). Minerals 2019, 9, 34. [Google Scholar] [CrossRef]
  64. Wang, J.; Zuo, R. A Monte Carlo-based Workflow for Geochemical Anomaly Identification Under Uncertainty and Global Sensitivity Analysis of Model Parameters. Math. Geosci. 2023, 55, 1075–1099. [Google Scholar] [CrossRef]
  65. Esmaeiloghli, S.; Tabatabaei, S.H.; Carranza, E.J.M. Empirical mode decomposition and power spectrum filtering for detection of frequency channels related to multi-scale geochemical anomalies: Metal exploration targeting in Moalleman district, NE Iran. J. Geochem. Explor. 2023, 246, 107157. [Google Scholar] [CrossRef]
  66. Cardoso-Fernandes, J.; Lima, J.; Lima, A.; Roda-Robles, E.; Köhler, M.; Schaefer, S.; Barth, A.; Knobloch, A.; Gonçalves, M.A.; Gonçalves, F.; et al. Stream sediment analysis for Lithium (Li) exploration in the Douro region (Portugal): A comparative study of the spatial interpolation and catchment basin approaches. J. Geochem. Explor. 2022, 236, 106978. [Google Scholar] [CrossRef]
  67. Sadeghi, B. Simulated-multifractal models: A futuristic review of multifractal modeling in geochemical anomaly classification. Ore Geol. Rev. 2021, 139, 104511. [Google Scholar] [CrossRef]
  68. Bishop, J.L.; Lane, M.D.; Dyar, M.D.; Brown, A.J. Reflectance and emission spectroscopy study of four groups of phyllosilicates: Smectites, kaolinite-serpentines, chlorites and micas. Clay Miner. 2008, 43, 35–54. [Google Scholar] [CrossRef]
  69. Clark, R.N.; King, T.V.V.; Klejwa, M.; Swayze, G.A.; Vergo, N. High spectral resolution reflectance spectroscopy of minerals. J. Geophys. Res. Solid Earth 1990, 95, 12653–12680. [Google Scholar] [CrossRef]
  70. Hunt, G.R.; Ashley, R.P. Spectra of altered rocks in the visible and near infrared. Econ. Geol. 1979, 74, 1613–1629. [Google Scholar] [CrossRef]
  71. Habashi, J.; Oskouei, M.; Moghadam, H.J. Classification of ASTER Data by Neural Network to Mapping Alterations Related to Copper and Iron Mineralization in Birjand. J. Min. Environ. 2024, 15, 649–665. [Google Scholar] [CrossRef]
  72. Etemadi, A.; Karimpour, M.H.; Shafaroudi, A.M. Comparison of Remote Sensing Processing by SAM Method with Field Studies of Alteration Zones, in Hemech Prospect Area (SW Birjand). In Proceedings of the 7th Conference of the Economic Geology Association of Iran, Zahedan, Iran, 13 September 2014. [Google Scholar]
  73. Maryam, A.; Mohammd, H.K. Application of Spectral Angle Mapper Classification to Discriminate Hydrothermal Alteration in Southwest Birjand Iran Using Advanced Space Borne Thermal Emission and Reflection Radiometer Image Processing. Acta Geol. Sin.-Engl. Ed. 2012, 86, 1289–1296. [Google Scholar]
  74. Hosseini, M. Discrimination of Hydrothermal Alterations Associated with Copper Mineralization Using ASTER Image Processing Sheet in Sar-e-Chah-e-Shur, Eastern Iran. Q. Sci. J. Tech. Vocat. Univ. 2021, 18, 153–168. (In Persian) [Google Scholar] [CrossRef]
  75. Pearlshtien, D.H.; Pignatti, S.; Greisman-Ran, U.; Ben-Dor, E. PRISMA sensor evaluation: A case study of mineral mapping performance over Makhtesh Ramon, Israel. Int. J. Remote Sens. 2021, 42, 5882–5914. [Google Scholar] [CrossRef]
  76. Sorrentino, A.; Chirico, R.; Corrado, F.; Laukamp, C.; Di Martire, D.; Mondillo, N. The application of PRISMA hyperspectral satellite imagery in the delineation of distinct hydrothermal alteration zones in the Chilean Andes: The Marimaca IOCG and the Río Blanco-Los Bronces Cu-Mo porphyry districts. Ore Geol. Rev. 2024, 167, 105998. [Google Scholar] [CrossRef]
  77. Courba, S.; Youssef, H.; Jamal, A.; Abdessalam, O.; Mohamed, E.A.; Larbi, B.; Assia, I.; Zineb, A.; Slimane, S.; Lahcen, O.; et al. Litho-structural and hydrothermal alteration mapping for mineral prospection in the Maider basin of Morocco based on remote sensing and field investigations. Remote Sens. Appl. Soc. Environ. 2023, 31, 100980. [Google Scholar] [CrossRef]
  78. Castellanos, P.; Colarco, P.; Espinosa, W.R.; Guzewich, S.D.; Levy, R.C.; Miller, R.L.; Chin, M.; Kahn, R.A.; Kemppinen, O.; Moosmüller, H.; et al. Mineral dust optical properties for remote sensing and global modeling: A review. Remote Sens. Environ. 2024, 303, 113982. [Google Scholar] [CrossRef]
  79. Salesin, K.; Knobelspiesse, K.D.; Chowdhary, J.; Zhai, P.-W.; Jarosz, W. Unifying radiative transfer models in computer graphics and remote sensing, Part II: A differentiable, polarimetric forward model and validation. J. Quant. Spectrosc. Radiat. Transf. 2024, 315, 108849. [Google Scholar] [CrossRef]
  80. Bennett, G. Analysis of methods used to validate remote sensing and GIS-based groundwater potential maps in the last two decades: A review. Geosyst. Geoenviron. 2024, 3, 100245. [Google Scholar] [CrossRef]
  81. Castillo, P.R.; Janney, P.E.; Solidum, R.U. Petrology and geochemistry of Camiguin Island, southern Philippines: Insights to the source of adakites and other lavas in a complex arc setting. Contrib. Miner. Pet. 1999, 134, 33–51. [Google Scholar] [CrossRef]
  82. Tietz, O.; Büchner, J. The origin of the term ‘basalt’. J. Geosci. 2018, 63, 295–298. [Google Scholar] [CrossRef]
  83. Troll, V.R.; Donaldson, C.H.; Emeleus, C.H. Pre-eruptive magma mixing in ash-flow deposits of the Tertiary Rum Igneous Centre, Scotland. Contrib. Miner. Pet. 2004, 147, 722–739. [Google Scholar] [CrossRef]
  84. Duff, M.C.; Newville, M.; Hunter, D.B.; Bertsch, P.M.; Sutton, S.R.; Triay, I.R.; Vaniman, D.T.; Eng, P.; Rivers, M.L. Micro-XAS studies with sorbed plutonium on tuff. J. Synchrotron Radiat. 1999, 6, 350–352. [Google Scholar] [CrossRef]
  85. Haldar, S.K.; Tišljar, J. Chapter 6—Metamorphic Rocks. In Introduction to Mineralogy and Petrology; Haldar, S.K., Tišljar, J., Eds.; Elsevier: Oxford, UK, 2014; pp. 213–232. ISBN 978-0-12-408133-8. [Google Scholar]
  86. Viti, C. Serpentine minerals discrimination by thermal analysis. Am. Miner. 2010, 95, 631–638. [Google Scholar] [CrossRef]
  87. Krinsley, D.H.; Pye, K.; Kearsley, A.T. Application of backscattered electron microscopy in shale petrology. Geol. Mag. 1983, 120, 109–114. [Google Scholar] [CrossRef]
  88. Delavari, M.; Dolati, A.; Marroni, M.; Pandolfi, L.; Saccani, E. Association of MORB and SSZ Ophiolites along the Shear Zone between Coloured Mélamge and Bajgan Complexes (North Maran, Iran): Evidence from the Sorkhband Area. Ofioliti 2016, 41, 21–34. [Google Scholar] [CrossRef]
  89. Boggs, S. Principles of Sedimentology and Stratigraphy; Pearson: London, UK, 2012. [Google Scholar]
  90. Lambart, S.; Baker, M.B.; Stolper, E.M. The role of pyroxenite in basalt genesis: Melt-PX, a melting parameterization for mantle pyroxenites between 0.9 and 5 GPa. J. Geophys. Res. Solid Earth 2016, 121, 5708–5735. [Google Scholar] [CrossRef]
  91. Macdonald, G.A.; Abbott, A.; Peterson, F.L. Volcanoes in the Sea: The Geology of Hawaii; University of Hawaii Press: Honolulu, HI, USA, 1983; ISBN 0824808320. [Google Scholar]
  92. Schmid, R. Descriptive nomenclature and classification of pyroclastic deposits and fragments. Int. J. Earth Sci. 1981, 70, 794–799. [Google Scholar] [CrossRef]
  93. Yang, S.; Chen, H.; Li, Z.; Li, Y.; Yu, X. (Eds.) 4—Geodynamics of the Tarim LIP. In The Early Permian Tarim Large Igneous Province in Northwest China; Elsevier: Amsterdam, The Netherlands, 2018; pp. 109–152. ISBN 978-0-12-812872-5. [Google Scholar]
  94. Gorayeb, P.S.d.S.; Barros, G.S.; Moura, C.A.V.; Dantas, E.L.; Assis, C.R.d.F. Scapolite metagabbros of the Xambica Suite: A Tonian OIB magmatism in the crustal evolution of the Araguaia Belt. J. South Am. Earth Sci. 2023, 123, 104217. [Google Scholar] [CrossRef]
  95. Bakhsh, R.A. Microanalysis and genesis of Cu-Ag minerals in metadiabase dykes at the Jabal Zalm area, Saudi Arabia. Ore Geol. Rev. 2018, 95, 713–724. [Google Scholar] [CrossRef]
  96. Li, R.; Xiao, W.; Mao, Q.; Zhang, J.; Ao, S.; Song, D.; Tan, Z.; Wang, H.; Bhandari, S. High magnesian schist, granitic gneiss, amphibolite and monzogneiss in the eastern Ama Drime Massif in South Tibet (China): A rifted Paleoproterozoic arc fringed the western Columbia supercontinent? Precambrian Res. 2023, 388, 106972. [Google Scholar] [CrossRef]
  97. Watson, K.D. Zoisite-Prehnite Alteration of Gabbro. American Mineralogist. J. Earth Planet. Mater. 1942, 27, 638–645. [Google Scholar]
  98. Fettes, D.; Desmons, J. Metamorphic Rocks: A Classification and Glossary of Terms: Recommendations of the International Union of Geological Sciences Sub-Commission on the Systematics of Metamorphic Rocks; Cambridge University Press: Cambridge, MA, USA, 2007; 244p. [Google Scholar]
  99. Perkins, P.C. Petrography of Some Rock Types of the Precambrian Basement near the Los Alamos Scientific Laboratory Geothermal Test Site, Jemez Mountains, New Mexico; LA-5129-MS; Los Alamos National Security Science Laboratory: Los Alamos, NM, USA, 1973; 12p.
  100. Bowes, D.R. Ultrabasic Igneous Rocks. In Petrology; Springer US: Boston, MA, USA, 1990; pp. 576–577. ISBN 978-0-387-30845-6. [Google Scholar]
  101. Robertson, S. BGS Rock Classification Scheme. Classification of Metamorphic Rocks; British Geological Survey Research Report, RR 99-02; NERC; British Geological Survey: Keyworth, Nottingham, UK, 1999; Volume 2.
  102. Lopez, F.P.A.; Zhou, G.; Vargas, L.P.; Jing, G.; Marca, M.E.O.; Quispe, M.V.; Ticona, E.A.; Tonconi, N.M.M.; Apaza, E.O. Lithium quantification based on random forest with multi-source geoinformation in Coipasa salt flats, Bolivia. Int. J. Appl. Earth Obs. Geoinf. 2023, 117, 103184. [Google Scholar] [CrossRef]
  103. Raeisi, D.; Hajsadeghi, S.; Hosseinzadehsabeti, E.; Babazadeh, S.; Lentz, D.R.; Santosh, M. Exploration Targeting in the Shadan Porphyry Gold–Copper Deposit, Lut Block, Iran: Analysis of Spatial Distribution of Sheeted Veins and Lithogeochemical Data. Minerals 2023, 13, 471. [Google Scholar] [CrossRef]
Figure 1. (A) Geographical location of the study area in east Iran. (B) Geological map of the Sar-e-châh-e-shur region.
Remotesensing 16 01277 g001
Figure 2. An overview of the methodological flowchart applied in this study.
Remotesensing 16 01277 g002
Figure 3. The spectral profile of a pixel in the PRISMA images before (A) and after (B) eliminates bad bands.
Remotesensing 16 01277 g003
Figure 4. The spectral profile of a pixel in the PRISMA images before (A) and after (B) undergoing IARR correction.
Remotesensing 16 01277 g004
Figure 5. Comparison between the reflectance spectra for detected endmembers in this analysis and the corresponding mineral reflectance spectra extracted from the USGS spectral library. (A) Richterite, (B) augite, (C) chlorite, (D) ilmenite, (E) kaolinite–smectite, (F) mirabilite, (G) muscovite, and (H) psilomelane.
Remotesensing 16 01277 g005
Figure 6. The abundance maps of the detected mineral endmembers were derived from the MF algorithm for the study area. (A) Richterite, (B) augite, (C) chlorite, (D) ilmenite, (E) kaolinite–smectite, (F) mirabilite, (G) muscovite, and (H) psilomelane.
Remotesensing 16 01277 g006
Figure 7. MF classification map of the alteration minerals for the study area.
Remotesensing 16 01277 g007
Figure 8. Exposed lithological units and alteration minerals in the study area. (A) Altered silica rock with mineralization of iron oxide and manganese; (B) propylitic–argillic alteration, the green parts are chlorite-altered and serpentinized zones; (C) limestone with iron oxide and chlorite (green color); (D) permead siliceous mass that has intruded into limestone, accompanied by iron oxide and manganese, is prone to gold mineralization; (E) outcrop shows propylitic and argillic alteration, with developed mineralization of alunite and kaolinite.
Remotesensing 16 01277 g008
Figure 9. Petrographic study of minerals under OLYMPUS CX31P polarizing microscope. (AC) In diorite–gabbro samples, hornblendes have undergone chloritization and epidotization. (DF) The fine-grained tuff has been cut by quartz veins. This sample has experienced partial sericitization and argillization. (GI) The crystallized and silicified limestone has been intersected by quartz–feldspar veins, and iron oxide has also developed in the joints. Alterations in both carbonate and oxide types are observed. (J,K) Rhyolite has undergone sericitization and argillization, with iron oxide observed in some joints. (LN) Iron oxide has developed within the joints of the graywacke sandstone. (OQ) The harzburgite sample has undergone strong serpentinization, with iron oxide observed in some joints. (RT) Granite has been significantly chloritized, muscovite-altered, and opacified. Abbreviation: Cpx = clinopyroxene, Qtz = quartz, Chl = chlorite, Plg = plagioclase, Opq = opaque minerals, Ep = epidote, Ca = calcite, Hem = hematite, Fld = feldspar, Ser = sericite, Ms = muscovite, Lit = lithic, CSpl = chromite spinel, Fe-Ox = iron oxide, Srp = serpentine, Ol = olivine, Opx = orthopyroxene.
Remotesensing 16 01277 g009
Figure 10. Results of geochemical analysis for stream sediment samples. (A): Zn, (B): Au, (C): As, (D): Ni, (E): Cu, (F): Mo, (G): Pb, (H): Cr, (I): Hg, (J): Bi, (K): Ba, (L): Co, (M): Sb, (N): Sn, (O): Ag, (P): W, (Q): Fe2O3, (R): TiO, (S): MnO.
Remotesensing 16 01277 g010
Figure 11. The integration of PRISMA abundance maps with the geological map of the study area and laboratory data. (A) Amphibole group, (B) clay group, (C) oxide group, and (D) pyroxene group.
Remotesensing 16 01277 g011
Figure 12. The integration of PRISMA abundance maps with the geological map of the study area and laboratory data. (A) Manganese oxide group, (B) sulfate group, and (C) mica group.
Remotesensing 16 01277 g012
Table 1. Specifications of the PRISMA dataset [6].
PRISMA
(PRecursore IperSpettrale Della Missione Applicativa)
Orbit Altitude614 km
Swath Width30 km
Field of View (FOV)2.77°
Spatial ResolutionHyperspectral—30 m
Panchromatic—5 m
Pixel SizeHyperspectral—30 µm × 30 µm
PAN—6.5 µm × 6.5 µm
Spectral RangeVNIR—0.400–1.01 µm (66 bands)
SWIR—0.92–2.5 µm (173 bands)
PAN—0.4–0.7 µm
Spectral Resolution≤12 nm
Radiometric Resolution12 bits
Signal-to-noise ratio (SNR)VNIR —> 200:1
SWIR —> 100:1
PAN —> 240:1
Lifetime5 years
Repeat interval29 days
Table 2. Minerals were identified using XRD analysis for 20 selected samples.
No. SampleLithologyMinerals Identified Using XRD
A, B, CDiorite–gabbroHornblende, plagioclase, clinopyroxene
D, E, FFine-grained tuffQuartz, phenoclasts, muscovite, hematite, feldspar
G, H, ILimestoneCalcite and quartz minerals, quartz-feldspar hematite
J, KRhyoliteQuartz, alkaline feldspar
L, M, NGreywacke sandstoneQuartz, lithic, muscovite, and feldspar hematite
O, P, QHarzburgiteOlivine, orthopyroxene, serpentine, and hematite
R, S, TGranitePlagioclase, quartz chlorite, muscovite, zircon
Table 3. Selected mineral groups for enhancing the accuracy of the result’s interpretation.
Mineral GroupMinerals
Mica groupMuscovite
Pyroxene groupAugite
Clay groupKaolinite/smectite–chlorite
Manganese oxide groupPsilomelane
Amphibole groupRichterite
Oxide groupIlmenite
Sulfate groupMirabilite
Table 4. Geological formations and associated mineral groups in the study area.
LegendGeology UnitDescriptionMineral GroupICP-OES
EOad,
ba,
EOd,
Ea,
da
Altered andesite and dacite, andesit to andesitic basalt, dacite, andesite, micrdiorite with andesitic or dacitic marginal faciesAn extrusive volcanic rock formed from basalt and intermediate rhyolite, typically containing minerals such as plagioclase, along with pyroxene or hornblende. Hornblende in this rock can easily alter into chlorite and epidote [81,82,83].Clay group,
Oxide group,
Pyroxene group, Mica group
Ag-Zn-W-Sn-Sb-Pb-Mo-Cu-Co-Ba-Au
Fe2O3-MnO
EtRed tuff with chert marker.Volcanic ashes [84].Zn-Sn-Pb-Cu-Co
SchSericite, chlorite,
schist
Hydrothermal alteration [85].Mica group,
Clay group
Zn-Sb-Pb-Co-Ba-Au-As, MnO, Fe2O3-TiO
SrSerpentiniteA rock is composed of one or a group of mineral types from the serpentine group [86].Serpentine group
(manganese-oxides)
Cu-Cr-Ba-Au
KusShale and sandstoneA sedimentary rock that appears in various colors depending on the percentage of materials present in it [87].Mica group,
Clay group,
Manganese oxide group
Zn-Sn-Co-Bi-Ba
CmColored mélangeA sedimentary rock of volcanic origin typically contains fine-grained deposits [88].Clay groupZn-Co-Ba-Fe2O3
EcConglomerateA volcaniclastic sedimentary rock typically contains fine-grained deposits [89].Clay group
PxPyroxeniteUltramafic igneous rock that has undergone serpentinization [90].Pyroxene group
kusdShale with diabasic tuffSediments and volcanic ash [84,87].Clay group,
Manganese oxide group
Sb, Co-TiO
apPyroxene andesiteAndesite igneous rock with pyroxene [90].Oxide group,
Manganese oxide group,
Pyroxene group
Pb-Ni-Cr-Co-Ba, Fe2O3-TiO-MnO
ahHornblende andesiteHornblende andesite, a frequent rock type in volcanic arcs and subduction zones, results from magma with medium silica content solidifying as it cools [91].Amphibole groupAs
EobTuff brecciaTuff is a type of rock created from volcanic ash that is ejected from a vent during a volcanic eruption. Once ejected and settled, the ash undergoes lithification, converting it into a solid rock [92].Zeolite groupZn-Sn
NgmMarly tuffTuff marl is a sedimentary rock that combines characteristics of both marl and tuff. It forms through the consolidation and hardening of volcanic ash mixed with fine-grained sediment rich in clay [84,89].Clay group
KudDiabaseDiorite is a fine-grained mafic igneous rock that is typically composed of minerals such as plagioclase feldspar and pyroxene [93].Ba
MetMetagabbro, metadiabase, amphibolite and gneissMetamorphic rocks are rocks that change mineral composition and texture due to high heat and pressure [93,94,95,96].Mica group,
Amphibole group
Zn-Pb-Hg-Cr-Co-Bi-Ba-MnO-TiO
gbGabbroA coarse-grained and intrusive igneous rock with a chemical composition equivalent to basalt is an ultramafic rock [97].Oxides group,
Pyroxene group
Cu
lvListvinite (listvenite, listvanite, or listwaenite)Low-temperature metamorphic rocks such as beresite are formed as a result of the alteration in ultramafic rocks like peridotite or serpentinite. Serpentinite is often associated with hydrothermal alteration processes, where fluids interact with ultramafic rocks and lead to mineral replacement, resulting in a distinct metamorphic rock. It is typically found in areas of intense folding or faulting, as well as in proximity to mineral deposits associated with ultramafic rocks [98].Manganese oxide group,
Oxide group
MnO
UbUltrabasic rocks in igneousUltramafic rocks are a type of igneous rocks that have very low silica content and are primarily rich in magnesium and iron. These rocks are often composed of dark-colored mafic minerals that have a high abundance of magnesium and iron [99].Oxides group,
Mica group,
Amphibole group,
Pyroxene group
Zn
gGraniteGranite is a coarse-grained, intrusive igneous rock composed mainly of quartz, feldspar, amphibole, and mica minerals. It forms deep within the Earth’s crust through the slow cooling of magma [100].Mica group,
Oxides group,
Amphibole group
Ba-TiO
SchmMica SchistThe definition by the IUGS is a schistose metamorphic rock with mica minerals as the only major (>5%) constituent [98].Mica groupTiO-MnO-Fe2O3
SchaAmphibole schistAmphibole schist is a metamorphic rock predominantly composed of amphibole minerals like hornblende and actinolite, along with plagioclase feldspar and minimal quartz. It has a dark color, dense texture, and a foliated or schistose structure, often appearing banded. The rock may exhibit a salt-and-pepper appearance due to small black and white mineral flakes. Amphibole schist forms through the metamorphism of pre-existing rocks under high pressure and temperature conditions [101].Amphibole groupFe2O3-MnO
SchgGreen schistGreen schist is a metamorphic rock recognized for its green appearance, mainly attributed to minerals like chlorite, serpentine, and epidote. It also contains platy minerals such as muscovite and platy serpentine, contributing to the rock’s schistosity, which makes it prone to splitting into layers. Additionally, common minerals found in green schist include quartz, orthoclase, talc, carbonate minerals, and amphibole, particularly actinolite [101].Amphibole group,
Mica group,
Clay group
gdMicrogranodioriteMicrogranodiorite is an igneous rock that falls within the granodiorite category but has a finer grain size. It is composed of minerals such as quartz, plagioclase feldspar, and potassium feldspar. The term “micro” in micro granodiorite indicates that the individual mineral grains are smaller, typically in the range of less than 1 mm. Granodiorite itself is an intermediate intrusive rock, and microgranodiorite shares similar mineralogical characteristics but with a more fine-grained texture. This rock type forms through the slow cooling and crystallization of magma beneath the Earth’s surface, contributing to its coarse to fine-grained appearance [100].Pyroxene group,
Micas group
saSalt flatsSalt flats, also known as salt pans or salt deserts, are extensive flat terrains characterized by a layer of salt and minerals. Typically located in arid regions with low rainfall and high evaporation rates, these areas form through the evaporation of water from former lakes or seas, leaving concentrated mineral deposits on the surface. Notable salts present in salt flats include sodium chloride (table salt), potassium, lithium, and magnesium salts. The resulting landscape often gives a surreal, otherworldly impression, with large areas covered in a white or light-colored crust [102].Sulfate group
Table 5. Conversion of qualitative to quantitative criteria.
ComplianceEstimate
Noncompliance: 0Overestimate: 0
Partial compliance: 1Partial estimate: 0.25
Semi-compliance: 2Semi-estimate: 0.5
Almost compliance: 3Almost estimate: 0.75
Perfect compliance: 4Perfect estimate: 1
Table 6. The results of validation of classes based on NS.
The Name of the Map Used in the ValidationEstimateComplianceNSNSP
Clay group143.4285.71
Amphibole group0.754
Oxide group13
Pyroxene group13
Mica group14
Sulfate group14
Manganese oxide group13
Disclaimer/Publisher’s Note: The statements, opinions and data contained in all publications are solely those of the individual author(s) and contributor(s) and not of MDPI and/or the editor(s). MDPI and/or the editor(s) disclaim responsibility for any injury to people or property resulting from any ideas, methods, instructions or products referred to in the content.

