Article

Detection and Attribution of Vegetation Dynamics in the Yellow River Basin Based on Long-Term Kernel NDVI Data

1
College of Engineering, Sichuan Normal University, Chengdu 610101, China
2
School of Geographical Science, Nantong University, Nantong 650500, China
3
State Key Laboratory of Hydraulics and Mountain River Engineering & College of Water Resource and Hydropower, Sichuan University, Chengdu 610065, China
4
The First Regional Geological Survey Brigade of the Xinjiang Uygur Autonomous Region Geology and Mineral Exploration and Development Bureau, Urumqi 830011, China
*
Author to whom correspondence should be addressed.
Remote Sens. 2024, 16(7), 1280; https://doi.org/10.3390/rs16071280
Submission received: 28 February 2024 / Revised: 30 March 2024 / Accepted: 1 April 2024 / Published: 5 April 2024
(This article belongs to the Special Issue Remote Sensing of Arid/Semiarid Lands II)

Abstract

:
Detecting and attributing vegetation variations in the Yellow River Basin (YRB) is vital for adjusting ecological restoration strategies to address the possible threats posed by changing environments. On the basis of the kernel normalized difference vegetation index (kNDVI) and key climate drivers (precipitation (PRE), temperature (TEM), solar radiation (SR), and potential evapotranspiration (PET)) in the basin during the period from 1982 to 2022, we utilized the multivariate statistical approach to analyze the spatiotemporal patterns of vegetation dynamics, identified the key climate variables, and discerned the respective impacts of climate change (CC) and human activities (HA) on these variations. Our analysis revealed a widespread greening trend across 93.1% of the YRB, with 83.2% exhibiting significant increases in kNDVI (p < 0.05). Conversely, 6.9% of vegetated areas displayed a browning trend, particularly concentrated in the alpine and urban areas. With the Hurst index of kNDVI exceeding 0.5 in 97.5% of vegetated areas, the YRB tends to be extensively greened in the future. Climate variability emerges as a pivotal determinant shaping diverse spatial and temporal vegetation patterns, with PRE exerting dominance in 41.9% of vegetated areas, followed by TEM (35.4%), SR (13%), and PET (9.7%). Spatially, increased PRE significantly enhanced vegetation growth in arid zones, while TEM and SR controlled vegetation variations in alpine areas and non-water-limited areas such as irrigation zones. Vegetation dynamics in the YRB were driven by a combination of CC and HA, with relative contributions of 55.8% and 44.2%, respectively, suggesting that long-term CC is the dominant force. Specifically, climate change contributed to the vegetation greening seen in the alpine region and southeastern part of the basin, and human-induced factors benefited vegetation growth on the Loess Plateau (LP) while inhibiting growth in urban and alpine pastoral areas. These findings provide critical insights that inform the formulation and adaptation of ecological conservation strategies in the basin, thereby enhancing resilience to changing environmental conditions.

1. Introduction

Vegetation plays a vital role in terrestrial ecosystems, regulating material and energy exchanges between the land and the atmosphere while offering invaluable ecological services [1,2]. It serves as a crucial indicator of ecological and environmental changes, exhibiting sensitivity to the combined impacts of climate change and human activities [3,4]. Satellite monitoring has revealed a significant global greening trend over the past two decades, with China and India being dominant contributors [5]. Quantifying the relative contributions of climate change (CC) and human activities (HA) to vegetation growth is essential for developing rational ecological restoration strategies.
Global changes have significantly focused attention on the relationship between global climate change and terrestrial ecosystems [6]. Temperature (TEM), precipitation (PRE), and solar radiation (SR) are crucial factors influencing vegetation growth, with their significance extending to the fundamental process of photosynthesis [7,8,9]. Research has unveiled a noteworthy global greening trend in vegetation due to climate warming, which is particularly evident in the northern hemisphere [10,11]. A higher TEM contributes to a longer growing season in the alpine region, which further substantiates the importance of TEM as a limiting variable for plant growth [12,13]. Arid zones, defined by water restrictions for vegetation, rely on PRE as the crucial water source necessary to support and stimulate vegetation growth [14,15,16]. SR emerges as an important factor shaping vegetation spatiotemporal patterns in China, particularly within the Tibetan Plateau [17,18]. Moreover, SR appears to be the predominant climatic driver influencing vegetation sensitivity [19]. Additionally, potential evapotranspiration (PET) signifies the maximum evapotranspiration recorded under adequate moisture supply conditions, reflecting a combination of SR, wind speed, and vapor pressure deficit, establishing it as a non-negligible climatic driver influencing vegetation dynamics [20,21]. Additionally, human activities are crucial in shaping vegetation dynamics. Vegetation cover has increased as a result of ecological initiatives, such as the conversion of farmland to forests, afforestation, and natural forest protection [22,23,24]. Conversely, urban expansion, overgrazing, reclamation, and deforestation have been associated with a decline in vegetation cover [25,26,27]. Given the dual influence of CC and HA on vegetation (facilitating or suppressing it), evaluating their roles is imperative for effective ecological conservation.
Satellite-related vegetation indices are effective tools for large-scale vegetation dynamics monitoring, with the NDVI being the most extensively utilized metric [28,29,30]. Acknowledged for its linear or near-linear correlation with leaf density, photosynthetically active radiation, vegetation productivity, and cumulative biomass, the NDVI has gained recognition as a dependable indicator for evaluating vegetation condition on a large scale [31,32,33]. Nevertheless, the precision of the data is impeded by the abundance of plants in thick foliage and susceptibility to variations in the brightness of the canopy background [34,35]. In contrast, Camps-Valls et al. [36] proposed a kNDVI that is grounded in kernel approach principles, demonstrating its effectiveness in assessing vegetation dynamics through enhanced consistency with primary productivity, resistance to saturation, bias mitigation, and adaptation to the phenological cycle [36,37]. The kNDVI improves robustness and instability toward noise on both spatial and temporal scales and has proven effective for assessing vegetation dynamics [38,39,40,41].
The Yellow River Basin (YRB) is a highly vulnerable and ecologically fragile region, attracting significant attention for the detection and attribution of its vegetation variations in the context of CC and HA. In summary, there are two primary limitations underlying the previous study: (1) limitations regarding the adopted vegetation indices. Previous studies were mostly conducted based on the third-generation Global Inventory Modeling and Mapping Studies (GIMMS) NDVI 3g (1982–2015) [42,43,44], the Moderate Resolution Imaging Spectroradiometer (MODIS) NDVI (2000–present) [45,46,47], and combinations of the above two sources of NDVI data [48,49,50], with relevant research using a long-term NDVI dataset from a unified source being absent. Additionally, NDVI saturation is often neglected. (2) Limitations regarding methods for attributing vegetation dynamics. Three principal methods are employed to attribute vegetation variations: the regression model, residual trend analysis, and the biophysical model [51]. Residual trend analysis is the most widely used approach for quantitatively separating the role of climate change and human activities as regards its effects on vegetation dynamics, given its simplicity in modeling and explicit presuppositions [52]. Although most studies employ residual analysis to assess TEM and PRE as climate factors [47,53], recent investigations have begun to integrate SR as a complementary factor [4,54]; however, PET is frequently overlooked.
To address these gaps, our study applied residual analysis to investigate the effects of CC and HA on vegetation dynamics in the YRB, based on long-term continuous kNDVI data. Furthermore, TEM, PRE, SR, and PET were considered as representative climatic variables, and the dominant climate factors driving vegetation dynamics were analyzed by partial correlation analysis. We aim to: (1) explore the spatiotemporal patterns of kNDVI trends and their persistence in the YRB; (2) identify the key climatic factors affecting vegetation growth; (3) separate and quantify the relative contributions of CC and HA to vegetation variations, then determine the dominant driver. The outcomes of our research will provide a valuable reference for adjusting ecological protection strategies in response to the changing environment of the YRB.

2. Materials and Methods
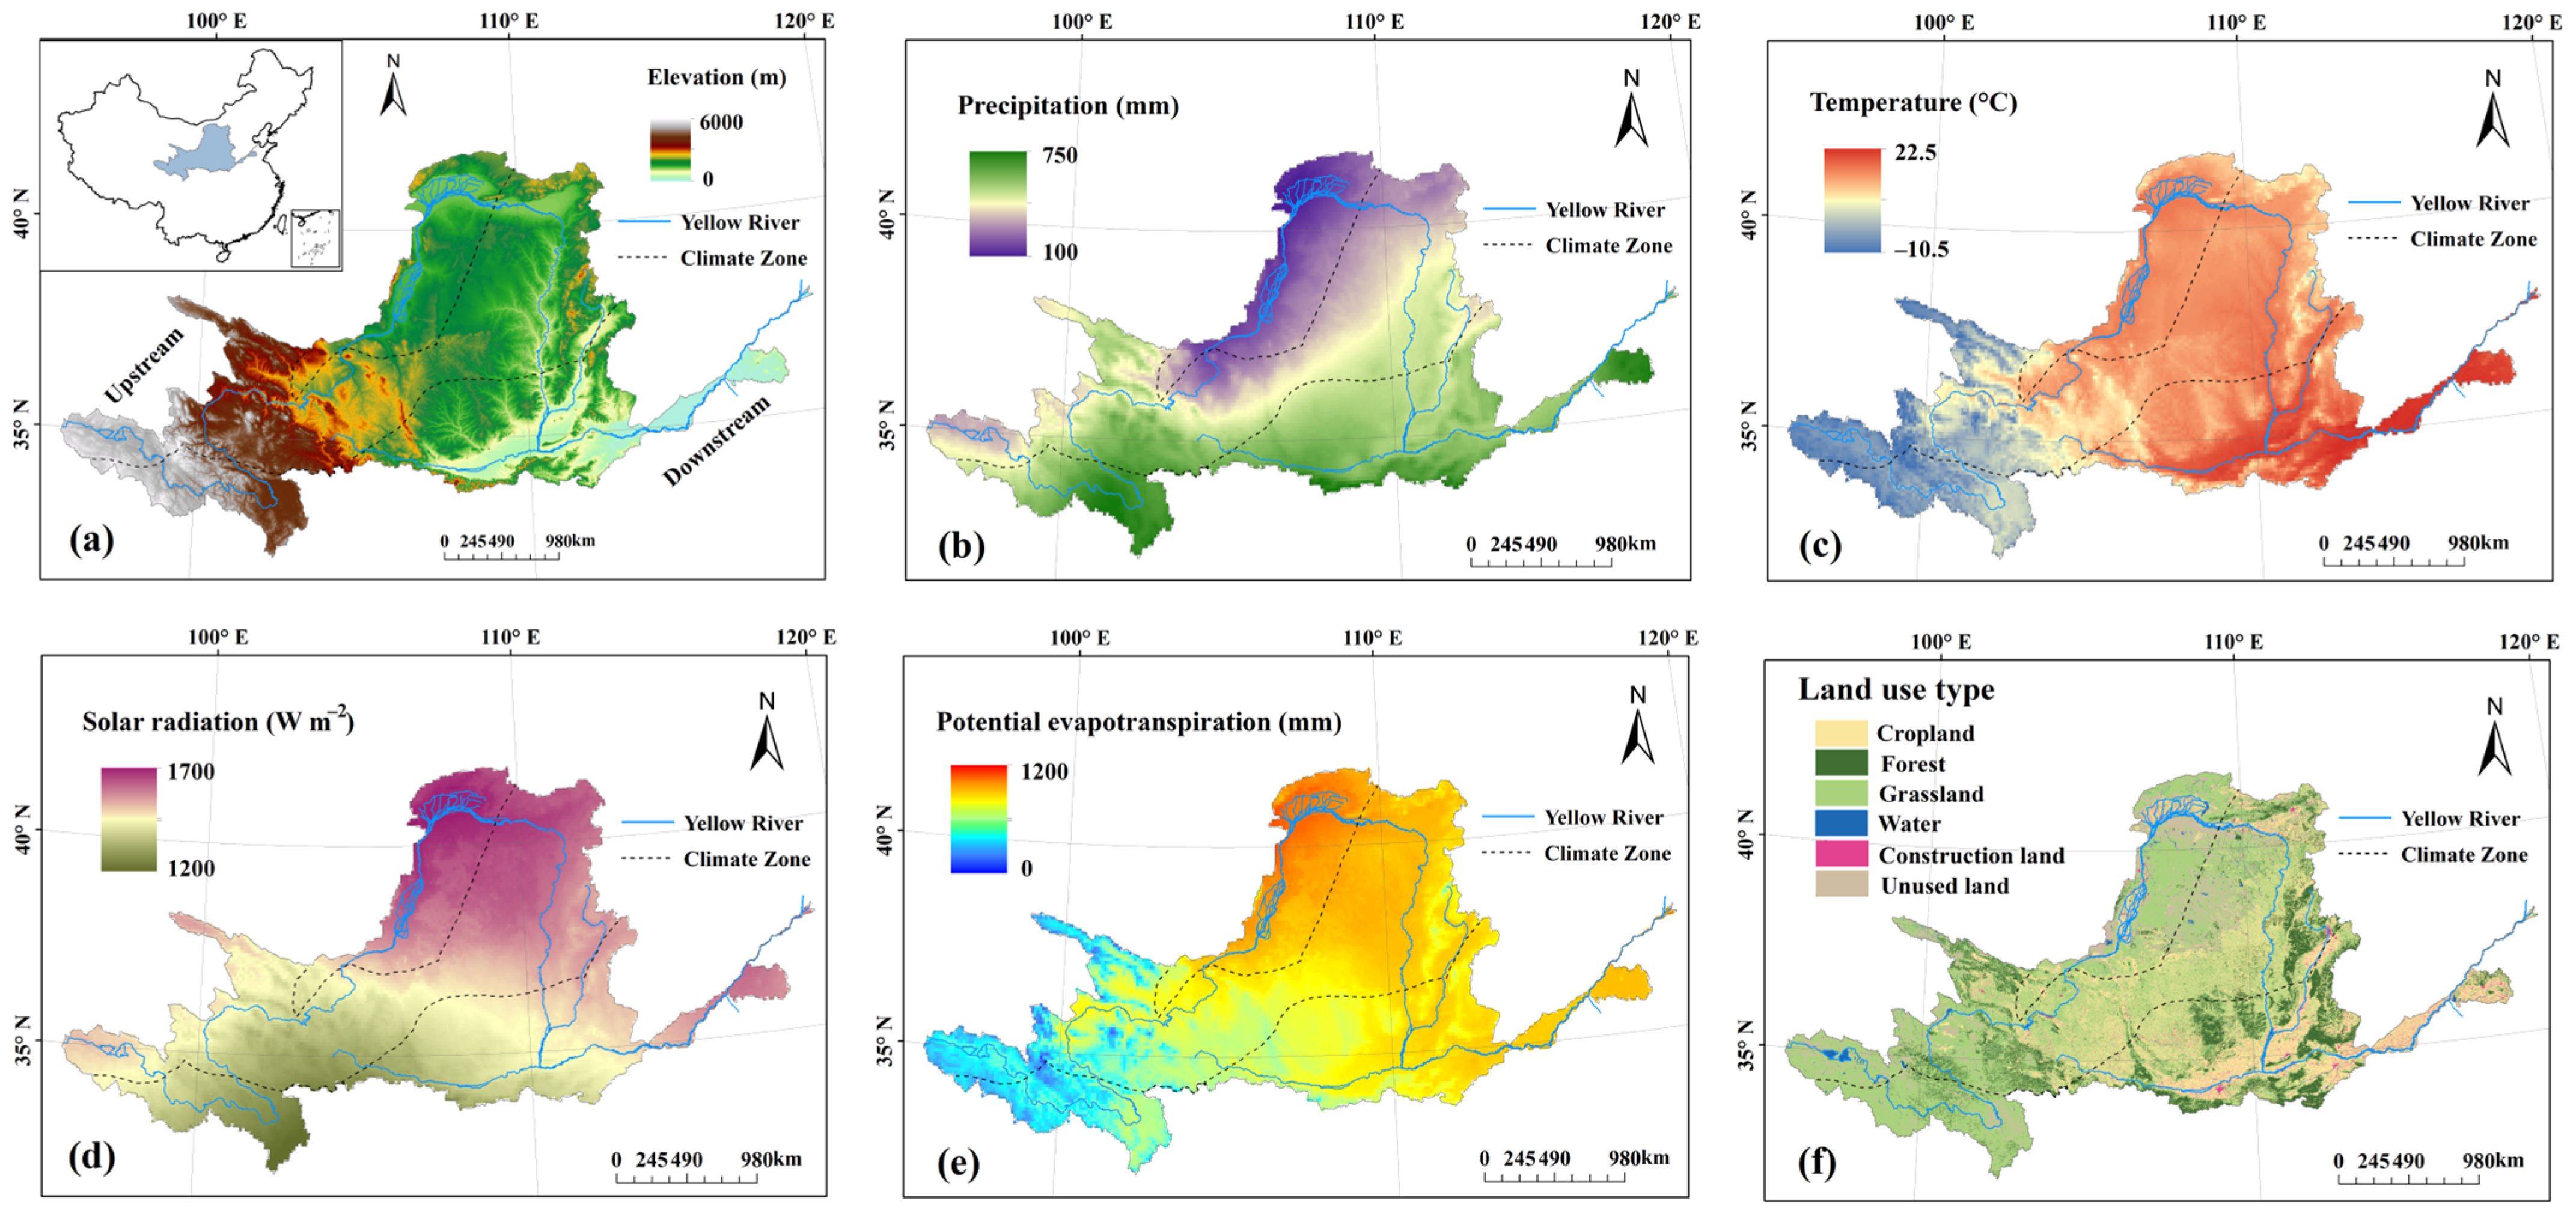
2.1. Study Area

The Yellow River originates in the Bayan Har Mountains in Qinghai Province of China, flows through nine provinces, and then flows into the Bohai Sea, with the YRB covering an area of 79.5 × 10⁴ km2 [47]. The elevation of the YRB gradually decreases from northwest to southeast, spanning four landforms: the Tibetan Plateau, the Inner Mongolian Plateau, the LP, and the Huang-Huai-Hai Plain from upstream to downstream (Figure 1a). According to the ecogeographical classification of China developed by Zheng [55], the YRB is characterized by an arid climate in the north, a semi-arid climate in the middle, and a semi-humid climate in the south. The average PRE in the YRB is 435 ± 48 mm (mean ± standard deviation, with the same below), the average TEM is 13.5 ± 0.5 °C, the average SR is 1500 ± 33 W m−2, and the average evaporation is 761 ± 31 mm, respectively (Figure 1b–e). Grassland, cropland, and forest dominate the vegetation type of the YRB (Figure 1f). Specifically, the upper reaches are located in regions with high mountains and are mostly forested. The middle reaches comprise plateaus with relatively gentle terrain, vegetated primarily with forest and grassland. The lower reaches are mostly characterized by a plain landscape containing a large proportion of cropland.

2.2. Datasets

A spatiotemporally consistent global dataset of the GIMMS normalized difference vegetation index (PKU GIMMS NDVI), generated by Li et al. [56], was used in this study. Based on a machine learning model, the PKU GIMMS NDVI integrates Landsat, GIMMS, and MODIS NDVI data, effectively eliminating the obvious orbital drift and sensor degradation effects in the tropics and showing high consistency with MODIS NDVI results. The PKU GIMMS NDVI covers the whole global vegetation area at a half-month temporal resolution and a spatial resolution of 1/12° for the period from 1982 to 2022. To eliminate atmospheric disturbances, monthly NDVI was calculated with the maximum synthesis algorithm (MVC) [9] and was further smoothed by the use of the Savitzky–Golay filter (SG) to minimize noise [57]. To mitigate the influence of water bodies and snowpack, areas with NDVIs below 0.1 during the growing season (April–October) were masked.
Four climate variables from two data sources were used in the present study. Monthly PRE and TEM for the period 1901–2022 were acquired from the National Tibetan Plateau Data Center (TPDC) and are provided at a spatial resolution of 1 km. Peng et al. [58] used the Delta downscaling technique to fuse the Climate Research Unit (CRU) data and WorldClim data and then validated it using observations from 496 weather stations in China, confirming its accuracy and reliability. The SR and PET were sourced from the TerraClimate dataset [59], spanning the period from 1958 to 2022, at a spatial resolution of 4 km. TerraClimate integrates the advantages of the high spatial resolution of the WorldClim dataset and the time-varying strengths of the CRU and Japanese 55-year Reanalysis (JRA55) dataset. TerraClimate has been robustly validated against Global Historical Climate Network (GHCN) station-based observations and is well correlated with the FLUXNET station-based reference evapotranspiration data.
Topographical data were acquired from digital elevation models (DEMs) of the Shuttle Radar Topography Mission (SRTM), with a 90 m spatial resolution [60]. Land-use data were sourced from the “China Multi-Period Land Use Remote Monitoring Dataset” (CNLUCC). The CNLUCC spans from 1980 to 2022 and categorizes China’s land use into six primary types: cropland, forest land, grassland, water, construction land, and unused land [61]. All data were resampled to align with the NDVI resolution before further analysis to ensure consistency. Detailed descriptions of the datasets utilized in this study are provided in Table 1.

2.3. Methods

2.3.1. Calculation of kNDVI

The kNDVI, rooted in the theory of kernel methods, is defined as follows:
k N D V I = k ( n , n ) k ( n , r ) k ( n , n ) + k ( n , r )
where NIR ( n ) and red ( r ) bands are the reflectance. The term k is used to describe the “kernel function”, which can be defined as k ( n , r ) = exp ( ( n r ) 2 / 2 σ 2 ) , where σ determines the measure of distance between n and r . Thus, Equation (1) can be simplified as follows:
k N D V I = 1 k ( n , r ) 1 + k ( n , r ) = t a n h n r 2 σ 2
Considering the equal distance between the NIR and red bands, Equation (1) can be further reduced to:
k N D V I = t a n h N D V I 2
In this study, we used a simplified algorithm (Equation (3)) to calculate the monthly kNDVI, which was then enumerated into the average growing season kNDVI to reflect the dominant vegetation growth process.

2.3.2. Trend Analysis

To measure the kNDVI trend, we created a linear regression model, and estimated the model parameters using least squares calculations with the help of the following formula:
slope = n × i = 1 n i × k N D V I i i = 1 n i i = 1 n k N D V I i n × i = 1 n i 2 i = 1 n i 2
Here, slope denotes the change rate and k N D V I i denotes the variable of the i-th value; when slope > 0 , an increasing trend is evident, and a decreasing trend is apparent for slope < 0 . The significance of the F-test was determined as follows:
F = S R S E / ( n 2 )
Here, S R = i = 1 n k N D V I ^ i k N D V I ¯ 2 and S E = i = 1 n k N D V I i k N D V I ^ i 2 denote the sums of the regression squares and residual squares, respectively. n 2 represents the degrees of freedom of residuals, and k N D V I ^ i is the linear regression value of the variable. The trend can be categorized as significant ( p < 0.05 ), more significant ( p < 0.01 ), or extremely significant ( p < 0.001 ), based on the F-test.

2.3.3. Persistence Analysis

Hurst [62] proposed the Hurst exponent (H) to evaluate the persistence of a time series. For a long-term kNDVI with a length of n, the primary computational procedures for the Hurst exponent are as follows:
(1)
Divide the original kNDVI into subsequences, k N D V I τ , with a length of τ , and calculate the mean value of each subsequence:
k N D V I τ ¯ = 1 τ t = 1 τ k N D V I t ,   τ = 1 , 2 , 3 , , n
(2)
Calculate the cumulative deviation ( V ( t , τ ) ) and its fluctuation range ( R ( τ ) ) for each k N D V I τ :
V ( t , τ ) = t = 1 τ k N D V I ( t ) k N D V I ( t ) ¯
R ( τ ) = m a x V ( t , τ ) m i n V t , τ ,   1 t τ ; τ = 1 , 2 , 3 , , n
(3)
Calculate the standard deviation ( S τ ) for each subsequence. Then, the H exponent can be derived from the following expression:
S τ = 1 τ t = 1 τ ( N D V I ( t ) k N D V I t ¯ ) 2 1 2
R ( τ ) S ( τ ) = ( c τ ) H
The H exponent indicates whether changes in kNDVI are persistent or not, with H > 0.5 , H < 0.5 , and H = 0.5 representing the presence of persistence, anti-persistence, and non-persistence for kNDVI, respectively.

2.3.4. Contribution Analysis

Residual analysis is a commonly utilized approach for measuring the contributions of climatic and anthropogenic influences on vegetation change. Residual analysis obtains the predicted value ( k N D V I p r e ) by building a multiple regression model between the observed value of the vegetation index ( k N D V I o b s ) and climatic factors, considering that ( k N D V I p r e ) reflects the effects of climate on kNDVI variations. Regardless of other factors, the residual value ( k N D V I r e s ) is defined to reflect anthropogenic impact. The specific expression is as follows:
k N D V I p r e = a × P R E + b × T E M + c × S R + d × P E T + ε
k N D V I r e s = k N D V I o b s k N D V I p r e
Here, k N D V I p r e denotes the predicted value of kNDVI, k N D V I r e s denotes the residual value of kNDVI, and k N D V I o b s denotes the observed value of kNDVI. a , b , c , and d correspond to the regression coefficients of growing season PRE, air TEM, SR, and PET in the multivariate regression model, and ε is a constant term.
Through the analysis given in Section 2.3.2, we can infer the trend of vegetation dynamics, with s l o p e o b s > 0 and s l o p e o b s < 0 indicating the observed greening and degradation trend of vegetation dynamics, respectively. Similarly, s l o p e p r e > 0 and s l o p e p r e < 0 suggest that climate change promotes and inhibits vegetation growth, respectively, while s l o p e r e s > 0 and s l o p e r e s < 0 suggest that human activities promote and inhibit vegetation growth, respectively.
According to s l o p e p r e and s l o p e r e s , climate and anthropogenic contributions can be classified into seven categories (Table 2). Additionally, the relative contributions of CC and HA to kNDVI changes were calculated based on the classification outlined in Table 3.

2.3.5. Partial Correlation Analysis

Controlling for the potential impacts of other climatic factors on kNDVI changes, we employed partial correlation analysis to investigate the individual correlations between kNDVI and each climatic driver (TEM, PRE, SR, and PET). In contrast to linear correlation, partial correlation excludes the interactive effects of other climate drivers when determining the influence of climate on vegetation dynamics, reflects a more realistic vegetation–climate relationship, and is widely used to identify the dominant climate drivers associated with vegetation change. The partial correlation coefficient (PCC) quantifies the strength of the correlation between vegetation dynamics and a single climatic factor; the larger the PCC, the stronger the correlation. The primary calculation procedures of the PCC are outlined as follows [9,63]:
r = i = 1 n x i x ¯ y i y ¯ i = 1 n x i x ¯ 2 i = 1 n y i y ¯ 2
P C C 12 , 3 = r 12 r 13 × r 23 1 r 13 2 1 r 23 2
P C C 12 , 34 = P C C 12 , 3 P C C 14 , 3 P C C 24 , 3 1 P C C 14 , 3 2 1 P C C 24 , 3 2
P C C 12 , 34 p = P C C 12 , 34 p 1 P C C 1 p , 34 p 1 ×   P C C 2 p , 34 p 1 ( 1 P C C 1 p , 34 p 1 2 ) ( 1 P C C 2 p , 34 p 1 2 ) ,   p 5  
Here, r is the Pearson correlation coefficient, and P C C 12 , 3 , P C C 12 , 34 , and P C C 12 , 34 p denote the PCCs of first order, second order, and multiple orders (order ≥ 3), respectively. Furthermore, the significance of the PCC was evaluated by t-test (Equation (15)), which was tested at a significance level of 0.05.
t = P C C 12 , 34 p n k 2 1 P C C 12 , 34 p 2
Here, n is the sample number and k is the order of the PCC.
To identify the dominant climate factors affecting kNDVI variations, we compared the absolute values of the PCC between kNDVI and the four climate variables, according to the following rules. In Scenario 1, where all the PCCs were either significant or insignificant (at the same level of significance), we directly compared the absolute values of the PCCs, and then the largest correlation coefficients were taken as corresponding to the dominant climate driver. In Scenario 2, both significant and insignificant PCCs were present, and we set the importance of significant PCCs as higher than that of insignificant PCCs. We then ranked the importance of climate factors in terms of the absolute value of the PCC under the same significance level in order to identify the most critical climate drivers.

3. Results

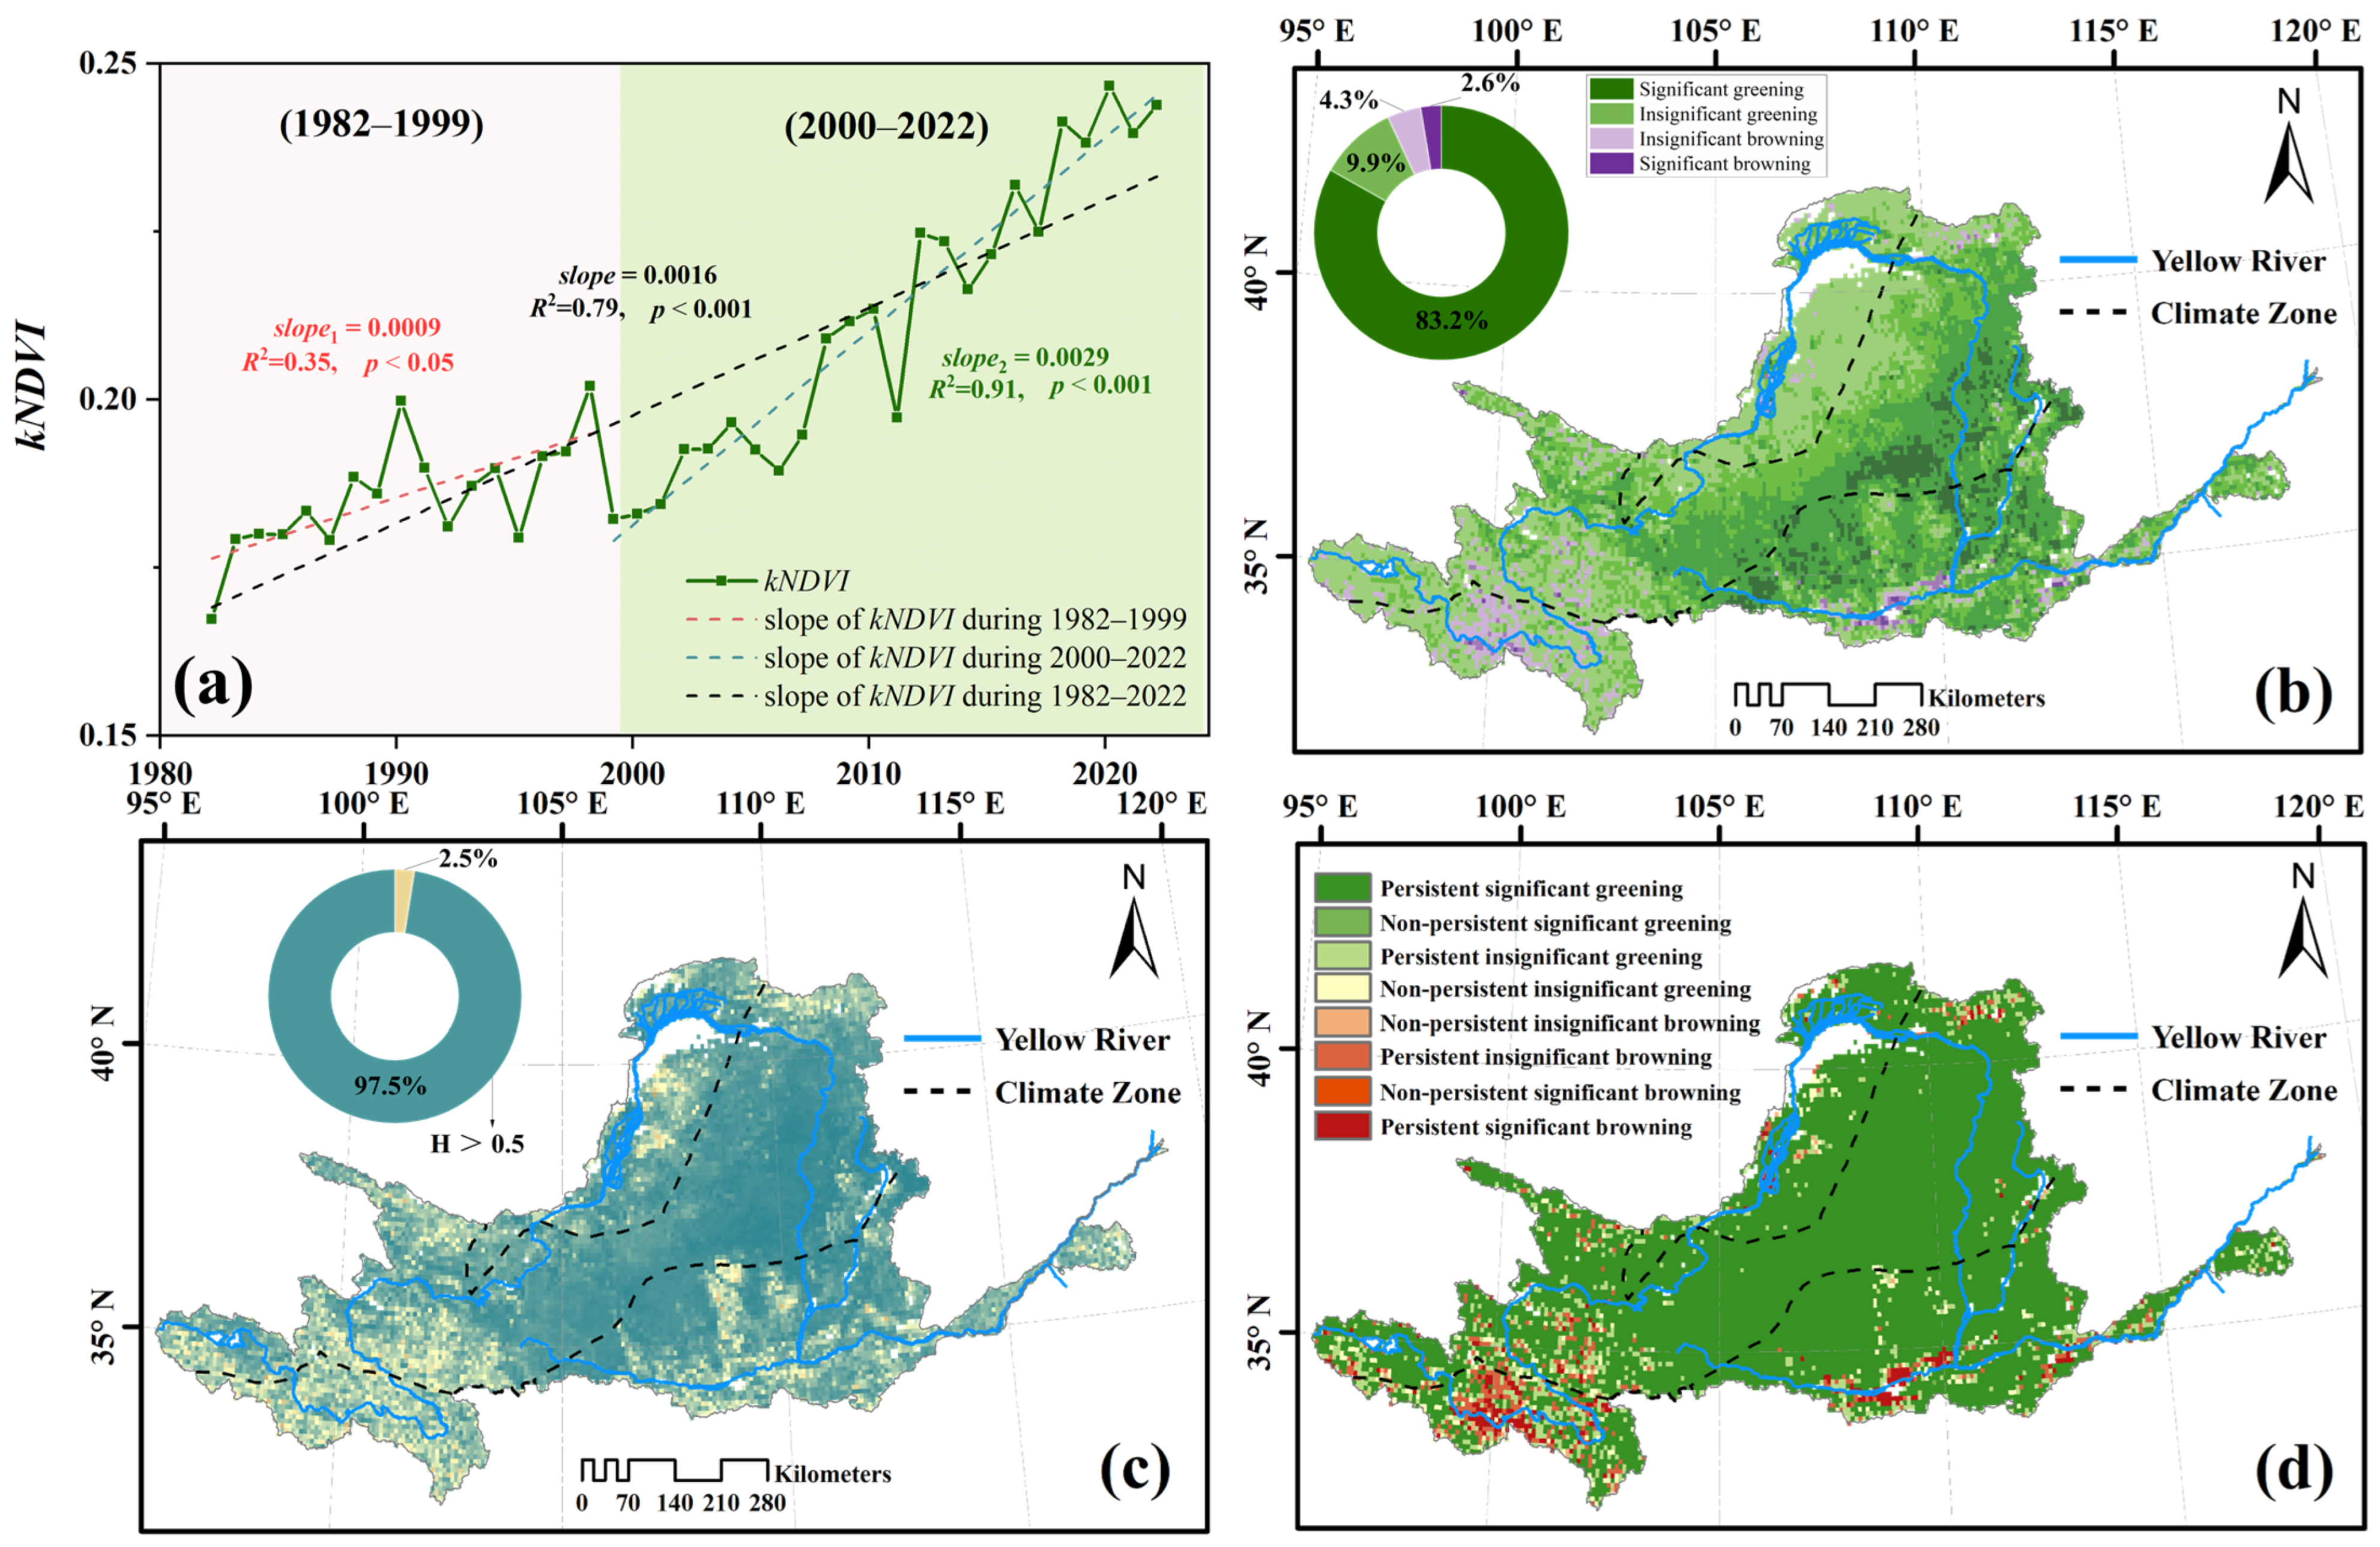
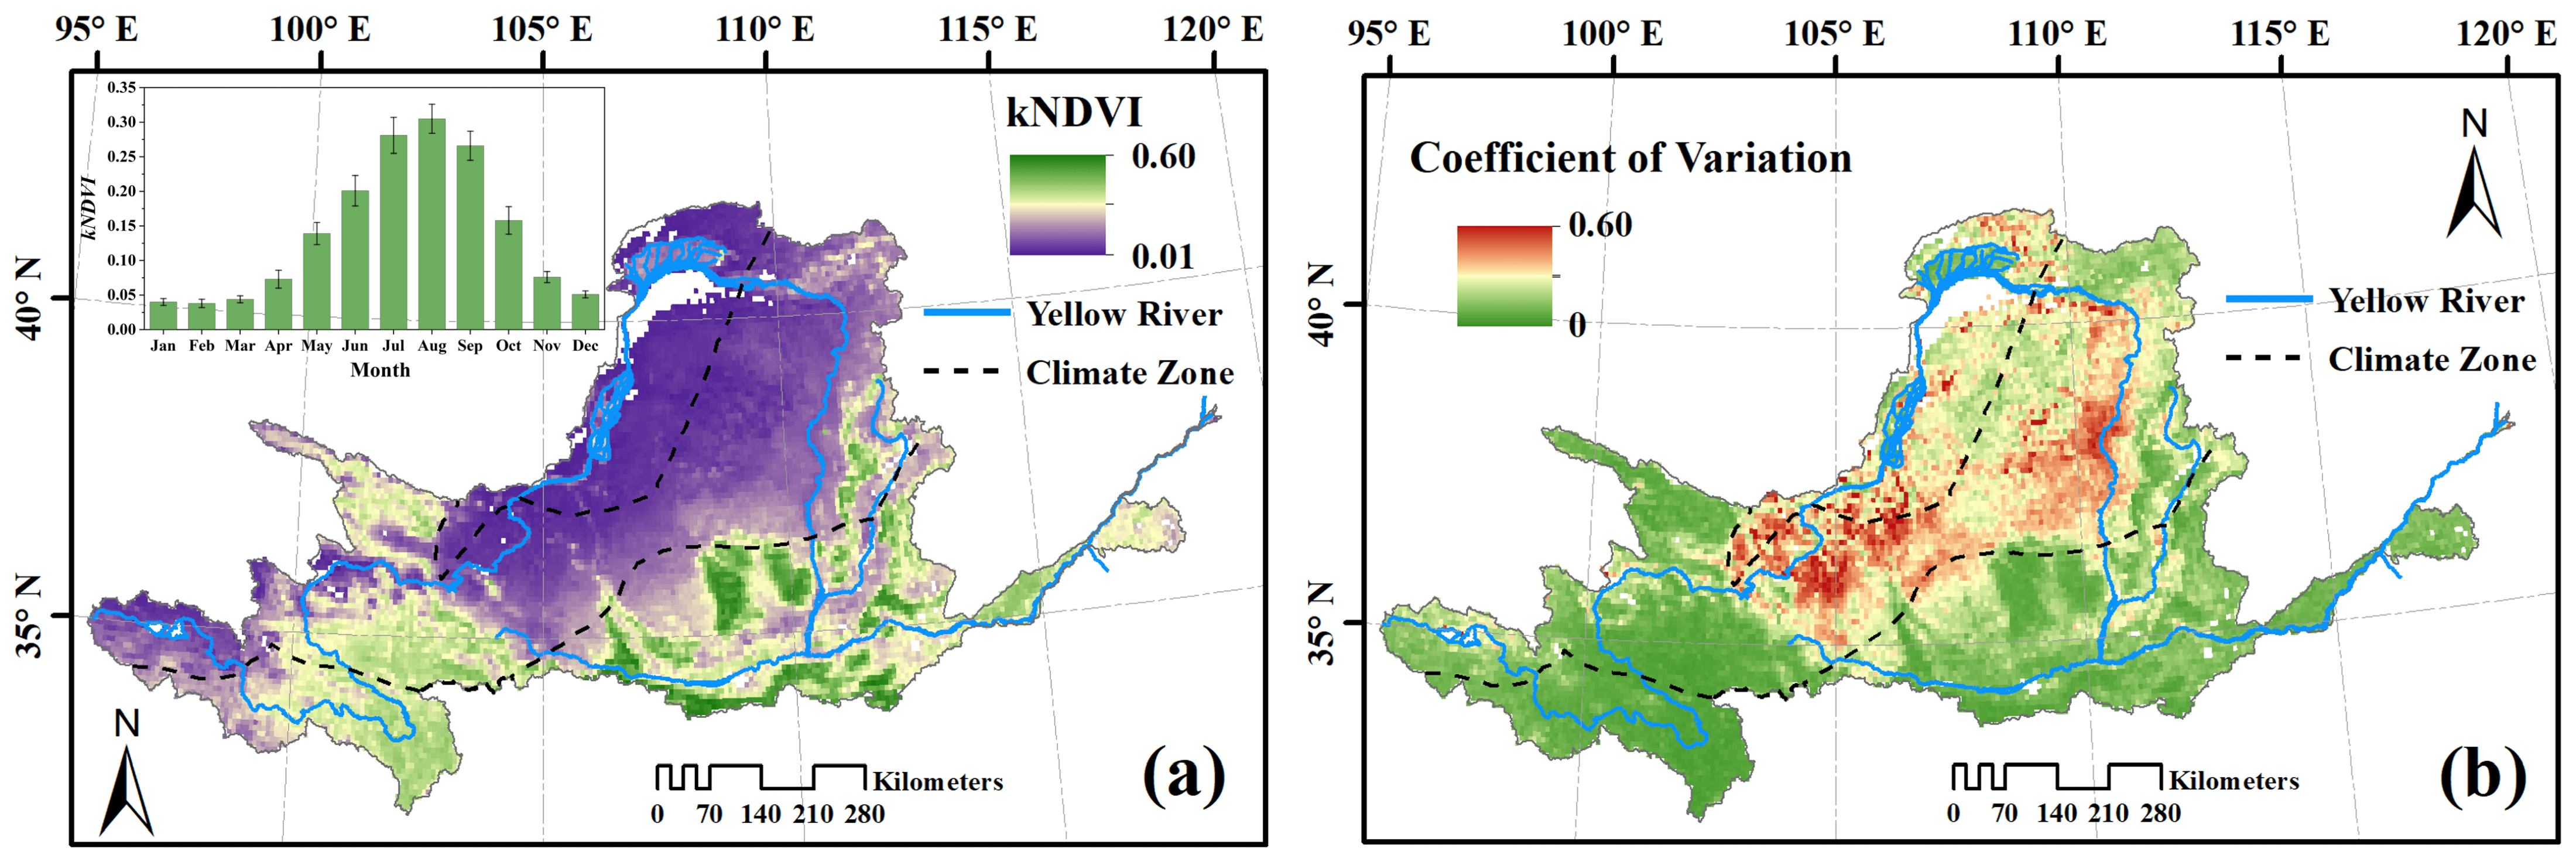
3.1. Spatial Patterns and the Annual Variability of kNDVI

As shown in Figure 2, clear spatial and temporal heterogeneity in vegetation dynamics was observed in the YRB. Within the year, the kNDVI in the YRB displayed a single-peak pattern, with its highest points occurring in August at a value of 0.31 ± 0.02 (Figure 2a). The growing season kNDVI in the YRB was 0.20 ± 0.02, decreasing spatially from southeast to northwest. The high values of kNDVI occurred in the southeastern YRB, characterized by a warm and humid climate, where the vegetation cover is dominated by crops, and the distinct growth process of the crops contributes to the presence of better vegetation conditions in the region. In contrast, the dry northwestern YRB was characterized by low vegetation cover that was predominantly distributed in grassland ecosystems. Over the past 41 years, the inter-annual fluctuation of vegetation dynamics in the YRB was irregular, with a coefficient of variation of 0.21 ± 0.13. Spatially, the northwestern YRB (corresponding to the area with low vegetation cover) showed strong kNDVI fluctuations, with coefficients of variation being greater than 0.2 in most areas. The southeastern YRB, however, exhibited lower kNDVI fluctuations, with better vegetation conditions (Figure 2b).

3.2. Spatio-Temporal Trends and the Persistence of kNDVI

We further investigated the trend as well as its persistence in vegetation variations in the YRB using linear regression and the Hurst index (Figure 3). A significant increase in kNDVI in the YRB was observed from 1982 to 2022, with a slope of 0.0016 yr−1 (p < 0.001). Moreover, the changes in kNDVI in the YRB show obvious phase features, which could be roughly divided into two phases: 1982 to 1999 and 2000 to 2022. In the first phase, the vegetation showed a significant greening trend, with the slope of kNDVI being 0.009 yr−1 (p < 0.05). In contrast, the greening rate of the vegetation in the YRB accelerated significantly in 2000–2022, with the slope of kNDVI being 0.029 yr−1 (p < 0.001), which is more than three times higher than that in the first phase (Figure 3a). This indicates that the ecological protection facilities, most notably the Grain to Green Program (GTGP) initiated in 1999, demonstrated a remarkable effect on improving the vegetation condition. Over the period from 1982 to 2022, 93.1% of the YRB experienced extensive greening, with 83.2% of the areas increasing significantly in terms of kNDVI. In the YRB, browning was observed in 6.9% of the vegetated areas, of which 2.3% were significantly brown, mainly in urban and alpine areas (Figure 3b). The Hurst index of kNDVI is greater than 0.5 in 97.5% of the vegetated areas in the YRB, indicating that the YRB will tend to be extensively greened in the future (Figure 3c). Synthesizing the results of the trend and persistence analysis, we found that 83% of the vegetated areas in the YRB are expected to undergo significant greening in the future (Figure 3d). In contrast, only 0.5% of the vegetated area will tend to be significantly browned in the future and will be located primarily in alpine and urban areas, underlining the urgency and complexity of ecological protection in these regions.

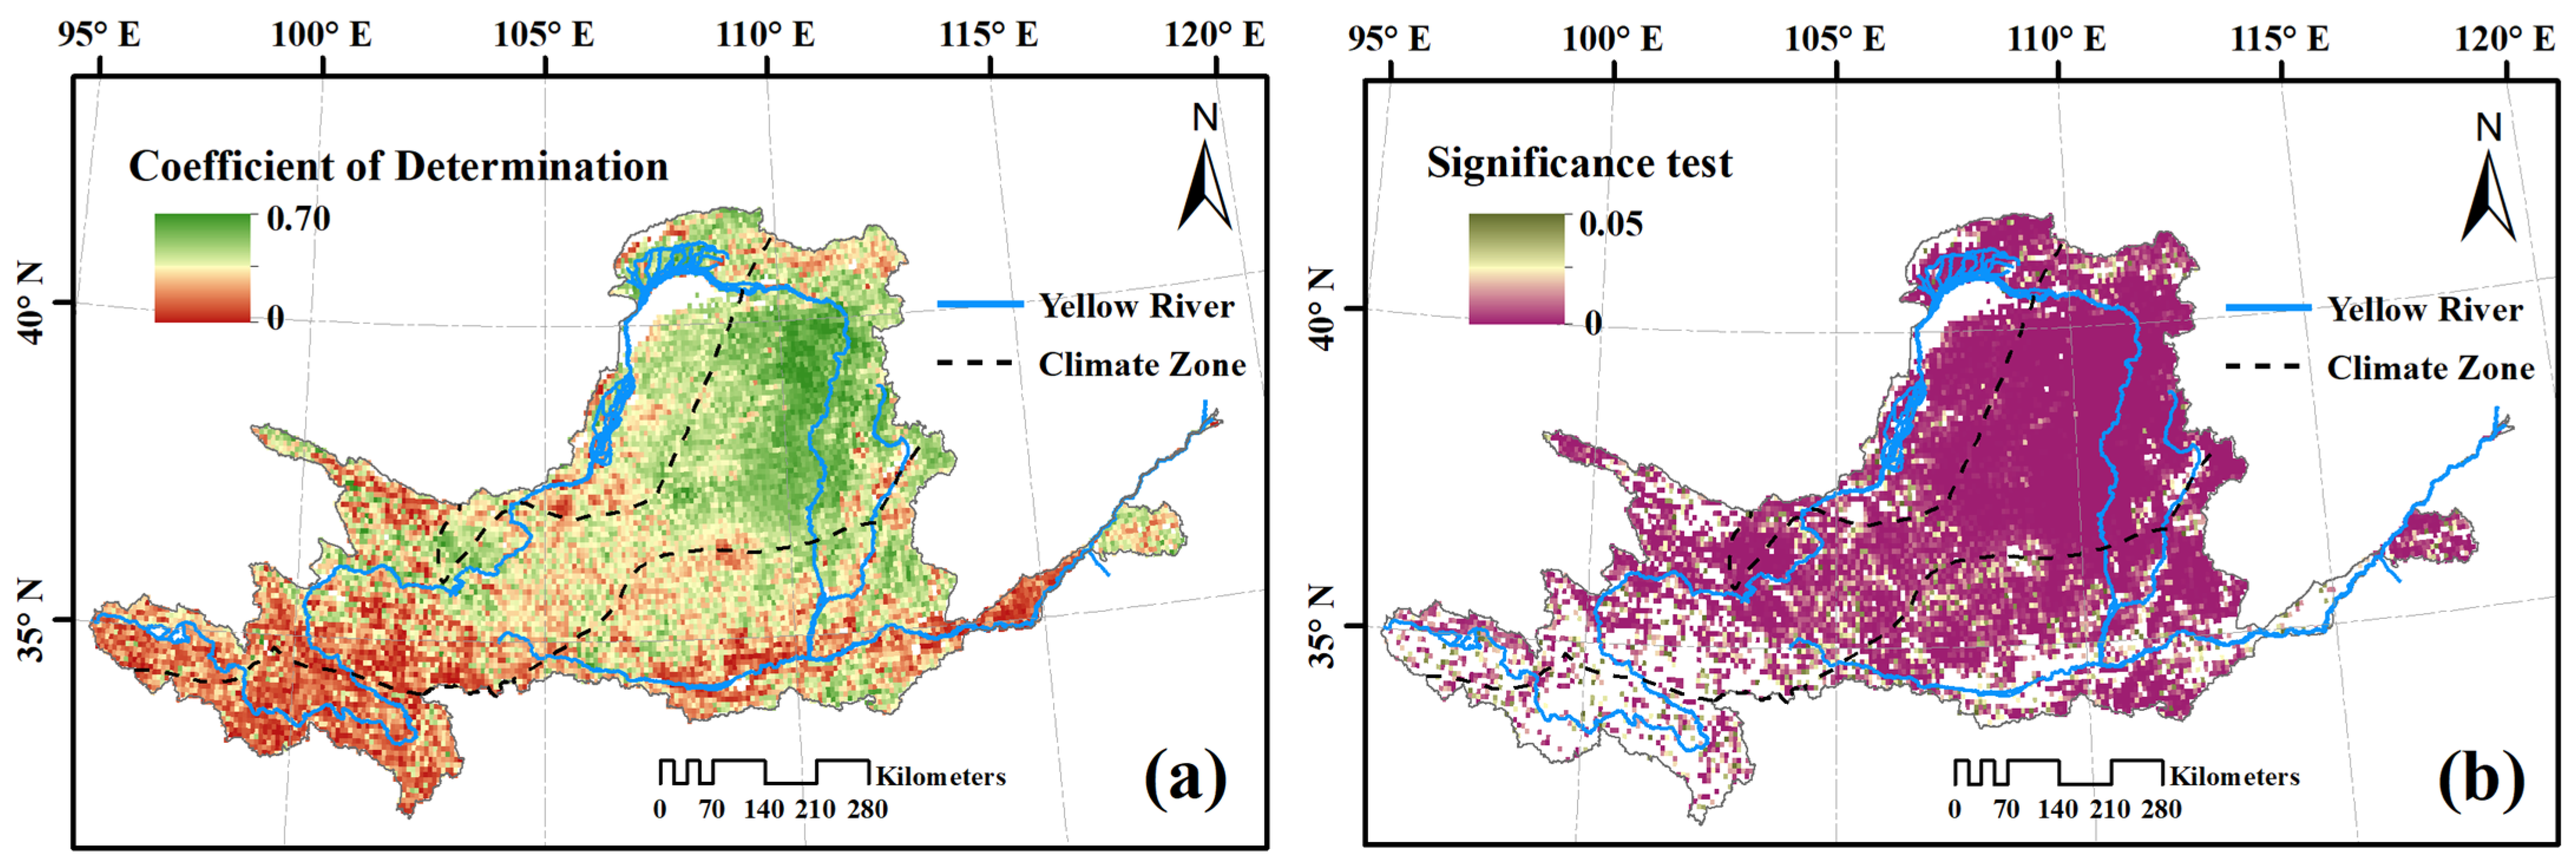
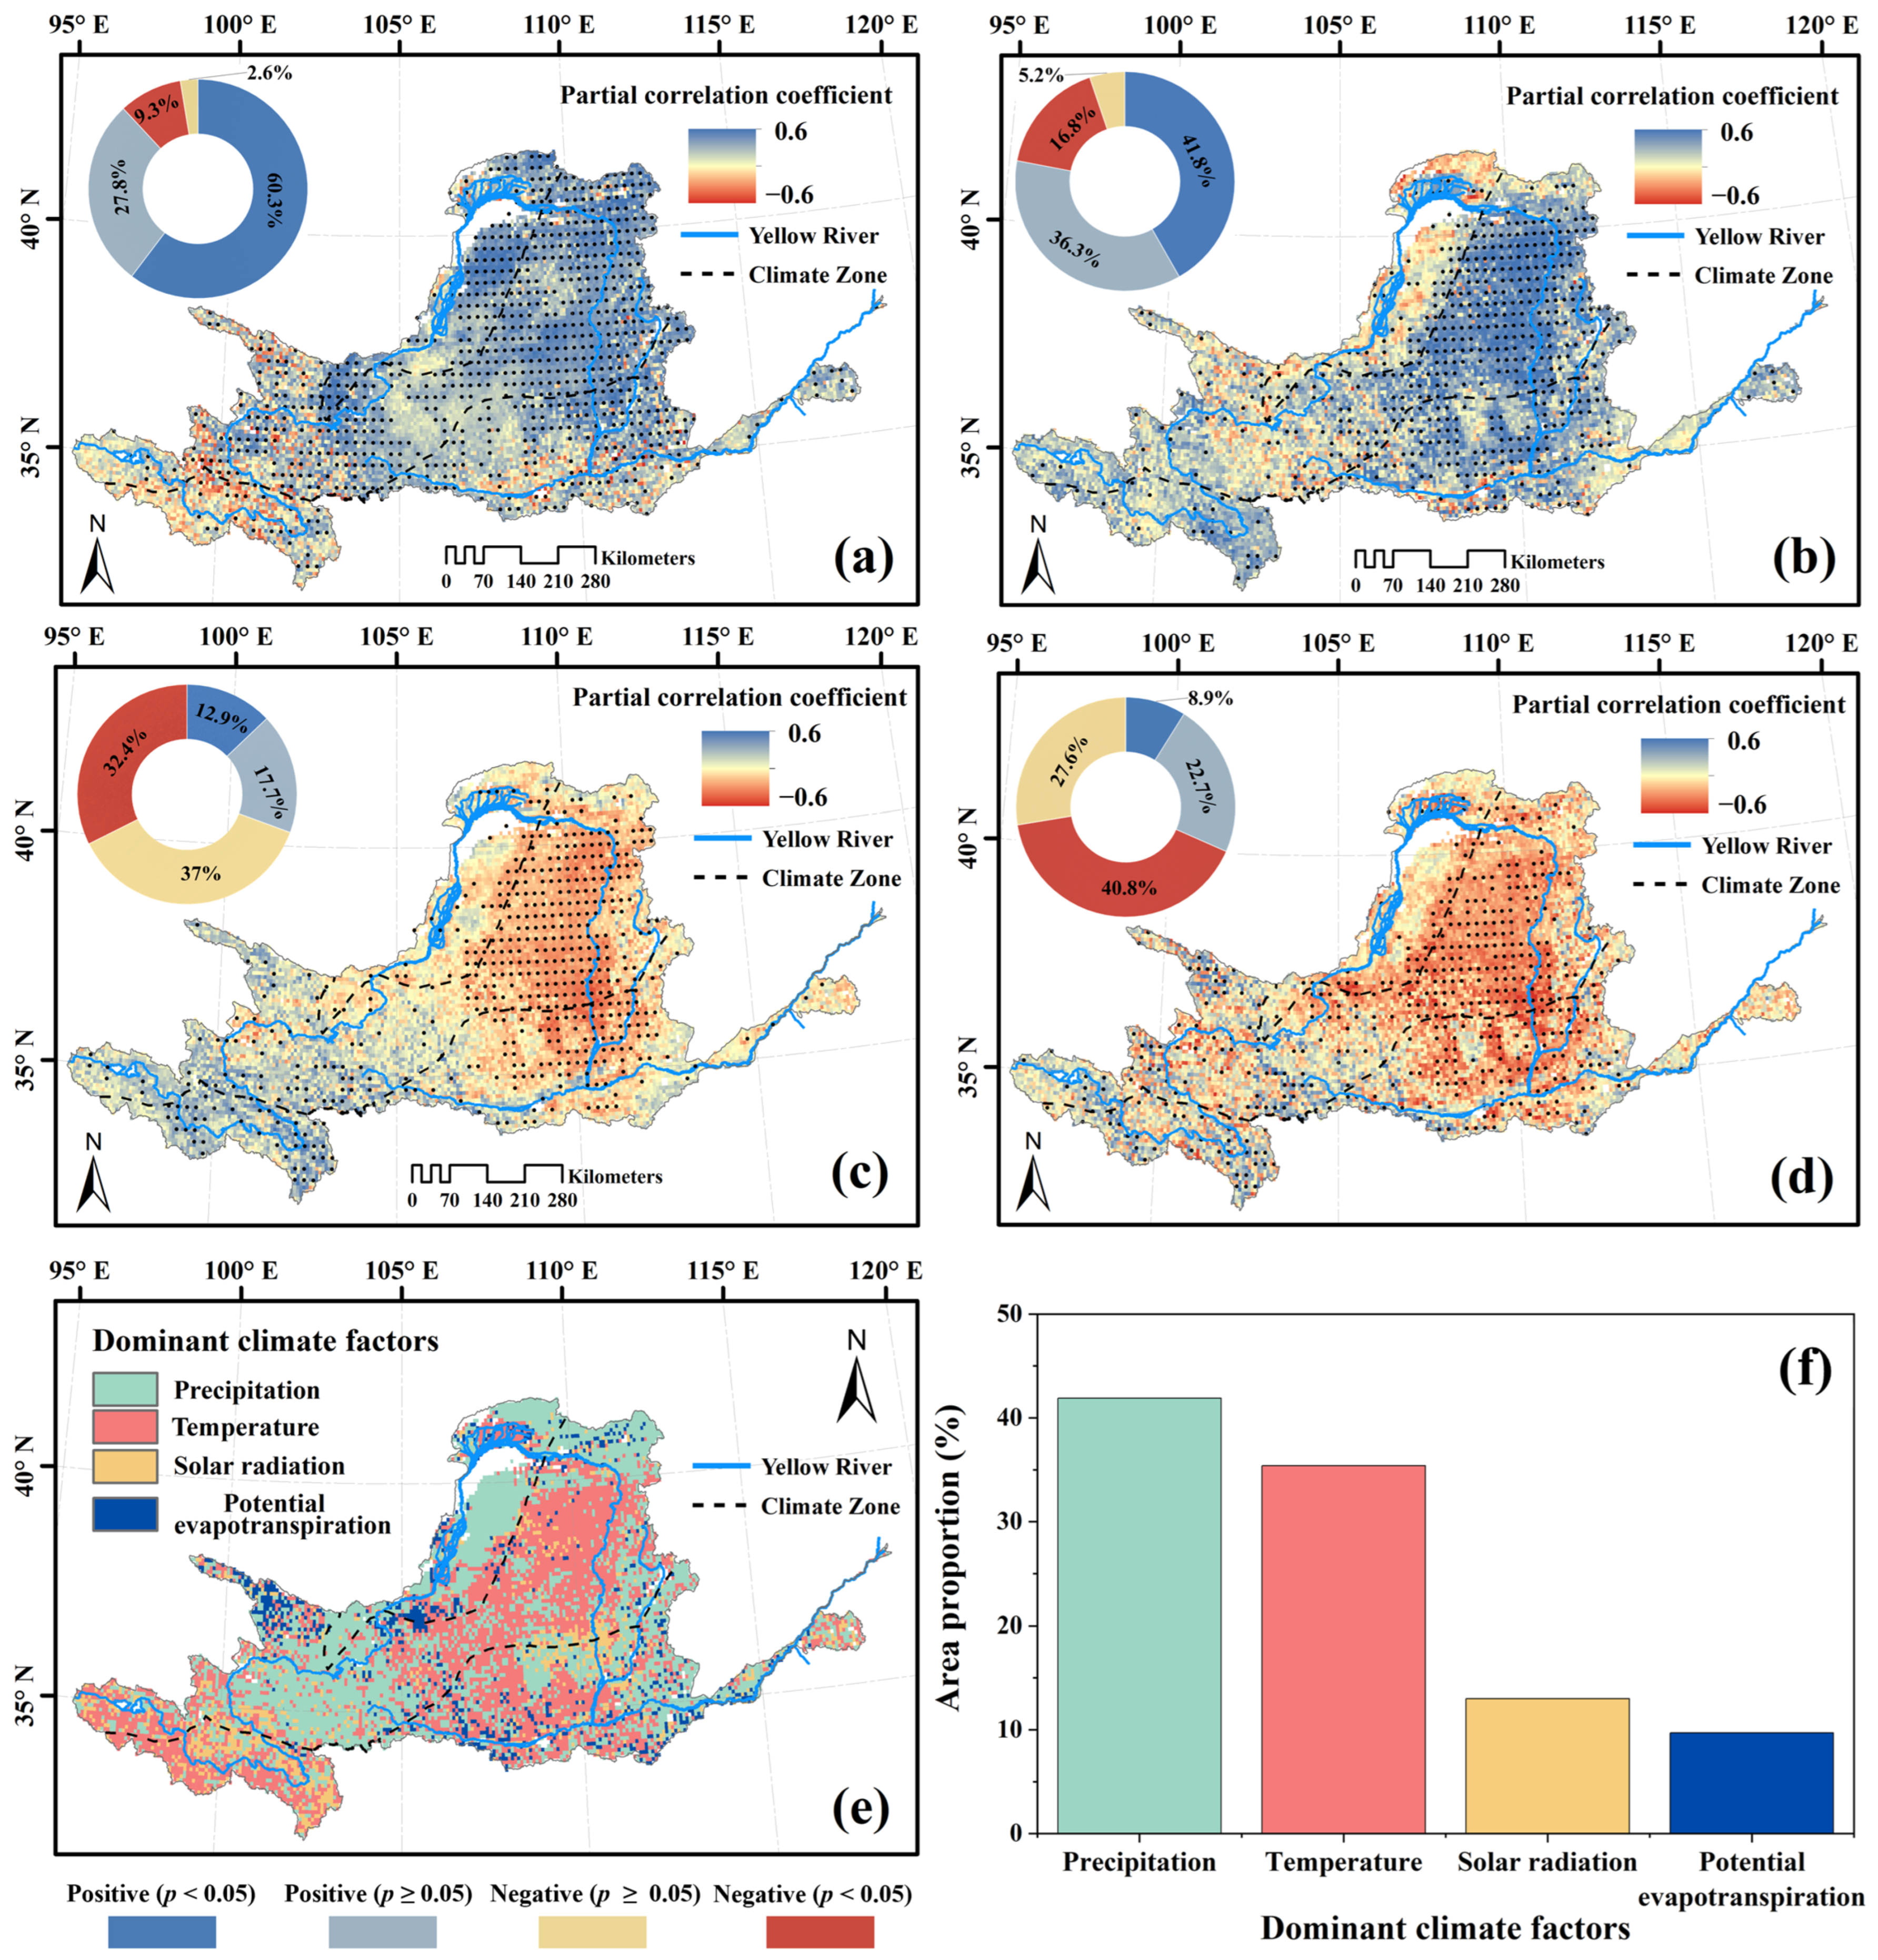
3.3. Response of Vegetation Dynamics to Changing Climate

To obtain a quantitative description of the climatic effect on vegetation variations in the YRB, we established a multiple regression model between kNDVI and the primary climatic variables (PRE, TEM, SR, and PET), as illustrated in Figure 4. From 1982 to 2022, most vegetated zones were highly influenced by climate change, with a multiple linear regression coefficient (MLRC) of 0.32 ± 0.15 (Figure 4a). The northeastern YRB recorded the highest vegetation–climate relationship values, whereas alpine and urban areas recorded lower values. Furthermore, the t-test revealed that climate change significantly affected over 75% of the vegetated areas, which corresponded to the high-value area of the MLRC (Figure 4b).
We further quantitatively described the relationship between kNDVI and single climatic factors by utilizing partial correlation analysis and identified the dominant climatic factors associated with vegetation change (Figure 5). Over the past four decades, 88.1% of the vegetated areas in the YRB benefited from increased PRE, of which 60.3% showed a significantly positive correlation between kNDVI and PRE (p < 0.05), primarily in arid and semi-arid regions (Figure 5a). In contrast, increased PRE primarily suppressed vegetation growth in the alpine and southeastern YRB. Warming promoted vegetation growth in 78% of the areas of the YRB (with a significant effect being observed in 41.8% of the region), whereas it negatively affected 22% of vegetated areas, especially in the arid zone (Figure 5b). In addition, the increased SR inhibited vegetation growth in nearly 70% of vegetated areas, primarily in the northeastern YRB, while it promoted vegetation growth in alpine areas (Figure 5c). Moreover, the enhanced PET significantly promoted vegetation growth in alpine areas, whereas it inhibited vegetation growth in nearly 70% of the vegetated areas, notably in the arid and semi-arid areas (Figure 5d). In summary, PRE was the most influential factor on vegetation growth in the YRB, representing a climate-dominant factor for 41.9% of vegetation changes, particularly in the arid zone. TEM, as the second most dominant climate factor, manifested 35.4% of climate-related vegetation variation, especially in the alpine and semi-humid zones. SR caused 13% of vegetation variations, especially in the alpine zone. The influence of PET on vegetation dynamics was limited and was spatially dispersed (Figure 5e,f).

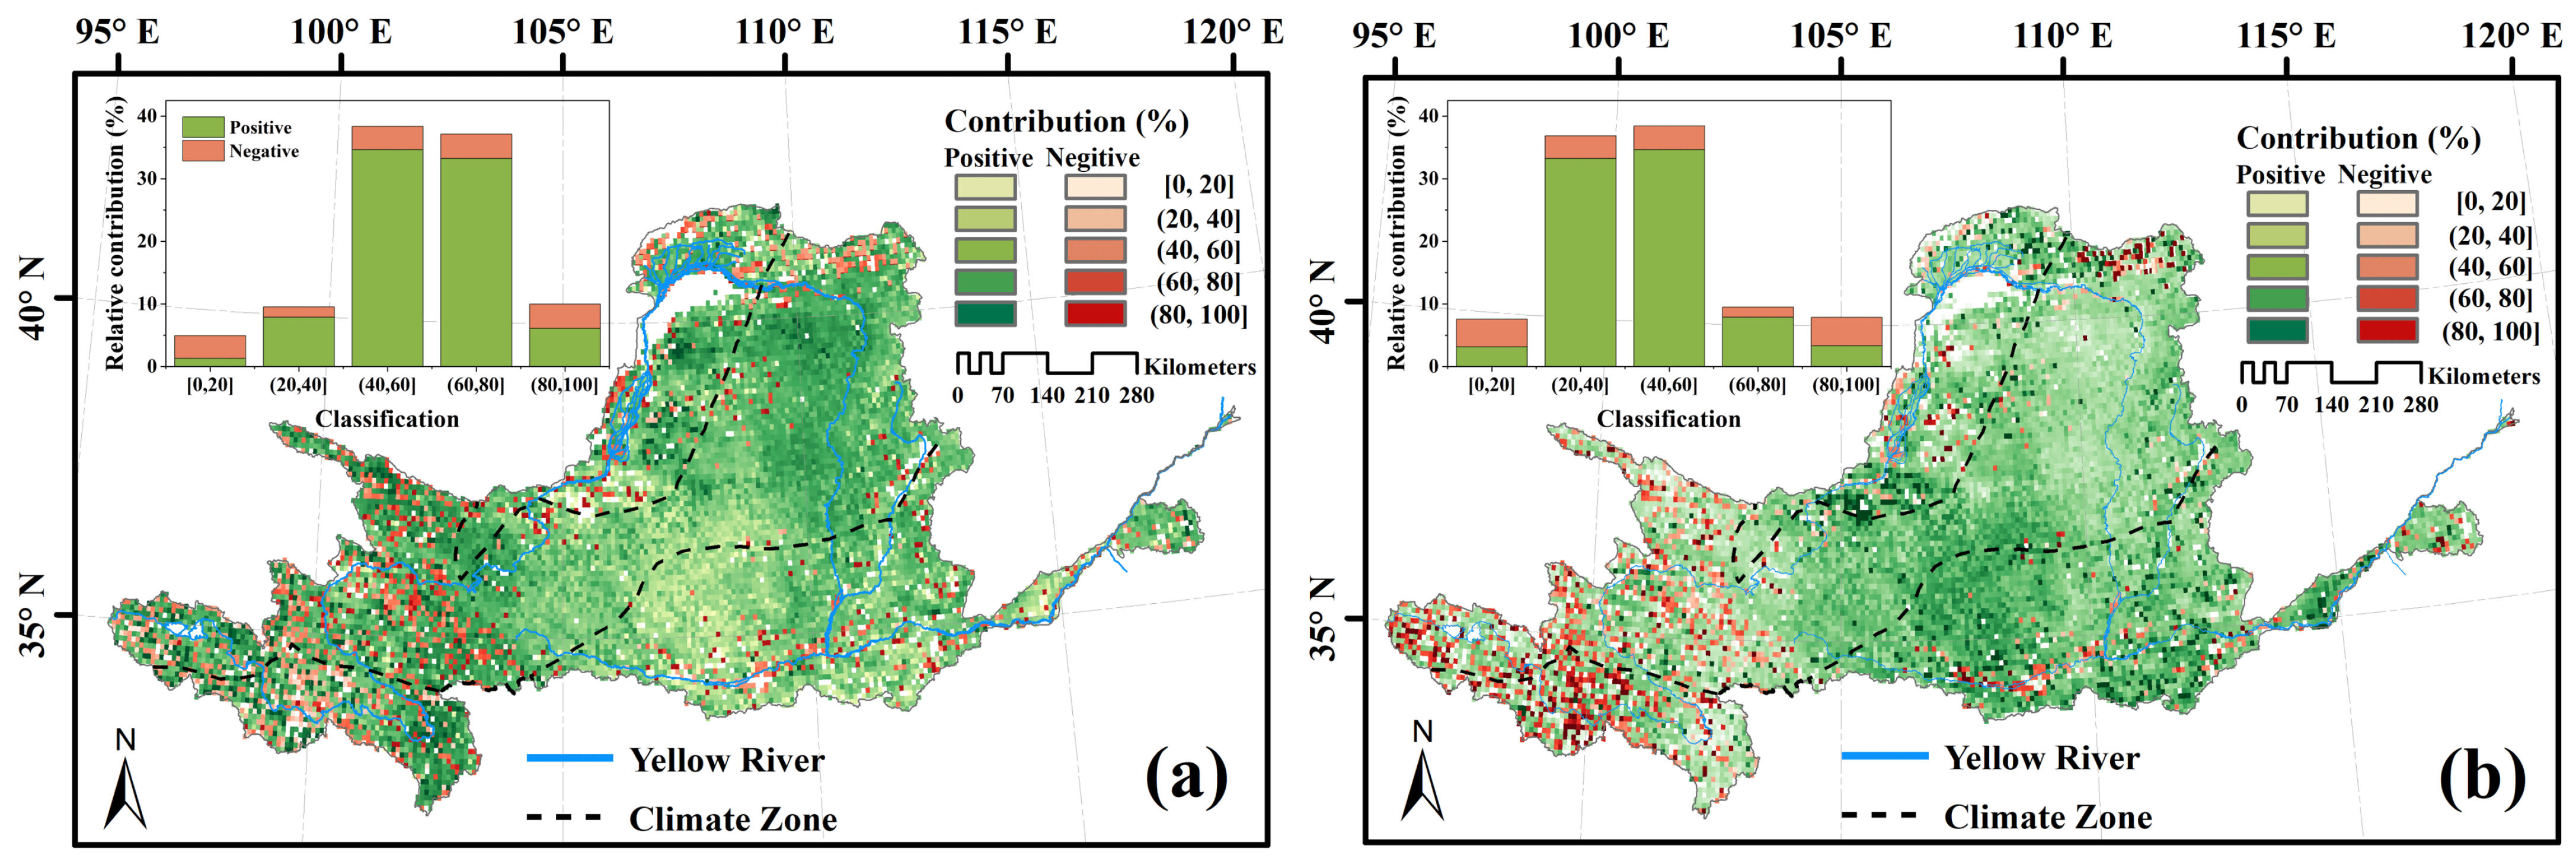
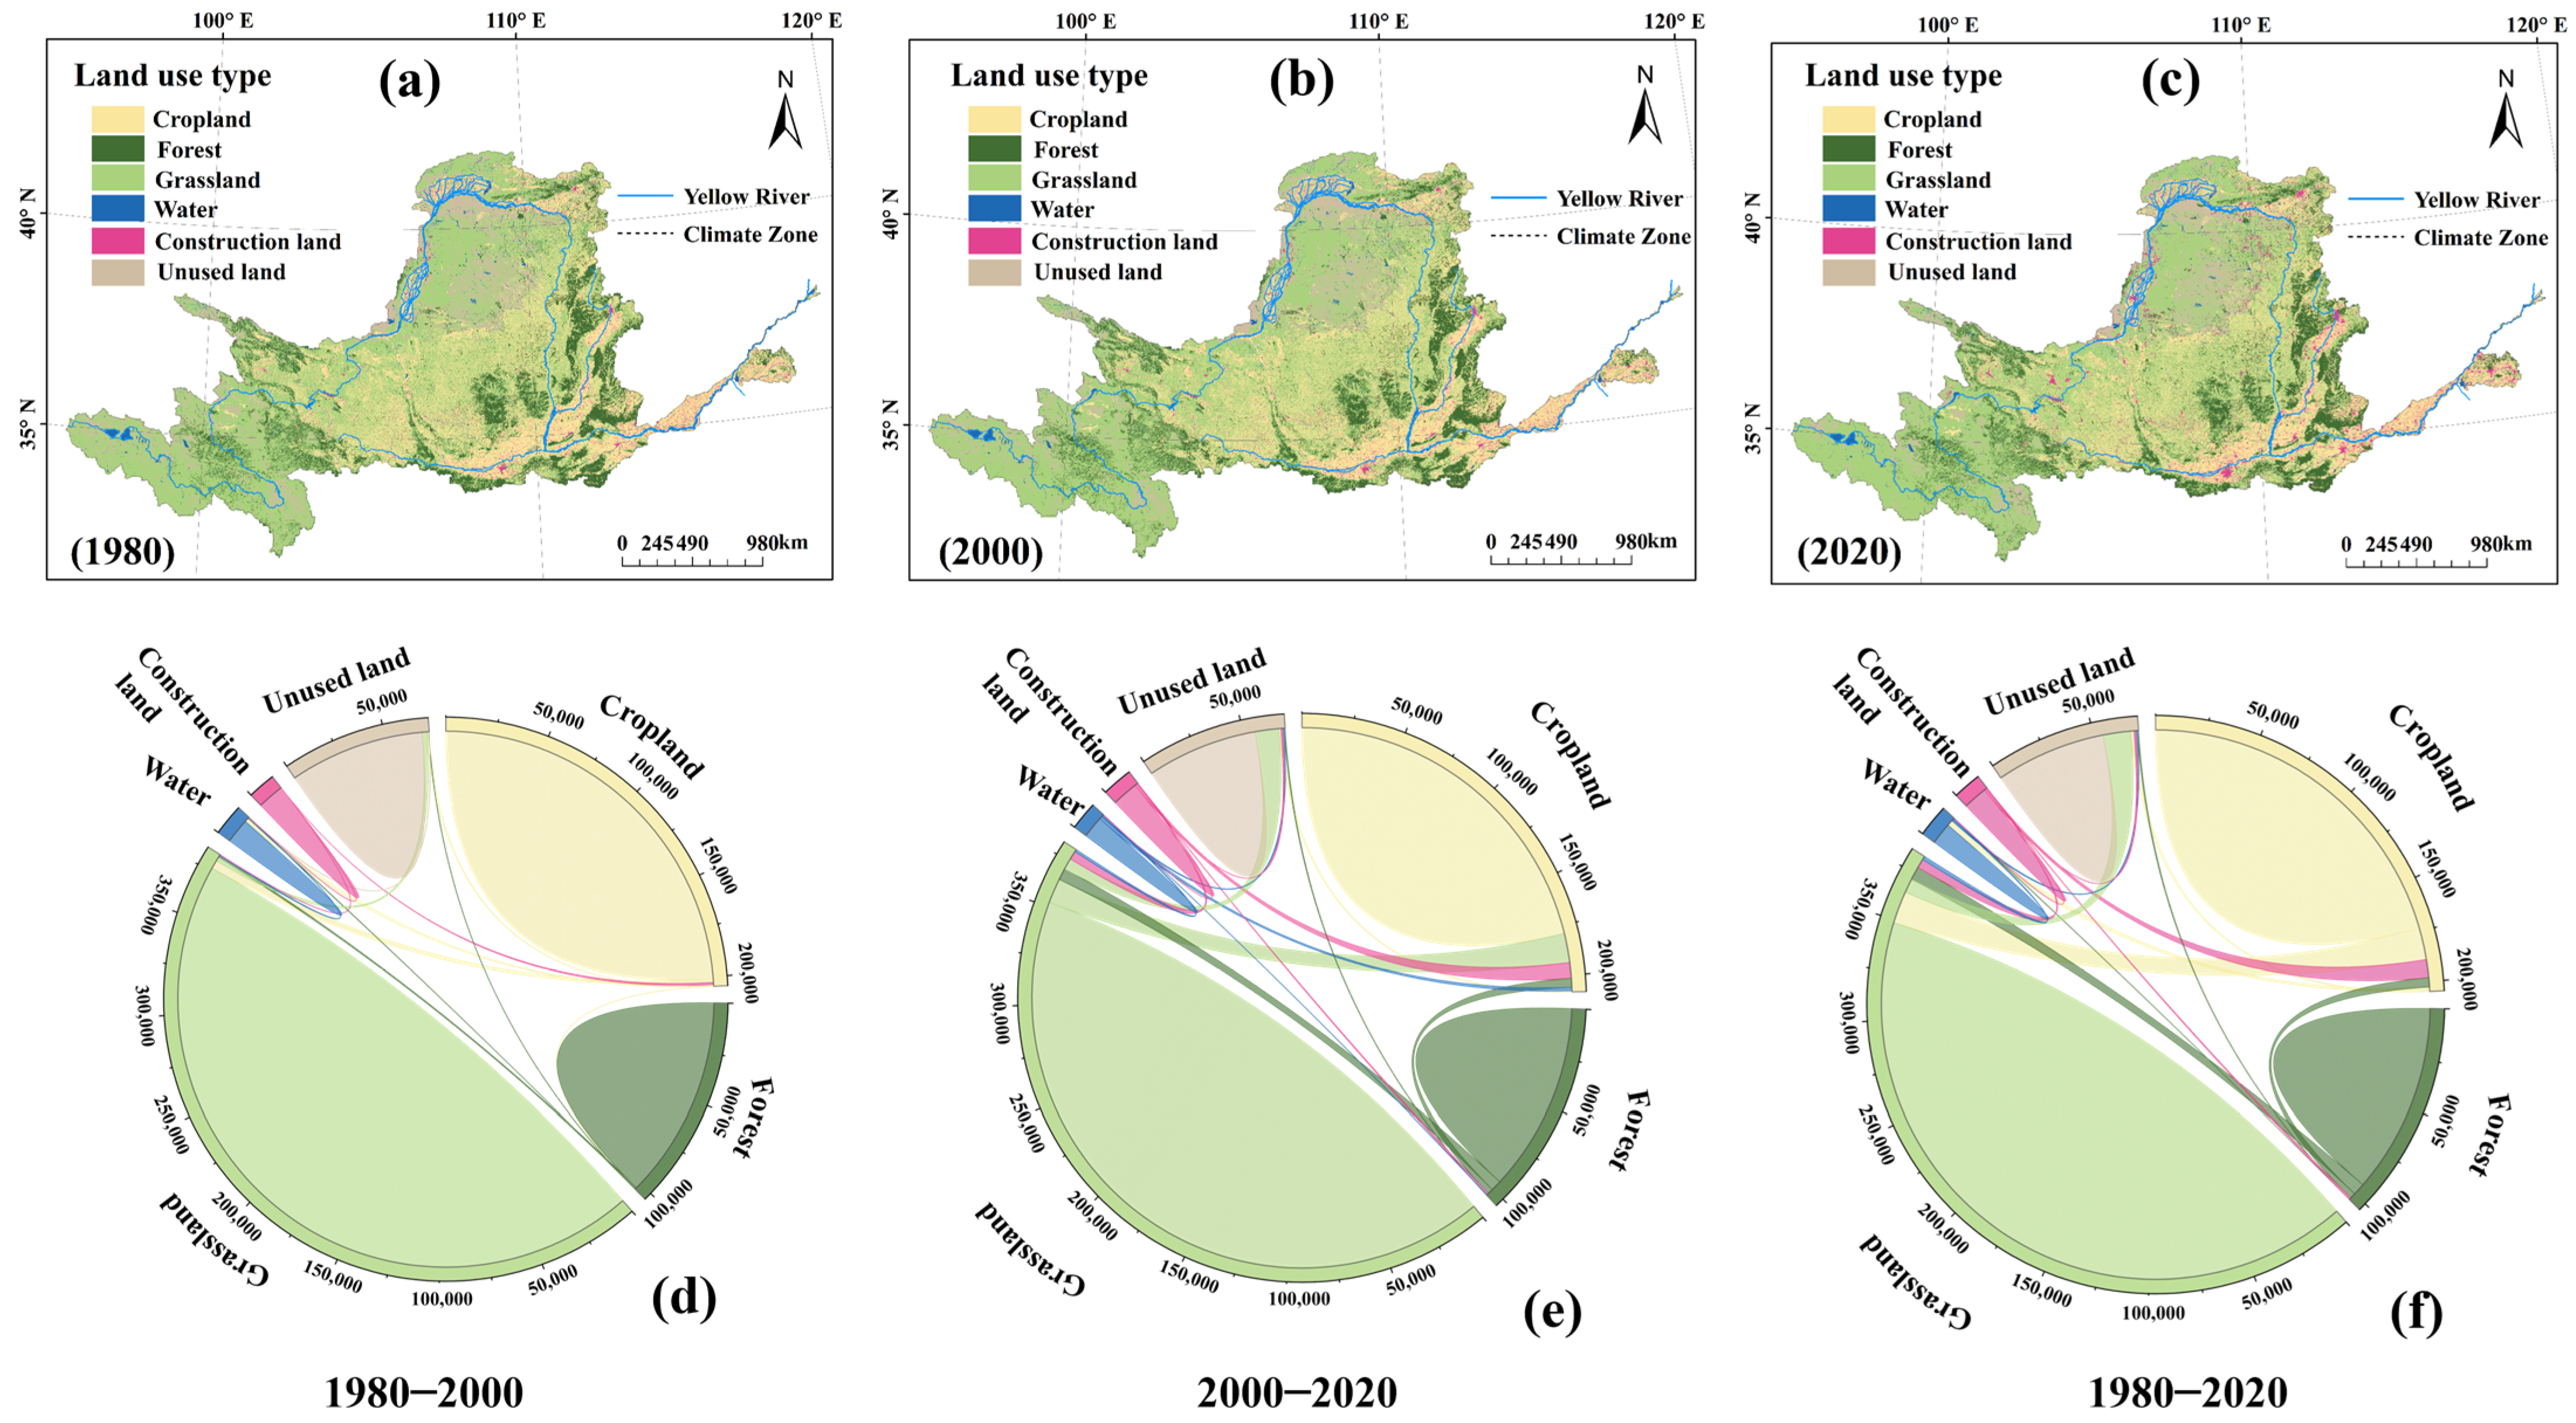
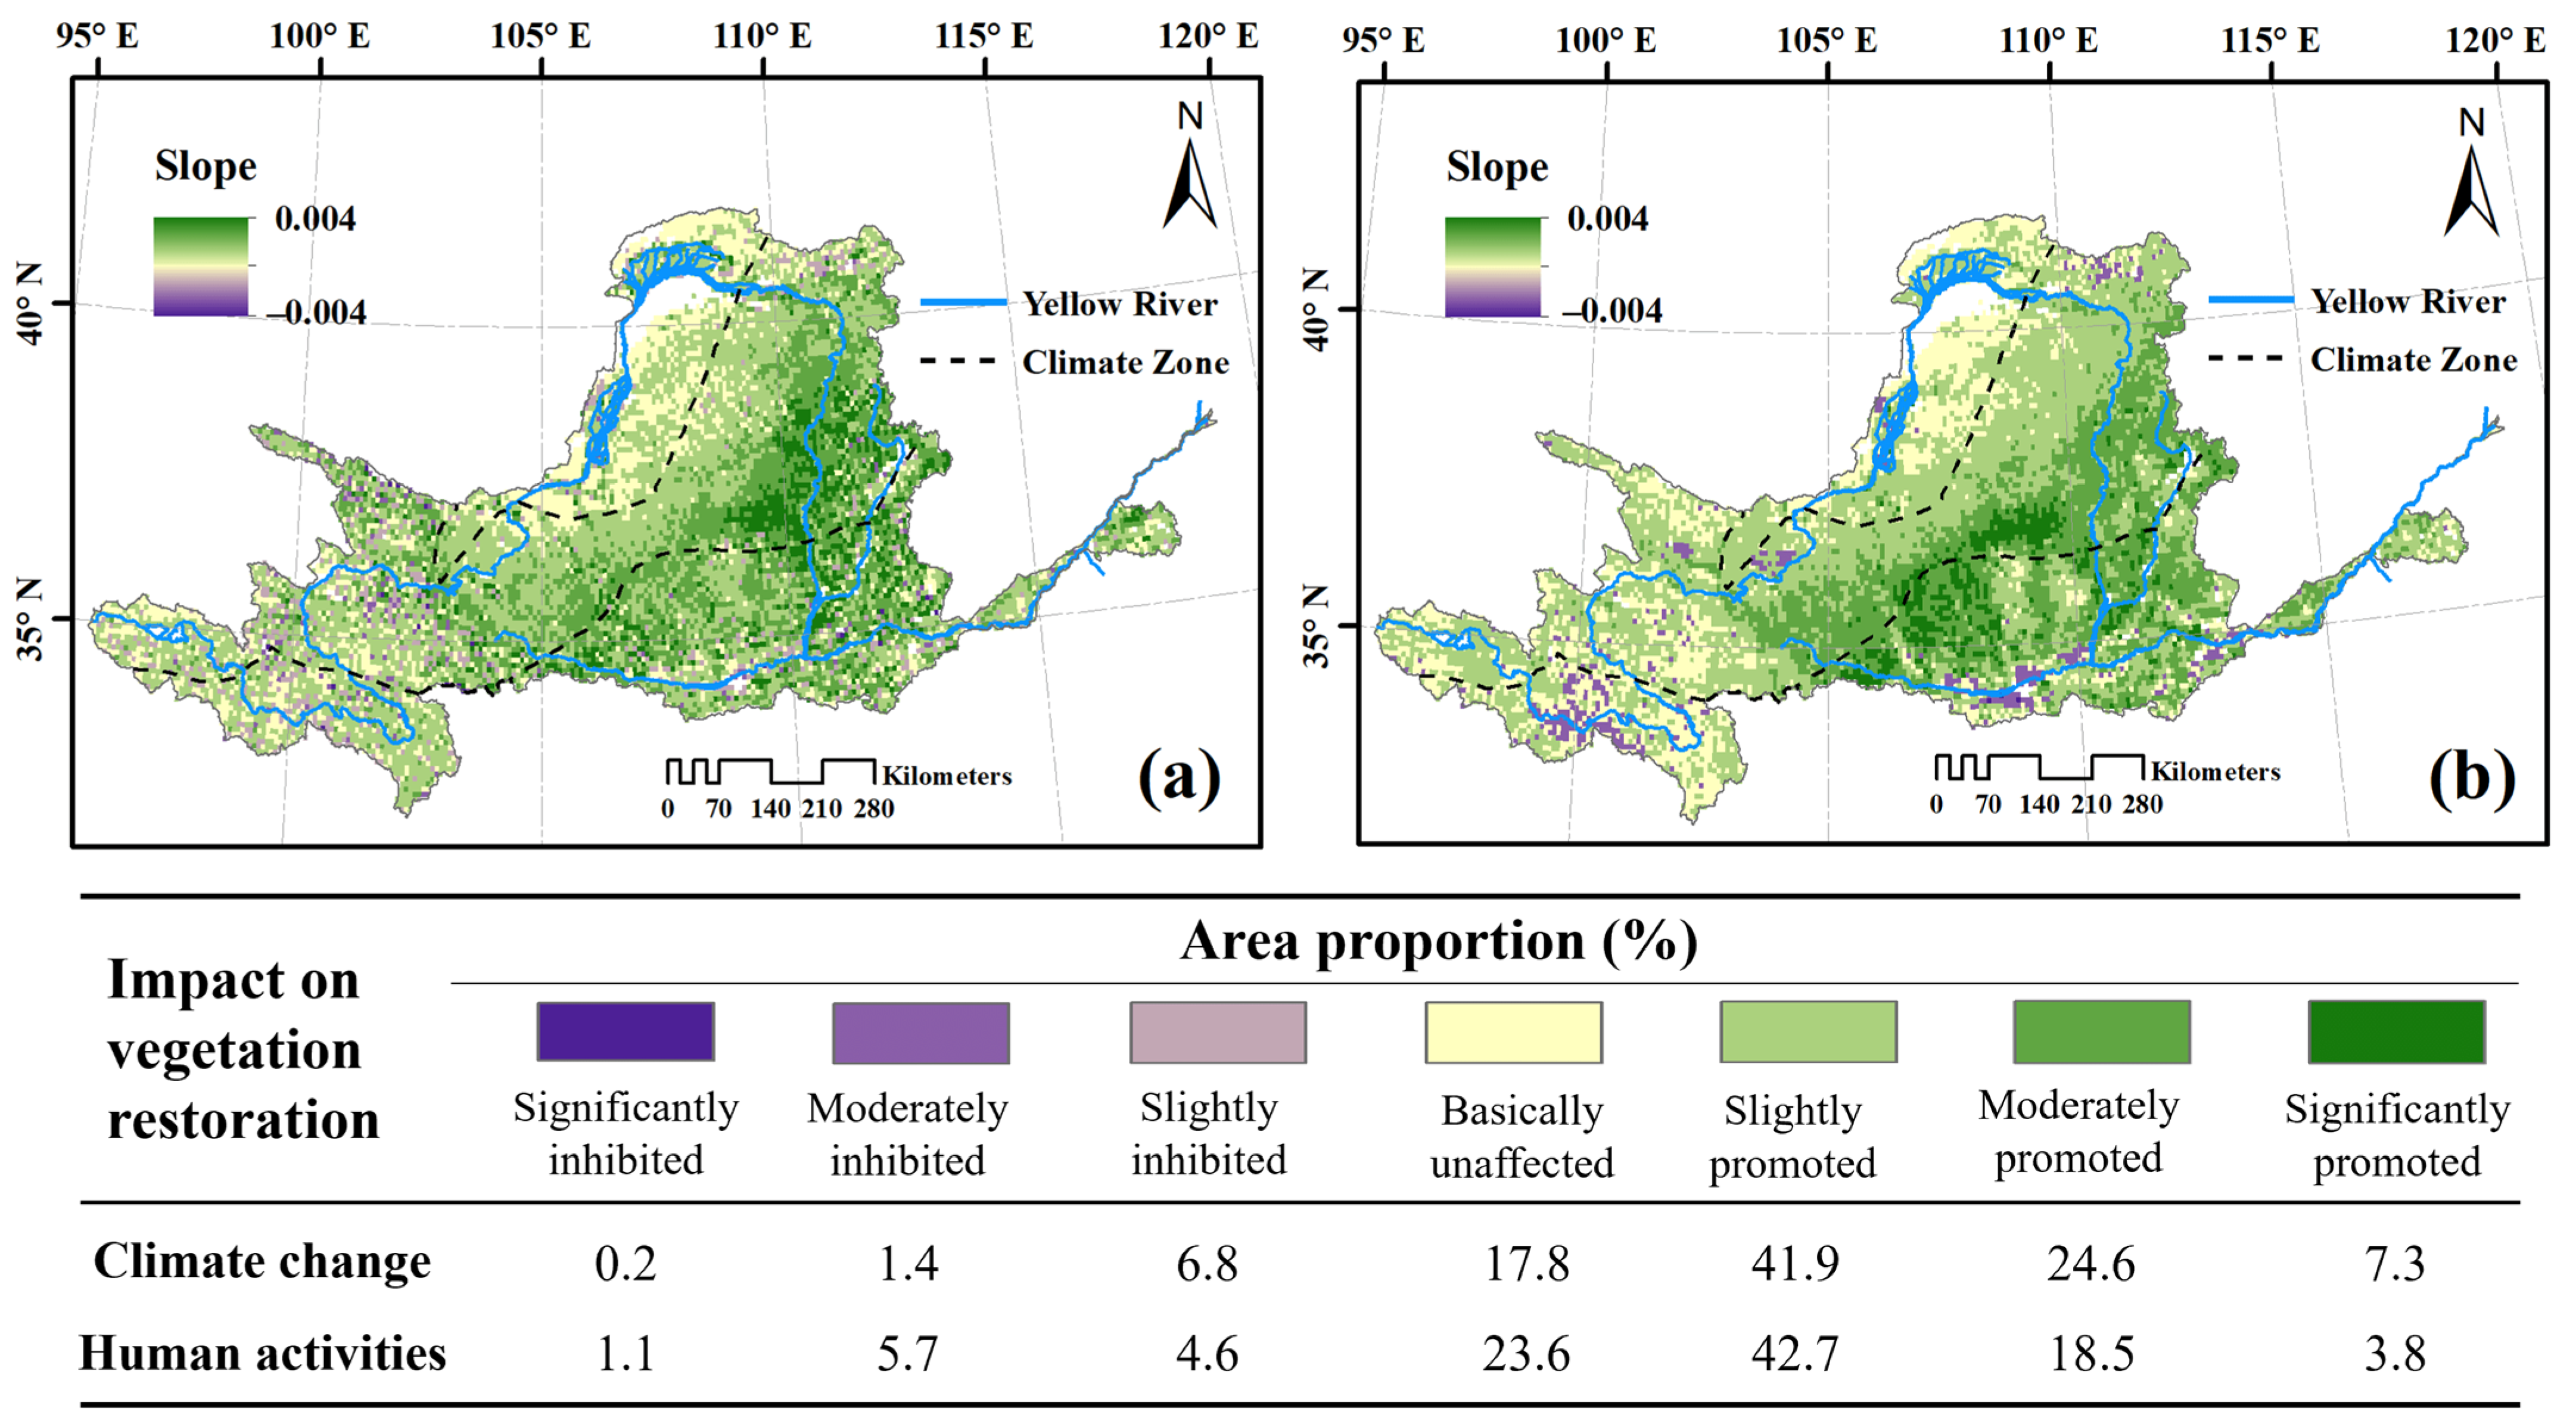
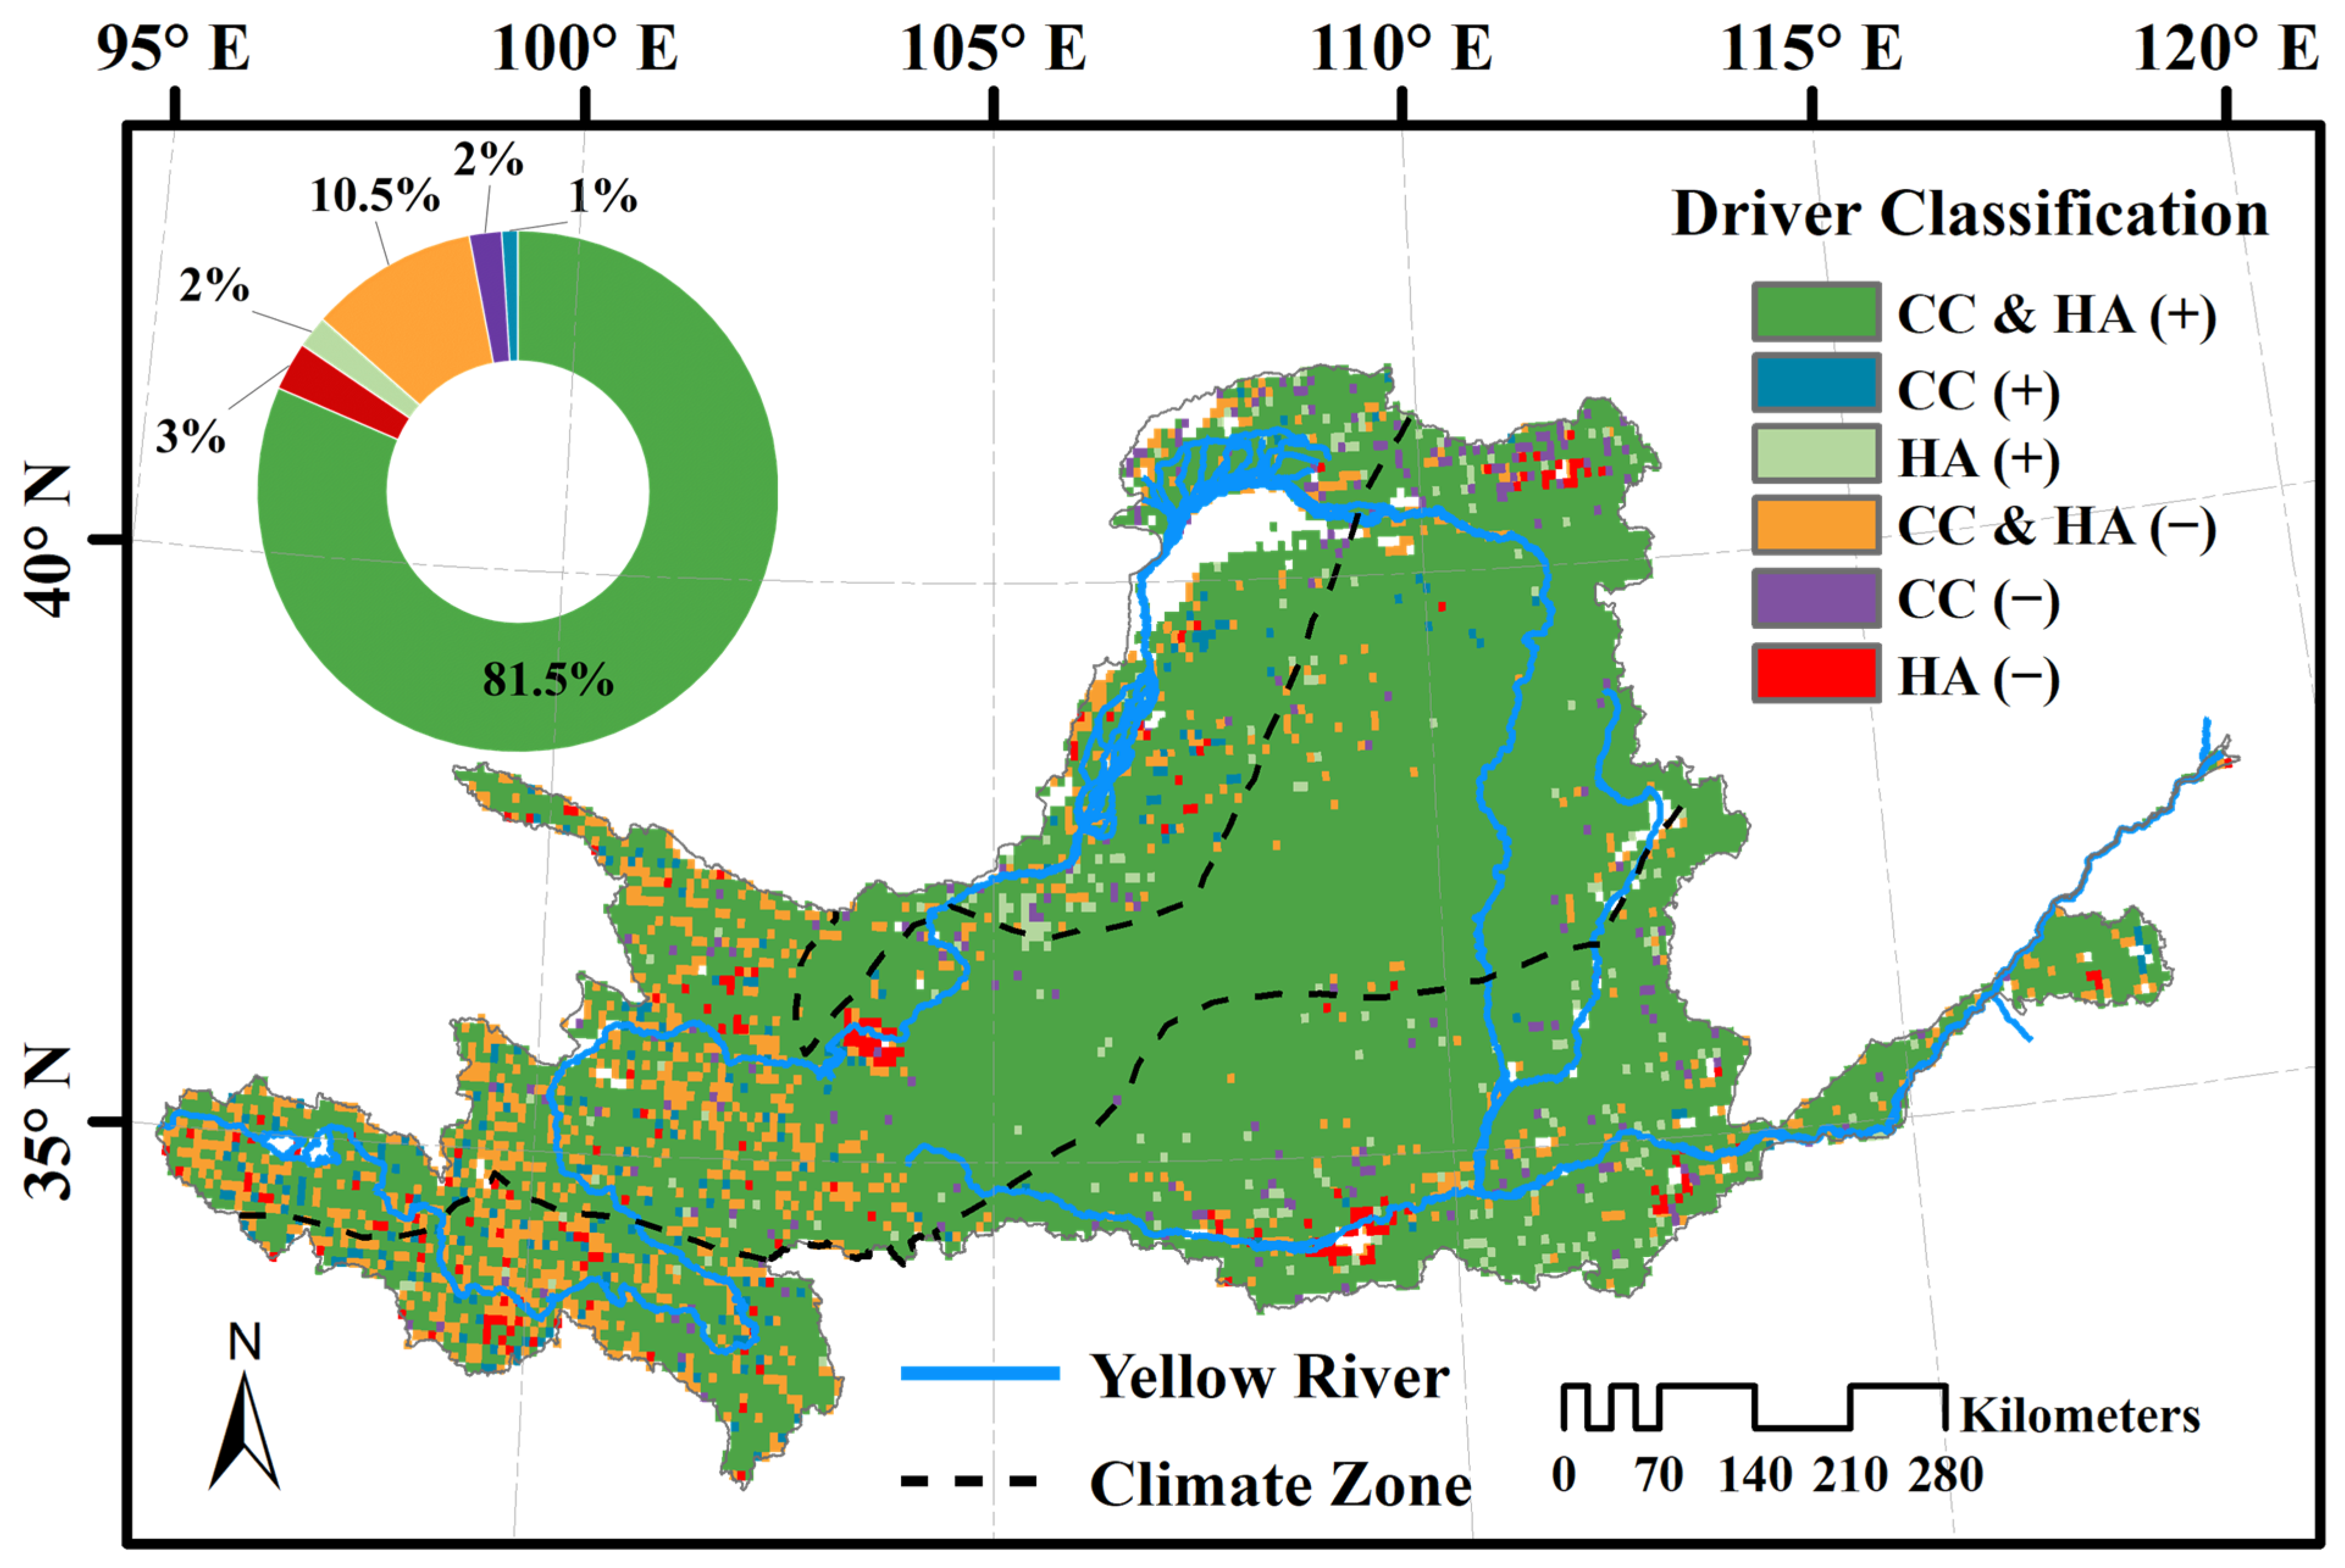
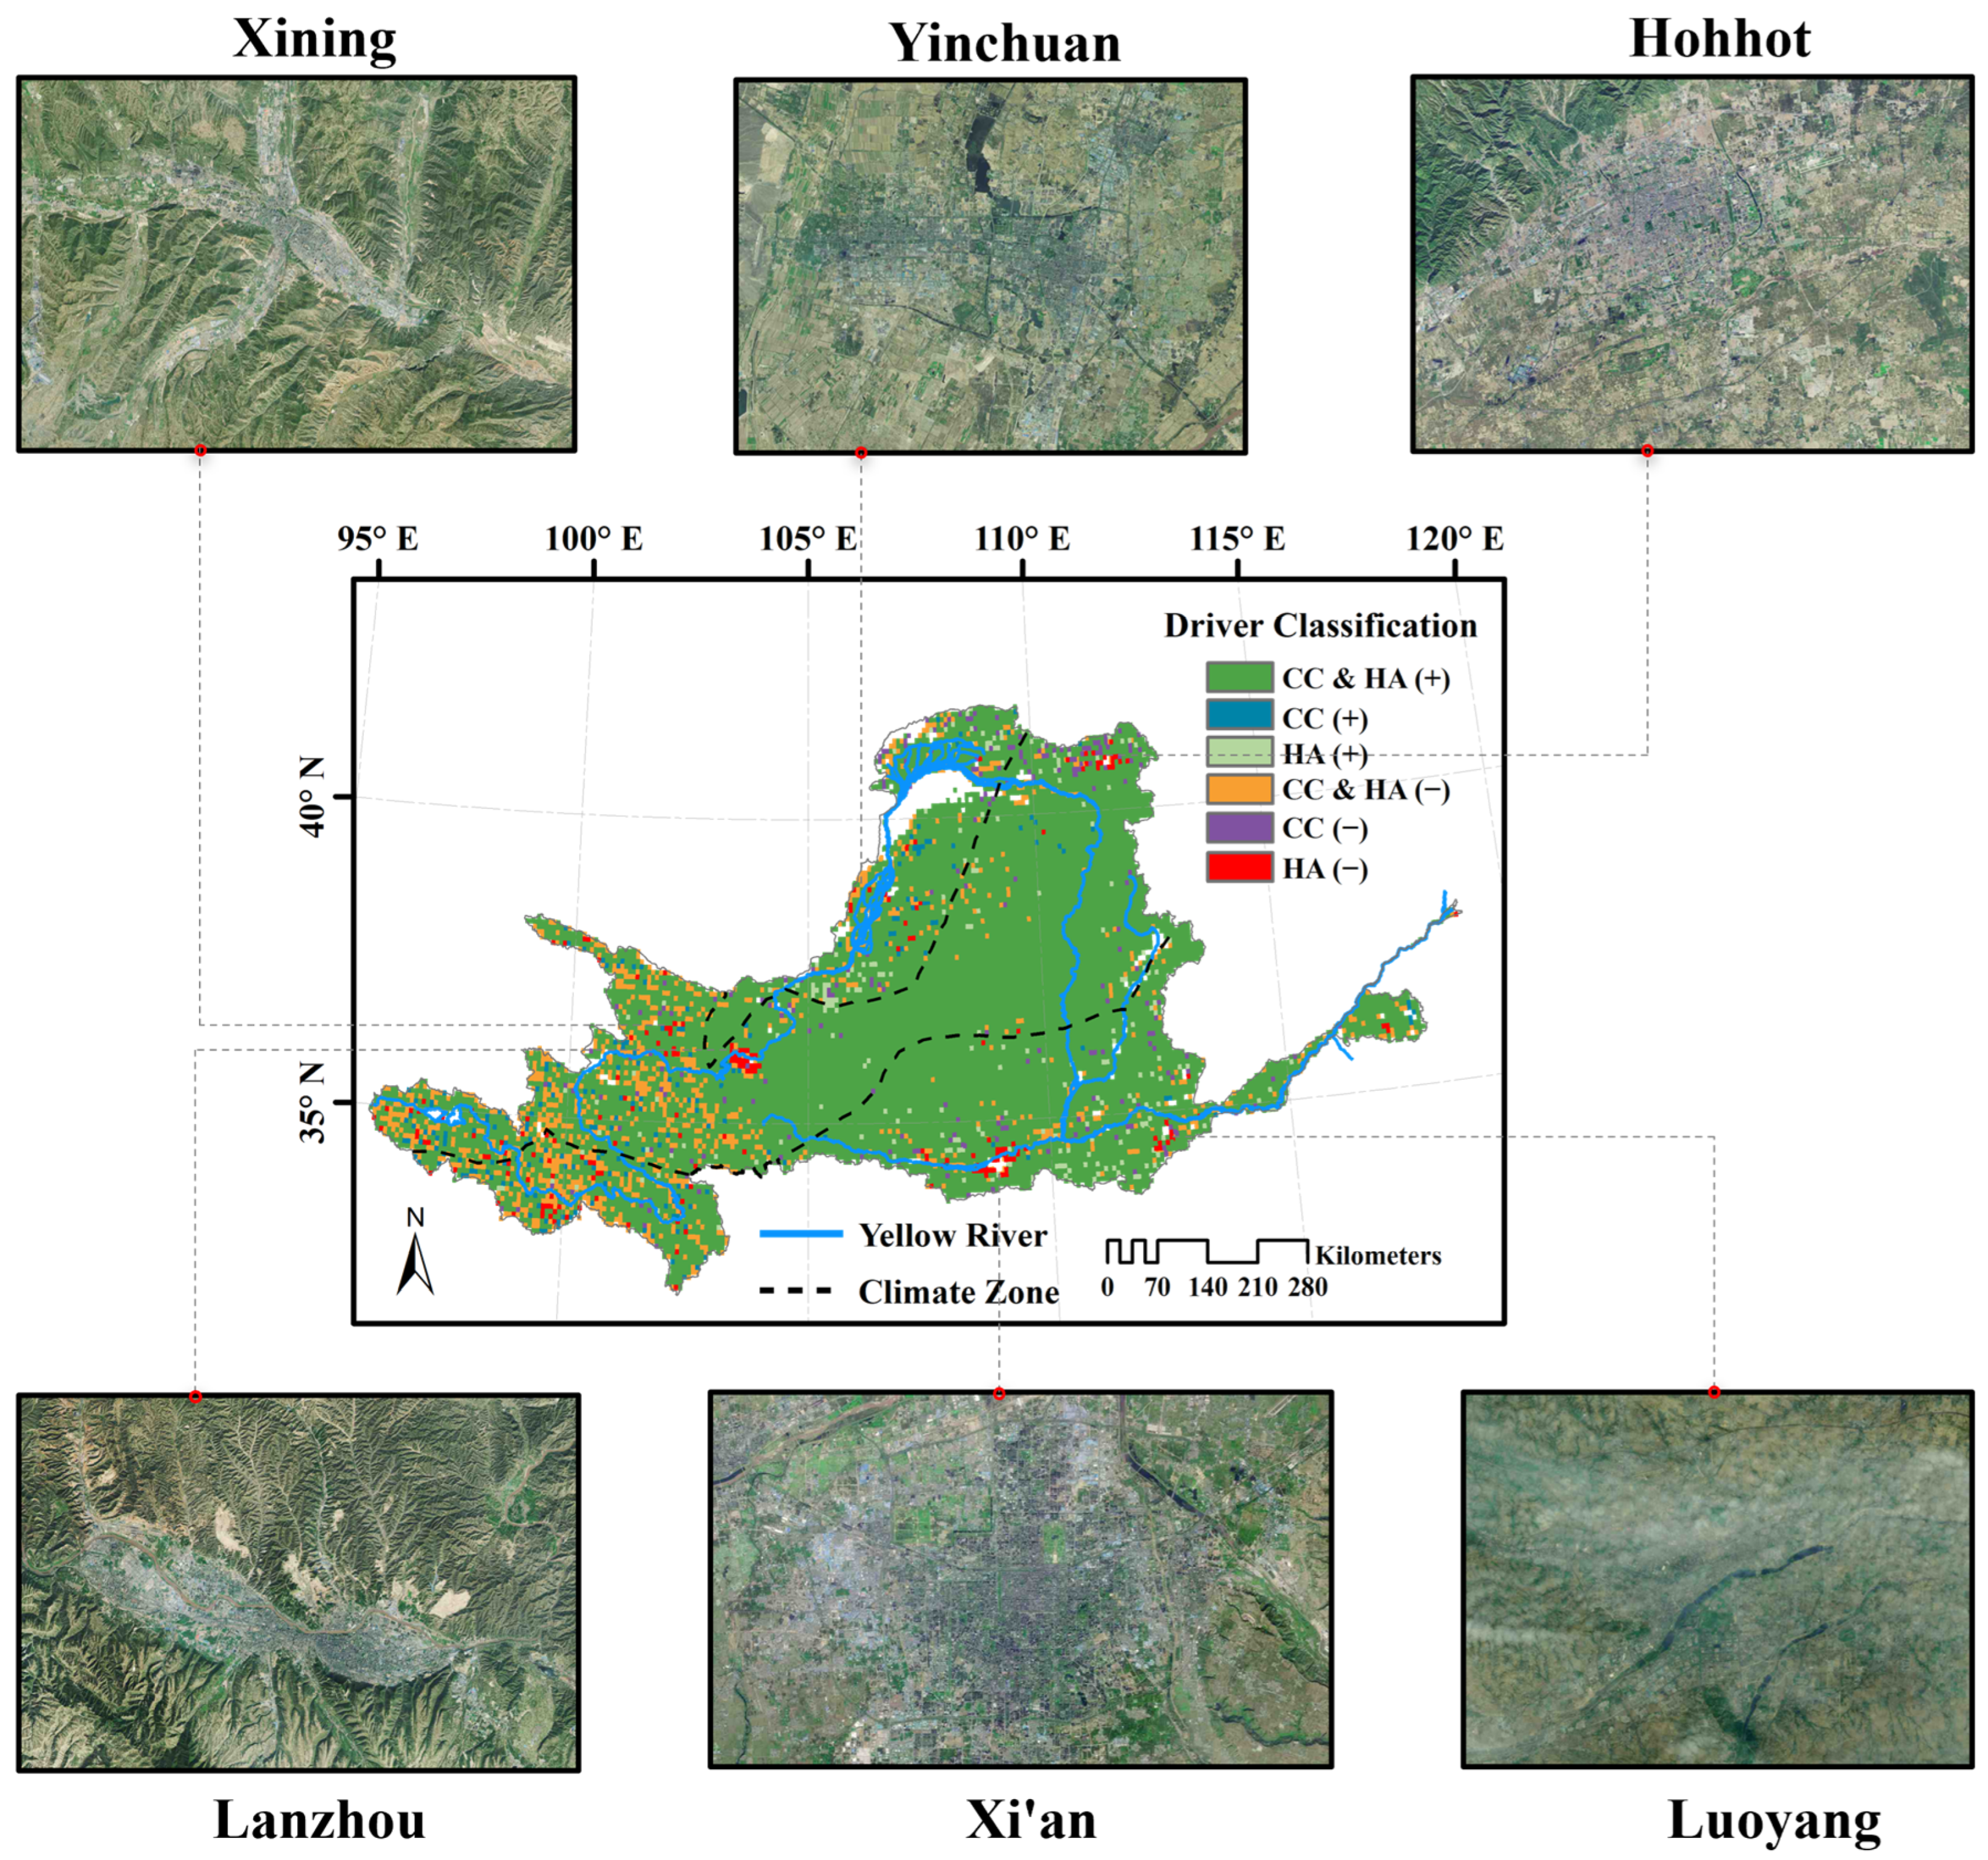
3.4. Climatic and Anthropogenic Effect on kNDVI

Furthermore, we quantitatively distinguished the relative contributions of CC and HA to vegetation dynamics in the YRB, based on the residual analysis method. As illustrated in Figure 6, clear spatial heterogeneity was observed in the effects of CC and HA on kNDVI changes in the basin. Overall, 66.5% of the vegetated areas in the YRB demonstrated insignificant effects of CC on the kNDVI changes, dominated by a slight facilitating effect. Climate change contributed to an increase in kNDVI in 73.8% of the areas of the YRB, of which 31.9% showed moderate and significant effects, primarily distributed in the eastern basin. In contrast, climate change suppressed kNDVI in 8.4% of the vegetated areas, with moderate and significant suppression in less than 2% of the vegetated areas, mainly located in urban areas (Figure 6a). Anthropogenic activities contributed to the increase in kNDVI in about 65% of vegetated areas, of which 22.3% were moderate and significant contributions, especially in the southeastern basin (Figure 6b). However, the area where HA clearly inhibited the increase in kNDVI accounted for 6.8% and was mostly located in the alpine zone and large cities (e.g., Xi’an, Yinchuan, etc.).
Figure 7 reveals that the combined effect of CC and HA primarily drove the vegetation dynamics in the YRB, dominating the kNDVI variations in 92% of the vegetated areas. The increase in kNDVI that was independently caused by climate change affected 3% of the area of the YRB, mostly in alpine areas, while the increase independently affected by anthropogenic activities was seen in 5% of the vegetated area, mainly in urban areas. Additionally, 10.5% of the vegetated areas in the YRB featured the combined effects of CC and HA as the drivers of a reduction in kNDVI during the growing season, which was mainly concentrated in the alpine zone. Vegetation degradation caused by CC alone and HA alone accounted for 2% and 3%, respectively, in a scattered distribution.
Based on a contribution analysis framework (Table 3), we calculated and accounted for the relative contributions of CC and HA to vegetation dynamics in the YRB. Overall, the relative contributions of CC and HA to kNDVI variations were 55.8% and 44.2% in the YRB, respectively (Figure 8). Specifically, CC contributed positively to vegetation dynamics in 83.3% of the area of the YRB. Among them, there were larger areas with climate change-related contributions in the ranges of 40% to 60% and 60% to 80%, accounting for 34.7% and 33.3% of the total area, respectively. The area with a contribution rate of greater than 80% accounted for 6.1%, mostly being concentrated in the semi-arid zone. Approximately 17% of the area was negatively affected by CC as regards the kNDVI change in the YRB, of which 7.8% saw a contribution greater than 60%, predominantly in alpine and urban areas (Figure 8a). In contrast, HA contributed positively to kNDVI variations in over 82.1% of the area of the YRB, among which more than 65% of the area was affected in the ranges of 20% to 40% and 40% to 60%, while the area showing a contribution rate of more than 80% was concentrated in the LP. HA contributed negatively to the kNDVI changes in 18% of vegetated areas, with similar spatial distributions to those regarding the effects of climate change (Figure 8b).

4. Discussion

4.1. Spatiotemporal Trends of Vegetation Dynamics

From 1982 to 2022, the YRB underwent a significant vegetation greening process, with a tendency toward significant increases in kNDVI in over 80% of its vegetated areas. Compared with previous studies, a consistent and significant trend of vegetation greening was found in the basin, although there were differences in the rate and degree of increase in the vegetation index [48,64,65]. The reason for this difference may be attributed to the types and time periods of the vegetation indices adopted. Furthermore, the changes in kNDVI in the YRB were characterized by obvious phases [66,67]. Compared with the period before the GTGP was implemented, the vegetation condition of LP improved significantly, with the slope of change in kNDVI increasing from 0.0009 yr−1 (p < 0.05) to 0.0029 yr−1 (p < 0.001). This suggests that the implementation of the GTGP program has effectively improved the vegetation condition of LP, especially in semi-arid and semi-humid zones. In contrast, rapid urbanization has exacerbated vegetation degradation in urban areas (e.g., Xi’an, Yinchuan, etc.), emphasizing the need to harmonize the relationship between social development and ecological protection [68].

4.2. Impact of Climate Change on Vegetation Dynamics

Quantitatively identifying the primary drivers and their relative contributions to vegetation change is essential for comprehending the mechanisms underlying ecological shifts and for optimizing and adjusting ecological conservation strategies. Residual analysis revealed that a combination of CC and HA dominated vegetation dynamics in the YRB, with CC being the primary driver accounting for 55.8% of the vegetated areas of kNDVI variations. Consistent with some previous studies [69,70], we all found that long-term climate change dominated vegetation changes in the YRB, albeit with differences in the impact degree and extent. Possible explanations may include differences in the number of key climate factors employed (most studies only accounted for PRE and TEM) and the types and lengths of vegetation indices used (most studies utilized an NDVI from 1982 to 2015).
Different conditions of water, heat, and light have shaped the spatial variability of vegetation landscapes in the YRB [71]. Water availability is the primary limit to vegetation growth in the YRB since most of it features arid and semi-arid climates [72,73]. As shown in Figure 5a, 60.3% of the vegetated areas in the YRB showed a significant positive correlation between kNDVI and precipitation, indicating that the vegetation in the YRB is susceptible to water variability, which finding is consistent with other studies in the region [42,74,75]. Conversely, only 9.3% of the vegetated areas displayed a significant negative correlation between kNDVI and precipitation, primarily concentrated in the alpine areas of the upper basin and in irrigation areas such as the Hetao and the Fenwei Plain. In the alpine region, the climate is mainly characterized by cold and humidity, with low temperatures and low evapotranspiration, and vegetation growth is limited by temperature and radiation, while the cooling effect of precipitation also inhibits vegetation growth [65,76,77]. Anthropogenic irrigation ensures the water supply to irrigated areas in the YRB, while cloudy and rainy days often lead to increased cloud cover, reducing radiation and thereby inhibiting vegetation photosynthesis [67,78]. Temperature largely controls vegetation growth in the upper alpine regions of the watershed and in non-water-limited areas, such as irrigation districts, and warming may promote vegetation growth, influencing vegetation phenology by lengthening the growing season and providing the necessary heat for vegetation growth [79,80]. However, increased temperatures may enhance evapotranspiration in water-limited zones (especially in arid zones), resulting in reduced water availability and, thus, inhibiting vegetation growth [81]. Increased solar radiation benefits vegetation greening in alpine regions but leads to increased evapotranspiration, which is detrimental to vegetation growth in arid and semi-arid regions [8]. In contrast to the spatial pattern of precipitation effects on vegetation, potential evapotranspiration had a significant negative effect on most of the vegetated zones, except for alpine and non-moisture-limited zones, where it promoted vegetation growth. Of note, although vegetation restoration will improve regional warming and humidification, the increased evapotranspiration (especially vegetation transpiration) caused by large-scale vegetation growth may lead the YRB into a more severe state of water shortage. Feng et al. [82] identified that the current vegetation restoration in the LP is close to the threshold of the water resources’ carrying capacity. Therefore, comprehensive consideration should be given to the integrated demand for water production, consumption, and use in the YRB, and ecological protection strategies should be adjusted to balance the relationship between vegetation growth and available water resources.

4.3. Effects of Human Activities on Vegetation Dynamics

We found that anthropogenic activities contributed 44.2% to vegetation dynamics in the YRB, with significant contributions being concentrated in three regions: the LP in the southeastern YRB, the areas surrounding large and medium-sized cities, and the alpine region. Various anthropogenic impact zones feature distinct mechanisms that drive vegetation growth. Specifically, the GTGP, which was initiated in 1999, has been the primary driver of vegetation recovery in the YRB since the beginning of the 20th century [70,83,84]. Figure 9 illustrates that prior to the implementation of the GTGP (1980–2000), the main land-use conversion mode involved transforming forest land and grassland into cropland, totaling a net area of 2387 km2. Following the implementation of the GTGP (2000–2020), the predominant land-use change shifted from cropland to forest land and grassland, resulting in a net conversion area of 3954 km2. The conversion of land-use types between cropland, forest land, and grassland reveals the impact of ecological protection projects on regional vegetation restoration [85].
Moreover, rapid urbanization in the YRB has resulted in vegetation degradation within urban areas and in their surroundings over the past four decades [86,87]. Throughout this period, substantial areas of cropland have been converted into construction land to facilitate urbanization. Significant trends of vegetation degradation have been observed in major large and medium-sized cities, spanning from upstream to downstream, including Xining, Lanzhou, Yinchuan, Hohhot, Xi’an, and Luoyang (Figure 10). Furthermore, non-land use conversion-related human activities (e.g., grazing) constitute the primary cause of vegetation degradation, particularly in grassland ecosystems within the alpine areas of the upper watershed [88,89]. Therefore, the positive and negative effects of HA on vegetation growth should be correctly grasped in order to create an environment in which humans and nature coexist harmoniously.

4.4. Limitations and Uncertainties

Although we used the longest continuous kNDVI series that were available for vegetation detection and attribution in the YRB and improved the saturation phenomenon of traditional vegetation indices, some uncertainties and limitations are still present. Firstly, additional potential influences (e.g., atmospheric CO2, nitrogen deposition, etc.) should be considered beyond the four key climate drivers emphasized in this study. Secondly, we focused on the response of vegetation to contemporaneous climate change, ignoring possible climate time-lag and cumulative effects. Moreover, climate change commonly affects vegetation growth in a nonlinear manner, and the attribution of vegetation dynamics based on residual analysis presents limitations when considering such nonlinear correlations. Therefore, a comprehensive analytical framework that integrates the temporal and nonlinear effects of climate, as well as incorporating more potential influencing factors, represents a direction for future research.

5. Conclusions

In this study, based on the kNDVI and key climate variables (PRE, TEM, SR, and PET), using data spanning from 1982 to 2022, we utilized the multivariate statistical approach to analyze the spatiotemporal patterns of vegetation dynamics, identified the key climate variables driving vegetation change, and separated the relative contributions of climatic and anthropogenic effects on vegetation variations. The main findings are summarized below.
The YRB has experienced extensive vegetation greening over the past four decades, with 83.2% of the vegetated areas demonstrating a significant increase in kNDVI, and the slope of kNDVI being 0.029 yr−1 (p < 0.001) from 2000 to 2022, which contrasts with 0.009 yr−1 (p < 0.05) from 1982 to 1999. The Hurst index of kNDVI suggests a continued extensive greening trend, with approximately 83% of vegetated areas expected to continue greening in the future. The PRE had the greatest effects on kNDVI, driving 41.9% of the vegetation changes, especially in the arid zones. The TEM, as the second most dominant climate factor, caused 35.4% of the climate-related vegetation variation seen, most notably in the source and semi-humid zones. The SR accounted for 13% of the vegetation variations, particularly in the alpine zone. The PET had limited and scattered effects on vegetation dynamics. The combined effects of CC and HA primarily drove the vegetation dynamics in the YRB, representing the dominant cause of kNDVI variations in 92% of the vegetated areas. Overall, the relative contributions of CC and HA to kNDVI variations were 55.8% and 44.2%, respectively. Areas with high contributions of CC were primarily situated in alpine regions and arid to semi-arid areas of the southeastern YRB. Conversely, anthropogenic factors contributed significantly to vegetation variations in the LP, urban areas, and specific alpine zones. The findings provide valuable insights and offer a comprehensive understanding of the relationship between vegetation dynamics and climatic or anthropogenic factors in the YRB while providing a theoretical reference for adapting ecological protection strategies to mitigate the impacts of changing external environments.

Author Contributions

Conceptualization, S.J. and C.Z.; methodology, Q.Y. and S.J.; software, Q.Y.; validation, S.J. and C.Z.; formal analysis, H.Y. and Q.Y.; data curation, Q.Y. and B.Z.; writing—original draft preparation, H.Y.; writing—review and editing, C.Z. and S.J.; visualization, H.Y. and Q.Y.; supervision, C.Z., S.J. and B.Z.; funding acquisition, H.Y. and S.J. All authors have read and agreed to the published version of the manuscript.

Funding

This research was funded by the National Natural Science Foundation of China (52279041, 52309055), Fundamental Research Funds for the Central Universities (YJ202259), and the Sichuan Science and Technology Program (2021YFS0306, 2023YFN0024, 2023NZZJ0015, 2023NZZJ0021).

Data Availability Statement

The PKU GIMMS NDVI is available at https://doi.org/10.5281/zenodo.8253971, accessed on 10 December 2023. The 1-kilometer monthly precipitation dataset for China (1901–2022) is available at https://data.tpdc.ac.cn/zh-hans/data/faae7605-a0f2-4d18-b28f-5cee413766a2, accessed on 10 December 2023. The 1-kilometer monthly mean temperature dataset for China (1901–2022) is available at https://data.tpdc.ac.cn/zh-hans/data/71ab4677-b66c-4fd1-a004-b2a541c4d5bf, accessed on 10 December 2023. The Terra Climate data are available at https://developers.google.com/earthengine/datasets/catalog/IDAHO_EPSCOR_TERRACLIMATE?hl=en, accessed on 10 December 2023.

Conflicts of Interest

The authors declare no conflicts of interest.

References

  1. Haberl, H.; Erb, K.H.; Krausmann, F.; Gaube, V.; Bondeau, A.; Plutzar, C.; Gingrich, S.; Lucht, W.; Fischer-Kowalski, M. Quantifying and mapping the human appropriation of net primary production in earth’s terrestrial ecosystems. Proc. Natl. Acad. Sci. USA 2007, 104, 12942–12947. [Google Scholar] [CrossRef] [PubMed]
  2. Bonan, G.B.; Pollard, D.; Thompson, S.L. Effects of boreal forest vegetation on global climate. Nature 1992, 359, 716–718. [Google Scholar] [CrossRef]
  3. Herrmann, S.M.; Anyamba, A.; Tucker, C.J. Recent trends in vegetation dynamics in the African Sahel and their relationship to climate. Glob. Environ. Chang. 2005, 15, 394–404. [Google Scholar] [CrossRef]
  4. Hua, W.; Chen, H.; Zhou, L.; Xie, Z.; Qin, M.; Li, X.; Ma, H.; Huang, Q.; Sun, S. Observational quantification of climatic and human influences on vegetation greening in China. Remote Sens. 2017, 9, 425. [Google Scholar] [CrossRef]
  5. Chen, C.; Park, T.; Wang, X.; Piao, S.; Xu, B.; Chaturvedi, R.K.; Fuchs, R.; Brovkin, V.; Ciais, P.; Fensholt, R. China and India lead in greening of the world through land-use management. Nat. Sustain. 2019, 2, 122–129. [Google Scholar] [CrossRef] [PubMed]
  6. Nolan, C.; Overpeck, J.T.; Allen, J.R.; Anderson, P.M.; Betancourt, J.L.; Binney, H.A.; Brewer, S.; Bush, M.B.; Chase, B.M.; Cheddadi, R. Past and future global transformation of terrestrial ecosystems under climate change. Science 2018, 361, 920–923. [Google Scholar] [CrossRef] [PubMed]
  7. Wu, D.; Zhao, X.; Liang, S.; Zhou, T.; Huang, K.; Tang, B.; Zhao, W. Time-lag effects of global vegetation responses to climate change. Glob. Chang. Biol. 2015, 21, 3520–3531. [Google Scholar] [CrossRef] [PubMed]
  8. Ren, H.; Wen, Z.; Liu, Y.; Lin, Z.; Han, P.; Shi, H.; Wang, Z.; Su, T. Vegetation response to changes in climate across different climate zones in China. Ecol. Indic. 2023, 155, 110932. [Google Scholar] [CrossRef]
  9. Zhan, C.; Liang, C.; Zhao, L.; Jiang, S.; Niu, K.; Zhang, Y.; Cheng, L. Detection and attribution of vegetation dynamics in the National Barrier Zone of China by considering climate temporal effects. Int. J. Appl. Earth Obs. Geoinf. 2023, 116, 103140. [Google Scholar] [CrossRef]
  10. Piao, S.; Friedlingstein, P.; Ciais, P.; Zhou, L.; Chen, A. Effect of climate and CO2 changes on the greening of the Northern Hemisphere over the past two decades. Geophys. Res. Lett. 2006, 33, L23402. [Google Scholar] [CrossRef]
  11. Peng, X.; Zhang, T.; Frauenfeld, O.W.; Wang, S.; Qiao, L.; Du, R.; Mu, C. Northern Hemisphere greening in association with warming permafrost. J. Geophys. Res. Biogeosci. 2020, 125, e2019JG005086. [Google Scholar] [CrossRef]
  12. Ernakovich, J.G.; Hopping, K.A.; Berdanier, A.B.; Simpson, R.T.; Kachergis, E.J.; Steltzer, H.; Wallenstein, M.D. Predicted responses of arctic and alpine ecosystems to altered seasonality under climate change. Glob. Chang. Biol. 2014, 20, 3256–3269. [Google Scholar] [CrossRef] [PubMed]
  13. Liu, X.; Zhu, X.; Pan, Y.; Zhu, W.; Zhang, J.; Zhang, D. Thermal growing season and response of alpine grassland to climate variability across the Three-Rivers Headwater Region, China. Agric. For. Meteorol. 2016, 220, 30–37. [Google Scholar] [CrossRef]
  14. Porporato, A.; Laio, F.; Ridolfi, L.; Rodriguez-Iturbe, I. Plants in water-controlled ecosystems: Active role in hydrologic processes and response to water stress: III. Vegetation water stress. Adv. Water Resour. 2001, 24, 725–744. [Google Scholar] [CrossRef]
  15. Bodner, G.; Nakhforoosh, A.; Kaul, H.-P. Management of crop water under drought: A review. Agron. Sustain. Dev. 2015, 35, 401–442. [Google Scholar] [CrossRef]
  16. Lian, X.; Piao, S.; Chen, A.; Huntingford, C.; Fu, B.; Li, L.Z.; Huang, J.; Sheffield, J.; Berg, A.M.; Keenan, T.F. Multifaceted characteristics of dryland aridity changes in a warming world. Nat. Rev. Earth Environ. 2021, 2, 232–250. [Google Scholar] [CrossRef]
  17. Wu, K.; Chen, J.; Yang, H.; Yang, Y.; Hu, Z. Spatiotemporal Variations in the Sensitivity of Vegetation Growth to Typical Climate Factors on the Qinghai–Tibet Plateau. Remote Sens. 2023, 15, 2355. [Google Scholar] [CrossRef]
  18. Sun, R.; Chen, S.; Su, H. Climate dynamics of the spatiotemporal changes of vegetation NDVI in northern China from 1982 to 2015. Remote Sens. 2021, 13, 187. [Google Scholar] [CrossRef]
  19. Jiang, P.; Ding, W.; Yuan, Y.; Ye, W.; Mu, Y. Interannual variability of vegetation sensitivity to climate in China. J. Environ. Manag. 2022, 301, 113768. [Google Scholar] [CrossRef]
  20. Zhang, L.; Dawes, W.; Walker, G. Response of mean annual evapotranspiration to vegetation changes at catchment scale. Water Resour. Res. 2001, 37, 701–708. [Google Scholar] [CrossRef]
  21. Ning, T.; Li, Z.; Liu, W. Vegetation dynamics and climate seasonality jointly control the interannual catchment water balance in the Loess Plateau under the Budyko framework. Hydrol. Earth Syst. Sci. 2017, 21, 1515–1526. [Google Scholar] [CrossRef]
  22. Rozelle, S.; Huang, J.; Benziger, V. Forest exploitation and protection in reform China: Assessing the impacts of policy and economic growth. In China’s Forests; Routledge: Abingdon, UK, 2015; pp. 109–133. [Google Scholar]
  23. Lü, Y.; Zhang, L.; Feng, X.; Zeng, Y.; Fu, B.; Yao, X.; Li, J.; Wu, B. Recent ecological transitions in China: Greening, browning and influential factors. Sci. Rep. 2015, 5, 8732. [Google Scholar] [CrossRef] [PubMed]
  24. Wang, Y.; Guo, C.-H.; Chen, X.-j.; Jia, L.-Q.; Guo, X.-N.; Chen, R.-S.; Zhang, M.-S.; Chen, Z.-Y.; Wang, H.-D. Carbon peak and carbon neutrality in China: Goals, implementation path and prospects. China Geol. 2021, 4, 720–746. [Google Scholar] [CrossRef]
  25. Kumar, R.; Kumar, A.; Saikia, P. Deforestation and forests degradation impacts on the environment. In Environmental Degradation: Challenges and Strategies for Mitigation; Springer: Berlin/Heidelberg, Germany, 2022; pp. 19–46. [Google Scholar]
  26. Wang, H.; Liu, Y.; Wang, Y.; Yao, Y.; Wang, C. Land cover change in global drylands: A review. Sci. Total Environ. 2023, 863, 160943. [Google Scholar] [CrossRef] [PubMed]
  27. Yang, K.; Sun, W.; Luo, Y.; Zhao, L. Impact of urban expansion on vegetation: The case of China (2000–2018). J. Environ. Manag. 2021, 291, 112598. [Google Scholar] [CrossRef] [PubMed]
  28. Bannari, A.; Morin, D.; Bonn, F.; Huete, A. A review of vegetation indices. Remote Sens. Rev. 1995, 13, 95–120. [Google Scholar] [CrossRef]
  29. Zeng, Y.; Hao, D.; Huete, A.; Dechant, B.; Berry, J.; Chen, J.M.; Joiner, J.; Frankenberg, C.; Bond-Lamberty, B.; Ryu, Y. Optical vegetation indices for monitoring terrestrial ecosystems globally. Nat. Rev. Earth Environ. 2022, 3, 477–493. [Google Scholar]
  30. Peng, W.; Kuang, T.; Tao, S. Quantifying influences of natural factors on vegetation NDVI changes based on geographical detector in Sichuan, western China. J. Clean. Prod. 2019, 233, 353–367. [Google Scholar] [CrossRef]
  31. Eastman, J.R.; Sangermano, F.; Machado, E.A.; Rogan, J.; Anyamba, A. Global trends in seasonality of normalized difference vegetation index (NDVI), 1982–2011. Remote Sens. 2013, 5, 4799–4818. [Google Scholar] [CrossRef]
  32. Fensholt, R.; Proud, S.R. Evaluation of earth observation based global long term vegetation trends—Comparing GIMMS and MODIS global NDVI time series. Remote Sens. Environ. 2012, 119, 131–147. [Google Scholar] [CrossRef]
  33. Jiao, W.; Wang, L.; Smith, W.K.; Chang, Q.; Wang, H.; D’Odorico, P. Observed increasing water constraint on vegetation growth over the last three decades. Nat. Commun. 2021, 12, 3777. [Google Scholar] [CrossRef] [PubMed]
  34. Thenkabail, P.S.; Smith, R.B.; De Pauw, E. Hyperspectral vegetation indices and their relationships with agricultural crop characteristics. Remote Sens. Environ. 2000, 71, 158–182. [Google Scholar] [CrossRef]
  35. Gao, X.; Huete, A.R.; Ni, W.; Miura, T. Optical–biophysical relationships of vegetation spectra without background contamination. Remote Sens. Environ. 2000, 74, 609–620. [Google Scholar] [CrossRef]
  36. Camps-Valls, G.; Campos-Taberner, M.; Moreno-Martínez, Á.; Walther, S.; Duveiller, G.; Cescatti, A.; Mahecha, M.D.; Muñoz-Marí, J.; García-Haro, F.J.; Guanter, L. A unified vegetation index for quantifying the terrestrial biosphere. Sci. Adv. 2021, 7, eabc7447. [Google Scholar] [CrossRef] [PubMed]
  37. Wang, Q.; Moreno-Martínez, Á.; Muñoz-Marí, J.; Campos-Taberner, M.; Camps-Valls, G. Estimation of vegetation traits with kernel NDVI. ISPRS J. Photogramm. Remote Sens. 2023, 195, 408–417. [Google Scholar] [CrossRef]
  38. Feng, X.; Tian, J.; Wang, Y.; Wu, J.; Liu, J.; Ya, Q.; Li, Z. Spatio-Temporal Variation and Climatic Driving Factors of Vegetation Coverage in the Yellow River Basin from 2001 to 2020 Based on kNDVI. Forests 2023, 14, 620. [Google Scholar] [CrossRef]
  39. Liu, T.; Zhang, Q.; Li, T.; Zhang, K. Dynamic Vegetation Responses to Climate and Land Use Changes over the Inner Mongolia Reach of the Yellow River Basin, China. Remote Sens. 2023, 15, 3531. [Google Scholar] [CrossRef]
  40. Forzieri, G.; Dakos, V.; McDowell, N.G.; Ramdane, A.; Cescatti, A. Emerging signals of declining forest resilience under climate change. Nature 2022, 608, 534–539. [Google Scholar] [CrossRef] [PubMed]
  41. Bellini, E.; Moriondo, M.; Dibari, C.; Leolini, L.; Staglianò, N.; Stendardi, L.; Filippa, G.; Galvagno, M.; Argenti, G. Impacts of Climate Change on European Grassland Phenology: A 20-Year Analysis of MODIS Satellite Data. Remote Sens. 2022, 15, 218. [Google Scholar] [CrossRef]
  42. Zhan, C.; Liang, C.; Zhao, L.; Jiang, S.; Niu, K.; Zhang, Y. Drought-related cumulative and time-lag effects on vegetation dynamics across the Yellow River Basin, China. Ecol. Indic. 2022, 143, 109409. [Google Scholar] [CrossRef]
  43. Han, Z.; Wu, Q.; Lai, R.; Soomro, S.-e.-h.; Hou, D.; Hu, C. Spatio-temporal variations of vegetation cover and its influence on surface air temperature change over the Yellow River Basin, China. J. Water Clim. Chang. 2022, 13, 3239–3252. [Google Scholar] [CrossRef]
  44. Jin, K.; Wang, F.; Zong, Q.; Qin, P.; Liu, C.; Wang, S. Spatiotemporal differences in climate change impacts on vegetation cover in China from 1982 to 2015. Environ. Sci. Pollut. Res. 2022, 29, 10263–10276. [Google Scholar] [CrossRef]
  45. Tian, F.; Liu, L.-Z.; Yang, J.-H.; Wu, J.-J. Vegetation greening in more than 94% of the Yellow River Basin (YRB) region in China during the 21st century caused jointly by warming and anthropogenic activities. Ecol. Indic. 2021, 125, 107479. [Google Scholar] [CrossRef]
  46. Li, Z.; Xue, H.; Dong, G.; Liu, X.; Lian, Y. Spatiotemporal Variation in Extreme Climate in the Yellow River Basin and its Impacts on Vegetation Coverage. Forests 2024, 15, 307. [Google Scholar] [CrossRef]
  47. Ren, Z.; Tian, Z.; Wei, H.; Liu, Y.; Yu, Y. Spatiotemporal evolution and driving mechanisms of vegetation in the Yellow River Basin, China during 2000–2020. Ecol. Indic. 2022, 138, 108832. [Google Scholar] [CrossRef]
  48. Jian, S.; Zhang, Q.; Wang, H. Spatial–temporal trends in and attribution analysis of vegetation change in the Yellow River Basin, China. Remote Sens. 2022, 14, 4607. [Google Scholar] [CrossRef]
  49. Cheng, Y.; Zhang, L.; Zhang, Z.; Li, X.; Wang, H.; Xi, X. Spatiotemporal variation and influence factors of vegetation cover in the Yellow River Basin (1982–2021) based on GIMMS NDVI and MOD13A1. Water 2022, 14, 3274. [Google Scholar] [CrossRef]
  50. Liu, Y.; Guo, B.; Lu, M.; Zang, W.; Yu, T.; Chen, D. Quantitative distinction of the relative actions of climate change and human activities on vegetation evolution in the Yellow River Basin of China during 1981–2019. J. Arid Land 2023, 15, 91–108. [Google Scholar] [CrossRef]
  51. Zhang, Y.; Ye, A. Quantitatively distinguishing the impact of climate change and human activities on vegetation in mainland China with the improved residual method. GISci. Remote Sens. 2021, 58, 235–260. [Google Scholar] [CrossRef]
  52. Tong, X.; Wang, K.; Yue, Y.; Brandt, M.; Liu, B.; Zhang, C.; Liao, C.; Fensholt, R. Quantifying the effectiveness of ecological restoration projects on long-term vegetation dynamics in the karst regions of Southwest China. Int. J. Appl. Earth Obs. Geoinf. 2017, 54, 105–113. [Google Scholar] [CrossRef]
  53. Li, J.; Xi, M.; Wang, L.; Li, N.; Wang, H.; Qin, F. Vegetation responses to climate change and anthropogenic activity in China, 1982 to 2018. Int. J. Environ. Res. Public Health 2022, 19, 7391. [Google Scholar] [CrossRef]
  54. Sun, R.; Chen, S.; Su, H. Trend analysis and driving factors of vegetation dynamics in northern China from 1982 to 2015. Remote Sens. 2022, 14, 6163. [Google Scholar] [CrossRef]
  55. Zheng, D. A study on the eco-geographic regional system of China. In Proceedings of the FAO FRA2000 Global Ecological Zoning Workshop, Cambridge, UK, 28–30 July 1999. [Google Scholar]
  56. Li, M.; Cao, S.; Zhu, Z.; Wang, Z.; Myneni, R.B.; Piao, S. Spatiotemporally consistent global dataset of the GIMMS Normalized Difference Vegetation Index (PKU GIMMS NDVI) from 1982 to 2022. Earth Syst. Sci. Data 2023, 15, 4181–4203. [Google Scholar] [CrossRef]
  57. Cai, Y.; Zhang, F.; Duan, P.; Jim, C.Y.; Chan, N.W.; Shi, J.; Liu, C.; Wang, J.; Bahtebay, J.; Ma, X. Vegetation cover changes in China induced by ecological restoration-protection projects and land-use changes from 2000 to 2020. Catena 2022, 217, 106530. [Google Scholar] [CrossRef]
  58. Peng, S.; Ding, Y.; Liu, W.; Li, Z. 1km monthly temperature and precipitation dataset for China from 1901 to 2017. Earth Syst. Sci. Data 2019, 11, 1931–1946. [Google Scholar] [CrossRef]
  59. Abatzoglou, J.T.; Dobrowski, S.Z.; Parks, S.A.; Hegewisch, K.C. TerraClimate, a high-resolution global dataset of monthly climate and climatic water balance from 1958–2015. Sci. Data 2018, 5, 170191. [Google Scholar] [CrossRef]
  60. Liu, Z.; Zhu, J.; Fu, H.; Zhou, C.; Zuo, T. Evaluation of the vertical accuracy of open global DEMs over steep terrain regions using ICESat data: A case study over Hunan Province, China. Sensors 2020, 20, 4865. [Google Scholar] [CrossRef]
  61. Xu, X.; Liu, J.; Zhang, S.; Li, R.; Yan, C.; Wu, S. China Multi Period Land Use Remote Sensing Monitoring Dataset (CNLUCC); Resource and Environmental Science Data Registration and Publishing System: Beijing, China, 2018. [Google Scholar]
  62. Hurst, H.E. Long-term storage capacity of reservoirs. Trans. Am. Soc. Civ. Eng. 1951, 116, 770–799. [Google Scholar] [CrossRef]
  63. Lou, J.; Xu, G.; Wang, Z.; Yang, Z.; Ni, S. Multi-year NDVI values as indicator of the relationship between spatiotemporal vegetation dynamics and environmental factors in the Qaidam Basin, China. Remote Sens. 2021, 13, 1240. [Google Scholar] [CrossRef]
  64. Jiang, W.; Yuan, L.; Wang, W.; Cao, R.; Zhang, Y.; Shen, W. Spatio-temporal analysis of vegetation variation in the Yellow River Basin. Ecol. Indic. 2015, 51, 117–126. [Google Scholar] [CrossRef]
  65. Zhan, C.; Liang, C.; Zhao, L.; Jiang, S.; Niu, K.; Zhang, Y.; Cheng, L. Vegetation dynamics and its response to climate change in the Yellow River Basin, China. Front. Environ. Sci. 2022, 10, 892747. [Google Scholar] [CrossRef]
  66. Li, G.; Sun, S.; Han, J.; Yan, J.; Liu, W.; Wei, Y.; Lu, N.; Sun, Y. Impacts of Chinese Grain for Green program and climate change on vegetation in the Loess Plateau during 1982–2015. Sci. Total Environ. 2019, 660, 177–187. [Google Scholar] [CrossRef]
  67. Cao, Y.; Li, H.; Liu, Y.; Zhang, Y.; Jiang, Y.; Dai, W.; Shen, M.; Guo, X.; Qi, W.; Li, L. Regional Contribution and Attribution of the Interannual Variation of Net Primary Production in the Yellow River Basin, China. Remote Sens. 2023, 15, 5212. [Google Scholar] [CrossRef]
  68. Yuan, M.; Wang, L.; Lin, A.; Liu, Z.; Li, Q.; Qu, S. Vegetation green up under the influence of daily minimum temperature and urbanization in the Yellow River Basin, China. Ecol. Indic. 2020, 108, 105760. [Google Scholar] [CrossRef]
  69. Zhang, W.; Wang, L.; Xiang, F.; Qin, W.; Jiang, W. Vegetation dynamics and the relations with climate change at multiple time scales in the Yangtze River and Yellow River Basin, China. Ecol. Indic. 2020, 110, 105892. [Google Scholar] [CrossRef]
  70. Li, W.; Zhou, J.; Xu, Z.; Liang, Y.; Shi, J.; Zhao, X. Climate impact greater on vegetation NPP but human enhance benefits after the Grain for Green Program in Loess Plateau. Ecol. Indic. 2023, 157, 111201. [Google Scholar] [CrossRef]
  71. Wang, X.; Shi, S.; Zhao, X.; Hu, Z.; Hou, M.; Xu, L. Detecting spatially non-stationary between vegetation and related factors in the Yellow River Basin from 1986 to 2021 using multiscale geographically weighted regression based on Landsat. Remote Sens. 2022, 14, 6276. [Google Scholar] [CrossRef]
  72. Zhao, A.; Wang, D.; Xiang, K.; Zhang, A. Vegetation photosynthesis changes and response to water constraints in the Yangtze River and Yellow River Basin, China. Ecol. Indic. 2022, 143, 109331. [Google Scholar] [CrossRef]
  73. Qin, G.; Meng, Z.; Fu, Y. Drought and water-use efficiency are dominant environmental factors affecting greenness in the Yellow River Basin, China. Sci. Total Environ. 2022, 834, 155479. [Google Scholar] [CrossRef]
  74. Ren, Y.; Liu, J.; Liu, S.; Wang, Z.; Liu, T.; Shalamzari, M.J. Effects of climate change on vegetation growth in the Yellow River Basin from 2000 to 2019. Remote Sens. 2022, 14, 687. [Google Scholar] [CrossRef]
  75. Jiang, W.; Niu, Z.; Wang, L.; Yao, R.; Gui, X.; Xiang, F.; Ji, Y. Impacts of drought and climatic factors on vegetation dynamics in the Yellow River Basin and Yangtze River Basin, China. Remote Sens. 2022, 14, 930. [Google Scholar] [CrossRef]
  76. Jiang, T.; Wang, X.; Afzal, M.M.; Sun, L.; Luo, Y. Vegetation Productivity and Precipitation Use Efficiency across the Yellow River Basin: Spatial Patterns and Controls. Remote Sens. 2022, 14, 5074. [Google Scholar] [CrossRef]
  77. Wang, S.; Zhang, B.; Yang, Q.; Chen, G.; Yang, B.; Lu, L.; Shen, M.; Peng, Y. Responses of net primary productivity to phenological dynamics in the Tibetan Plateau, China. Agric. For. Meteorol. 2017, 232, 235–246. [Google Scholar] [CrossRef]
  78. Shi, P.; Hou, P.; Gao, J.; Wan, H.; Wang, Y.; Sun, C. Spatial-temporal variation characteristics and influencing factors of vegetation in the Yellow River Basin from 2000 to 2019. Atmosphere 2021, 12, 1576. [Google Scholar] [CrossRef]
  79. Wang, Y.; Wang, X.; Wang, Q. Temporal and Spatial Changes of Vegetation Phenology and Their Response to Climate in the Yellow River Basin. IEEE Access 2023, 11, 141776–141788. [Google Scholar] [CrossRef]
  80. Wang, Y.; Luo, Y.; Shafeeque, M. Interpretation of vegetation phenology changes using daytime and night-time temperatures across the Yellow River Basin, China. Sci. Total Environ. 2019, 693, 133553. [Google Scholar] [CrossRef] [PubMed]
  81. Fu, J.; Gong, Y.; Zheng, W.; Zou, J.; Zhang, M.; Zhang, Z.; Qin, J.; Liu, J.; Quan, B. Spatial-temporal variations of terrestrial evapotranspiration across China from 2000 to 2019. Sci. Total Environ. 2022, 825, 153951. [Google Scholar] [CrossRef] [PubMed]
  82. Feng, X.; Fu, B.; Piao, S.; Wang, S.; Ciais, P.; Zeng, Z.; Lü, Y.; Zeng, Y.; Li, Y.; Jiang, X. Revegetation in China’s Loess Plateau is approaching sustainable water resource limits. Nat. Clim. Chang. 2016, 6, 1019–1022. [Google Scholar] [CrossRef]
  83. Wu, X.; Wang, S.; Fu, B.; Liu, J. Spatial variation and influencing factors of the effectiveness of afforestation in China’s Loess Plateau. Sci. Total Environ. 2021, 771, 144904. [Google Scholar] [CrossRef]
  84. Ni, X.; Guo, W.; Li, X.; Li, S. Heterogeneity of increases in net primary production under intensified human activity and climate variability on the Loess Plateau of China. Remote Sens. 2022, 14, 4706. [Google Scholar] [CrossRef]
  85. Zhang, Q.; Wang, G.; Yuan, R.; Singh, V.P.; Wu, W.; Wang, D. Dynamic responses of ecological vulnerability to land cover shifts over the Yellow River Basin, China. Ecol. Indic. 2022, 144, 109554. [Google Scholar] [CrossRef]
  86. Yang, M.; Gao, X.; Siddique, K.H.; Wu, P.; Zhao, X. Spatiotemporal exploration of ecosystem service, urbanization, and their interactive coercing relationship in the Yellow River Basin over the past 40 years. Sci. Total Environ. 2023, 858, 159757. [Google Scholar] [CrossRef] [PubMed]
  87. Zang, Y.; Yu, B.; Wu, C.; Zhao, Z. Spatiotemporal evolution of growing-season vegetation coverage and its natural-human drivers in the Yellow River Basin, China. Land Degrad. Dev. 2023, 34, 5849–5862. [Google Scholar] [CrossRef]
  88. Liang, S.; Ge, S.; Wan, L.; Xu, D. Characteristics and causes of vegetation variation in the source regions of the Yellow River, China. Int. J. Remote Sens. 2012, 33, 1529–1542. [Google Scholar] [CrossRef]
  89. Zhao, W.; Luo, T.; Wei, H.; Zhang, L. Relative impact of climate change and grazing on NDVI changes in grassland in the Mt. Qomolangma nature reserve and adjacent regions during 2000–2018. Diversity 2022, 14, 171. [Google Scholar] [CrossRef]
Figure 1. Spatial patterns of the multiyear average of climate variables and vegetation types in the Yellow River Basin. (a) Geographic location and elevation; (b) precipitation; (c) temperature; (d) solar radiation; (e) potential evapotranspiration; (f) land-use types in 2000.
Remotesensing 16 01280 g001
Figure 2. Spatial patterns of (a) multi-year average values and (b) the variation coefficient of growing season kNDVI in the Yellow River Basin from 1982 to 2022.
Remotesensing 16 01280 g002
Figure 3. (a) Interannual slopes of the kernel normalized difference vegetation index (kNDVI); spatial distribution of (b) kNDVI trend, (c) Hurst index for kNDVI, and (d) future kNDVI trends in the Yellow River Basin from 1982 to 2022.
Remotesensing 16 01280 g003
Figure 4. Spatial distribution of the (a) determination coefficient and (b) areas corresponding to significant relationships (p < 0.05) between the kernel normalized difference vegetation index (kNDVI) and the four main climate factors identified by the multiple regression model.
Remotesensing 16 01280 g004
Figure 5. Spatial patterns of partial correlation coefficients (PCC) between the kernel normalized difference vegetation index (kNDVI) and (a) precipitation, (b) temperature, (c) solar radiation, and (d) potential evapotranspiration. (e) Spatial patterns of the climate drivers dominating vegetation dynamics; (f) proportion of the controlled area of dominant climate drivers. Black dots represent significant correlations (p < 0.05).
Remotesensing 16 01280 g005
Figure 6. Spatial patterns of the impacts of (a) climate change and (b) human activities on vegetation dynamics in the Yellow River Basin from 1982 to 2022.
Remotesensing 16 01280 g006
Figure 7. Spatial distribution of the driver classifications of vegetation dynamics in the Yellow River Basin from 1982 to 2022. CC and HA denote climate change and human activities, respectively.
Remotesensing 16 01280 g007
Figure 8. Spatial distribution of the relative contributions of climatic change (a) and human activities (b) to vegetation dynamics in the Yellow River Basin from 1982 to 2022.
Remotesensing 16 01280 g008
Figure 9. Spatial distribution of land-use types in (a) 1980, (b) 2000, and (c) 2020, and land-use conversion in (d) 1980–2000, (e) 2000–2020, and (f) 1980–2020 in the Yellow River Basin (unit: km2). The colors in subfigures (df) are consistent with subfigures (ac), representing different land use types.
Remotesensing 16 01280 g009
Figure 10. Satellite images of major cities in the Yellow River Basin.
Remotesensing 16 01280 g010
Table 1. Dataset description for the present study.
Data TypesDatasetVariablesResolutionPeriodReference
NDVIPKU GIMMS NDVINDVIhalf-monthly/1/12°1982–2022[56]
Climate 1-km monthly precipitation/temperature dataset for China PREmonthly/1 km1901–2022[58]
TEM
TerraClimateSRmonthly/4 km1958–2022[59]
PET
TopographySRTM 90DEM90 m[60]
Land useLandsatLUCC30 m1980, 1990, 1995, 2000, 2005, 2008, 2010, 2013, 2015, 2018, and 2020[61]
Table 2. Classification of the climatic and anthropogenic effects on vegetation dynamics.
S l o p e p r e   or   S l o p e r e s (10 −3 yr−1)Degree of Impact
<−2.0Significantly inhibited
[−2.0, −1.0)Moderately inhibited
[−1.0, 0.2)Slightly inhibited
[−0.2, 0.2)Basically unaffected
[0.2, 1.0)Slightly promoted
[1.0, 2.0)Moderately promoted
≥2.0Significantly promoted
Note: S l o p e p r e and S l o p e r e s represent the climate change-related and anthropogenic-related trends in vegetation dynamics, respectively.
Table 3. Identification criteria and relative contribution calculation in relation to the drivers of vegetation dynamics in the Yellow River Basin.
Vegetation Change S l o p e o b s S l o p e p r e S l o p e r e s Relative Contribution
of Climate Change (%)
Relative Contribution
of Human Activities (%)
Greening>0<0>00100
>0>0<01000
>0>0>0 S l o p e p r e S l o p e o b s × 100 S l o p e r e s S l o p e o b s × 100
Degradation<0<0>01000
<0>0<00100
<0<0<0 S l o p e p r e S l o p e o b s × 100 S l o p e r e s S l o p e o b s × 100
Note: S l o p e o b s , S l o p e p r e , and S l o p e r e s represent observation-indicated, climate change-related, and anthropogenic-related trends in vegetation dynamics, respectively.
Disclaimer/Publisher’s Note: The statements, opinions and data contained in all publications are solely those of the individual author(s) and contributor(s) and not of MDPI and/or the editor(s). MDPI and/or the editor(s) disclaim responsibility for any injury to people or property resulting from any ideas, methods, instructions or products referred to in the content.

