Article

Changes in Vegetation NDVI and Its Response to Climate Change and Human Activities in the Ferghana Basin from 1982 to 2015

1
Institute of Desert Meteorology, China Meteorological Administration/Key Laboratory of Tree-Ring Physical and Chemical Research of China Meteorological Administration/Xinjiang Key Laboratory for Tree Ring Ecology, Urumqi 830002, China
2
Yunnan Key Laboratory of International Rivers and Transboundary Eco-Security, Institute of International Rivers and Eco-Security, Yunnan University, Kunming 650500, China
3
Meteorological Observatory of Xinjiang Uygur Autonomous Region, Urumqi 830002, China
4
Xinjiang Eco-Meteorological and Satellite Remote Sensing Center, Urumqi 830011, China
*
Author to whom correspondence should be addressed.
Remote Sens. 2024, 16(7), 1296; https://doi.org/10.3390/rs16071296
Submission received: 1 February 2024 / Revised: 30 March 2024 / Accepted: 2 April 2024 / Published: 6 April 2024

Abstract

:
Exploring the evolution of vegetation cover and its drivers in the Ferghana Basin helps to understand the current ecological status of the Ferghana Basin and to analyze the vegetation changes and drivers, with a view to providing a scientific basis for regional ecological and environmental management and planning. Based on GIMMS NDVI3g and meteorological data, the spatial and temporal evolution characteristics of NDVI were analyzed from multiple perspectives with the help of linear trend and Mann–Kendall (MK) test methods using arcgis and the R language spatial analysis module, combined with partial correlation coefficients and residual analysis methods to analyze the impacts of climate change and human activities on the regional vegetation cover of the Ferghana Basin from 1982 to 2015. NDVI driving forces. The results showed the following: (1) The growing season of vegetation NDVI in the Ferghana Basin showed an increasing trend in the 34-year period, with an increase rate of 0.0044/10a, and the spatial distribution was significantly different, which was high in the central part of the country and low in the northern and southern parts of the country. (2) Temperature and precipitation simultaneously co-influenced the vegetation NDVI growth season, with most of the temperature and precipitation contributing in the spring, most of the temperature in the summer being negatively phased and the precipitation positively correlated, and most of the temperature and precipitation in the fall inhibiting vegetation NDVI growth. (3) The combined effect of climate change and human activities was the main reason for the overall rapid increase and great spatial variations in vegetation NDVI in China, and the spatial distribution of drivers, namely human activities and climate change, contributed 44.6% to vegetation NDVI in the growing season. The contribution of climate change and human activities to vegetation NDVI in the Ferghana Basin was 62.32% and 93.29%, respectively. The study suggests that more attention should be paid to the role of human activities and climate change in vegetation restoration to inform ecosystem management and green development.

1. Introduction

As one of the most pressing global threats facing humanity, climate variation has already greatly influenced the earth’s natural environment and human community. Climate change is causing glacier melting and extreme weather events alongside harming food security, human health, ecosystem services, and socio-economic development, and we need to recognize the urgency and severity of climate change and take effective measures to mitigate and adapt to them [1,2,3]. Vegetative cover, one of the most significant parts of the terrestrial ecosystem on the earth, exerts an effect on associating ecological factors including the atmosphere, soil, and hydrology, and is also the most active factor in terrestrial ecosystems [4,5,6].
Vegetation development can be quantitatively characterized with the global normal diversity vegetation indicator, which can intuitively show vegetation development and continuously monitor the dynamic changes in vegetation cover largely and over a long period of time [7,8,9]. Vegetation variation characteristics can be obtained with remote sensing monitoring at different spatial and temporal scales [10,11]. NDVI data have the advantages of easy acquisition, high resolution, and a long time span. In-depth analysis of vegetation characteristics and climatic elements reveals the intrinsic association between vegetation and climate [12,13], which will assist in understanding the climate drivers of variation in terrestrial ecosystems. In previous studies, large-scale vegetation change data were often analyzed with the help of vegetation index data on the basis of remote sensing, and the NDVI was the most extensively adopted [14,15]. There is a linear or near-linear association between NDVI and vegetation productivity, photosynthetically active radiation, green leaf density, and accumulative biomass, which is identified as a useful index of big surface vegetation cover and development [16,17,18]. SPOT-VGT NDVI [19], AVHRR NDVI [20], and MODIS NDVI [21] are included in the most frequently adopted NDVI data. There are several diversities between the three NDVI results with regard to the sensor, spectral reaction function, modification and data processing approaches, synthesis duration, and spatiotemporal resolution [22,23,24,25]. Among them, the AVHRR NDVI results have been updated sometimes with a long time series; the SPOT-VGT and MODIS NDVI results have a shorter time series and higher spatial resolution. Although the application of various NDVI results may bring some diversities in the research outcomes, it still has prominent merits in large-scale vegetation cover change and its cause analysis, land cover identification, and vegetation productivity calculation.
Plant development and growth are influenced by temperature and rainfall, which are core climatic elements [26]. According to the past research, increased temperatures, rainfall, and drought situations in the spring affect vegetation positively, while persistent summer temperatures lead to suppressed vegetation growth [27]. In addition, the role of human activities in vegetative cover variation is also two-sided [28]. For instance, urbanization development has caused the encroachment of a lot of farmland and forest land by construction land, leading to a great decline in vegetation coverage [29]. Central Asia and Mongolia are restoring dryland forests under changing climatic conditions [30]. Hence, vegetation variation can be affected by human activities and climate variation, which may result in great diversities in vegetative cover variation in various places of the world [31].
Climate change in Central Asia shows great spatial heterogeneity, with significant changes in temperature and precipitation. Because of varied hydrothermal conditions and vegetation kinds in various places, great spatial diversities in vegetation variation and its reaction to climate variation can be found [32]. In addition, in recent decades, a number of vegetation construction and ecological protection projects have been formulated and made in the Ferghana Basin, which has greatly promoted vegetation restoration. Most of the research on vegetation variation pays attention to the reaction to climate variation and human events in the whole area of Central Asia, and these studies are of great value for understanding the features and driving elements of vegetation variation in various regions of the Ferghana Basin. However, in previous studies, association discussion and other approaches were often adopted for qualitatively exploring the drivers of vegetative cover variation [33], and the influence of different driving elements was rarely distinguished and quantified. To solve this problem, Piao et al. [34] and Deng Chenhui et al. [35] used prediction models to quantitatively simulate vegetation changes under different driving conditions. At present, there are still a few long-term vegetation variations and their attribution analyses in the Ferghana Basin, and the influences of human events on vegetation variations and regional differences in the Ferghana Basin are not fully understood. Therefore, it is necessary to carry out attribution studies of vegetation change and quantification of the corresponding contribution within the Ferghana Basin.
The Ferghana Basin, known as the “Pearl of Central Asia” and as a special geographical location, is an essential part of the “Belt and Road” route. Based on the high-resolution lattice data of the Climate Research Center of the University of East Anglia, the temperature and precipitation data and the GIMMS NDVI3g data with a long series of time series in the Ferghana Basin were discussed, and the basic features of the vegetative cover NDVI shift in the Ferghana Basin from 1982 to 2015 and their influence on climate variation and human events were evaluated, and the relative efforts of the two driving elements were assessed.

2. Materials and Methods
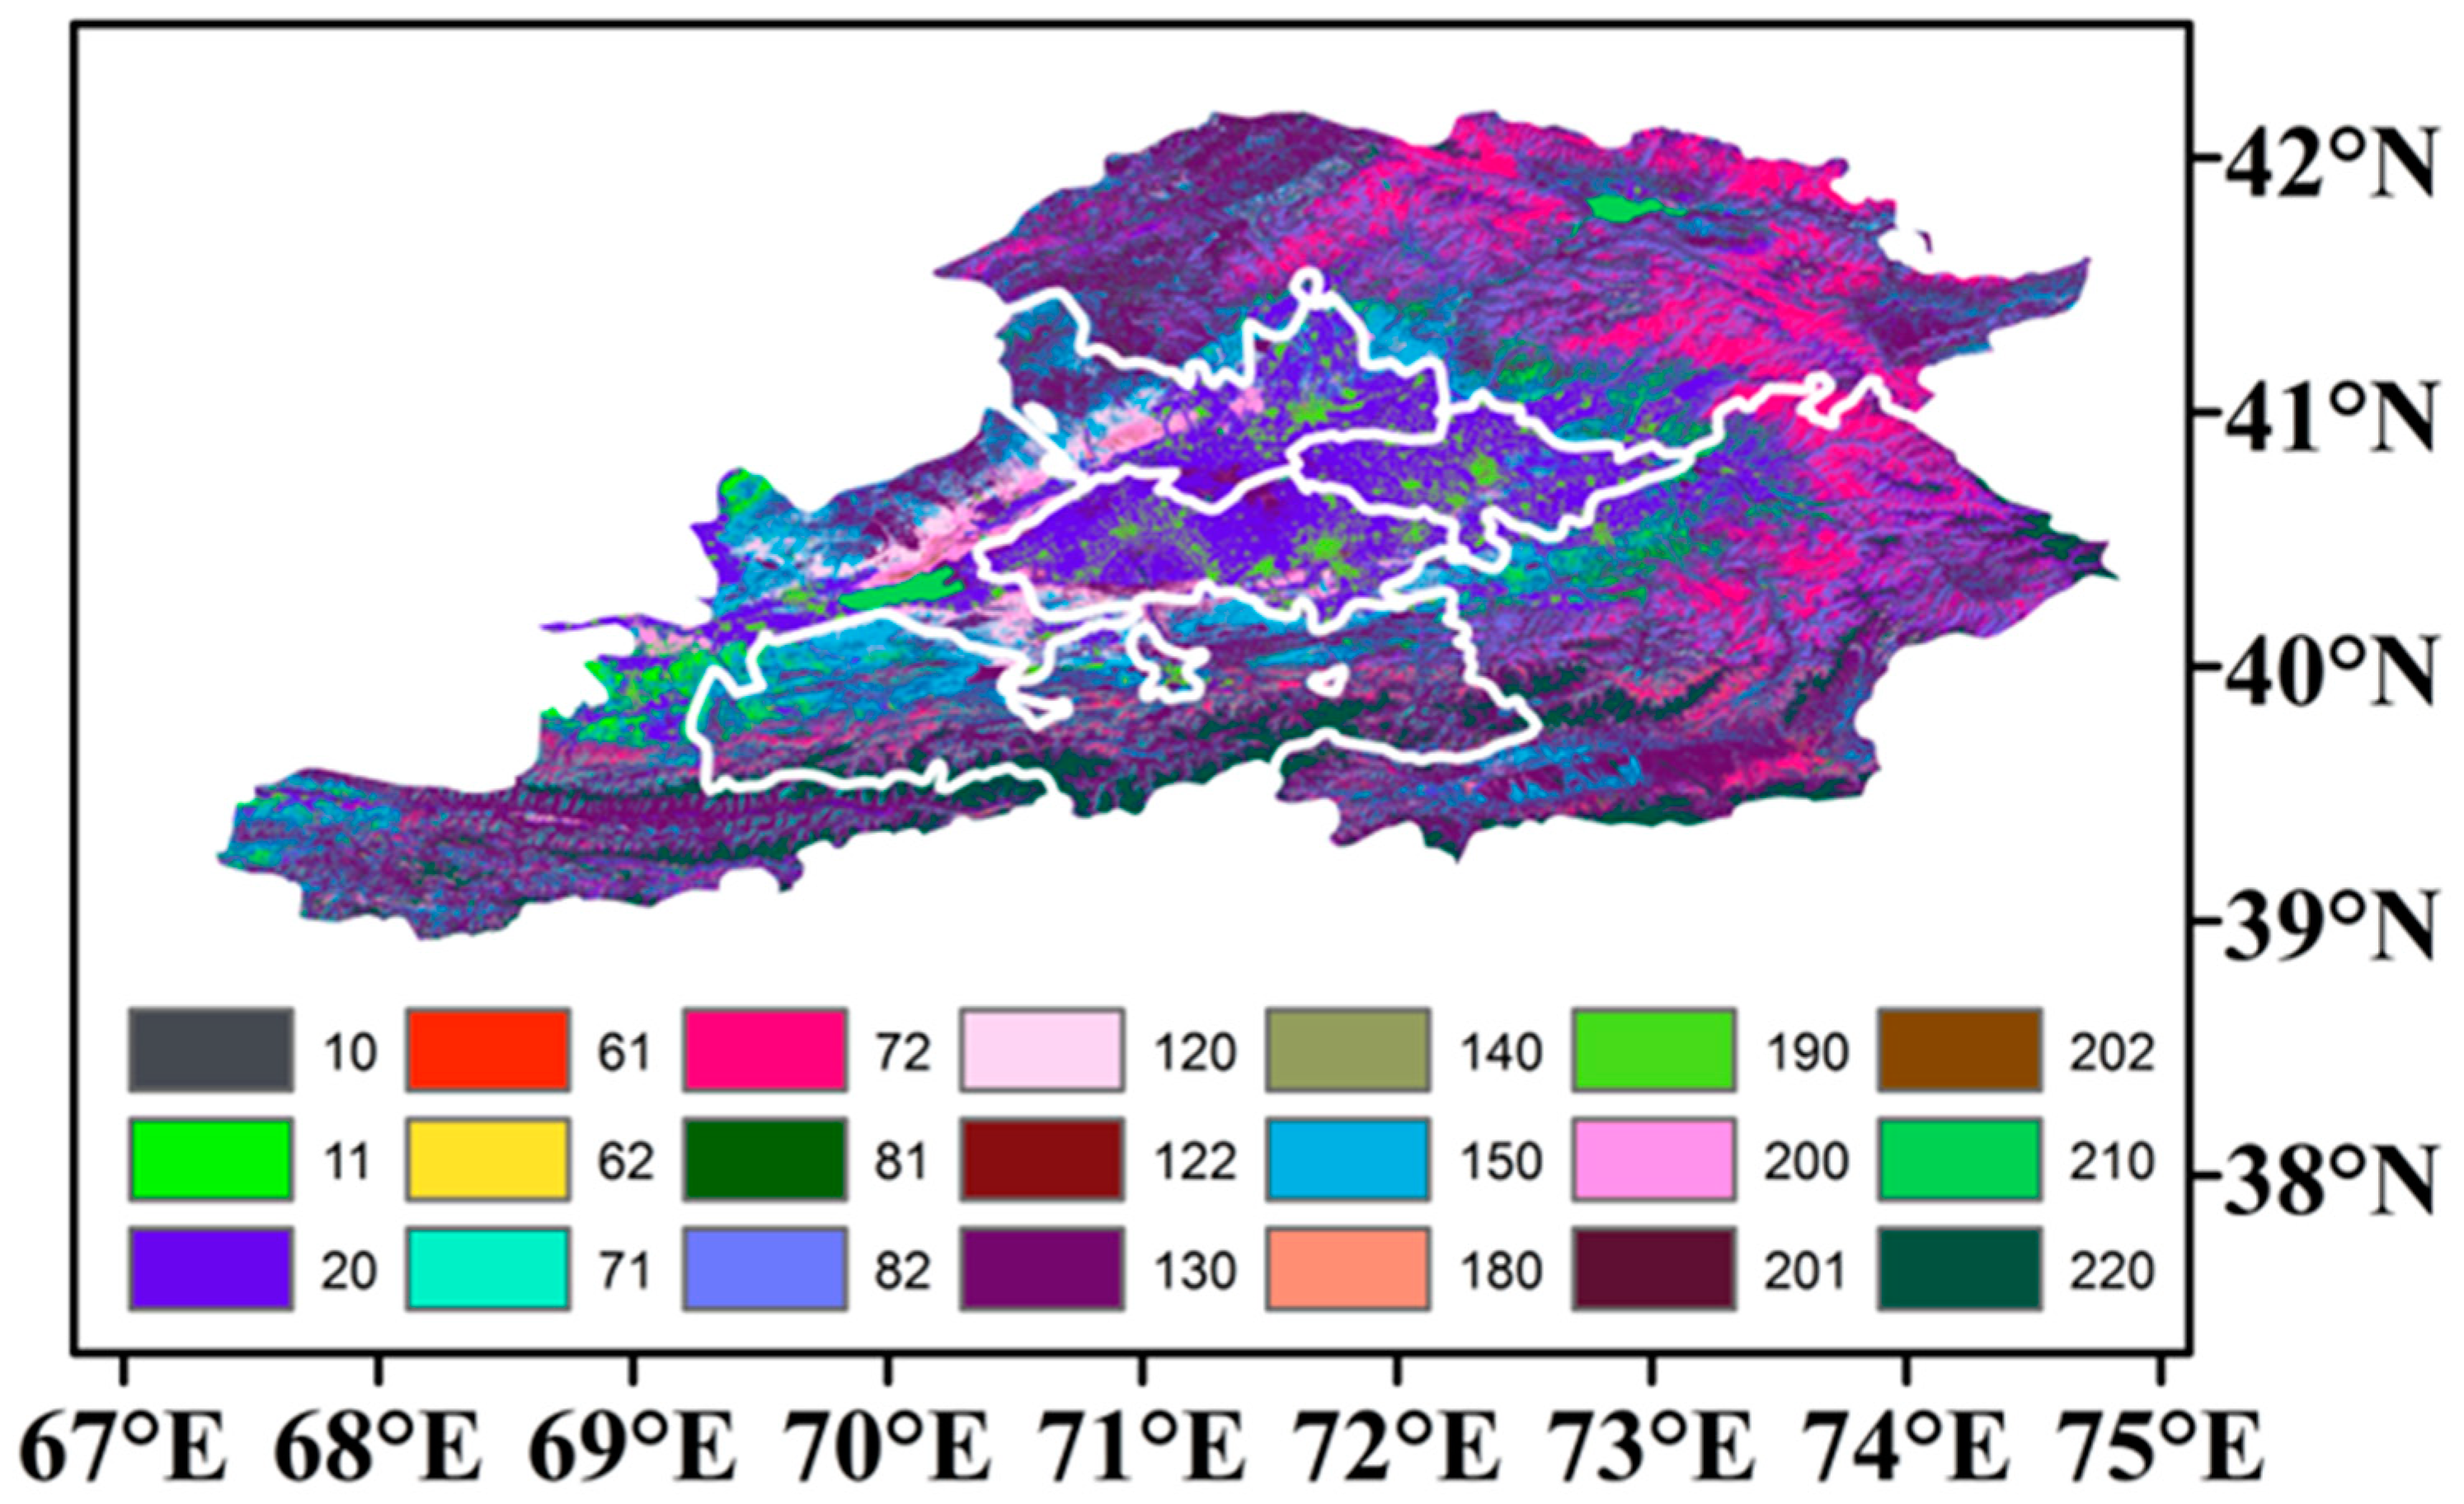
2.1. Study Regions

The Ferghana Basin is a closed intermountain basin in Central Asia and covers parts of the three countries of Uzbekistan, Kyrgyzstan, and Tajikistan. Located on the western side of the Pamir Plateau, the Ferghana Basin is surrounded by the Tien Shan and the Gissar-Alai mountain ranges, with river valleys and mountain passes leading out of the basin. The basin is 300 km long from east to west and 170 km wide from north to south, with an altitude of 330 to 1000 m above sea level. The climatic characteristics of the Ferghana Basin are mainly continental and arid, and generally show the characteristics of hot and dry. Since the region is located inland in Central Asia, far from the ocean, there is relatively little precipitation and it is characterized by dryness overall. The seasonal climate shows cold and dry winters and hot and arid summers. Because of the geographical location, the temperature diversity between day and night in the Ferghana Basin is large, with hot days and sudden drops at night, which influences the development of vegetation to a certain extent. Figure 1 overviews the research region. The Ferghana Basin, one of the most densely populated areas in Central Asia, is known as the “Fruit and Vegetable Basin of Central Asia”, where irrigated agriculture and animal husbandry have been developed since ancient times, and the main crops include cotton, wheat, grapes, alfalfa, and vegetables, etc. Dozens of rivers, such as the Syrdarya, Karadarya, Sokh, and Isfara, have formed the most complex water network in Central Asia in the Ferghana Basin. Figure 2 illustrates the variety of land cover types in the Ferghana Basin, including grasslands, meadows, deserts, deserts, agricultural lands, lakes, rivers, mountains, and forests, etc., which are interspersed with each other and together form the rich and diverse natural landscape of the basin.

2.2. Data

Climatic Research Unit Timeseries (CRU TS) Version 4.07, one of the most extensively adopted climate datasets, is manufactured by the UK’s National Centre for Atmospheric Science. The CRU TS v4.07 dataset offers monthly information including the land surface from 1901 to 2022 to 0.5° × 0.5° resolution worldwide. The impact of urbanization on the data itself is not fully considered, which brings some uncertainty to the results and conclusions of this study. However, the CRU data have been validated by numerous studies [36,37].
The NDVI dataset is the latest release of the long sequence (1981–2015) normalized difference vegetation index product of the NOAA Global Inventory Monitoring and Modeling System (GIMMS), version number 3g.v1, and the dataset is a long time series of NDVI data acquired by NOAA’s Advanced Very High Resolution Radiometer (AVHRR) sensor. The temporal resolution of the product is twice a month, while the spatial resolution is 1/12 of a degree. The temporal coverage is from July 1981 to December 2015. This dataset was inverted from NOAA AVHRR satellite data, atmospherically corrected and geometrically corrected, and eliminated other non-vegetation-related effects [38,39]. It has been widely used in studies such as monitoring vegetation dynamics on a global or regional scale, vegetation responses to climate change, and has achieved good results [40,41,42]. Therefore, this study analyzes the land surface air temperature and precipitation in the Ferghana Basin from 1982 to 2015. The partial correlation method was used to analyze the changes in temperature and precipitation in the growing season in the Ferghana Basin, and the kriging interpolation method of R language was used to interpolate the temperature and precipitation data of the growing season in China, and the temperature and precipitation data of the growing season in China were resampled to a resolution of 8 km. Format change, coordinate change, data pruning, monthly maximum extraction, and NDVI truth calculation are included in the preprocessing of NDVI data. Among them, the monthly maximum data of NDVI were obtained by processing 15d data by the maximum synthesis method [43]. Surface cover data for 2010 from the Earth’s Big Data Science Project data-sharing service system [44].

2.3. Statistical Analyses

2.3.1. Trend Analysis

The calculation of the interannual tendency of NDVI in the developing season was made with univariate linear regression, and the definition of the linear regression equation slope as the interannual tendency rate of NDVI was made. The slope gradient is calculated with reference to Wang et al. [45]. slope < 0 and slope > 0 suggest growing and declining NDVI sequences over time. In case of a bigger absolute value of slope, the variation in NDVI will be faster during the developing season.
The Mann–Kendall (MK) test represents that it is not necessary to make prior conceptions about the statistical allocation of the data. The tendency and importance of the time series are tested with the normalized statistic Z [46]. The importance of the tendency of change is determined with the Mann–Kendall test. Based on the tendency of vegetative cover variation characterized by the slope value, integrated with the outcomes of the test of significance of the tendency of vegetation change, we took the statistic at the significance of |Z| = 0.05 and |Z| = 0.01 as the critical value and categorized the trend of NDVI change into six classes: highly great decline (slope < 0, |Z| > 2.58), great decline (slope < 0, 1.96 < |Z| ≤ 2.58), non-great decline (slope < 0, |Z| ≤ 1.96), non-great growth (slope > 0, |Z| ≤ 1.96), great growth (slope > 0, 1.96 < |Z| ≤ 2.58), and highly great growth (slope > 0, |Z| > 2.58).

2.3.2. Partial Correlation Analysis

Since both temperature and precipitation affect NDVI, the partial association discussion removes the effect of the third variable and analyzes the association between the first two variables only [47]. The formula is shown below:
r N D V I T · P = r N D V I T r N D V I P r T P 1 r N D V I P 2 1 r T P 2
r N D V I P · T = r N D V I P r N D V I T r T P 1 r N D V I T 2 1 r T P 2
which denotes the partial association parameter between NDVI and T after excluding the effect of P, denotes the partial association parameter between NDVI and P after ruling out the effect of T, when T means air temperature and P is precipitation. On the basis of the calculated partial association parameters, the significance was tested with the t-test, and the degree of association between vegetation NDVI and climate factors was classified as follows: r > 0, highly great positive association (P < 0.01), great positive association (0.01 ≤ P < 0.05), and not great positive association (P ≥ 0.05); r < 0, highly great negative association (P < 0.01), great negative association (0.01 ≤ P < 0.05), and not great positive association (P ≥ 0.05); r < 0, highly great negative association (P < 0.01), great negative association (0.01 ≤ P < 0.05), and non-great negative association (P ≥ 0.05).

2.3.3. Multiple Regression Residual Analysis

The roles and related effect of human events and climate variation on a vegetative cover NDVI shift were researched with multiple regression residual analysis [48,49]. The approach mostly consists of the three procedures: (1) On the basis of the NDVI of the developing season and the interpolated time series information of temperature and rainfall, the calculation of the coefficients in the model is made by setting up a binary linear regression model. (2) On the basis of the temperature and rainfall information and the coefficients of the regression model, the calculation of the forecast value of NDVI (NDVICC) was made, which was adopted to stand for the role of climate elements in vegetative cover NDVI. (3) The role of human activities in vegetative cover NDVI was represented by the calculation of the diversity between the NDVI observations and the NDVICC, i.e., the NDVI residuals (NDVIHA). The given calculation formula is shown below:
N D V I C C = a × T + b × P + c
N D V I H A = N D V I o b s N D V I C C
where NDVICC and NDVIobs mean the NDVI prediction value on the basis of the regression model and the NDVI observation value on the basis of remote sensing figures (dimensionless). a, b, and c mean model coefficients; T and P mean the mean temperature and cumulative rainfall during the developing season, and the units are mm and mm, respectively. NDVIHA means the residual.

2.3.4. Determination and Impact of the Driving Elements of Vegetation NDVI Variation

The linear tendency rates of NDVICC and NDVIHA represent the tendency of NDVI in the developing season, influenced by climate variation and human events. The positive tendency rate indicates that climate variation or human events can drive the growth of vegetation NDVI, which plays a driving role in vegetation restoration. On the contrary, it will result in the decline in vegetation NDVI and inhibit vegetation restoration. For better evaluating the role of climate variation and human events in vegetative cover development, the effects of NDVICC and NDVIHA were fallen into great control, moderate control, slight control, almost no influence, slight control, moderate control, and great advancement (Table 1). In addition, Table 2 identified the major driving agents of NDVI variation in the developing season in the Ferghana Basin, and the calculation of the related effort rate of climate variation and human events to the NDVI variation in the developing season was made [50,51].

2.3.5. Criteria for Deciding the Driving Elements of Vegetation NDVI Variation and Calculation Approach for Contribution Rate

Here, we provide the criteria for determining the driving factors of vegetation NDVI variation and the method for calculating contribution rates (Table 2).

2.3.6. Coefficient of Variation (CV) Stability Analysis

In this paper, the coefficient of the variation of vegetation NDVI was calculated based on the pixel scale, which was used to evaluate the stability of the vegetation on time series [43]. The formula is as follows:
C V = σ μ
where σ—NDVI standard deviation and μ—NDVI average.
When the CV value is larger, it means that the data are more volatile and the interannual variation of vegetation NDVI is greater. On the contrary, the data volatility was small, and the interannual variation of vegetation NDVI was relatively stable. The stability of vegetation NDVI was divided into five categories: low fluctuation (CV < 0.05), low fluctuation (0.05 ≤ CV < 0.1), moderate fluctuation (0.10 ≤ CV < 0.15), high fluctuation (0.15 ≤ CV ≤ 0.20), and high fluctuation (CV > 0.20).

3. Results

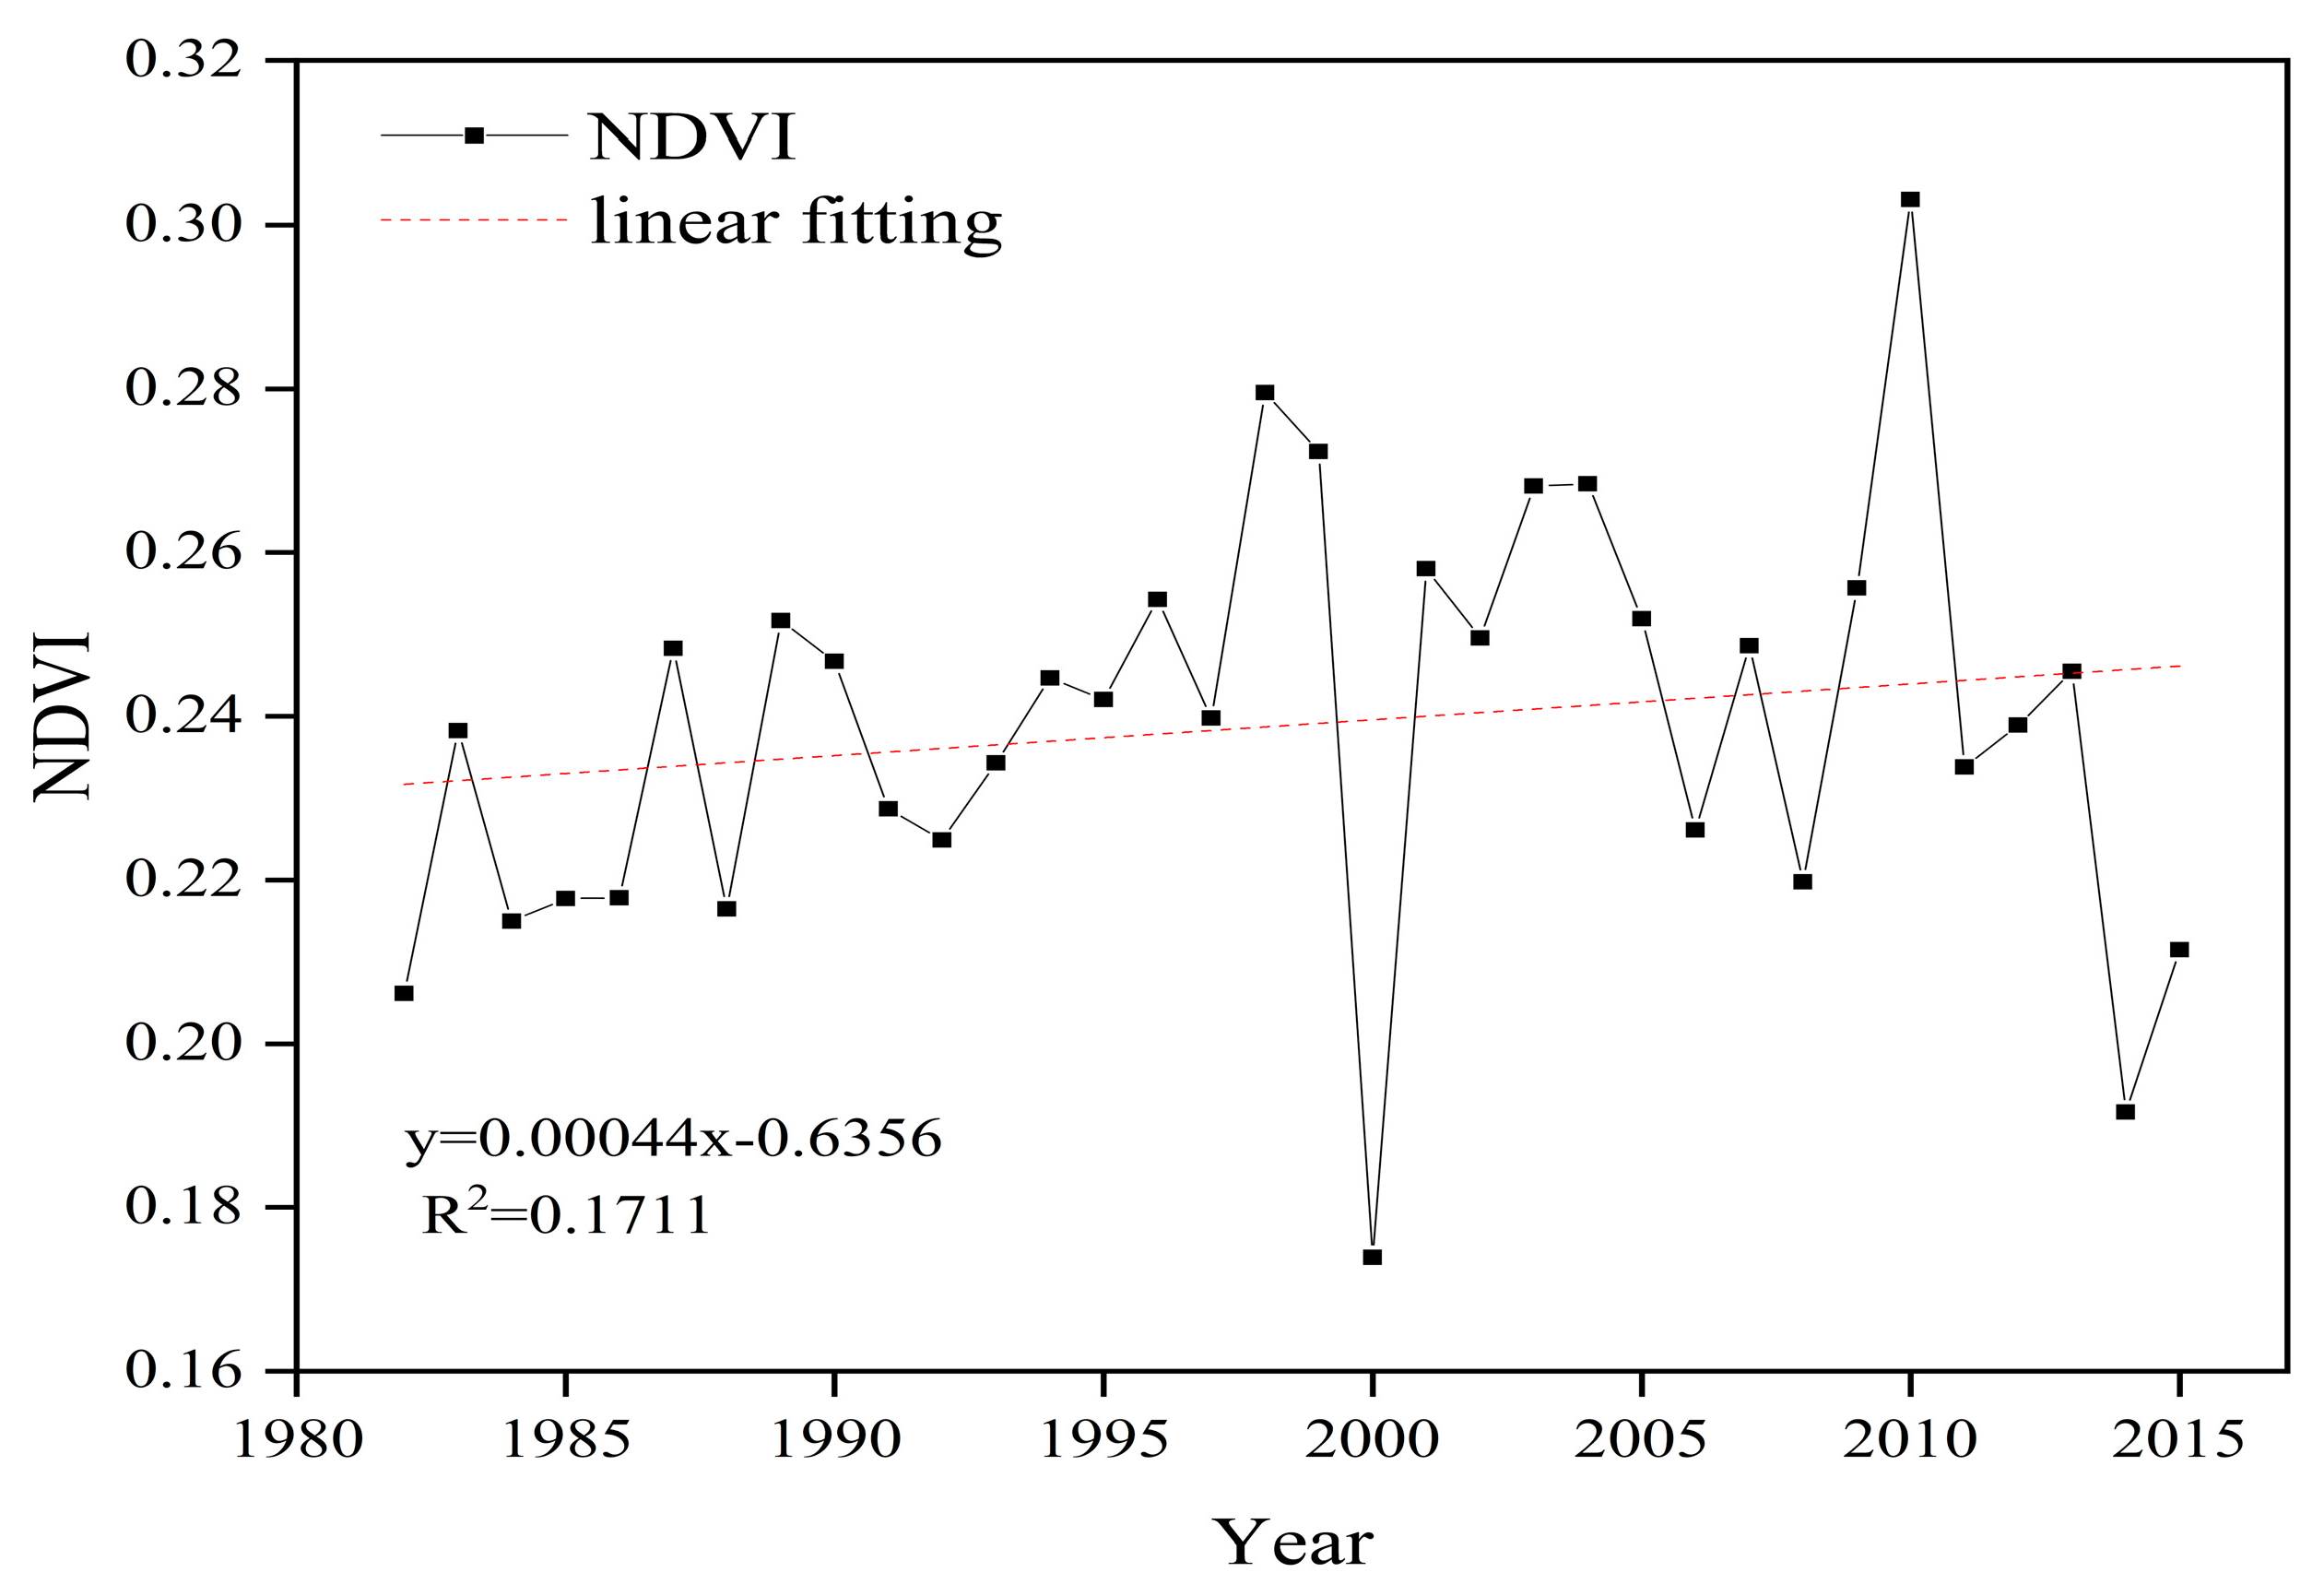
3.1. Temporal Variation Characteristics of NDVI during the Growing Season

Average developing season NDVI values in the Ferghana Basin displayed a fluctuating increasing tendency from 1982 to 2015, with an increasing trend in 1982–1999 (with a growth rate of up to 0.027/10a) and a decreasing trend from 2000 onwards (Figure 3). During the research period, the mean developing season NDVI in the research area varied in the range of 0.174–0.303, with an inflection point in the year 2000 and a decreasing trend thereafter. Overall, the average growing season NDVI trend rate in the Ferghana Basin from 1982 to 2015 was 0.004/10a.

3.2. Characteristics of Spatial Variation of Vegetation NDVI in the Growing Season

3.2.1. Characteristics of Spatial Distribution of Vegetation NDVI in the Growing Season

The variation range of NDVI in the Ferghana Basin varied from −0.0423 to 0.5328, and on the basis of the spatial allocation of NDVI (Figure 4), there was high vegetation cover in the Ferghana Basin in the medium and low in the north and south. The NDVI was classified according to low (NDVI < 0.1), medium (0.1 ≤ NDVI < 0.3), and high (NDVI ≥ 0.3), and the number of pixels with various densities of vegetative cover was counted, and their percentages were calculated. The proportion of vegetative cover in the Ferghana Basin from low to high was 3.95% for low density, 66.23% for medium density, and 29.82% for high density.

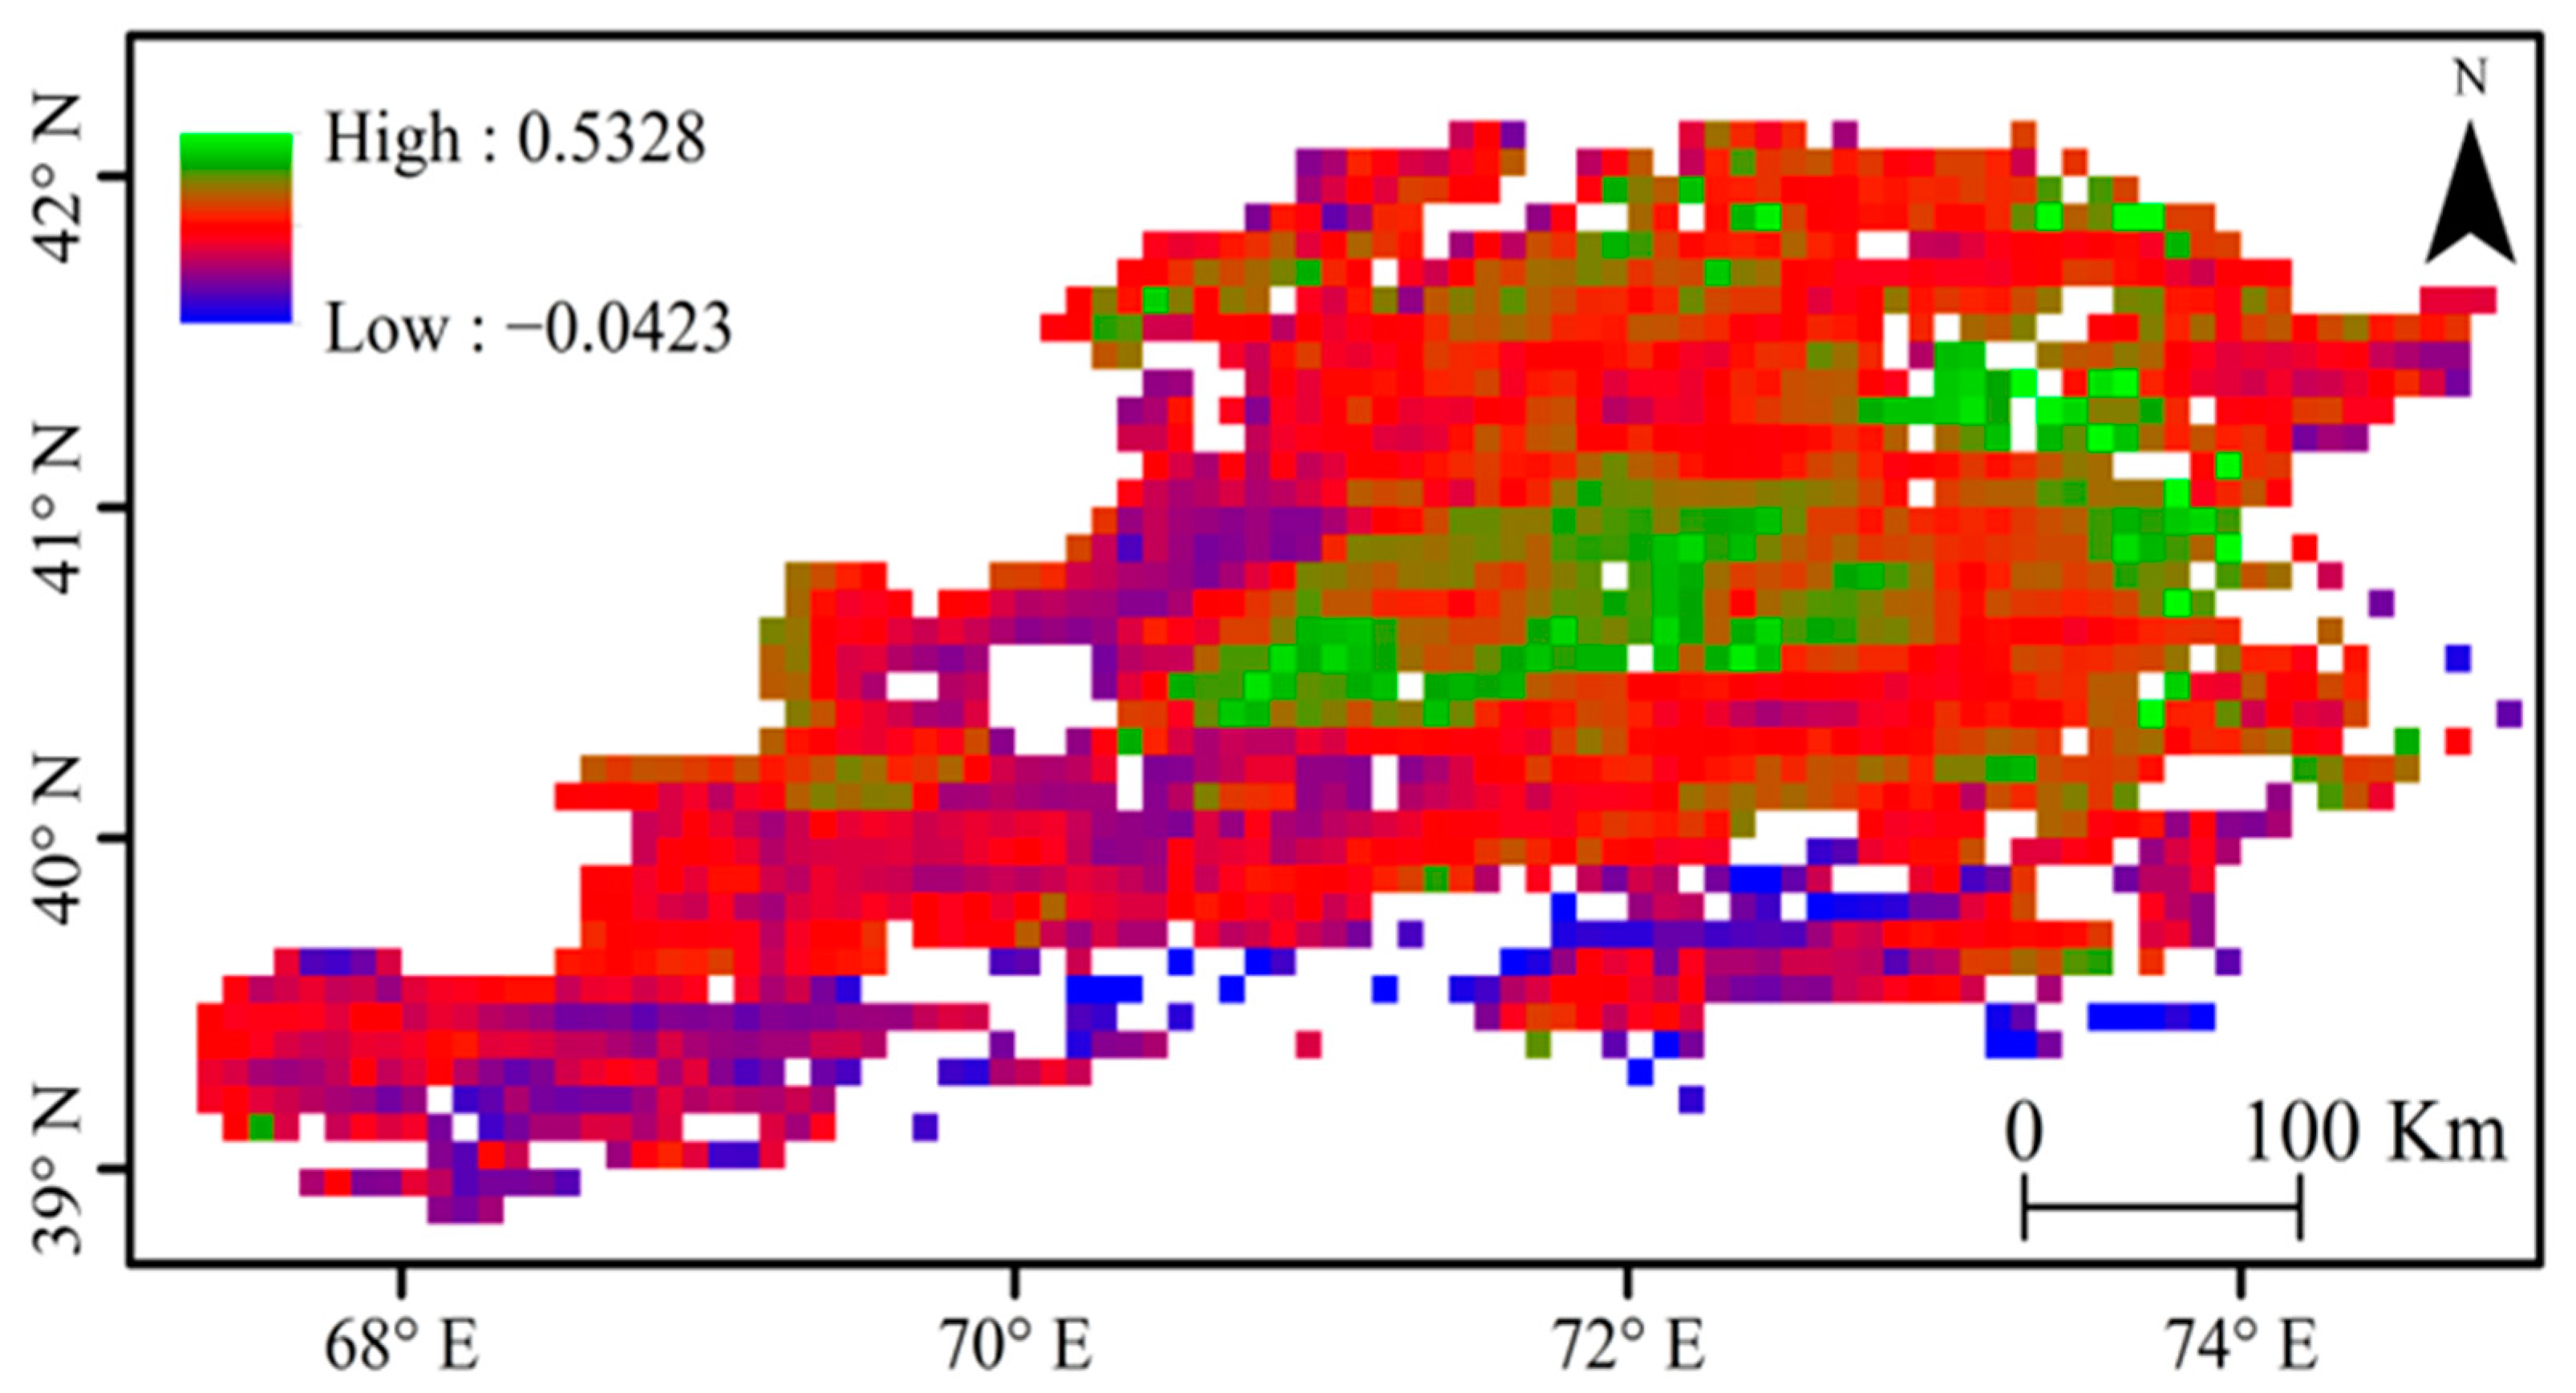
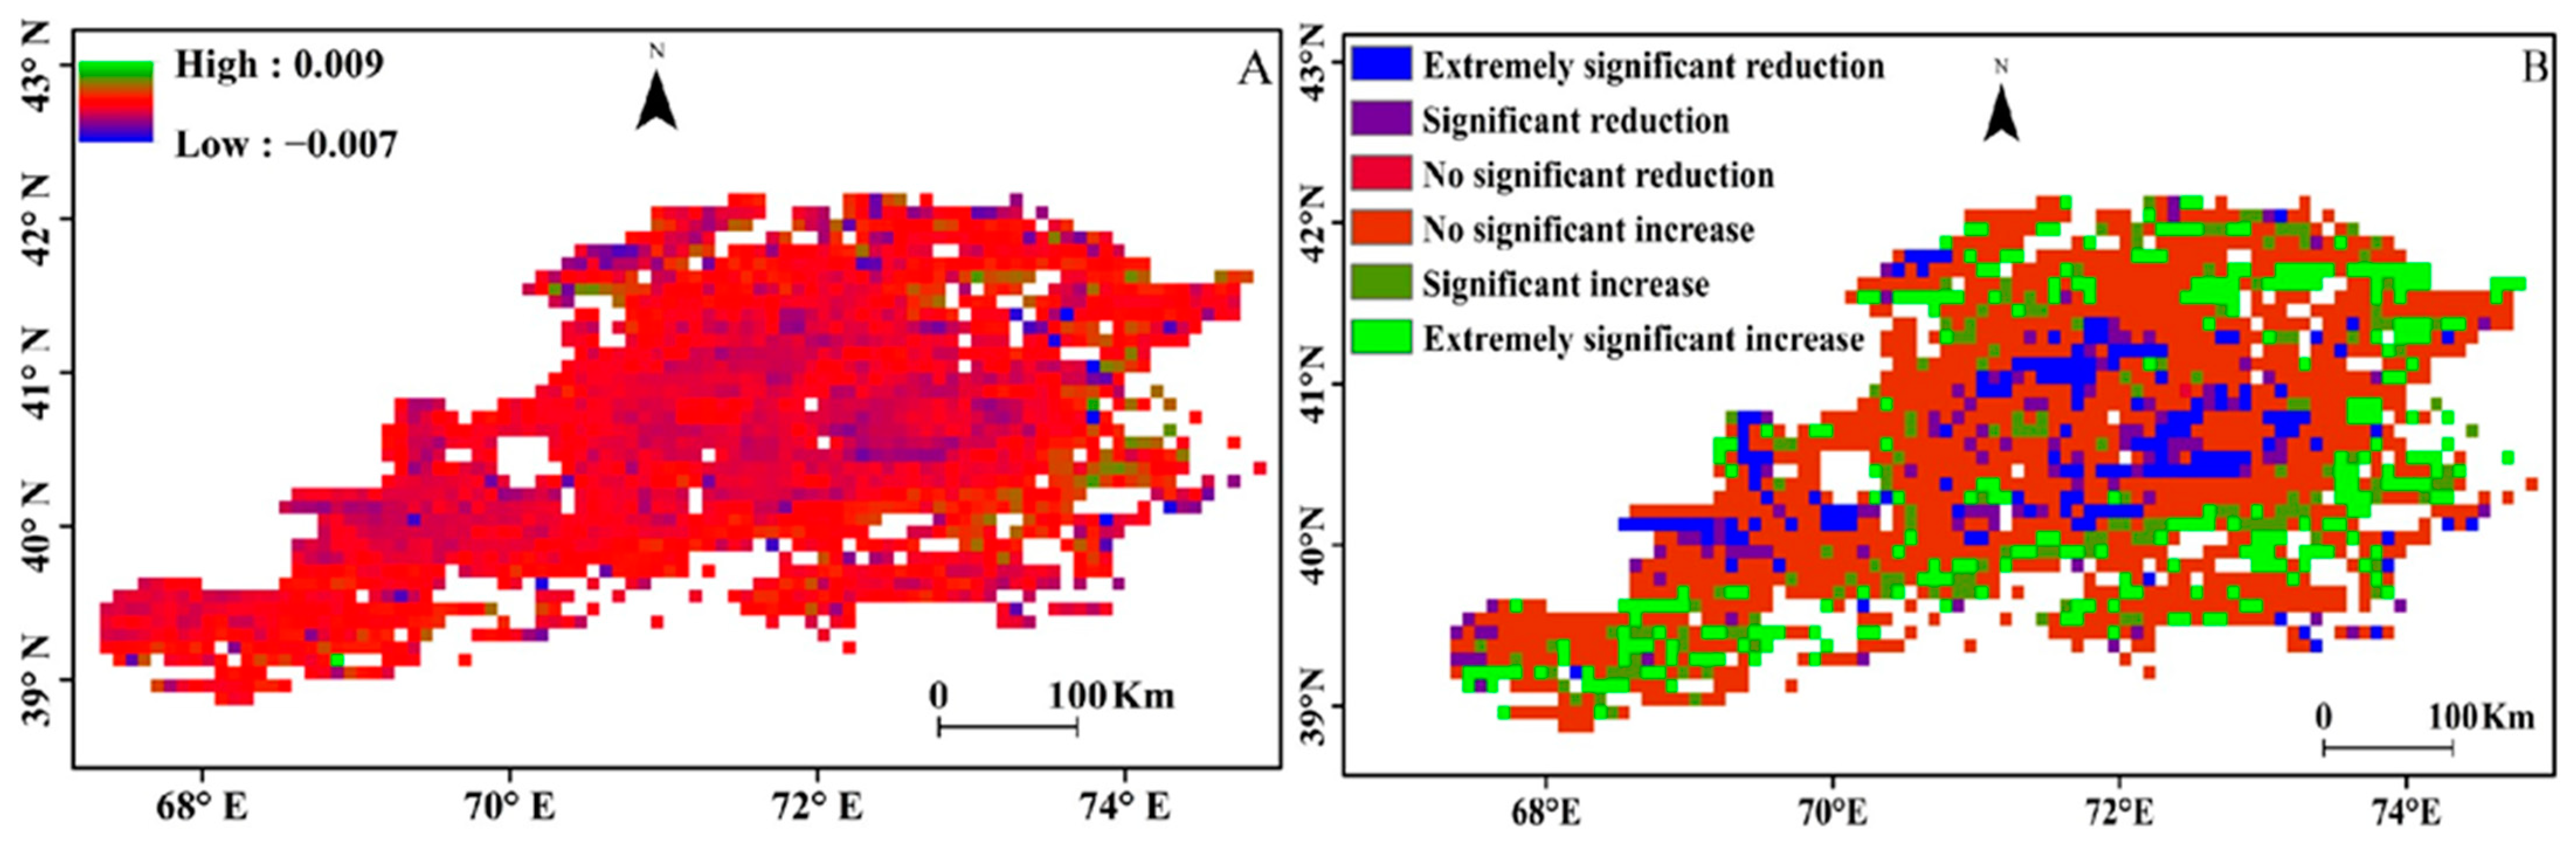
3.2.2. Analysis of the Trend of NDVI in the Growing Season

As shown in Figure 5, the NDVI trend of vegetation in the Ferghana Basin from 1982 to 2015 ranged from −7.0 × 10⁻³/a1 to 9.0 × 10⁻³/a1, with the upward trend being larger than the downward trend, accounting for 56.56%. Among them, 15.74% were highly significant increases and 8.70% were significant increases; 43.44% were decreasing trends, 5.84% were significant decreases, and 0.06% were highly significant decreases.

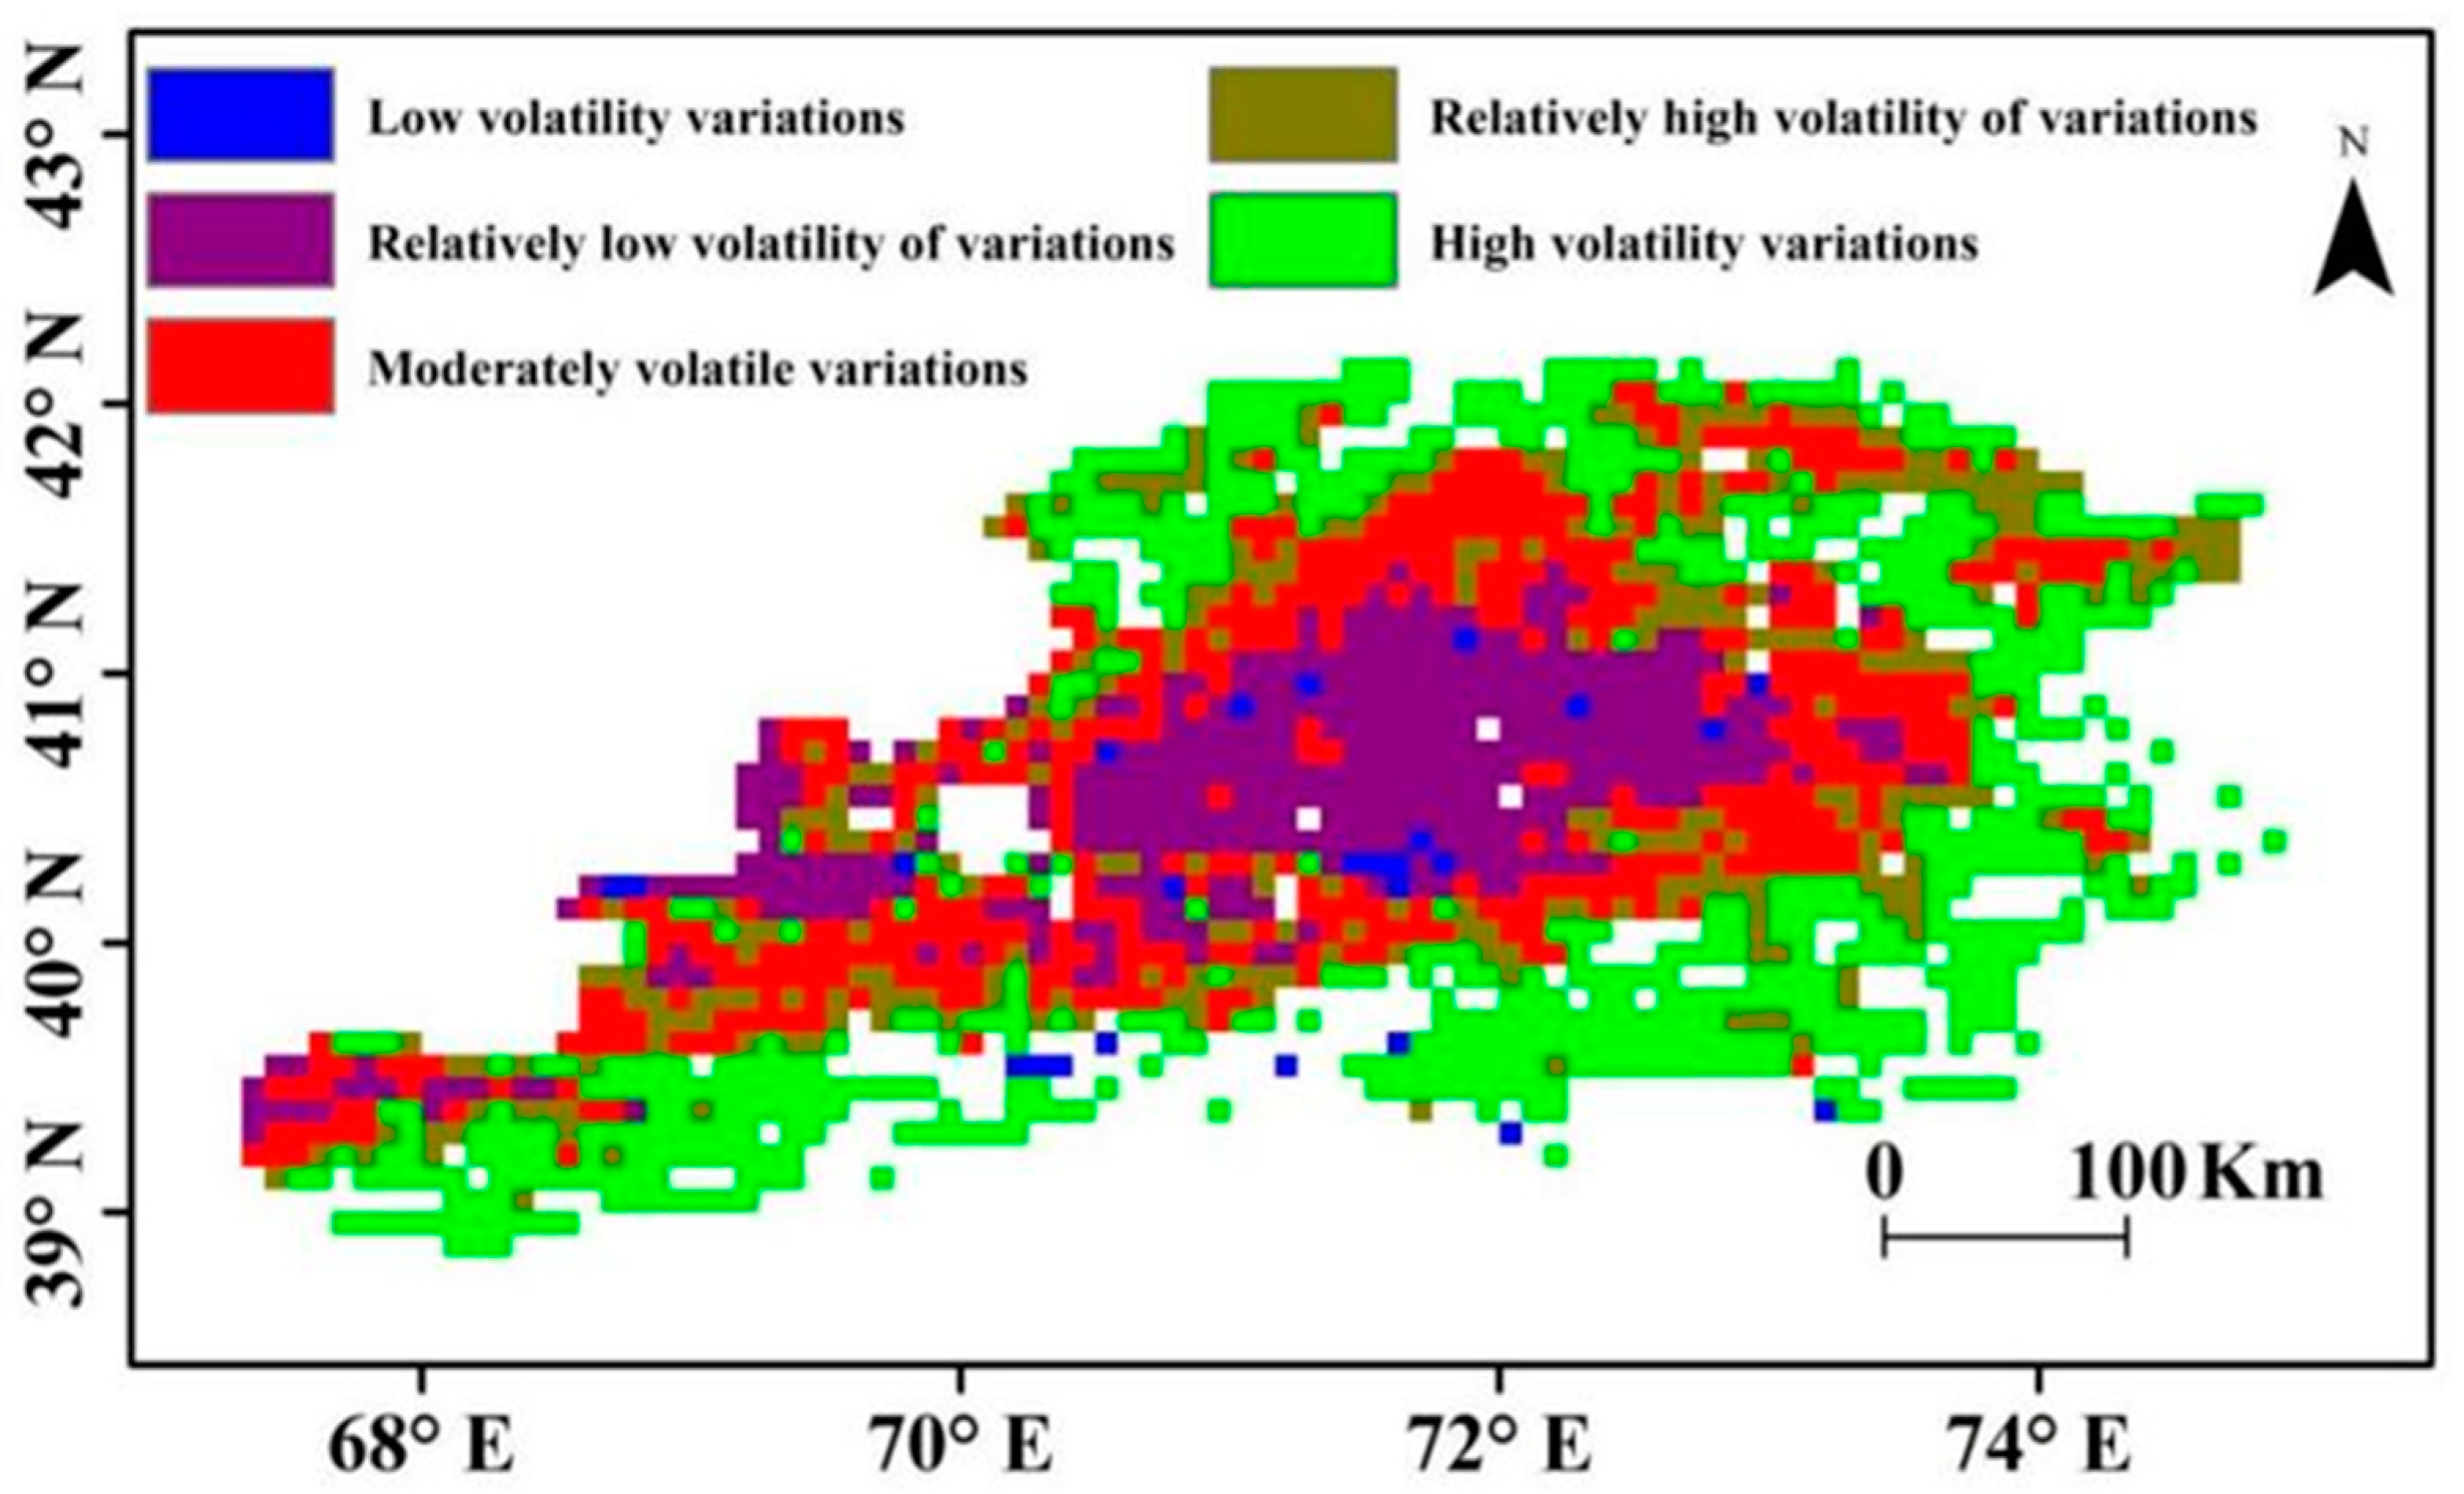
3.2.3. Stability Characteristics of NDVI in Growing Season

According to Equation (5), the coefficient of variation CV of NDVI was calculated image-by-image for the period of 1982–2015 and categorized into five classes according to the magnitude of CV: low fluctuating variation, relatively low fluctuating variation, medium fluctuating variation, relatively high fluctuating variation, and high fluctuating variation (Table 2). As can be seen in Figure 6 and Table 3, the pattern of NDVI fluctuations is reflected by the coefficient of variation: the high fluctuation region is 35.66%, which is mainly distributed in the north of Jalalabad, the south of Leninabad, and the southeast of Osh; the relatively high fluctuation region is 16.66%, which is distributed in all the study areas; the relatively low fluctuation region is 21.18%, which is mainly distributed in Andijan, Ferghana, and Namangan; the medium fluctuation region is 25.07%, mainly distributed in south Jalalabad, northwestern Osh, and northwestern Batken; and the low volatility is less distributed with a percentage of 1.43% of the region.

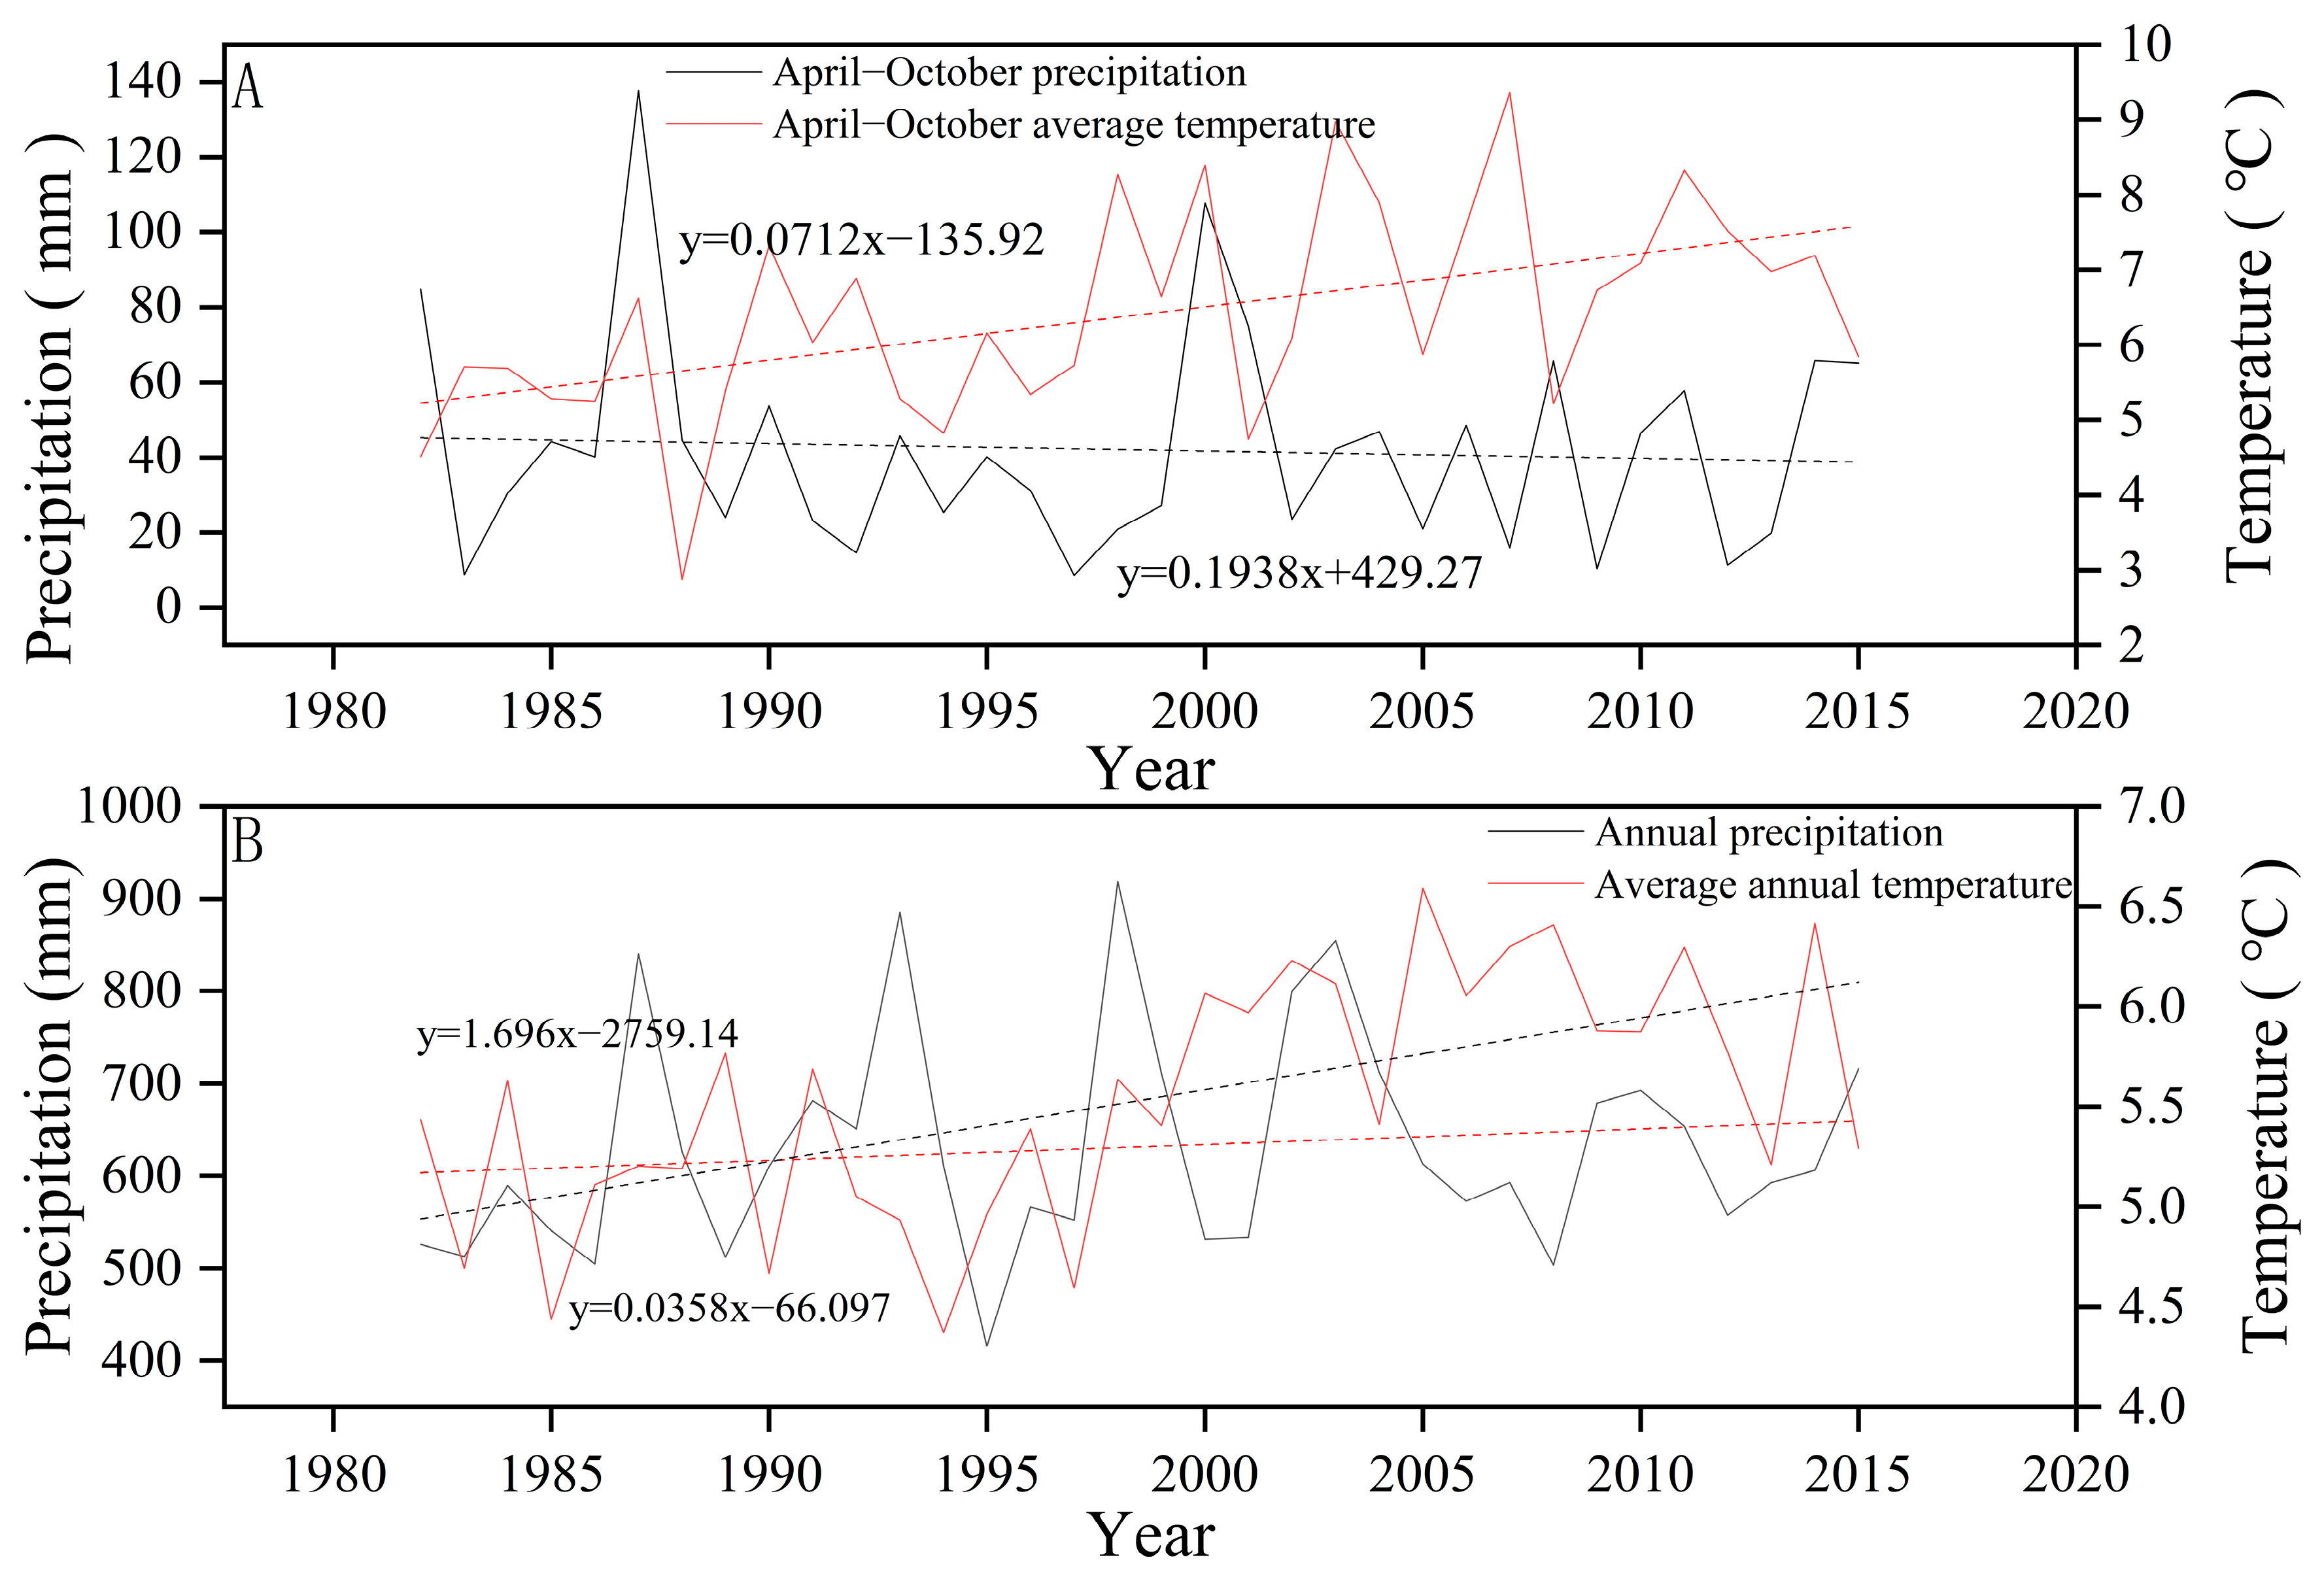
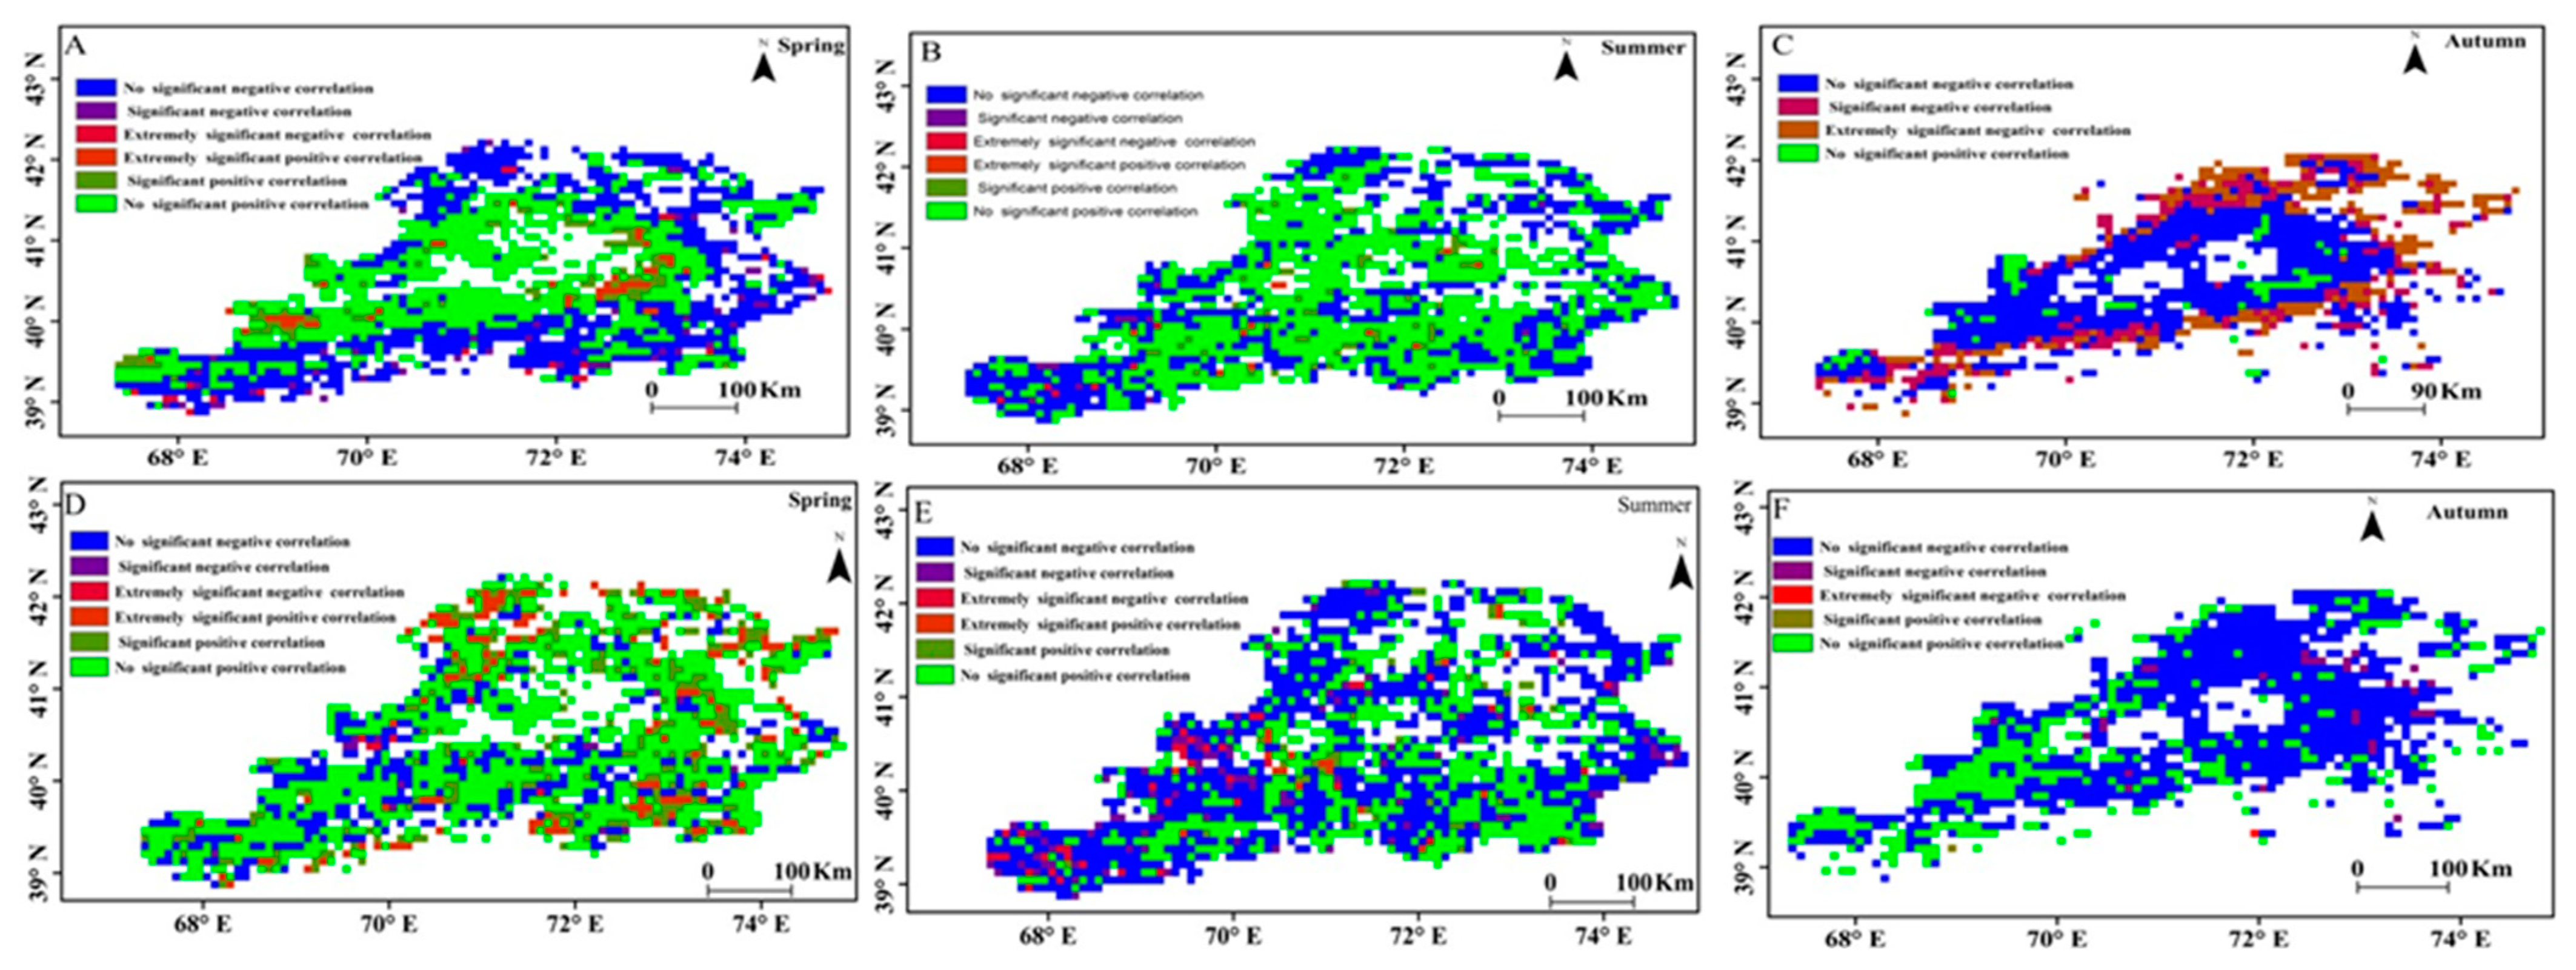
3.3. Climate Response of NDVI during the Growing Season

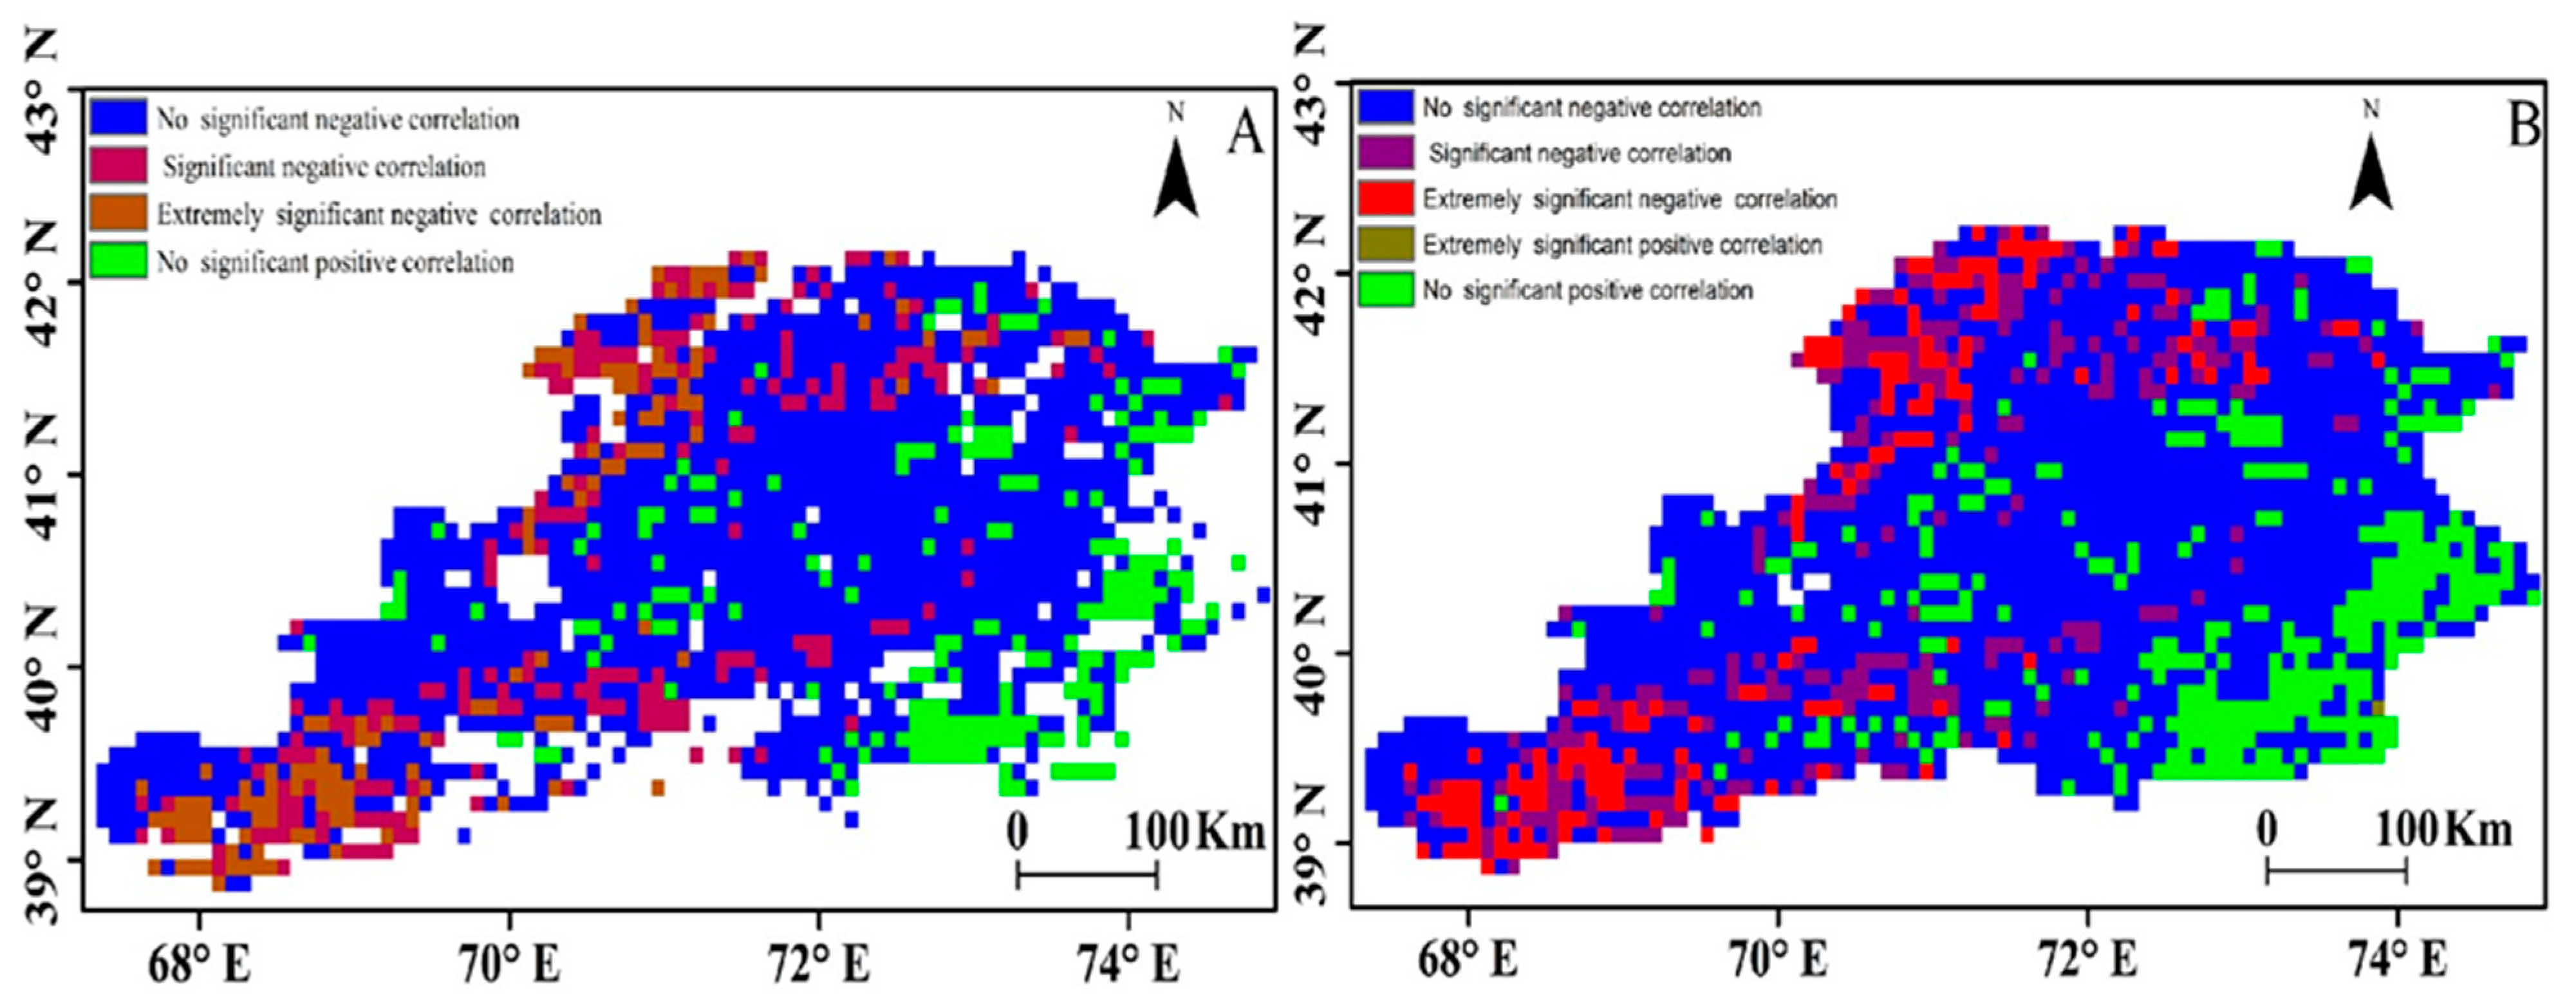
Correlation between NDVI and Climatic Factors during Growing Season

With global warming, the warming tendency in the research region from 1982 to 2015 was significant (Figure 7A), and in the meantime, the rainfall in the research region also showed a declining tendency, with an April–October average temperature growing rate of 0.0712 °C·a−1 and an April–October rainfall decreasing rate of −0.1938 mm·a−1. Figure 7B illustrates the upward trend in both the annual precipitation and average annual temperature. Using the partial association analysis approach, the calculation of the significance areas of the partial association between the developing season NDVI and the developing season temperature and rainfall was made on the basis of image elements from 1982 to 2015, as shown in Figure 8. The areas of positive association between the average increasing season NDVI and the average increasing temperature and precipitation accounted for 65.26% and 17.00% of the research area, and the areas associated with precipitation are smaller than temperatures.
As shown in Figure 9A–F and Table 4, in spring, a positive association between vegetation NDVI and temperature and rainfall in 77.90% and 51.73% of the research area was found; there was a positive relationship between temperature and rainfall in 38.21% and 61.85% in summer; and there was a positive relationship between temperature and rainfall in 27.28% and 5.83% in autumn, indicating that most of the areas of temperature and rainfall in spring and summer jointly affected vegetation NDVI, and a small part of the areas of temperature and precipitation in autumn affected vegetation NDVI.

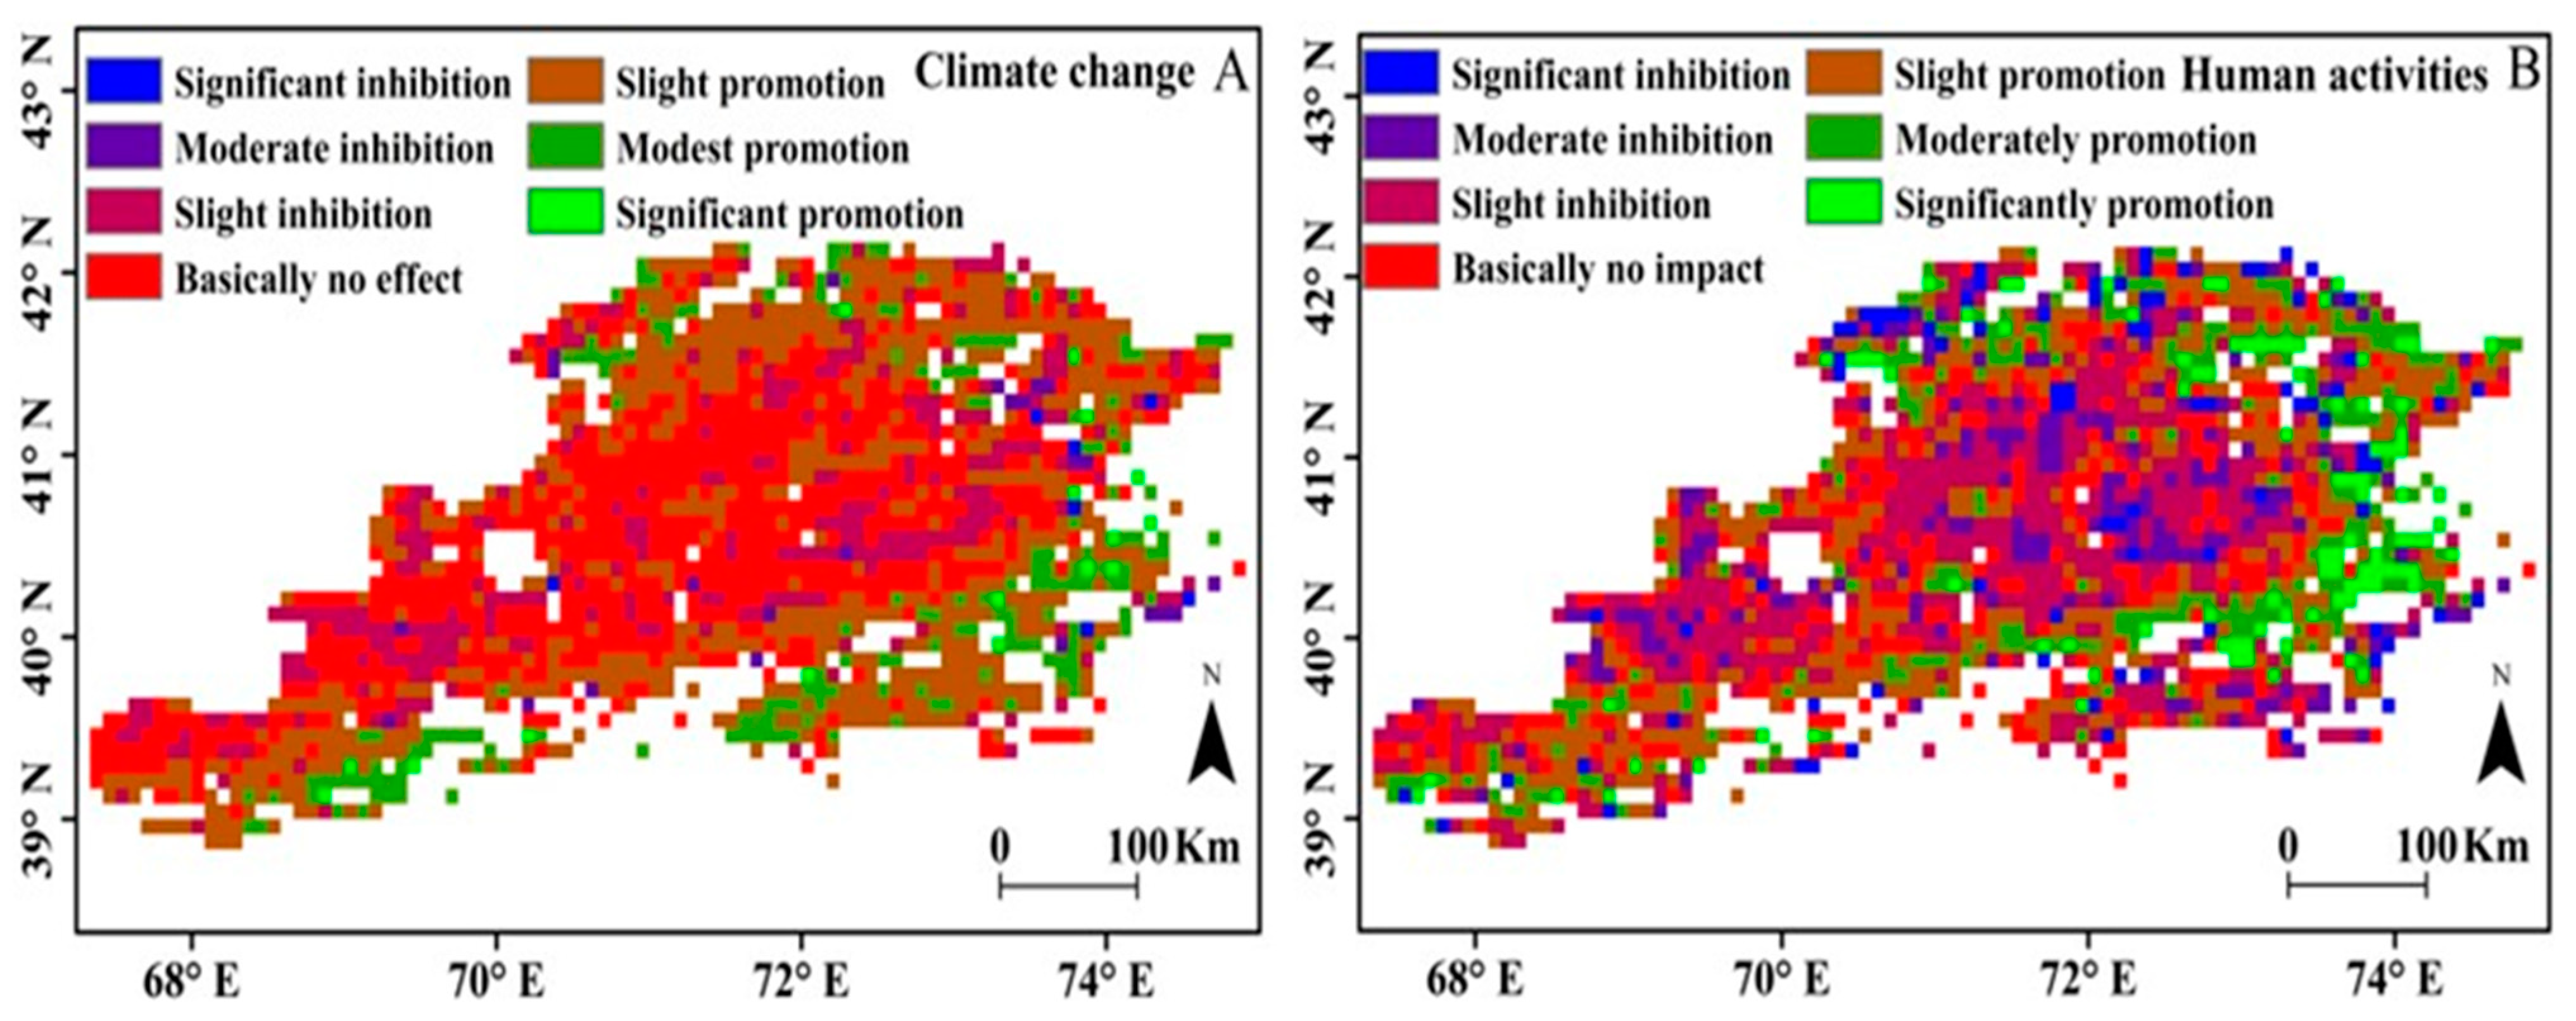
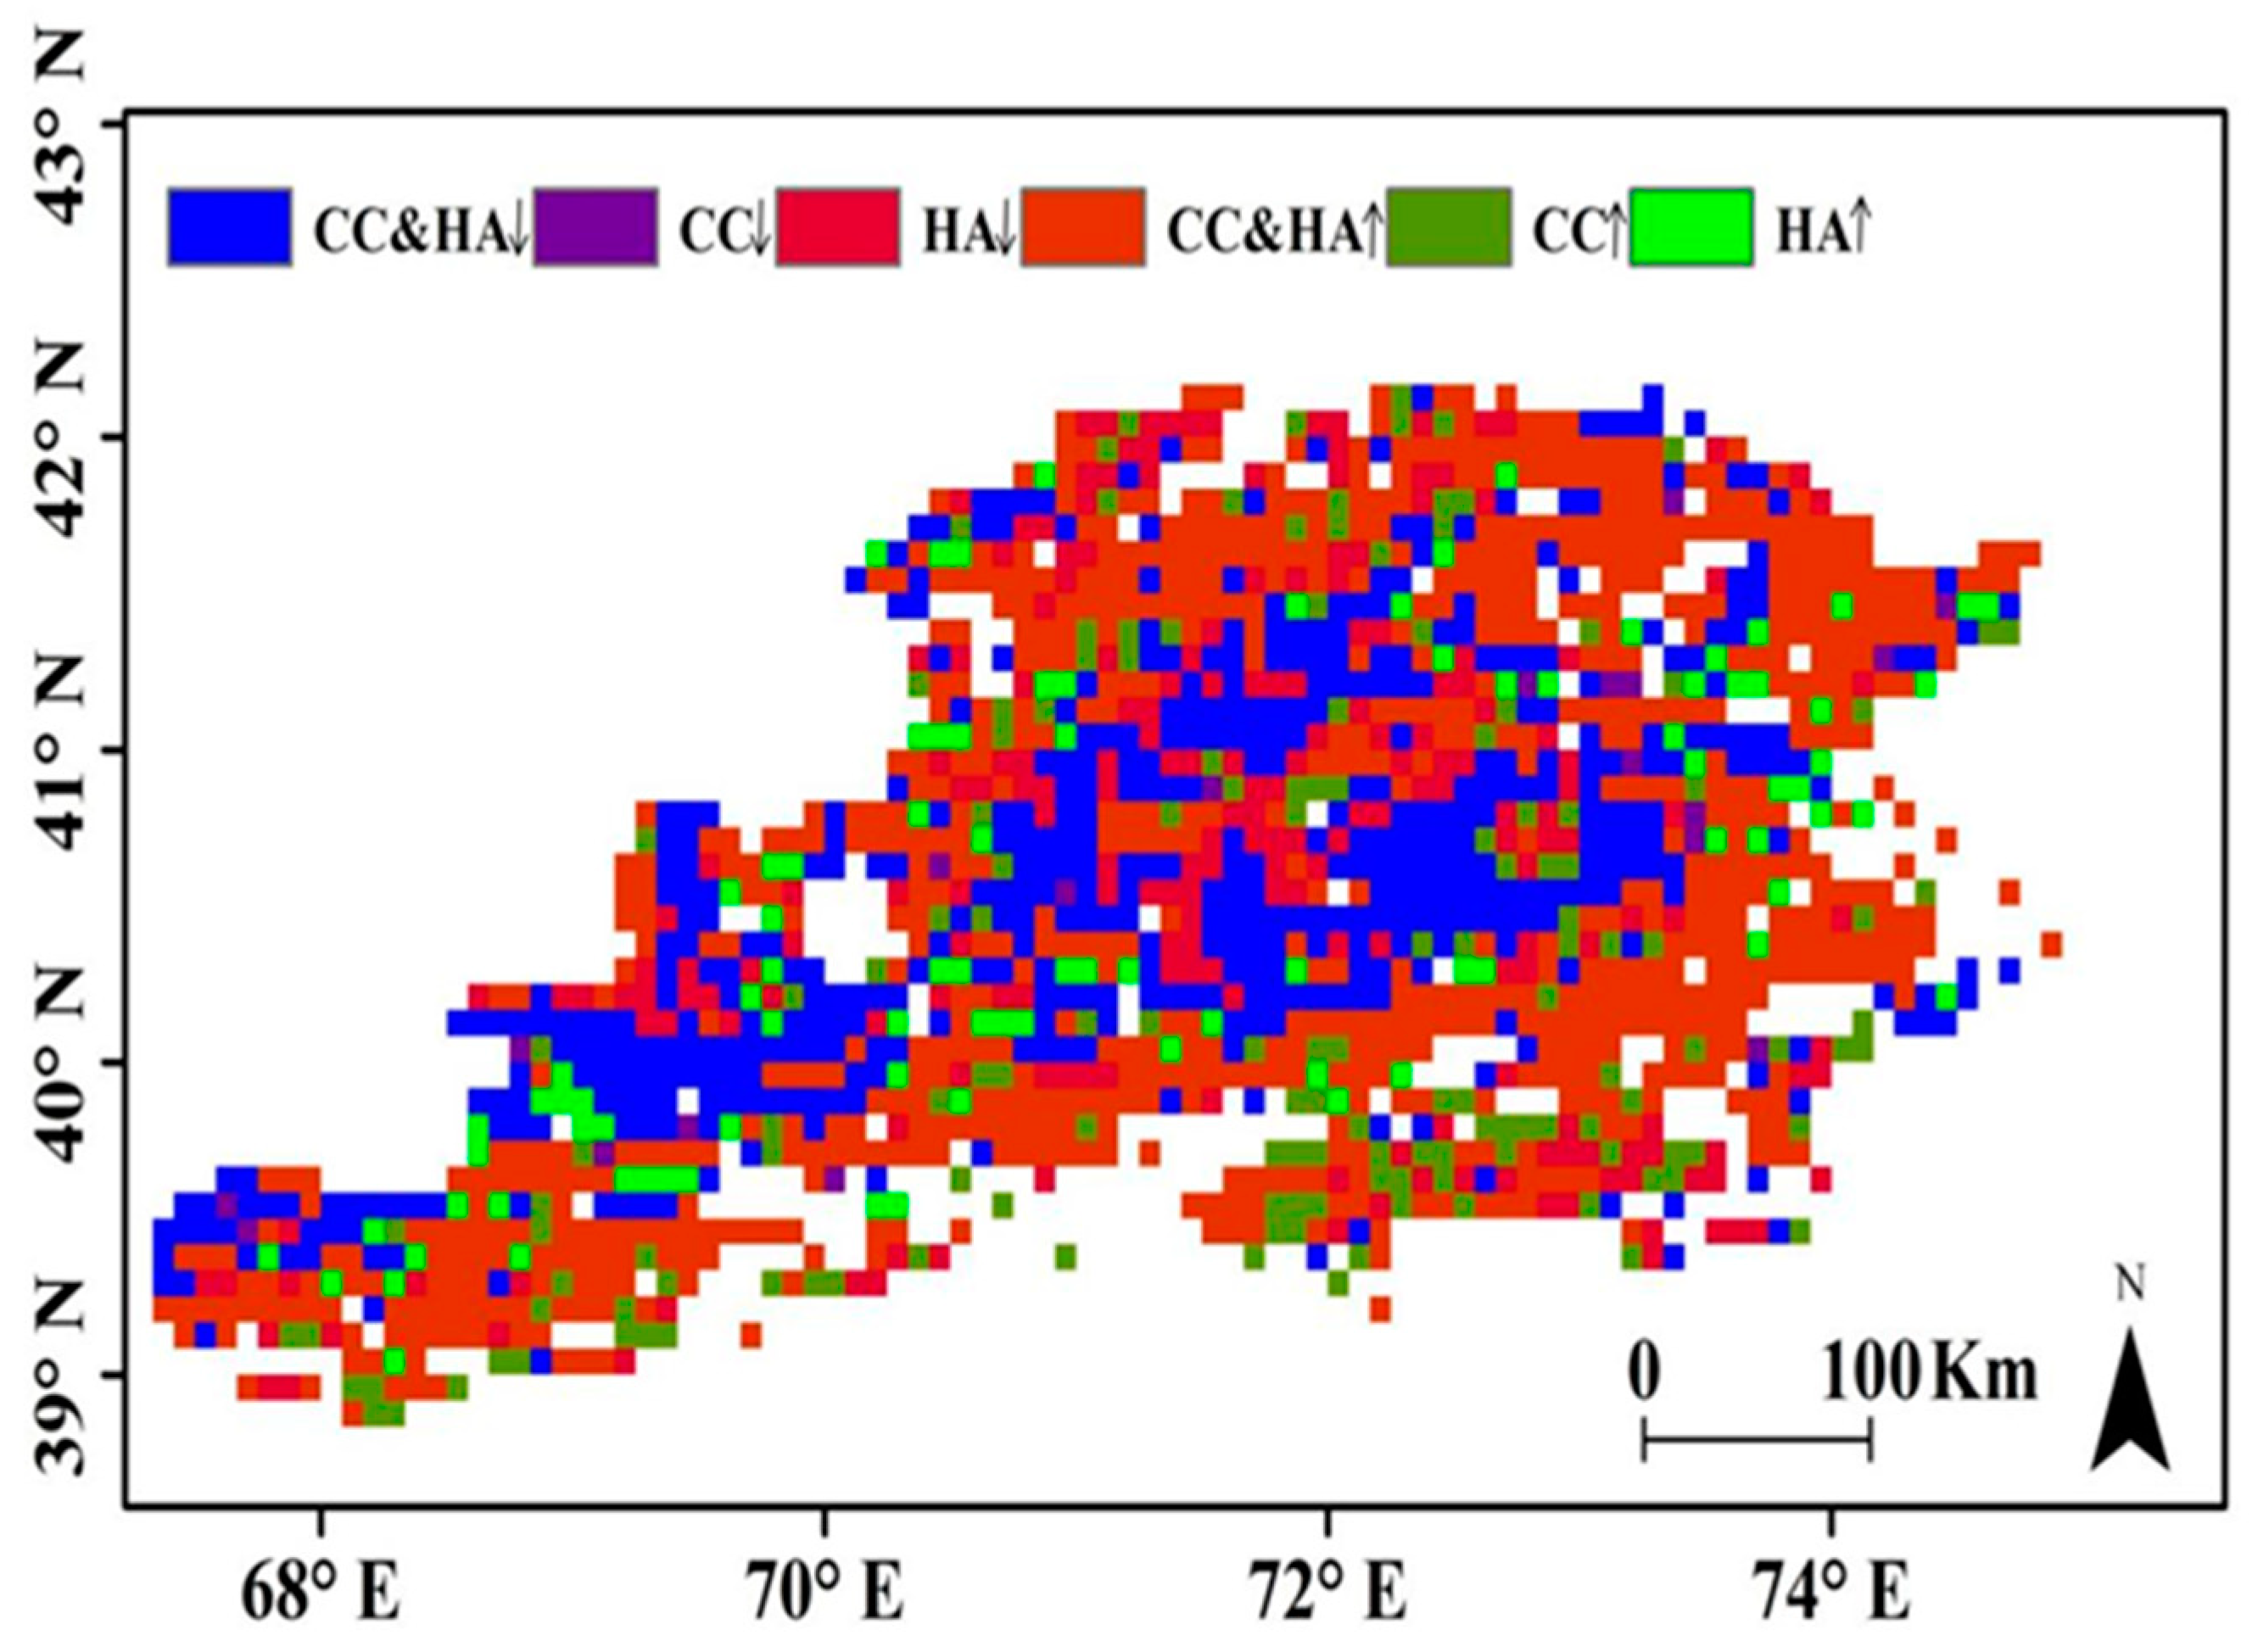
3.4. Vegetation Driving Force Analysis

3.4.1. Spatial Distribution of Vegetation Driving Forces

According to Figure 10, big spatial heterogeneity in the roles of climate shift and human events in NDVI variations in the Ferghana Basin is observed. The role of both factors in changes in NDVI also varies widely for the same region. Overall, about 35.83% of the area in the Ferghana Basin showed that climate variation did not significantly influence the variation of NDVI during the developing season. About 46.94% of the field included where climate variation made contributions to the growth of NDVI in the developing season, and about 11.22% of the area played a moderate and obvious role in promoting the growth season. In about 17.23% of the areas, climate change inhibited the development of NDVI in the developing season, and 16.83% of the areas had moderate and obvious inhibitory effects (Figure 10 and Table 5). In about 42.01% of the field, human activities were in favor of the growth of NDVI during the developing season (Figure 10B and Table 5). In comparison with the role of climate variation, the region where human events were in favor of the development of NDVI in the developing season occupied a smaller ratio. According to further calculations, climate variation and human events influence the variation of NDVI in the average developing season in the Ferghana Basin—0.25 × 10⁻³·a−1 and 3.47 × 10⁻³·a−1, respectively. On the basis of the above results, climate variation and human events in the research area have the largest area promoting NDVI during the developing season.
Figure 11 and Table 6 show that about 44.08% of the area in the Ferghana Basin displays that the integrated role of climate variation and human events is the driving element for the development of NDVI in the developing season. The field of the developing season NDVI increase brought by climate change alone occupied about 8.7%, and the area of the developing season NDVI increase brought by human activities alone occupied about 5.27%. In addition, about 27.65% of the area of the Ferghana Basin shows that the integrated roles of climate variation and human events are the driving elements for reducing NDVI in the developing season. The area of the developing season NDVI decline brought by climate variation alone and human activities alone occupied about 1.09% and 12.36%, and there was a relatively scattered distribution. Generally, the integrated effects of human events and climate variation in the Ferghana Basin area mainly explain the development of vegetative cover NDVI in the Ferghana Basin in the previous 34 years.

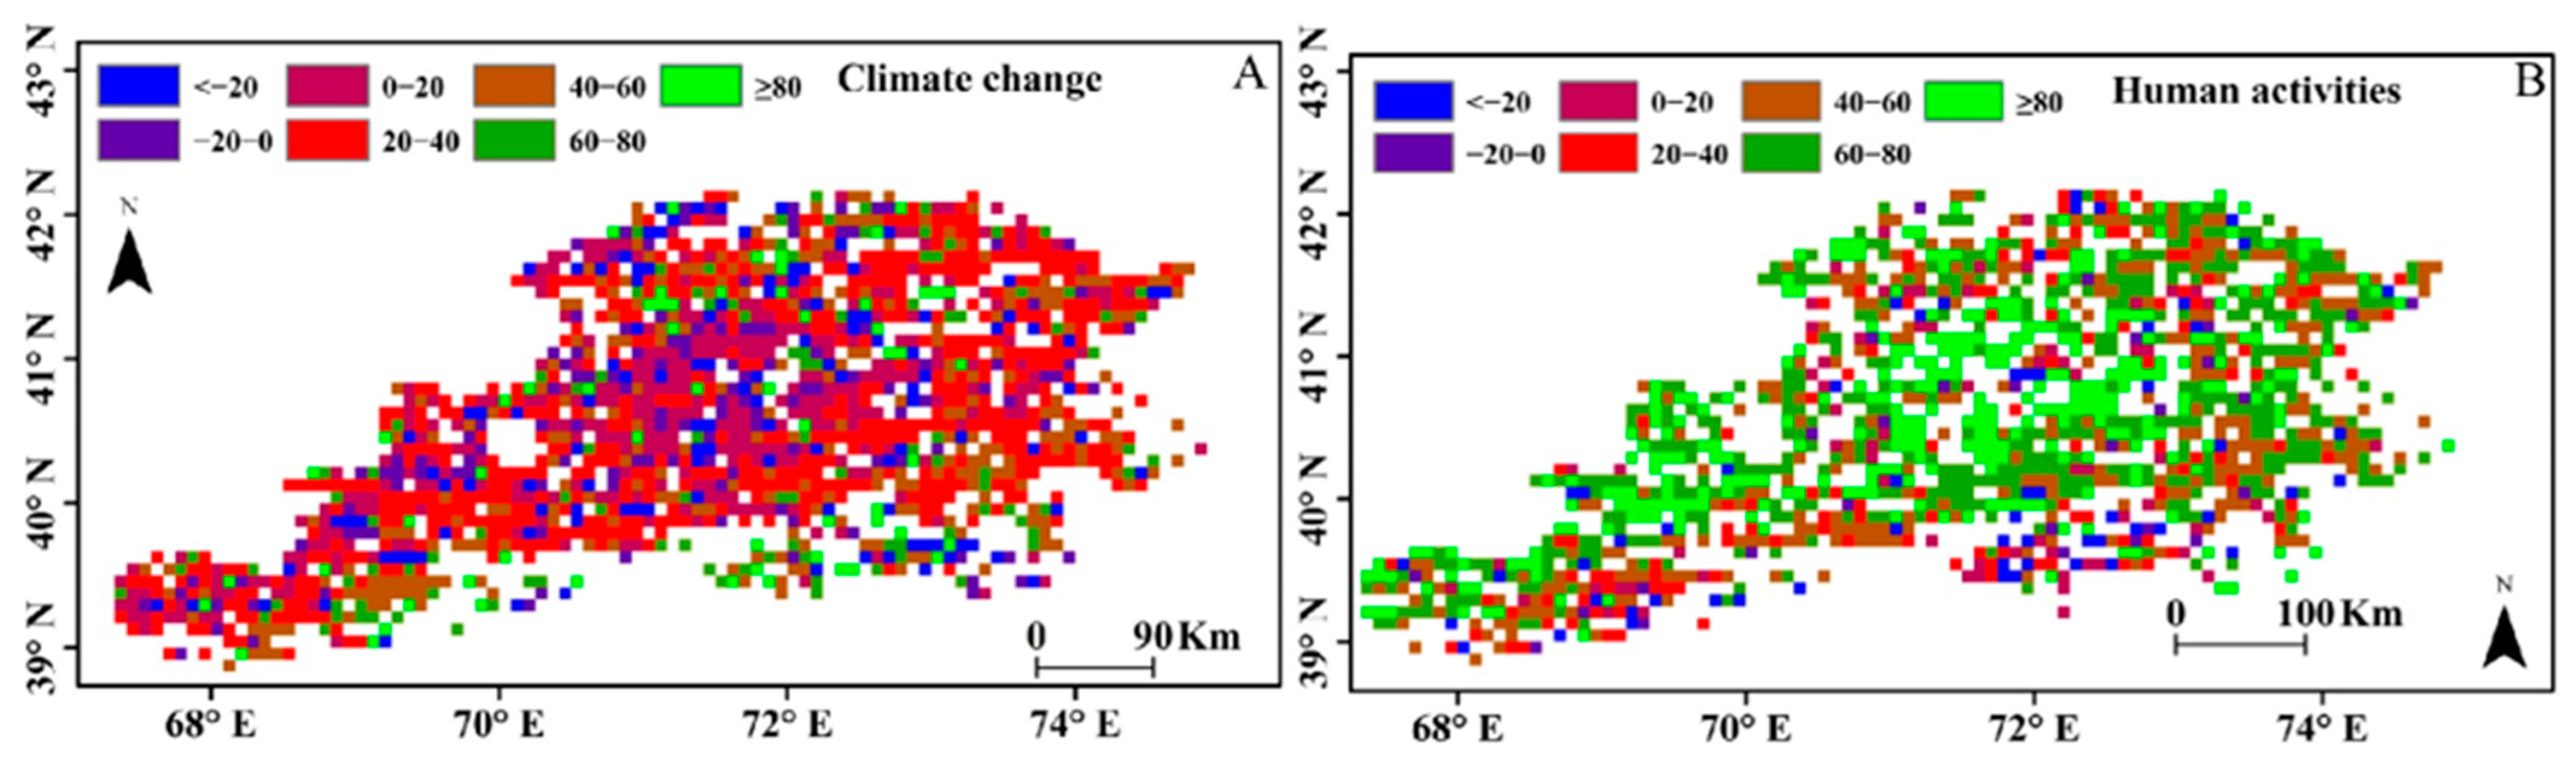
3.4.2. Relative Contributions of Different Drivers to Vegetation NDVI Change

Figure 12 and Table 7 show that 62.32% of the field showing a positive effort rate of climate variation to vegetative cover NDVI variation in the Ferghana Basin is positive. Among them, the area in the range of 20–40% of the effort rate of climate variation is larger, accounting for about 34.34% of the overall region. The region with an effort rate of above 80% accounts for appropriately 3.87%. The effort rate of human events to the NDVI variation of vegetative cover in the Ferghana Basin is positive, occupying appropriately 93.29% of the region (Figure 12). Among them, the field with a positive effort rate of human events was the largest in the scope of 60–80%, accounting for 31.78%. The negative effort of human events to the NDVI variation of vegetative cover in the Ferghana Basin accounts for about 6.71%. In most regions, vegetative cover NDVI showed the greater effort of human events to the growth than climate variation. According to the average tendency of NDVI in the actual developing season and the mean tendency of NDVI in the developing season affected by climate variation and human events, the effort of climate variation and human events to the mean NDVI variation in the developing season in the Ferghana Basin is about 6.72% and 93.28%, respectively.

4. Discussion

4.1. Image Element-Based, Temporal, and Spatial Change in Vegetation NDVI

This research observed that the overall weak fluctuating upward tendency of NDVI in the developing season of vegetation in the Ferghana Basin over the last 34 years conforms to the outcomes of the NDVI growth tendency of vegetation in Central Asia, but in this paper, we found that there was an inflection point in 1999, and then a decreasing trend afterward [52]; In their 1982–2002 study, Suo Yuxia et al., (2009) observed that 39.97% of the vegetation (GIMMS-NDVI) in Central Asia displayed a growing tendency and 6.47% displayed a declining tendency [53]. In the present study, it was found that 24.44% of the vegetation NDVI in the Ferghana Basin significantly increased and 5.9% significantly decreased, while the areas of high fluctuation contain areas of significantly increased vegetation NDVI, which is inconsistent with the outcomes of research on NDVI changes in Central Asia. The above differences may be associated with the extent of the research area and time period.

4.2. Vegetation NDVI Response to Climate Variation

In the current research, the growing trend in annual rainfall and the mean annual air temperature in the Ferghana Basin from 1982 to 2015 with a warm and humid trend were analyzed, which conforms to the general trend of warming and humidification in Central Asia. This research analyzed the association between the vegetative cover NDVI (April–October) reaction to meteorological factors (temperature and precipitation) in 1982–2015 with partial correlation. The outcomes of the analysis displayed that 15.97% of the vegetation NDVI was greatly precorrelated with air temperature and 19.52% was greatly related to rainfall, which may be associated with the differential climate variation related to the research area [54]. The response of meteorological factors to vegetation NDVI in spring, summer, and winter was further analyzed using partial correlation. In spring, the temperature and precipitation together promoted vegetation NDVI, in which 77.90% of vegetation NDVI was positively related to temperature, and 51.73 was positively related to precipitation. In summer, due to the continental arid climate of the study area, 61.79% of vegetation NDVI was negatively related to temperature, and 61.85% was positively related to precipitation, during which evapotranspiration increased and vegetation water demand was high. In autumn, air temperature and rainfall were mainly negatively related to vegetation NDVI, which inhibited the growth of vegetation NDVI. Precipitation and temperature are the main drivers of vegetation dynamics. In the arid and semi-arid regions of Central Asia, precipitation has a greater impact on vegetation than temperature [55]. Figure 9 and Figure 10 illustrate the positive correlation between both temperature and precipitation on vegetation NDVI in some regions. This indicates that both warmer temperatures and increased precipitation favor improved vegetation, but that temperature has a greater effect on vegetation than precipitation. This is due to the fact that precipitation is scarce in the study area and the vegetation is mostly crops, woodlands, etc. Therefore, changes in precipitation have less impact on the vegetation.
The above outcomes conform to the physiological mechanisms of vegetative cover NDVI fertility. In the Ferghana Basin in the last 34 years, the effects of earthquakes, floods, and droughts have disrupted the normal increase in vegetation, leading to a decline in vegetative cover NDVI [56]. The reaction of vegetative cover NDVI to climatic elements in various geographical areas is more complex, and temperature and rainfall, which exert the greatest impact on vegetation development, were selected for analysis, but humidity and sunshine also affect the changes in vegetation NDVI [57], which will be considered in the future.

4.3. Drivers of Vegetation NDVI from Human Events and Climate Variation

This paper displays that the integrated role of climate variation and human events is responsible for the recovery of vegetative cover in most parts of the Ferghana Basin. In addition, climate warming lengthens the vegetative cover development cycle while driving the breakdown of soil organic matters and the discharge of nutrients, favouring accelerated vegetative cover increase [58]. In addition, human activities including enhancing agricultural administration (e.g., fertilizer and irrigation) and carrying out vegetative cover building projects can usefully grow vegetative cover locally or even regionally [59]. While inhibiting the growth of vegetative cover, climate variation and human activities can even result in a more pronounced degradation of vegetative cover in several areas of the Ferghana Basin (Figure 8). It is noteworthy that climate variation negatively affects vegetation changes in several areas (Figure 8 climate change). In addition, there are more obvious negative influences of human events on vegetative cover variations in big urban agglomerations (Figure 8 human activities), which is often due to the encroachment of urbanization growth on agricultural land, forest land, etc. [29]. A large number of studies have shown that climate change and human activities are the main drivers of NDVI changes in vegetation in Central Asia, and the results of this study are consistent with previous studies. Thus, the complex influences of climate variation and human events are crucial for the spatial allocation of NDVI variations in the vegetation of the Ferghana Basin.
However, the current large-scale studies based on spatial data including remote sensing images are still restricted by the data’s low spatial and temporal resolution and the small number of meteorological stations [60]. Moreover, although the research on separating the roles of human activities in vegetative cover NDVI variation had extensively adopted the multiple regression residual analysis approach, it still has several demerits in itself. For instance, while setting up various regression equations between climate elements and NDVI, how to choose climate factors properly is still inconclusive [61]. Additionally, when mentioning human activities, the given parts of human activities have not been considered [62]. Because of the differences in the reaction of vegetation development to different affecting elements in various regions, the above issues and defects can be hardly solved in large-scale studies, which creates some uncertainty in the results. Refining the drivers of vegetation variation, identifying the association between every element and vegetation variation, and assessing the precision of the outcomes through field surveys will assist in reducing the above uncertainties. Overall, the influences of anthropogenic and climate variation on vegetative cover changes and their driving systems at the Ferghana Basin scale still need to be further investigated.

5. Conclusions

Based on temperature, precipitation, and NDVI data, using partial correlation, trend analysis of change, and multiple regression residual analysis, this paper presents a multi-scale discussion on the reaction and drivers of vegetation NDVI variation to meteorological elements and the corresponding contributions in the Ferghana Basin from 1982 to 2015. The major conclusions are presented below:
(1) The total fluctuating tendency of vegetation NDVI in the developing season in the Ferghana Basin from 1982 to 2015 is increasing, with a growing trend in vegetation NDVI from 1982 to 1999 and a declining trend from 2000 onwards. The average trend rate was 0.4 × 10⁻³ a−1, but there was a large spatial variation. Divided according to different densities of vegetation, medium densities dominated the research area, and the tendency of vegetative cover NDVI in the developing season was dominated by a growing trend. (2) The roles of climate variation and human events in the NDVI variation of vegetative cover in the Ferghana Basin are highly spatially varied, but both are dominated by positive influences. The positive influences of human events on vegetative cover NDVI variation are greater than those of climate variation. Overall, the influences of climate variation and human events on the average growing season NDVI variation in the Ferghana Basin from 1982 to 2015 were 0.25 × 10⁻³ a−1 and 3.47 × 10⁻³ a−1. The integrated roles of climate variation and human events are the major driving agents of NDVI variations in vegetative cover in the Ferghana Basin over the last 34 years. (3) Big spatial heterogeneity in the corresponding efforts of climate variation and human events to the vegetative cover NDVI shift in the Ferghana Basin is observed, and the related efforts of climate variation and human events to the vegetative cover NDVI variation in the Ferghana Basin during the developing season over the last 34 years are 6.72% and 93.28%. (4) The percentage of area with moderately volatile variations, a relatively high volatility of variations, and a high volatility of variations in NDVI of vegetation in the Ferghana Basin during the growing season is 77.39%, and the percentage of area with a low volatility of variations and a relatively low volatility of variations is 22.61%.

Author Contributions

Conceptualization, H.Z.; Data curation, H.Z., L.L., X.Z., J.W., Z.F., T.H., Y.C., W.Y., H.S., S.W. and M.H.; Formal analysis, H.Z., L.L. and X.Z.; Funding acquisition, H.Z., F.C. and H.S.; Investigation, H.Z., L.L., X.Z., J.W., Z.F., T.H., Y.C., W.Y., H.S., S.W. and M.H.; Methodology, H.Z., X.Z. and F.C.; Project administration, H.Z. and F.C.; Resources, H.Z.; Software, H.Z. and X.Z.; Supervision, H.Z.; Validation, H.Z.; Visualization, H.Z.; Writing—original draft, H.Z.; Writing—review and editing, H.Z., F.C. and H.S. All authors have read and agreed to the published version of the manuscript.

Funding

This research was funded by Natural Science Foundation of Xinjiang Province of China (No. 2021D01B118); supported by the Natural Science Foundation of China (No. 32061123008); Key 355 Laboratory of Xinjiang Province of China (No. 2022D04005); China Desert Weather Scientific 356 Research Fund (Sqj2019002); and Natural Science Foundation of Xinjiang Province of China (No. 2021D01B116).

Data Availability Statement

Data are contained within the article.

Conflicts of Interest

The authors declare that the research was conducted in the absence of any commercial or financial relationships that could be construed as potential conflicts of interest.

References

  1. Adedeji, O.; Reuben, O.; Olatoye, O. Global Climate Change. J. Geosci. Environ. Prot. 2014, 2, 114. [Google Scholar] [CrossRef]
  2. Huppert, H.E.; Sparks, R.S.J. Extreme Natural Hazards: Population Growth, Globalization and Environmental Change. Philos. Trans. R. Soc. A Math. Phys. Eng. Sci. 2006, 364, 1875–1888. [Google Scholar] [CrossRef]
  3. Abbass, K.; Qasim, M.Z.; Song, H.; Murshed, M.; Mahmood, H.; Younis, I. A Review of the Global Climate Change Impacts, Adaptation, and Sustainable Mitigation Measures. Environ. Sci. Pollut. Res. 2022, 29, 42539–42559. [Google Scholar] [CrossRef]
  4. Feng, S.; Liu, X.; Mao, X. Vegetation Dynamics in Arid Central Asia over the Past Two Millennia Linked to NAO Variability and Solar Forcing. Quat. Sci. Rev. 2023, 310, 108134. [Google Scholar] [CrossRef]
  5. Liu, L.; Peng, J.; Li, G.; Guan, J.; Han, W.; Ju, X.; Zheng, J. Effects of Drought and Climate Factors on Vegetation Dynamics in Central Asia from 1982 to 2020. J. Environ. Manag. 2023, 328, 116997. [Google Scholar] [CrossRef]
  6. Xu, M.; Wang, X.; Sun, T.; Wu, H.; Li, X.; Kang, S. Water Balance Change and Its Implications to Vegetation in the Tarim River Basin, Central Asia. Quat. Int. 2019, 523, 25–36. [Google Scholar] [CrossRef]
  7. Vicente-Serrano, S.M.; Camarero, J.J.; Olano, J.M.; Martín-Hernández, N.; Peña-Gallardo, M.; Tomás-Burguera, M.; Gazol, A.; Azorin-Molina, C.; Bhuyan, U.; El Kenawy, A. Diverse Relationships between Forest Growth and the Normalized Difference Vegetation Index at a Global Scale. Remote Sens. Environ. 2016, 187, 14–29. [Google Scholar] [CrossRef]
  8. Zhang, H.; Ma, J.; Chen, C.; Tian, X. NDVI-Net: A fusion network for generating high-resolution normalized difference vegetation index in remote sensing. ISPRS J. Photogramm. Remote Sens. 2020, 168, 182–196. [Google Scholar] [CrossRef]
  9. Li, H.; Yang, X.; Zhang, K. Understanding global land degradation processes interacted with complex biophysics and socioeconomics from the perspective of the Normalized Difference Vegetation Index (1982–2015). Glob. Planet. Change 2021, 198, 103431. [Google Scholar] [CrossRef]
  10. Bai, Y.; Li, S.; Zhou, J.; Liu, M.; Guo, Q. Revisiting Vegetation Activity of Mongolian Plateau Using Multiple Remote Sensing Datasets. Agric. For. Meteorol. 2023, 341, 109649. [Google Scholar] [CrossRef]
  11. Xu, Z.; Li, Y.; Qin, Y.; Bach, E. A Global Assessment of the Effects of Solar Farms on Albedo, Vegetation, and Land Surface Temperature Using Remote Sensing. Sol. Energy 2024, 268, 112198. [Google Scholar] [CrossRef]
  12. Ren, Y.; Zhang, F.; Zhao, C.; Cheng, Z. Attribution of Climate Change and Human Activities to Vegetation NDVI in Jilin Province, China during 1998–2020. Ecol. Indic. 2023, 153, 110415. [Google Scholar] [CrossRef]
  13. Ding, Y.; He, X.; Zhou, Z.; Hu, J.; Cai, H.; Wang, X.; Li, L.; Xu, J.; Shi, H. Response of Vegetation to Drought and Yield Monitoring Based on NDVI and SIF. CATENA 2022, 219, 106328. [Google Scholar] [CrossRef]
  14. Zhou, Y.; Batelaan, O.; Guan, H.; Liu, T.; Duan, L.; Wang, Y.; Li, X. Assessing Long-Term Trends in Vegetation Cover Change in the Xilin River Basin: Potential for Monitoring Grassland Degradation and Restoration. J. Environ. Manag. 2024, 349, 119579. [Google Scholar] [CrossRef] [PubMed]
  15. Yi, K.; Zhao, X.; Zheng, Z.; Zhao, D.; Zeng, Y. Trends of Greening and Browning in Terrestrial Vegetation in China from 2000 to 2020. Ecol. Indic. 2023, 154, 110587. [Google Scholar] [CrossRef]
  16. Han, Y.; Lu, H.; Qiao, D. Integrated Effects of Meteorological Factors, Edaphic Moisture, Evapotranspiration, and Leaf Area Index on the Net Primary Productivity of Winter Wheat − Summer Maize Rotation System. Field Crops Res. 2023, 302, 109080. [Google Scholar] [CrossRef]
  17. Huang, X.; Lin, D.; Mao, X.; Zhao, Y. Multi-Source Data Fusion for Estimating Maize Leaf Area Index over the Whole Growing Season under Different Mulching and Irrigation Conditions. Field Crops Res. 2023, 303, 109111. [Google Scholar] [CrossRef]
  18. Verrelst, J.; Halabuk, A.; Atzberger, C.; Hank, T.; Steinhauser, S.; Berger, K. A Comprehensive Survey on Quantifying Non-Photosynthetic Vegetation Cover and Biomass from Imaging Spectroscopy. Ecol. Indic. 2023, 155, 110911. [Google Scholar] [CrossRef]
  19. Liu, Z.; Wu, C.; Liu, Y.; Wang, X.; Fang, B.; Yuan, W.; Ge, Q. Spring green-up date derived from GIMMS3g and SPOT-VGT NDVI of winter wheat cropland in the North China Plain. ISPRS J. Photogramm. Remote Sens. 2017, 130, 81–91. [Google Scholar] [CrossRef]
  20. Fensholt, R.; Rasmussen, K.; Nielsen, T.T.; Mbow, C. Evaluation of Earth Observation Based Long Term Vegetation Trends—Intercomparing NDVI Time Series Trend Analysis Consistency of Sahel from AVHRR GIMMS, Terra MODIS and SPOT VGT Data. Remote Sens. Environ. 2009, 113, 1886–1898. [Google Scholar] [CrossRef]
  21. Li, S.; Xu, L.; Chen, J.; Jiang, Y.; Sun, S.; Yu, S.; Tan, Z.; Li, X. Monitoring Vegetation Dynamics (2010–2020) in Shengnongjia Forestry District with Cloud-Removed MODIS NDVI Series by a Spatio-Temporal Reconstruction Method. Egypt. J. Remote Sens. Space Sci. 2023, 26, 527–543. [Google Scholar] [CrossRef]
  22. Tarnavsky, E.; Garrigues, S.; Brown, M.E. Multiscale Geostatistical Analysis of AVHRR, SPOT-VGT, and MODIS Global NDVI Products. Remote Sens. Environ. 2008, 112, 535–549. [Google Scholar] [CrossRef]
  23. Santamaria-Artigas, A.; Vermote, E.; Franch, B.; Roger, J.; Skakun, S. Evaluation of the AVHRR surface reflectance long term data record between 1984 and 2011. Int. J. Appl. Earth Obs. Geoin. 2021, 98, 102317. [Google Scholar] [CrossRef]
  24. Mao, D.; Wang, Z.; Luo, L.; Ren, C. Integrating AVHRR and MODIS Data to Monitor NDVI Changes and Their Relationships with Climatic Parameters in Northeast China. Int. J. Appl. Earth Obs. Geoinf. 2012, 18, 528–536. [Google Scholar] [CrossRef]
  25. Zhang, Y.; Zhu, Z.; Liu, Z.; Zeng, Z.; Ciais, P.; Huang, M.; Liu, Y.; Piao, S. Seasonal and Interannual Changes in Vegetation Activity of Tropical Forests in Southeast Asia. Agric. For. Meteorol. 2016, 224, 1–10. [Google Scholar] [CrossRef]
  26. Zhang, X.; Li, X. An Innovative Index for Separating the Effects of Temperature and Precipitation on Global Vegetation Change. iScience 2023, 26, 106972. [Google Scholar] [CrossRef] [PubMed]
  27. Han, Q.; Li, C.; Zhao, C.; Zhang, Y.; Li, S. Grazing decreased water use efficiency in Central Asia from 1979 to 2011. Ecol. Modell. 2018, 388, 72–79. [Google Scholar] [CrossRef]
  28. Hwang, Y.; Ryu, Y.; Qu, S. Expanding Vegetated Areas by Human Activities and Strengthening Vegetation Growth Concurrently Explain the Greening of Seoul. Landsc. Urban Plan. 2022, 227, 104518. [Google Scholar] [CrossRef]
  29. Jin, K.; Wang, F.; Li, P. Responses of Vegetation Cover to Environmental Change in Large Cities of China. Sustainability 2018, 10, 270. [Google Scholar] [CrossRef]
  30. Zhao, A.; Zhang, A.; Liu, X.; Cao, S. Spatiotemporal Changes of Normalized Difference Vegetation Index (NDVI) and Response to Climate Extremes and Ecological Restoration in the Loess Plateau, China. Theor. Appl. Clim. 2018, 132, 555–567. [Google Scholar] [CrossRef]
  31. Liu, Y.; Li, Y.; Li, S.; Motesharrei, S. Spatial and Temporal Patterns of Global NDVI Trends: Correlations with Climate and Human Factors. Remote Sens. 2015, 7, 13233–13250. [Google Scholar] [CrossRef]
  32. Fang, J.; Song, Y.; Liu, H.; Piao, S. Vegetation-climate relationship and its application in the division of vegetation zone in Chin. Acta Bot. Sin. 2002, 44, 1105–1122. [Google Scholar]
  33. Wang, A.; Gao, X.; Zhou, Z.; Siddique, K.; Yang, H.; Wang, J.; Zhang, S.; Zhao, X. A novel index for vegetation drought assessment based on plant water metabolism and balance under vegetation restoration on the Loess Plateau. Sci. Total Environ. 2024, 918, 170549. [Google Scholar] [CrossRef] [PubMed]
  34. Piao, S.; Yin, G.; Tan, J.; Cheng, L.; Huang, M.; Li, Y.; Liu, R.; Mao, J.; Myneni, R.B.; Peng, S.; et al. Detection and Attribution of Vegetation Greening Trend in China over the Last 30 Years. Glob. Change Biol. 2015, 21, 1601–1609. [Google Scholar] [CrossRef] [PubMed]
  35. Xiao-Yan, L.I. Research on Spatial and Temporal Changes of Vegetation Cover and Response to Climate Factors in Hanjiang Basin. J. Northwest Norm. Univ. Nat. Sci. 2013, 49, 102–106. [Google Scholar]
  36. Shi, H.; Li, T.; Wei, J. Evaluation of the Gridded CRU TS Precipitation Dataset with the Point Raingauge Records over the Three-River Headwaters Region. J. Hydrol. 2017, 548, 322–332. [Google Scholar] [CrossRef]
  37. Zhang, Y.; Zhao, Z.; Li, S.; Meng, X. Indicating Variation of Surface Vegetation Cover Using SPOT NDVI in the Northern Part of North China. Geogr. Res. 2008, 27, 745–754. [Google Scholar] [CrossRef]
  38. Zhang, Q.; Kong, D.; Singh, V.P.; Shi, P. Response of Vegetation to Different Time-Scales Drought across China: Spatiotemporal Patterns, Causes and Implications. Glob. Planet. Change 2017, 152, 1–11. [Google Scholar] [CrossRef]
  39. Tucker, C.J.; Pinzon, J.E.; Brown, M.E.; Slayback, D.A.; Pak, E.W.; Mahoney, R.; Vermote, E.F.; El Saleous, N. An Extended AVHRR 8-km NDVI Dataset Compatible with MODIS and SPOT Vegetation NDVI Data. Int. J. Remote Sens. 2005, 26, 4485–4498. [Google Scholar] [CrossRef]
  40. Vicente-Serrano, S.M.; Gouveia, C.; Camarero, J.J.; Beguería, S.; Trigo, R.; López-Moreno, J.I.; Azorín-Molina, C.; Pasho, E.; Lorenzo-Lacruz, J.; Revuelto, J.; et al. Response of Vegetation to Drought Time-Scales across Global Land Biomes. Proc. Natl. Acad. Sci. USA 2013, 110, 52–57. [Google Scholar] [CrossRef]
  41. Gouveia, C.M.; Trigo, R.M.; Beguería, S.; Vicente-Serrano, S.M. Drought Impacts on Vegetation Activity in the Mediterranean Region: An Assessment Using Remote Sensing Data and Multi-Scale Drought Indicators. Glob. Planet. Change 2017, 151, 15–27. [Google Scholar] [CrossRef]
  42. Li, C.; Leal Filho, W.; Yin, J.; Hu, R.; Wang, J.; Yang, C.; Yin, S.; Bao, Y.; Ayal, D.Y. Assessing Vegetation Response to Multi-Time-Scale Drought across Inner Mongolia Plateau. J. Clean. Prod. 2018, 179, 210–216. [Google Scholar] [CrossRef]
  43. Ma, M.; Wang, Q.; Liu, R.; Zhao, Y.; Zhang, D. Effects of climate change and human activities on vegetation coverage change in northern China considering extreme climate and time-lag and -accumulation effects. Sci. Total Environ. 2023, 860, 160527. [Google Scholar] [CrossRef] [PubMed]
  44. Zhang, X.; Liu, L.; Chen, X.; Gao, Y.; Xie, S.; Mi, J. GLC_FCS30: Global Land-Cover Product with Fine Classification System at 30 m Using Time-Series Landsat Imagery. Earth Syst. Sci. Data 2021, 13, 2753–2776. [Google Scholar] [CrossRef]
  45. Wang, F.; Ge, Q.; Wang, S.; Li, Q.; Jones, P.D. A New Estimation of Urbanization’s Contribution to the Warming Trend in China. J. Clim. 2015, 28, 8923–8938. [Google Scholar] [CrossRef]
  46. Zhou, L.; Tucker, C.J.; Kaufmann, R.K.; Slayback, D.; Shabanov, N.V.; Myneni, R.B. Variations in Northern Vegetation Activity Inferred from Satellite Data of Vegetation Index during 1981 to 1999. J. Geophys. Res. Atmos. 2001, 106, 20069–20083. [Google Scholar] [CrossRef]
  47. Zhong, R.; Wang, P.; Mao, G.; Chen, A.; Liu, J. Spatiotemporal Variation of Enhanced Vegetation Index in the Amazon Basin and Its Response to Climate Change. Phys. Chem. Earth Parts A/B/C 2021, 123, 103024. [Google Scholar] [CrossRef]
  48. Wessels, K.J.; Prince, S.D.; Malherbe, J.; Small, J.; Frost, P.E.; VanZyl, D. Can Human-Induced Land Degradation Be Distinguished from the Effects of Rainfall Variability? A Case Study in South Africa. J. Arid Environ. 2007, 68, 271–297. [Google Scholar] [CrossRef]
  49. Evans, J.; Geerken, R. Discrimination between Climate and Human-Induced Dryland Degradation. J. Arid Environ. 2004, 57, 535–554. [Google Scholar] [CrossRef]
  50. Sun, W.; Song, X.; Mu, X.; Gao, P.; Wang, F.; Zhao, G. Spatiotemporal Vegetation Cover Variations Associated with Climate Change and Ecological Restoration in the Loess Plateau. Agric. For. Meteorol. 2015, 209–210, 87–99. [Google Scholar] [CrossRef]
  51. Zhao, K.; Shi, Y.; Niu, M. Research on the Temporal and Spatial Changes of Vegetation Coverage in Qinling Mountains Based on Google Earth Engine Platform. Bull. Surv. Mapp. 2022, 5, 49–55. [Google Scholar] [CrossRef]
  52. Shihua, Z.; Fang, X.; Hang, X.; Xiaoping, X.; Liangxiao, S.; Liangzhong, G. Normalized Difference Vegetation index (NDVI) dynamics of Grassland in Central Asia and Its Response to Climate Change and Human Activities. J. Desert Res. 2022, 42, 229–241. [Google Scholar]
  53. Yuxia, S.; Zhengxing, W.; Chuang, L.; Bohua, Y.U. Relationship between NDVI and Precipitation and Temperature in Middle Asia during 1982–2002. Resour. Sci. 2009, 31, 1422–1429. [Google Scholar]
  54. Gong, Z.; Peng, D.; Wen, J.; Cai, Z.; Wang, T.; Hu, Y.; Ma, Y.; Xu, J. Research on Trend of Warm-Humid Climate in Central Asia. IOP Conf. Ser. Earth Environ. Sci. 2017, 74, 012017. [Google Scholar] [CrossRef]
  55. Chen, T.; Tang, G.; Yuan, Y.; Guo, H.; Xu, Z.; Jiang, G.; Chen, X. Unraveling the Relative Impacts of Climate Change and Human Activities on Grassland Productivity in Central Asia over Last Three Decades. Sci. Total Environ. 2020, 743, 140649. [Google Scholar] [CrossRef] [PubMed]
  56. Yin, G.; Hu, Z.; Chen, X.; Tiyip, T. Vegetation Dynamics and Its Response to Climate Change in Central Asia. J. Arid Land 2016, 8, 375–388. [Google Scholar] [CrossRef]
  57. Liu, J.; Wen, Z.; Gang, C. Normalized Difference Vegetation Index of Different Vegetation Cover Types and Its Responses to Climate Change in the Loess Plateau. Acta Ecol. Sin. 2020, 40, 678–691. [Google Scholar]
  58. Li, J.; Liu, H.; Li, L. Changes of Green-up Day of Vegetation Growing Season Based on GIMMS 3g NDVI in Northern China in Recent 30 Years. Acta Geogr. Sin. 2017, 37, 620–629. [Google Scholar] [CrossRef]
  59. Zhang, Z.; Zhao, W.; Liu, Y.; Pereira, P. Impacts of urbanisation on vegetation dynamics in Chinese cities. Environ. Impact Assess. Rev. 2023, 103, 107227. [Google Scholar] [CrossRef]
  60. Zhang, B.; Wu, P.; Zhao, X. Detecting and Analysis of Spatial and Temporal Variation of Vegetation Cover in the Loess Plateau during 1982-2009. Trans. Chin. Soc. Agric. Eng. 2011, 27, 287–293. [Google Scholar]
  61. Tian, H. Assessment of Non-Climate Triggered Vegetation Trends in China from Time Series of Remotely Sensed Data: A Case Study of Government-Dominated Forest Construction. Ph.D. Thesis, Institute of Remote Sensing and Digital Earth, Chinese Academy of Sciences, Beijing, China, 2017. [Google Scholar]
  62. Liu, X.; Zhu, X.; Pan, Y.; Li, S.; Ma, Y.; Nie, J. Vegetation Dynamics in Qinling-Daba Mountains in Relation to Climate Factors between 2000 and 2014. J. Geogr. Sci. 2016, 26, 45–58. [Google Scholar] [CrossRef]
Figure 1. Overview of the study area in the Ferghana Basin.
Remotesensing 16 01296 g001
Figure 2. Thirty-meter land cover types in the Ferghana Basin, 2010, 10—Rainfed cropland, 11—Herbaceous cover, 20—Irrigated cropland, 61—Open deciduous broadleaved forest, 62—Closed deciduous broadleaved forest, 71—Open evergreen needle-leaved forest, 72—Closed evergreen needle-leaved forest, 81—Open deciduous needle-leaved forest, 82—Closed deciduous needle-leaved forest, 120—Shrubland, 122—Deciduous shrubland, 130—Grassland, 140—Lichens and mosses, 150—Sparse vegetation, 180—Wetlands, 190—Impervious surfaces, 200—Bare areas, 201—Consolidated bare areas, 202—Unconsolidated bare areas, 210—Water body, 220—Permanent ice and snow.
Remotesensing 16 01296 g002
Figure 3. Interannual change of NDVI during developing season in the Ferghana Basin from 1982 to 2015.
Remotesensing 16 01296 g003
Figure 4. Spatial distribution of multi-year mean NDVI in vegetation growing season from 1982 to 2015.
Remotesensing 16 01296 g004
Figure 5. Significant distribution of NDVI changes in vegetation growing season from 1982 to 2015. (A): NDVI trend, (B): NDVI Trend Significance.
Remotesensing 16 01296 g005
Figure 6. Coefficient of variation of NDVI in the study area, 1982–2015.
Remotesensing 16 01296 g006
Figure 7. Interannual and growing season variations in climate factors in the study area, 1982−2015. (A): April−October factors; (B): Annual factors.
Remotesensing 16 01296 g007
Figure 8. Spatial distribution of biased correlations between NDVI and climate factors for growing season vegetation from 1982−2015. (A): Growing season NDVI is biased with precipitation; (B): Growing season NDVI is biased with temperature.
Remotesensing 16 01296 g008
Figure 9. (AC): Spring, summer, and autumn vegetation NDVI bias correlation with precipitation; (DF): Spring, summer, and autumn vegetation NDVI bias correlation with temperature.
Remotesensing 16 01296 g009
Figure 10. Spatial distribution of the impacts of climatic change and human activities on vegetation restoration in Ferghana Basin during 1982–2015. (A): Climate change; (B): Human activities.
Remotesensing 16 01296 g010
Figure 11. Spatial distribution of driving factors of vegetation cover change in the Ferghana Basin from 1982 to 2015 (CC and HA refer to climate change and human activities, respectively), ↑ represents an increase, ↓ represents a decrease.
Remotesensing 16 01296 g011
Figure 12. Spatial distribution of the contribution rate of climate change and human activities to vegetation cover change in the Ferghana Basin from 1982 to 2015. (A): Climate change; (B): Human activities.
Remotesensing 16 01296 g012
Table 1. Categorization of the influences of climatic variation and human events on vegetative cover recovery (10−3·a−1).
Slope (NDVI) 1<−2.0−1–0.8−0.8–0.4−0.4–0.20.2–1.01.0–2.0≥2.0
Level of impactGreat controlModerate controlSlight controlBasically no influenceSlight drivenModerately drivenGreatly driven
Note: 1 Growing season NDVI change under the influence of climate change or human activities trends, i.e., slopes (NDVICC) or slopes (NDVIHA).
Table 2. Recognition standard and effort calculation of the driving agents of NDVI variation.
Slope (NDVIobs) aDriversCriteria for Dividing the DriversContribution of Drivers (%)
Slope (NDVICC) bSlope (NDVIHA) cClimatic ChangeHuman Activities
>0CC and HA>0>0 s l o p e   N D V I C C s l o p e   N D V I o b s s l o p e   N D V I H A s l o p e   N D V I o b s
CC>0<01000
HA<0>00100
<0CC and HA<0<0 s l o p e   N D V I C C s l o p e   N D V I o b s s l o p e   N D V I H A s l o p e   N D V I o b s
CC<0>01000
HA>0<00100
Note: a–c mean the tendency rate of developing season NDVI discoveries on basis of remote sensing data, the tendency rate of developing season NDVI predictions on basis of binary regression analysis, and the tendency rate of growing season NDVI residuals. Among them, b and c mean the tendency of NDVI in the developing season, influenced by climate variation and human events.
Table 3. Coefficients of variation of NDVI for 34a years in the study area.
Degree of VariationRange of Variation of CvPixel Percentage (%)
Low volatility variationsCV < 0.051.43
Relatively low volatility of variations0.05 ≤ CV 0.1021.18
Moderately volatile variations0.10 ≤ CV < 0.1525.07
Relatively high volatility of variations 0.15 ≤ CV 0.2016.66
High volatility variationsCV > 0.2035.66
Table 4. Percentage of image elements correlating vegetation NDVI deviation with precipitation and temperature in spring, summer, and autumn.
Significant CorrelationPixel Percentage (%)
Spring Temperature-NDVISpring Precipitation-NDVISummer Temperature-NDVISummer Precipitation-NDVIAutumn Temperature-NDVIAutumn Precipitation-NDVI
No significant negative correlation20.7843.5753.6136.9770.0256.84
Significant negative correlation0.883.395.750.832.6217.06
Extremely significant negative correlation0.441.322.430.360.0820.27
Extremely significant positive correlation9.292.701.180.710.005.83
Significant positive correlation14.195.462.553.260.080.00
No significant positive correlation54.4343.5734.4857.8827.200.00
Table 5. Spatial image metric share of the impact of climate change and human activities on vegetation restoration in the Ferghana Basin, 1982–2015.
Impact on Vegetation RestorationPixel Percentage (%)
Significant InhibitionModerate InhibitionSlight InhibitionBasically No ImpactSlight PromotedModerately PromotedSignificantly Promoted
Climatic change41.8416.9421.923.432.924.128.82
Human activities6.126.4712.828.1312.4212.6541.39
Table 6. Spatial distribution of drivers of vegetation cover changes in the Ferghana Basin, 1982–2015, as a percentage of statistical metrics.
NDVI TrendDriving ForcePixel Percentage (%)
>0CC and HA44.08
CC8.70
HA6.13
<0CC and HA27.65
CC1.09
HA12.36
Table 7. Spatial distribution of the contribution of climate change and human activities to changes in vegetation cover in the Ferghana Basin, 1982–2015, like meta-percentages.
Contribution Rate (%)Pixel Percentage (%)
≤−20−20−00−2020−4040−6060−8080−100
Climate change24.434.525.8813.5716.9716.2918.33
Human activities26.3612.2112.2112.2116.2811.439.30
Disclaimer/Publisher’s Note: The statements, opinions and data contained in all publications are solely those of the individual author(s) and contributor(s) and not of MDPI and/or the editor(s). MDPI and/or the editor(s) disclaim responsibility for any injury to people or property resulting from any ideas, methods, instructions or products referred to in the content.

