Article

Lunar Surface Resource Exploration: Tracing Lithium, 7 Li and Black Ice Using Spectral Libraries and Apollo Mission Samples

by
Susana del Carmen Fernández
1,*,
Fernando Alberquilla
2,
Julia María Fernández
3,
Enrique Díez
3,
Javier Rodríguez
3,
Rubén Muñiz
4,
Javier F. Calleja
5,
Francisco Javier de Cos
3 and
Jesús Martínez-Frías
6
1
Departamento de Geología e Instituto Universitario de Ciencias y Tecnologías Espaciales de Asturias (ICTEA), Universidad de Oviedo, Independencia 13, 33004 Oviedo, Spain
2
Departamento Química Analítica de la Universidad del País Vasco (UPV/EHU) Barrio Sarriena s/n, 48940 Leioa-Bizkaia, Spain
3
Instituto Universitario de Ciencias y Tecnologías Espaciales de Asturias (ICTEA), Universidad de Oviedo, Independencia 13, 33004 Oviedo, Spain
4
Departmento de Informática, Universidad de Oviedo, 33003 Oviedo, Spain
5
Departmento de Física, Universidad de Oviedo, 33003 Oviedo, Spain
6
Instituto de Geociencias, Consejo Superior de Investigaciones Cientificas, Universidad Complutense Madrid, 28040 Madrid, Spain
*
Author to whom correspondence should be addressed.
Remote Sens. 2024, 16(7), 1306; https://doi.org/10.3390/rs16071306
Submission received: 20 February 2024 / Revised: 18 March 2024 / Accepted: 4 April 2024 / Published: 8 April 2024
(This article belongs to the Special Issue Future of Lunar Exploration)

Abstract

:
This is an exercise to explore the concentration of lithium, lithium-7 isotope and the possible presence of black dirty ice on the lunar surface using spectral data obtained from the Clementine mission. The main interest in tracing the lithium and presence of dark ice on the lunar surface is closely related to future human settlement missions on the moon. We investigate the distribution of lithium and 7 Li isotope on the lunar surface by employing spectral data from the Clementine images. We utilized visible (VIS–NIR) imagery at wavelengths of 450, 750, 900, 950 and 1000 nm, along with near-infrared (NIR–SWIR) at 1100, 1250, 1500, 2000, 2600 and 2780 nm, encompassing 11 bands in total. This dataset offers a comprehensive coverage of about 80% of the lunar surface, with resolutions ranging from 100 to 500 m, spanning latitudes from 80°S to 80°N. In order to extract quantitative abundance of lithium, ground-truth sites were used to calibrate the Clementine images. Samples (specifically, 12045, 15058, 15475, 15555, 62255, 70035, 74220 and 75075) returned from Apollo missions 12, 15, 16 and 17 have been correlated to the Clementine VIS–NIR bands and five spectral ratios. The five spectral ratios calculated synthesize the main spectral features of sample spectra that were grouped by their lithium and 7 Li content using Principal Component Analysis. The ratios spectrally characterize substrates of anorthosite, silica-rich basalts, olivine-rich basalts, high-Ti mare basalts and Orange and Glasses soils. Our findings reveal a strong linear correlation between the spectral parameters and the lithium content in the eight Apollo samples. With the values of the 11 Clementine bands and the 5 spectral ratios, we performed linear regression models to estimate the concentration of lithium and 7 Li. Also, we calculated Digital Terrain Models (Altitude, Slope, Aspect, DirectInsolation and WindExposition) from LOLA-DTM to discover relations between relief and spatial distribution of the extended models of lithium and 7 Li. The analysis was conducted in a mask polygon around the Apollo 15 landing site. This analysis seeks to uncover potential 7 Li enrichment through spallation processes, influenced by varying exposure to solar wind. To explore the possibility of finding ice mixed with regolith (often referred to as `black ice’), we extended results to the entire Clementine coverage spectral indices, calculated with a library (350–2500 nm) of ice samples contaminated with various concentrations of volcanic particles.

1. Introduction

The main interest in tracing lithium and the presence of black ice on the lunar surface is closely related to future human settlement missions on the moon. For long-term lunar bases or space missions, in situ access to lithium for battery production could be crucial for energy sustainability. Mining lithium on the moon could further spur technological advancements in space exploration. In the other side, the confirmation of water on the moon has been relatively recent. In 2009, NASA’s Lunar Crater Observation and Sensing Satellite (LCROSS) mission identified water in the form of ice within the Cabeus crater near the lunar South Pole [1] and identified and mapped surfaces with reflectance so high as to be unlikely to be part of an ice-free population. In this south, they found a similar distribution found by [2] based on UV properties. The majority of lunar water is found as ice in permanently shadowed craters at the poles, where temperatures are extremely low and sunlight is perpetually absent. However, there are also indications of water in other regions of the moon, albeit in significantly lower concentrations [2]. This work represents an exploration exercise for these resources on the lunar surface using remote sensing and spectroscopy techniques, together with the information available in the PDS Orbital Data Explorer from JPL, NASA. The literature on the presence of lithium on the moon is limited. Magna [3] analyzed lithium (ppm) and 7 Li (‰) isotope in several rock and regolith samples from the solar system for astrophysical purposes, and eight of these samples were from the moon. Lithium and 7 Li in basaltic and ultramafic rocks from the Earth, moon (Apollo 12, 15, 16 and 17 mission samples), Mars and Vesta samples were analyzed, yielding Li stable isotope compositions more or less consistent with the Earth’s mantle (7 Li ≈ +4‰). Martian meteorites give distinct 7 Li contents of 3.9‰ (Zagami) and 5.0‰ (Nakhla). Eucrites from Vesta shows substantially higher Li abundances (8.3–13.1 ppm) than lunar rocks and glasses (6.0–13.3 ppm). In this way, 7 Li isotope concentration in the lunar samples reaches +8.89‰, measured in the 62255-moon sample, which is composed of anorthosite. Mare moon basalts exhibit a large range of Li isotope compositions (7 Li = +3.4‰ to +6.4‰), predominating high concentrations (e.g., 9.2 ppm with 6.39‰ of 7 Li in sample 72255 or 10.3 ppm and 5.48‰ in sample 75075, both from high-Ti mare basalts). These concentrations are more than double the 7 Li concentrations measured in samples of terrestrial basalts (MORB; Iceland and Hawaii basalts). Moreover, sample 74220 (named as Orange and Glass), collected from the fourth geological station of the Apollo 17 mission, was considered a clod of friable material that was taken 6–8 cm deep in a trench from Station 4, on the rim of a 120 m Shorty crater. This sample is rich in lithium, reaching 13.3 ppm, but only 4.2‰ is 7 Li, which defines a ratio of 7 Li of 0.32 (7 Li/lithium (ppm)) (Table 1). On the other hand, anorthosite sample 62255 shows the lowest lithium concentration (0.8 ppm) but the highest concentration of 7 Li (8.89‰), which determines a value of 11.11 for the 7 Li/lithium ratio (Table 1). However, oxygen isotopes provide evidence that the Earth and the moon were created from the same raw material. The lithium concentrations measured in the lunar samples are in accordance with the Earth data, but the isotope 7 Li ratios are not. The values in the lunar samples are several orders of magnitude larger than in the Earth’s crust and more than twice those in the rocks in the terrestrial mantle. Therefore, the Li isotope compositions in the Earth and the moon should be identical. We suspect that the apparent increments of 7 Li on the lunar surface could be related to possible surface exposure to solar wind particles. Spallation processes in cosmic rays are the primary means of nucleosynthesis for stable isotopes of lithium, beryllium and boron. Throughout the Moon’s long evolutionary history, the composition of its most ancient substrates may have been significantly altered by space weathering and impact processes, in comparison to the source materials. For instance, crystalline rocks like anorthosite, which are the most abundant substratum in the lunar highlands, may have been affected [4,5]. Regarding the exploration of dirty ice, beyond ice, molecular water (H2O) and hydroxyl groups (OH) have been detected on the lunar surface. NASA’s Stratospheric Observatory for Infrared Astronomy (SOFIA) has played a pivotal role in identifying water molecules on the sunlit lunar surface. One hypothesis suggests that water was formed through the interaction of solar wind with lunar minerals, yielding hydroxyl and, subsequently, water. Alternative theories propose that water was delivered via cometary and asteroidal impacts on the moon [6]. Current and upcoming missions, such as NASA’s Artemis program, are focused on investigating lunar water. These studies will aid in comprehending the distribution, quantity and potential extraction and utilization methods of lunar water.

Mapping the Mineral Composition of the Moon

Many groups have estimated the lunar surface composition, particularly oxide or elemental abundances, using reflectance data obtained from Earth-based telescopes (e.g., [7]), X-ray spectroscopy data gathered by Apollo 15 and Apollo 16 missions [8], Chandrayaan-1 [9,10] or Chang’E (CE)-3,4 [11,12]. Also, elemental mapping was performed with data from gamma-ray spectroscopy (GRS) acquired by Apollo 15 and Apollo 16 [13], Lunar Prospector (LP) [14,15,16] or SELENE (Kaguya) [17], along with neutron spectroscopy data obtained by LP [18,19,20,21,22]. Reflectance spectral data obtained from missions such as Clementine [23,24,25,26] and, more recently, Lunar Reconnaissance Orbiter (LRO) [27,28,29] and CE-1 [30,31,32,33,34] have provided further insights. At this point, we would like to highlight the Christiansen Feature product (CF) and recognize it as a crucial spectroscopic tool in lunar mineralogy mapping. CF refers to a specific point in the infrared spectrum where reflectance peaks, occurring at a wavelength unique to each of the material’s properties. At this peak, the material’s refractive index is 1. The relationship between the wavelength of the CF and mineral composition was first established by Conel in 1969 and was later connected to the igneous rock types by [35,36]. More recently, CFs have been instrumental in mapping lunar surface mineralogy, as demonstrated in studies by [5,29]. The main goal of NASA’s Lunar Reconnaissance Orbiter’s Diviner mission is to conduct a comprehensive mapping of CFs across the lunar surface [29,37]. However, the identification of the relative abundance of low-weight elements, molecules or minerals using near-infrared spectral reflectance is not entirely reliable. Additionally, Refs. [38,39,40,41] have shown that the CF values measured under lunar-like conditions, or calculated by Diviner multispectral infrared measurements, shift to shorter wavelengths with a decrease in lunar sample maturity [25]. In addition, the effects of viewing geometry on the CF values accounting for the temperature and anisothermality (temperature variation in different directions), which can cause the CF values to shift toward short or long wavelengths, especially in the high-latitude regions [38], are also worth considering. Another limitation arises because spectral features can be obscured by space weathering, a challenge noted by [5]. All these limitations to CF as a mapping tool have encouraged us to explore the ability of ViS_NIR_SWIR bands for lithium or black ice identification and mapping. The majority of optical data currently available for the moon come from much simpler sensors, namely, multispectral imagers, which typically consist of a digital framing camera equipped with several filters. Examples of lunar applications are the Galileo SSI camera (6 broadband filters) or the VIS–NIR camera of Clementine (11 filters) [42,43,44]. The Clementine mission was a joint project of the U.S. Department of Defense’s Ballistic Missile Defense Organization (BMDO) and NASA. Launched in 1994, its primary objective was to test sensors and space navigation technology in a real spaceflight environment. In addition, it conducted significant lunar scientific research. During its mission, Clementine conducted numerous scientific experiments using various instruments, such as multi-spectral cameras, a laser altimeter and a spectrometer. The data collected provided extensive information on lunar topography and mineral composition. The mission concluded in June 1994 after a computer malfunction prevented a planned flyby of asteroid Geographos. Clementine, albeit with filter technology, provided the most comprehensive collection of satellite optical images of the moon that could be useful for exploration works like the one we present here. To validate the Clementine data, it could be convenient to collect reflectance spectra in situ with a calibration panel that can quantify the absolute reflectance and give more compositional detail to provide the ground truth. The first in situ reflectance spectra were measured at the end of 2013, when China’s Chang’E-3 (CE-3) spacecraft landed on the moon [11]. In summary, various tools have been employed to map the resources on the moon. However, as of now, no maps displaying the distribution of lithium or dark ice on the lunar surface in relation to relief patterns and geomophological units as crater rims have been published. To address this gap, we have investigated the distribution of lithium, 7 Li (‰) and black ice on the lunar surface (including rocks and regolith) using spectral data obtained from the Clementine mission combined with reflectance spectra obtained from the RELAB spectral library [45] or obtained in a laboratory using an ADS spectrophotometer (VIS–NIR–SWIR).

2. Materials and Methods

For this research we used mosaics constructed from data collected by the Clementine mission’s VIS–NIR–SWIR experiment [42,43], spanning 11 distinct spectral channels. This imagery is publicly available from NASA and can be accessed since 4 May 2007 through https://ode.rsl.wustl.edu/. We also utilized the digital elevation model obtained from the Lunar Orbiter Laser Altimeter (LOLA) experiment aboard the Lunar Reconnaissance Orbiter (LRO) and available since 13 September 2016 [27].

2.1. Lunar Samples

The geological details of the sample collection returned by the Apollo missions can be found in the Lunar Sample Atlas (https://www.usra.edu/, version 1 of the atlas was released in August 2009 and version 2 was released in July 2010). This catalog presents an extensive compendium of all analyses conducted on lunar samples up to 2008, organized by sample. The data include absolute age dating and exposure times to cosmic rays. However, lithium content measurements are not available for all samples. Therefore, this study only used samples with measured lithium content (mg/kg) and the corresponding fraction of the 7 Li isotope. These are the samples that were selected for the work by Magna [3]. These samples have lithium analytics and represent the variety of substrates found on the moon. They were characterized using samples returned during NASA’s Apollo missions. The samples include anorthosite, different types of basalts (high-Ti Mare basalts, olivine-enriched basalts and basalts with silica), as well as lunar regolith known as Orange and Glasses soils. In Table 1, we present a summary of the sample composition—lithium and 7 Li concentrations—as well as the topographic height at which the sample was collected (obtained from the LOLA_LRO_DTS) and the exposure age assigned by different authors. Below, we can see some geological data of interest from the samples used in this study:
  • Sample 62255 (1239 g) was collected during the Apollo 16 mission at the south rim of Buster Crater. The sample is composed of approximately 65% ferroan anorthosite and 35% dark, finely crystalline melt that has been crushed and granulated by shock. It is also penetrated with patches and veins of mafic melt. The anorthosite is chemically pristine but enriched in some volatiles. The total K-Ar age is about 3.66 ± 0.08 b.y. [46];
  • Sample 12045 (63 g) was collected during the Apollo 12 mission and contains glomerophyric aggregates of olivine phenocrysts, spinel grains and rare metal droplets. These phenocryst assemblages are set in a groundmass of acicular pyroxene, plagioclase, silica, ilmenite and troilite. The age of the sample could not be determined;
  • Sample 15058 (2672 g) was collected during the Apollo 15 mission. It is a quartz-normative mare basalt with elongate pyroxene crystals. The sample has been dated to 3.4 billion years, with an exposure age of approximately 135 million years;
  • Sample 70035 (5765 g) was collected during the Apollo 17 mission. It is a vesicular, medium-grained, high-Ti basalt taken from a boulder on the rim of a subdued crater. The bottom surface of this sample is coated with glass. Sample 70035 is 3.7 b.y. old and [46] has been exposed on the lunar surface 122 ± 3 m.y. by the 81Kr dating method [46];
  • Sample 15475 (406.8 g) was collected from the rim of Dune Crater during the Apollo 15 mission. It is a porphyritic pigeonite basalt that was dated to be approximately 3.4 billion years old and has been exposed to cosmic rays for about 200 million years;
  • Sample 75075 (1008 g) was discovered during the Apollo 17 mission. It was found lying loose on top of a large boulder in Camelot Crater. The sample was dated to 3.74 billion years old and consists of a vuggy ilmenite basalt with an apparent old exposure age of 143 million years [47]. The sample, classified as a Type S1 Apollo 17 high-Ti basalt using the scheme of Rhodes [48], shows few micrometeorite craters despite its old exposure age and being found on top of a boulder;
  • Sample 15555 (9614 g), also known as “Great Scott”, is the largest and most extensively studied rock from the Apollo 15 mission. It is a medium-grained olivine basalt with a few small vugs and has been dated to 3.3 billion years old. It has been exposed for 90 million years;
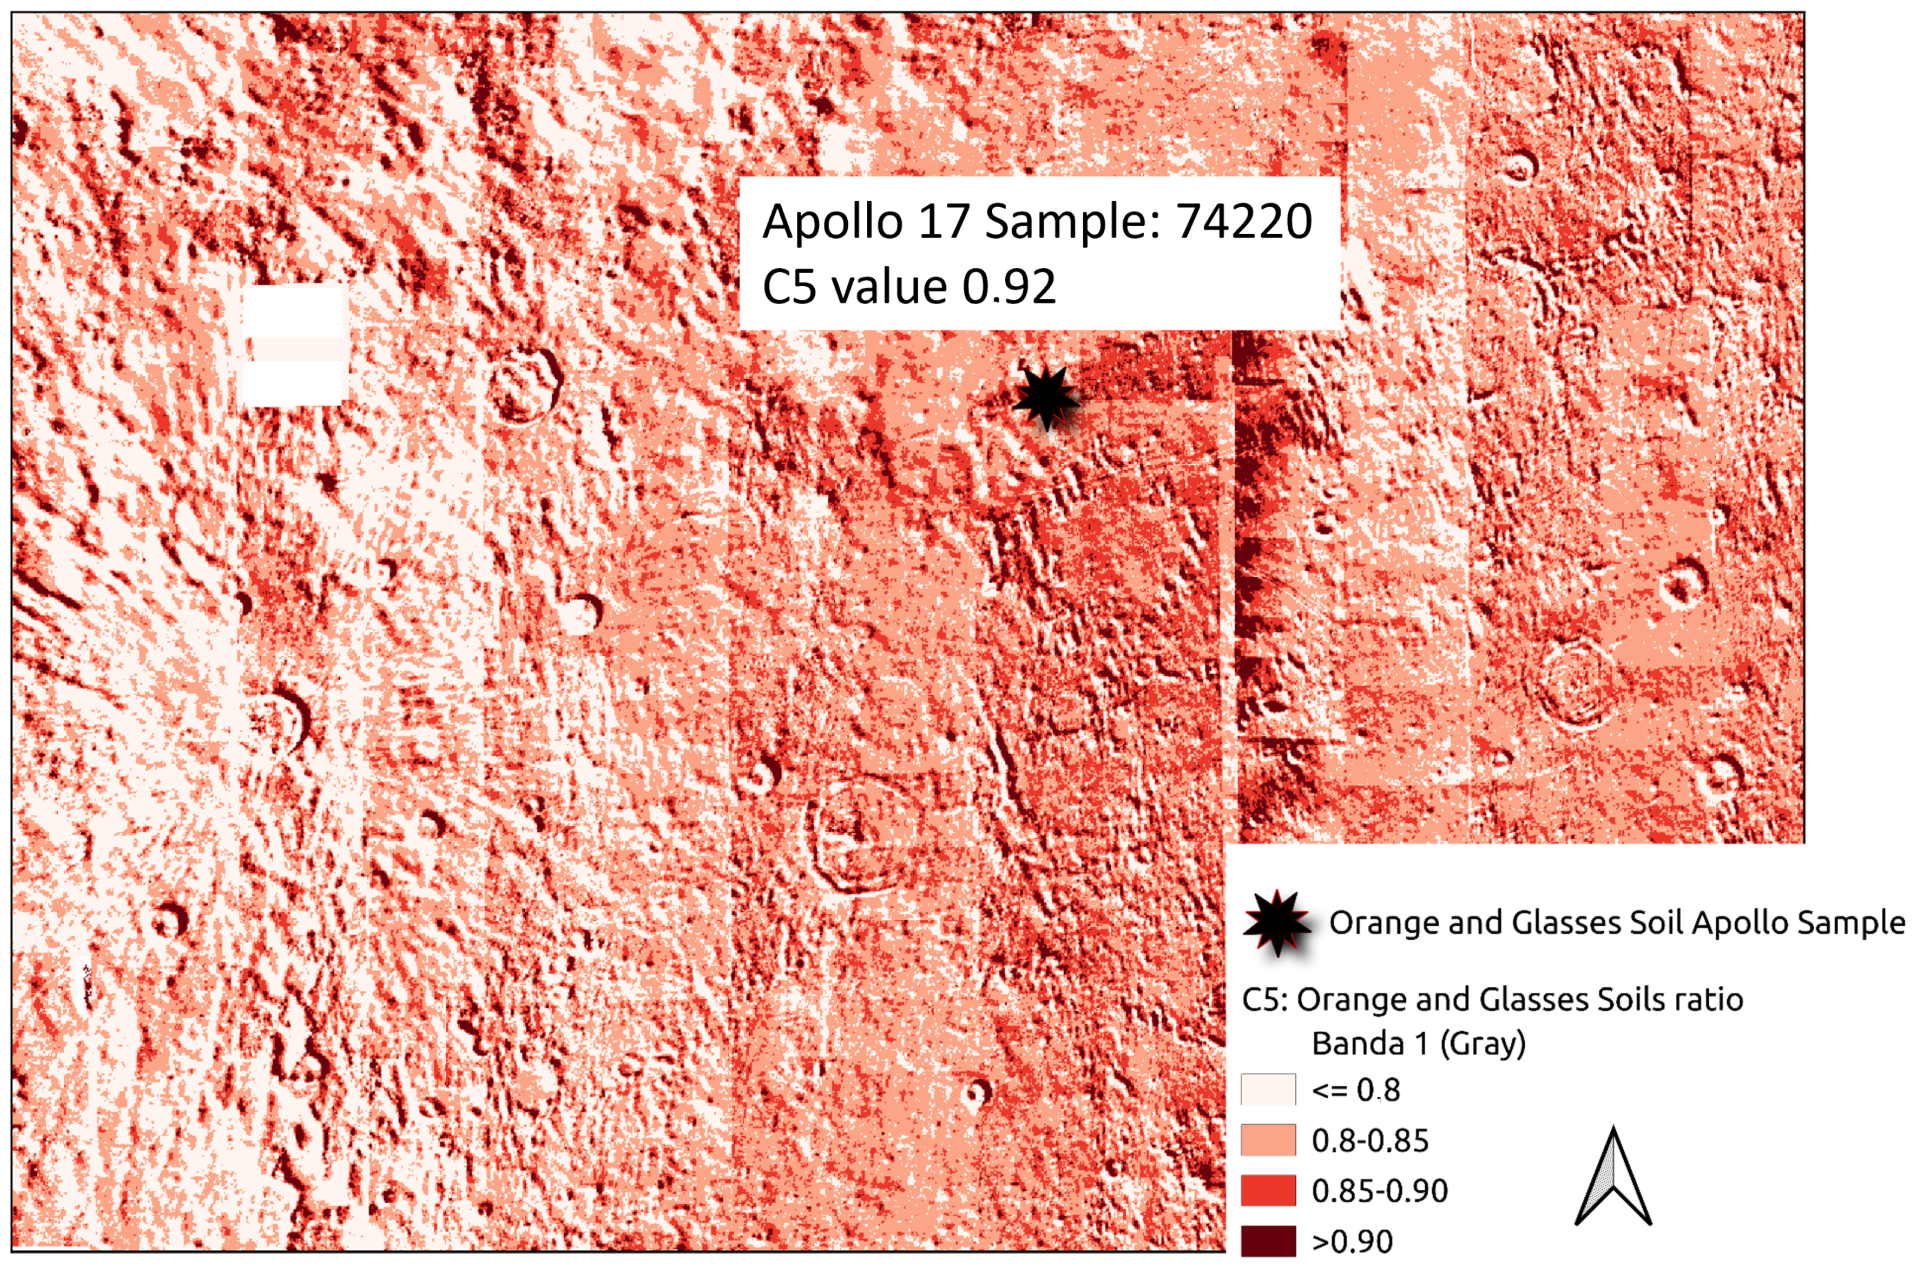
  • Sample 74220 (1180 g) was taken during the Apollo 17 mission. It is considered a clod of friable material taken from a depth of 6–8 cm in a trench from Station 4 on the rim of the 120-meter Shorty crater. The orange and black glass samples were identified as a pyroclastic deposit [49]. Ref. [50] reported the exposure age as 27 m.y. The Orange and Glasses soils represent lunar regolith that has been weathered and originated from materials impacted by meteorites. Sample 74220 exhibits the highest concentration of lithium at 13.3 ppm, but the lowest concentration of the 7 Li isotope (4.19‰) (Table 1).

2.2. Lithium Exploration

To calibrate the Clementine images for lithium composition (ground trough), chemical analyses of samples returned from Apollo missions 12, 15, 16 and 17 were used. Specifically, samples 12045, 15058, 15475, 15555, 62255, 70035, 74220 and 75075 were analyzed by [3] (Table 1). We utilized the RELAB (Reflectance Experiment Laboratory) spectral library from PDS Geosciences Node, which includes spectra of the eight lunar samples. A total of 19 spectra were measured over the spectral range of 300–2780 nm, with a 5 nm sampling resolution at a phase angle of 30° [45]. A key aspect of these data is that Clementine data and laboratory spectral measurements of lunar soils were taken with the same photometric geometry and calibration [45].

Numerical Methods

A Principal Component Analysis (PCA) was conducted on eight lunar samples obtained from the RELAB database. The analysis aimed to condense the 19 spectra (ranging from 300 to 2780 nm) based on lithium and 7 Li concentration. PCA is a statistical technique that reduces data dimensionality while preserving variability. It generates a single component that is a linear combination of a matrix of variables. Suppose that we have a data matrix X with n observations and p variables. The goal is to find a linear combination of these original variables that captures the most variability in the data. The first principal component, identifed as PC1, is calculated as the linear combination of the original variables that maximizes the variance. Mathematically, this can be expressed as in Equation (1), where a 11 , a 12 , , a 1 p are the coefficients that multiply each variable X 1 , X 2 , , X p , respectively:
P C 1 = a 11 X 1 + a 12 X 2 + + a 1 p X p
The coefficients are selected to maximize the variance in PC1 while ensuring that the sum of the squares of the coefficients equals 1 (Equation (2)):
i = 1 p a 1 i 2 = 1
PC1 is a normalized linear combination of the original variables.
Once the first principal component is computed, it can be used to reduce the dimensionality of the data or to analyze patterns in the data. This process can be repeated to compute more principal components if a more complete representation of the variability in the data is desired.
To transfer spectral information to the Clementine image, spectral ratios were defined and calculated for the five types of spectra (C1–C5), as expressed in Equation (3):
R a t i o × ( λ p e a k λ v a l l e y )
where ratio is defined as p e a k i n t e n s i t y v a l l e y i n t e n s i t y and λ represents the corresponding wavelengths. The specific wavelengths were identified in spectra using Spectroscopy Pro Tools 1.2 software. Table 2 contains the values used to obtain the spectral ratios by applying Equation (3).
To conduct this work, a GIS environment was necessary. QGIS 3.34 was utilized and the initial step involved creating a georeferenced map of the eight lunar samples. Georeferenced information about the moon samples from LPI–NASA and Google Moon was relied upon for this purpose. To investigate the presence of lithium on the lunar surface, the five spectral ratios were translated into the Clementine bands using QGIS’s raster calculator. To translate the spectral ratios into a Clementine image, we had to consider the central wavelength of the Clementine bands. It is important to note that the reflection and absorption peaks represent wavelengths of spectra taken at 5 nm resolution, while the Clementine bands were obtained with photometric filters without spectral resolution. The 11 Clementine bands (visible–near infrared–shortwave infrared) and 5 spectral ratios (C1–C5) were used to analyze 8 georeferenced lunar samples. The QGis Point Sampling Tool was utilized to obtain the values of the bands and ratios, resulting in a total of 16 variables for each sample. Linear correlation analyses were performed between the values of lithium and 7 Li and the spectral parameters for lunar soils extracted from 11 bands (450, 750, 900, 950, 1000, 1100, 1250, 1500, 2000, 2600 and 2780 nm) and the 5 spectral ratios. Multiple Linear Regression (forward stepwise) techniques were then used to estimate lithium concentration using a statistics application. A large number of Linear Regression analyses were completed with these data. The best-fitting linear models were extended to the entire set of Clementine images using QGIS’s raster calculator.
Multiple Linear Regression (MLR) was used to establish the relationship between the lithium values and explanatory variables. The linear regression model assumes a linear relationship between the inputs (explicative variables) and the output (estimation). This relationship is represented by a linear equation (Equation (4)):
Y = β 0 + β 1 X 1 + β 2 X 2 + + β p X p + e
where Y is the dependent variable (lithium or 7 Li), β 0 is the order at the origin or bias and β 1 β p are the coefficients of the independent variables ( X 1 X p ), i.e., radiometric indexes. The variables in the analysis were determined using a backward stepwise selection procedure and Akaike information criteria (AIC) to find the model that best explained the data with the fewest number of explicative variables. In the analysis, we used all the bands of the Clementine images (11) and 5 spectral ratios (C1_C5), i.e., all 16 explicative variables.

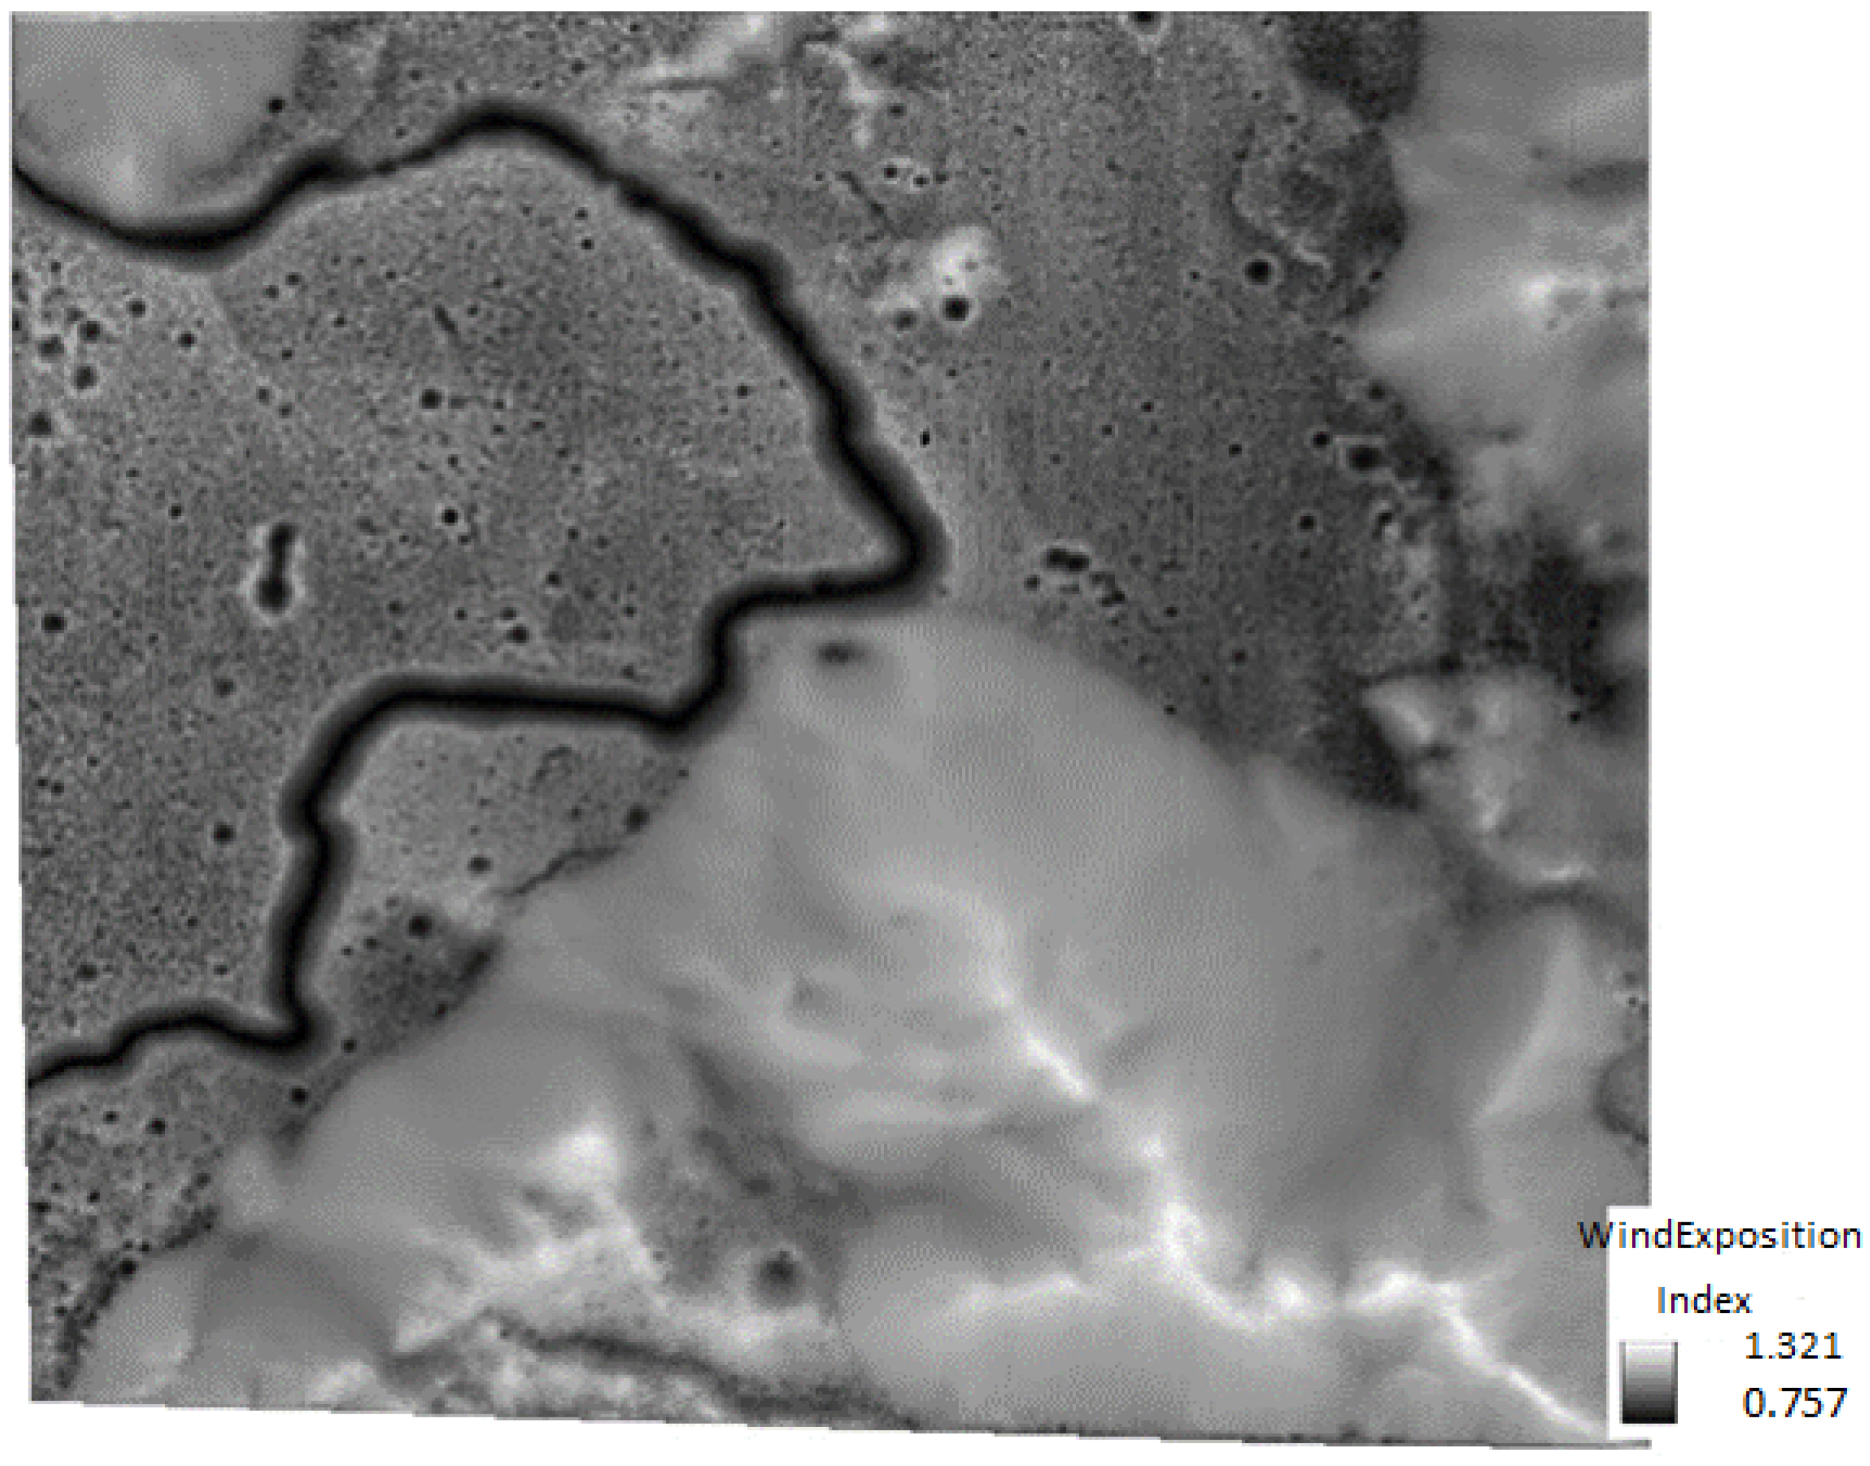
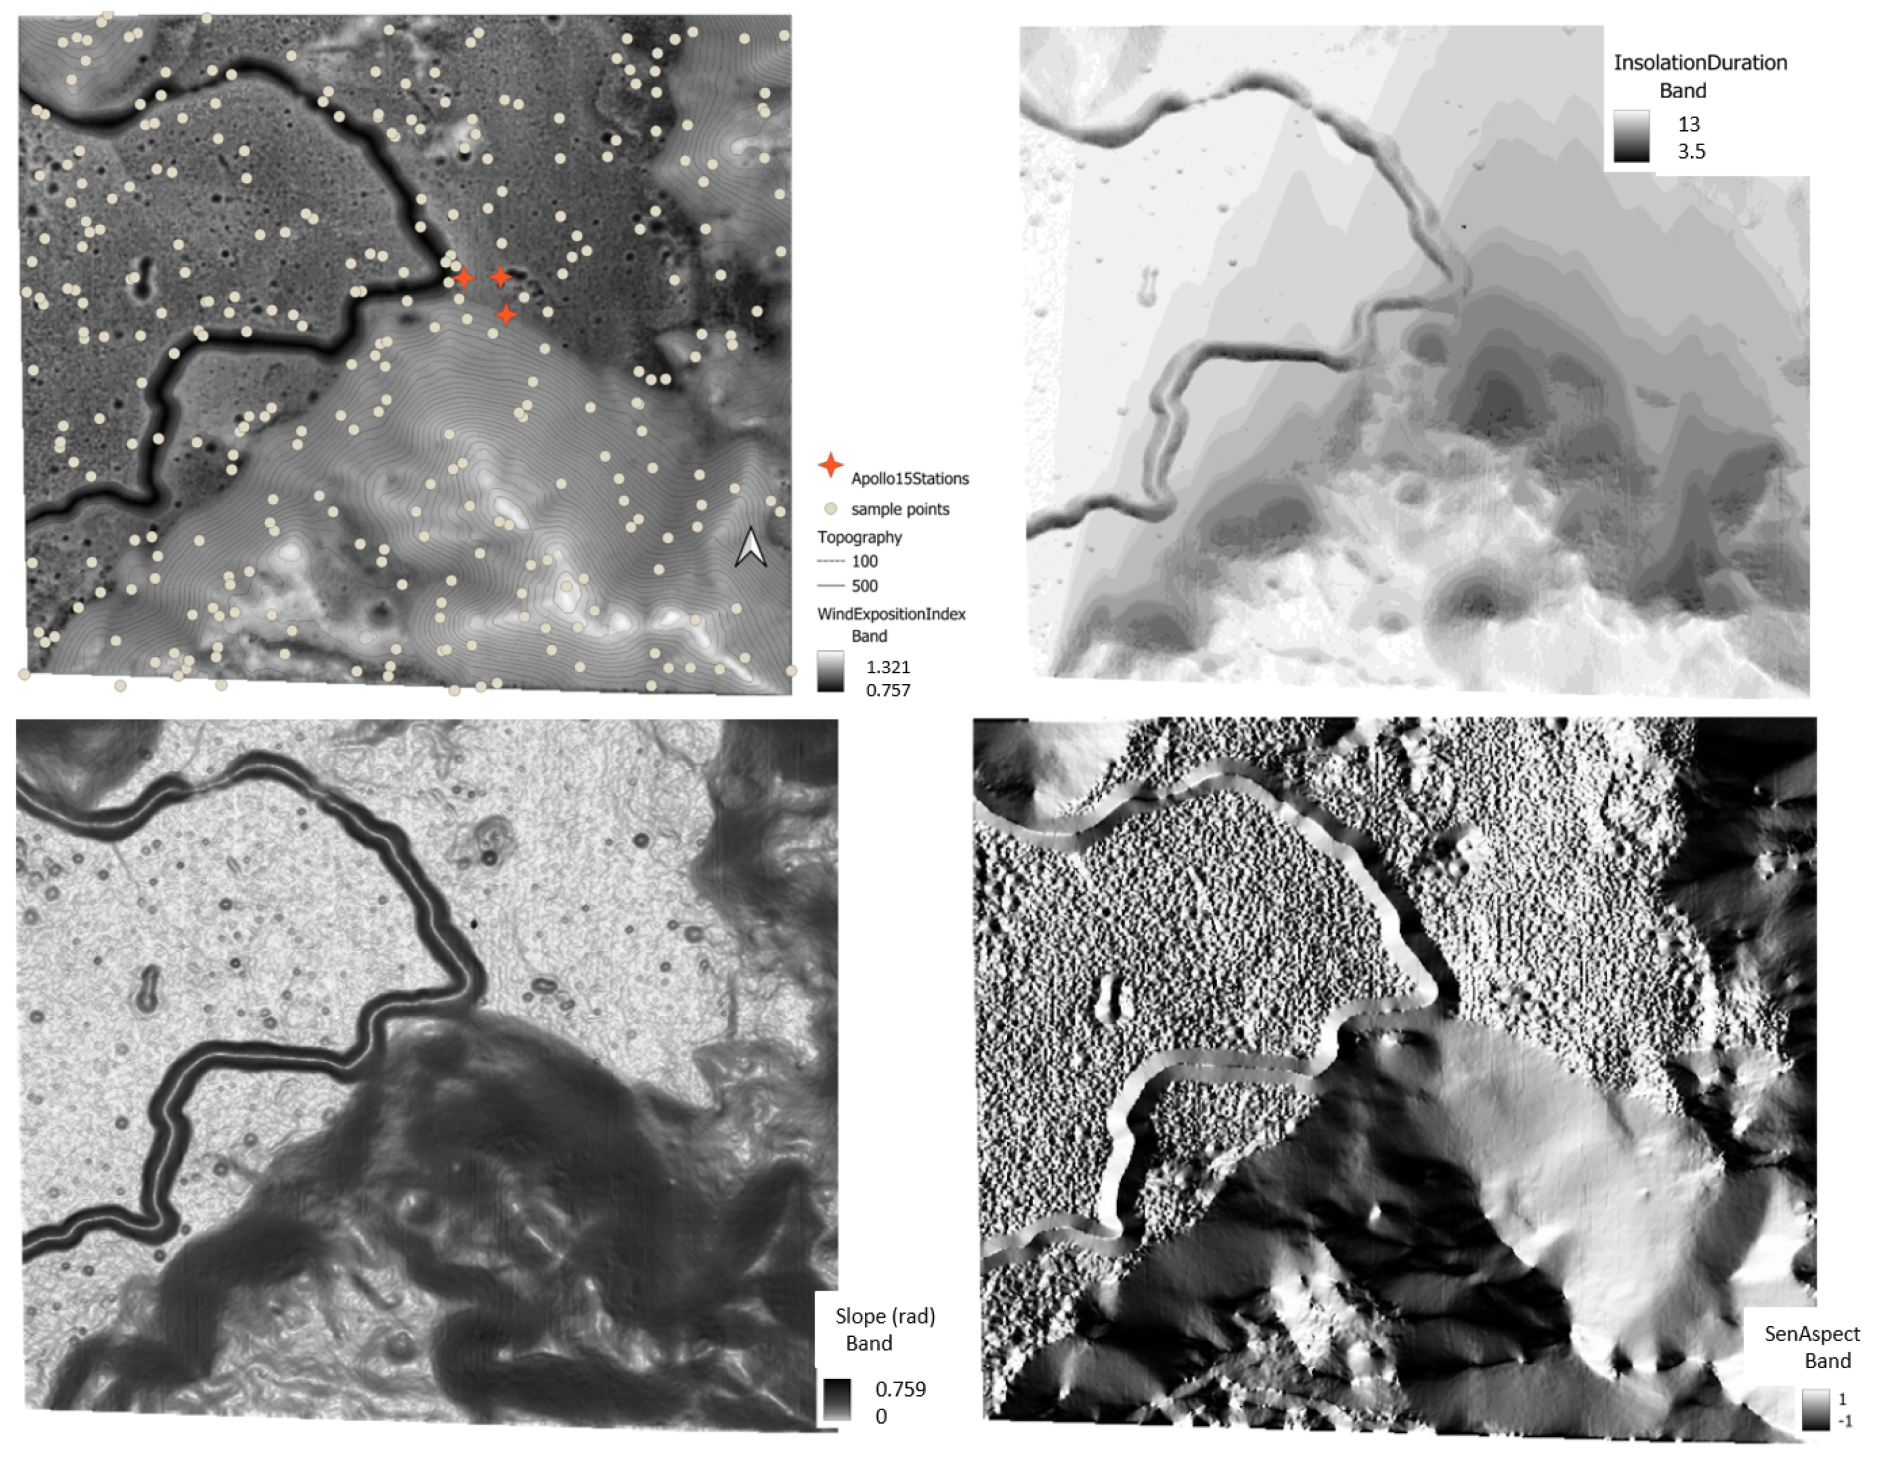
2.3. Lithium Distribution and Relief Patterns

We explored patterns of lithium distribution related to different terrain exposures. Topographic shading controls the amount of solar radiation that reaches the surface. Variations in altitude, slope, aspect and local topographic horizon can cause significant differences in solar insolation [51]. To obtain the MDT variables and topographic indexes, we used The System for Automated Geoscientific Analysis (SAGA). SAGA–GIS is an open-access Geographic Information System that offers tools for visualizing, analyzing and managing geospatial data. It allows users to explore spatial relationships, conduct spatial analysis and create maps for various applications. With its open-access nature, SAGA–GIS promotes collaboration and accessibility to geospatial information for research, planning and decision-making purposes (https://saga-gis.sourceforge.io/en/index.html, accessed on 1 February 2024). SAGA provides a set of tools ranging from the pre-processing of DEMs (e.g., filtering and filling procedures) through the generation of simple first- and second-order terrain derivatives, such as slope and curvature, to more sophisticated terrain parameters, e.g., Wind Exposition Index [52,53]. The Wind Exposition Index [54] calculates the average wind effect from all directions using an angular step and is a dimensionless index. Values below 1 indicate wind-shadowed areas, whereas those above 1 indicate areas exposed to wind. SAGA–GIS calculates the Wind Exposure Index (WEI) using methods that evaluate the terrain topography to determine a location’s exposure to wind action. This index considers factors such as terrain orientation and surface roughness to estimate the relative exposure of a location to dominant winds. In Figure 1, we can see the cartographic expression of this index.
We used the R programming language to conduct correlation analyses with Digital Terrain Models (Altitude, Slope, Aspect, DirectInsolation and WindExposition) and values extracted from the extended models of lithium and 7 Li. The analysis was conducted in a mask polygon extracted from Lunar Orbiter Laser Altimeter (LOLA) and located around the Apollo 15 landing site. We explored the linear correlations between the lithium and 7 Li values estimated in the models and the DTM variables. This analysis was performed using ≈300 random points extracted from the polygon mask from the Apollo 15 station environment (Figure 2).

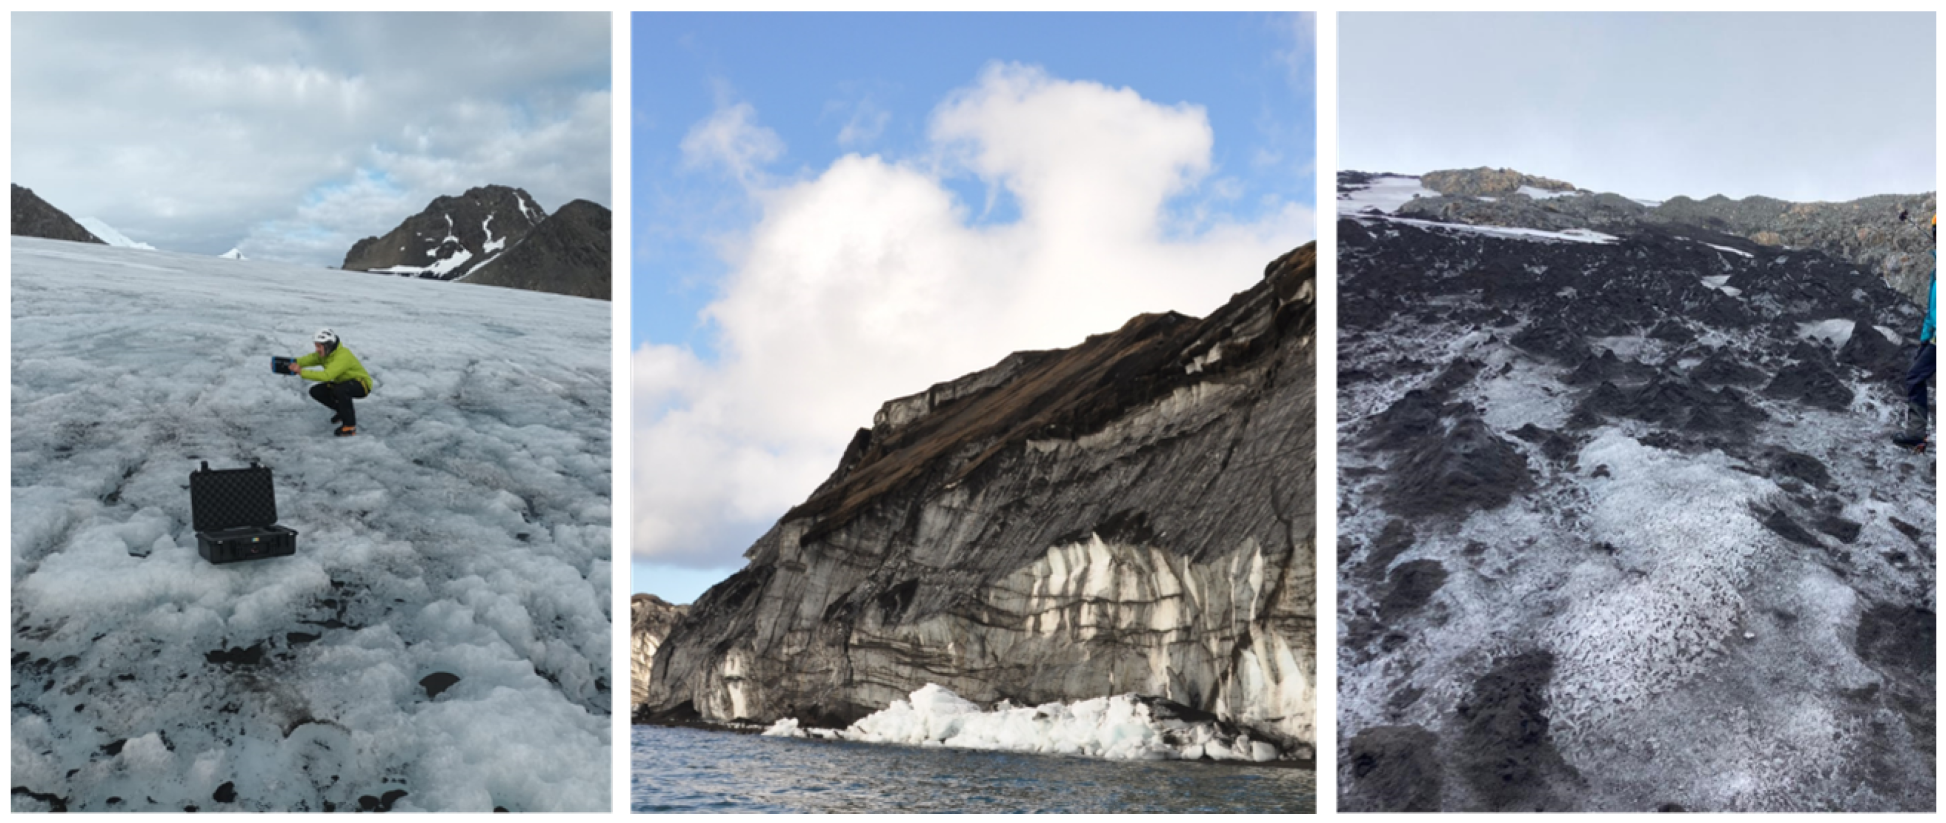
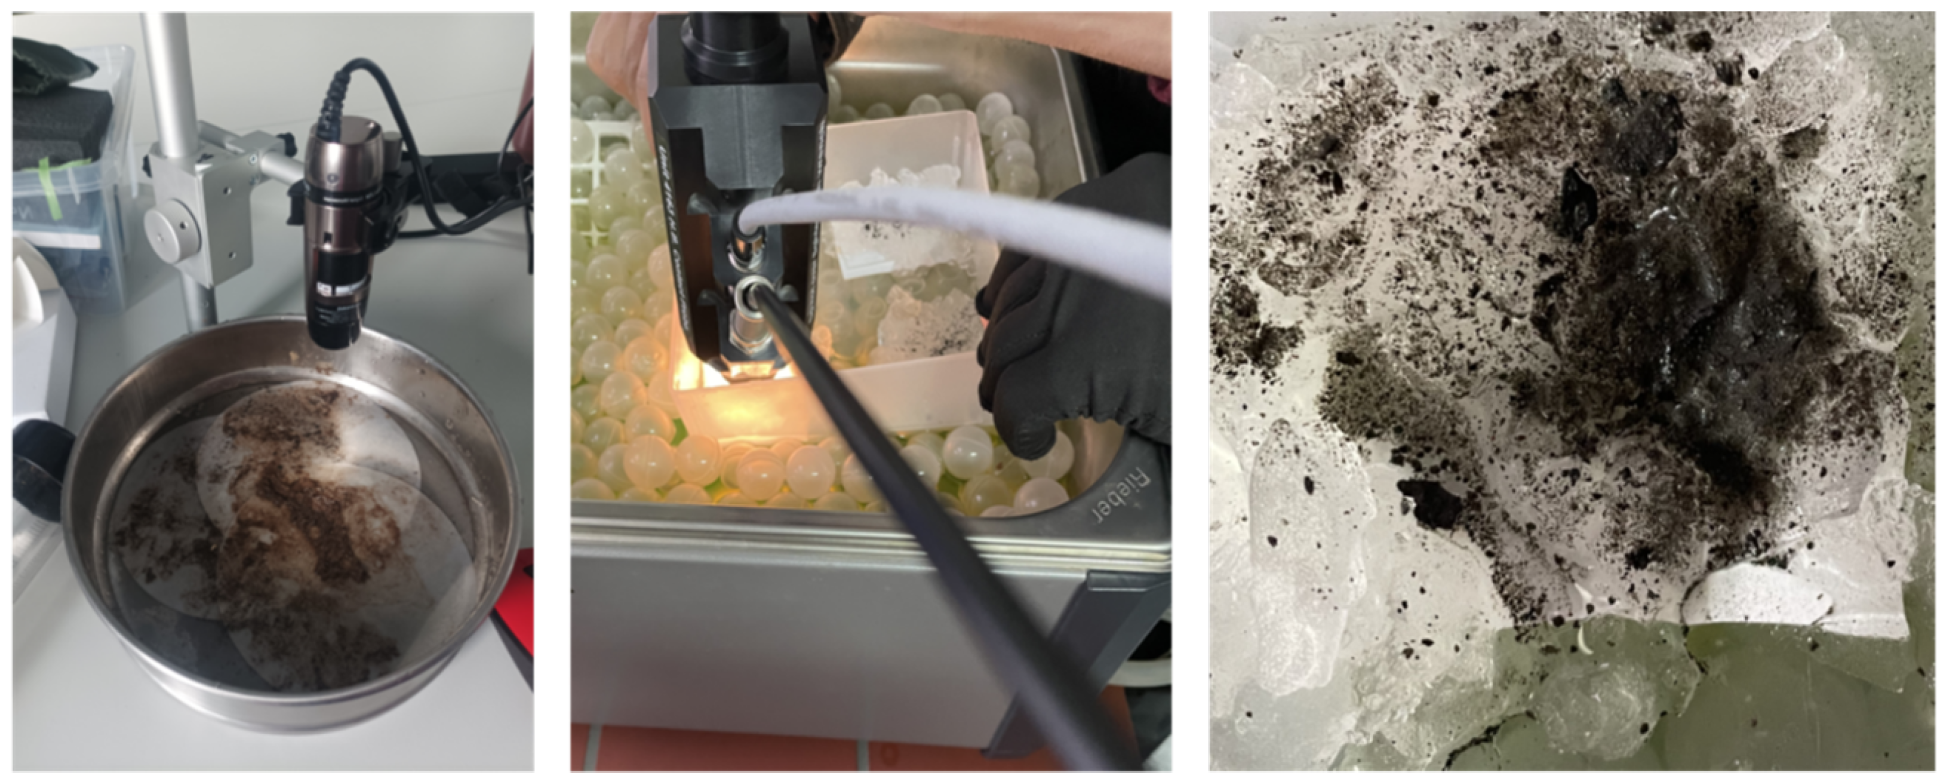
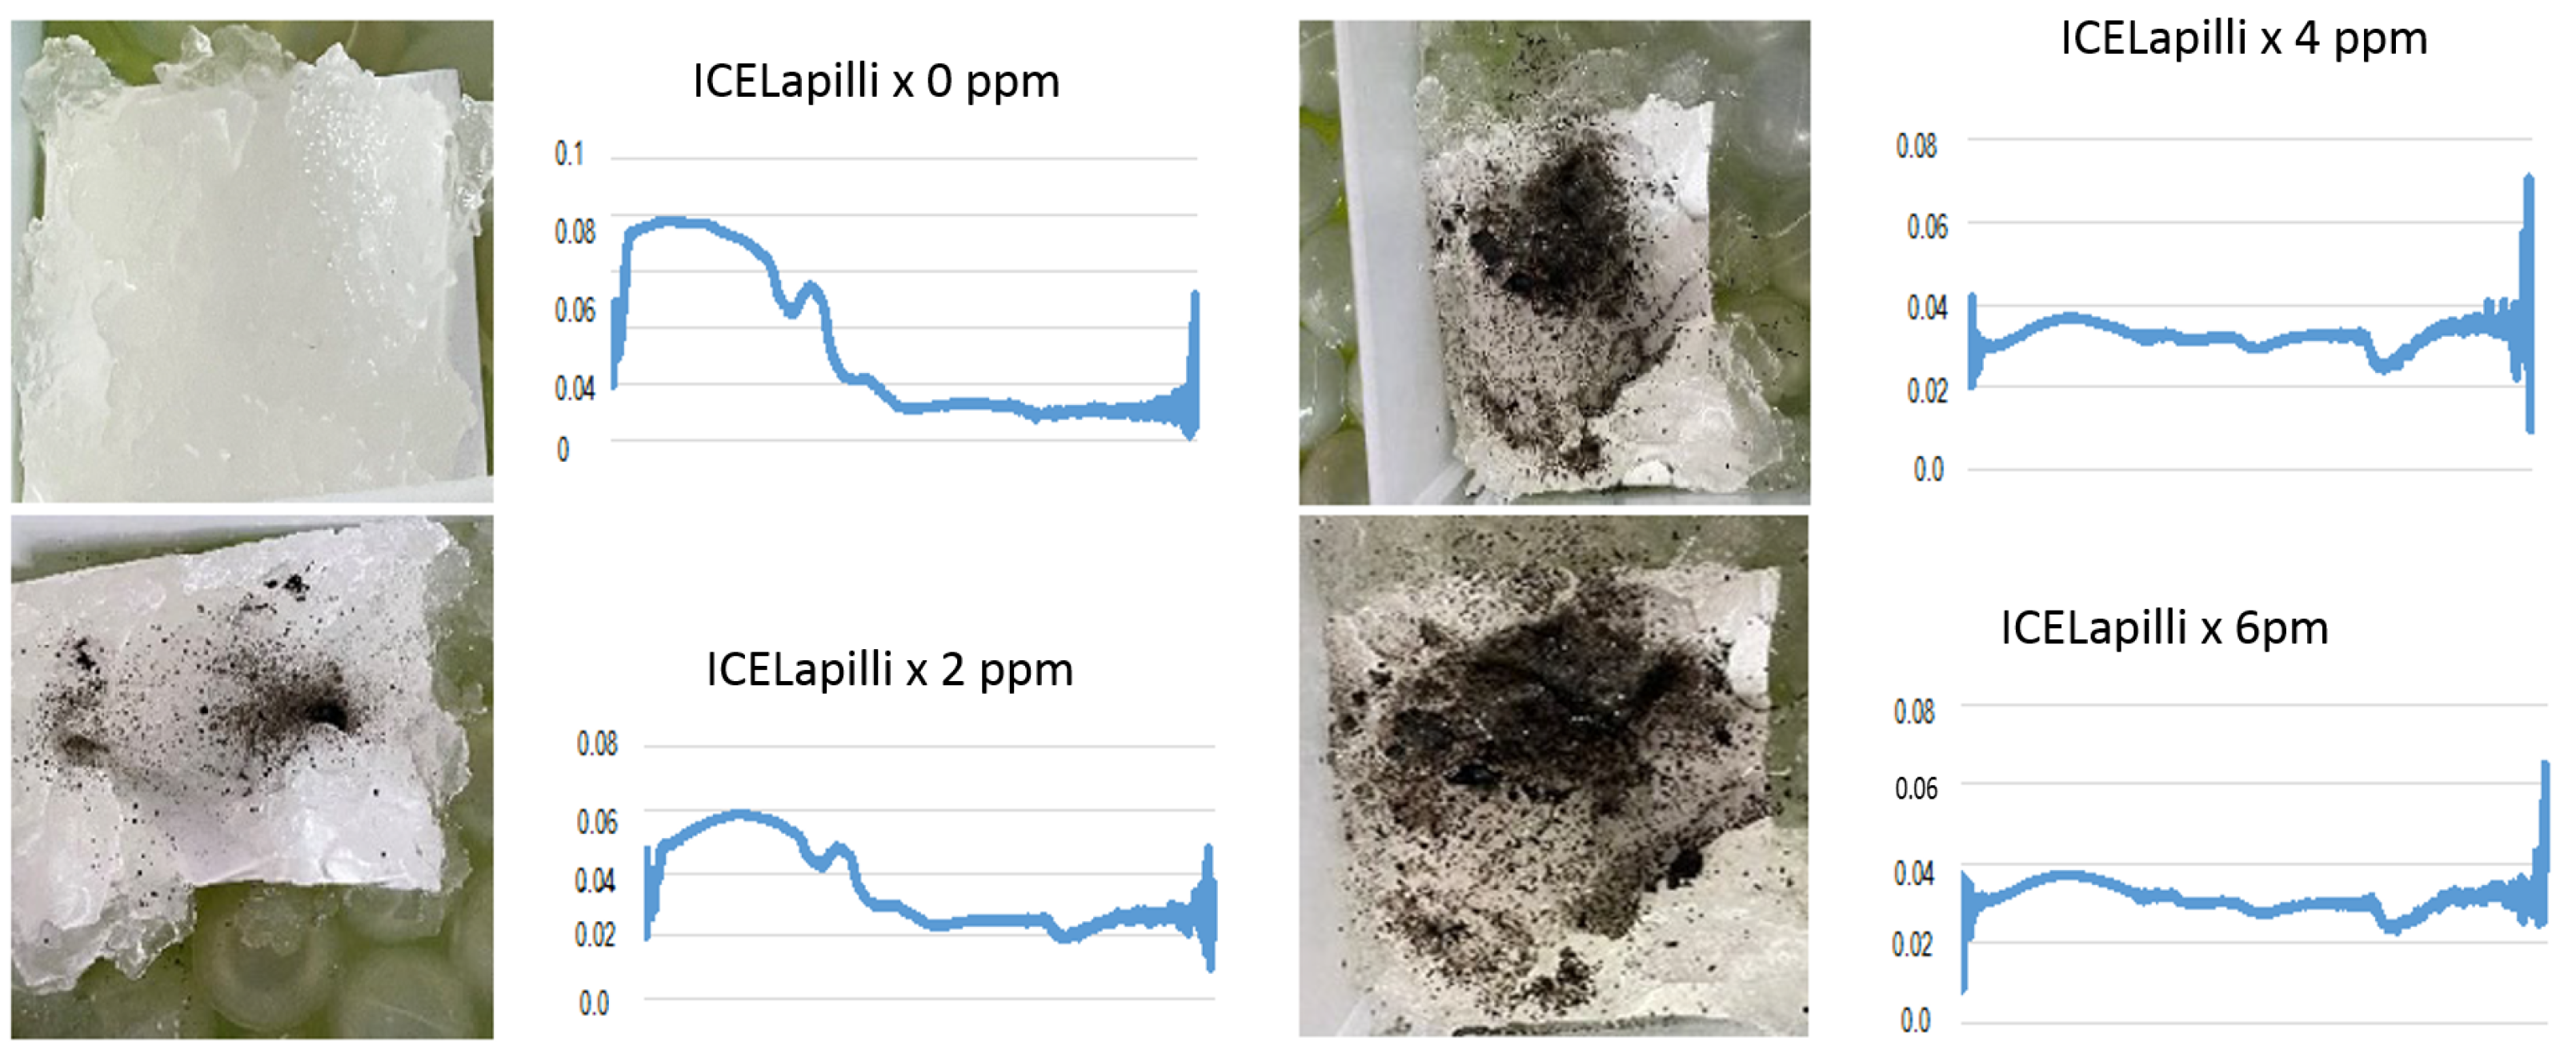
2.4. Dirty Ice Samples

To investigate the potential presence of black ice or ice mixed with regolith using spectroscopy techniques, we utilized a spectral library (350–2500 nm) consisting of dirty ices with varying concentrations of volcanic particles (0, 2, 4 and 6 ppm of very fine, <2 mm, lapilli with andesitic composition). The ice library was obtained in the laboratory using an ADS spectroradiometer, with 30 ADS spectra collected for each type of ice. The lapilli used to contaminate the ice samples were obtained from the glaciers of Deception and Livingston Islands in Maritime Antarctica. Our research focuses on the optical properties of ice and snow over glaciers in Deception and Livingston Islands in Maritime Antarctica. During our on-site research, we create VIS–NIR libraries to characterize the spectral properties of the ice with varying concentrations of impurities. Samples of ice with impurities are taken and filtered to obtain solid particles. Volcanic lapilli with andesitic composition, from the last volcanic episode in 1970, were obtained in Deception Island and in front of Johnson’s Glacier in Livingston Island (Figure 3). Spectral libraries were obtained in situ. For this experiment, we replicated the dirty ice in a laboratory and obtained spectra using an ADS spectroradiometer (Figure 4 and Figure 5). The main reason for this was to control the composition and the environment of the sampled spectra.
In the case of dirty ices, we did not have a “ground truth” for comparison or validation of the results. The four ice ratios were regionalized to the entire Clementine image and the results were then visualized.

3. Results and Discussion

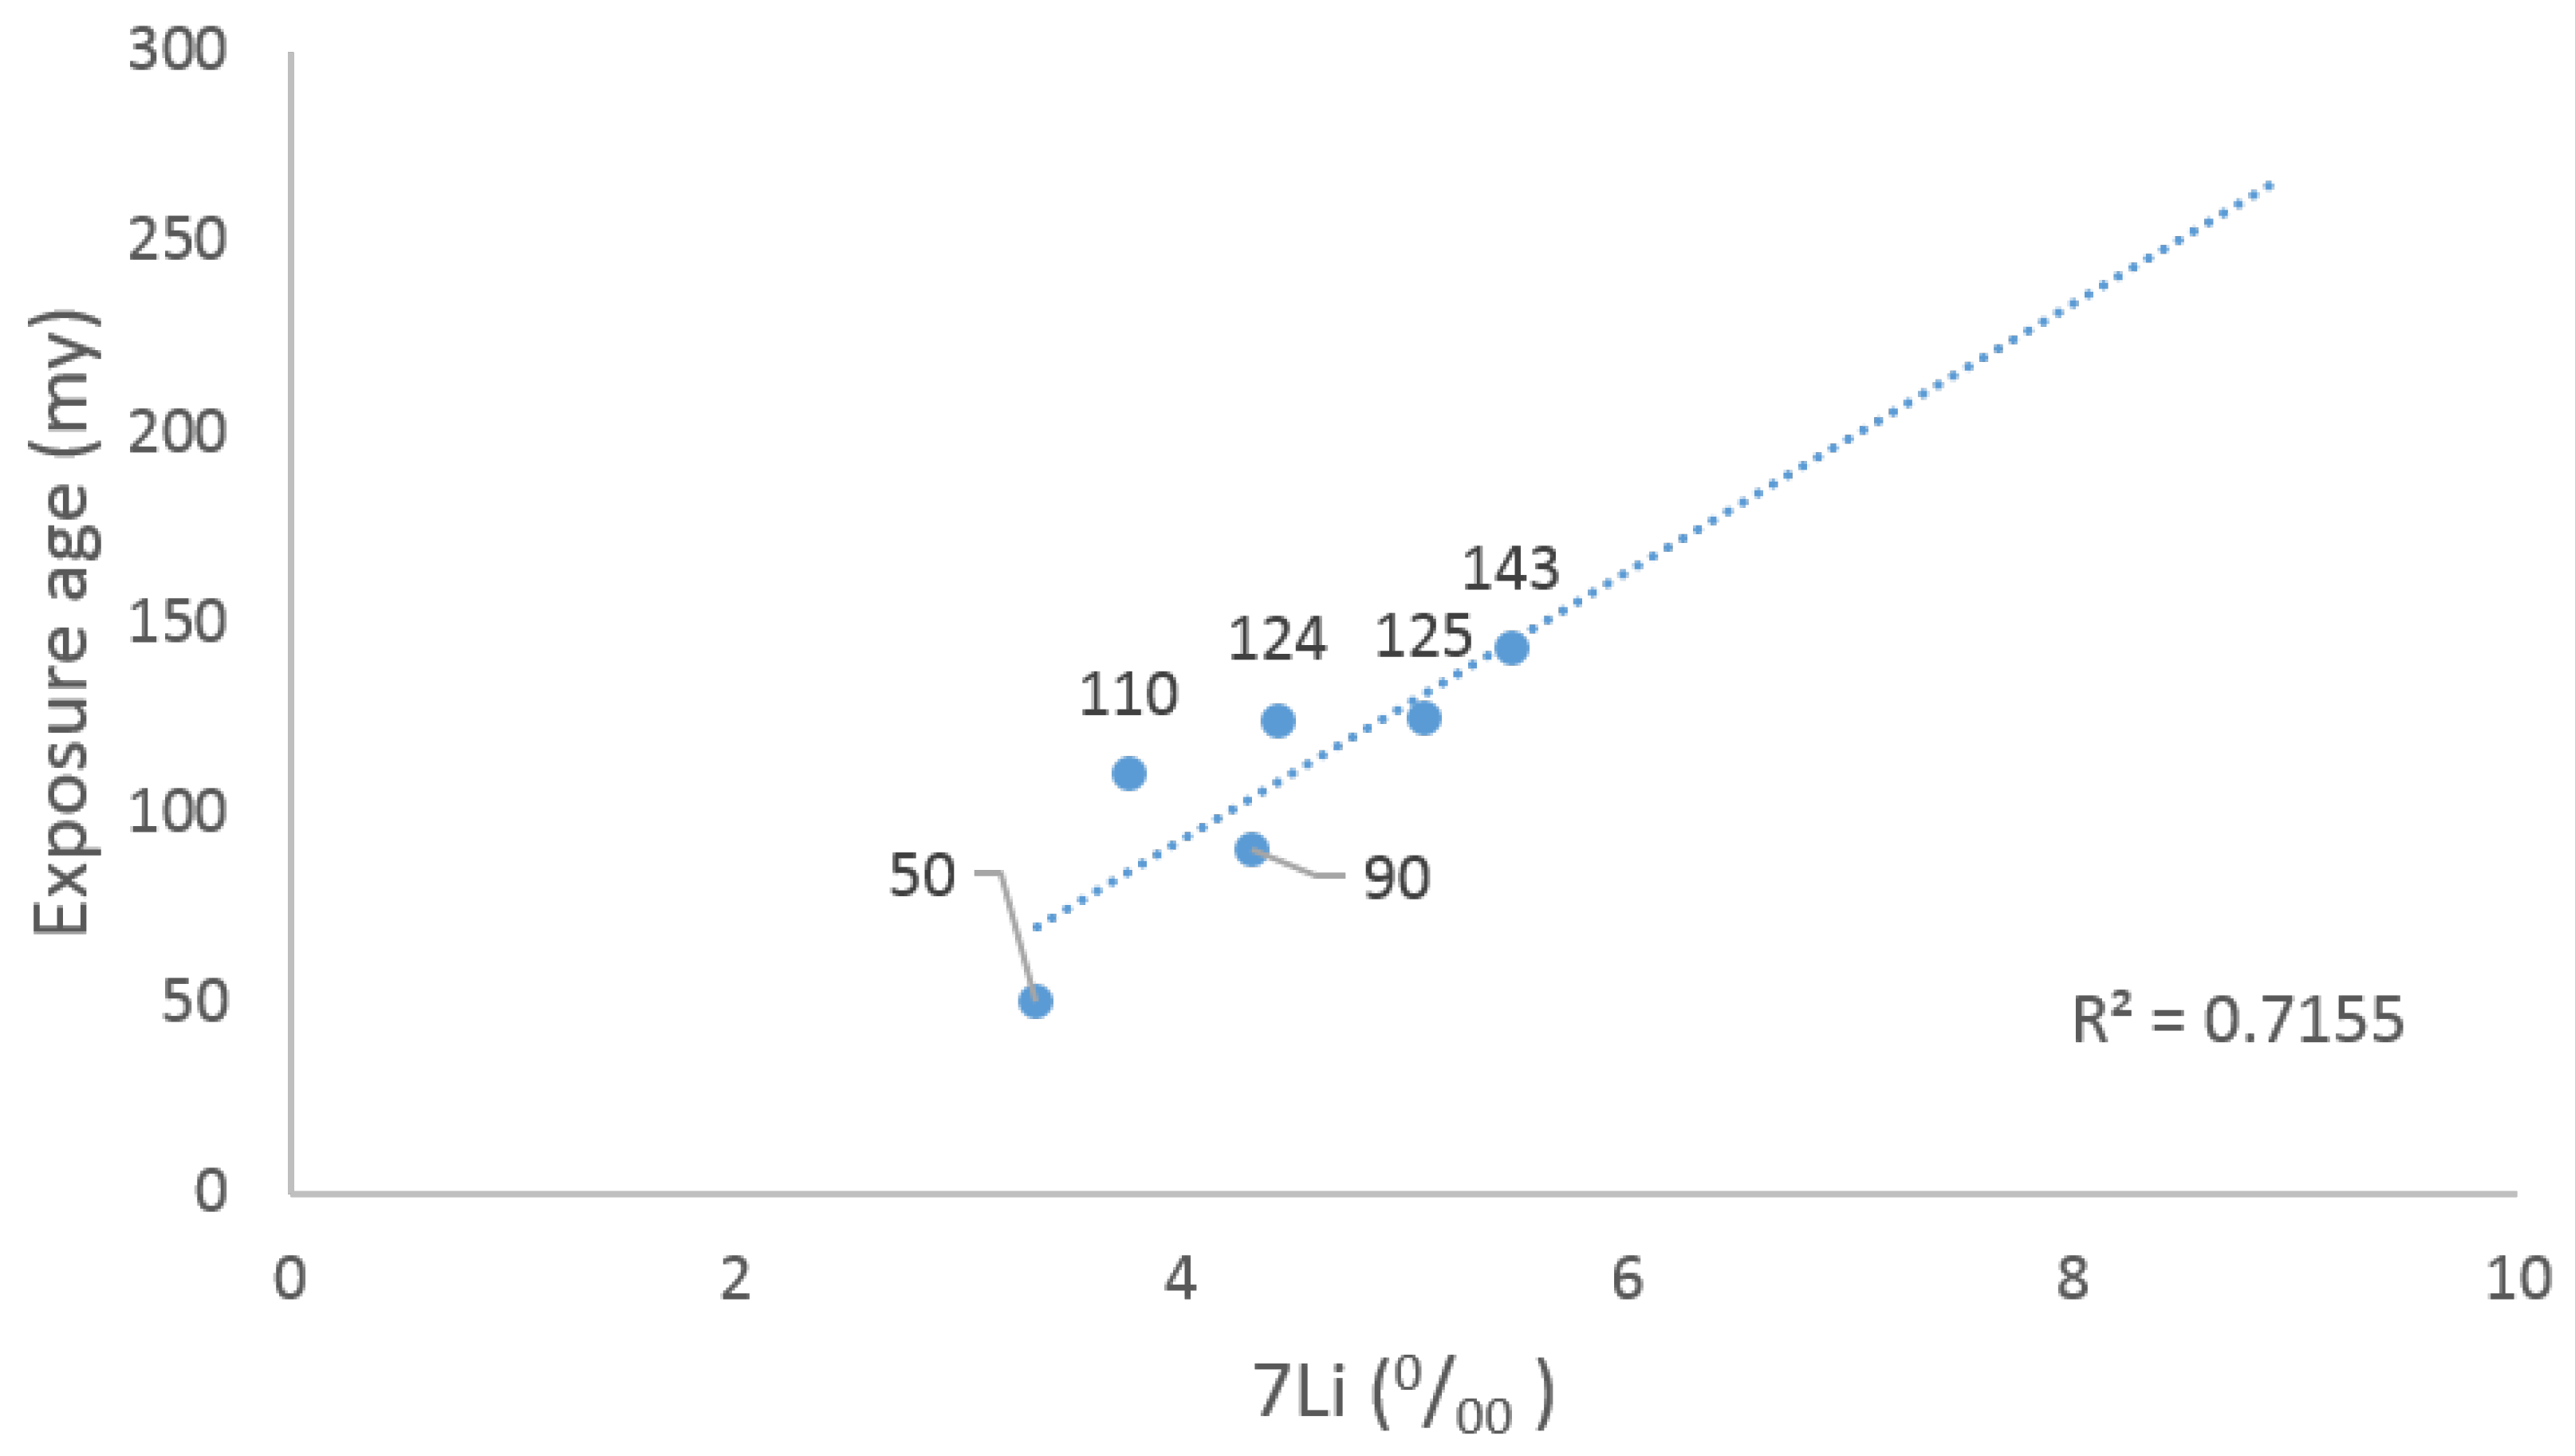
3.1. Lunar Samples and Exposure Ages

We have tried to understand the relationships between the exposure age of the samples analyzed by different authors with 38Ar (also with 81Kr) and the concentration of 7 Li isotope. In general, as can be seen in Figure 6, the correlation between the fraction of 7 Li and exposure ages is significant for six of the samples (80% of the samples used in this study).
However, sample 62255 (anorthosite) and sample 74220 (corresponding to Orange soils) do not follow this pattern. Sample 62255, despite being dated at around 3.66 b.y. (i.e., 3660 million years), shows an exposure age of 3 ± 1 m.y. Previous authors believed that there were no relationships between the 7 Li isotope and cosmic rays. The exposure dating of sample 62255 has been verified three times, but it does not align with the general pattern. We investigated the causes of this result and the possibility that other factors related to the exposure of the samples to cosmic rays could influence this datum. To accomplish this, we used the LOLA digital elevation model. In Table 1, we can see that the altitude of sample 6255 is two orders of magnitude higher (−23 m) than the rest of the samples. We think this could be the reason why the concentration of the 7 Li isotope measured in this sample is abnormally high, with a 7 Li/Li ratio of 11.11 (Table 1).
In Figure 7, the concentration of the 7 Li isotope with respect to altitude is shown. There is a non-linear relationship that suggests that rock samples found at very low altitudes have higher concentrations of the 7 Li isotope than samples at intermediate altitudes. Meanwhile, samples from higher altitude areas have very high values of the 7 Li isotope. This observation requires a deeper study of the role of relief in the exposure of the samples. The fact that samples found at intermediate altitudes have lower concentrations of the 7 Li isotope, we believe, needs a detailed study of its relationship with relief. The samples we will analyze are those collected during the Apollo 15 mission (Table 1). These samples include 15058, 15475 and 15555. Sample 12054, a small sample (63 g) collected during Apollo 12, will not be considered in the relief analysis due to doubts about its georeferencing accuracy.
On the other hand, sample 74220, which corresponds to Orange regolith, exhibits the lowest ratio 7 Li/Li (0.31—Table 1). Weathering on the lunar surface is a continuous process, and it is quite possible that these materials have formed recently and have been exposed to the solar wind for a short time (dated about 27 m.y., Table 1) and in a low topographical position that coincides with a shaded area, as can be interpreted from the descriptions of the setting of this sample: “6–8 cm deep in a trench from Station 4, on the rim of 120 m Shorty crater”. On the other hand, we can find that the anorthosite samples have the lowest concentration of lithium (0.8 ppm) but the highest 7 Li ratio (8.89‰), more than double the 4‰ typical from the 7 Li in the Earth rocks (Table 1). It is important to highlight that anorthosite is the rock that predominates in the most elevated areas of the moon, with the highest topography exposures [4,36,55]. The other samples composed of different types of basalts display normal concentrations of lithium, similar to those found in basalts on Earth.

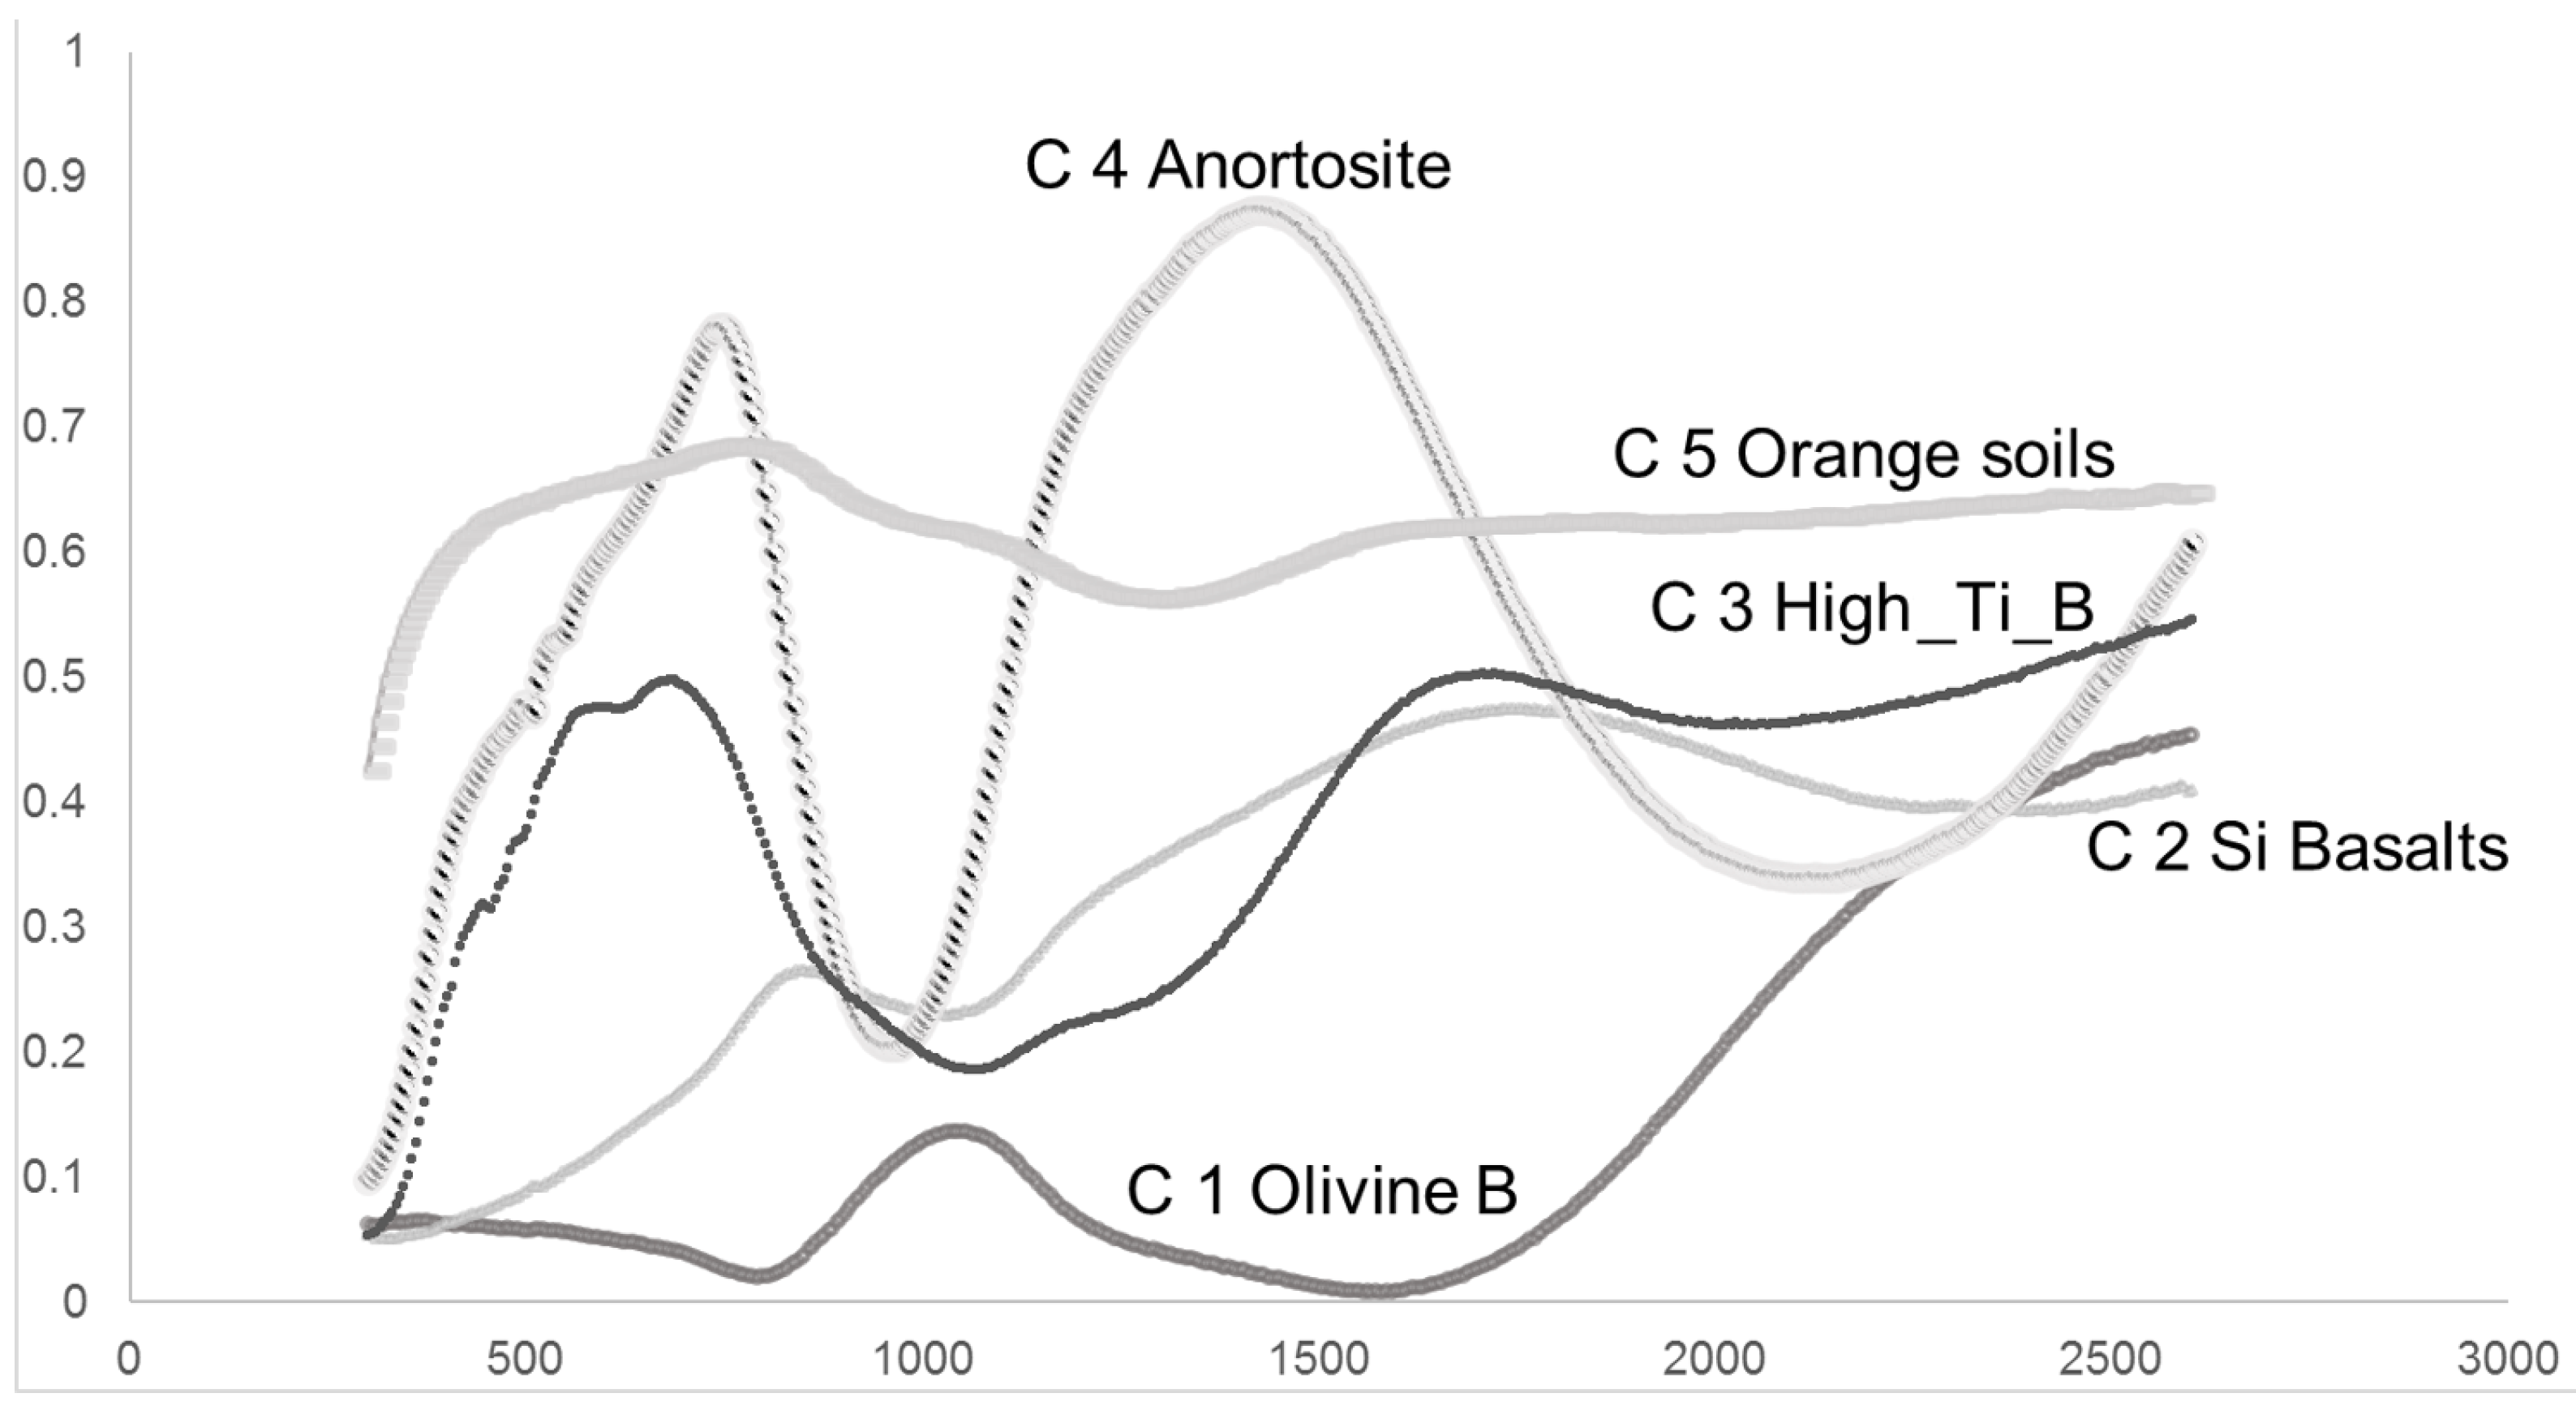
3.2. Types of Materials and Geological Samples

By combining the RELAB spectra via Principal Component Analysis (PCA), we could identify five types of spectra (Figure 8), which present five types of lunar samples: C1_Olivine-rich basalts, C2_Silica-rich basalts, C3_High_T Mare Basalts, C4_Anorthosite and C5_Orange and Glasses soils. These latter materials (C5) exhibit the highest concentrations of lithium (13.3 ppm) but the lowest 7 Li (4.19‰). On the other hand, the anorthosite samples have the lowest concentration of lithium (0.8 ppm) but the highest 7 Li ratio (8.89‰), more than double the 4‰ typically found in the rocks from the Earth.
The mineralogy of the moon is relatively simple, with most lunar rocks dominated by mixtures of feldspar, pyroxene, olivine and ilmenite [56]. Regolith covers the main part of the surface of the moon. The composition of the moon’s regolith varies depending on the area but, in general, is composed of a mixture of dust, small rocks and larger boulders, and it is created from the constant bombardment of meteoroids onto the moon’s surface over billions of years. The dust and small rocks are created by the impact of these meteoroids, which grinds the moon’s surface into fine particles. Also, there are rock outcrops in the highland regions, which make up the moon’s ancient crust, that are mainly composed of anorthosite [4,36,55]. The younger volcanic regions known as Maria are mainly composed of basalts (high-Ti mare basalts) [57].
Reflectance spectra are an important tool for exploring the moon. These spectra are available in the form of laboratory measurements of lunar samples [45,58]. We performed a Principal Component Analysis with the 19 spectra downloaded from the RELAB library (12045, 2_5058, 15475, 3_15555, 3_62255, 5_70035, 2_74220 and 2_75075) and we found different numbers of spectra for each of the eight samples. The PCA classified the spectra into five types of spectra (Figure 2, C1–C5; Table 1), presenting spectral features associated with five types of lunar substrata: C1_Olivine-rich basalts, C2_Silica-rich basalts, C3_High_Ti Mare Basalts, C4_Anorthosite and C5_Orange and Glasses soils. The spectral signatures of these five types (C1–C5) are characteristic for different types of substrata. Anorthosite shows two reflection peaks (at 650 and 150 nm) and two marked valleys at 1000 and 2000 nm. Orange and Glasses soils do not show clear peaks or valleys, but the spectrum presents the highest coefficients with rounded values of 0.6 and 0.7, which indicate that the sample is light and bright in color. On the other hand, High_Ti_Mare Basalts shows reflection peaks (600 and 1700 nm), valley at 1000 nm, and the color is dark and bright. Olivine basalts displays the lowest coefficients, with a very dark color and a reflection peak found at 1000 nm, with valleys at 800 and 1500 nm.
The Orange color of the soils (C5) seems to be related to space weathering processes. Space weathering here refers to the processes by which the optical properties of airless bodies change due to exposure to solar wind and micrometeoroid impacts. However, the difficulties in reproducing space-weathering conditions in the laboratory, or returning weathered samples to Earth, make it challenging to determine precisely how space weathering operates [58,59,60,61,62]. Remote sensing measurements, studies of lunar samples and laboratory experiments have established that solar wind ions and micrometeoroid bombardment weaken spectral absorption features and cause the lunar surface to darken and redden (increase in spectral continuum slope in the visible and near-infrared) over time. These changes appear to be due to some combination of the formation of impact glasses and agglutinates [63], the regolith’s disintegration into increasingly finer soils [64] and the accumulation of nanophase iron [60,65,66]. Sample 74220 (Orange and Glasses soil) was described as a clod of friable material taken from a depth of 6–8 cm in a trench in the Shorty crater, i.e., the Apollo 17 landing site. The Orange soil was found to be enriched with volatile elements (Zn, Pb, S, Cl, etc.) [67,68]. It generally contains significant amounts of highly siderophilic elements (Re, Os) that seem to be due to meteoritic contamination [69]. This information is available in the Lunar Sample Compendium compiled by Charles Meyer (https://curator.jsc.nasa.gov/lunar/lsc/index.cfm, accessed on 23 May 2023). This sample (74220) displays a relatively uniform spectra in the observed wavelength range (Figure 5). This phenomenon can occur when the sample has a uniform texture and composition and lacks specific functional groups that interact significantly with the visible–near-infrared regions, resulting in weak absorption or reflection characteristics. Additionally, the sample exhibits high coefficients, indicating efficient light reflection [40]. To obtain spectral indexes for the eight moon samples, we extended the indexes (C1_C5) to the entire Clementine image using the raster calculator in QGIS. Figure 9 shows the cartographic expression of the C5 ratio (Orange and Glasses soils) crossing with the Apollo sample 74220. The index reaches a value of 0.92 for the location of this sample. The C5 ratio is calculated using the Band2 and Nir2 bands of the Clementine image (Table 2). The sensor mapping can result in anomalous cartographic figures when there is contact between passes. However, the sample value (74220) in the index is consistent with its geological nature.
Other authors have also used Clementine images to relate the color of minerals with the composition of the surface. The presence of silicate minerals has been detected in the Clementine data set [70], and the presence of ilmenite was inferred from empirical relationships between lunar color and Ti content in lunar basalts [71,72]. Maps of the mineralogy of the lunar surface derived from the analysis of about 400,000 lunar spectra obtained by Clementine mission were presented years ago. The analysis was based upon an inversion of a radiative transfer model that predicts spectral reflectance properties from the relative abundance of the lunar minerals, their major elemental chemistry, grain size and properties related to space weathering.

3.3. Linear Correlations between Clementine Bands, Spectral Ratios and Lithium Concentration

Our analysis revealed an excellent linear correlation between the spectral parameters and lithium content of the lunar samples. Although the sample population is very small (only eight samples), the correlations are statistically significant (Table 3). The most noteworthy aspect of Table 3 is that the correlations have a negative sign for lithium concentrations and a positive one for the 7 Li isotope. Lithium concentration shows the highest correlations with the NIR bands, especially with Nir1 (1100 nm) and Nir2 (1250 nm) but with a negative sign. The only positive correlations are with C1 of 0.47 (olivine basalts) and with C5 of 0.45 (index of orange and glassy soils). The intense correlations with a negative sign that lithium shows with the visible bands must be related to the lithological nature of the rocks. Dark, fine-grained basalts absorb more light, so reflection in VIS–NIR bands is less. It is known that dark, fine-grained rocks absorb more light [73]. These correlations could be showing the geogenetic origin of lithium. On the other hand 7 Li shows the highest correlations to visible bands, in special with Band1 (450 nm) with R of 0.92. With respect to the spectral ratios, 7 Li has positive and significant correlation with C4 (0.57) which represent the anorthosite spectral index. In this case, these positive correlations with the visible bands could be related to the nature of the rock and also to its color, clear and bright, and location more exposed to light, which the samples with the highest amount of 7 Li seem to have (See Figure 7). The study shows statistically significant correlations. This is an important point to discuss, as it implies a strong relationship despite limited data availability. These correlations have encouraged us to perform Linear Regression Models (LRM) with the idea of exploring the possibility of estimating lithium concentrations from spectral indexes and Clementine bands. However, the small sample size also suggests the need for caution in generalizing these findings without further research.
Furthermore, the observation that the correlations have a negative sign for lithium concentrations but a positive sign for the 7 Li isotope is intriguing. This suggests different spectral behaviors for overall lithium versus its specific isotope, which could have implications for understanding lunar geology and the processes affecting lithium distribution. The high correlation of lithium concentration with NIR bands, particularly Nir1 (1100 nm) and Nir2 (1250 nm), is noteworthy. NIR spectroscopy could be a valuable tool in identifying lithium-rich areas on the Moon. The correlation of the 7 Li isotope with visible bands, particularly Band 1 (450 nm), should be discussed in relation to the Christiansen Factor (CF) and the Diviner mission. If we take a look at the C4 index (anorthosite) in Figure 8, we can see that there is a very marked peak of reflection in the visible region. This substrate shows the highest concentrations of 7 Li. The correlation with this band may be related to the strong response of Anorthosite in the visible spectrum or different surface processes or mineral compositions affecting 7 Li distribution, separate from overall lithium.

3.4. LRMs

We completed a large number of LRM analyses, with the most interesting results shown in Table 4. In summary, the C4 spectral ratio represents anorthosite (0.623), while the C5 spectral ratio corresponds to Orange and Glasses soils (−0.495), while Band1_450 nm (0.736) is the variable that best explained the variability of the 7 Li‰ in a LRM (R2→0.9) with a standard error of 0.53. However, in the case of the lithium concentration, the Nir1_1100 nm band (−7.233), C5 (−0.539) and Nir2_1250 nm band (6.106) better explained the spatial variability. The results suggest a possible relationship between the spatial variability of 7 Li and the Anortosite ratio (C4), as well as the importance of C5 in the lithium concentration model.
The significance of the Nir2 band in different lunar basalts and its correlation with the geogenetic origin of lithium is noteworthy. This correlation implies that the spectral characteristics could indicate the geological processes that affect the distribution of lithium. The correlation of the C4 spectral ratio (anorthosite) with 7 Li and the findings from [3] about the oldest anorthosite sample (3660 m.y.) having the lowest lithium concentration, but the highest 7 Li concentration is significant. This could indicate that spallation processes and weathering by the solar wind could play a significant role in altering the isotopic composition of lithium in these lunar samples. However, the measured exposure ages for this sample are the lowest (3 m.y.). The exposure age of sample 62255 is significantly higher, two orders of magnitude higher than the rest of the samples, despite being located at −23 m. The rest of the samples are found in depressed areas with altitudes between −1441 and −2633. It is important to note that this difference in exposure age should be taken into consideration when analyzing the data (see Table 1). While these results are promising, they highlight the need for further extensive research to comprehend the intricate interactions between lunar geology, solar wind exposure and the resulting chemical and isotopic composition of lunar materials. A detailed study of the sample’s exposure based on quantitative analysis of the relief could help clarify this issue.

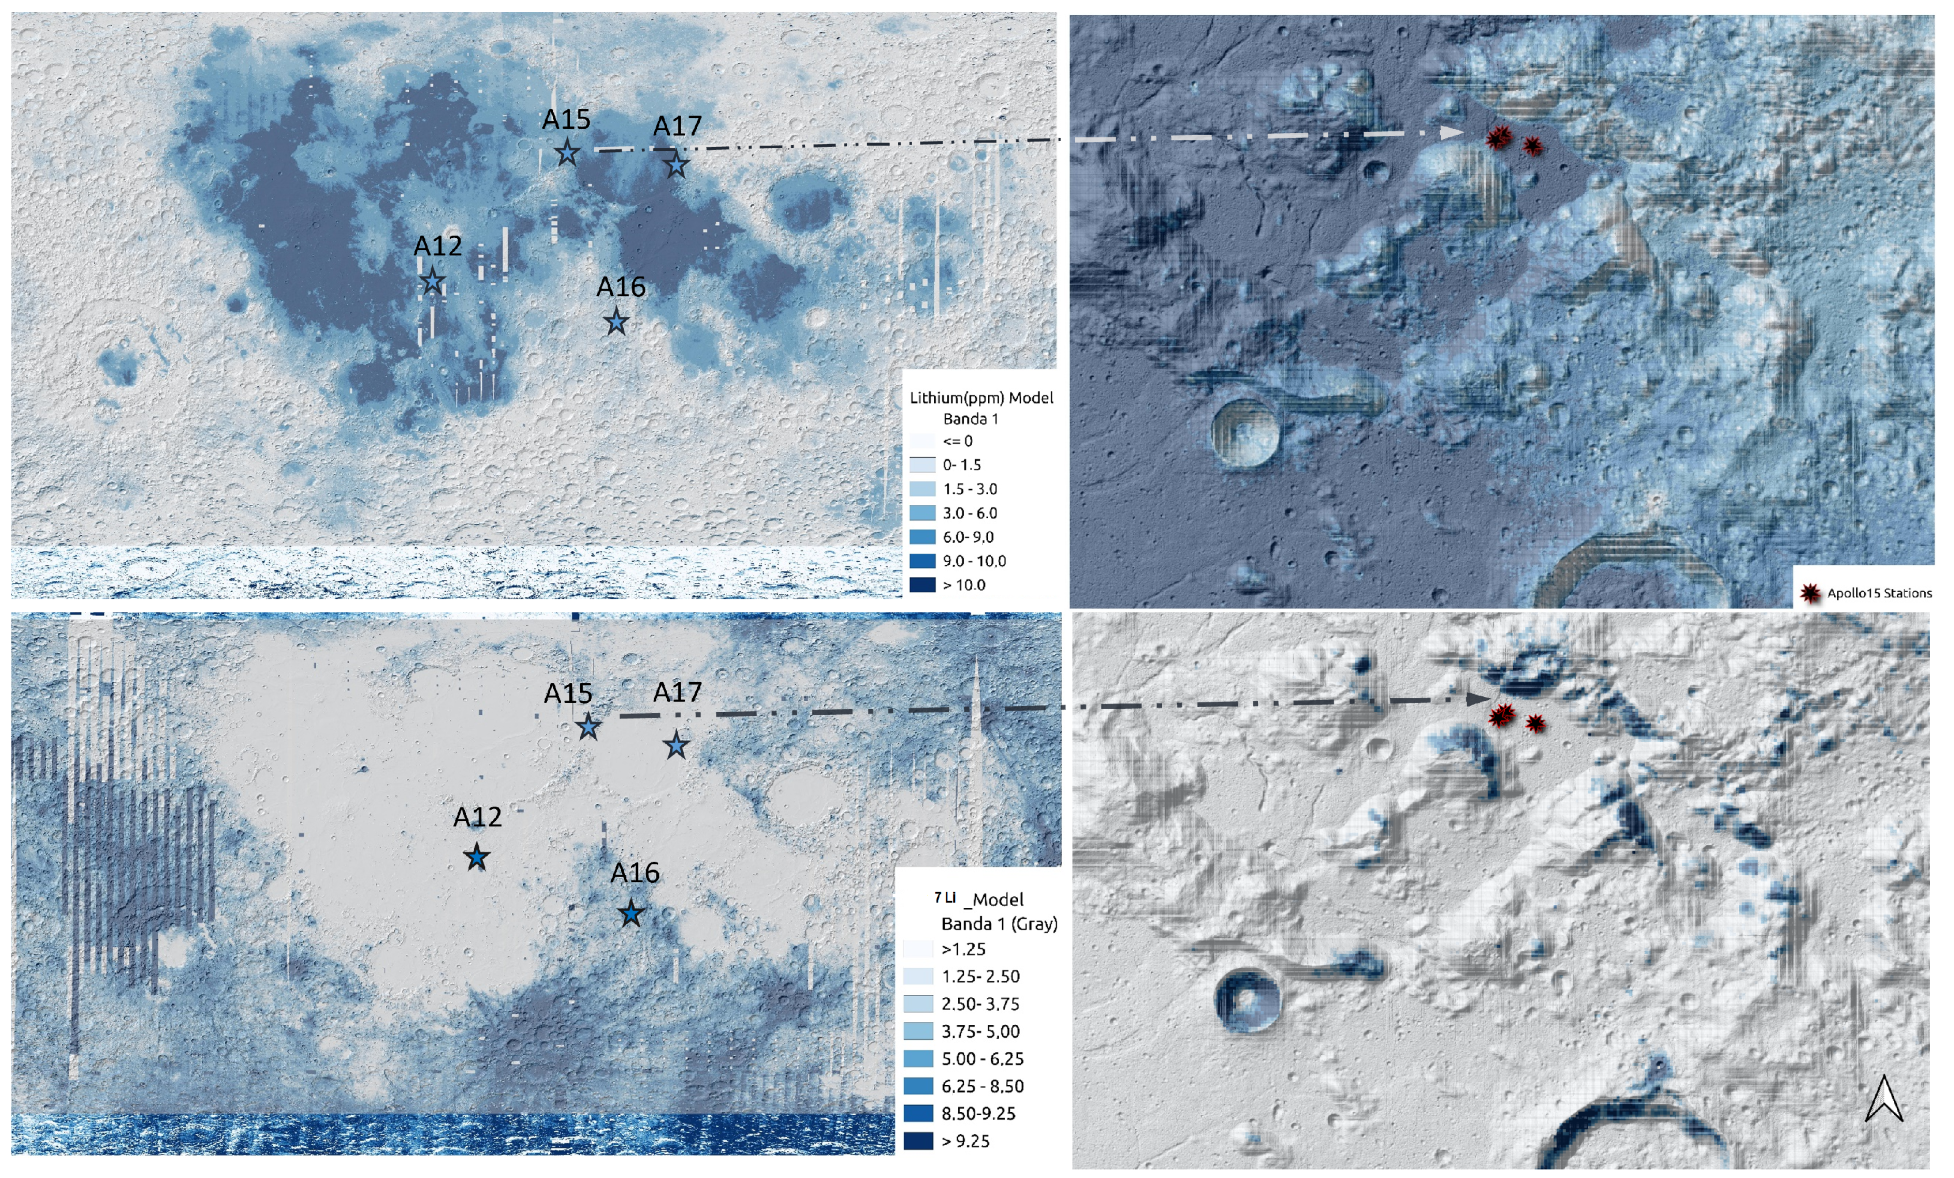
3.5. Maps of Lithium and 7 Li

The linear equations were translated into the Clementine image using QGis 3.34 raster calculator, resulting in two maps, one for lithium and another for 7 Li‰ (Figure 9). In this figure we can see details of the maps near the Apollo 15 landing zone, where the concentration of lithium is higher in relation to basaltic areas of the moon. This distribution is consistent with a geogenetic origin of the lithium [3]. However, upon combining the extended models of 7 Li and the LOLA_DEM, the image indicates that 7 Li is more concentrated in the highly cratered highlands. The analysis of spatial patterns and their relationship with topography suggests that 7 Li may have a cosmogenic origin due to space weathering. Space weathering, which involves changes in optical properties due to solar wind and micrometeoroid impacts [40], could significantly affect the isotopic composition of lunar materials. These processes could explain the high correlations between 7 Li and the visible bands of the Clementine images (Table 3). Analyzing the spatial patterns of 7 Li in relation to lunar topography could provide valuable insights into the moon’s geological history and the impact of external factors such as solar wind (Figure 10). The relationship between topography and isotope concentrations could reveal much about the moon’s exposure to space-weathering processes over time.
In Figure 11, we can see an attempt to validate the extended models with the 8 samples we have analysed. The model of 7 Li seems to be more accurate (R2 → 0.866) than the model of lithium (R2 → 0.75). The lithium model tends to overestimate the values. These findings may have implications for future lunar exploration, particularly in identifying areas of interest for resource utilization or further geological study. The spatial distribution of elements such as lithium and their isotopes is crucial for scientific understanding and practical applications.

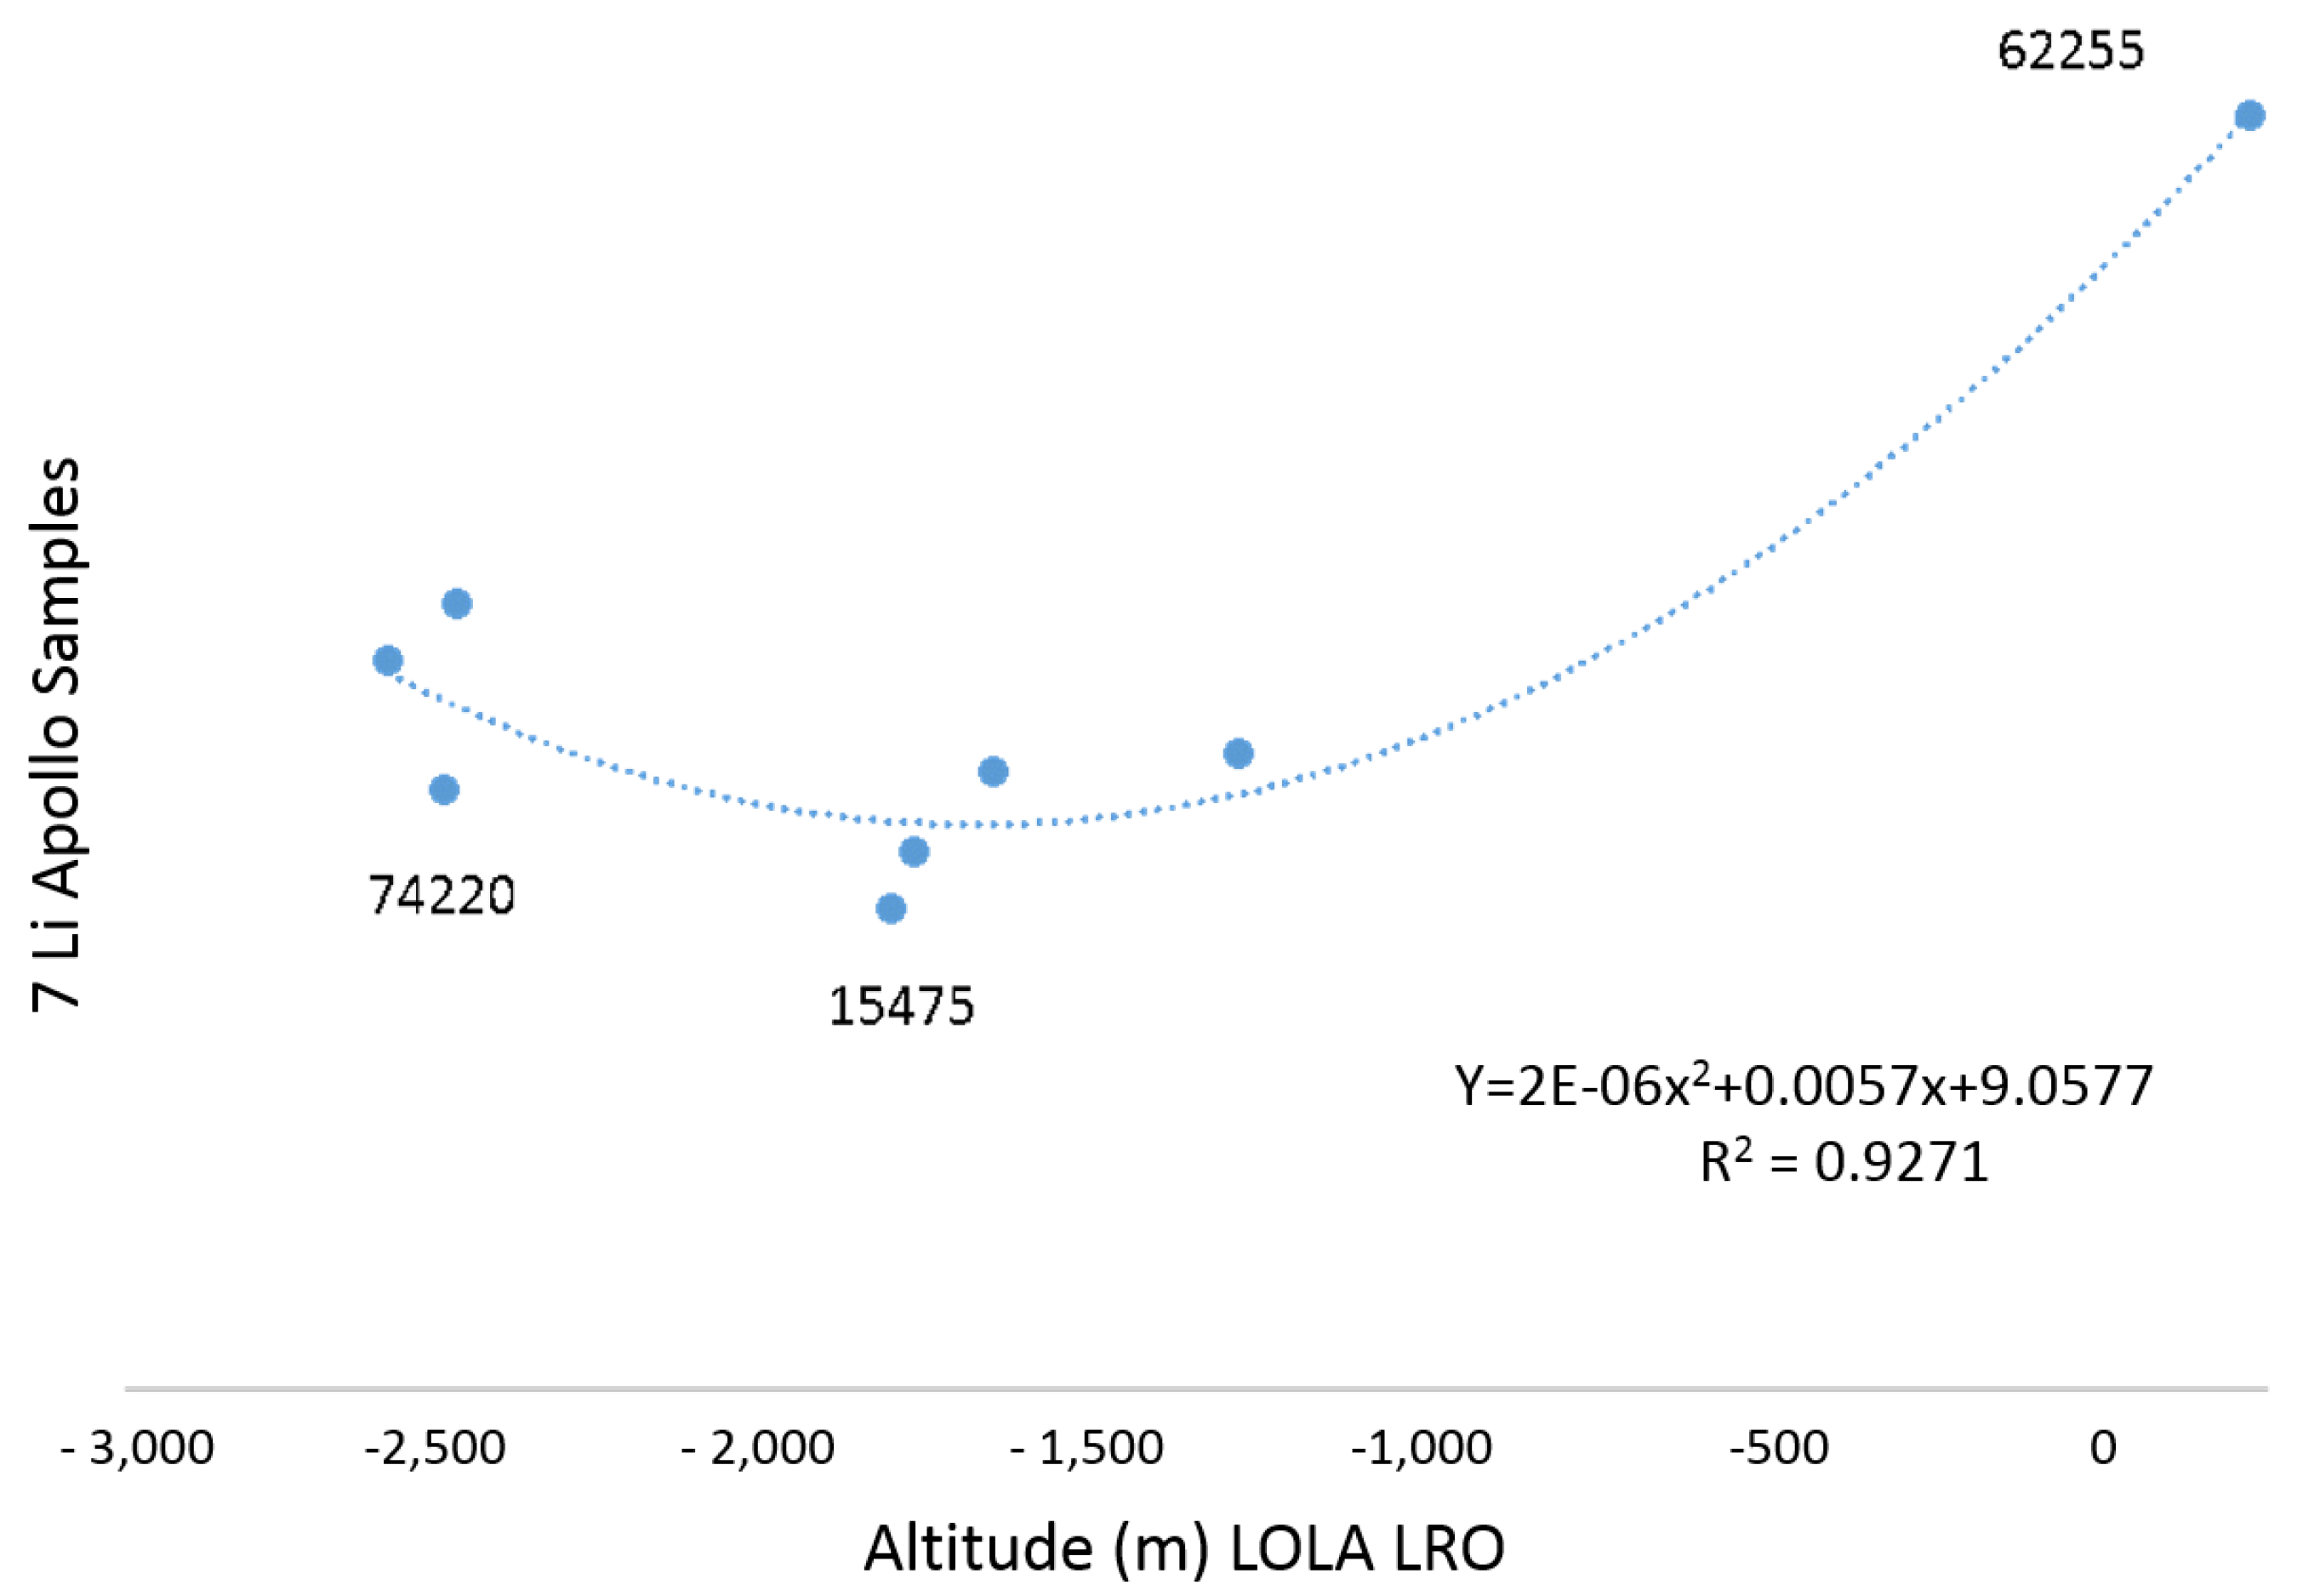
3.6. Relations with the DTMs
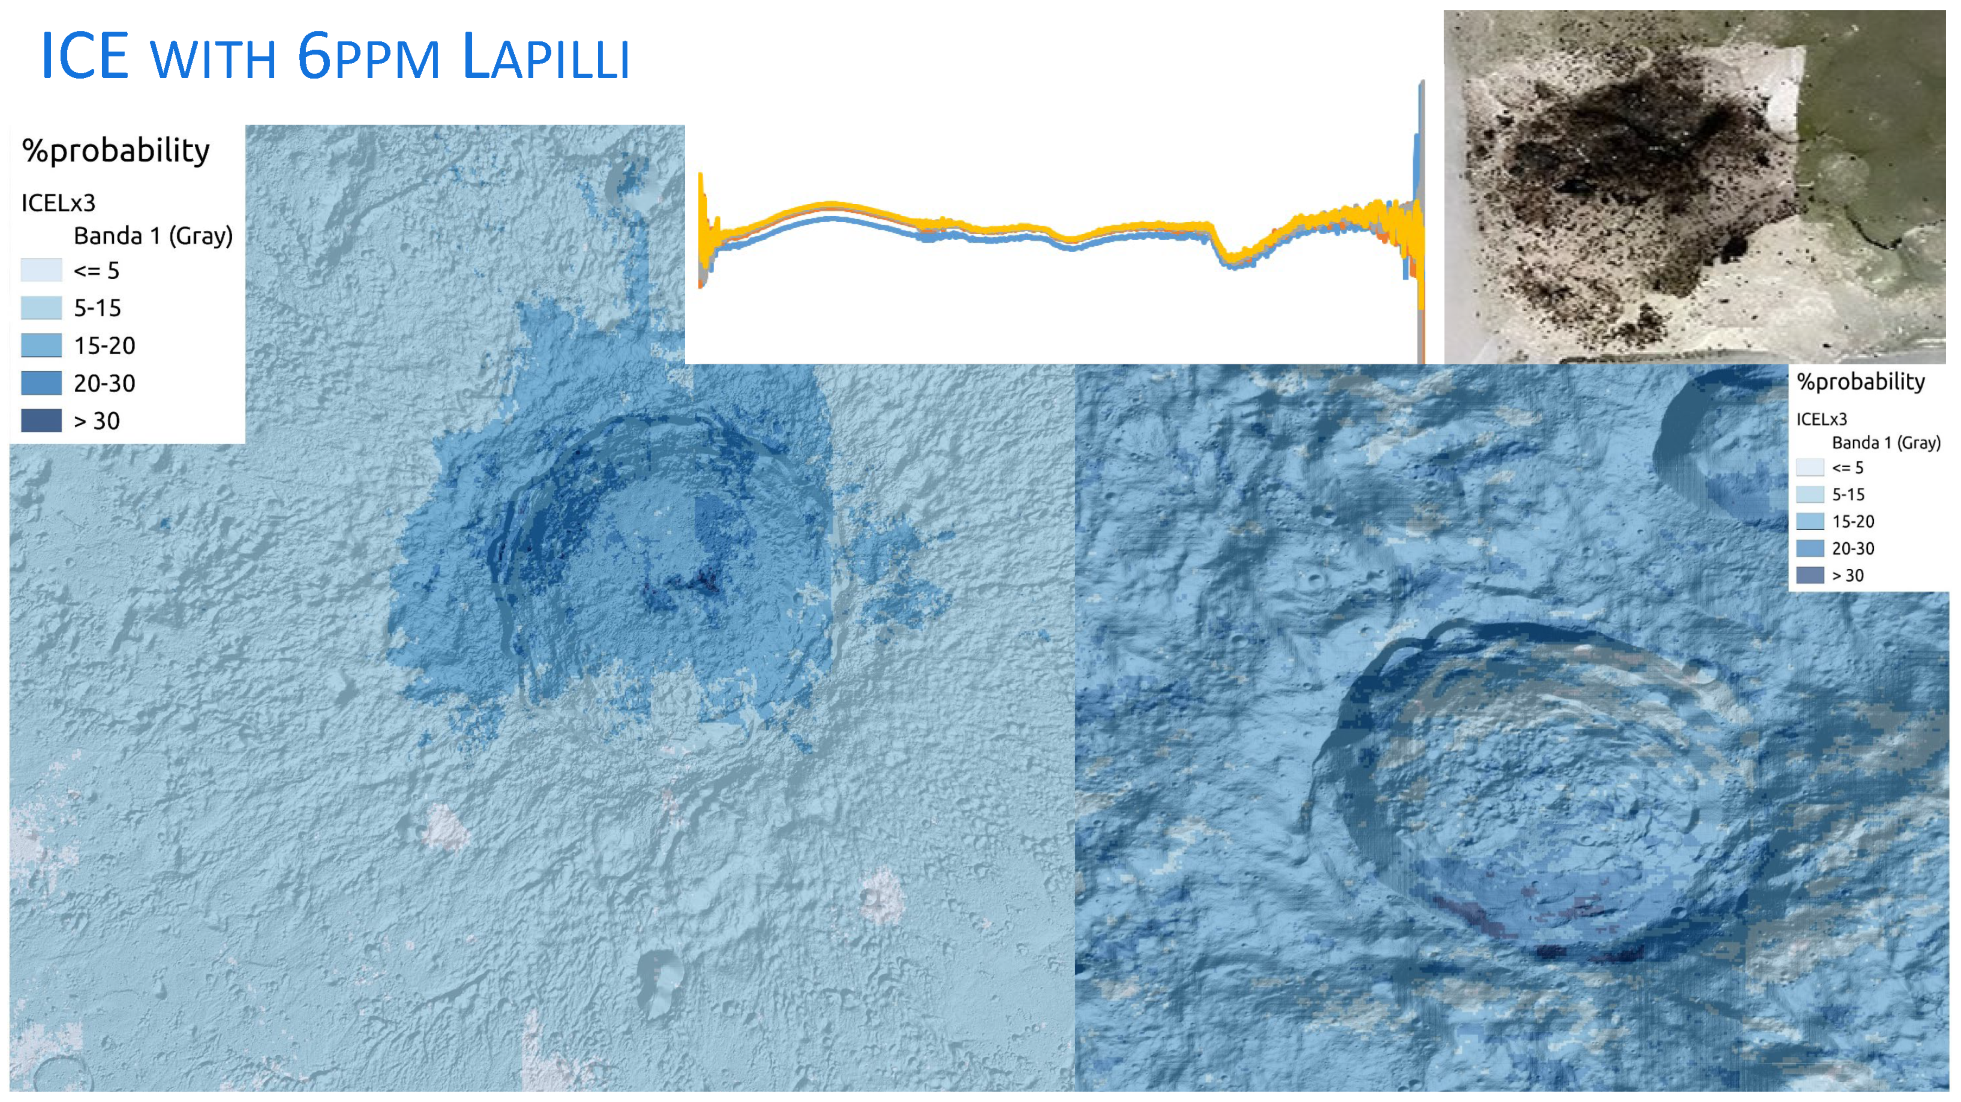
To further analyze the possible influence of the topography in the incidence of solar wind and concentration of 7 Li on the moon surface, we performed a GIS analysis in the environment of the Apollo 15 landing zone. This area was selected because it contains three moon samples of basalts (15058, 15475, 15555) that display very homogeneous values of lithium and 7 Li between them and the highest accuracy predictions in the models (e.g., 15058: 7.5; 15475: 6.8; 15555: 6.5 ppm of lithium). The study analyzed a random population of approximately 300 samples and examined the correlations between relief variables derived from DEM_LOLA and lithium and 7 Li concentrations. The results are shown in Figure 12. It is observed that relief variables have a negative correlation with lithium concentrations, indicating that lithium is more concentrated in flat, depressed and underexposed areas. Additionally, 7 Li exhibits low but statistically significant positive correlations with the wind exposition index, slope and sine of the aspect.
Analyzing a random population of about 300 samples can provide a substantial dataset for a more comprehensive understanding of the spatial distribution and environmental factors affecting lithium and 7 Li concentrations. It is significant that relief variables are negatively correlated with lithium concentrations. Areas of the lunar surface that are flatter, lower in elevation or less exposed to external elements tend to have higher lithium concentrations. These areas coincide with the depressed zones occupied by the Maria (Figure 9); thus, lithium appears to be closely related to geological processes on the Moon. The correlation of 7 Li with variables related to wind exposure supports the hypothesis that the solar wind may play a role in the distribution and creation of this isotope on the lunar surface. This finding has significant implications for our understanding of lunar geology and the impact of extraterrestrial factors, such as solar wind, on lunar materials. This result is consistent with the theory proposed by [51] regarding topographic solar radiation, which suggests that areas more exposed to solar wind exhibit a different isotopic composition. The GIS analysis provides valuable insights into the spatial distribution of lithium and the 7 Li isotope on the moon, indicating a significant influence of topographical features and solar wind exposure.

3.7. Dirty Ice

In Figure 13, we can see the types of Vis_Nir (350–2500 nm) spectra obtained for the dirty ices found in Figure 5. Three spectral ratios were obtained according to Equation (1) and extended to the entire clementine image using QGis raster calculation.
To search for ice in lunar regolith, which might have spectral signatures analogous to those presented by the Antarctic black glaciers we work on (see photos of glaciers, Figure 3), we used spectral libraries of ice fouled with different concentrations of lapilli (Figure 4). In this way, spectral ratios for the types of dirty ice (Figure 5: ICELapilli ×2 ppm; ICELapilli ×4ppm, and ICELapilli ×6 ppm) have been calculated using Equation (3), with the parameters showed in (Table 5). It is important to remember that a spectral ratio is a relationship between the intensities of reflected light at different wavelengths within a spectrum, specifically between 350 and 2450 nm. This relationship synthesizes the most characteristic features of the spectrum and is a useful tool for analyzing spectral satellite images. By analyzing a spectral curve in this range, it is possible to identify specific characteristics of materials, such as the presence of certain compounds. Applying these ratios to the Clementine image and studying the possible presence of regolith mixed with ice, only the ICELx3 ratio has produced results that can be interpreted with cartographic criteria. In the frequency histograms found in Figure 7, we can see that only the index ICELx3 takes positive values between 0 and 0.4. The ICELx2 and ICELx1 ratios do not exhibit positive values between 0 and 1, and, when they do appear, they are clearly associated with errors in the Clementine image (Figure 14).
Only one index (ICELx3) has shown a cartographic pattern that can be interpreted with geomorphological criteria as indicating the possibility of finding ice in the lunar regolith. The index ICELx3 corresponds to ice with 6 ppm of lapilli.
According to the initial screening, it seems that ice mixed with regolith is most likely to be found in areas near the South Pole of the moon, particularly in crater rims and impact-ejected material Figure 15). The index values range from 0 to 0.4, indicating a maximum probability of 40% for finding something similar to the Antarctic black glaciers. However, higher spectral and spatial resolution images are required to investigate areas of high probability. Further research is needed to confirm this hypothesis. It is possible that an impact crater created by an asteroid with a significant amount of ice has mixed with the lunar regolith and these ices. Therefore, the edges of craters or areas where residual material from the impact remains are preferred locations to search for this type of regolith mixed with ice. This proposition will be explored further using high-resolution images from China’s missions, such as the Chang’e Program [12], or other programs like Chandrayaan-1 [74], the Lunar Reconnaissance Orbiter (LRO) or Kaguya (SELENE).

4. Conclusions

The application of linear regression models, GIS analysis and spectral data interpretation prove to be powerful tools in lunar resource research. These methods allow for a deeper and more detailed understanding of the distribution of elements, minerals and resources as ice on the moon. Based on the results, several important conclusions can be drawn about lunar geology and the distribution of lithium and its isotopes on the moon’s surface. The presence of lithium on the moon appears to have geogenetic origin, with higher concentrations in basaltic areas. This suggests that lithium has accumulated in these regions as a result of specific geological processes from the moon’s past. Nevertheless, the findings indicate that the isotope 7 Li might have a cosmogenic origin, influenced by space weathering. This conclusion is supported by the positive correlation of 7 Li with areas exposed to solar wind, suggesting that long-term exposure to these extraterrestrial factors has affected its distribution. There is a clear relationship between the moon’s topographical features and the distribution of lithium and 7 Li. Although lithium concentrates in flatter, less exposed areas, 7 Li is more prevalent in the highly cratered highlands. These findings are valuable for future lunar exploration missions, as they provide key insights into where resources like lithium might be found. This is particularly relevant for long-term human settlement missions where local access to resources like lithium could be crucial. Although these results are significant, they also underscore the need for further studies to fully understand the geological and cosmogenic processes affecting the moon’s surface composition.
In summary, the study presents a comprehensive analysis of the distribution and potential origins of lithium and its isotopes on the moon. The results highlight the influence of both geological and extraterrestrial factors. These findings enhance our understanding of lunar geology and offer new opportunities for the exploration and utilization of lunar resources. Unfortunately, this exercise is only a preliminary exploration because this approach cannot be directly validated and applied to map the lithium of the lunar surface. This is due to the limited number of samples (only eight) that have measured lithium concentrations. However, this situation is common in geological planetary exploration. The use of the spectral library RELAB could serve to improve this point. Regarding the presence of dirty ice in rims and ejected material of craters located near the South Pole, it is suggested that further exploration will be conducted using high-resolution images from Lunar Reconnaissance Orbiter (LRO), Chandrayaan-1, Kaguya (SELENE) or Chang’e Program from China missions.

Author Contributions

Conceptualization, S.d.C.F.; methodology, S.d.C.F. and F.A.; software, R.M.; validation, S.d.C.F., E.D. and J.R.; formal analysis, S.d.C.F., F.A. and J.M.F.; investigation, S.d.C.F. and F.A.; resources, S.d.C.F. and J.F.C.; data curation, E.D. and J.F.C.; writing—original draft preparation, S.d.C.F.; writing—review and editing, S.d.C.F. and R.M.; visualization, F.J.d.C.; supervision, J.M.-F.; project administration, S.d.C.F. and J.F.C.; funding acquisition, S.d.C.F. and J.F.C. All authors have read and agreed to the published version of the manuscript.

Funding

This research and the APC were funded by Ministerio de Ciencia e Innovación: PALANTARICE: PID2021-361127060OB-I00 and GLACEVOL: PID2020-113051RB-C31.

Data Availability Statement

Publicly available datasets were analyzed in this study. These data can be found here: https://sispec.cnr.it/index.php, accessed on 5 May 2022.

Acknowledgments

We gratefully acknowledge the open-access data provided by Orbital Data Explorer and RELAB. This valuable resource has contributed significantly to the research findings presented in this paper.

Conflicts of Interest

The authors declare no conflicts of interest.

References

  1. Fisher, E.A.; Lucey, P.G.; Lemelin, M.; Greenhagen, B.T.; Siegler, M.A.; Mazarico, E.; Aharonson, O.; Williams, J.P.; Hayne, P.O.; Neumann, G.A.; et al. Evidence for surface water ice in the lunar polar regions using reflectance measurements from the Lunar Orbiter Laser Altimeter and temperature measurements from the Diviner Lunar Radiometer Experiment. Icarus 2017, 292, 74–85. [Google Scholar] [CrossRef] [PubMed]
  2. Hayne, P.O.; Hendrix, A.; Sefton-Nash, E.; Siegler, M.A.; Lucey, P.G.; Retherford, K.D.; Williams, J.P.; Greenhagen, B.T.; Paige, D.A. Evidence for exposed water ice in the Moon’s south polar regions from Lunar Reconnaissance Orbiter ultraviolet albedo and temperature measurements. Icarus 2015, 255, 58–69. [Google Scholar] [CrossRef]
  3. Magna, T.; Wiechert, U.; Halliday, A.N. New constraints on the lithium isotope compositions of the Moon and terrestrial planets. Earth Planet. Sci. Lett. 2006, 243, 336–353. [Google Scholar] [CrossRef]
  4. Ohtake, M.; Matsunaga, T.; Haruyama, J.; Yokota, Y.; Morota, T.; Honda, C.; Ogawa, Y.; Torii, M.; Miyamoto, H.; Arai, T.; et al. The global distribution of pure anorthosite on the Moon. Nature 2009, 461, 236–240. [Google Scholar] [CrossRef] [PubMed]
  5. Lucey, P.G. Mineral maps of the Moon. Geophys. Res. Lett. 2004, 31, 8. [Google Scholar] [CrossRef]
  6. Colaprete, A.; Schultz, P.; Heldmann, J.; Wooden, D.; Shirley, M.; Ennico, K.; Hermalyn, B.; Marshall, W.; Ricco, A.; Elphic, R.C.; et al. Detection of water in the LCROSS ejecta plume. Science 2010, 330, 463–468. [Google Scholar] [CrossRef] [PubMed]
  7. Charette, M.P.; McCord, T.B.; Pieters, C.M.; Adams, J.B. Application of Remote Spectral Reflectance Measurements to Lunar Geology Classification and Determination of Titanium Content of Lunar Soils. J. Geophys. Res. 1974, 79, 1605–1613. [Google Scholar] [CrossRef]
  8. Adler, I.; Trombka, J.; Gerard, J.; Lowman, P.; Schmadebeck, R.; Blodget, H.; Eller, E.; Yin, L.; Lamothe, R.; Osswald, G.; et al. Apollo 16 geochemical X-ray fluorescence experiment: Preliminary report. Science 1972, 177, 256–259. [Google Scholar] [CrossRef] [PubMed]
  9. Swinyard, B.; Joy, K.; Kellett, B.; Crawford, I.; Grande, M.; Howe, C.; Fernandes, V.; Gasnault, O.; Lawrence, D.; Russell, S.; et al. X-ray fluorescence observations of the Moon by SMART-1/D-CIXS and the first detection of Ti Kα from the lunar surface. Planet. Space Sci. 2009, 57, 744–750. [Google Scholar] [CrossRef]
  10. Athiray, P.; Narendranath, S.; Sreekumar, P.; Dash, S.; Babu, B. Validation of methodology to derive elemental abundances from X-ray observations on Chandrayaan-1. Planet. Space Sci. 2013, 75, 188–194. [Google Scholar] [CrossRef]
  11. Fa, W.; Zhu, M.H.; Liu, T.; Plescia, J.B. Regolith stratigraphy at the Chang’E-3 landing site as seen by lunar penetrating radar. Geophys. Res. Lett. 2015, 42, 10–179. [Google Scholar] [CrossRef]
  12. Li, C.; Zuo, W.; Wen, W.; Zeng, X.; Gao, X.; Liu, Y.; Fu, Q.; Zhang, Z.; Su, Y.; Ren, X.; et al. Overview of the Chang’e-4 mission: Opening the frontier of scientific exploration of the lunar far side. Space Sci. Rev. 2021, 217, 35. [Google Scholar] [CrossRef]
  13. Metzger, A. Composition of the Moon as Determined from Orbit by Gamma-Ray Spectroscopy, in Remote Geochemical Analysis: Elemental and Mineralogical Composition. Ph.D. Thesis, Cambridge University Press, New York, NY, USA, 1993. Available online: https://www.semanticscholar.org/paper/Composition-of-the-Moon-as-Determined-from-Orbit-by-Metzger/ea880d11ccf05dee2c2109f4e1fc394eeccf41e4 (accessed on 1 February 2024).
  14. Lawrence, D.; Feldman, W.; Barraclough, B.; Binder, A.; Elphic, R.; Maurice, S.; Thomsen, D. Global elemental maps of the Moon: The Lunar Prospector gamma-ray spectrometer. Science 1998, 281, 1484–1489. [Google Scholar] [CrossRef] [PubMed]
  15. Lawrence, D.; Feldman, W.; Barraclough, B.; Binder, A.; Elphic, R.; Maurice, S.; Miller, M.; Prettyman, T. Thorium abundances on the lunar surface. J. Geophys. Res. Planets 2000, 105, 20307–20331. [Google Scholar] [CrossRef]
  16. Prettyman, T.H.; Hagerty, J.; Elphic, R.; Feldman, W.; Lawrence, D.; McKinney, G.; Vaniman, D. Elemental composition of the lunar surface: Analysis of gamma ray spectroscopy data from Lunar Prospector. J. Geophys. Res. Planets 2006, 111. [Google Scholar] [CrossRef]
  17. Naito, M.; Hasebe, N.; Nagaoka, H.; Shibamura, E.; Ohtake, M.; Kim, K.; Wöhler, C.; Berezhnoy, A. Iron distribution of the Moon observed by the Kaguya gamma-ray spectrometer: Geological implications for the South Pole-Aitken basin, the Orientale basin, and the Tycho crater. Icarus 2018, 310, 21–31. [Google Scholar] [CrossRef]
  18. Elphic, R.; Lawrence, D.; Feldman, W.; Barraclough, B.; Maurice, S.; Binder, A.; Lucey, P. Lunar Fe and Ti abundances: Comparison of Lunar Prospector and Clementine data. Science 1998, 281, 1493–1496. [Google Scholar] [CrossRef] [PubMed]
  19. Elphic, R.; Lawrence, D.; Feldman, W.; Barraclough, B.; Maurice, S.; Binder, A.; Lucey, P. Lunar rare earth element distribution and ramifications for FeO and TiO2: Lunar Prospector neutron spectrometer observations. J. Geophys. Res. Planets 2000, 105, 20333–20345. [Google Scholar] [CrossRef]
  20. Elphic, R.; Lawrence, D.; Feldman, W.; Barraclough, B.; Gasnault, O.; Maurice, S.; Lucey, P.; Blewett, D.; Binder, A. Lunar Prospector neutron spectrometer constraints on TiO2. J. Geophys. Res. Planets 2002, 107, 8-1–8-9. [Google Scholar] [CrossRef]
  21. Feldman, W.; Barraclough, B.; Maurice, S.; Elphic, R.; Lawrence, D.; Thomsen, D.; Binder, A. Major compositional units of the Moon: Lunar Prospector thermal and fast neutrons. Science 1998, 281, 1489–1493. [Google Scholar] [CrossRef] [PubMed]
  22. Feldman, W.; Lawrence, D.; Elphic, R.; Barraclough, B.; Maurice, S.; Genetay, I.; Binder, A. Polar hydrogen deposits on the Moon. J. Geophys. Res. Planets 2000, 105, 4175–4195. [Google Scholar] [CrossRef]
  23. Lucey, P.G.; Taylor, G.J.; Malaret, E. Abundance and distribution of iron on the Moon. Science 1995, 268, 1150–1153. [Google Scholar] [CrossRef] [PubMed]
  24. Lucey, P.G.; Blewett, D.T.; Hawke, B.R. Mapping the FeO and TiO2 content of the lunar surface with multispectral imagery. J. Geophys. Res. Planets 1998, 103, 3679–3699. [Google Scholar] [CrossRef]
  25. Lucey, P.G.; Blewett, D.T.; Jolliff, B.L. Lunar iron and titanium abundance algorithms based on final processing of Clementine ultraviolet-visible images. J. Geophys. Res. Planets 2000, 105, 20297–20305. [Google Scholar] [CrossRef]
  26. Lucey, P.G. Radiative transfer modeling of the effect of mineralogy on some empirical methods for estimating iron concentration from multispectral imaging of the Moon. J. Geophys. Res. Planets 2006, 111. [Google Scholar] [CrossRef]
  27. Bandfield, J.L.; Hayne, P.O.; Williams, J.P.; Greenhagen, B.T.; Paige, D.A. Lunar surface roughness derived from LRO Diviner Radiometer observations. Icarus 2015, 248, 357–372. [Google Scholar] [CrossRef]
  28. Sato, H.; Robinson, M.S.; Lawrence, S.J.; Denevi, B.W.; Hapke, B.; Jolliff, B.L.; Hiesinger, H. Lunar mare TiO2 abundances estimated from UV/Vis reflectance. Icarus 2017, 296, 216–238. [Google Scholar] [CrossRef]
  29. Ma, M.; Li, B.; Chen, S.; Lu, T.; Lu, P.; Lu, Y.; Jin, Q. Global estimates of lunar surface chemistry derived from LRO diviner data. Icarus 2022, 371, 114697. [Google Scholar] [CrossRef]
  30. Ling, Z.; Zhang, J.; Liu, J.; Zhang, W.; Bian, W.; Ren, X.; Mu, L.; Liu, J.; Li, C. Preliminary results of FeO mapping using Imaging Interferometer data from Chang’E-1. Chin. Sci. Bull. 2011, 56, 376–379. [Google Scholar] [CrossRef]
  31. Yan, B.; Xiong, S.Q.; Wu, Y.; Wang, Z.; Dong, L.; Gan, F.; Yang, S.; Wang, R. Mapping Lunar global chemical composition from Chang’E-1 IIM data. Planet. Space Sci. 2012, 67, 119–129. [Google Scholar] [CrossRef]
  32. Wu, Y.; Xue, B.; Zhao, B.; Lucey, P.; Chen, J.; Xu, X.; Li, C.; Ouyang, Z. Global estimates of lunar iron and titanium contents from the Chang’E-1 IIM data. J. Geophys. Res. Planets 2012, 117. [Google Scholar] [CrossRef]
  33. Sun, L.; Ling, Z.; Zhang, J.; Li, B.; Chen, J.; Wu, Z.; Liu, J. Lunar iron and optical maturity mapping: Results from partial least squares modeling of Chang’E-1 IIM data. Icarus 2016, 280, 183–198. [Google Scholar] [CrossRef]
  34. Xia, W.; Wang, X.; Zhao, S.; Jin, H.; Chen, X.; Yang, M.; Wu, X.; Hu, C.; Zhang, Y.; Shi, Y.; et al. New maps of lunar surface chemistry. Icarus 2019, 321, 200–215. [Google Scholar] [CrossRef]
  35. Logan, L.M.; Hunt, G.R.; Salisbury, J.W.; Balsamo, S.R. Compositional implications of Christiansen frequency maximums for infrared remote sensing applications. J. Geophys. Res. 1973, 78, 4983–5003. [Google Scholar] [CrossRef]
  36. Salisbury, J.W.; Basu, A.; Fischer, E.M. Thermal infrared spectra of lunar soils. Icarus 1997, 130, 125–139. [Google Scholar] [CrossRef]
  37. Paige, D.; Foote, M.; Greenhagen, B.; Schofield, J.; Calcutt, S.; Vasavada, A.; Preston, D.; Taylor, F.; Allen, C.; Snook, K.; et al. The lunar reconnaissance orbiter diviner lunar radiometer experiment. Space Sci. Rev. 2010, 150, 125–160. [Google Scholar] [CrossRef]
  38. Greenhagen, B.T.; Lucey, P.G.; Wyatt, M.B.; Glotch, T.D.; Allen, C.C.; Arnold, J.A.; Bandfield, J.L.; Bowles, N.E.; Hanna, K.L.D.; Hayne, P.O.; et al. Global Silicate Mineralogy of the Moon from the Diviner Lunar Radiometer. Science 2010, 329, 1507–1509. [Google Scholar] [CrossRef] [PubMed]
  39. Hanna, K.D.; Greenhagen, B.; Patterson Iii, W.; Pieters, C.; Mustard, J.; Bowles, N.; Paige, D.; Glotch, T.; Thompson, C. Effects of varying environmental conditions on emissivity spectra of bulk lunar soils: Application to Diviner thermal infrared observations of the Moon. Icarus 2017, 283, 326–342. [Google Scholar] [CrossRef]
  40. Lucey, P.G.; Greenhagen, B.T.; Song, E.; Arnold, J.A.; Lemelin, M.; Hanna, K.D.; Bowles, N.E.; Glotch, T.D.; Paige, D.A. Space weathering effects in Diviner Lunar Radiometer multispectral infrared measurements of the lunar Christiansen Feature: Characteristics and mitigation. Icarus 2017, 283, 343–351. [Google Scholar] [CrossRef]
  41. Lucey, P.G.; Hayne, P.O.; Costello, E.; Green, R.; Hibbitts, C.; Goldberg, A.; Mazarico, E.; Li, S.; Honniball, C. The spectral radiance of indirectly illuminated surfaces in regions of permanent shadow on the Moon. Acta Astronaut. 2021, 180, 25–34. [Google Scholar] [CrossRef]
  42. Nozette, S.; Rustan, P.; Pleasance, L.; Kordas, J.; Lewis, I.; Park, H.; Priest, R.; Horan, D.; Regeon, P.; Lichtenberg, C.; et al. The Clementine mission to the Moon: Scientific overview. Science 1994, 266, 1835–1839. [Google Scholar] [CrossRef] [PubMed]
  43. McEwen, A.; Robinson, M. Mapping of the Moon by Clementine. Adv. Space Res. 1997, 19, 1523–1533. [Google Scholar] [CrossRef]
  44. Pieters, C.; Shkuratov, Y.; Kaydash, V.; Stankevich, D.; Taylor, L. Lunar soil characterization consortium analyses: Pyroxene and maturity estimates derived from Clementine image data. Icarus 2006, 184, 83–101. [Google Scholar] [CrossRef]
  45. Pieters, C.M.; Hiroi, T. RELAB (Reflectance Experiment Laboratory): A NASA multiuser spectroscopy facility. In Proceedings of the Lunar and Planetary Science Conference, League City, TX, USA, 15–19 March 2004; p. 1720. [Google Scholar]
  46. Drozd, R.; Hohenberg, C.; Morgan, C.; Ralston, C. Cosmic-ray exposure history at the Apollo 16 and other lunar sites: Lunar surface dynamics. Geochim. Cosmochim. Acta 1974, 38, 1625–1642. [Google Scholar] [CrossRef]
  47. Wolfe, E.W.; Lucchitta, B.K.; Reed, V.S.; Ulrich, G.E.; Sánchez, A.G. Geology of the Taurus-Littrow Valley Floor; NASA: Washington, DC, USA, 1975. [Google Scholar]
  48. Butler, J. Origins of Mare Basalts and Their Implications for Lunar Evolution; NASA: Washington, DC, USA, 1975. [Google Scholar]
  49. Heiken, G.H.; McKay, D.S.; Brown, R. Lunar deposits of possible pyroclastic origin. Geochim. Cosmochim. Acta 1974, 38, 1703–1718. [Google Scholar] [CrossRef]
  50. Hintenberger, H.; Weber, H.W.; Schultz, L. Solar, Spallogenic, and Radiogenic Rare Gases in Apollo 17 Soils and Breccias; NASA: Washington, DC, USA, 1974. [Google Scholar]
  51. Dubayah, R.; Rich, P.M. Topographic solar radiation models for GIS. Int. J. Geogr. Inf. Syst. 1995, 9, 405–419. [Google Scholar] [CrossRef]
  52. Wilson, J.P.; Gallant, J.C. Digital terrain analysis. Terrain Anal. Princ. Appl. 2000, 6, 1–27. [Google Scholar]
  53. Olaya, V.; Conrad, O. Geomorphometry in SAGA. Dev. Soil Sci. 2009, 33, 293–308. [Google Scholar]
  54. Böhner, J.; Antonić, O. Land-surface parameters specific to topo-climatology. Dev. Soil Sci. 2009, 33, 195–226. [Google Scholar]
  55. Blewett, D.T.; Hawke, B.R.; Lucey, P.G. Lunar pure anorthosite as a spectral analog for Mercury. Meteorit. Planet. Sci. 2002, 37, 1245–1254. [Google Scholar] [CrossRef]
  56. Papike, J.; Taylor, L.; Simon, S. Lunar minerals. In Lunar Sourcebook: A User’s Guide to the Moon; Lunar and Planetary Institute: Houston, TX, USA, 1991; pp. 121–181. [Google Scholar]
  57. Warren, P.H.; Shirley, D.N.; Kallemeyn, G.W. A potpourri of pristine Moon rocks, including a VHK mare basalt and a unique, augite-rich Apollo 17 anorthosite. J. Geophys. Res. Solid Earth 1986, 91, 319–330. [Google Scholar] [CrossRef]
  58. Pieters, C.; Pratt, S. Earth-based near-infrared collection of spectra for the Moon: A new PDS data set. In Proceedings of the Lunar and Planetary Science Conference, Houston, TX, USA, 13–17 March 2000; p. 2059. [Google Scholar]
  59. Pieters, C.M.; Ammannito, E.; Blewett, D.T.; Denevi, B.W.; De Sanctis, M.C.; Gaffey, M.J.; Le Corre, L.; Li, J.Y.; Marchi, S.; McCord, T.B.; et al. Distinctive space weathering on Vesta from regolith mixing processes. Nature 2012, 491, 79–82. [Google Scholar] [CrossRef] [PubMed]
  60. Hapke, B. Space weathering from Mercury to the asteroid belt. J. Geophys. Res. Planets 2001, 106, 10039–10073. [Google Scholar] [CrossRef]
  61. Vernazza, P.; Binzel, R.; Rossi, A.; Fulchignoni, M.; Birlan, M. Solar wind as the origin of rapid reddening of asteroid surfaces. Nature 2009, 458, 993–995. [Google Scholar] [CrossRef] [PubMed]
  62. Domingue, D.L.; Chapman, C.R.; Killen, R.M.; Zurbuchen, T.H.; Gilbert, J.A.; Sarantos, M.; Benna, M.; Slavin, J.A.; Schriver, D.; Trávníček, P.M.; et al. Mercury’s weather-beaten surface: Understanding Mercury in the context of lunar and asteroidal space weathering studies. Space Sci. Rev. 2014, 181, 121–214. [Google Scholar] [CrossRef]
  63. Adams, J.B.; McCord, T.B. Optical properties of mineral separates, glass, and anorthositic fragments from Apollo mare samples. In Proceedings of the Lunar Science Conference, Houston, TX, USA, 11–14 January 1971; Volume 2, p. 2183. [Google Scholar]
  64. Pieters, C.M.; Head, J.; Sunshine, J.; Fischer, E.; Murchie, S.; Belton, M.; McEwen, A.; Gaddis, L.; Greeley, R.; Neukum, G.; et al. Crustal diversity of the Moon: Compositional analyses of Galileo solid state imaging data. J. Geophys. Res. Planets 1993, 98, 17127–17148. [Google Scholar] [CrossRef]
  65. Sasaki, S.; Nakamura, K.; Hamabe, Y.; Kurahashi, E.; Hiroi, T. Production of iron nanoparticles by laser irradiation in a simulation of lunar-like space weathering. Nature 2001, 410, 555–557. [Google Scholar] [CrossRef] [PubMed]
  66. Noble, S.K.; Pieters, C.M.; Keller, L.P. An experimental approach to understanding the optical effects of space weathering. Icarus 2007, 192, 629–642. [Google Scholar] [CrossRef]
  67. Meyer, C., Jr.; McKay, D.; Anderson, D.; Butler, P., Jr. The source of sublimates on the Apollo 15 green and Apollo 17 orange glass samples. In Proceedings of the Lunar Science Conference, Houston, TX, USA, 17–21 March 1975; Volume 6, pp. 1673–1699. [Google Scholar]
  68. Butler, J., Jr.; Meyer, C., Jr. Sulfur prevails in coatings on glass droplets-Apollo 15 green and brown glasses and Apollo 17 orange and black/devitrified/glasses. In Proceedings of the Lunar and Planetary Science Conference Proceedings, Houston, TX, USA, 15–19 March 1976; Volume 7, pp. 1561–1581. [Google Scholar]
  69. Day, J.M.; Walker, R.J.; James, O.B.; Puchtel, I.S. Osmium isotope and highly siderophile element systematics of the lunar crust. Earth Planet. Sci. Lett. 2010, 289, 595–605. [Google Scholar] [CrossRef]
  70. Tompkins, S.; Pieters, C.M. Mineralogy of the lunar crust: Results from Clementine. Meteorit. Planet. Sci. 1999, 34, 25–41. [Google Scholar] [CrossRef]
  71. Blewett, D.T.; Lucey, P.G.; Hawke, B.R.; Jolliff, B.L. Clementine images of the lunar sample-return stations: Refinement of FeO and TiO2 mapping techniques. J. Geophys. Res. Planets 1997, 102, 16319–16325. [Google Scholar] [CrossRef]
  72. Giguere, T.A.; Taylor, G.J.; HAWKE, B.R.; Lucey, P.G. The titanium contents of lunar mare basalts. Meteorit. Planet. Sci. 2000, 35, 193–200. [Google Scholar] [CrossRef]
  73. Escadafal, R.; Girard, M.C.; Courault, D. Munsell soil color and soil reflectance in the visible spectral bands of Landsat MSS and TM data. Remote. Sens. Environ. 1989, 27, 37–46. [Google Scholar] [CrossRef]
  74. Bhatt, M.; Wöhler, C.; Dhingra, D.; Thangjam, G.; Rommel, D.; Mall, U.; Bhardwaj, A.; Grumpe, A. Compositional studies of Mare Moscoviense: New perspectives from Chandrayaan-1 VIS-NIR data. Icarus 2018, 303, 149–165. [Google Scholar] [CrossRef]
Figure 1. Cartographic expression of the Wind Exposition Index. The areas in dark grey represent those less exposed to solar wind, while the areas in light grey represent those experiencing a greater impact from solar wind.
Remotesensing 16 01306 g001
Figure 2. Training area (around the Apollo 15 landing site) and point population used to test the influence of relief variables in lithium distribution.
Remotesensing 16 01306 g002
Figure 3. On the left, taking the spectral library (VIS–NIR) over Johnson Glacier; in the middle, the Black Glacier of Deception Inland; on the right, front of Johnson Glacier, covered with lapilli.
Remotesensing 16 01306 g003
Figure 4. On the left, extraction and characterization in the Juan Carlos I Spanish Scientific Base in Livingstone Island of impurities from a snow sample of the Johnsons Glacier. On the right, we can see the ice rendered dirty by us with lapilli. In the middle, the ADS spectroradiometer taking spectra of dirty ice at temperatures below 0 °C.
Remotesensing 16 01306 g004
Figure 5. Types of samples in the spectral library of ices (0, 2, 4 and 6 ppm of very fine, <2 mm, lapilli with andesitic composition). In the case of dirty ices, we do not have “ground truth” to compare or validate the results. The four ice ratios were regionalized to the entire Clementine image and we then visualized the results.
Remotesensing 16 01306 g005
Figure 6. Correlation between exposure age (38Ar) and 7 Li concentration in lunar samples without 62255 and 74220.
Remotesensing 16 01306 g006
Figure 7. Relations between altitude (m) of samples and concentration of 7 Li.
Remotesensing 16 01306 g007
Figure 8. Five spectra types of lunar samples obtained in PCA analysis.
Remotesensing 16 01306 g008
Figure 9. Detailed cartographic expression of C5 (Orange and Glasses soils) spectral index crossing with the Apollo sample 74220.
Remotesensing 16 01306 g009
Figure 10. Extended lithium (ppm) and 7 Li‰ estimation models. Detailed mapping in the area of the Apollo 15 landing site. The base maps are Clementine image (500 m/pixel) and LOLA (50 m/pixel). The projection system is GCS_moon_2000.
Remotesensing 16 01306 g010
Figure 11. Attempt to validate the extended models with the eight lunar samples.
Remotesensing 16 01306 g011
Figure 12. Correlations between values of relief variables derived from DEM_LOLA and lithium and 7 Li concentrations. The analysis were performed with a simulated population of 296 samples concentrated in the area of Apollo 15 landing site.
Remotesensing 16 01306 g012
Figure 13. ADS Vis_Nir spectral library for ices.
Remotesensing 16 01306 g013
Figure 14. Cartographic expression of the spectral ice indices (ICELx1, ICELx2 and ICELx3) across the entire Clementine image. The frequencies of the values obtained by each of the indices in the Clementine image can be consulted in the corresponding histograms.
Remotesensing 16 01306 g014
Figure 15. Example of regolith with ice probability distribution.
Remotesensing 16 01306 g015
Table 1. Sample name and type of substrata; concentration of Li and fraction of 7 Li [3]; ratio between them; altitude in meters measured in LOLA DEM_LRO (Equirectangular Moon—Projected); determined exposure ages with 38Ar; corresponding spectral index, see Section 3.2.
Sample #SubstrataLi (ppm)7 Li (0/00)Ratio (7 Li/Li)Altitude (m)m.y. (38Ar)Spectral Index
62255Anortosite0.88.8911.11−233C4
1205Basalt9.54.430.47−1441124C2
15058Basalt7.73.760.49−1895135C2
15475Basalt7.23.350.47−1928200C2
70035High-Ti Mare Basalt8.65.090.59−2633125C3
75075High-Ti Mare Basalt10.35.480.53−2534143C3
15555Olivine Basalt64.320.72−178690C1
74220Orange Glasses Soil13.34.190.32−255227C5
Table 2. Values used to calculate the spectral ratios from the Vis_Nir spectra types for lithium composition. The specific wavelengths were identified in spectra using Spectroscopy Pro Tools 1.2 software.
Types of SpectraSustrata(Peak/Valley) CoefficientsnmClementine Bands
C1Olivine Basalts15.6411044/1575Band5/Nir3
C2Basalts with Silica2.06391755/1030Nir4/Nir5
C3Hight_Ti Mare Basalts2.70291705/1060Nir3/Band5
C4Anorthosite4.27861420/965Nir3/Band4
C5Orange and Glasses Soils1.2198778/1300Band2/Nir2
Table 3. Correlations between variables, lithium and 7 Li.
R PearsonLithium (ppm)7 Li (‰)
C10.470.23
C2−0.41−0.27
C3−0.44−0.24
C40.210.57
C50.450.18
Band1−0.640.92
Band2−0.730.87
Band3−0.690.88
Band4−0.680.87
Band5−0.690.87
Nir1−0.890.57
Nir2−0.890.59
Nir3−0.870.49
Nir4−0.800.27
Nir5−0.60−0.11
Nir6−0.790.25
Table 4. Summary of LRM for 7 Li and lithium selected to be extended to the entire Clementine image. The Adjusted R 2 represents the robustness of models. B are the coefficients of the independent variables on the fit line; The intercept is the y coordinate of the fit line at the origin; The beta coefficients are the standardized coefficients. The p level is the statistical significance of the explanatory variables. Std. Err is the standard deviation of the coefficients.
BetaStd.Err.BStd.Err.p-Level
Intercept(7 Li) 2.6152.0100.263
C40.6230.2268.9243.2430.051
C5−0.4950.204−7.4683.0820.073
Band10.7360.13760.84511.3370.006
Intercept(Lithium) 64.76020.8210.036
Nir1−7.2333.581−672.392332.9180.114
C5−0.5390.251−74.41034.6230.098
Nir26.1063.501536.480307.5610.156
Regression summary for dependent variable: 7 Li (‰); R = 0.97333231; R 2 = 0.94737579; Adjusted R 2 = 0.90790763; p < 0.0051; Std.Err 0.526; Regression summary for dependent variable: Lithium (ppm); R = 0.95159092; R 2 = 0.90552528; Adjusted R 2 = 0.83466924; p < 0.01620 Std.Err: 1.4782.
Table 5. Values used to calculate the spectral ratios of dirty ices. The specific wavelengths were identified in spectra using Spectroscopy Pro Tools 1.2 software.
Types of Spectra(Peak/Valley) CoefficientsnmClementine Bands
ICELx13.5301076/2383NIR1/Nir4
ICELx22.4961076/1954Nir1/Nir3
ICELx31.6862397/1940Nir4/NIR1
Disclaimer/Publisher’s Note: The statements, opinions and data contained in all publications are solely those of the individual author(s) and contributor(s) and not of MDPI and/or the editor(s). MDPI and/or the editor(s) disclaim responsibility for any injury to people or property resulting from any ideas, methods, instructions or products referred to in the content.

