1. Introduction
Lightning constitutes a formidable natural phenomenon characterized by the discharge of electrical energy amidst thunderstorms. The large transient currents from a Cloud-to-ground lightning flash may result in notable consequences such as power disruptions, structural impairment, ignition of fires, and potential human casualties [
1,
2,
3]. Understanding the physics of lightning is crucial for preventing lightning-related hazards and developing effective protection measures [
4]. Within this field, the lightning initiation mechanism is a primary focus, and experimental observations as the cornerstone for addressing this matter should be the first concern. Particularly, for a comprehensive investigation of the mechanism of a lightning stroke to a structure or an electrical system, it is essential to directly measure the lightning channel current while conducting electromagnetic field and optical observations [
5].
In previous studies, attempts to expand the range of lightning current measurements, from a few amperes to hundreds of kilo-amperes, have involved the use of Rogowski coils with different dynamic ranges and shunts with various resistance values [
6,
7,
8]. By utilizing these methodologies, an accuracy level of about 5 A was attained, facilitating the study of lightning evolution from the leader discharge to the return stroke [
9]. Coaxial shunts with resistance values spanning from several tens to several hundreds of ohms were additionally used for the measurement of milliamp corona discharge currents occurring at the extremities of grounded objects during thunderstorms [
10]. However, the high resistance cannot withstand the current after the upward leader initiation [
11], which poses a significant obstacle in addressing the progression from a corona discharge stage to a lightning leader stage, as well as their interconnections with the lightning return stroke process.
To advance the lightning current measurement, we have designed and implemented a 100-volts shock-resistant, low-noise multi-range analog front-end (AFE). By installing this AFE on the Shenzhen Meteorological Gradient Tower (SZMGT) via a 0.25 mΩ coaxial shunt, we have succeeded in the measurement of lightning currents in the range from milliamps to hundreds of kiloamps [
12]. However, due to the strong electromagnetic interference emitted by the radio station around SZMGT, the system bandwidth was reduced to avoid saturation of the pre-stage output. Both background noise and low bandwidth affect the sensitivity and only corona pulses over 300 mA could be identified, which hinders the research on the lightning initiation process and reduces the system’s applicability.
This paper aims at improving the identification ability of corona pulses without changing the system hardware, providing a data basis for further research in the field of lightning. First, the comparison of background noises during fine weather before and after installing the AFE module is conducted. It confirms that the installation of the AFE module significantly reduces the background noise in the lightning current acquisition system to at least one-tenth of its previous level. Subsequently, the noise spectrum collected during fine weather is used as a reference to determine the frequency and characteristics of surrounding electromagnetic interference. Finally, the zeroing out FFT (Fast Fourier Transform) bins method is selected to design a multi-frequency notch filter. With this filter, the current pulse identification level is decreased to 50 mA, demonstrating its effectiveness and stability in measuring sub-microvolt signals in complex electromagnetic environments.
2. Setup of the Lightning Current Acquisition System on SZMGT
The SZMGT is about 356 m high, which was built in 2016 for meteorological gradient observations and lightning experiments [
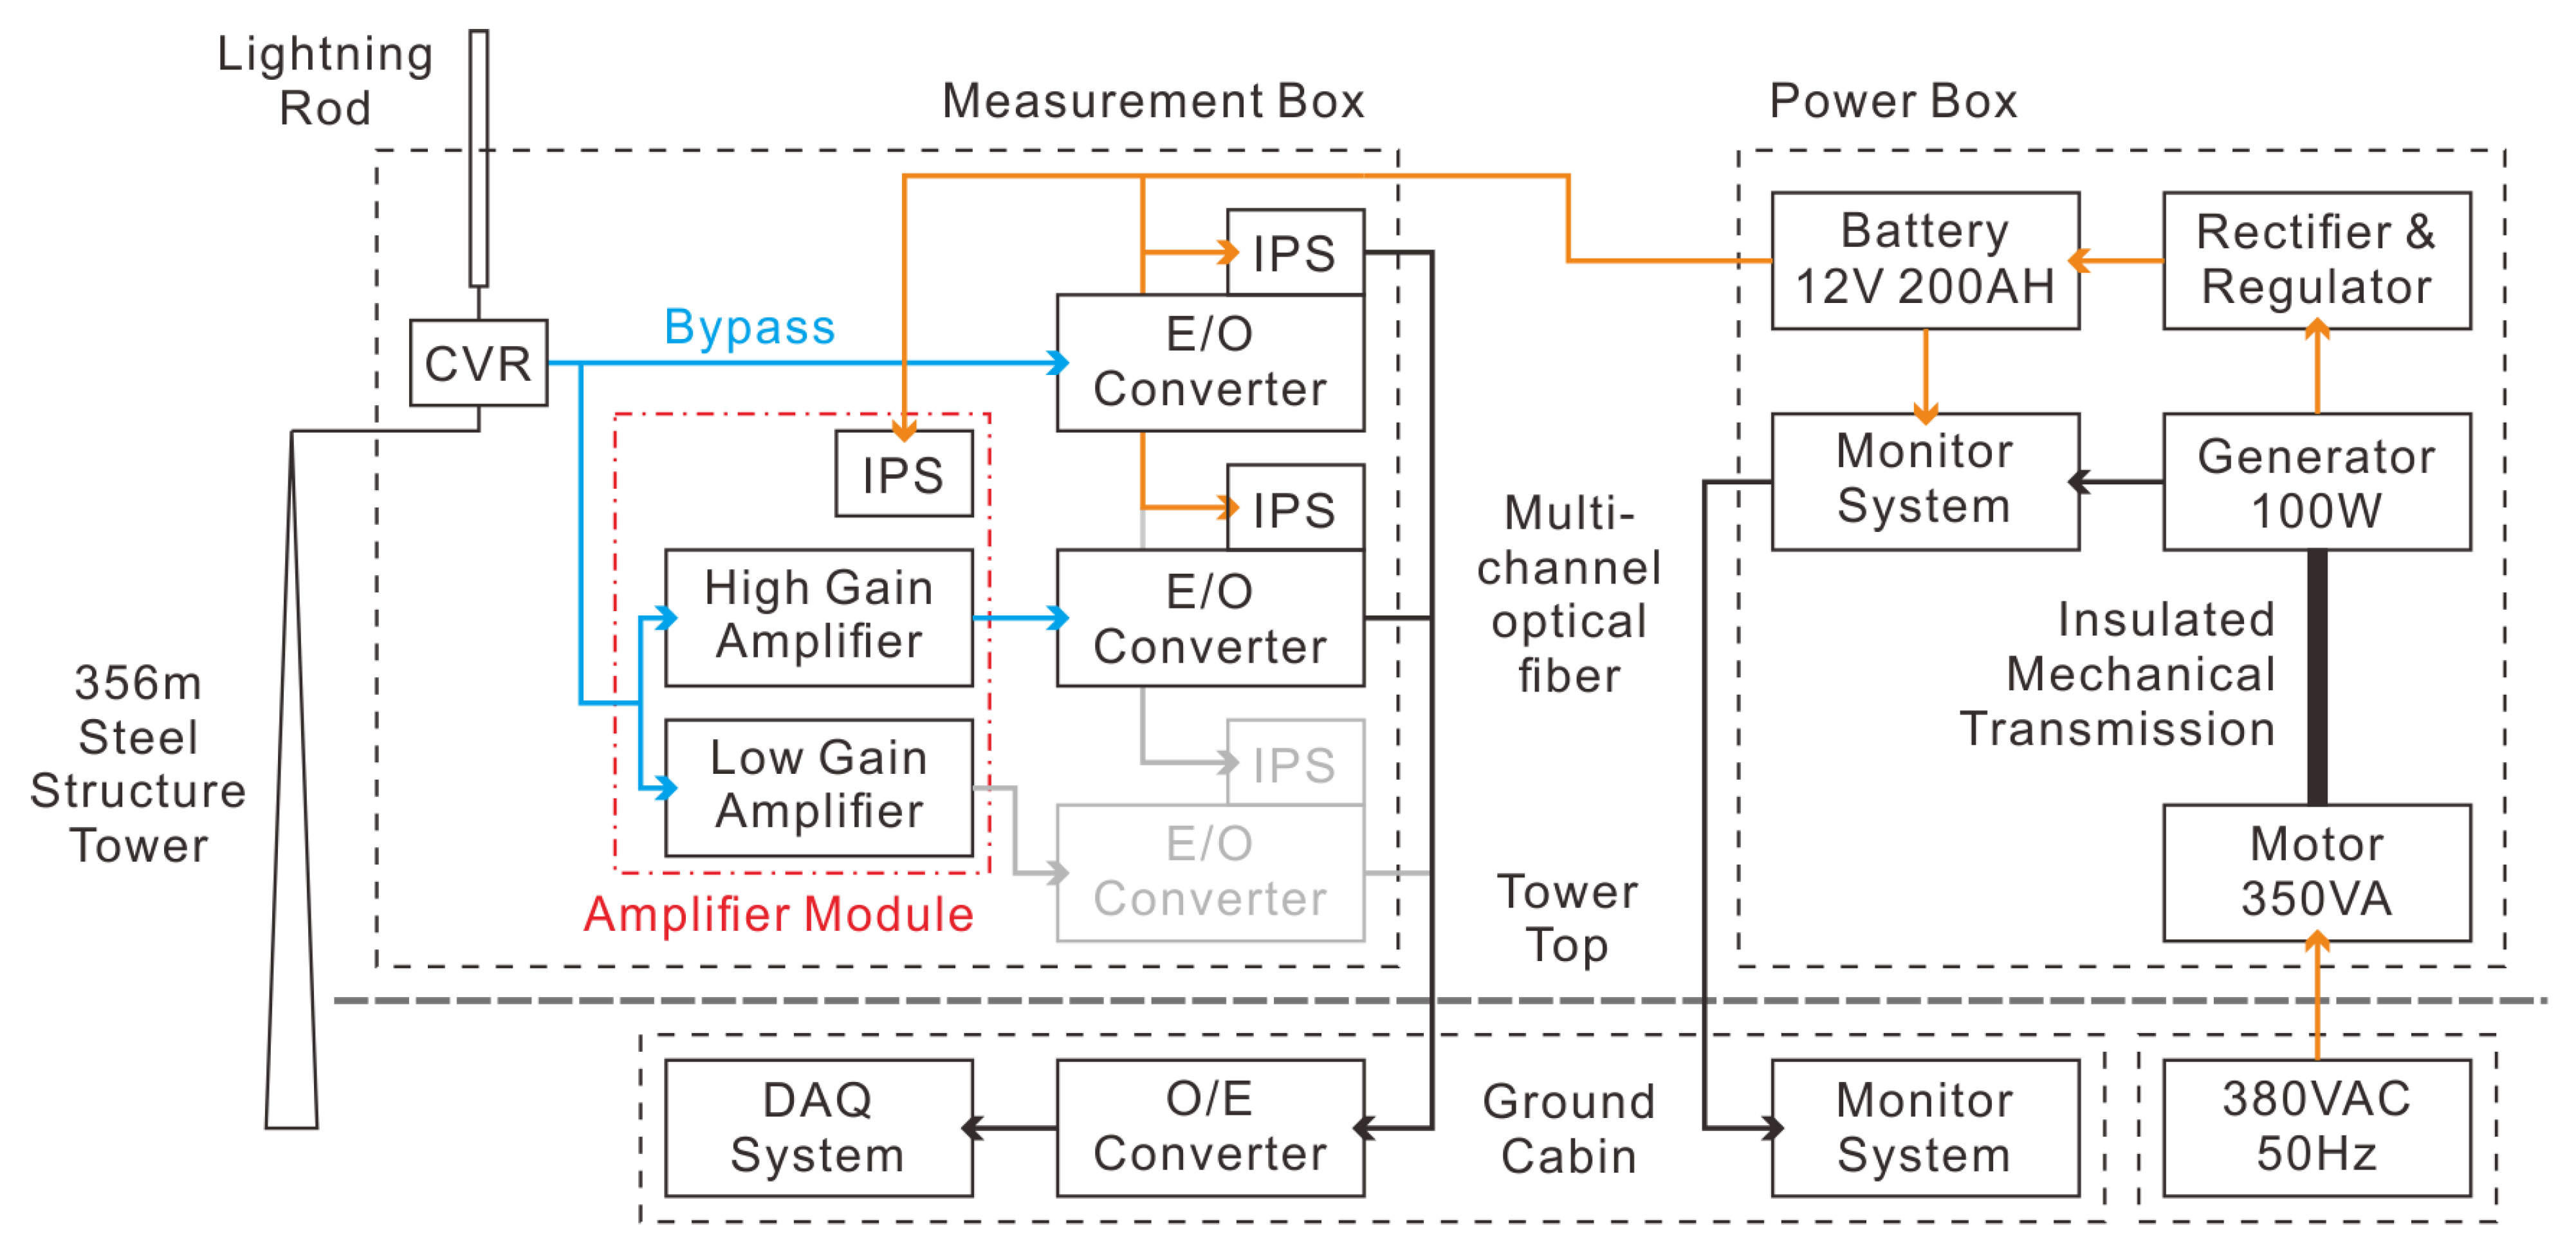
13]. Shown in
Figure 1 is a block diagram for the lightning current acquisition system and its isolated power supply installed on and around the SZMGT. The acquisition equipment mainly consists of (a) a coaxial current shunt resistor (Hilotest ISM500) with a resistance of 0.25 mΩ, (b) an optical fiber transmission system for signal isolation, (c) a data acquisition (DAQ) platform for signal recording, and (d) a shock-tolerant low-noise multi-range AFE developed in our previous work for further extension of the current measurement range.
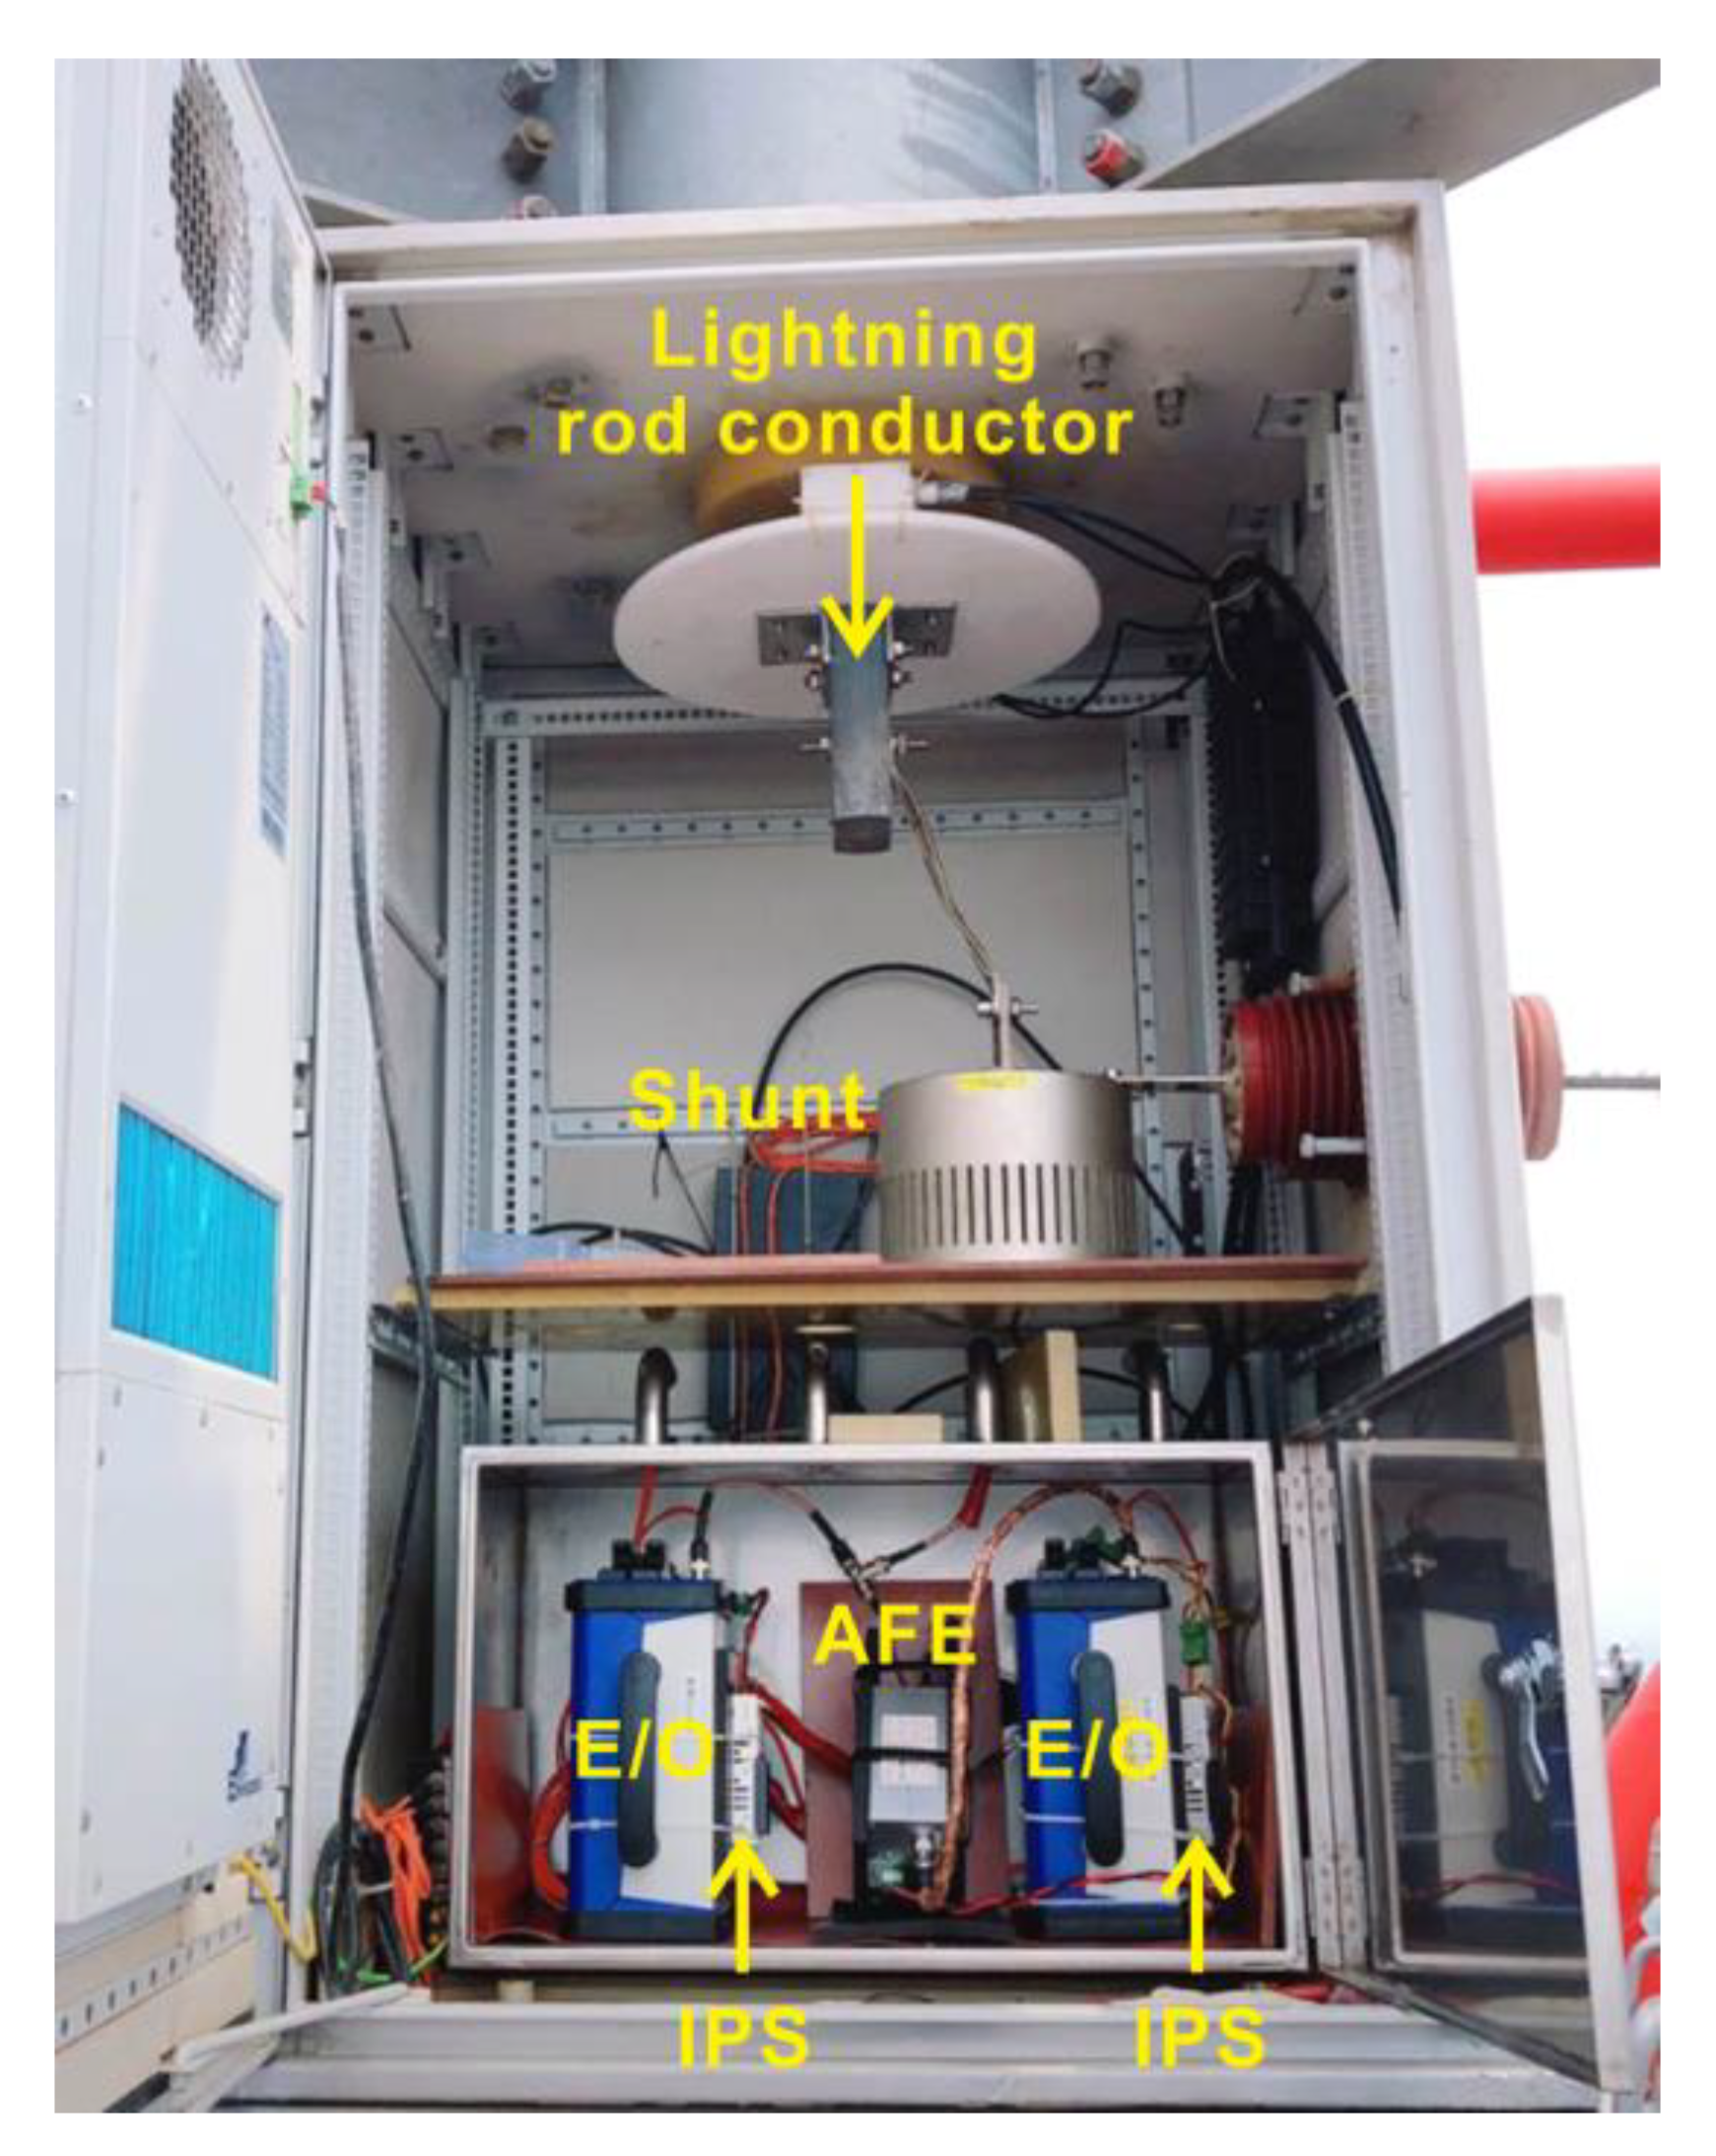
The internal configuration of the lightning current measurement enclosure located on the upper platform of SZMGT is depicted in
Figure 2. Flexible copper busbars are used to connect the lightning rod conductor at the top to the shunt resistor on the intermediate shelf, as well as to connect the shunt resistor to the tower structure. The voltage output from the shunt resistor is simultaneously connected to both the E/O module (bottom-left) and AFE module (bottom-middle) via double-shielded RG400 coaxial cables through a BNC T-adapter. Additionally, the high-gain amplifier output is routed to the right E/O housing within the shielded enclosure on the lower level.
The optical fiber signal isolation transmission system consists of up to four ISOBE5600t units (E/O: electrical signal to optical signal converter) and an ISOBE5600r (O/E: optical signal to electrical signal converter). The ISOBE5600t features a programmable gain input stage and a built-in 14-bit ADC (Analog-to-Digital Converter) with a sampling rate of 100 MSps to convert analog signals to digital signals and transmit them as optical signals. The ISOBE5600r has built-in 14-bit DACs (Digital-to-Analog Converter) at the same speed to convert digital optical signals back to analog signals with an amplitude of ±2 V [
14]. It should be noted that one ISOBE5600r can be connected to four ISOBE5600t units at the same time and provide 4-channel outputs. However, since the battery installed on the tower can be charged during fine weather only for safety reasons, just two ISOBE5600t units were installed in the measurement box to allow the system to work longer during thunderstorms, and only the high-gain amplifier output and the raw signal from the coaxial shunt output were sampled in subsequent experiments. In addition, the DAQ system consists of a GEN7tA transient recorder and a GN412 plug-in acquisition card both manufactured by HBM, which can perform 14-bit 100 MSps sampling on 4 analog input channels [
15].
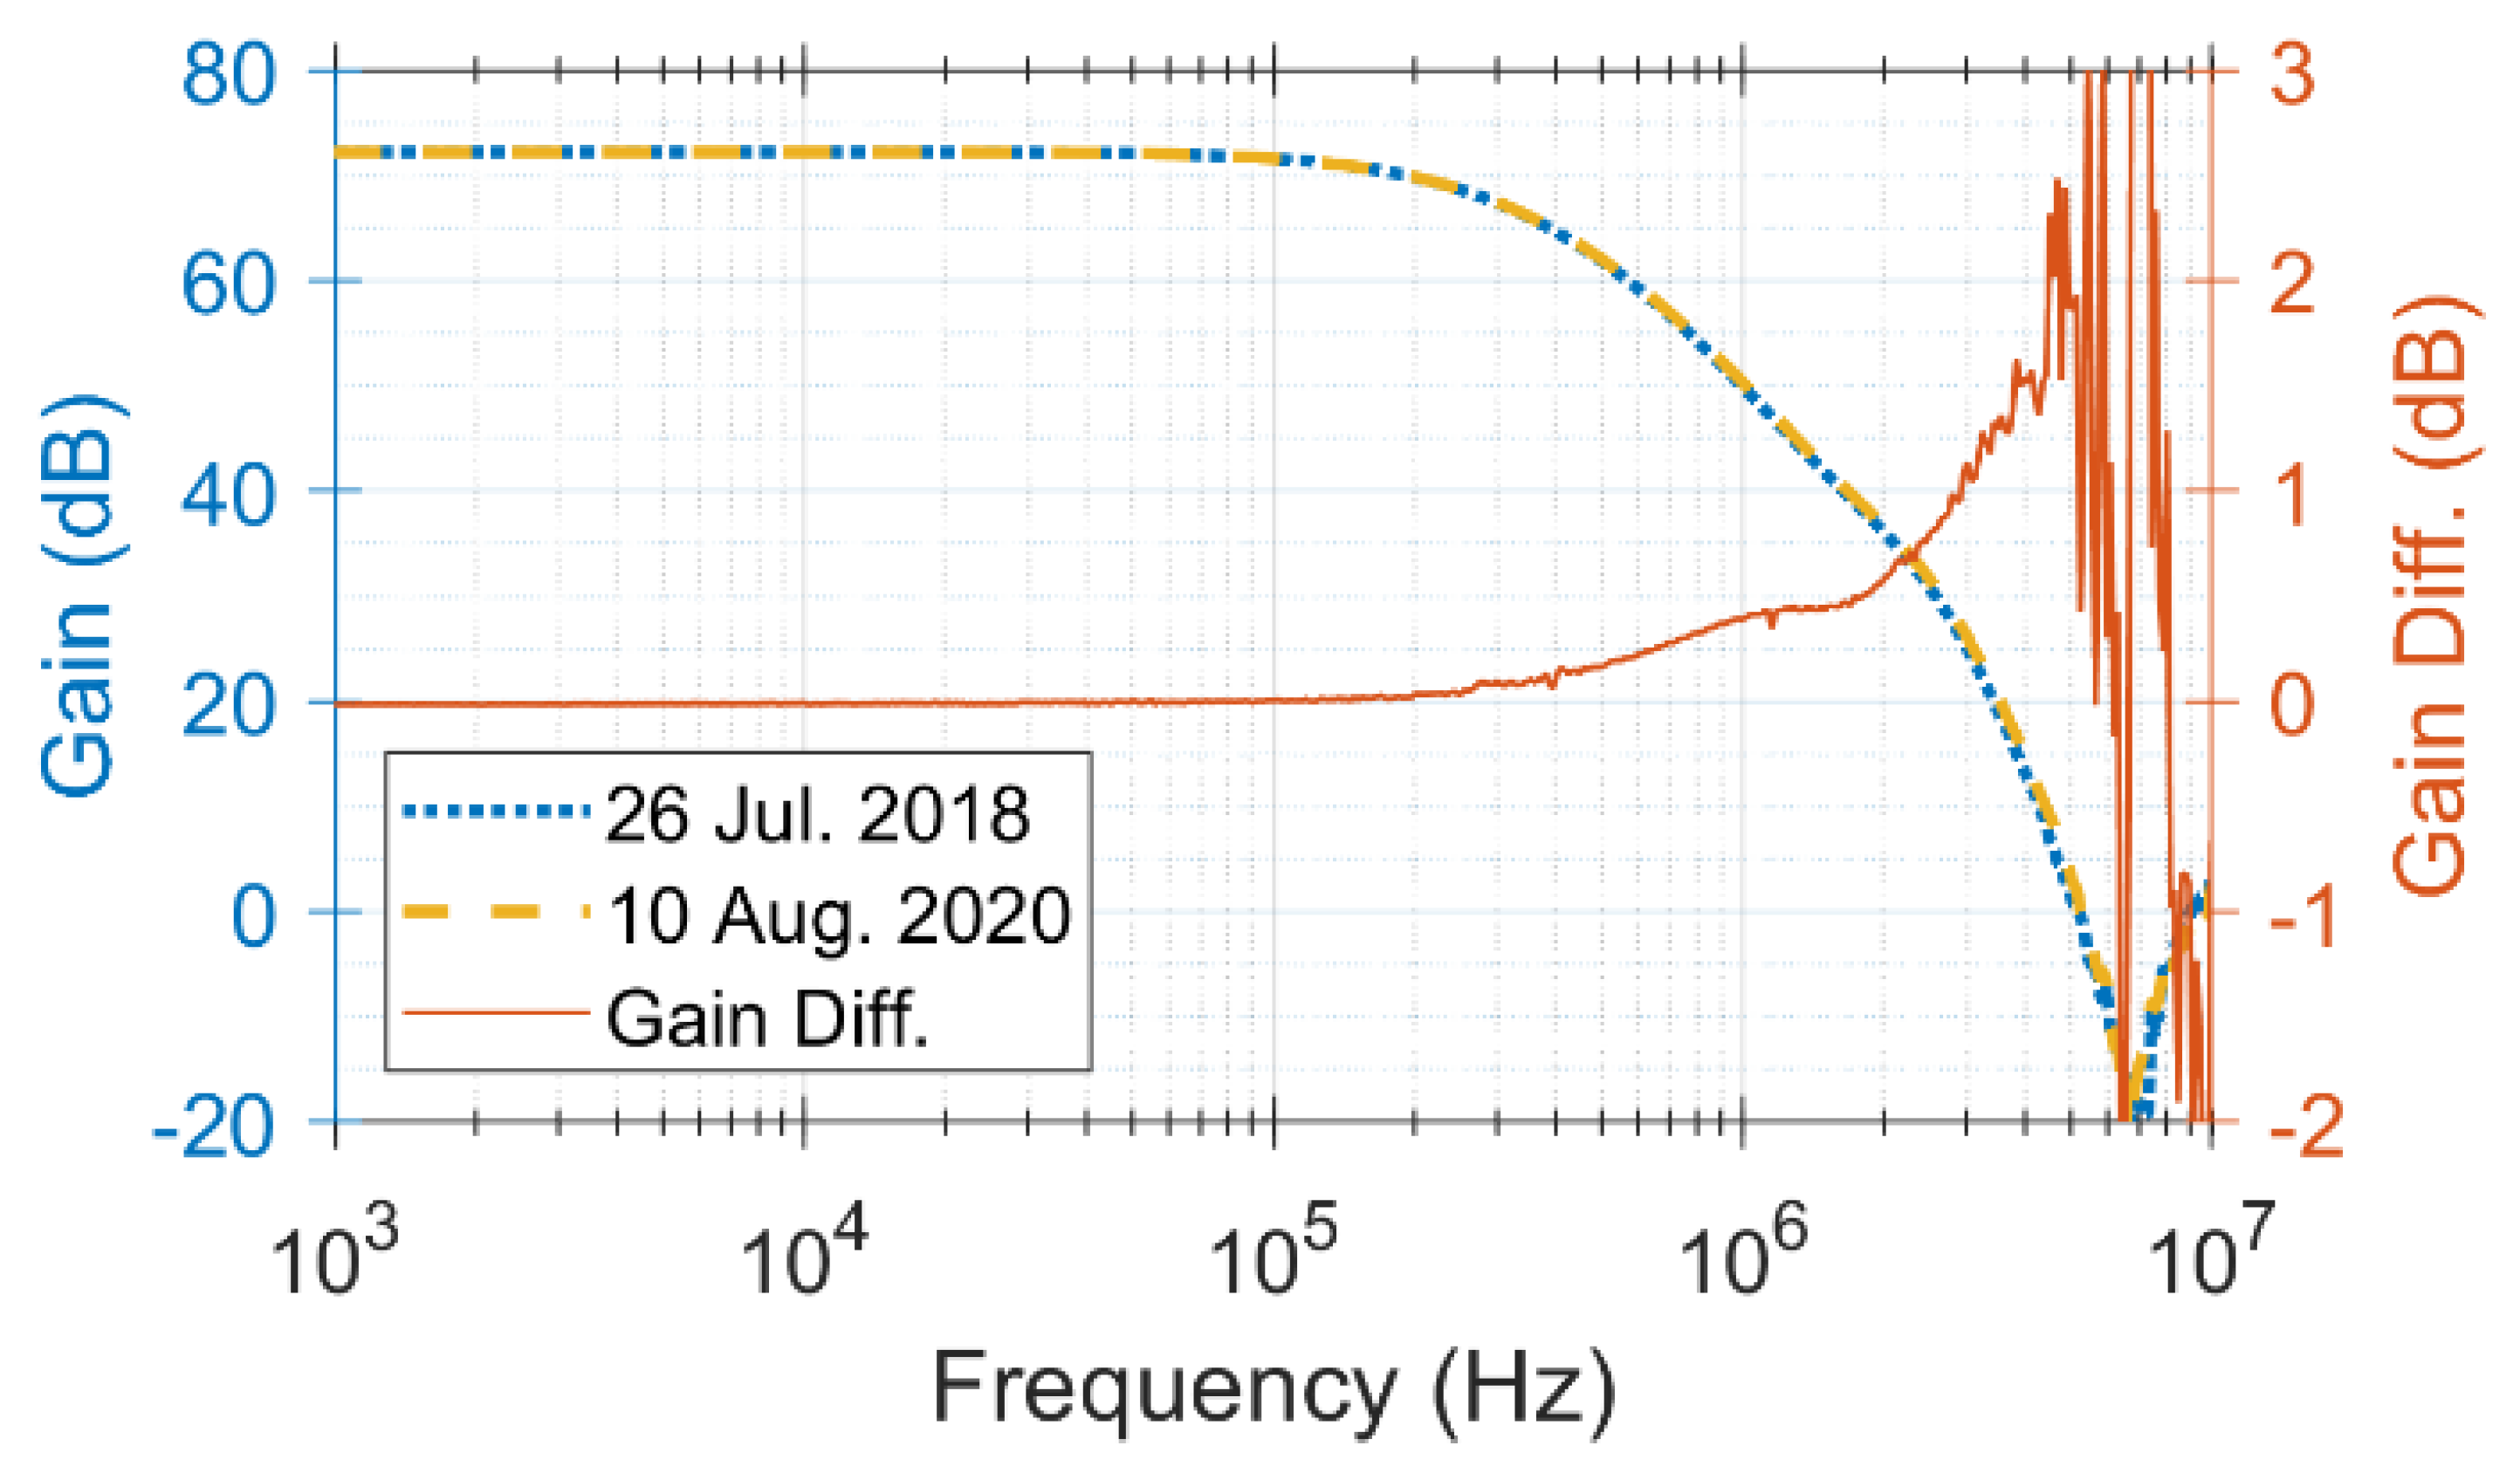
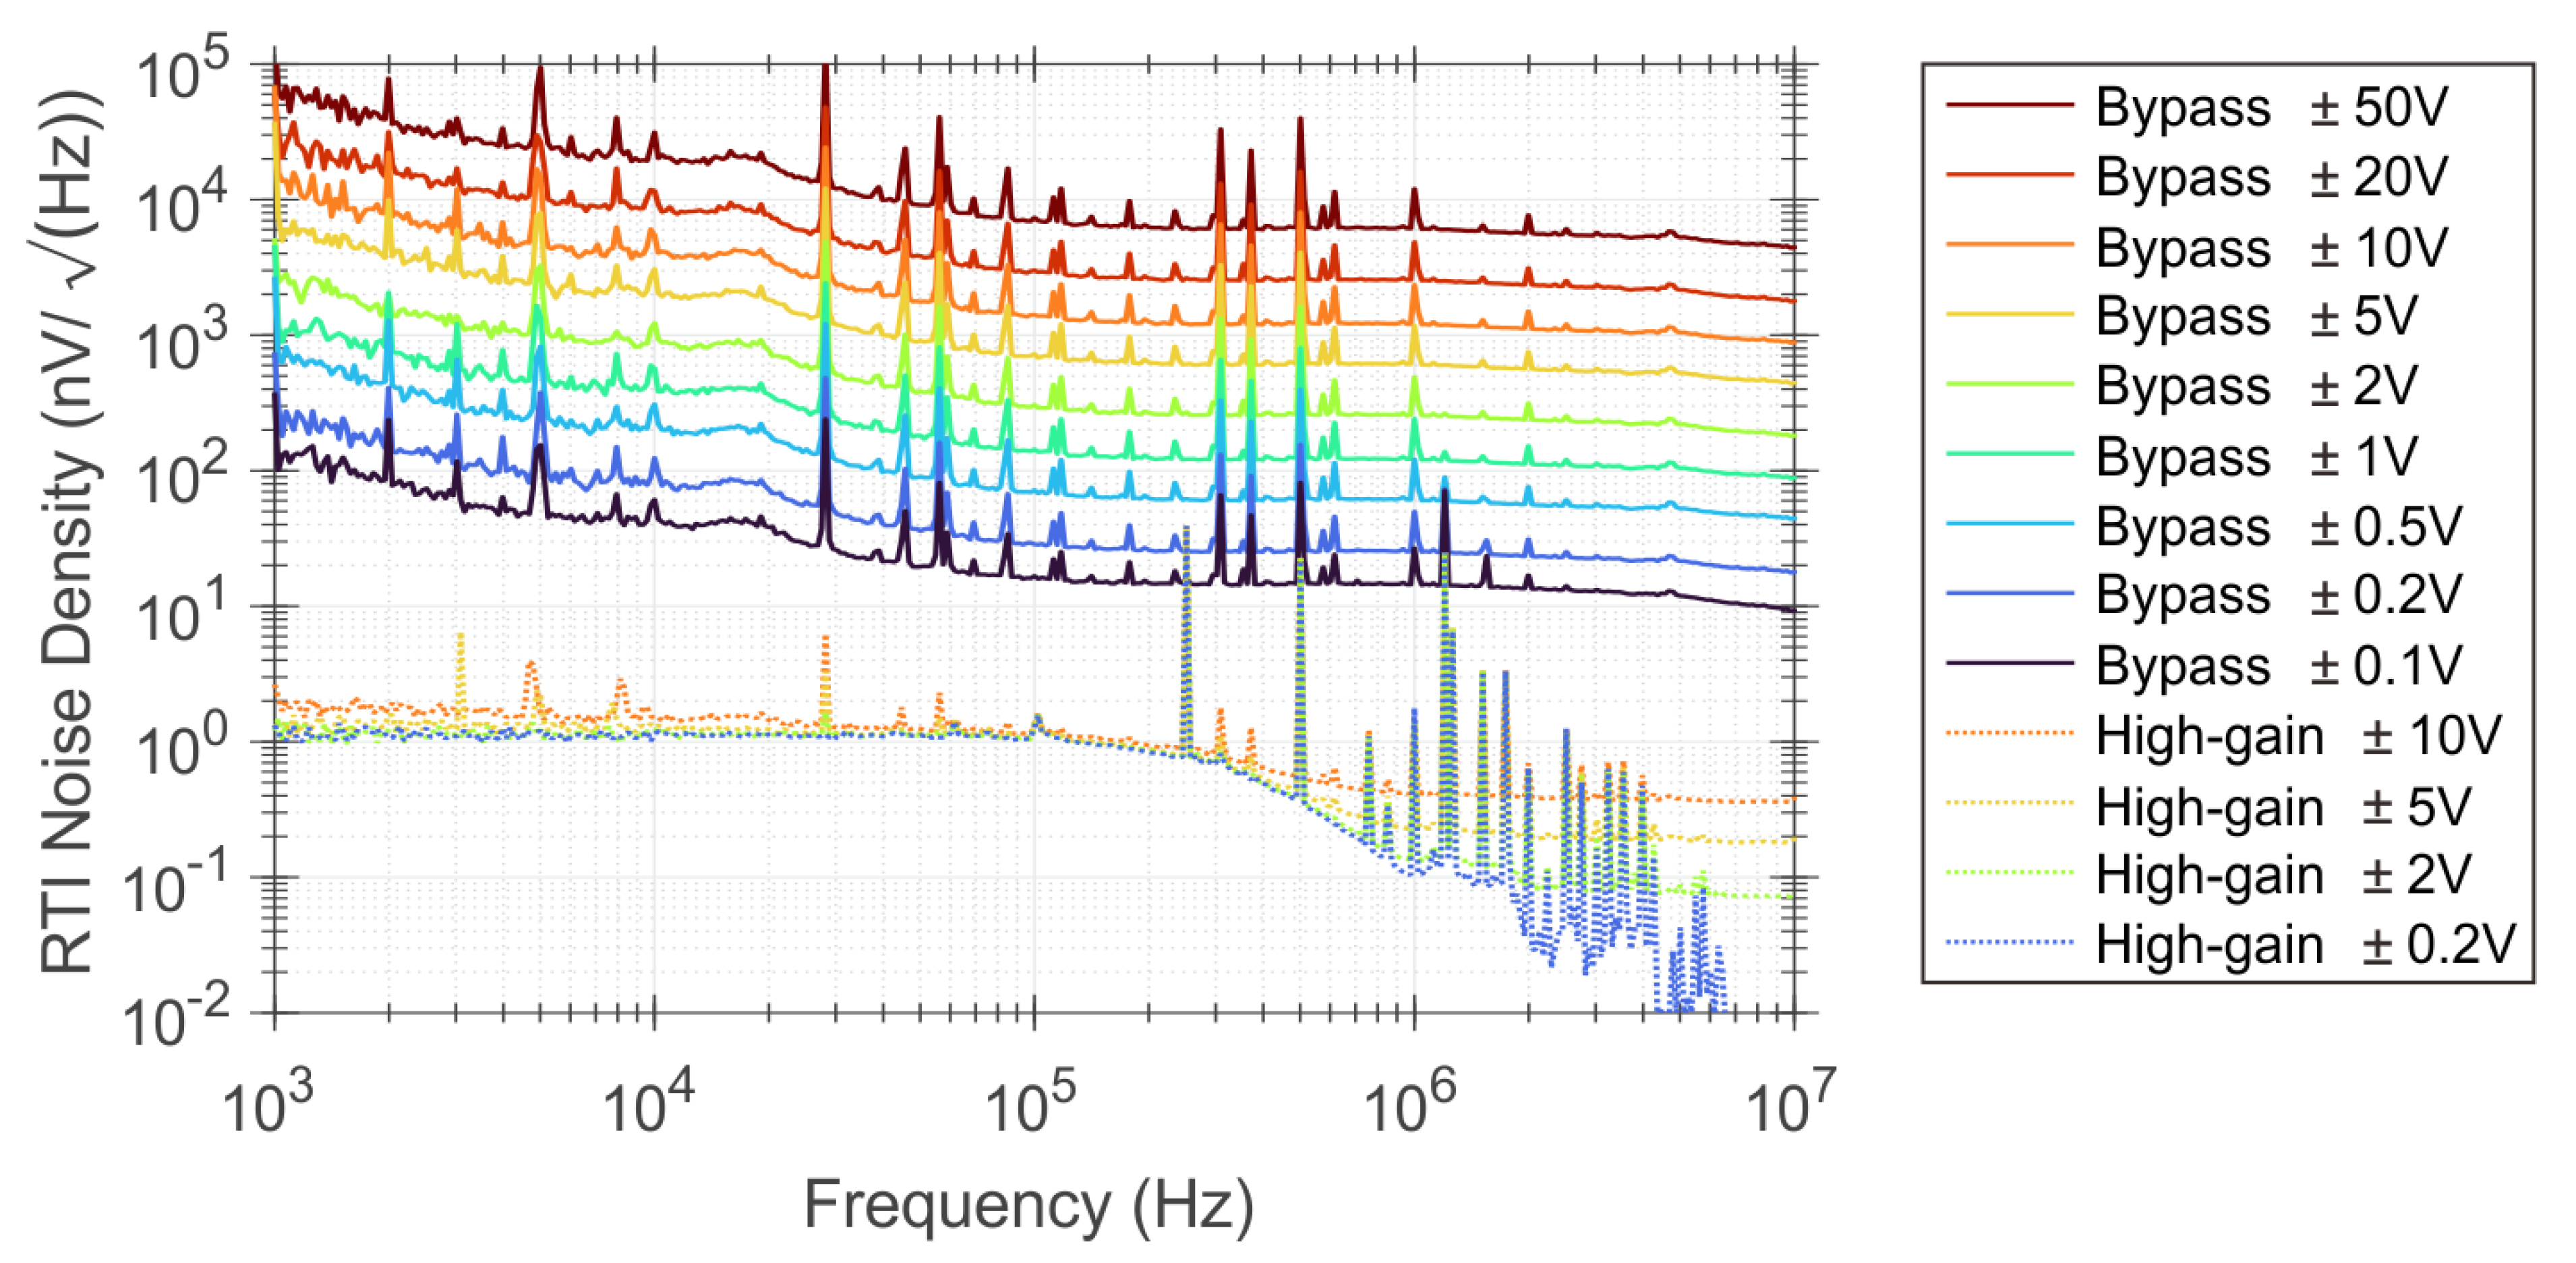
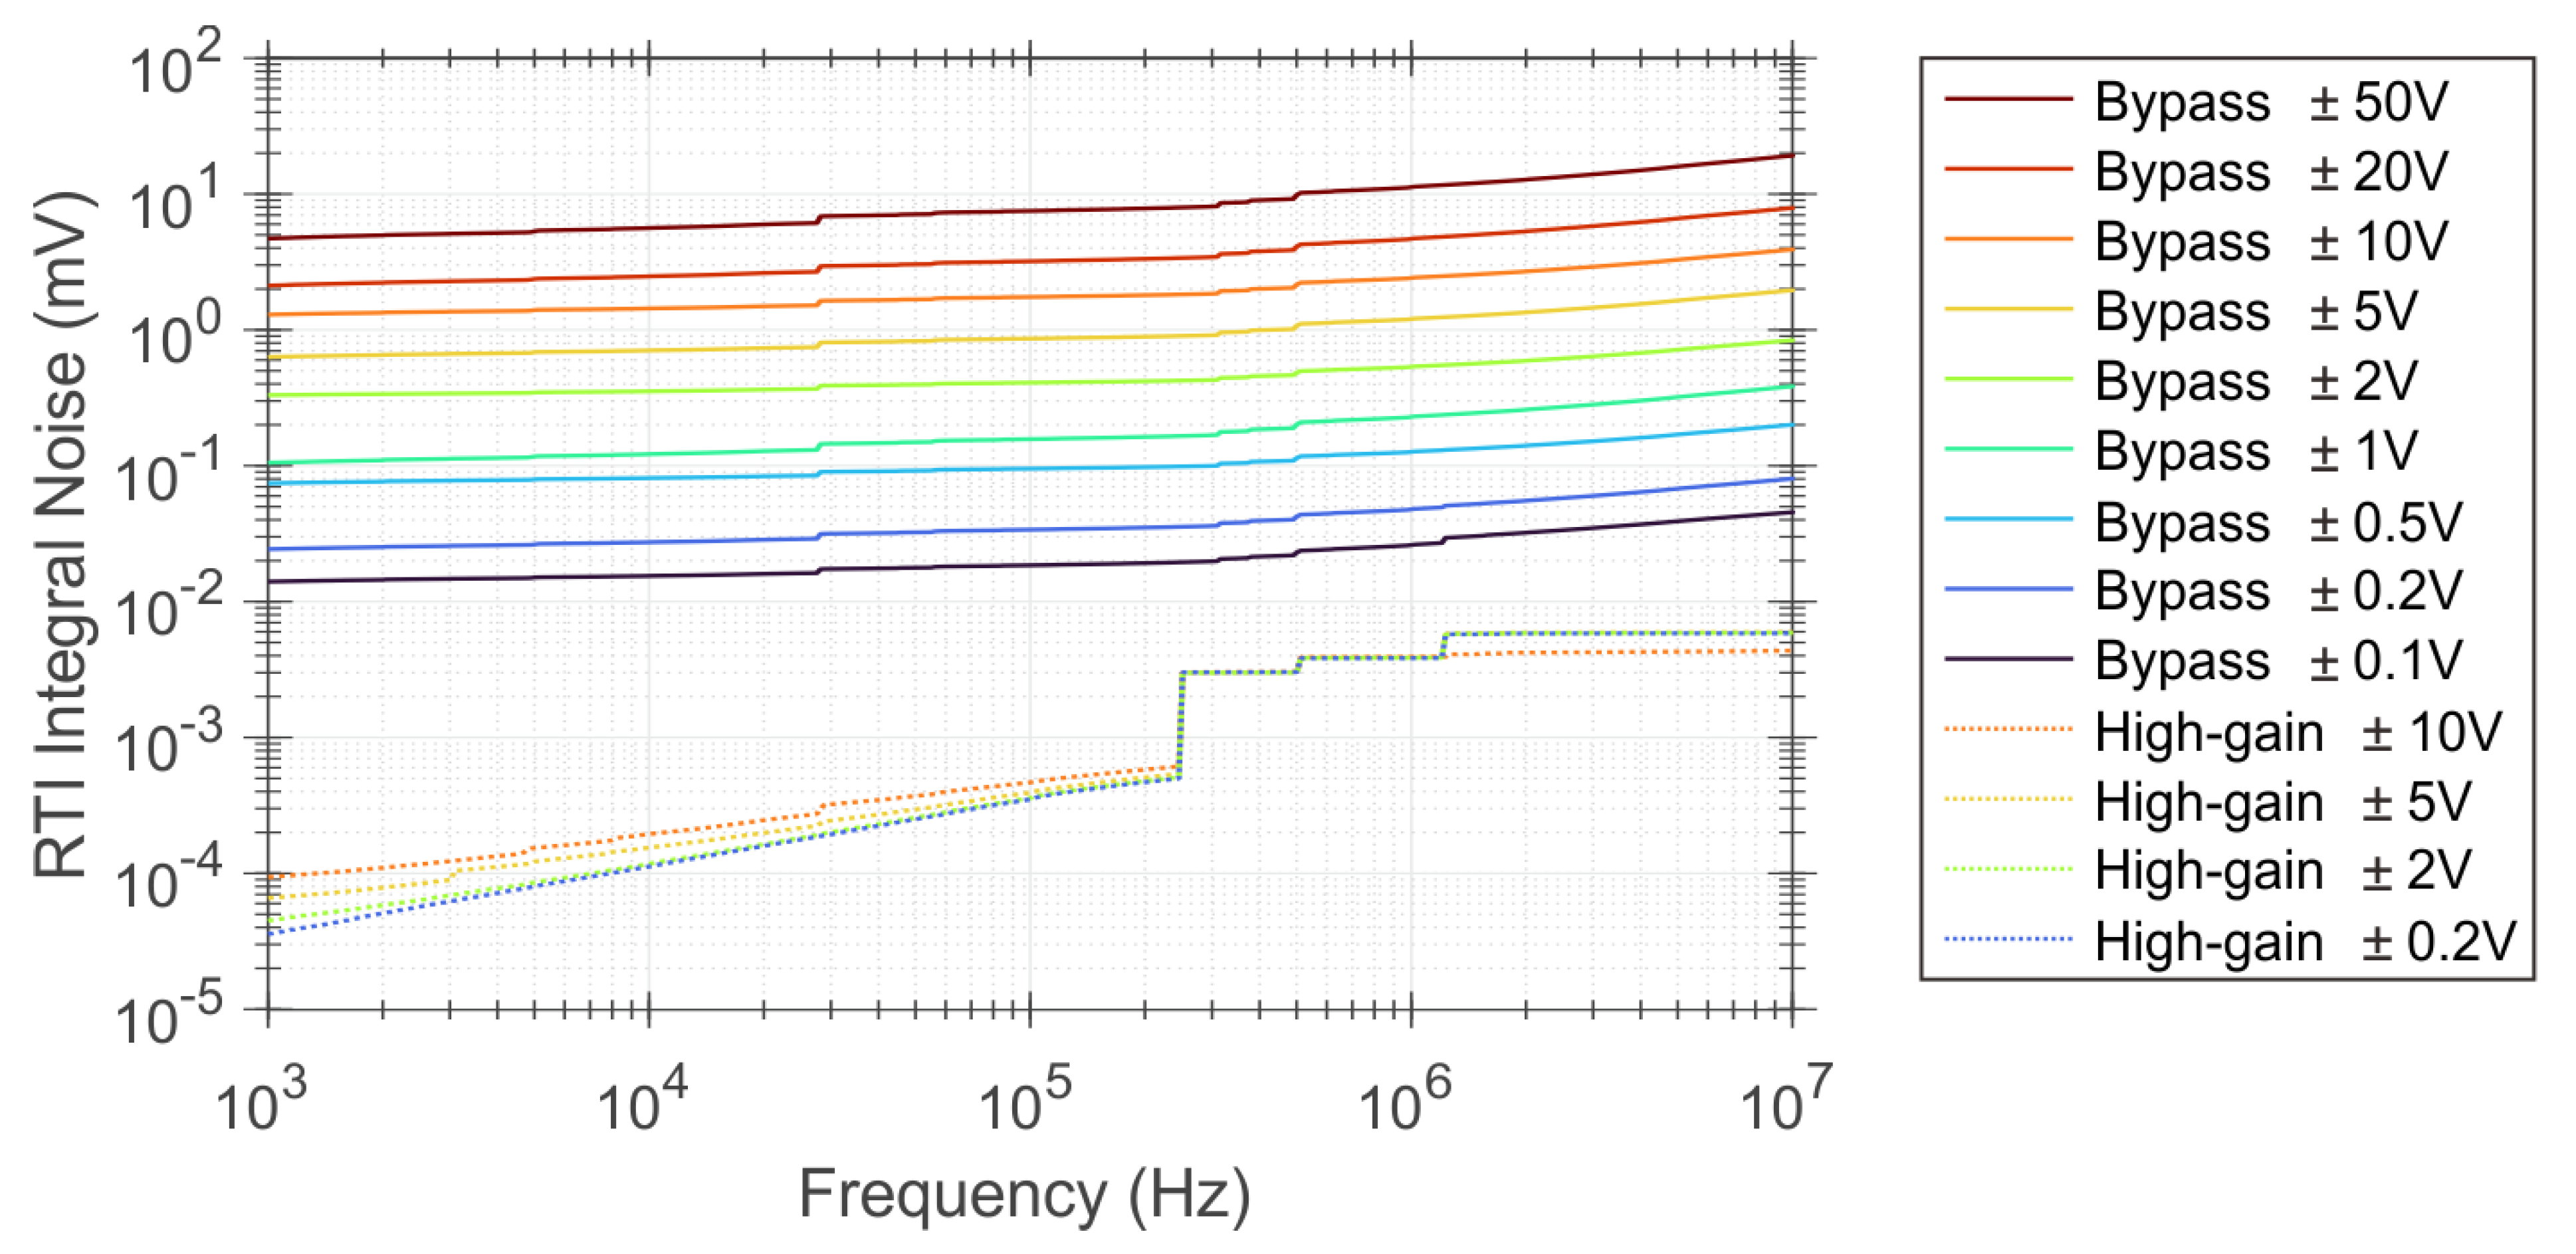
Figure 3 and
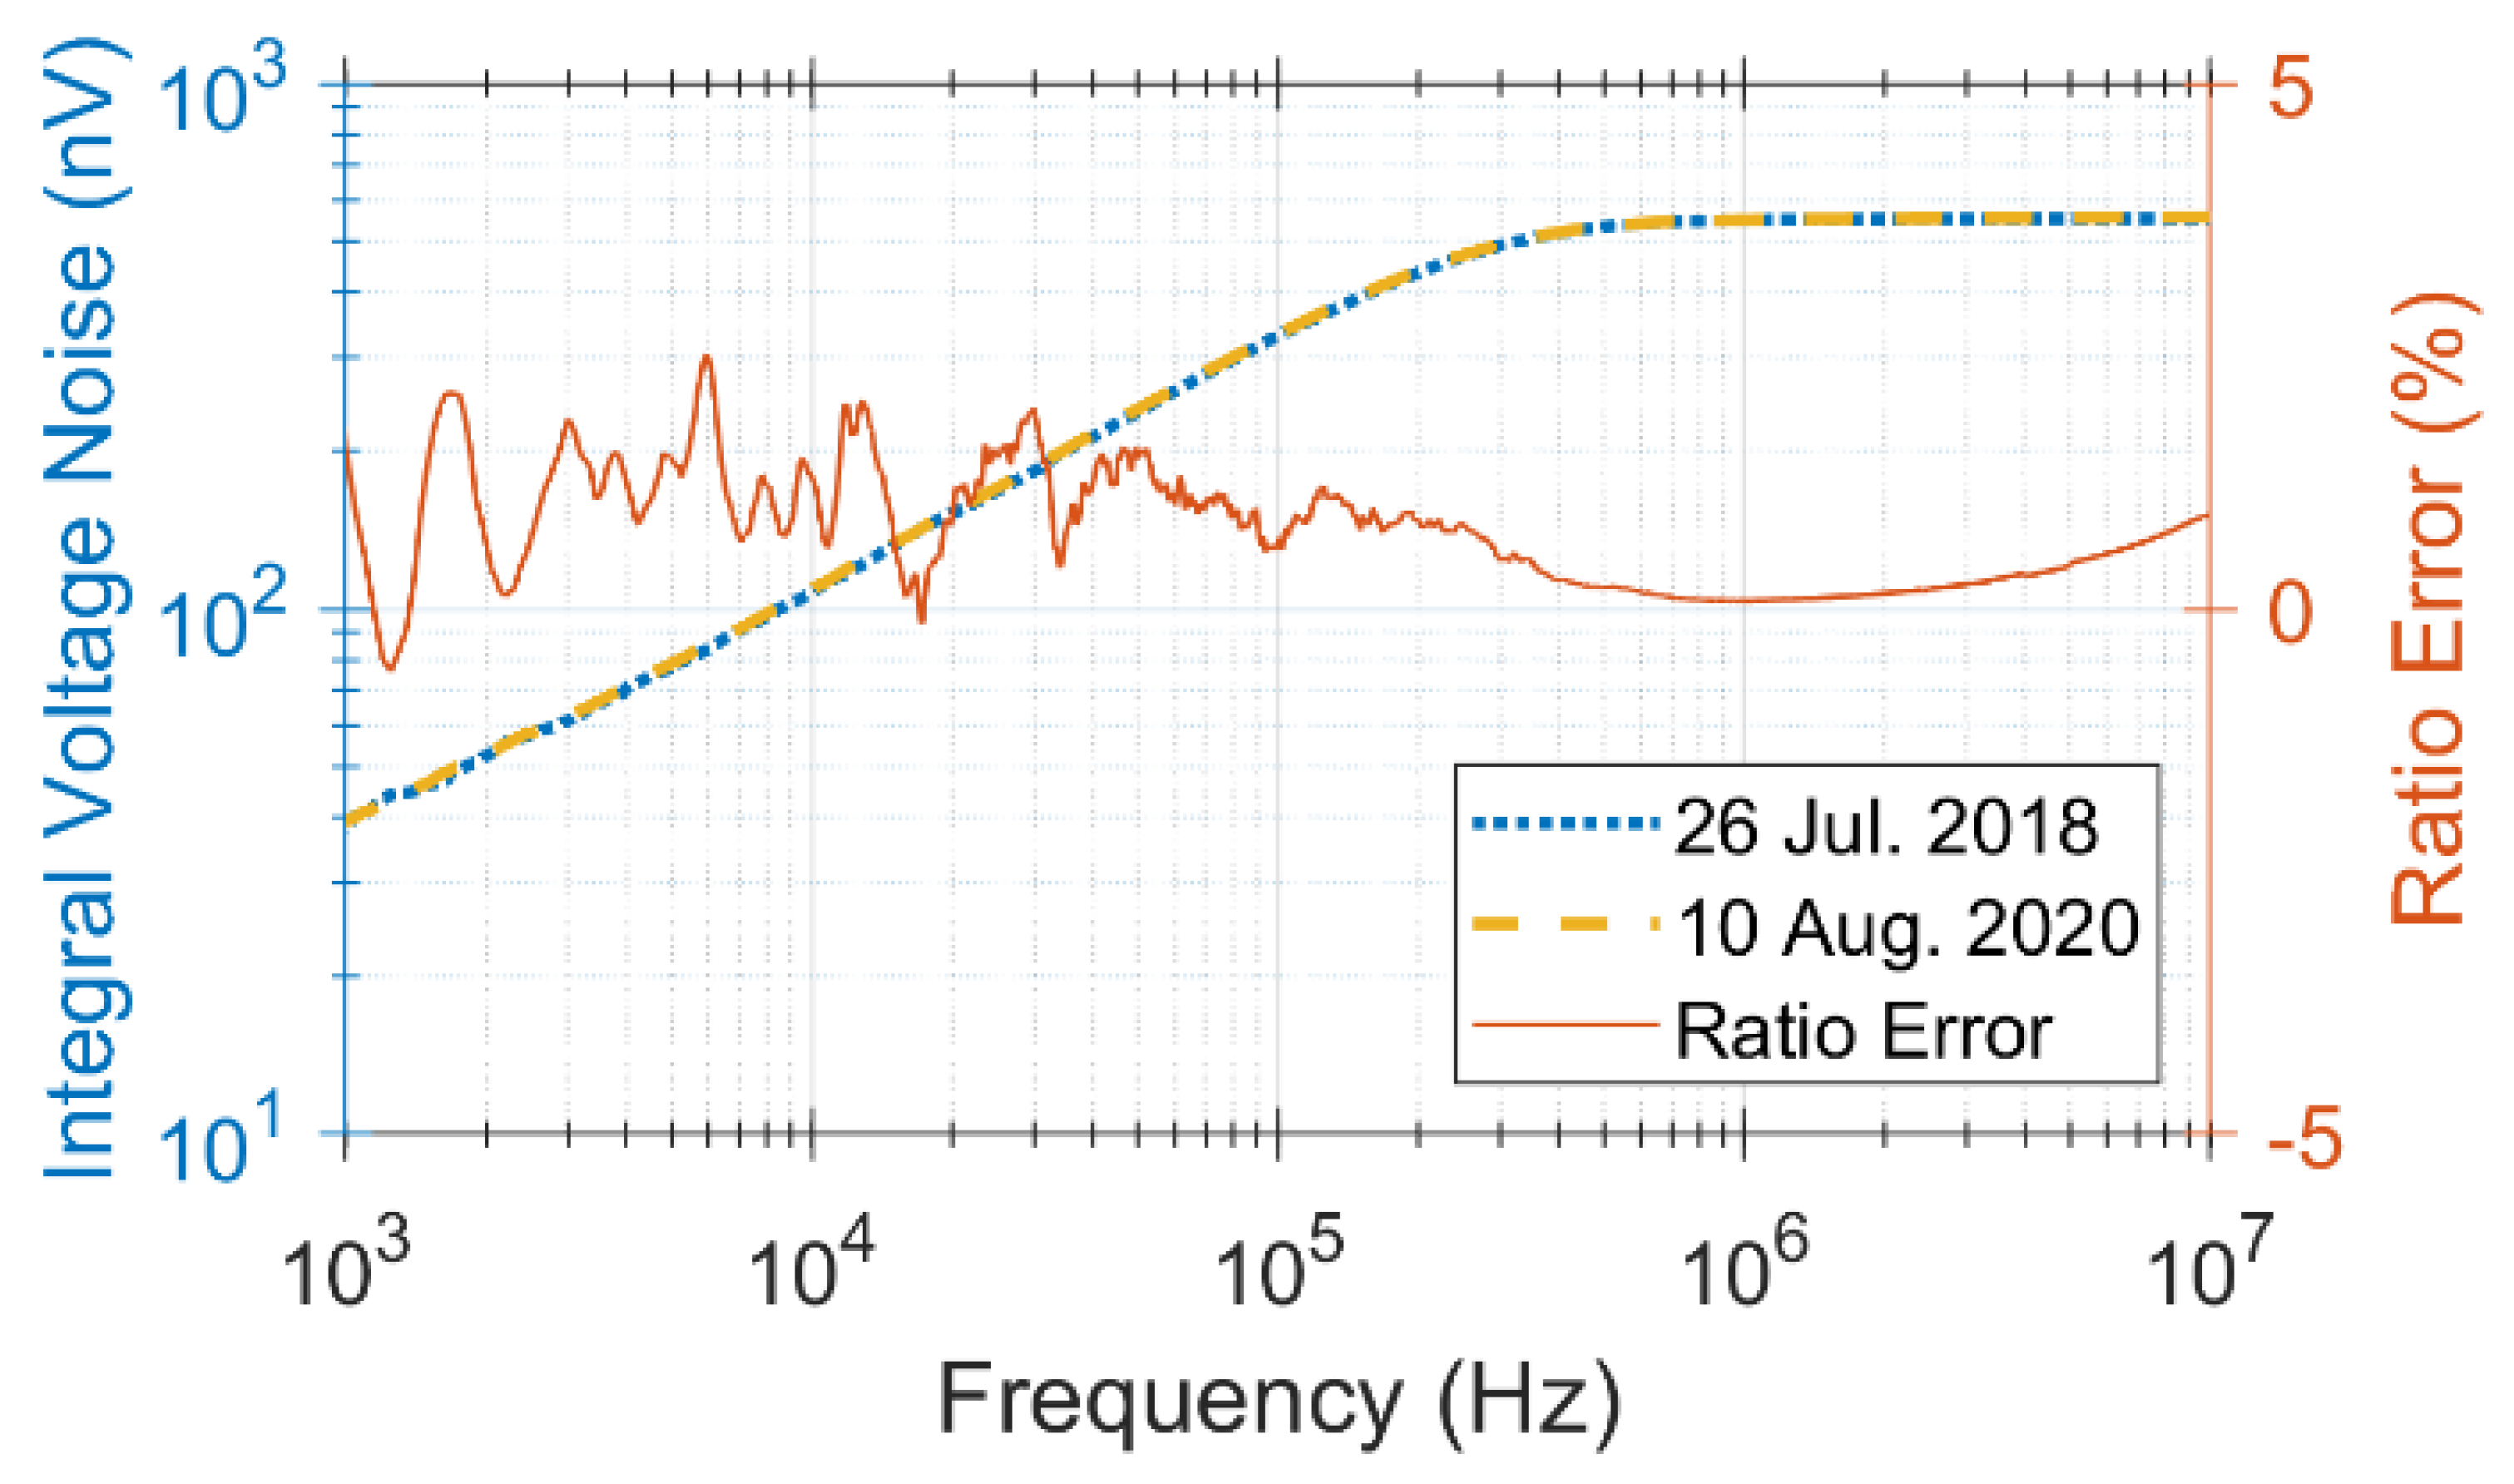
Figure 4 illustrate the frequency response and the noise characteristic of the AFE high-gain channel respectively, which include test results of the initial assembly compared to those after the shock testing and lightning events. The frequency responses were obtained using the Analog Discovery 2 from Digilent and verified using the WaveRunner 610 Zi from Lecroy, achieving an absolute amplitude measurement error of 0.3 dB (~3.5%). Additionally, the noise voltage spectrum and integral noise were obtained from the signals collected by the WaveRunner 610 Zi with short-circuited inputs and FFT method [
16], demonstrating equal accuracy. The high-gain channel of the AFE features a voltage gain of 4102 V/V, translating to a current gain of 1.0255 V/A with the 0.25-mΩ shunt on SZMGT. Its RMS (root mean square) voltage noise is recorded at 551 nV, corresponding to 2.2 mA with the aforementioned shunt resistor. After a span of two years, taking into account measurement errors, no changes in voltage gain and noise performance were discerned. The only discernible variance is a slight gain offset of a few tenths of a decibel in the frequency range of approximately 200 kHz to 800 kHz. This offset may be attributed to a change in the value of the capacitor used for hardware filters over the 2-year period, resulting in a shift in the 3 dB cut-off frequency.
3. Test and Observation Results on SZGMT
After the AFE installed on SZMGT, the background noise on a fine day was measured first to validate the improvement on noise performance. Then, two sets of lightning current were successfully recorded in 2019 and 2020, respectively, to verify the shock tolerance of the AFE module. Finally, based on frequency recognition of the background noise, a targeted multi-frequency notch filter was attempted to simultaneously avoid pulse distortion and decrease the identification amplitude of corona pulse current.
3.1. Noise Floor Measurement
To identify and attempt to reduce the influence of the optical fiber signal isolation transmission system on lightning current measurement, the background noise under different configurations and settings was measured.
Table 1 lists the RTI voltage noise under all configuration combinations and the equivalent current noise when using the 0.25 mΩ coaxial shunt. The sampling rate of the DAQ system is uniformly set to 100 MSps, and since a low-frequency continuous current exists in the lightning discharge process [
17], the input coupling mode of all channels is set to DC (direct current). For the high frequency cut-off frequency, the E/O unit ISOBE5600t provides two modes: wideband and filter. The wideband mode has a 3-dB bandwidth greater than 25 MHz, while the filter mode has a 3-dB bandwidth of 10 MHz with a 6th order Bessel low-pass filter. As the bandwidth of the high-gain amplifier is lower than 1 MHz, the internal filter of the corresponding E/O channel is always enabled, which can reduce the broadband noise introduced during the transmission process without affecting the signal bandwidth.
In addition,
Figure 5 and
Figure 6 illustrate the smoothed RTI noise spectral density and integral noise for various configurations and E/O settings, respectively. It should be noticed that the noise spectral densities shown in this figure are being smoothed to prevent the overlap of multiple curves, narrowband interference signals within the frequency range of 700 kHz to 10 MHz are been concealed and will be addressed through the implementation of a digital filter, as discussed in the next section. Due to the discontinuity of the interference signal, the RMS noise of the high-gain output with an E/O voltage range of ±10 V is lower than the other samples. However, as shown by
Figure 6, this is only due to the cessation of the noise signal with a frequency around 1.2 MHz in the integrated noise.
Based on the results of the noise measurement, it is evident that using this shock-resistant amplifier module can significantly reduce the noise of the measurement system to 1/10 of the E/O’s best performance with a voltage range setting of ±0.1 V. If we only consider the bypass channel and the ±50 V voltage range used in the previous experiment, the noise level can be reduced to one ten-thousandth of the original level. This results in an equivalent RMS current noise of approximately 20 mA, which implies a current pulse detection capability of around 120 mA.
3.2. Denoising Digital Filter Design
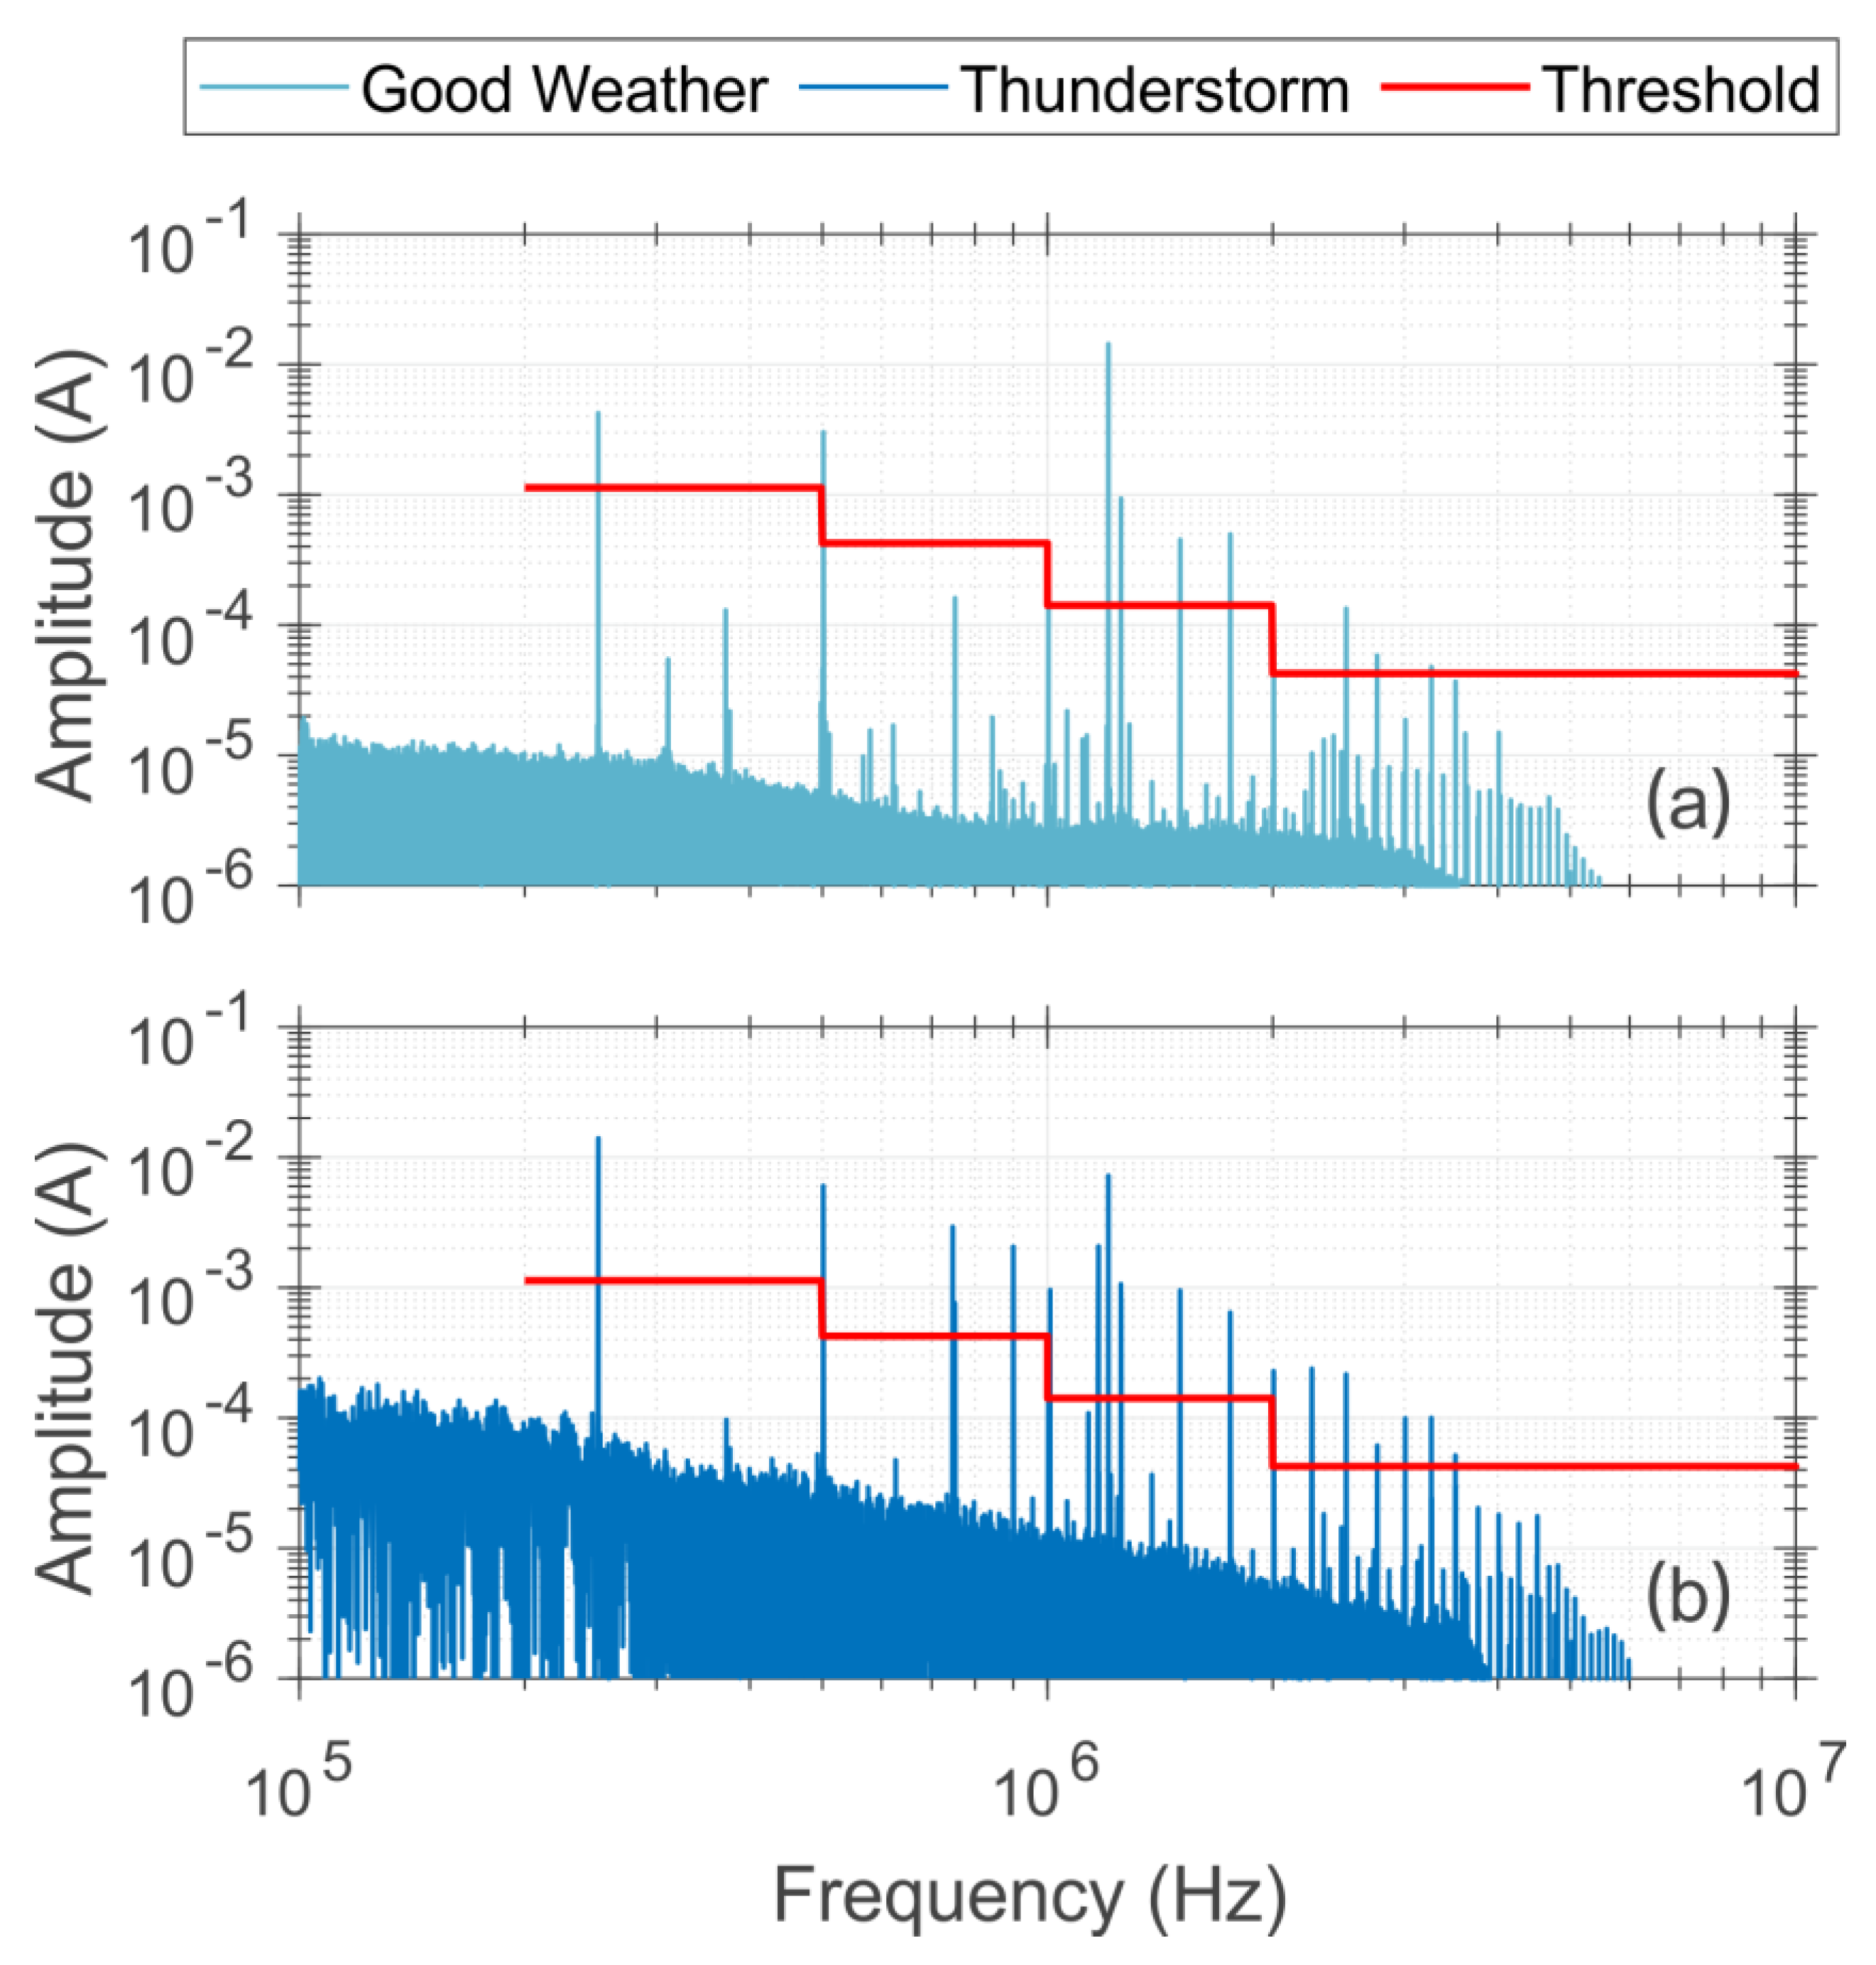
In order to improve further the system sensitivity and observation data quality, a multi-frequency notch filter is designed to address narrowband interference signals found in the noise measurement between 700 kHz and 10 MHz. The identification of noise frequencies is done by comparing the noise spectrum measured on a fine day with the signal spectrum of the observed lightning current waveform under thunderstorm, as shown in
Figure 7. Multiple narrowband interference signals with the same frequency can be easily detected between two spectrums. However, since the occurrence and intensity of these interference signals may vary over time, an identification threshold (
) is set and adjusted starting from 200 kHz with Equation (1) to detect frequencies with significant noise (indicated by the red line in
Figure 7). Any signal surpassing the threshold and exhibiting a bandwidth narrower than 0.002 times the center frequency is classified as interference, where a center frequency (
) and its width (
) of the signal are documented for subsequent processing.
For selecting the digital filter, different types and orders of digital notch filters are attempted, including the commonly used Butterworth, Chebyshev, and elliptic filters. However, finding a balance between the effectivity of noise suppression and the impulse response shown on the output waveforms always be difficult due to the large number of filters with different frequencies that are required. At the end, the zeroing out FFT bins method is attempted and performs well in both aspects.
The multi-frequency notch filter, constructed using the zeroing out FFT bins method, has a transfer function () given by Equation (2). The result can be computed using Equation (3), which involves the following steps: (i) perform a FFT () on the original signal () to convert it to the frequency domain, (ii) zero the FFT bins falling within the center frequency and twice the bandwidth of each interference signal, (iii) perform an Inverse Fast Fourier Transform (IFFT, ) to convert the signal back to the time domain.
This approach is usually not recommended due to its generation of the sinc-like impulse response that may extend infinitely in both temporal directions [
18], a phenomenon known as the Gibbs phenomenon [
19]. It also has a higher computational complexity of O(NlogN) [
20] compared to O(N) for FIR and IIR filters [
21], making it less suitable for real-time signal processing than other digital filters. However, this approach can be accepted when the following three points are met: (i) the frequency band to be filtered out is regarded as invalid signal, (ii) equal-length data are utilized for both the FFT and IFFT transforms, and (iii) the output waveform is carefully checked. In this case, as the interference signals to be filtered out have a narrow bandwidth and lightning currents have a wideband characteristic [
17], it can be approximated that removing these narrowband frequencies will not have a significant impact on the original signal. In addition, because the lightning current observation system uses a trigger-storage-analysis processing flow, which has a lower real-time signal processing requirement and a higher tolerance for computational complexity. More importantly, the output waveform calculated using this method does not exhibit any negative issues such as oscillations, which suggests that the use of this method is successful in this application.
3.3. Observed Lightning Current Waveform
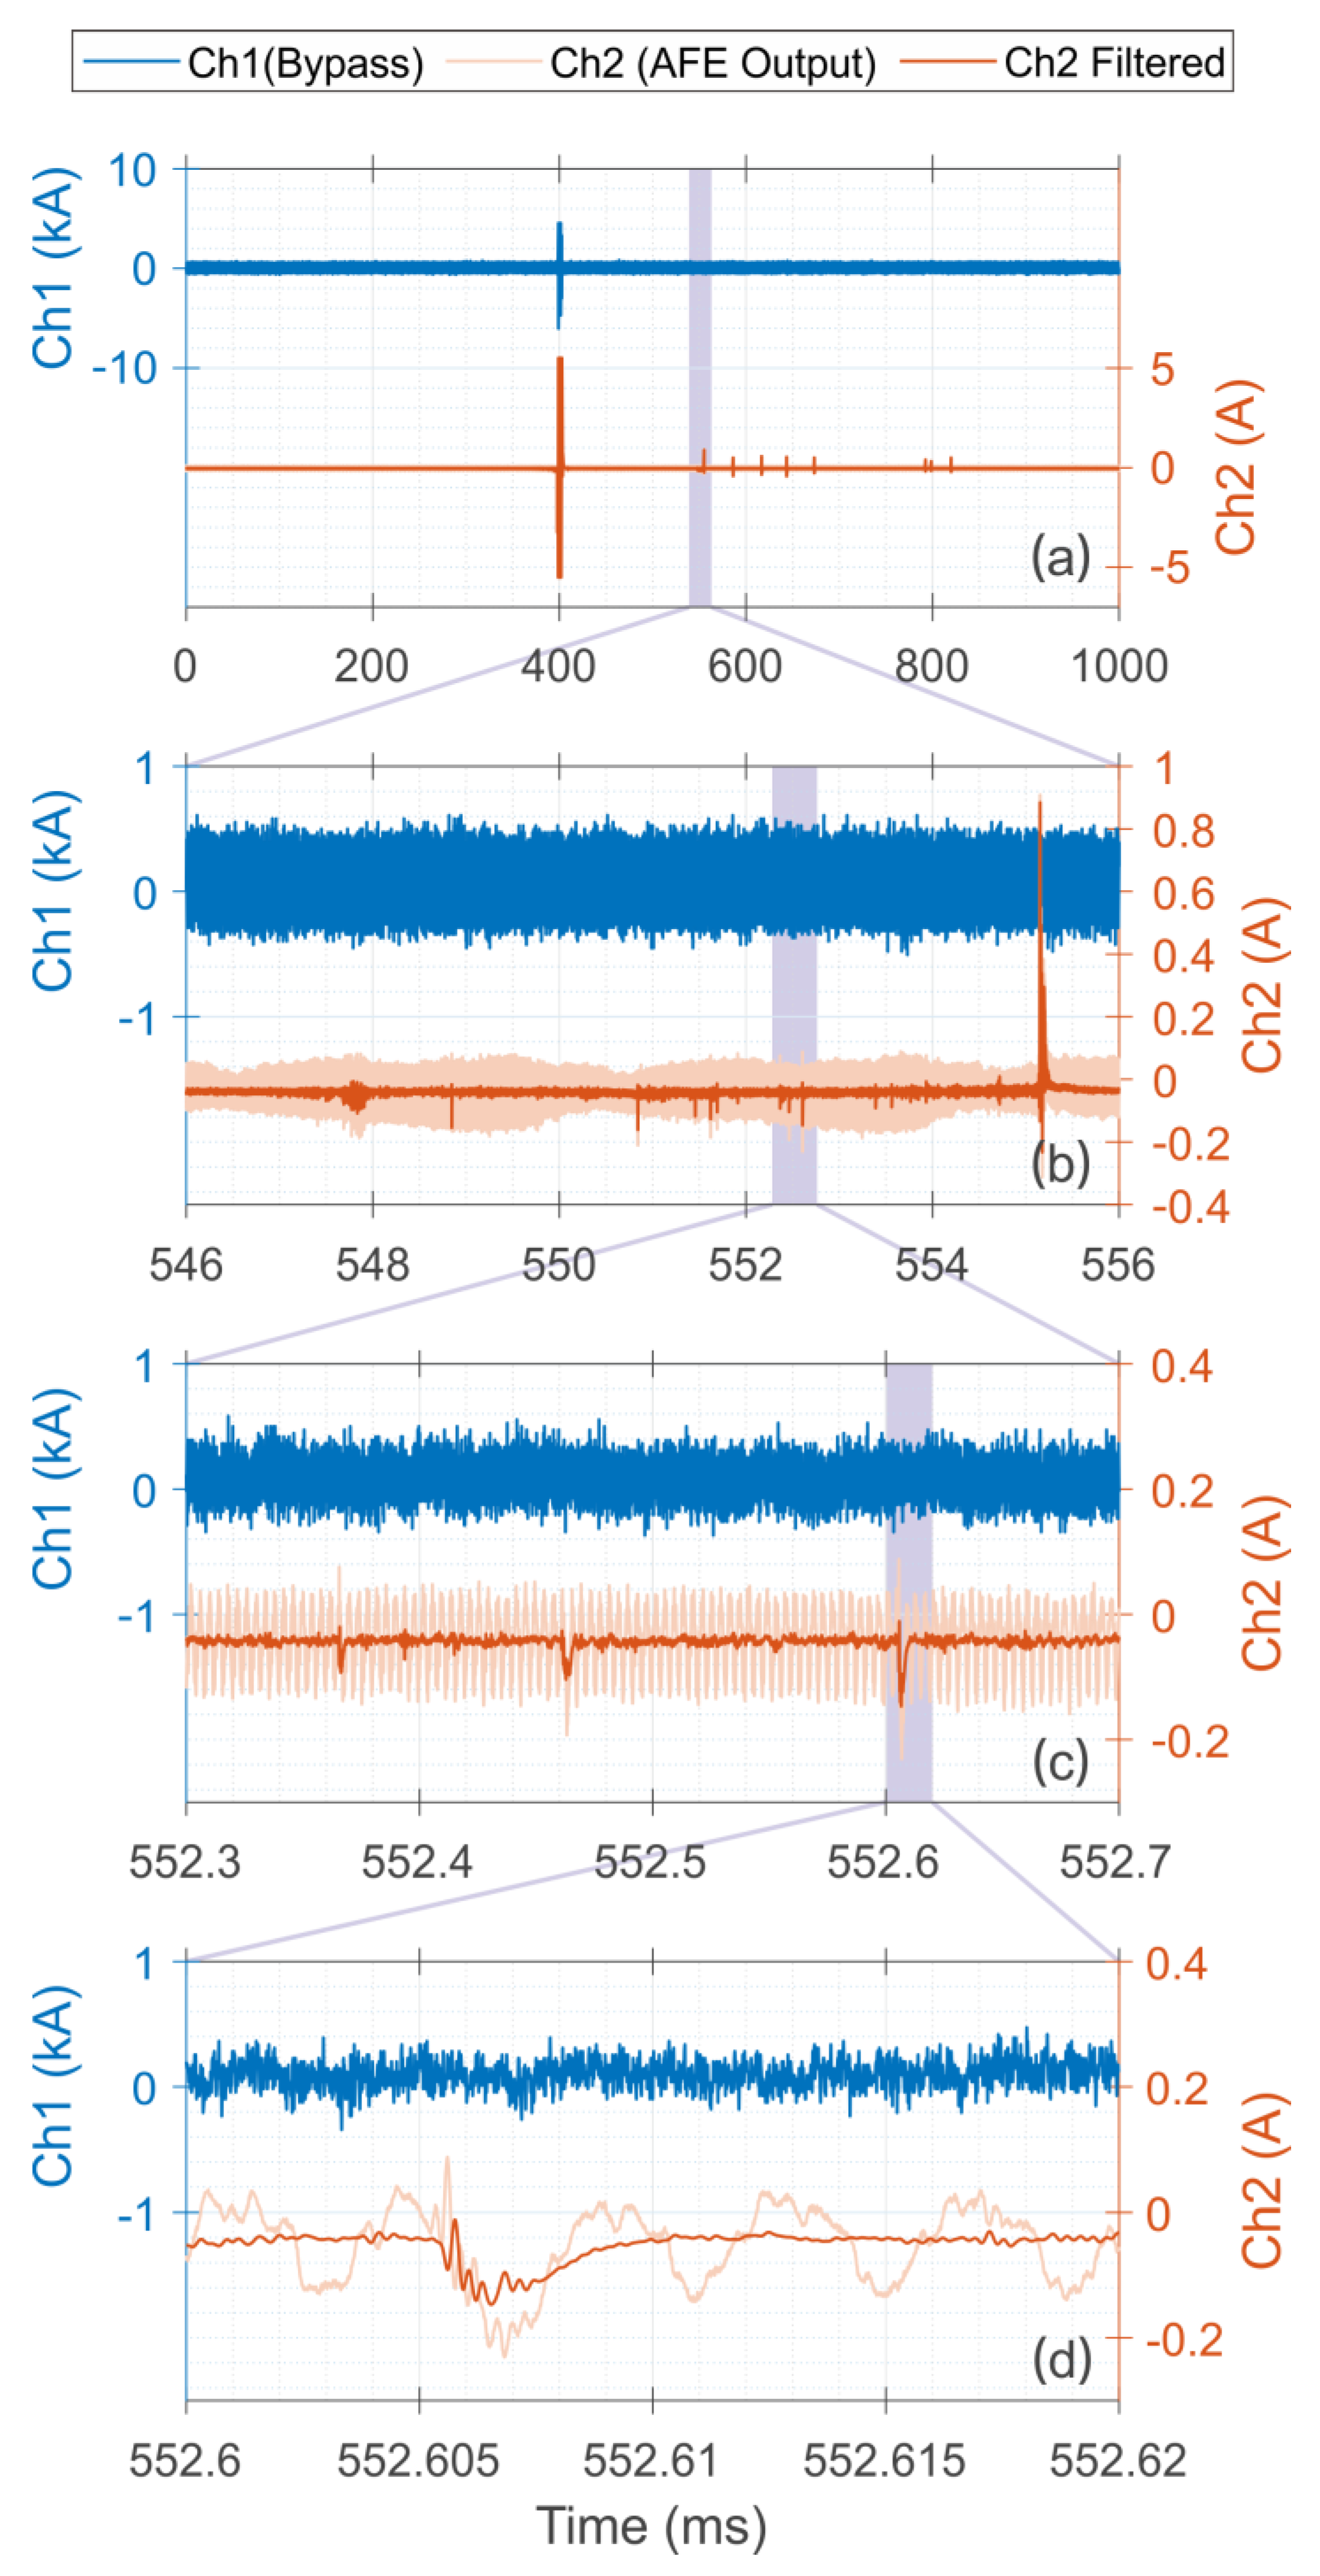
Two lightning events were recorded by the lightning current acquisition system equipped with the shock-tolerant low-noise AFE on SZMGT, in 2019 and 2020 respectively. In both cases, the E/O’s input voltage range of the bypass channel (Ch1) was set to ±50 V (equivalent to ±200 kA) and the wideband mode of the E/O was used to obtain high-frequency current pulses. For the channel of the high-gain amplifier output (Ch2), a voltage range of ±5 V (equivalent to ±5 A) was set to measure the corona discharge pulses just before the initiation of a lightning leader, and the filter mode of E/O was used to minimize additional noise.
Figure 8 presents the comprehensive current waveforms and detailed characteristics of the observed lightning event on 16 September 2019. As no optical signals was recorded for this event, it was classified as an attempted unconnected upward leader, and a maximum peak current of approximately −6.0 kA was documented. The waveform fragment in (a) shows the complete process of the event, and those in (b) to (d) show more details on the leader initiation and corona discharge stage of the event. The maximum oscillating pulses around 400 ms indicate the current pulses generated by the lightning upward leader and their continuous oscillations within the tower body. Afterwards, several attempted upward leaders were observed with pulse amplitudes ranging from 300 mA to 1 A and lasting from 550 ms to 850 ms, but no connection occurred.
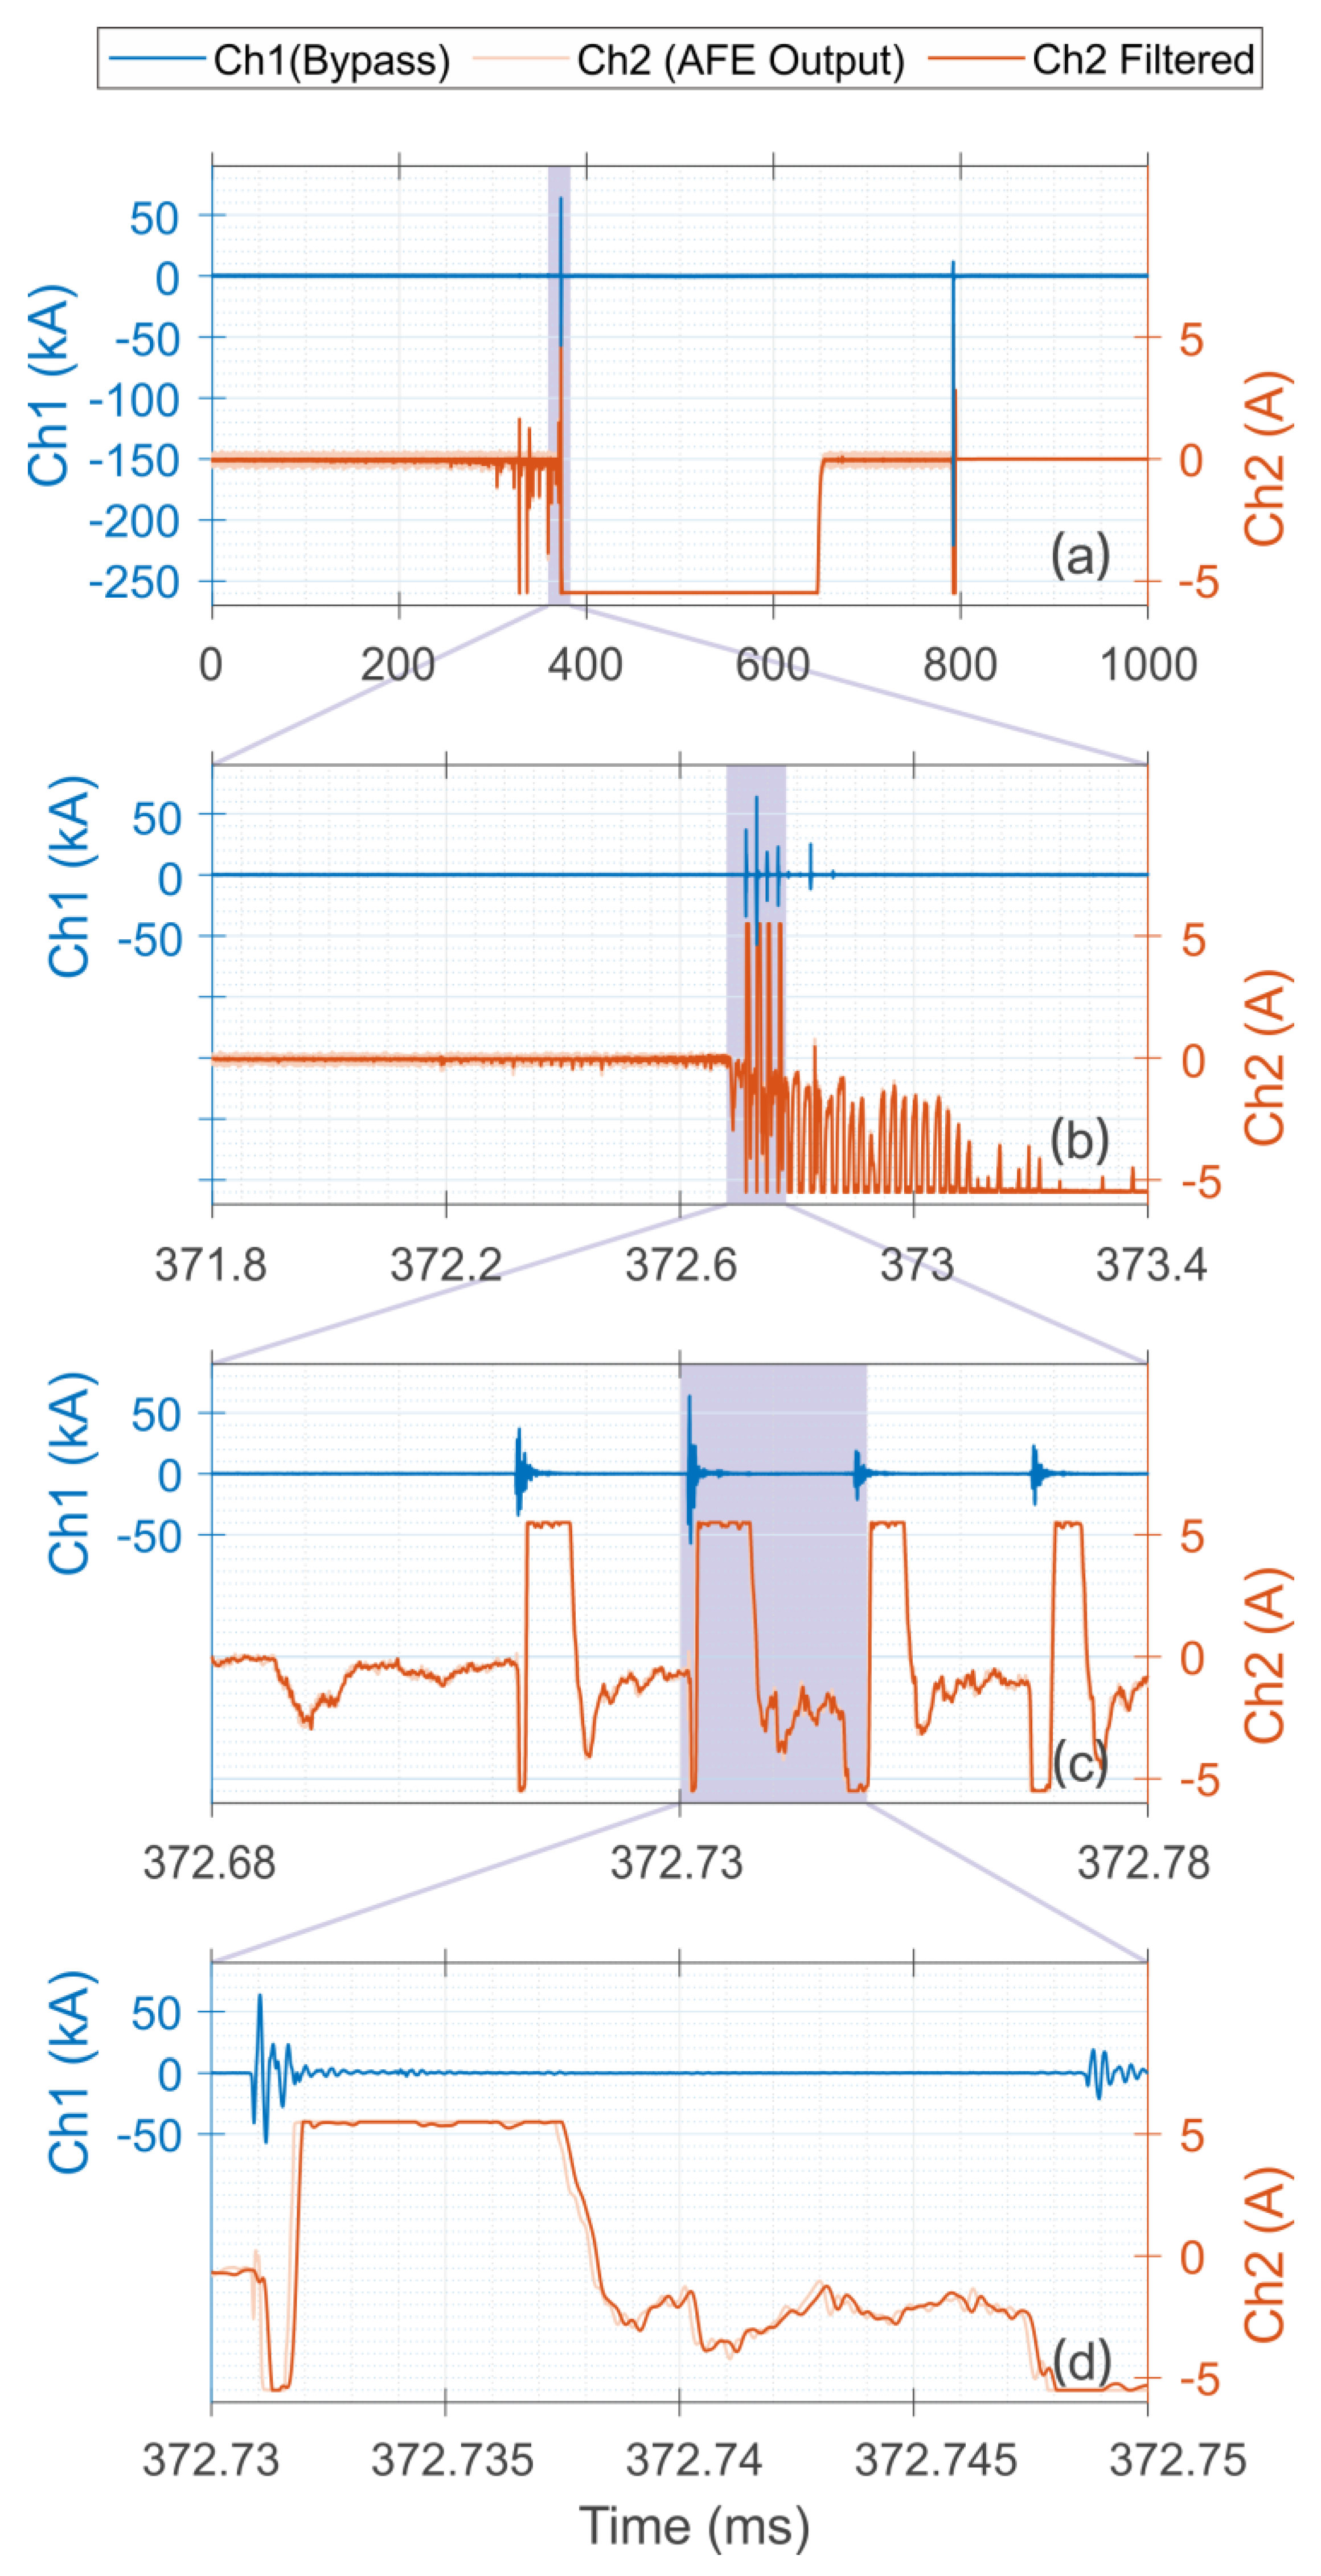
Figure 9 depicts the lightning event recorded on 30 May 2020, which has a peak current larger than −220 kA. While panel (a) shows the complete development process of the event, panels (b) to (d) give more details on the coroChiCna and leader process of the event. The event begins with the appearance of corona discharge current pulses around 200 ms, with the pulse amplitudes ranging from several hundred milliamps to several amperes. Following these current pulses from the corona discharge, a sequence of current pulses from the stepped leader process is observed around 372 ms, which the pulse amplitude is saturated due to it exceeds the range of the high-gain channel but cannot be observed in the bypass channel. Based on a comparison of the pulse intervals and shapes recorded by another research teams [
9], it is considered that these current pulses were generated by an upward stepped leader. The channel current continues to develop until 650 ms, with the current peak of the return stroke process appearing around 800 ms.
In addition, the filtered outputs of these two lightning events also confirmed the effectiveness of the digital denoise filter.
Figure 8c,d present a comparison between the raw data and the filtered data from the high-gain output under low signal conditions. Weaker current pulses with amplitudes between 50 mA and 200 mA can be identified in the filtered waveform, indicating a significant improvement in system sensitivity and data quality. In
Figure 9c,d, the difference before and after filter processing is compared under the condition with large current pulses generated by the upward stepped leader. Little difference can be found, demonstrating the high reliability of this filter design method.
4. Conclusions
In this study, the background noise of the lightning current acquisition system equipped with a specially designed low-noise AFE module on a tall tower was measured and analyzed. A noise floor of 5 μV, corresponding to a current level of 20 mA on a 0.25 mΩ shunt resistor was achieved by using the AFE, which is a significant improvement in noise reduction. During the testing, many narrowband interferences with frequencies between 700 kHz and 10 MHz were detected, and the technique of zeroing out FFT bins was found to be more effective and stable than other methods for building digital filters. The lightning currents measured for two lightning events were also provided, demonstrating the system’s stability and shock tolerance capacity. With the digital filter built, an identification amplitude of corona pulse current of around 50 mA was achieved from the high-gain amplifier output. This value is much lower than the detectable level of approximately 300 mA in the raw data of the high-gain output, and the 0.5 kA level before the installing of the AFE module.
All of these evidences confirm that this multi-channel low-noise lightning current measurement system in combination with a targeted design digital filter can collect valuable lightning current data even in complex electromagnetic interference environments. The shock-tolerant low-noise AFE we developed, in conjunction with an adequately built digital filter can be applied in other scenarios where weak voltage or current changes need to be monitored in the presence of strong shocks and complex electromagnetic interference environments, such as arc fault detector in power systems. Additionally, an AC (alternating current) coupling circuit can also be added to observe small voltage fluctuations occurring under high DC bias conditions.
Author Contributions
Conceptualization, S.W.; Data curation, R.H.; Funding acquisition, Y.G. and M.C.; Methodology, S.W.; Resources, Z.Q. and H.Z.; Supervision, M.C.; Validation, Y.G.; Writing—original draft, S.W.; Writing—review & editing, M.C. All authors have read and agreed to the published version of the manuscript.
Funding
This work was supported by the National Natural Science Foundation of China (Grant No. 42105085), and The Hong Kong Polytechnic University and Research Grants Council of Hong Kong (Grant No.: PolyU 15219121).
Data Availability Statement
The raw data supporting the conclusions of this article will be made available by the authors on reasonable request.
Conflicts of Interest
Author Runquan Huang was employed by the company Shenzhen City Ouxintai Science and Technology Co., Ltd. The remaining authors declare that the research was conducted in the absence of any commercial or financial relationships that could be construed as a potential conflict of interest.
References
- Ab Kadir, M.Z.A.; Cooper, M.A.; Gomes, C. An Overview of the Global Statistics on Lightning Fatalities. In Proceedings of the 2010 30th International Conference on Lightning Protection (ICLP), Cagliari, Italy, 13–17 September 2010; IEEE: Piscataway, NJ, USA, 2010; pp. 1–4. [Google Scholar] [CrossRef]
- Holle, R.L. A Summary of Recent National-Scale Lightning Fatality Studies. Weather Clim. Soc. 2016, 8, 35–42. [Google Scholar] [CrossRef]
- Dashti, R.; Daisy, M.; Mirshekali, H.; Shaker, H.R.; Hosseini Aliabadi, M. A Survey of Fault Prediction and Location Methods in Electrical Energy Distribution Networks. Measurement 2021, 184, 109947. [Google Scholar] [CrossRef]
- Nor Hassan, N.H.; Abu Bakar, A.H.; Illias, H.A.; Abd Halim, S.; Mokhlis, H.; Terzija, V. Analysis of Discharge Energy on Surge Arrester Configurations in 132 kV Double Circuit Transmission Lines. Measurement 2019, 139, 103–111. [Google Scholar] [CrossRef]
- Rakov, V.A.; Rachidi, F. Overview of Recent Progress in Lightning Research and Lightning Protection. IEEE Trans. Electromagn. Compat. 2009, 51, 428–442. [Google Scholar] [CrossRef]
- Miki, M.; Rakov, V.A.; Shindo, T.; Diendorfer, G.; Mair, M.; Heidler, F.; Zischank, W.; Uman, M.A.; Thottappillil, R.; Wang, D. Initial Stage in Lightning Initiated from Tall Objects and in Rocket-triggered Lightning. J. Geophys. Res. Atmos. 2005, 110, D2. [Google Scholar] [CrossRef]
- Qie, X.; Zhang, Q.; Zhou, Y.; Feng, G.; Zhang, T.; Yang, J.; Kong, X.; Xiao, Q.; Wu, S. Artificially Triggered Lightning and Its Characteristic Discharge Parameters in Two Severe Thunderstorms. Sci. China Ser. D Earth Sci. 2007, 50, 1241–1250. [Google Scholar] [CrossRef]
- Qie, X.; Jiang, R.; Wang, C.; Yang, J.; Wang, J.; Liu, D. Simultaneously Measured Current, Luminosity, and Electric Field Pulses in a Rocket-Triggered Lightning Flash. J. Geophys. Res. 2011, 116, D10102. [Google Scholar] [CrossRef]
- Visacro, S.; Guimaraes, M.; Murta Vale, M.H. Features of Upward Positive Leaders Initiated From Towers in Natural Cloud-to-Ground Lightning Based on Simultaneous High-Speed Videos, Measured Currents, and Electric Fields. J. Geophys. Res. Atmos. 2017, 122, 12,786–12,800. [Google Scholar] [CrossRef]
- Arcanjo, M.; Montanyà, J.; Urbani, M.; Lorenzo, V.; Pineda, N. Observations of Corona Point Discharges from Grounded Rods under Thunderstorms. Atmos. Res. 2021, 247, 105238. [Google Scholar] [CrossRef]
- Moore, C.B.; Aulich, G.D.; Rison, W. Measurements of Lightning Rod Responses to Nearby Strikes. Geophys. Res. Lett. 2000, 27, 1487–1490. [Google Scholar] [CrossRef]
- Wang, S.; Chen, M.; Du, Y. Shock Tolerated Low Noise Analog Front-End for Milliamp Measurement on a Low Resistance Shunt. In Proceedings of the 2023 IEEE International Instrumentation and Measurement Technology Conference (I2MTC), Kuala Lumpur, Malaysia, 22–25 May 2023; IEEE: Piscataway, NJ, USA, 2023; pp. 01–05. [Google Scholar] [CrossRef]
- Qiu, Z.; Yang, Y.; Qin, Z.; Chen, M.; Lyu, F.; Guo, H.; Du, Y.P.; Gao, Y.; Zhang, G.; Wang, S. Optical and Current Measurements of Lightning Attachment to the 356-m-High Shenzhen Meteorological Gradient Tower in Southern Coastal Area of China. IEEE Access 2019, 7, 155372–155380. [Google Scholar] [CrossRef]
- HBM Fiber Optic Isolated System & Transient Recorder ISOBE5600 Series—User Manual. Available online: https://archive.org/download/manualzilla-id-5854324/5854324.pdf (accessed on 15 May 2023).
- HBM GEN7tA—User Manual. Available online: https://www.hbm.com/fileadmin/mediapool/hbmdoc/technical/A04145.pdf (accessed on 28 July 2023).
- Cerna, M.; Harvey, A.F. The Fundamentals of FFT-Based Signal Analysis and Measurement; Application Note 041; National Instruments: Austin, TX, USA, 2000. [Google Scholar]
- Uman, M.A.; Krider, E.P. A Review of Natural Lightning: Experimental Data and Modeling. IEEE Trans. Electromagn. Compat. 1982, EMC–24, 79–112. [Google Scholar] [CrossRef]
- Oppenheim, A.V.; Schafer, R.W. Discrete-Time Signal Processing, 3rd ed.; Prentice Hall Press: Hoboken, NJ, USA, 2009; ISBN 0-13-198842-5. [Google Scholar]
- Nahin, P.J. Dr. Euler’s Fabulous Formula: Cures Many Mathematical Ills; Princeton University Press: Hoboken, NJ, USA, 2011; Volume 52. [Google Scholar]
- Duhamel, P.; Vetterli, M. Fast Fourier Transforms: A Tutorial Review and a State of the Art. Signal Process. 1990, 19, 259–299. [Google Scholar] [CrossRef]
- Williams, A.B.; Taylor, F.J. Electronic Filter Design Handbook; McGraw-Hill Education: New York, NY, USA, 2006. [Google Scholar]
| Disclaimer/Publisher’s Note: The statements, opinions and data contained in all publications are solely those of the individual author(s) and contributor(s) and not of MDPI and/or the editor(s). MDPI and/or the editor(s) disclaim responsibility for any injury to people or property resulting from any ideas, methods, instructions or products referred to in the content. |
© 2024 by the authors. Licensee MDPI, Basel, Switzerland. This article is an open access article distributed under the terms and conditions of the Creative Commons Attribution (CC BY) license (https://creativecommons.org/licenses/by/4.0/).

 ,
, 


