Article

Wildlife Real-Time Detection in Complex Forest Scenes Based on YOLOv5s Deep Learning Network

1
School of Information Science and Technology, Beijing Forestry University, Beijing 100083, China
2
Engineering Research Center for Forestry-Oriented Intelligent Information Processing, National Forestry and Grassland Administration, Beijing 100083, China
*
Author to whom correspondence should be addressed.
Remote Sens. 2024, 16(8), 1350; https://doi.org/10.3390/rs16081350
Submission received: 3 February 2024 / Revised: 12 March 2024 / Accepted: 9 April 2024 / Published: 11 April 2024
(This article belongs to the Topic Computer Vision and Image Processing, 2nd Edition)

Abstract

:
With the progressively deteriorating global ecological environment and the gradual escalation of human activities, the survival of wildlife has been severely impacted. Hence, a rapid, precise, and reliable method for detecting wildlife holds immense significance in safeguarding their existence and monitoring their status. However, due to the rare and concealed nature of wildlife activities, the existing wildlife detection methods face limitations in efficiently extracting features during real-time monitoring in complex forest environments. These models exhibit drawbacks such as slow speed and low accuracy. Therefore, we propose a novel real-time monitoring model called WL-YOLO, which is designed for lightweight wildlife detection in complex forest environments. This model is built upon the deep learning model YOLOv5s. In WL-YOLO, we introduce a novel and lightweight feature extraction module. This module is comprised of a deeply separable convolutional neural network integrated with compression and excitation modules in the backbone network. This design is aimed at reducing the number of model parameters and computational requirements, while simultaneously enhancing the feature representation of the network. Additionally, we introduced a CBAM attention mechanism to enhance the extraction of local key features, resulting in improved performance of WL-YOLO in the natural environment where wildlife has high concealment and complexity. This model achieved a mean accuracy (mAP) value of 97.25%, an F1-score value of 95.65%, and an accuracy value of 95.14%. These results demonstrated that this model outperforms the current mainstream deep learning models. Additionally, compared to the YOLOv5m base model, WL-YOLO reduces the number of parameters by 44.73% and shortens the detection time by 58%. This study offers technical support for detecting and protecting wildlife in intricate environments by introducing a highly efficient and advanced wildlife detection model.

Graphical Abstract

1. Introduction

Wildlife is an essential component of natural ecosystems, playing a crucial role in regulating and balancing these ecosystems. Furthermore, it actively participates in the Earth’s carbon cycle, contributing to the stability of ecosystems, species diversity, and the overall health of the carbon cycle [1]. Unfortunately, due to the exponential growth in the human population and the excessive pursuit of economic development, natural resources have been excessively exploited. Additionally, human social activities have expanded into the natural environment, leading to rapid and significant changes in the Earth’s ecosystem [2]. Consequently, the diversity of wildlife is declining at an unprecedented rate, with some species facing extinction [3]. Therefore, it is imperative to enhance the protection and management of wildlife.
Detecting and identifying wildlife is a crucial aspect of wildlife protection and management. It not only improves our understanding of the current status of wildlife species and populations but also provides valuable information about changes in the natural ecological environment, as evident through the survival of wildlife observed during the detection process [4].
Traditional wildlife detection and identification methods rely on wildlife conservation rangers collaborating with taxonomic experts [5]. These methods, including direct observation and capture–recapture, are currently widely used. However, they have drawbacks such as being time-consuming, costly, and requiring specialized taxonomic experts to ensure reliable identification results. Additionally, conducting traditional wildlife surveys faces obstacles like the remoteness of some wildlife habitats and the presence of aggressive and potentially dangerous animals that make close observation difficult [6]. Comparatively, wildlife identification using GPS collars and environmental DNA sampling is less expensive and poses less risk than manual census methods [7]. However, these approaches have limitations. They cover smaller areas and allow for the surveying of fewer wildlife species. Moreover, the use of GPS collars can cause harm to the animals themselves.
Advances in machine vision and monitoring equipment have shed new light on wildlife identification and detection [8]. Monitoring equipment, including visible and infrared cameras, can collect vast amounts of wildlife image data without requiring a human presence [9]. Deep learning techniques, as the primary method used in target recognition, which is the most researched field in machine vision, can be utilized to extract the features of target wildlife using a large amount of image data, thereby recognizing the species of wildlife [10]. With the continuous improvement of large-scale image datasets and device arithmetic power, the superiority of deep learning has been recognized [11]. Deep convolutional neural networks have been more and more widely used in wildlife detection and identification by virtue of its excellent feature extraction ability [12], which can be broadly classified into two kinds. The first is a two-stage deep learning model based on region suggestions, including Fast-RCNN, Mask-RCNN and Faster-RCNN, etc. The second is a single-stage deep learning model, with the most representative being the You Only Look Once (YOLO) deep learning model [13]. Each of these two models has its own strengths and excels in different tasks.
Fast R-CNN is a new rapid target detection model proposed by Ross Girshcik et al. from Microsoft Research [14]. This model generates a region of interest for potential targets by processing images through convolution and maximum pooling layers to propose features. It then compares the extracted feature vectors and ultimately identifies the most probable target region. This method represents a significant advancement in terms of speed and accuracy when compared to models like VGG16 and SPPNet. To enhance the accuracy of Fast R-CNN, Shaoqing Ren and colleagues proposed integrating a fully convolutional network called the Region Proposal Network into Fast R-CNN [15]. This addition aims to produce high-quality regions of interest through end-to-end training while sharing convolutional features with the baseline network to decrease the network’s computational cost. In experiments, Faster R-CNN demonstrated a considerable enhancement in detection frame rate and accuracy compared to the backbone network, making it more suitable for target detection tasks.
Alekss Vecvanags et al. utilized RetinaNet and Faster R-CNN models as the backbone network in monitoring wildlife activity in hoofed species [16]. The models were compared with the YOLO model, and experiments showed that Faster R-CNN has a faster detection speed compared to RetinaNet. However, as a two-stage model, the average detection speed is still not as efficient as the single-stage YOLO model. Despite this, the YOLO model does not perform as well as Faster R-CNN in small target detection. Each model has its own set of advantages.
Mohamad Ziad Altobel and colleagues successfully remotely monitored wild tigers using the Faster R-CNN model applied to the ATRW dataset for tiger detection [17]. After comparing the results with the MobileNet and YOLOv3 models, it was found that the Faster R-CNN model had a significant advantage in terms of accuracy. Jinbang Peng et al. utilized Faster R-CNN for detecting wildlife targets in UAV images. The purpose was to address the challenge posed by the smaller and more scattered distribution of wildlife targets in such images [18]. The experimental findings indicated that Faster R-CNN outperformed other methods in terms of suppressing image background and detecting targets quickly. It is evident that Fast R-CNN and Faster R-CNN outperform backbone networks like VGG in target detection, being both quicker and more precise. However, thorough research and experiments have revealed that there still exists a noticeable gap in detection speed between Fast R-CNN and the YOLO model. Despite its complex background suppression capabilities and unmatched detection accuracy, Fast R-CNN falls short in terms of detection speed when compared to the YOLO model.
Mask R-CNN is an advanced model that builds upon the strengths of Faster R-CNN, as proposed by Kaiming He et al. It is a highly adaptable framework for target instance segmentation, effectively detecting targets within images [19]. In comparison to Faster R-CNN, the increase in computational cost with Mask R-CNN is minimal. However, it achieves greater accuracy in the task of instance segmentation, resulting in more precise target detection. Jiaxi Tang et al. proposed a two-stage model based on the Mask R-CNN model for detecting wildlife targets captured by trap cameras [20]. In the first stage, few-shot object detection is used to identify the species and initially describe the target contour. In the second stage, the feature extraction module of Mask R-CNN is utilized to carry out contour approximation. An experiment proved that the method achieves good results in fast contour outlining of wildlife, and it performs better in terms of FPS and mAP50 metrics compared to the Mask R-CNN and PANet models.
Yasmin M. Kassim et al. have proposed a fast detection algorithm for small targets in infrared video based on migration learning to solve the problem of small targets being difficult to recognize in natural M.G. thermal imaging [21]. The algorithm utilizes Mask R-CNN and DAF processes, and the experimental results show that the method achieves better accuracy in target detection at higher frame rates.
Timm Haucke and others proposed the D-MASK-R-CNN model for recognizing wild animal images with added depth information, achieving instance segmentation of wild animal targets [22]. It is evident that Mask R-CNN outperforms Fast R-CNN in terms of target detection accuracy and target contour approximation. However, they perform similarly in terms of detection speed. In the context of wildlife target detection in complex field environments, high detection accuracy is crucial, but equally important is the need for fast detection speeds.
The YOLO algorithm, proposed in 2016 by Joseph Redmon et al., is a one-stage target detection algorithm [23]. This algorithm converts the problem of target localization into a regression problem. Moreover, the algorithm offers the advantages of speed and flexibility, creating conditions for enhanced image processing [24]. After undergoing several iterations, the YOLO model has been further improved. YOLOv5, being the fifth version of the YOLO series and also the model with the most recent updates, is an efficient and accurate target monitoring algorithm. Its performance in terms of speed, capacity, and accuracy has witnessed significant improvements. The YOLOv5 model group consists of five sub-models. Among these, the YOLOv5s model stands out for having the shallowest network depth and width, the fewest parameters, and a faster inference speed compared to other models, except for the edge device-specific variants [25]. The other models expand upon and enhance the YOLOv5s model by increasing the network depth and width, resulting in improved accuracy. However, this increased complexity also leads to higher hardware requirements for computing devices [26]. Compared to two-stage deep learning models like Fast R-CNN, the YOLO series of models do not require target extraction based on candidate frames for recognition results. Instead, detection results are obtained directly through image computation. The emergence of the YOLO model and its variants has significantly improved the speed of detection and has also shown high accuracy [27].
William Andrew et al. proposed an offline automatic detection model based on the YOLOv2 model in order to realize an unmanned aircraft platform capable of wildlife recognition and reasoning, and demonstrated that the YOLO model has some potential for application in wildlife detection through a small-scale experiment in a farm environment [28]. Runchen Wei et al. used the YOLOv3 deep learning model as the base model for Northeast tiger recognition and adopted channel pruning and knowledge distillation to lighten the model. The experimental results showed that although the model accuracy decreased, the model size and computation amount were greatly reduced, and the comprehensive performance was better than the previous target detection model [29]. Arunabha M. Roy et al. designed a deep learning model for endangered wildlife identification based on the YOLOv4 model and introduced a residual module in the backbone network for enhancing the feature extraction capability, which outperformed the mainstream deep learning models at a certain detection rate [30]. The YOLOv5 target detection algorithm is known for its fast detection speed and light weight, making it ideal for improving the efficiency of image data processing. However, using the YOLOv5 network directly to detect targets in complex environments can lead to high leakage and false detection rates.
To address this issue, Mingyu Zhang et al. proposed an enhanced animal detection model based on the YOLOv5s model by introducing the GSConv module, which combines deep convolution, standard convolution, and hybrid channels, thus realizing the improvement of classification detection accuracy in the presence of improved model detection speed [31]. Similarly, Ding Ma et al. developed the YOLO-Animal model by incorporating the YOLOv5s model and integrating the weighted bi-directional feature pyramid network and attention module. This fusion with the YOLOv5s network significantly enhanced the detection accuracy for small and fuzzy targets of wild animals [32]. YOLOv5s has achieved improved results in various tasks due to its light weight.
Kaixuan Liu et al. developed an algorithm specifically for quickly identifying the rice fertility period. Building upon the lightweight nature of YOLOv5s [33], the backbone network was replaced with MobileNetV3 to enhance the model’s detection speed. Additionally, the feature extraction network was replaced with GSConv to reduce the computational costs, and a lightweight Neck network was constructed to decrease the complexity of the model while preserving accuracy. Xinfa Wang et al. also utilized the YOLOv5 model to enhance it for detecting small targets in tomatoes in agriculture [34]. MobileNetV3 was introduced instead of the backbone network to improve efficiency. A small target detection layer was added during small target detection to enhance accuracy, resulting in significant improvements in both accuracy and detection speed based on experimental results. These advanced studies highlight that YOLOv5s, as an outstanding lightweight model structure, can effectively accommodate rapid target detection tasks. There is potential for further improvement in terms of lightweight design, and by refining the feature extraction method, detection accuracy can be enhanced while maintaining detection speed. This makes YOLOv5s more suitable for detecting wildlife targets in complex forest environments.
In addition to the more popular single-stage and two-stage models such as YOLO and Fast R-CNN, there are also other models that have shown excellent performance in wildlife target detection tasks. For example, Lei Liu et al. addressed the issue of accurately recognizing wildlife targets by proposing the Temporal-SE-ResNet50 network [35]. This network not only utilizes ResNet50 to extract image features but also incorporates a residual multilayer perceptron to capture temporal features. By fusing these features, the model’s accuracy in recognizing animal categories is significantly improved, as demonstrated by experiments showing a notable enhancement in accuracy compared to models like ResNet50 and VGG16. While this approach has achieved impressive results, it is more suitable for recognizing data collected by trap cameras, due to its large model scale and challenges in meeting real-time detection demands after two-stage coding.
In summary, the YOLO series model has more evident advantages in detection speed and model scale compared with a series of two-stage models like Fast R-CNN due to its concise structure. However, there are still deficiencies in detection accuracy. It can be observed that by integrating the feature extraction mechanisms of models with higher detection accuracy, such as the attention mechanism, with the YOLO backbone network, there is potential to enhance detection accuracy while maintaining fast detection speeds.
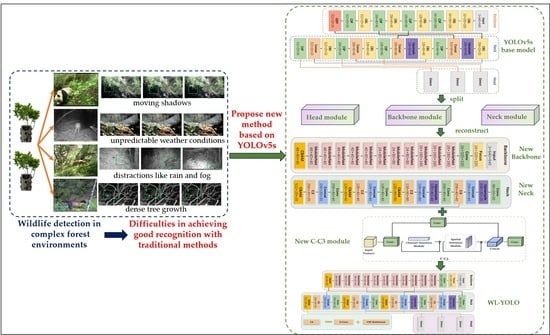
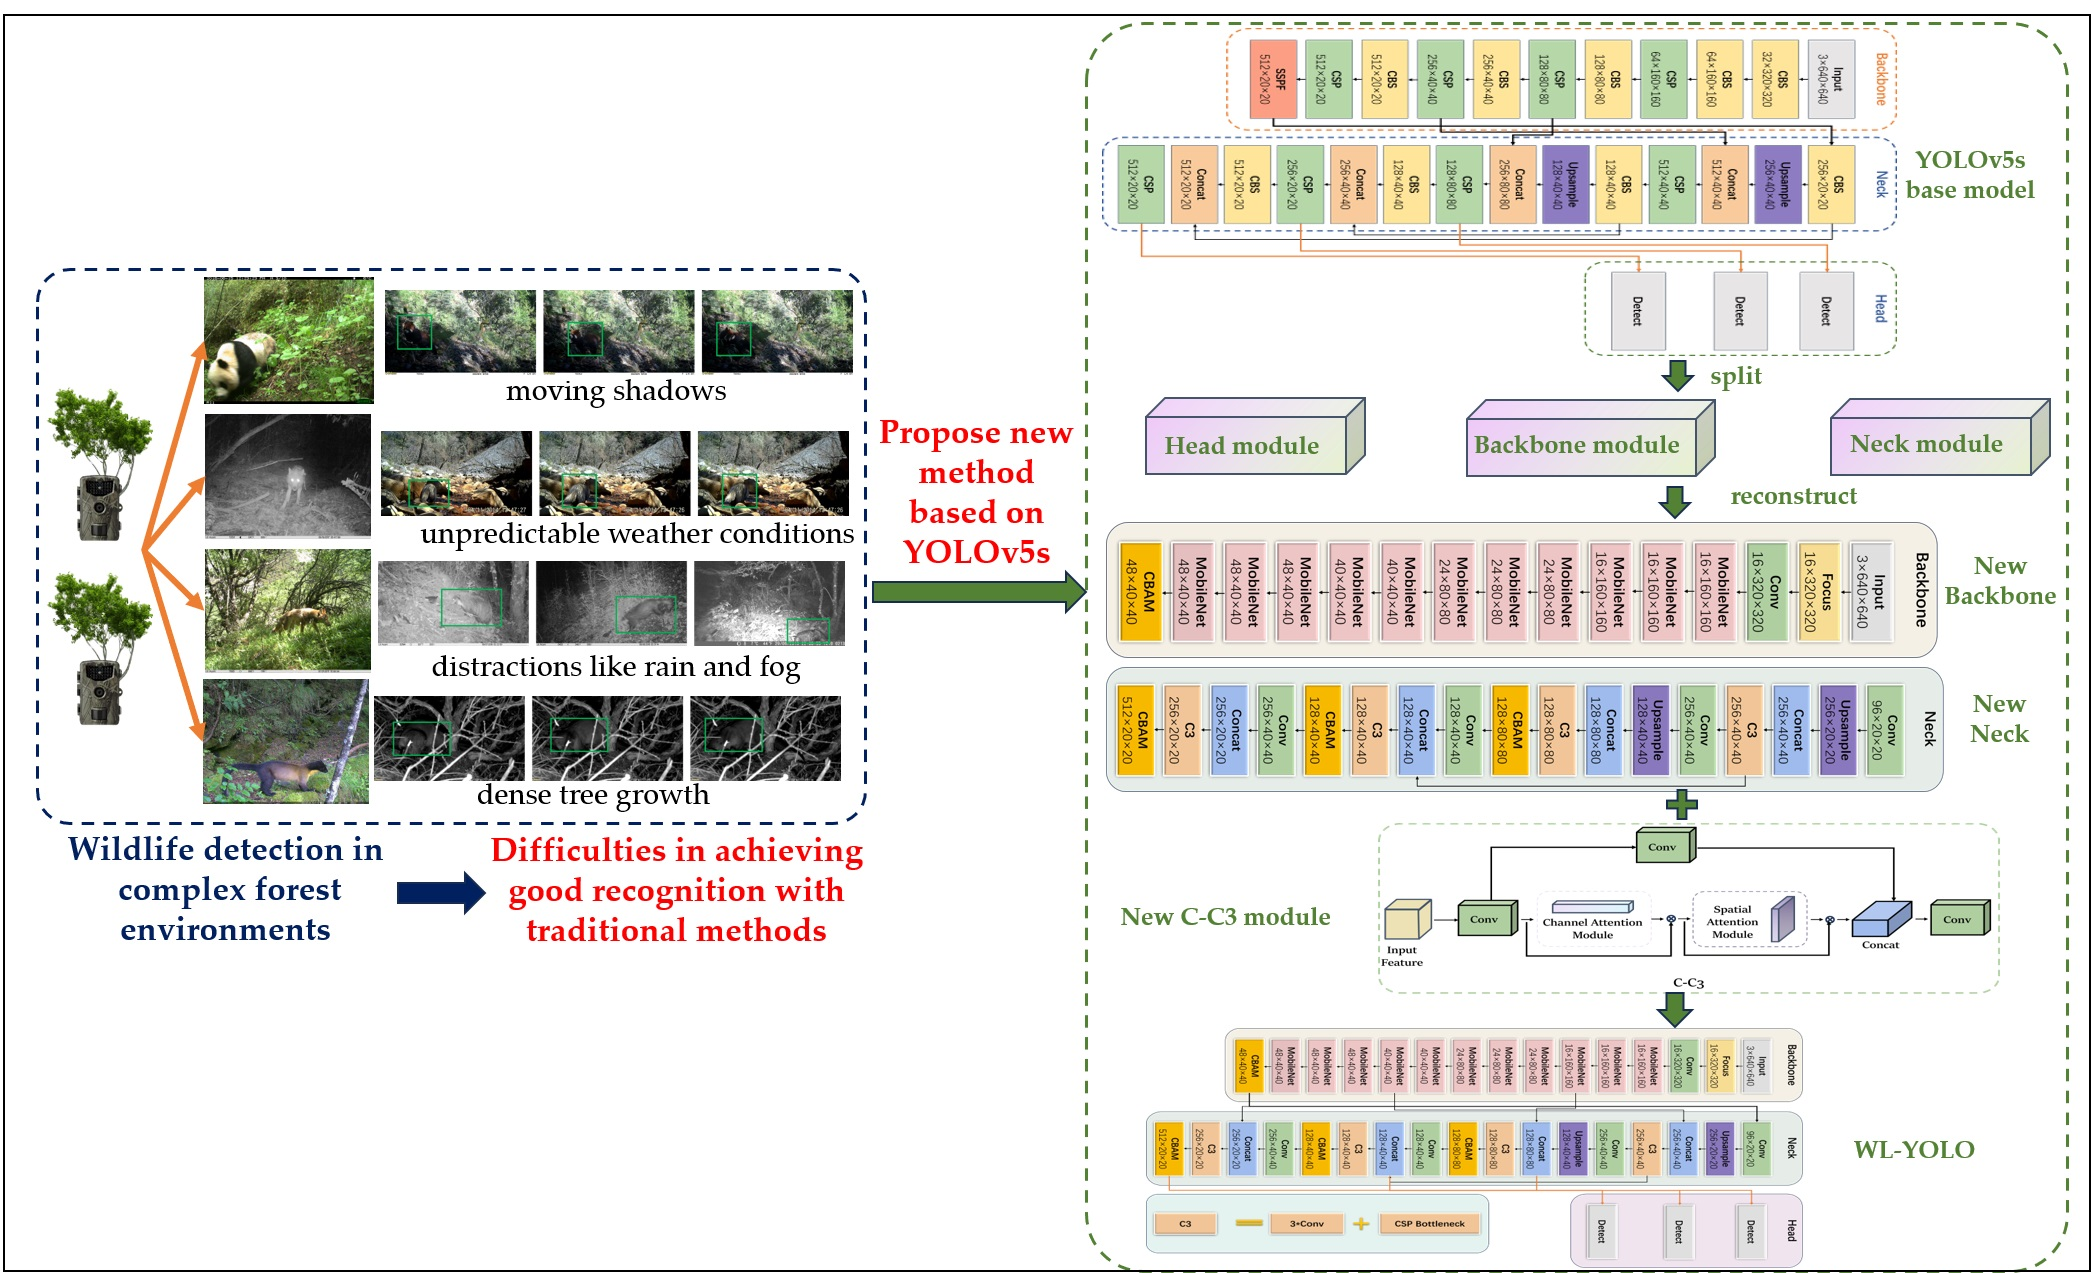
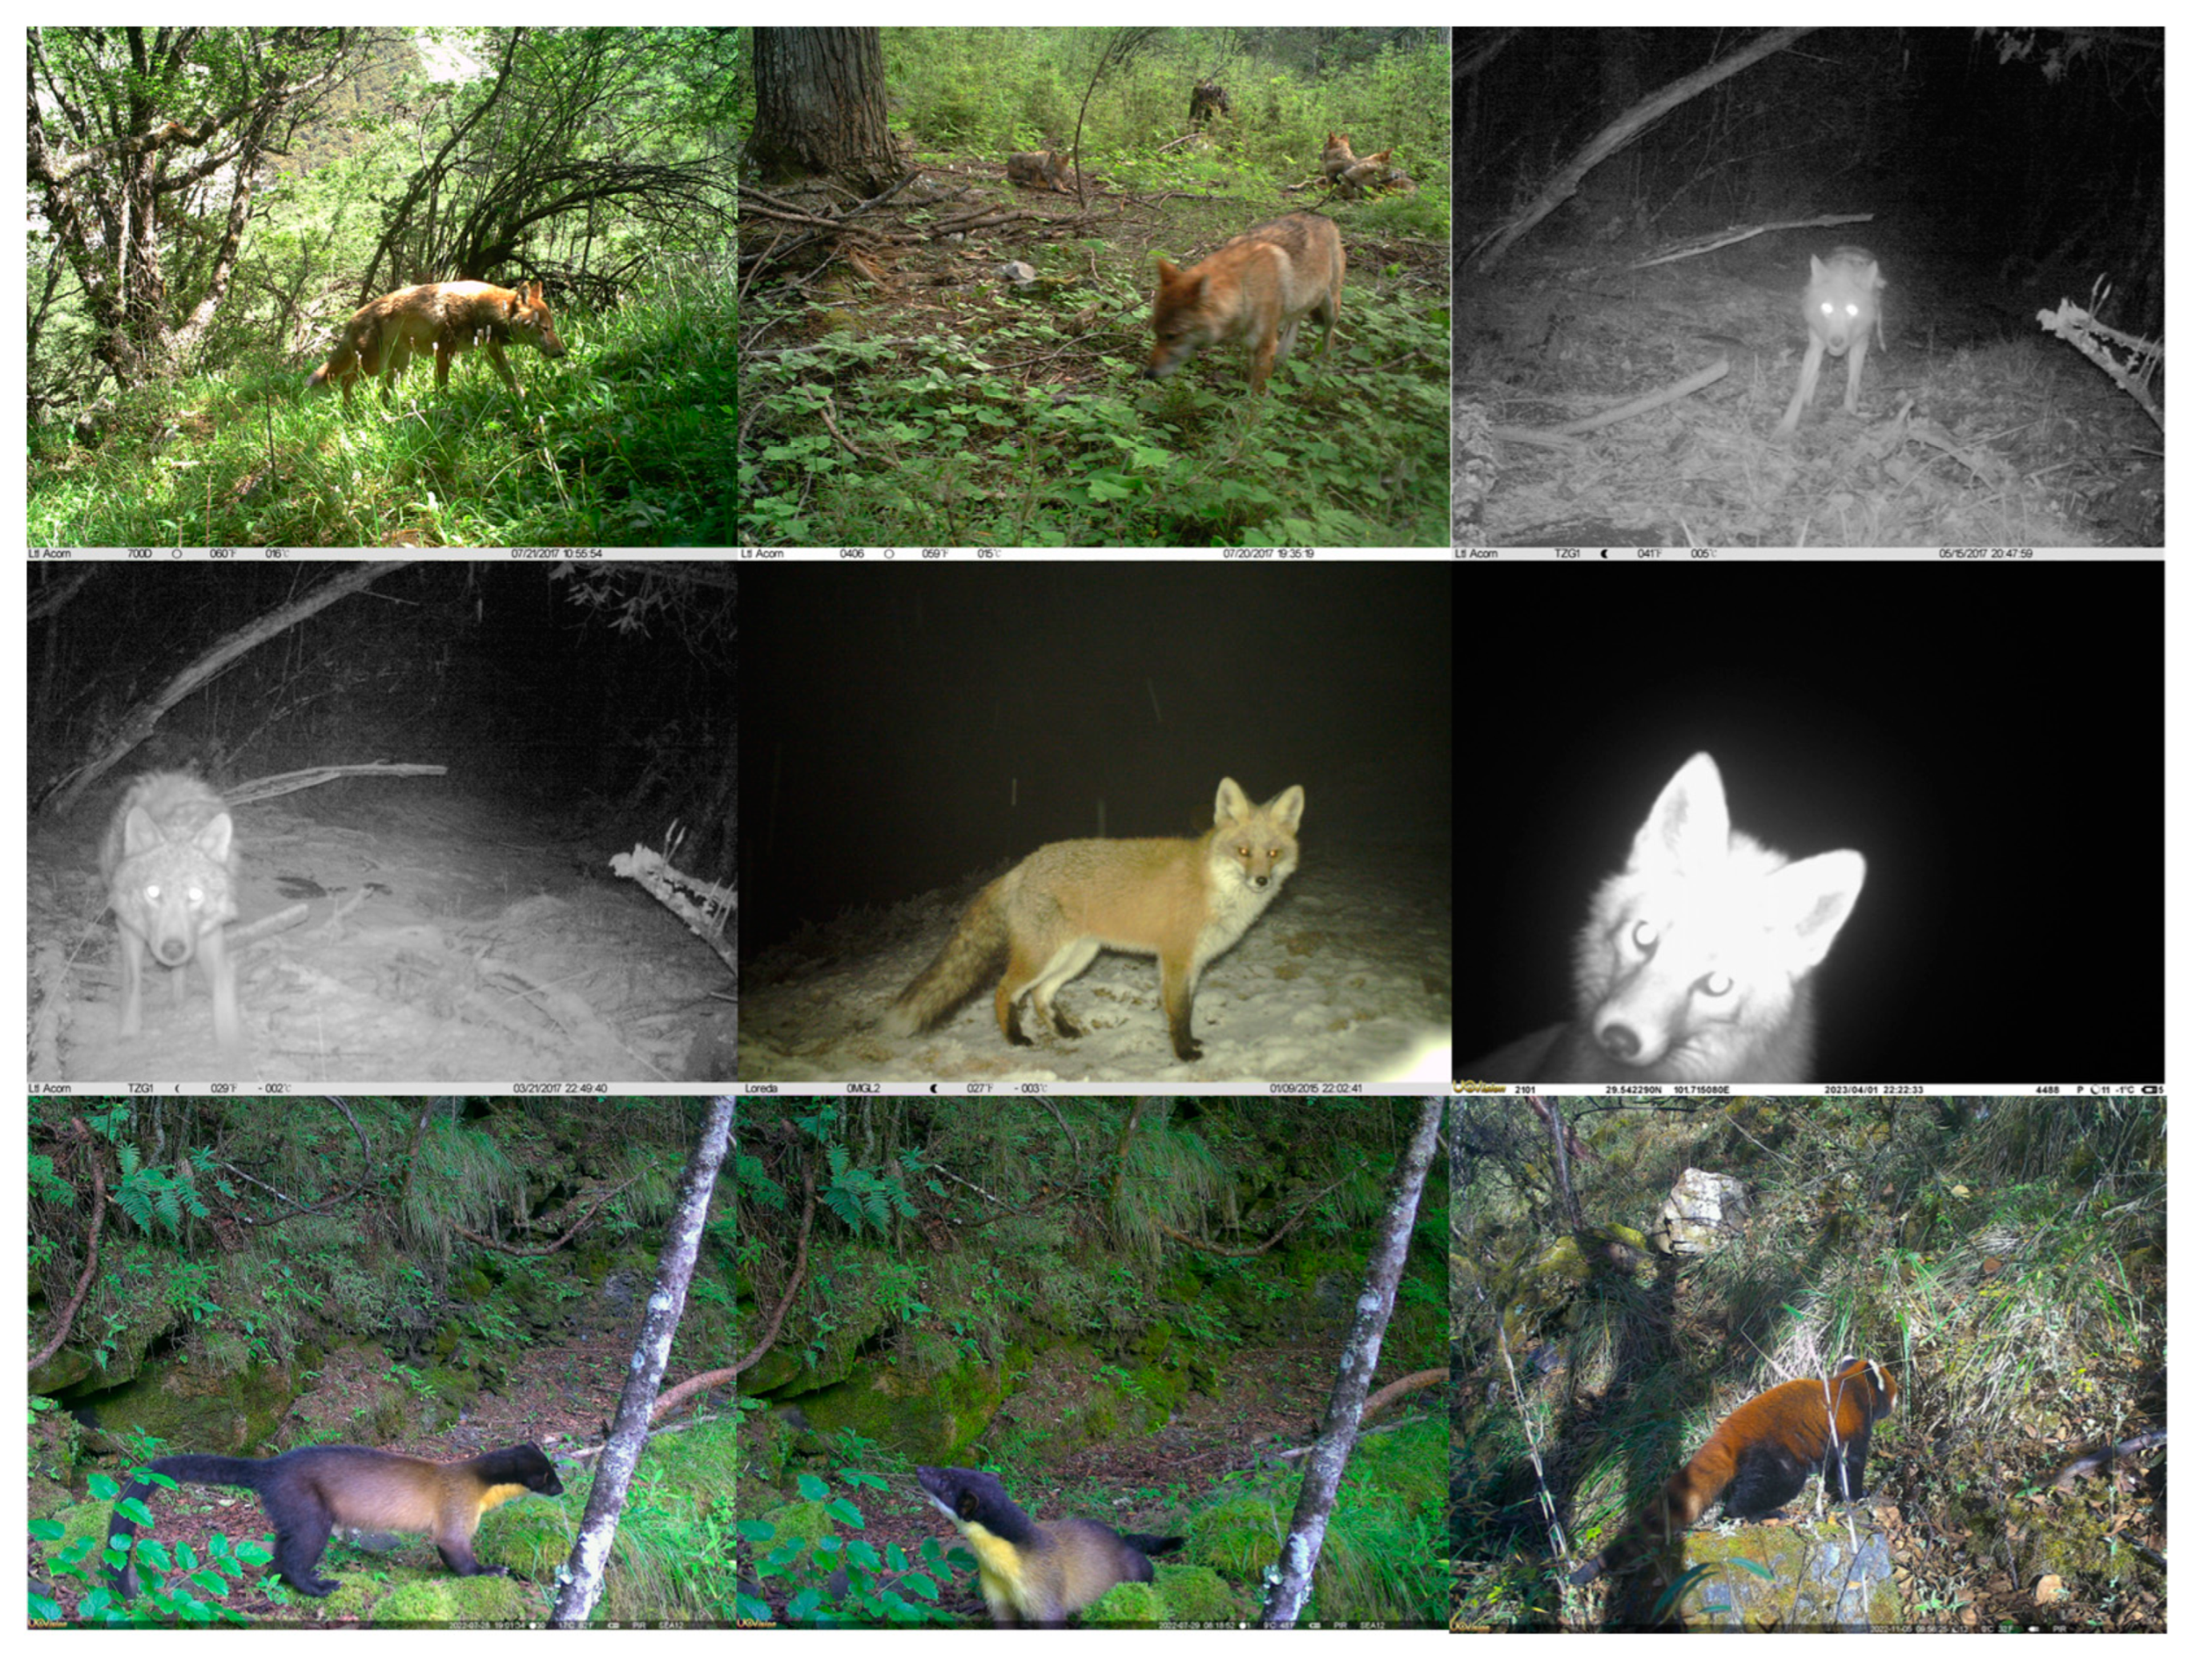
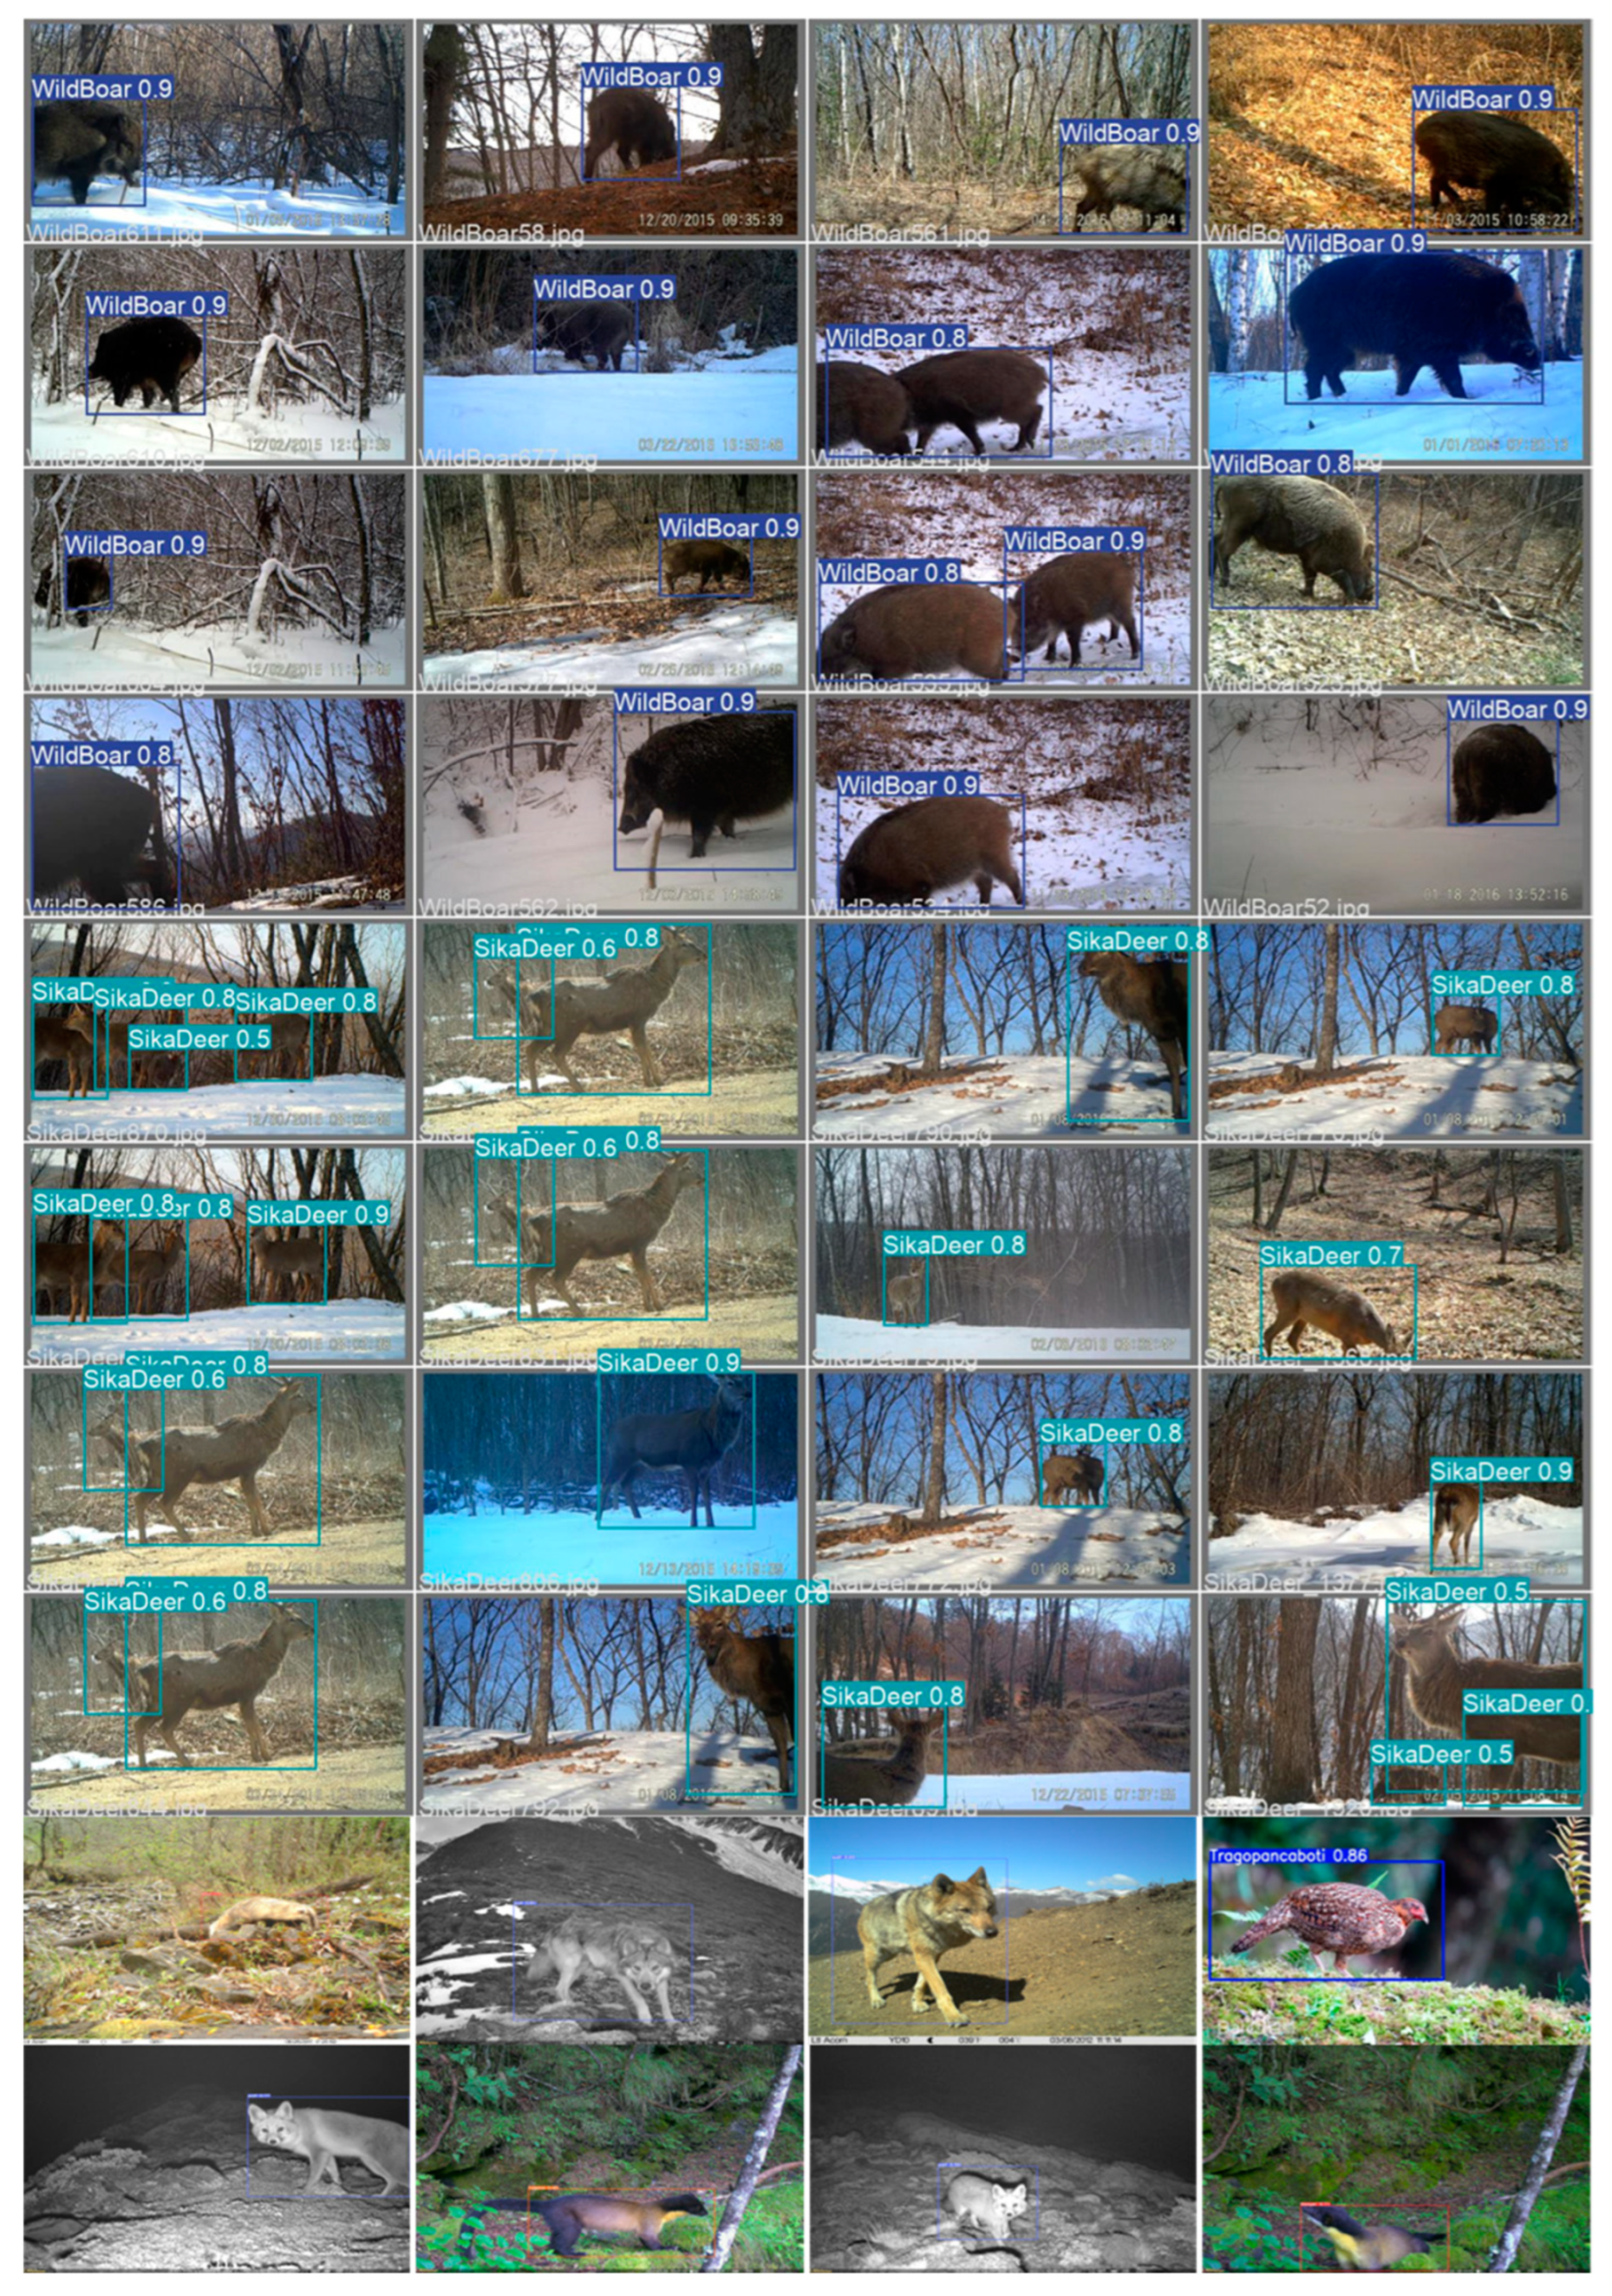
Unlike conventional target recognition, wildlife recognition in complex forest environments is a challenge. This is due to several factors, such as dense tree growth, unpredictable weather conditions, moving shadows, and distractions like rain and fog [36]. Additionally, the natural camouflage of wild animals further complicates their identification in these environments (Figure 1) [37]. As depicted in Figure 1, the targets within the green boxes are the wildlife targets that must be identified. Each row in Figure 1 represents a different situation in which a target is affected, including factors such as light, weather, and more. Therefore, the primary challenge lies in developing models that can efficiently and accurately detect and recognize animals against complex backgrounds.
To address the aforementioned challenges, this study utilized public parks and ecological reserves in China as the study area. We focused on gathering data on approximately 14 species of wildlife as our research objectives. In order to achieve real-time and accurate detection of wildlife in intricate forest environments, we introduced the WL-YOLO model, an enhanced version of the YOLOv5s detection model. By deploying the model on both the server-side and mobile-side, real-time monitoring can be achieved through surveillance cameras in national parks and by field workers using mobile devices, respectively. The main contributions of this article are as follows:
(1)
In the WL-YOLO model, we have integrated the MobileNetV3 module to reduce the model parameters and improve the real-time detection speed, achieving a 44.73% reduction in the number of parameters compared to the YOLOv5m model.
(2)
Additionally, we have introduced the CBAM attention mechanism, which combines spatial and channel aspects with the feature extraction module to participate in end-to-end training. This attention mechanism has a better target focusing effect compared to mechanisms that solely focus on the channel.
(3)
We have enhanced the scale of the model’s anchor frame, which is used for detecting targets. This improvement enables the model to better concentrate its attention on elusive wildlife targets. Compared to the unimproved YOLOv5 model, this model has a superior ability to focus on small targets and detect hidden targets in complex environments.
In comparison to two-stage models like Fast R-CNN, the WL-YOLO model boasts a smaller number of parameters, faster detection speed, and, simultaneously, better accuracy.
This article is organized as follows: Section 2 presents the wildlife dataset we collected and used, as well as the designed wildlife detection and identification model. In Section 3, the experimental results of the model are evaluated and analyzed. Section 4 provides a summary and generalization of the wildlife detection and identification model for complex forest environments, presented in conjunction with the experimental results. This section also highlights the advantages and limitations of the model.

2. Materials and Methods

2.1. Study Area and Sample Plots

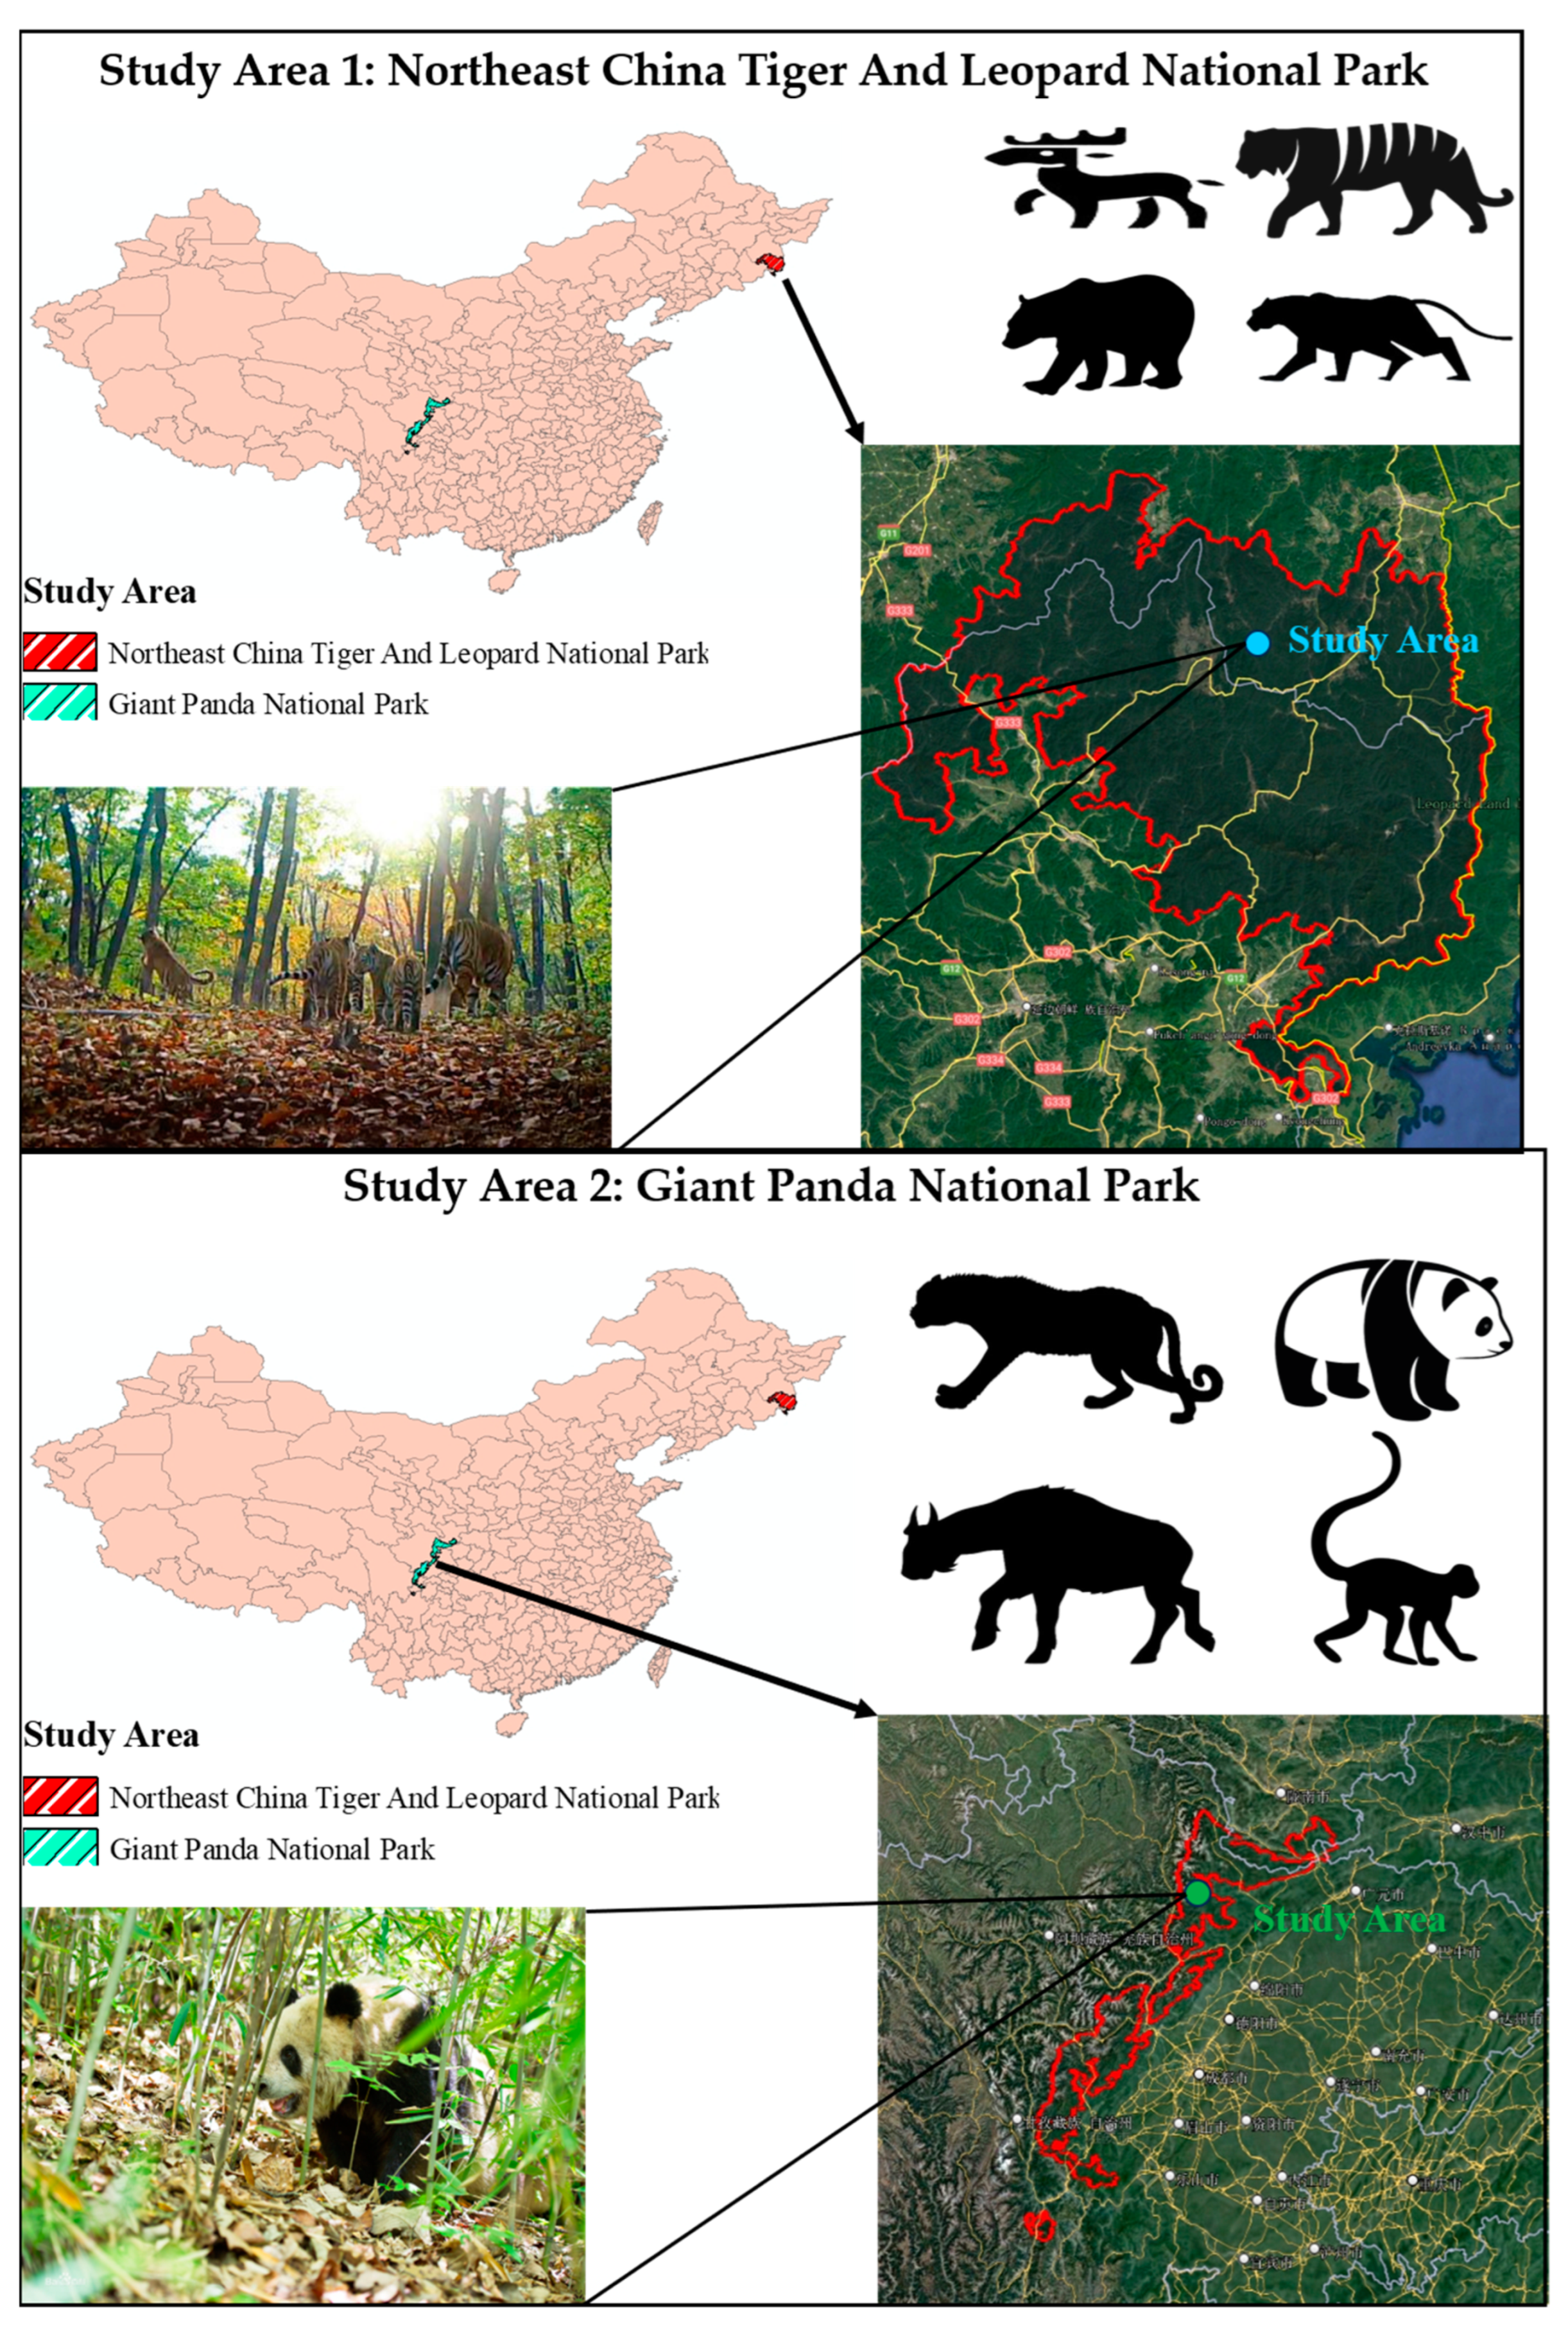
The wildlife image data collected and used in this paper are all from national parks as well as ecological reserve areas within China, including the Giant Panda National Park, Northeast Tiger and Leopard National Park, Three-River-Source National Park, Xishuangbanna National Nature Reserve of Yunnan, Gongga Mountain National Nature Reserve and other areas. The main focus of this paper is the study area, which primarily encompasses the Giant Panda National Park and the Northeast Tiger and Leopard National Park. This region boasts a diverse range of wildlife and a complex ecological environment, covering an expansive area of 170,840 square kilometers. Notable examples of the key national wildlife found here include the Amur tiger, the Amur leopard, the giant panda, the golden monkey, and the red panda. The specific location of the study area is depicted in Figure 2.
To maximize the collection of wildlife image data, we employed infrared and visible infrared trap cameras. These cameras enabled us to capture an extensive array of images, featuring diverse wildlife species set against complex backgrounds. The infrared cameras and visible light cameras we used to collect data were primarily distributed in the Giant Panda National Park and Northeast Tiger and Leopard National Park. We used trap cameras to minimize the impact on wildlife and prevent damage to the equipment by animals. Our staff regularly collected the memory cards from the equipment and transmitted the data. In areas with good communication, we deployed infrared cameras with 4G communication capability for real-time data transmission and identification.
The dataset used for the experiments consisted of 14 main categories: badger, black bear, red panda, otter, red fox, marten, leopard, Amur tiger, leopard cat, Sika deer, weasel, wild boar, and wolf. 
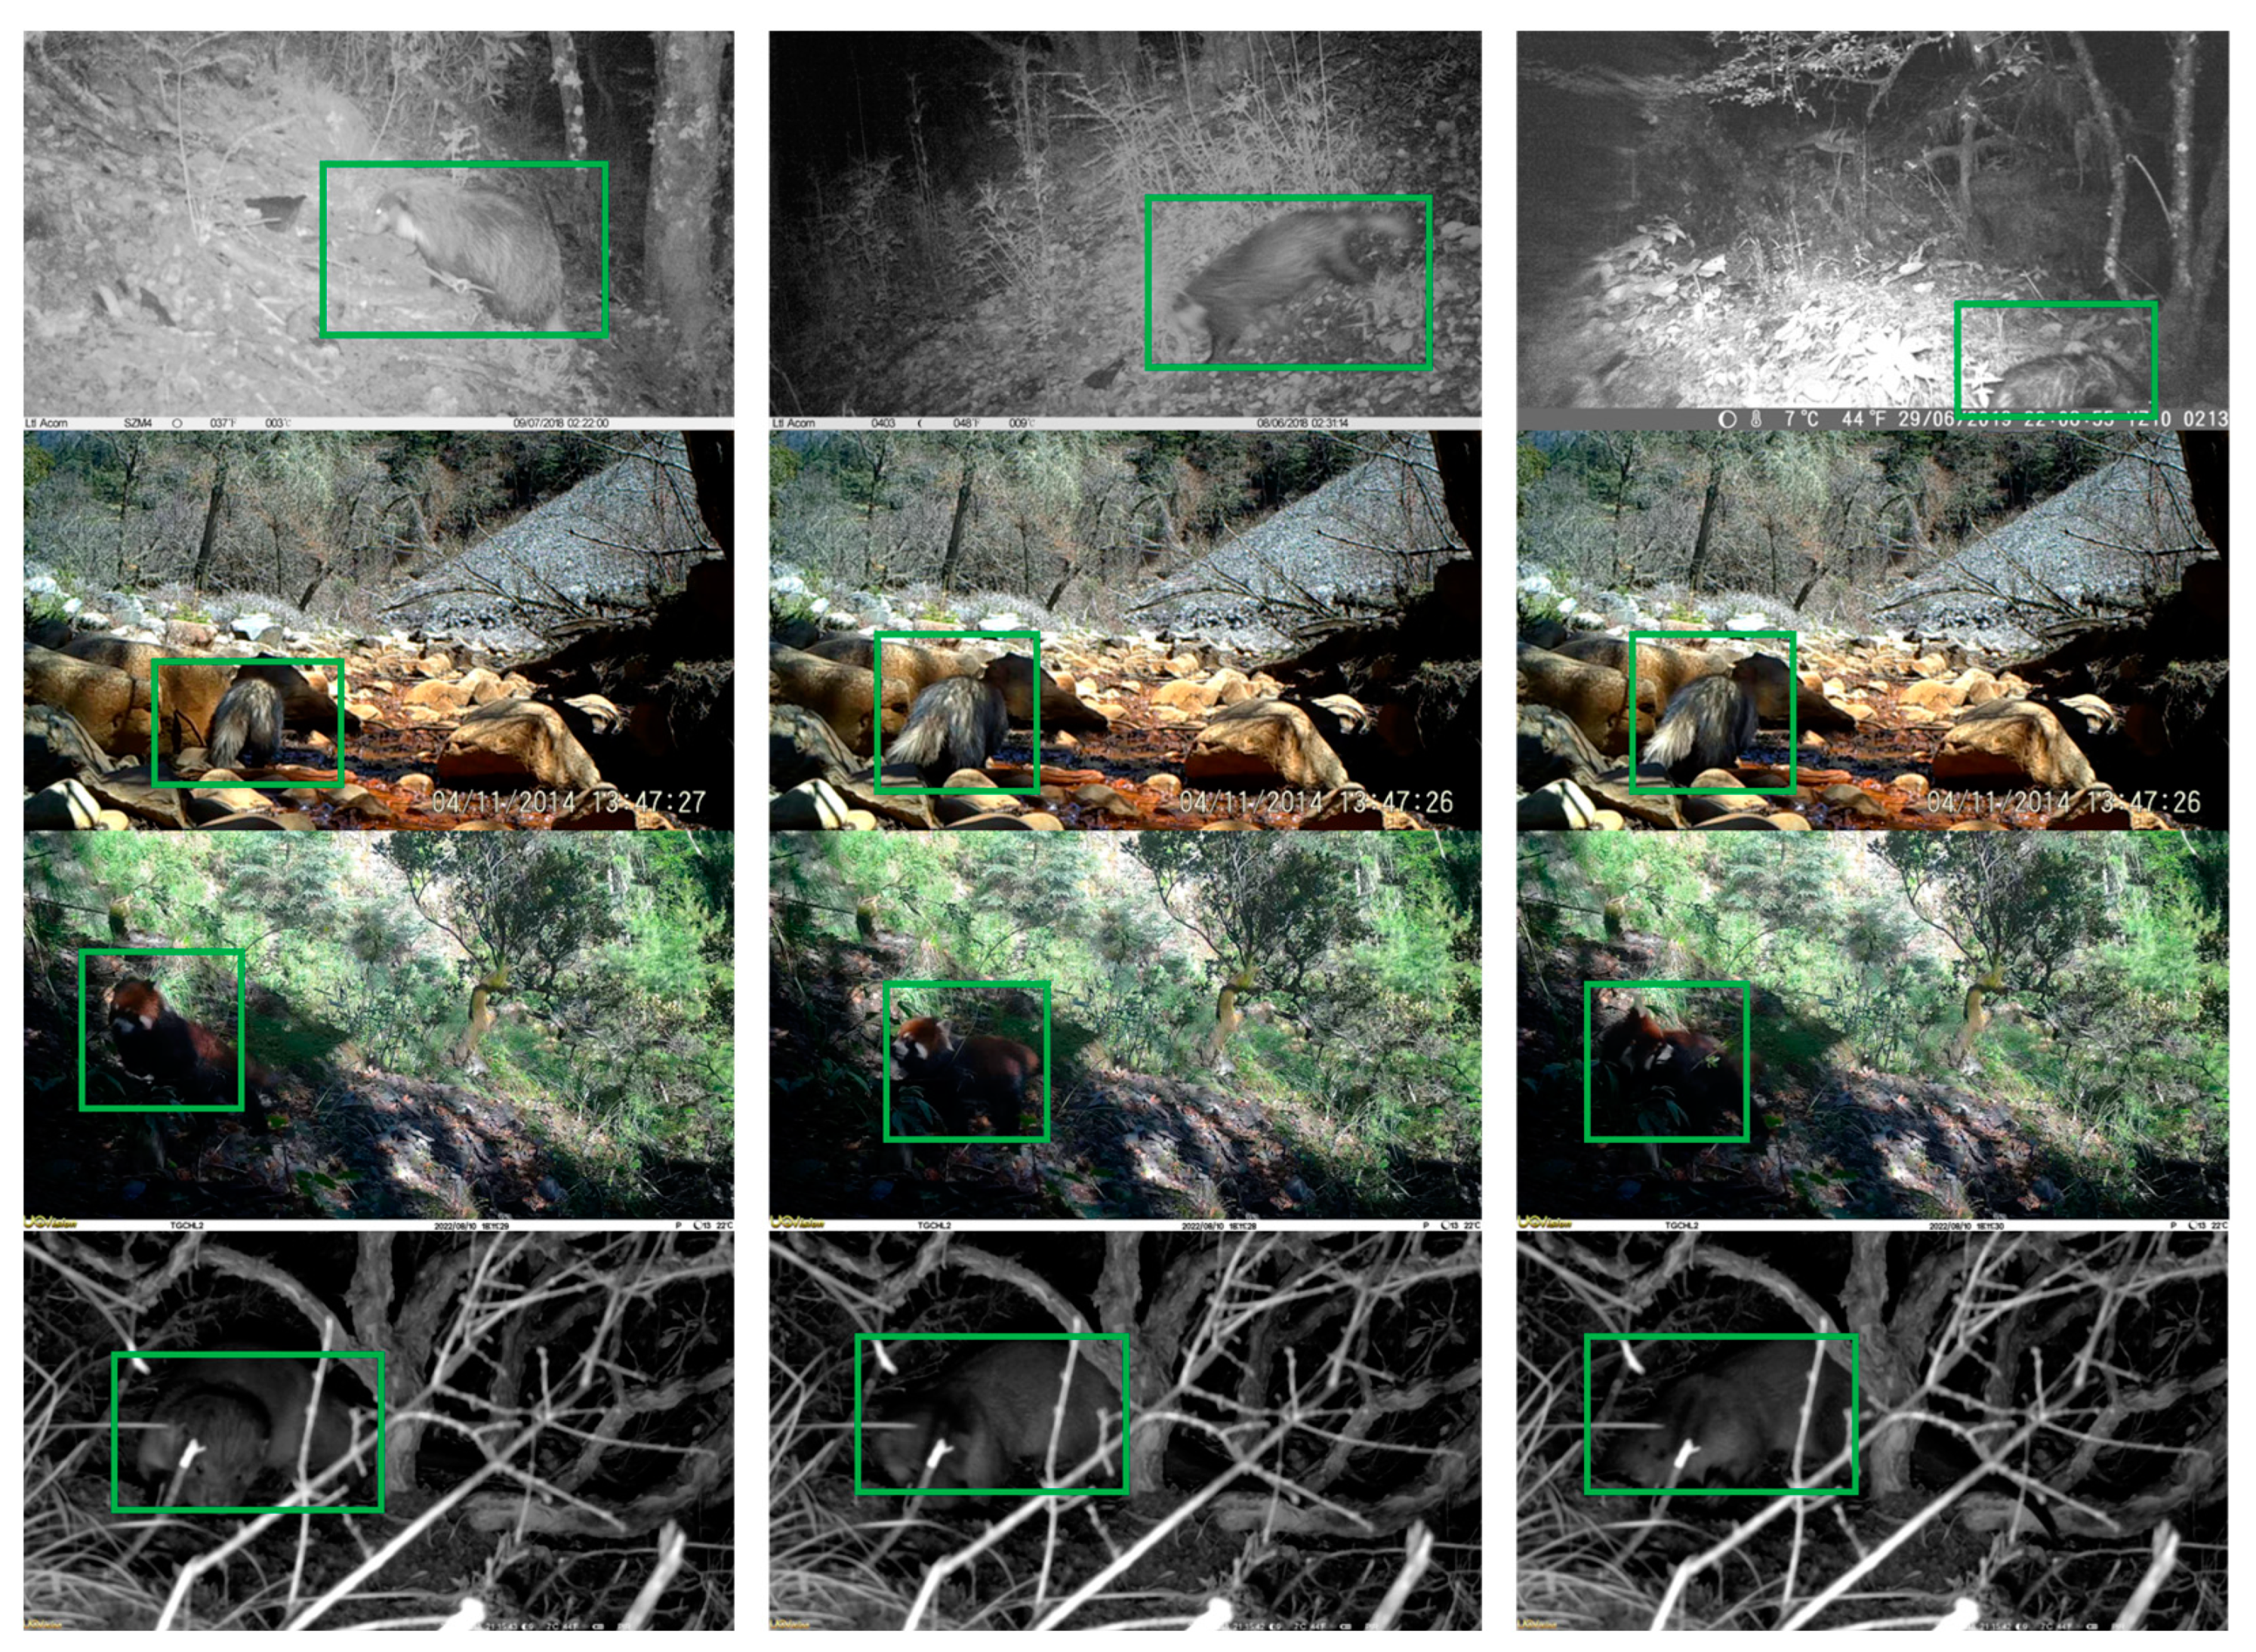
Figure 3 displays representative images from the training dataset used in this paper. The dataset comprises a total of 14,000 image data, with 1000 images per category. Each category includes 500 visible image data and 500 infrared image data. Additionally, a small amount of video data has been included to test the model. This means that the video data is converted frame-by-frame into image data to be input into the model in order to test its target detection effect at higher frame rates. To ensure the dataset’s versatility and diversity, we included images that exhibit various characteristics such as limited or full light, high or low visibility, high levels of occlusion, and complex backgrounds, among others. Furthermore, the dataset encompasses variations in terms of image resolution, orientation, and grayscale. The subsequent section provides a more detailed description of these specific aspects of variation.

2.2. General Methodology

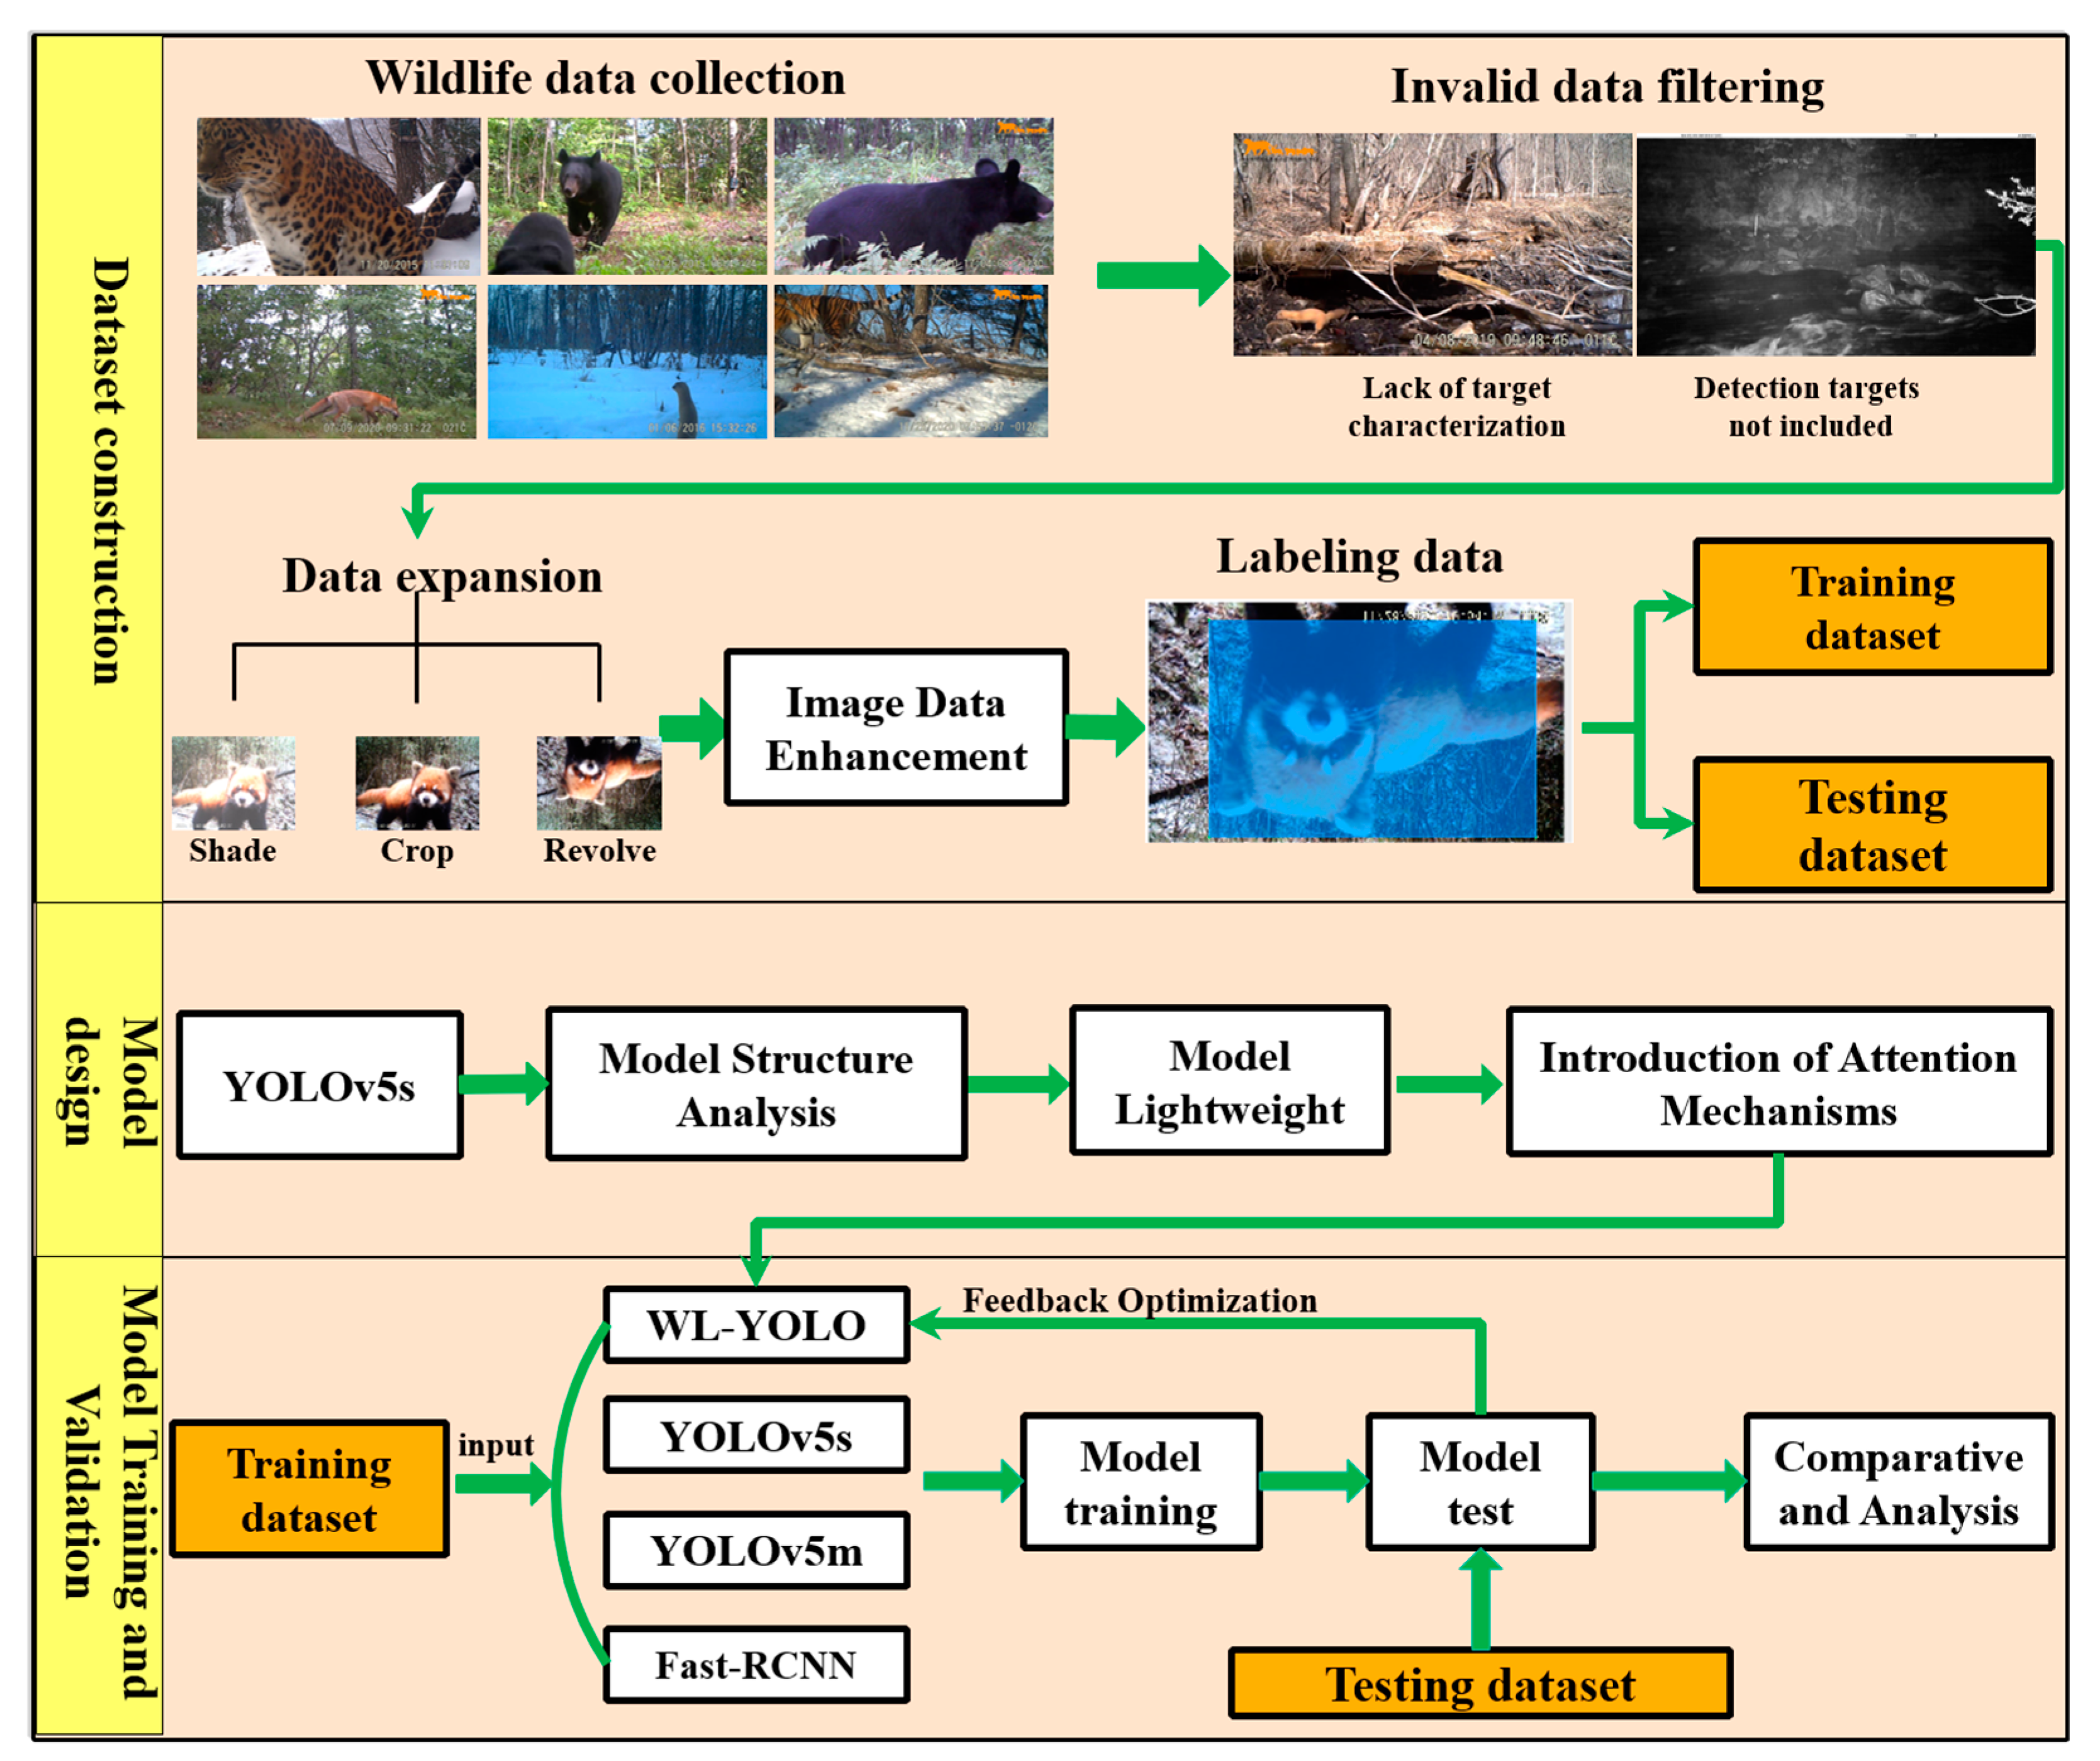
Our proposed method includes the following main steps: first, the collected wildlife image data is preprocessed. This involves filtering out irrelevant data, converting the data to a uniform format, and performing other necessary operations. This is performed to create a strong foundation for accurately annotating the images. As the number of images captured for each animal species may vary, the dataset was augmented using various methods.
The goal was to ensure that there are at least 1000 images available for each species of animal and achieve a balanced amount of image data for all animals. Furthermore, we aimed to improve the quality of the image data by implementing deep learning algorithms specifically designed for low-quality images. To accomplish this, we utilized the YOLOv5s model as the foundation, retaining the Darknet53 feature extraction structure. Additionally, we redesigned both the detection head and the feature extraction module of the model’s backbone network, resulting in the creation of the WL-YOLO wildlife detection model. To train, validate, and compare the performance of the WL-YOLO and other models such as YOLOv5s, YOLOv5m, and Fast-RCNN, we fed the training dataset, test dataset, and validation dataset into each model. The overall technical route is illustrated in Figure 4.

2.3. Dataset Construction

The process of constructing a wildlife dataset mainly involves acquiring data, preprocessing it, augmenting it, enhancing data quality, converting data formats, and labeling data. Due to the natural conditions of the complex forest environment and the limitations of the data acquisition equipment, the collected wildlife data often include a large number of aerial data and fuzzy images. These factors adversely affect the effectiveness of the model. Therefore, the first step in constructing the dataset is to clean the dataset by removing extraneous data and filtering out images that do not have the desired characteristics.
Limited by the points of wildlife infestation, the frequency of infestation may differ. Consequently, the number of wildlife images captured by our surveillance equipment for each category may also differ. However, the balance of data for each category directly influences the effectiveness of the model. To address this, we have ensured that the amount of wildlife images for all categories in the model is approximately 1000 pieces of data. Various methods, including image rotation, panning, cropping, changes in lighting and darkness, and changes to gray scale, have been employed to generate multiple representations of the same image and augment the dataset.
Different kinds of wildlife image data were collected using various acquisition equipment. As a result, the sizes of wildlife image data in the dataset are not uniform. The dataset contains images of different resolutions, such as 1920 × 1080, 647 × 657, 474 × 392, and others. However, our model requires a fixed input size. If the image is too large or too small, it will impact the model’s ability to read the image features and affect the overall performance of the model.
To address this issue, we decided to compress all of the original images to a standardized size of 224 × 224 pixels before performing image quality enhancement. In this process, we first rescaled the shorter side of each image to ensure it matches a fixed length. Then, we utilized the center cropping technique to crop the images to the same length. This approach helps to maintain the efficiency and accuracy of our work. Furthermore, in order to ensure uniformity across the dataset, we adjusted the width and height of all image data to a consistent size.
Due to the sparse survival of certain animal species, it becomes challenging to collect a large amount of image data. However, deep learning algorithms require a sufficient number of samples. Using augmented image methods excessively for quantity expansion can result in the repetition of image features, which leads to overfitting models [38].
Therefore, for this specific part of the image data, we have designed an image quality enhancement method based on deep learning techniques in order to enhance the fuzzy images. We utilized the torch vision library provided by the PyTorch deep learning framework for image quality enhancement. This method generates similar but not identical training samples by enhancing the image quality [
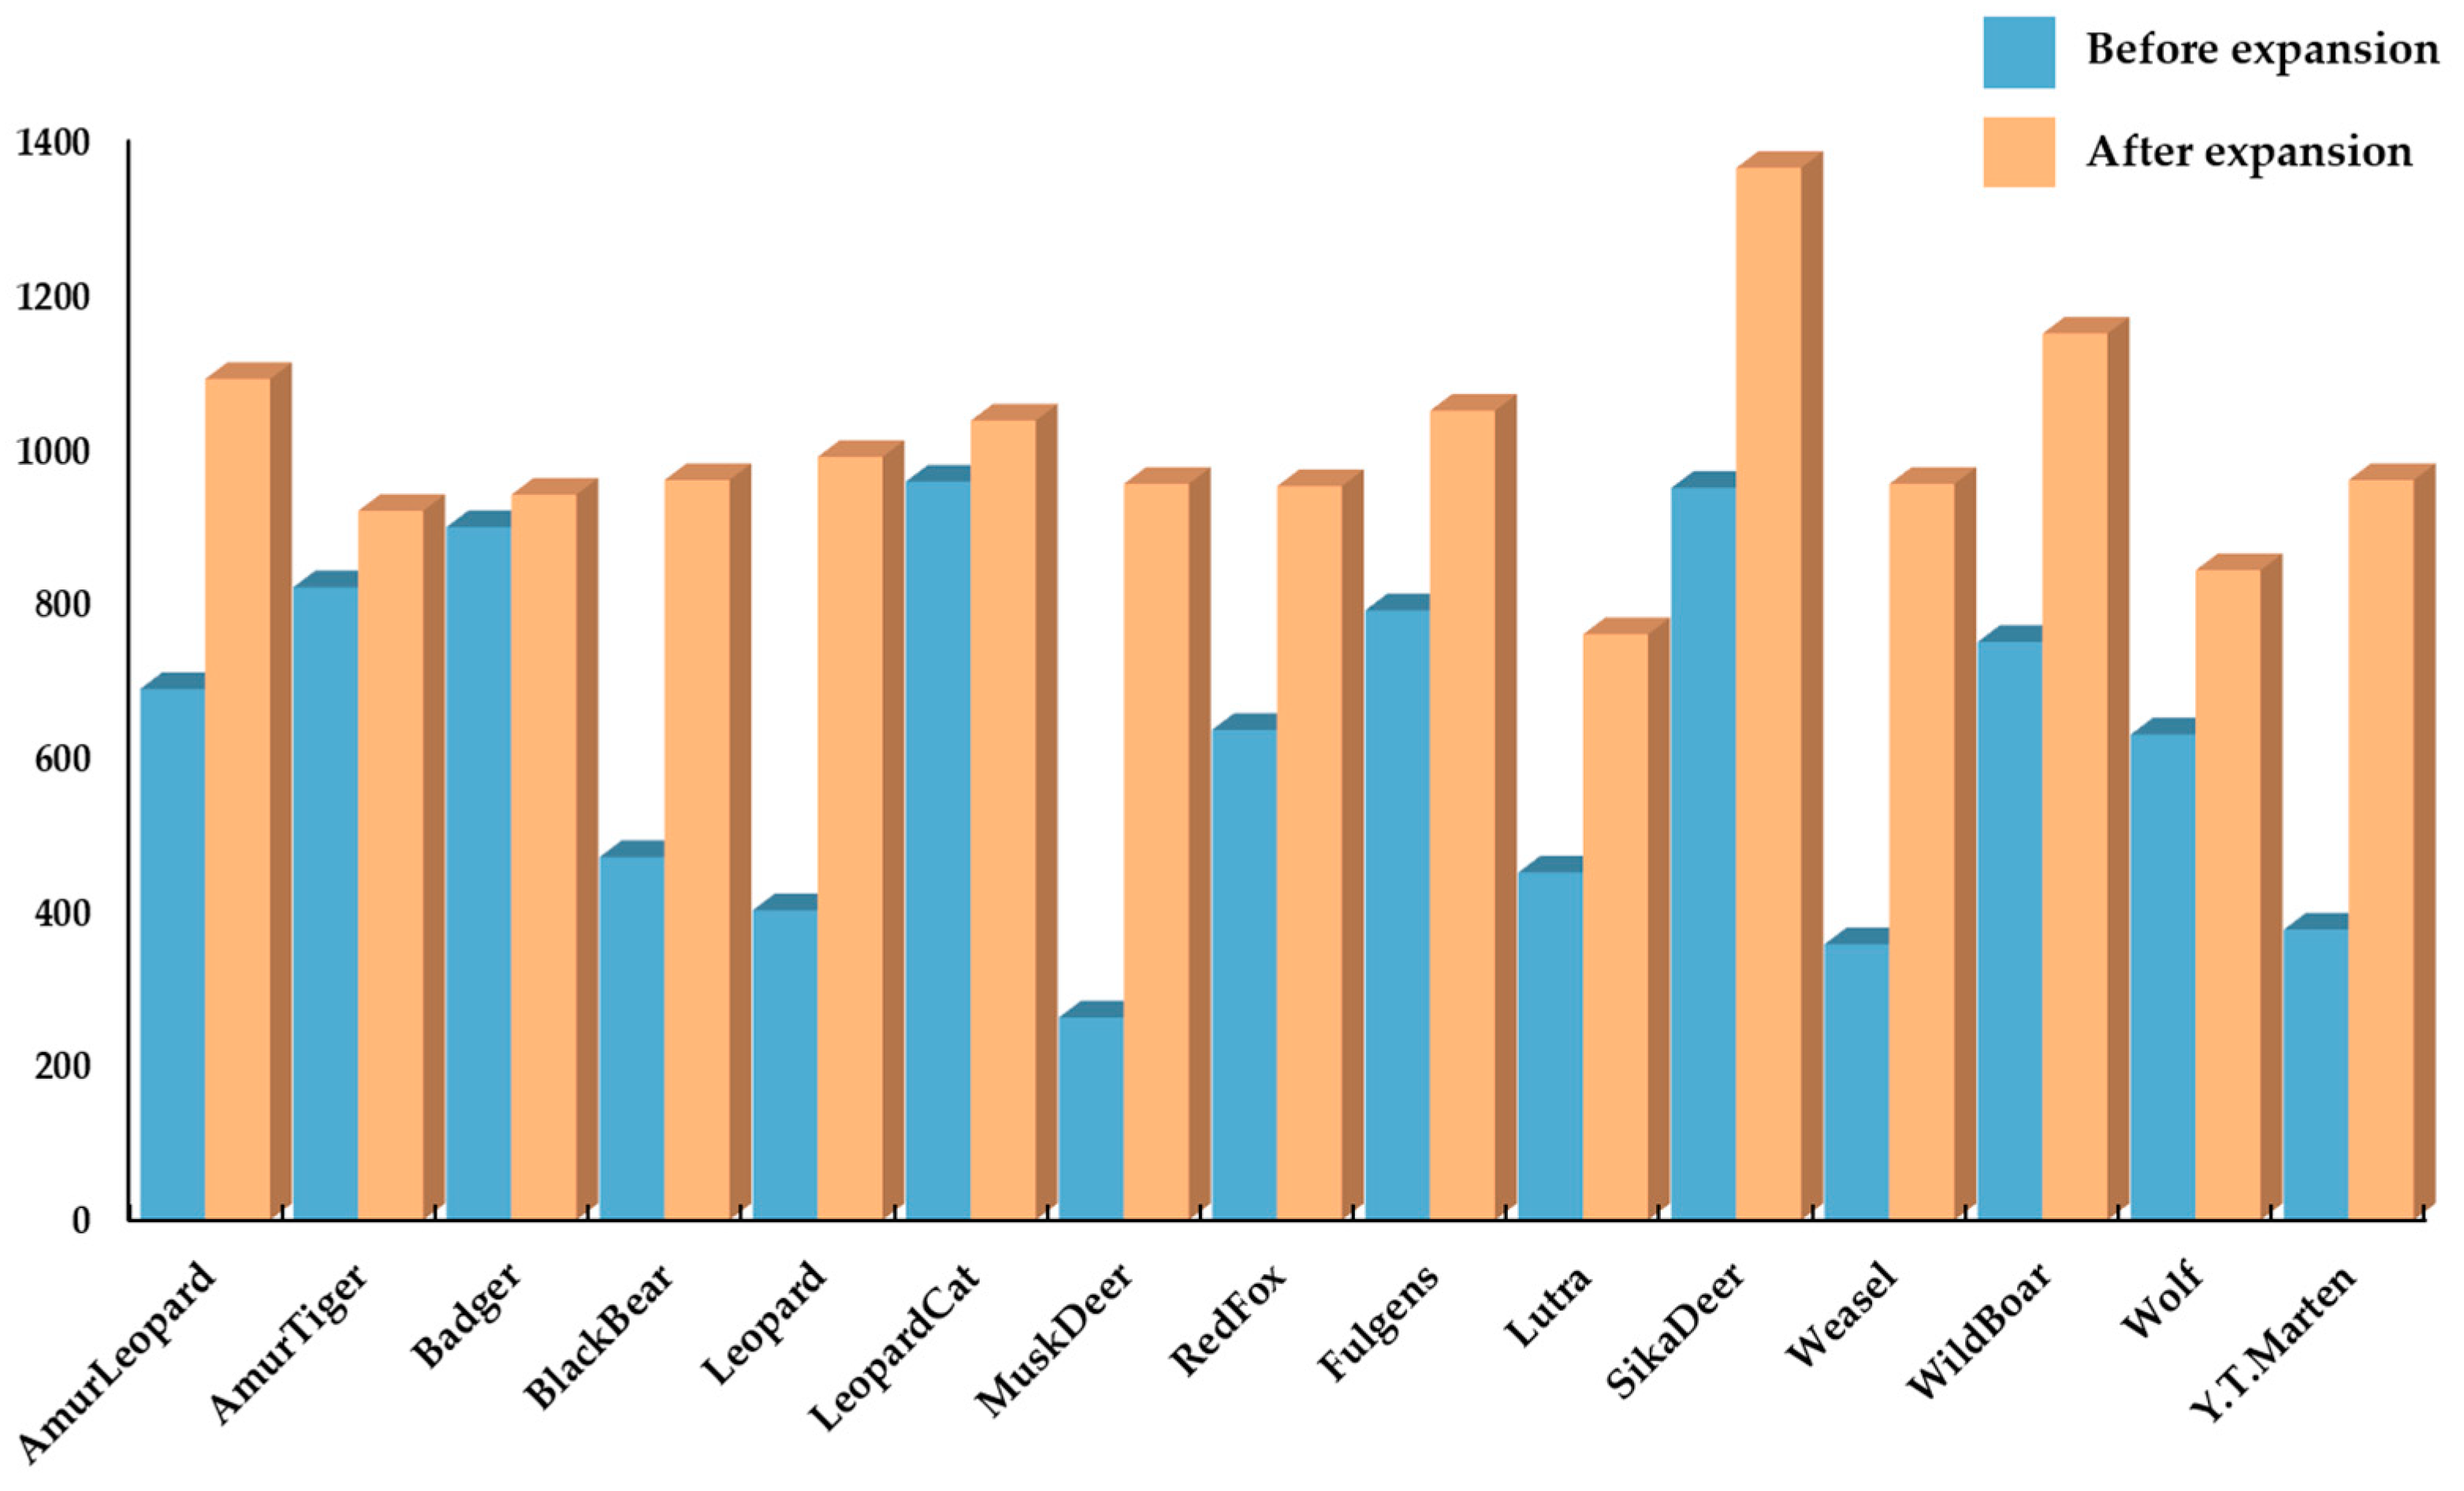
39]. This helps in expanding the size of the training set. Additionally, it reduces the model’s reliance on specific attributes, thus improving the model’s ability to generalize. A comparison of the number of images for each type of animal before and after data expansion and enhancement is shown in Figure 5. It can be observed that the amount of image data for each type of wildlife is well-balanced after the implementation of data expansion and enhancement techniques, thereby meeting the dataset quality standards required for model training and validation. To introduce a certain level of error in the image data and also ensure its experimental value, as well as to prevent overfitting to some extent, we applied a suitable amount of Gaussian noise to the obtained image data.
By performing a series of operations, such as data cleaning, data expansion, and data enhancement, on the dataset, we obtained the dataset that was used for model training. Next, we needed to label the dataset. For the annotation process, we utilized the LabelImg (v1.8.2) software to annotate the images with the wildlife category name and the relative position of the wildlife target in each image. Traditional manual annotation methods require significant human and material resources, which is why we adopted active learning methods to accurately annotate 30% of the dataset manually. Additionally, we employed the “Human-in-the-loop” interactive framework to automatically annotate the remaining data [40], effectively reducing the amount of manual data annotation required.
After labeling all of the image data, we divided the dataset into a training set and a test set with a 7:3 ratio. Additionally, we included a portion of video data that were not part of the dataset as the model validation data. This allowed us to effectively compare the performance of different models.

2.4. WL-YOLO

To address the practical challenges associated with detecting wildlife targets in complex field environments, this study suggests leveraging YOLOv5s for rapid target detection. The focus is on improving accuracy and reducing the likelihood of omission and misdetection of wildlife targets in challenging environments, ultimately introducing a new method and structure for enhanced detection capabilities. In this work, we have designed the WL-YOLO model for detecting and recognizing wildlife in complex forest environments. The WL-YOLO model has been developed using the YOLOv5s model as a foundation but with specific modifications to suit our needs.
The architecture of the YOLOv5s model is depicted in Figure 6. The YOLOv5s model network structure mainly consists of input, neck, backbone, and head modules [41]. The Input module primarily utilizes the mosaic method to enhance the input data. The mosaic method generates new images by randomly cropping, combining, splicing, and scaling the existing images. This data enhancement technique improves the model’s generalization ability and overall performance [32]. The backbone is the core structure of the YOLOv5 model. It consists of Focus, Conv, C3, and SPP, and is responsible for extracting features from multi-scale images. Compared to other models, the C3 module effectively reduces the repetition of gradient information during network information transmission [42]. By adjusting the number and depth of C3 modules, the total number of parameters in the model can be controlled.
The neck network is primarily structured by SPPF and PANet. It consists of a series of feature layers that fuse image features. By combining feature maps of various sizes generated by the backbone network, the neck network obtains more contextual information. This process increases the sensory field of the model and reduces information loss.
The head serves as the terminal of the model and is responsible for detecting images with different scales. It corresponds to the three different sizes of feature maps in the neck network.
The difference between YOLOv5s and several other derived models lies in the fact that depth_multiple and width_multiple are unique to YOLOv5s and do not include repetitive modules [43]. These exclusive features contribute to its faster computation and more efficient models. Additionally, the YOLOv5s model incorporates the innovative SPP (Spatial Pyramid) Pooling module into its backbone [44]. This module effectively combines feature maps of various sizes to create a comprehensive global feature description. As a result, the model becomes highly resilient to challenges such as small objects, occlusion, and changes in illumination. These characteristics make YOLOv5s an ideal choice for wildlife identification tasks, particularly in intricate forest environments. In summary, the YOLOv5s model is highly suitable for rapidly monitoring and identifying wildlife targets in complex forest environments.
As the number of parameters in YOLOv5’s model decreases, the low-level features are less mapped and the receptive field is smaller. This leads to a reduction in its deep feature extraction ability. Additionally, due to the complexity of the wildlife target environment, the model struggles to suppress invalid information such as background effectively. As a result, YOLOv5s model faces challenges in achieving better results in recognition accuracy. Moreover, YOLOv5s is not a top performer in terms of accuracy among the YOLOv5 series models. The gap becomes even more evident when compared to the two-stage model with higher detection accuracy. To address these limitations, we propose the WL-YOLO model, which enhances the model in three key areas: backbone, neck, and head:
(1)
To minimize redundancy in model parameters and enhance computational speed, we have opted to utilize the lightweight network MobileNetV3 for the backbone structure instead of the base network’s combination of Conv and C3 modules.
(2)
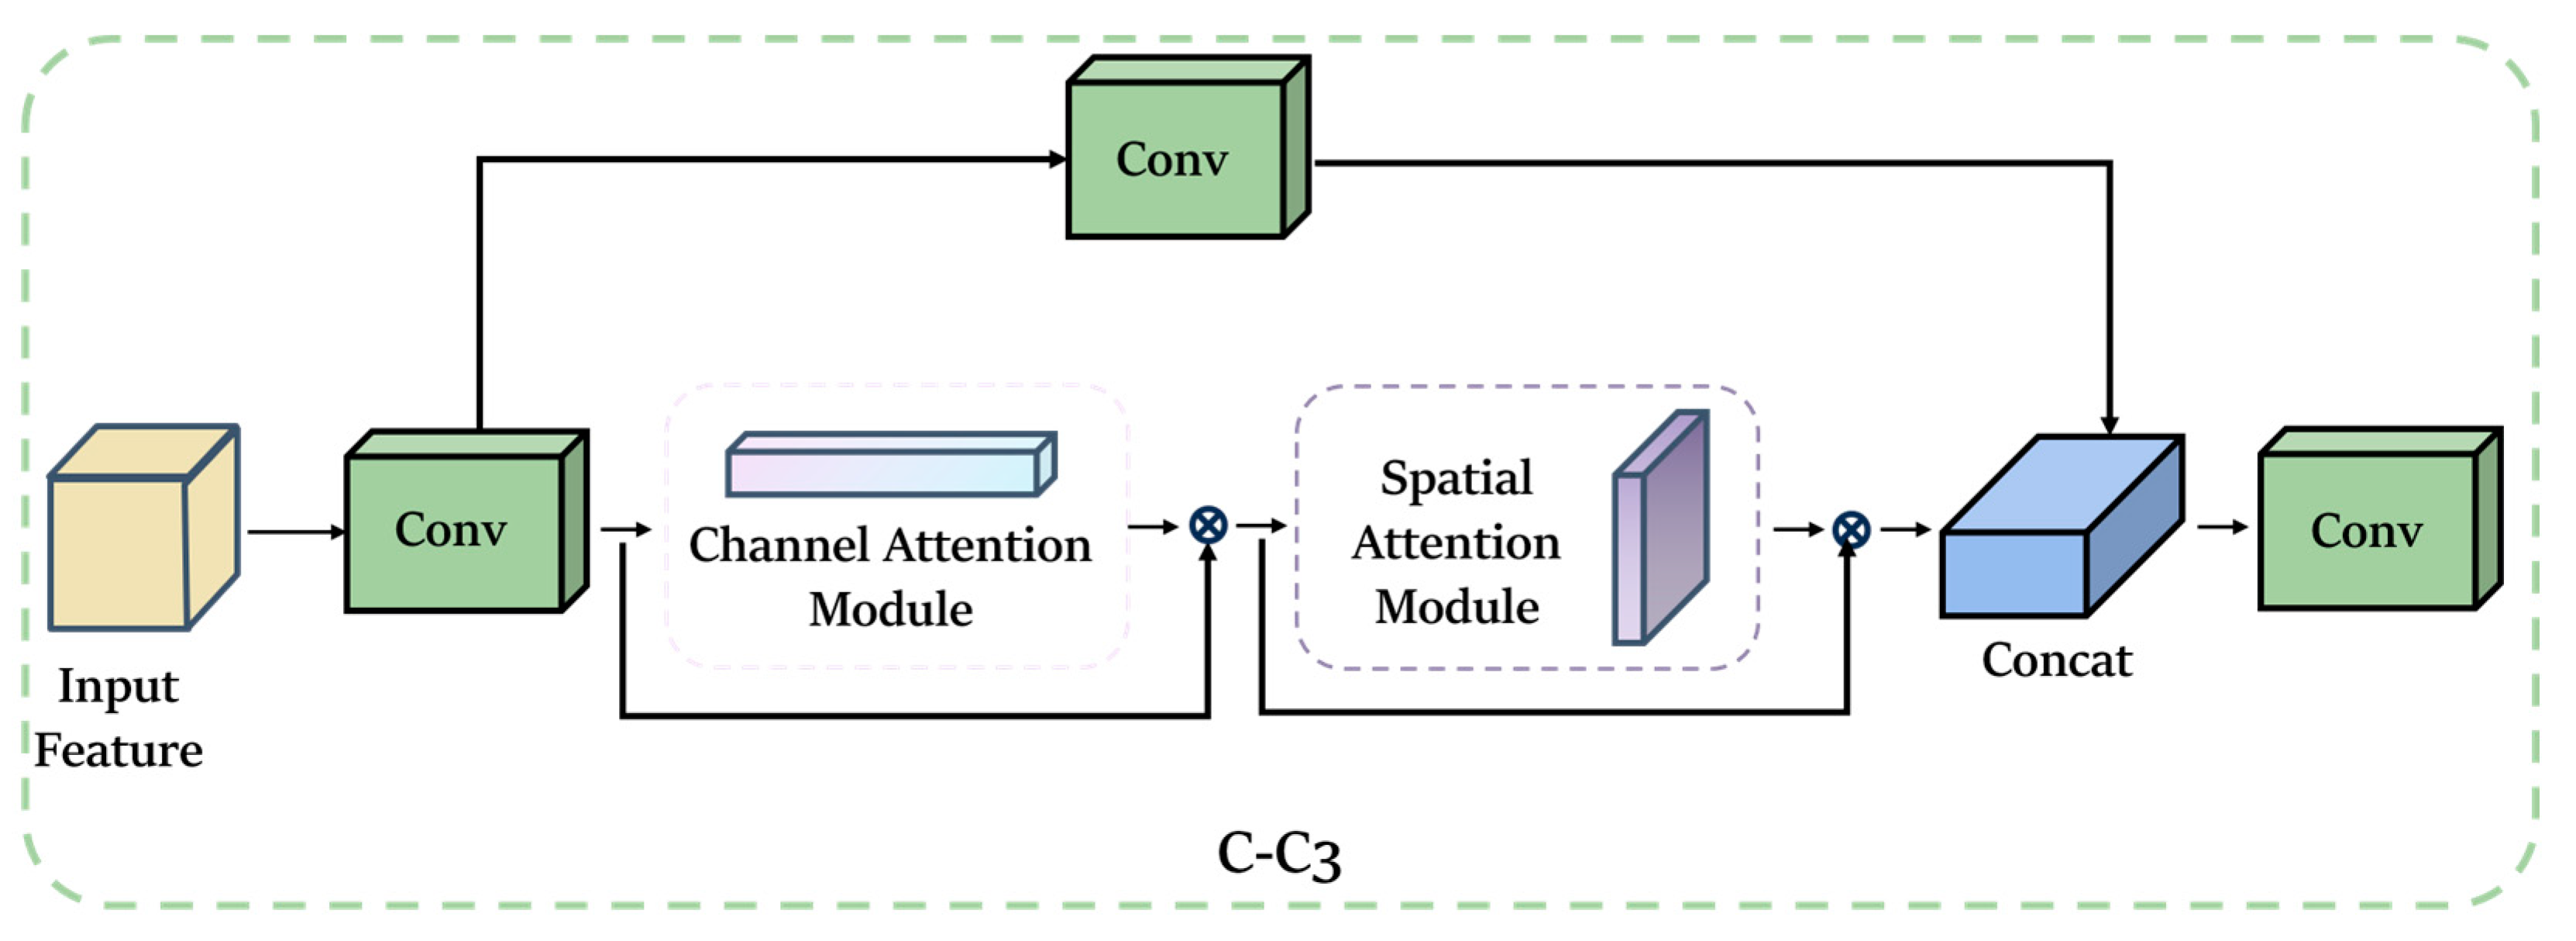
In order to enhance the model’s ability to focus on small targets in complex environments and effectively ignore complex backgrounds, we have designed a novel C-C3 module. This module integrates an attention mechanism into the neck component of the model, replacing the original C3 module.
Based on our enhanced model, we offer a real-time detection algorithm that is specifically designed for wildlife in intricate forest environments. This algorithm aims to greatly enhance detection accuracy while also ensuring efficiency in detection.
In the backbone structure design of WL-YOLO, we introduced a lightweight network called MobileNetV3 to address the issues of excessive model parameters in YOLOv5s, which leads to slow recognition, high complexity, and poor real-time performance. The MobileNet family of networks is a convolutional network proposed by the Google team for mobile devices [45]. It is designed to address the limitations of both memory and arithmetic power. MobileNet suggests the utilization of deeply separable convolutional layers instead of traditional convolutional layers. This approach helps in reducing computational requirements and the model size. MobileNetV3 combines the deeply separable convolution from MobileNetV1 with the inverted residual structure featuring linear bottlenecks from MobileNetV2 [46]. It also incorporates a network search algorithm with a superimposed SE Attention Mechanism module and a hard-Swish activation function. This combination aims to decrease computational complexity while maintaining model accuracy intact.
We employed the deeply separable convolutional network in the MobileNetV3 model to minimize redundancy in the feature maps generated by the backbone structure during feature extraction. Similar to traditional convolution operations, the Depth Separable Convolution breaks down a complete convolution operation into two components: Depthwise Convolution and Pointwise Convolution [47].
Each convolution kernel of Depthwise Convolution is responsible for one channel of the input data, which undergoes the first convolution operation. Unlike conventional convolution, Depthwise Convolution is performed entirely on the two-dimensional plane. The number of convolution kernels is exactly the same as the number of channels in the previous layer [48], resulting in N feature maps produced from an N-channel image. However, this operation method does not effectively utilize the feature information from different channels at the same spatial location due to the independent convolution operation of each channel. Therefore, it is necessary to generate new feature maps by combining the N feature maps using Pointwise Convolution. The operation process is illustrated in Figure 7. Pointwise Convolution is mainly responsible for the weighted combination of feature maps generated by Depthwise Convolution in the depth direction [49]. The size of the convolution kernel is 1 × 1 × N, the number of convolution kernels determines the number of output feature maps, and its computational process is shown in Figure 7. When the size of the input feature map is Dk × Dk × M, the size of the convolution kernel is DF × DF × M, and the number of convolution kernels is N. When a convolution operation is performed for each point in the corresponding feature map spatial location, a single convolution requires a total of Dk × Dk × DF × DF × M operations because the feature map spatial dimension contains a total of Dk × Dk points, and the amount of computation to perform a convolution operation on each point is the same as the size of the convolution kernel, i.e., DF × DF × M. Therefore, the total amount of computation, C1, is shown in Formula (1) for the ordinary convolution of N channels:
C 1 = D k ×     D k ×     D F ×     D F ×   M ×   N
And for deeply separable convolution, the total computation C2 is:
C D = D k ×     D k ×     D F ×     D F ×   M C P = M ×   N ×     D k ×     D k C 2 = C D + C P = D k ×     D k ×     D F ×     D F × + M ×   N ×     D k ×     D k
Compared to ordinary convolution, the ratio of depth-separable convolution to ordinary convolution is shown in Formula (3). This clearly demonstrates that the computational efficiency of depth-separable convolution is significantly better than that of ordinary convolution:
C 2 C 1 = 1 N + 1 D F 2
However, the high efficiency of deep separable convolution comes at the expense of low accuracy. To address this concern, the squeeze and extraction (SE) attention mechanism module has been introduced into the MobilieNetV3 module. This module comprises a pooling layer, two fully connected layers, and a hard sigmoid activation function [50]. The original model utilizes sigmoid and swish functions as activation functions:
σ x = 1 ( 1 + e x )
s w i s h x = x × σ x
The sigmoid and swish activation functions have been replaced with the hard-sigmoid and hard-swish activation functions, as shown in Formula (8). In comparison to h-swish, h-sigmoid has a lower computational and derivation complexity:
R e L U 6 ( x ) = m i n ( max x , 0 , 6 )
h s i g m o i d = R e L U 6 ( x + 3 ) 6
h s w i s h x = x h s i g m o i d = x R e L U ( x + 3 ) 6
The SE module within the module pools information from the channels, generates weights for each feature channel, and then multiplies these weights with the input feature mapping elements to obtain the final feature mapping [51].
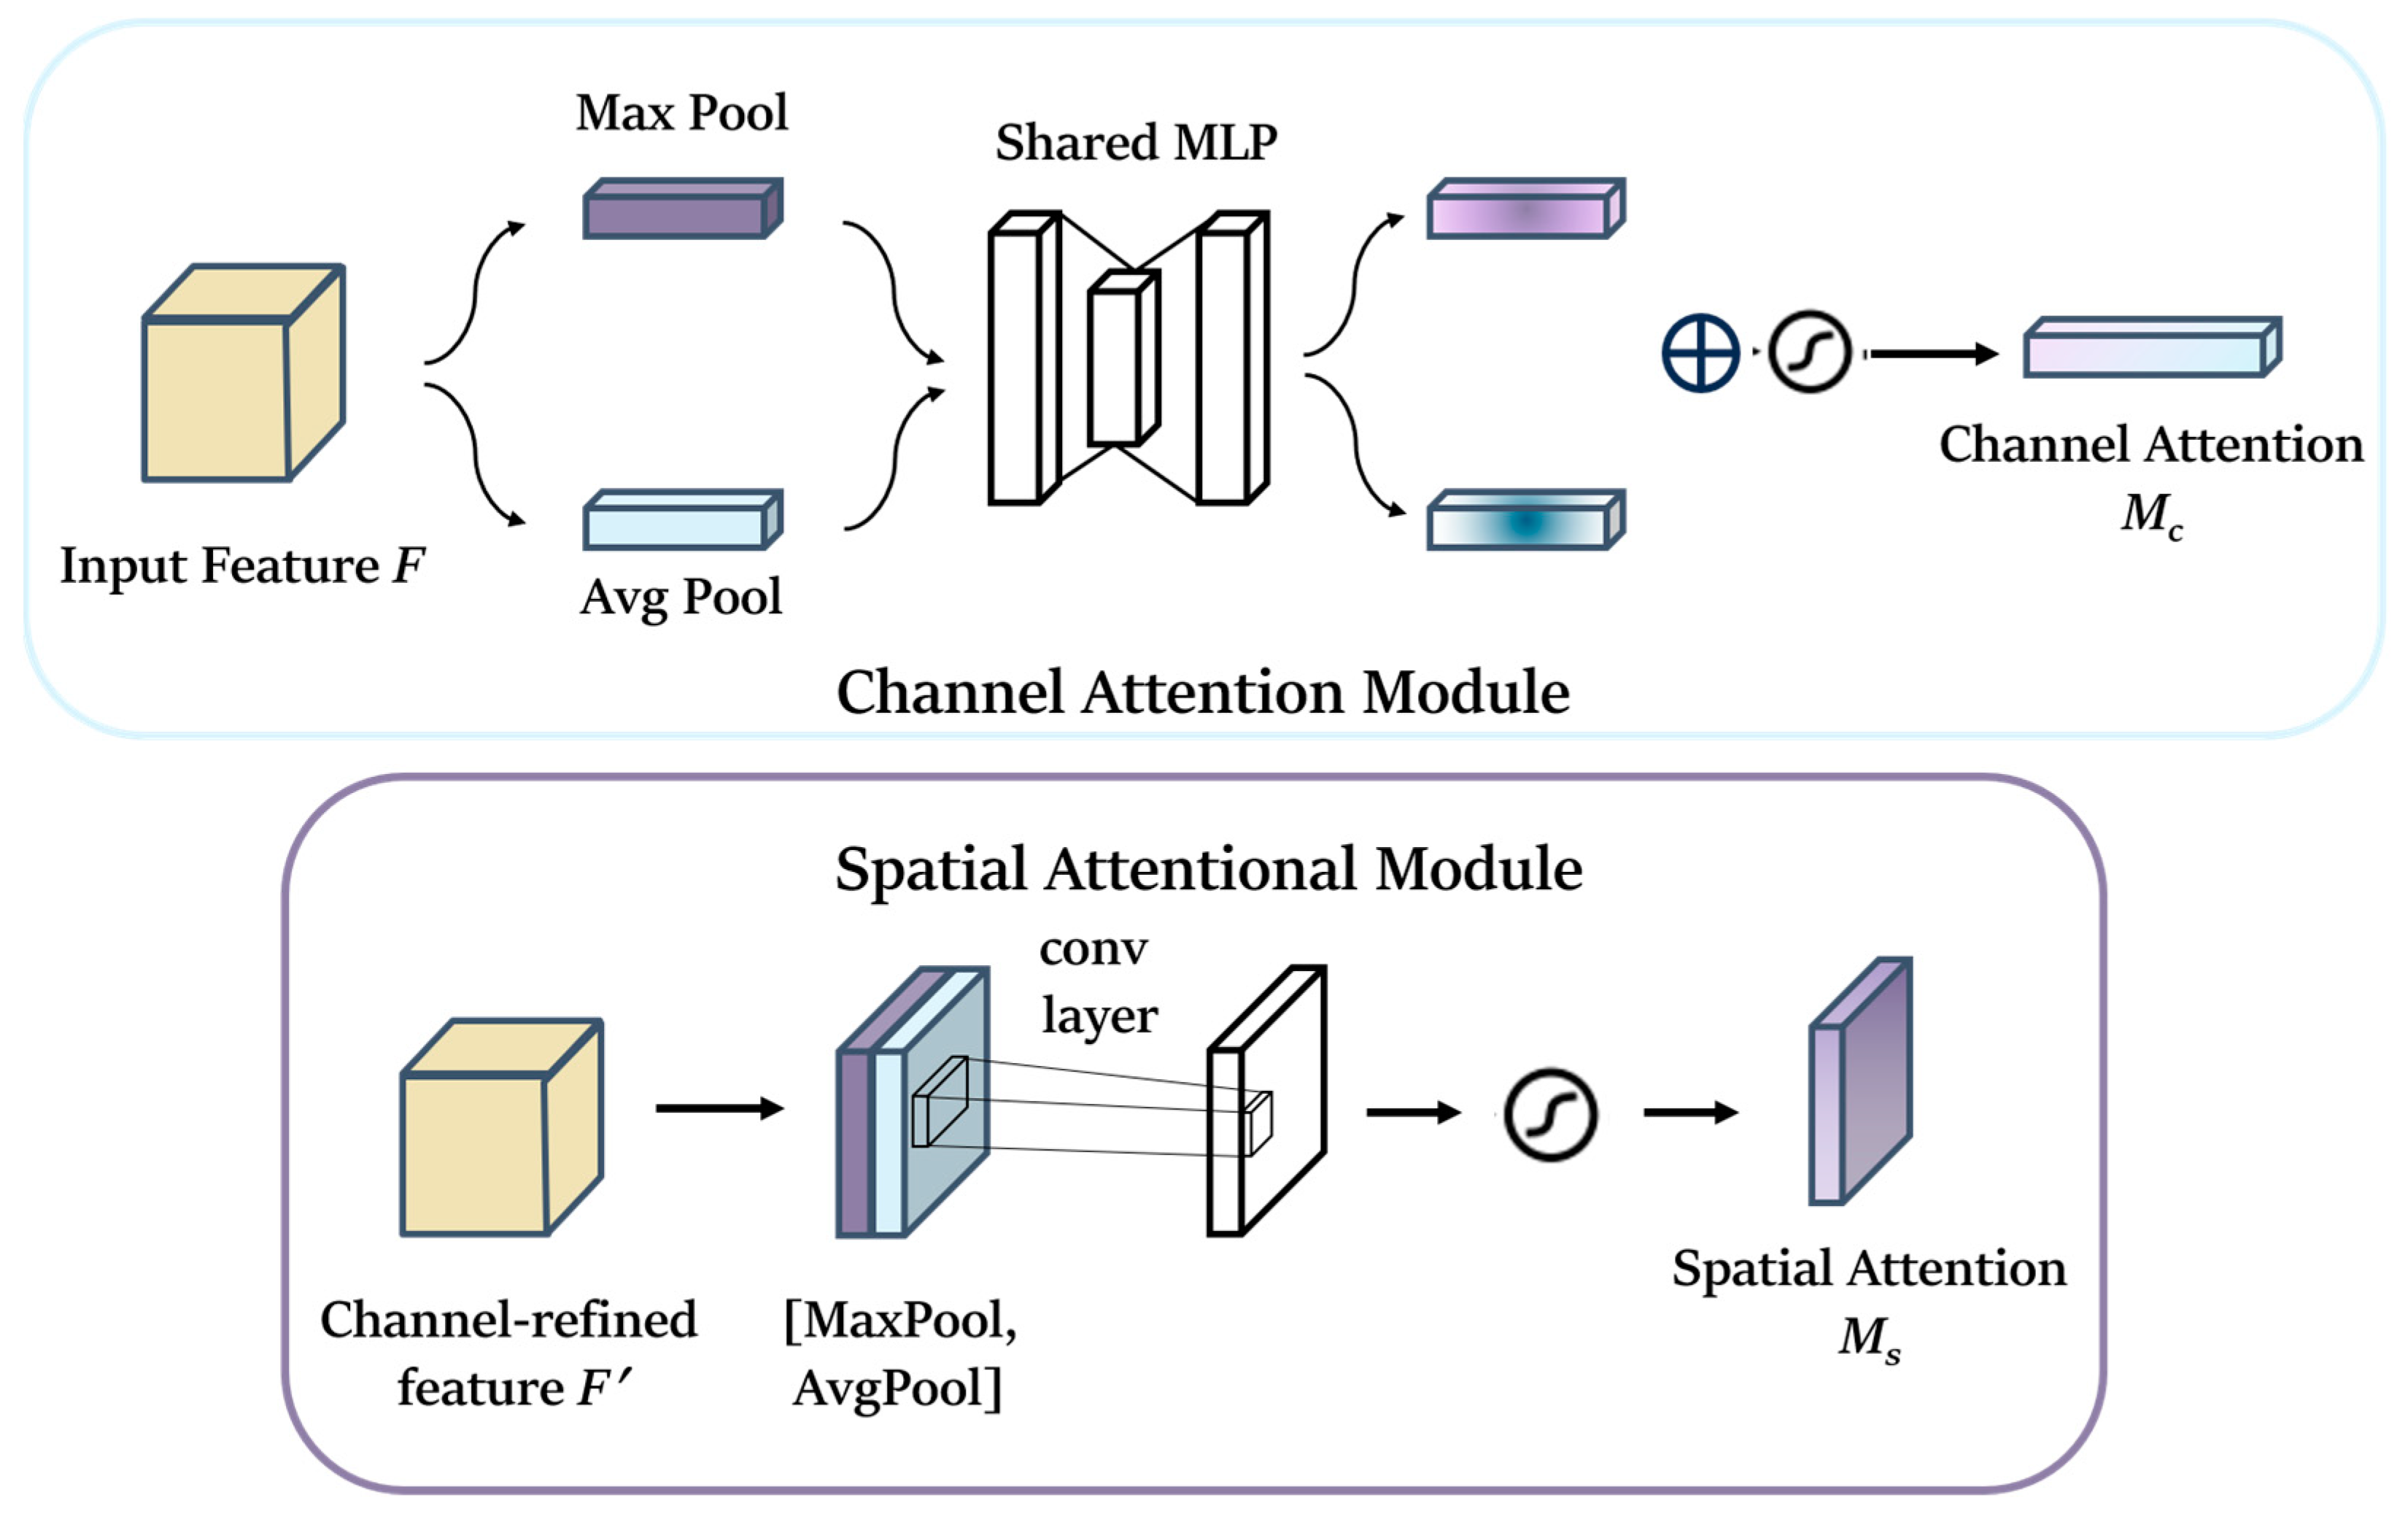
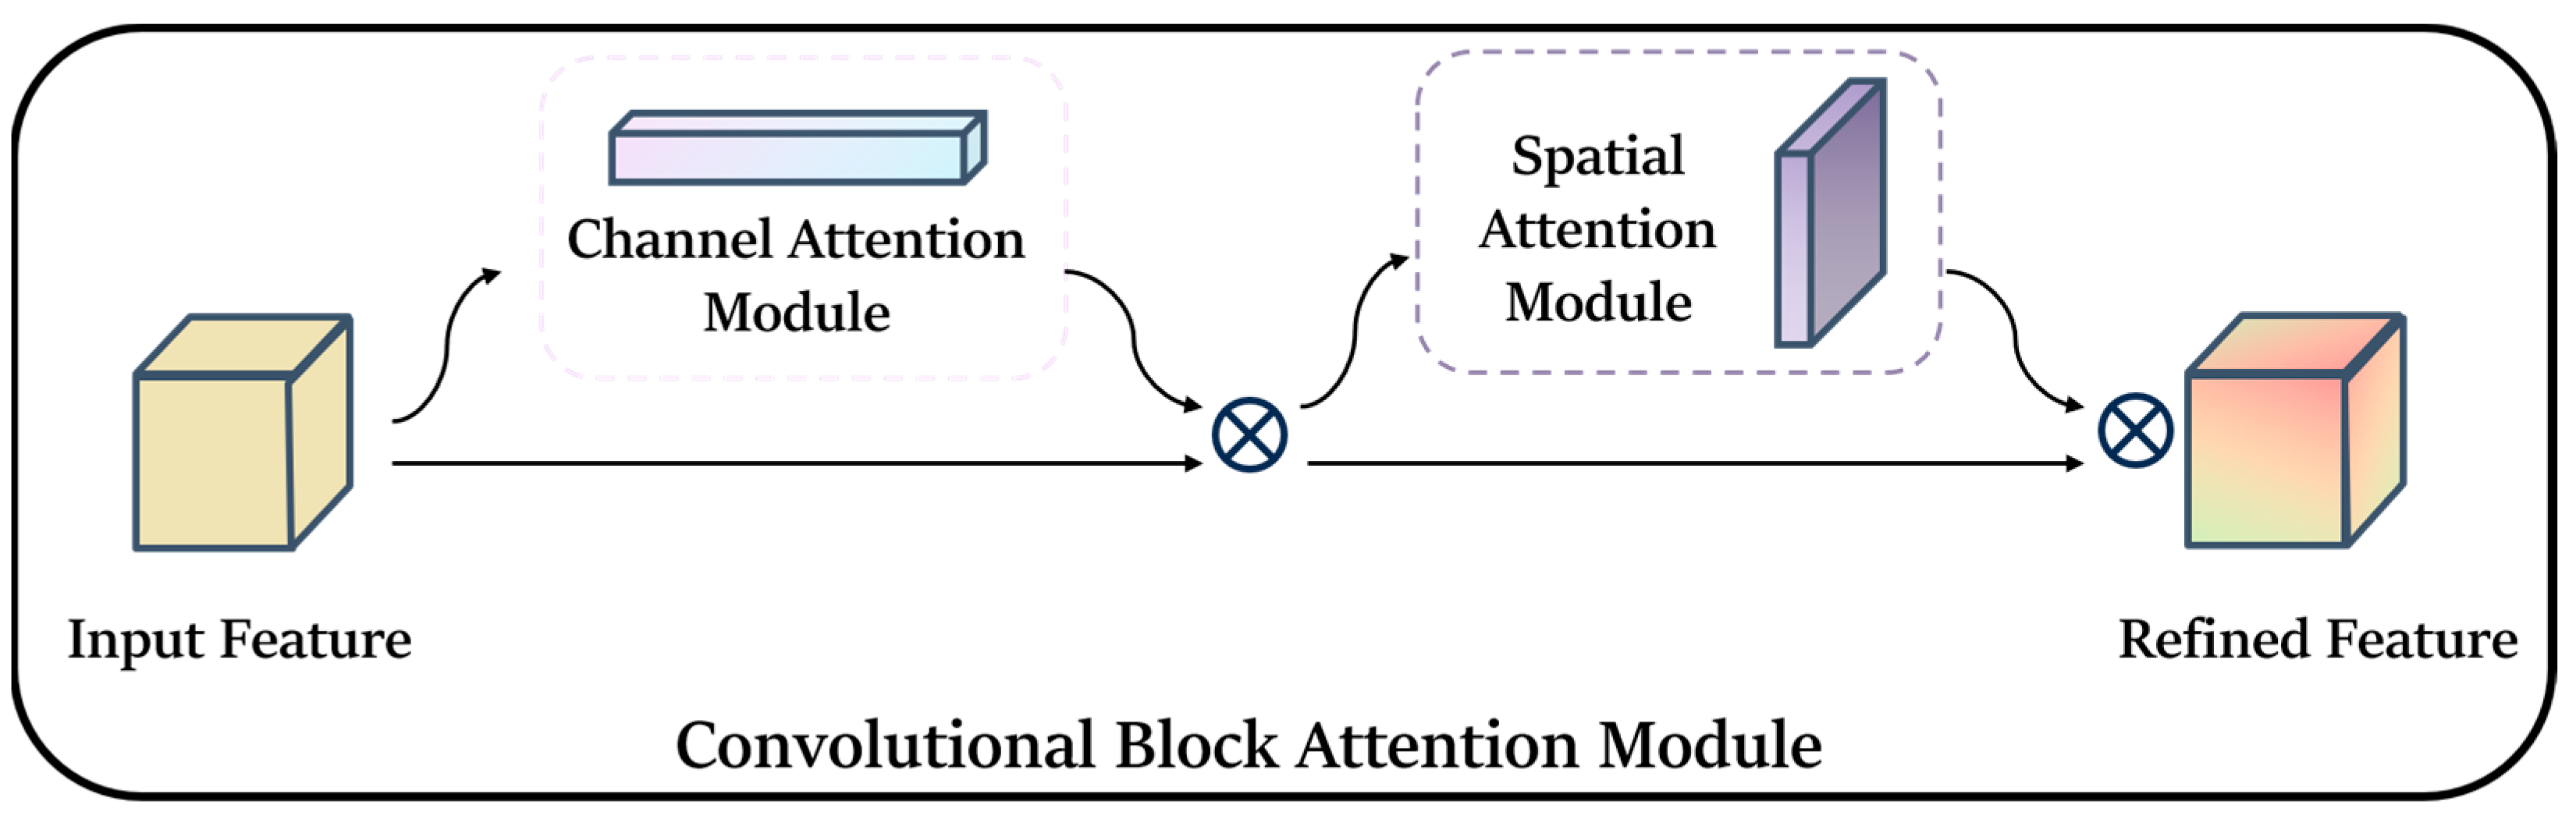
In the backbone, we utilize one convolutional module and eleven MobileNetV3 modules, which significantly decrease the parameter count and computational complexity of the backbone. However, because of the extensive usage of MobileNetV3, although the SE module can help suppress irrelevant features to some extent, it remains ineffective. Therefore, prior to feeding the feature map into the neck part, we have introduced CBAM (Convolution Block Attention Module) to enhance the feature representation of the target amidst complex environments. CBAM is an efficient and lightweight attention mechanism feed-forward convolutional neural network that primarily consists of channel attention and spatial attention machines [52]. Firstly, the global average and global maximum in spatial dimension are performed on the feature layer input from MobileNet. This process obtains a rough global perceptual feature map by utilizing Global Average Pooling and Global Max Pooling [30]. Based on the results of these two Pooling operations, the correlation between multiple channels is constructed using a shared fully connected layer. Finally, the results processed by the shared fully connected layer are fused and transmitted to the sigmoid activation function module [53]. The overall structure of CBAM is shown in Figure 8.
When an intermediate feature mapping map F ϵ RC × H × W exists as an input, CBAM derives a one-dimensional channel attention map Mc ϵ RC × 1 × 1 and a two-dimensional spatial attention map Ms ϵ R1 × H × W according to the sequence, as shown in the two feature maps in the above figure, and the whole process can be summarized as Formula (9):
F = M C F F F = M S F F
where ⊗ denotes the product of elements, i.e., the process of multiplying the corresponding elements of two matrices to obtain a new matrix, in which the attention values are propagated, with the values of the channel attention being propagated along the spatial dimension, and the values of the spatial attention being propagated along the channel dimension, with F′ representing the final input.
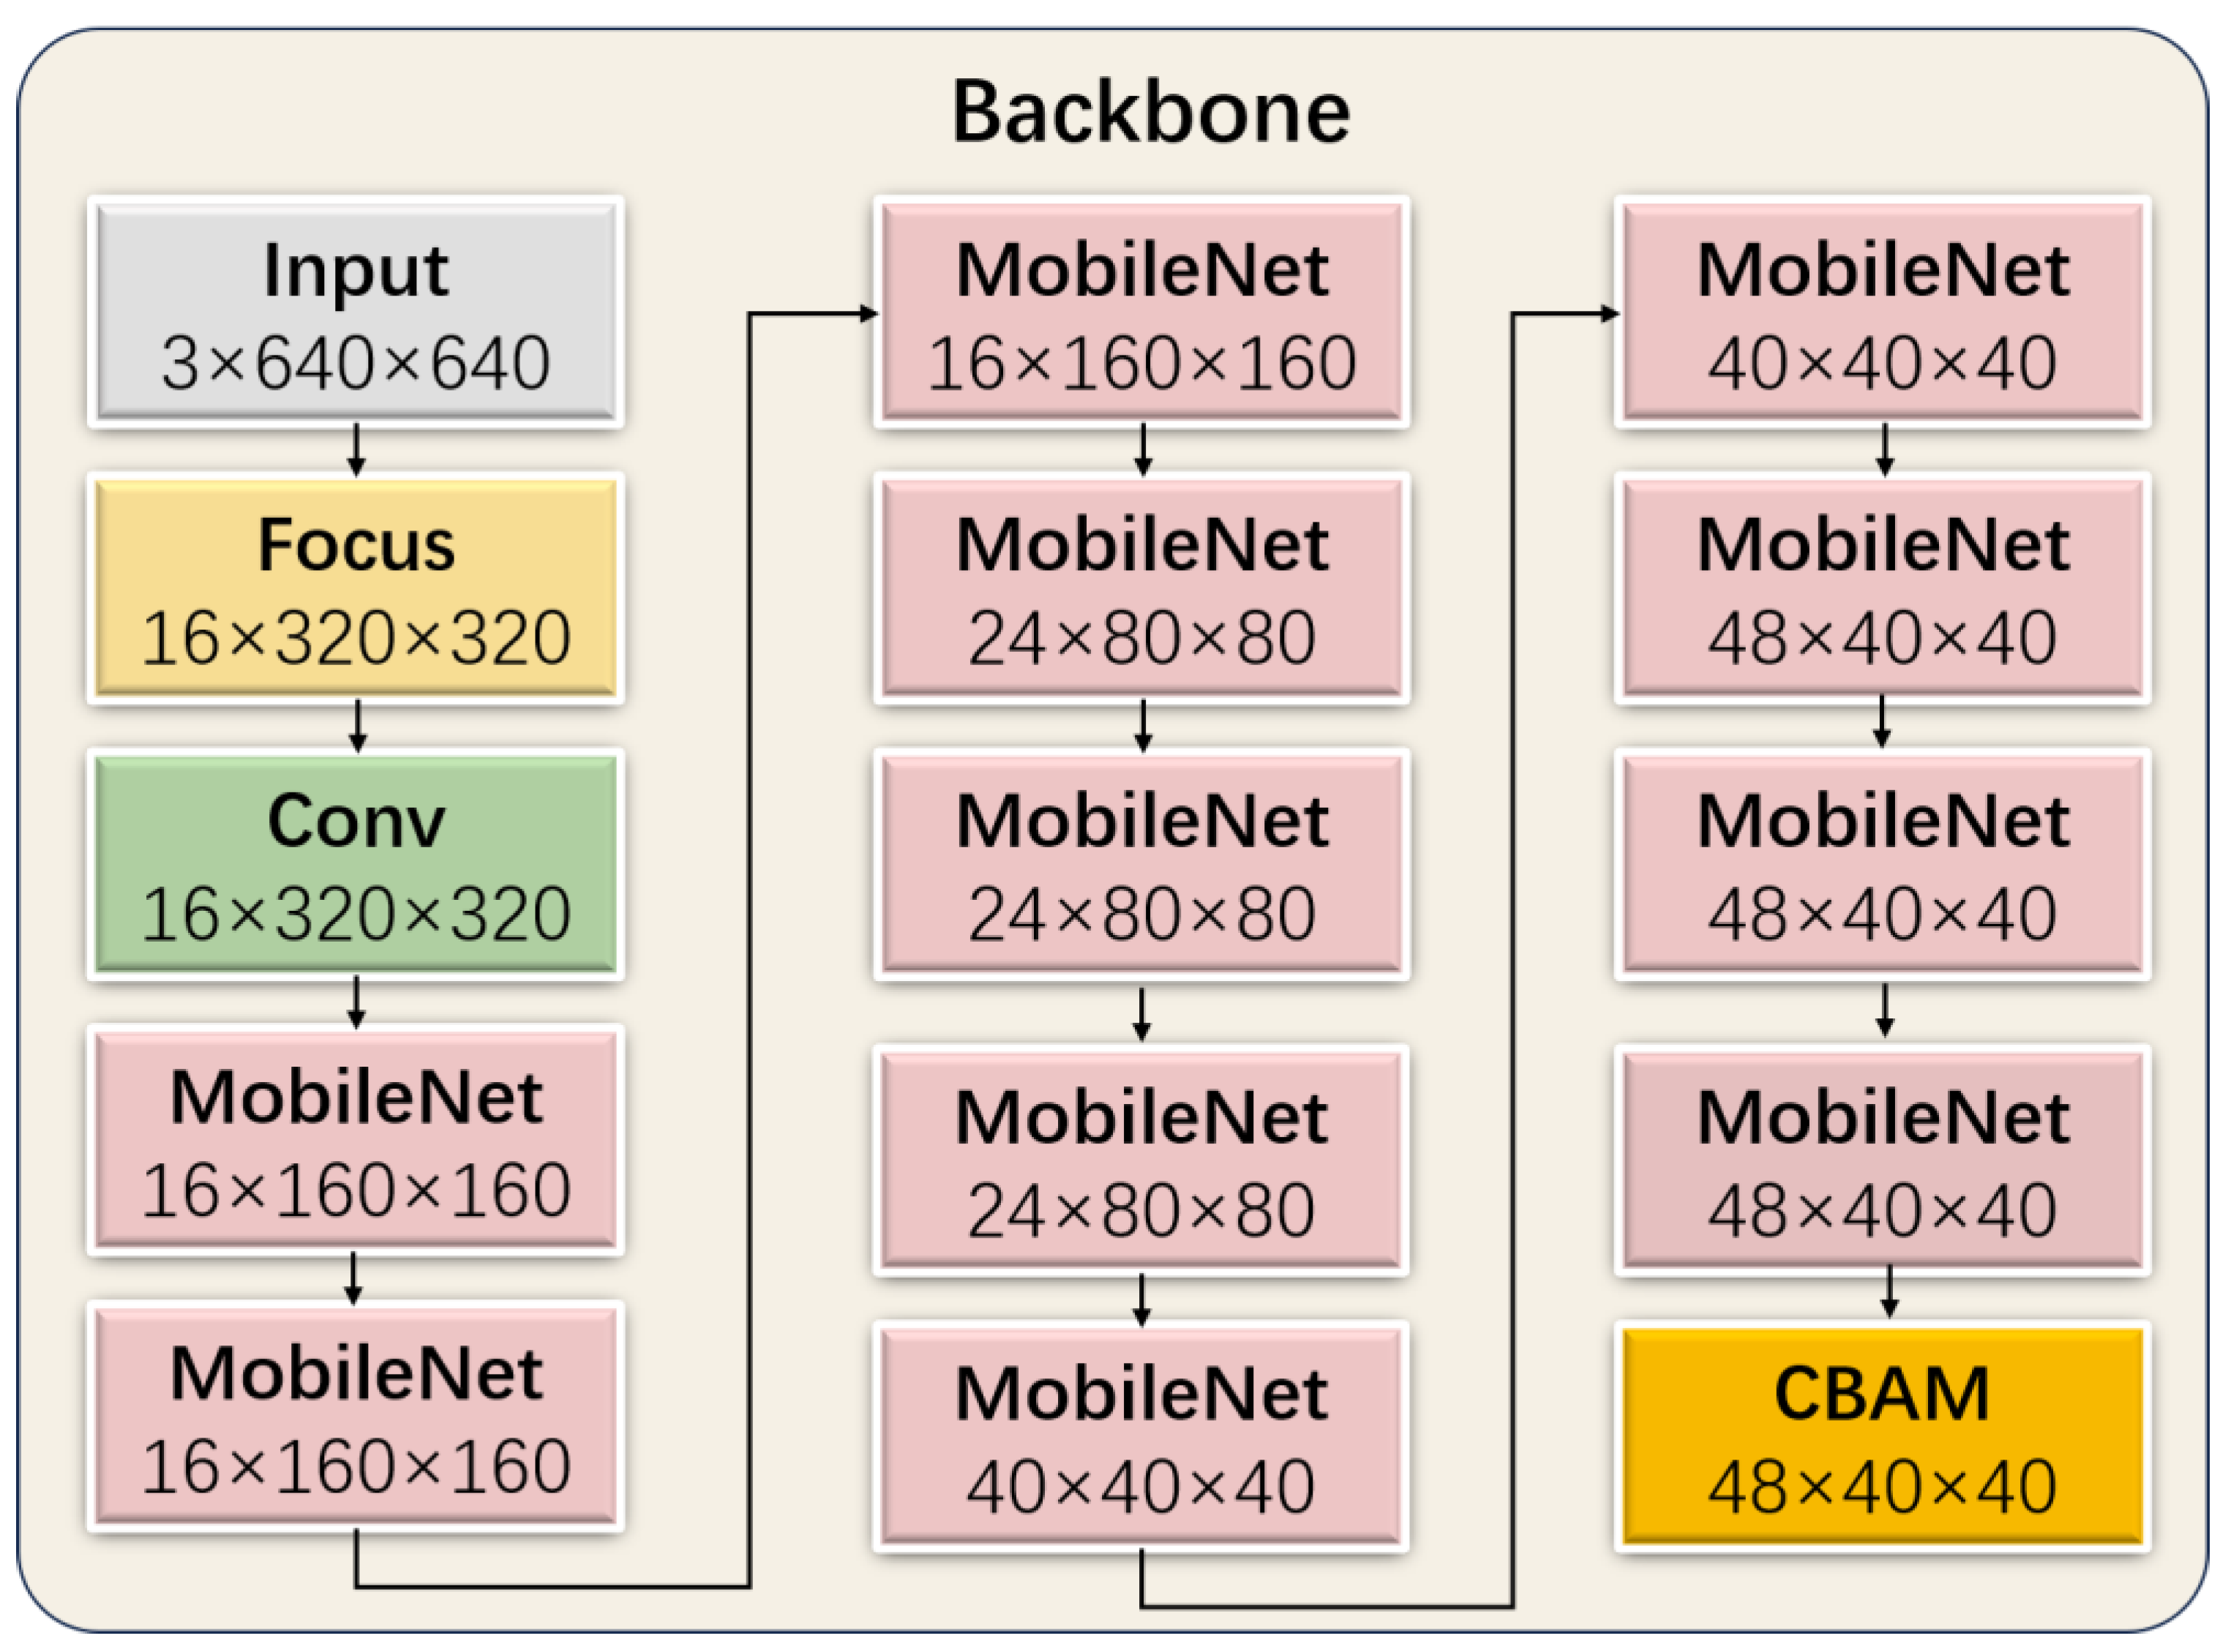
In the backbone module of WL-YOLO, we utilize the MobileNet module and convolution module to enhance the backbone module. Additionally, we employ CBAM to significantly decrease the number of parameters without compromising accuracy. By incorporating CBAM at the end of the backbone part, all of the generated feature maps are passed to CBAM, granting CBAM a global field of view. The structure of the backbone is depicted in Figure 9.
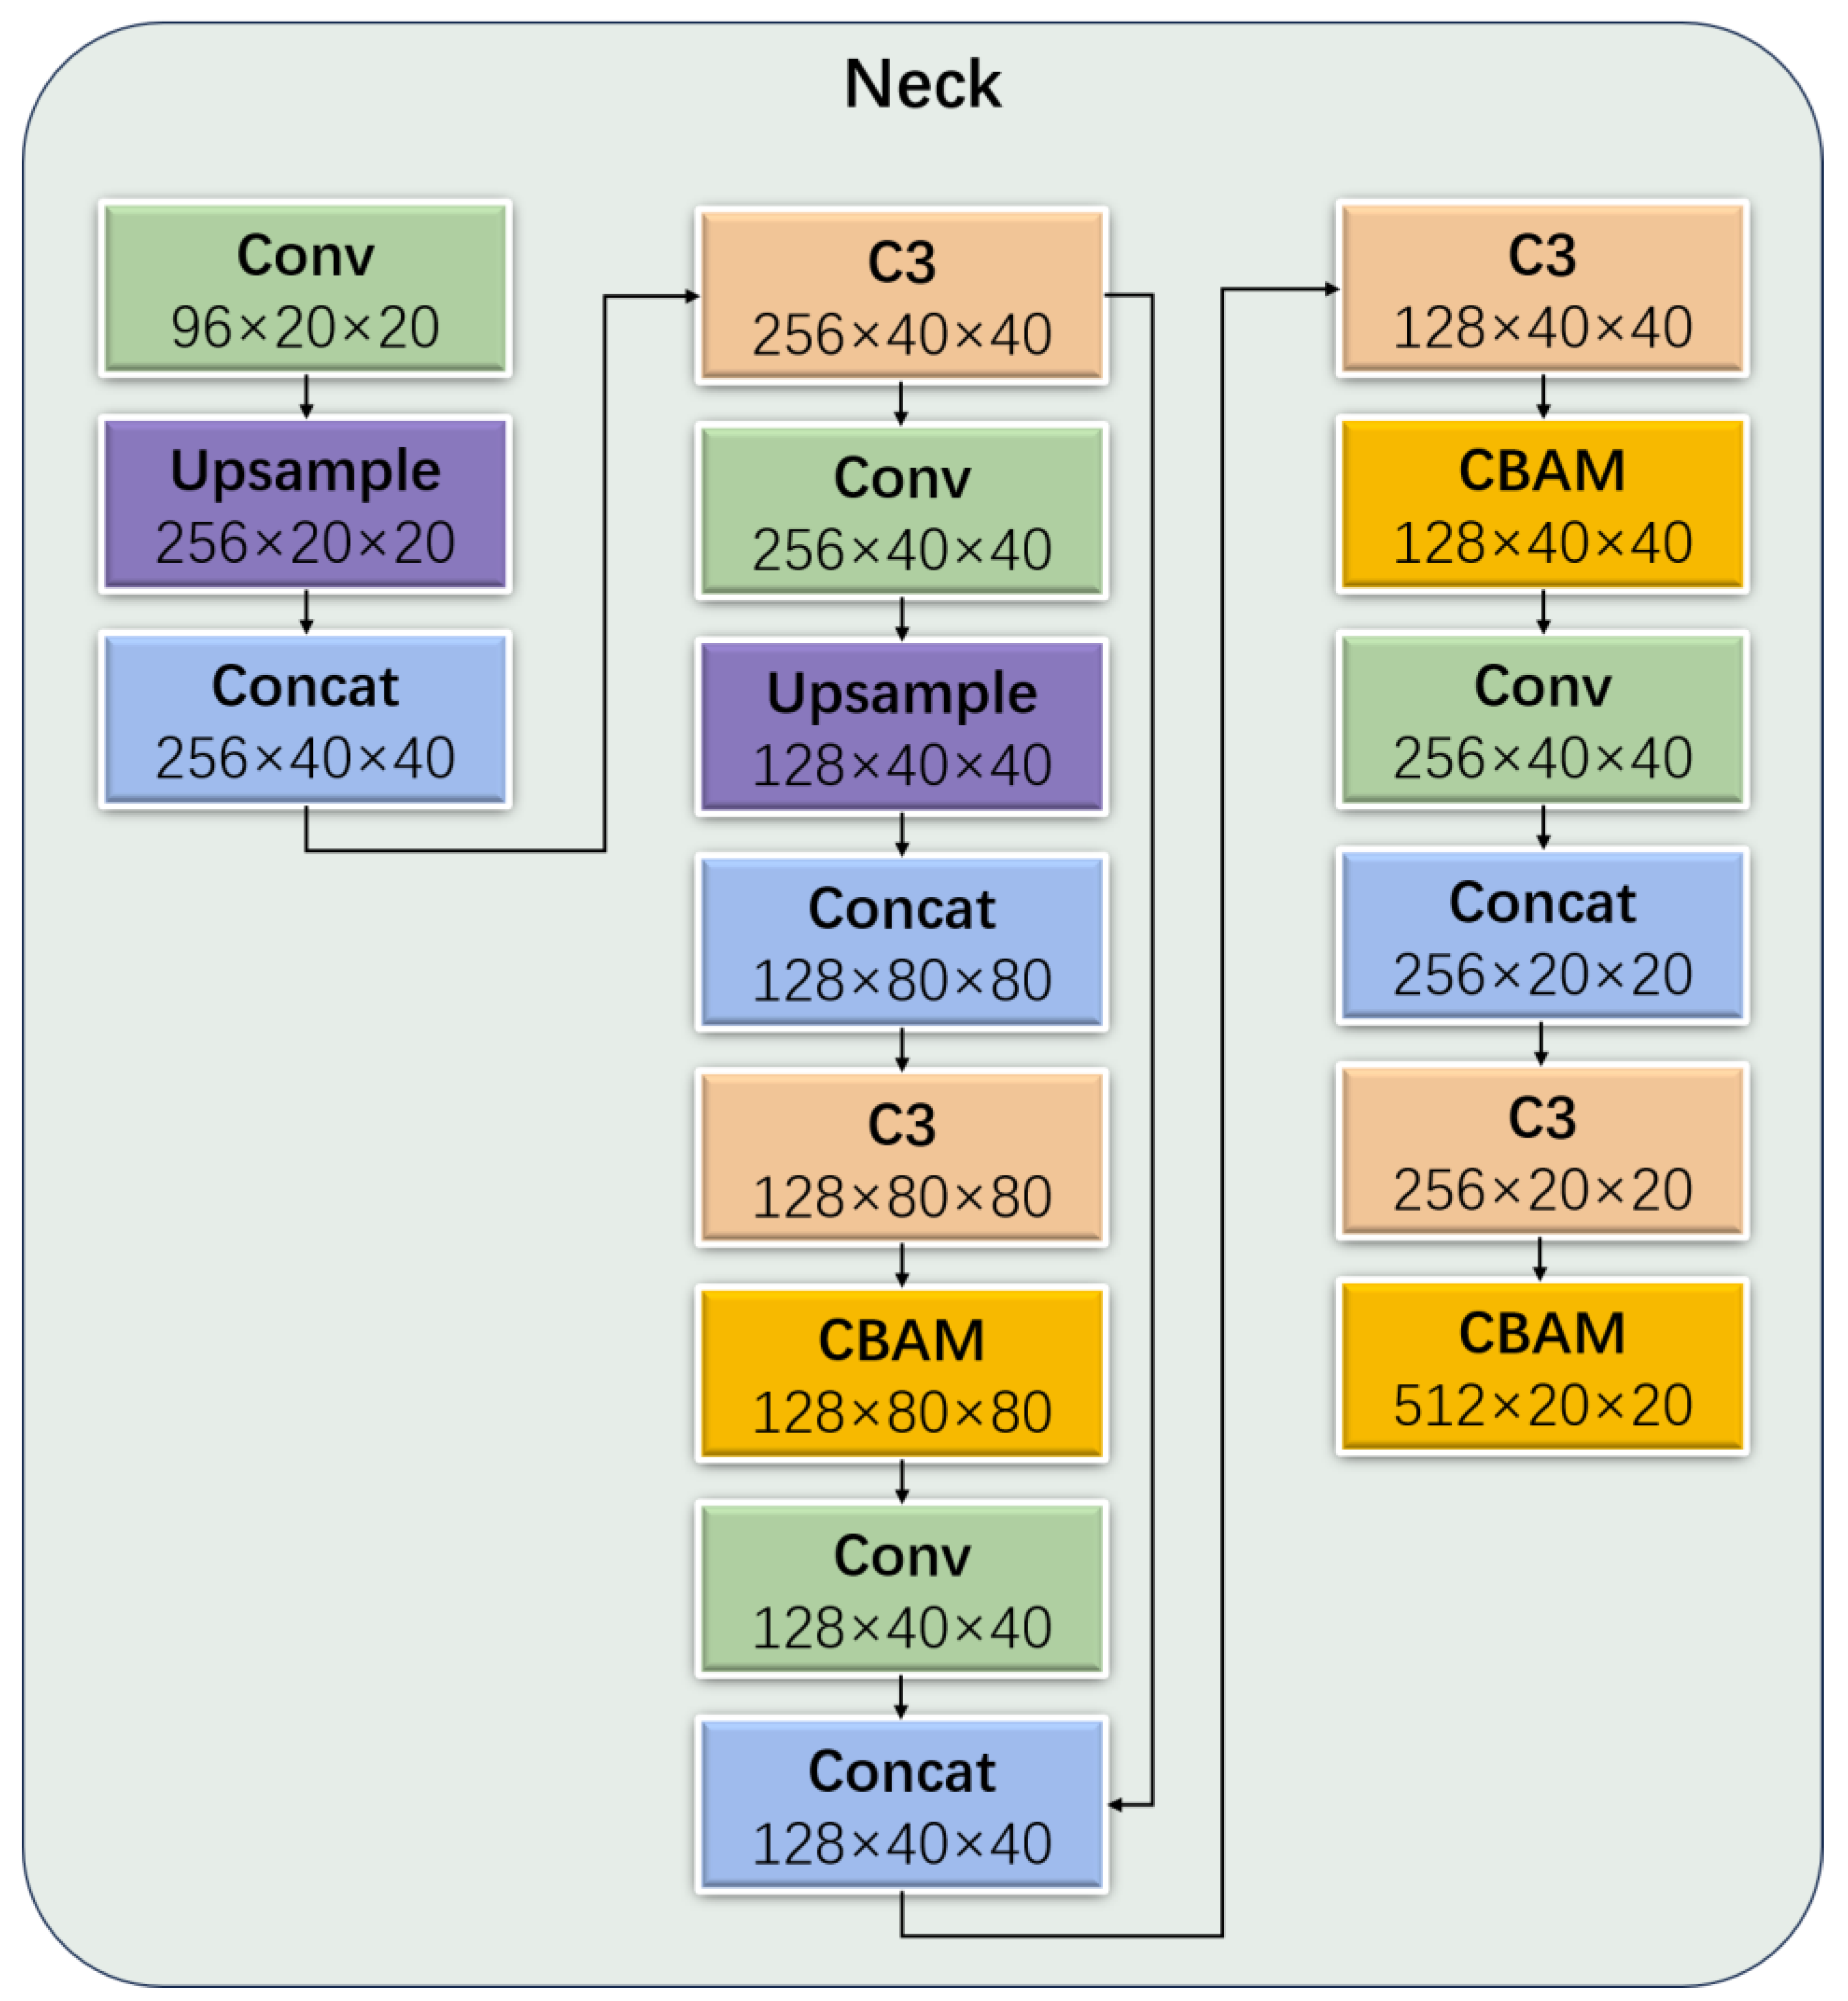
Similar to the backbone module, we have reconstructed the feature extraction unit in the neck part of WL-YOLO. We have incorporated the CBAM attention mechanism with the objective of achieving attentional learning at each layer of the feature map as it passes through the neck part. This allows the attention mechanism to focus on each local feature. The overall structure of the neck network is illustrated in Figure 10.
The neck part of the native model utilizes the C3 module to reduce the computational cost by imposing a bottleneck module after convolution, followed by reorganization. Although this effectively reduces the computational cost, it also results in feature loss. Therefore, in the neck part, we suggest replacing the previous bottleneck module with a C-C3 module based on the attentional mechanism. This modification enhances the attention capability of the mechanism without incurring additional computational costs. The structure of the C-C3 module is depicted in Figure 11.
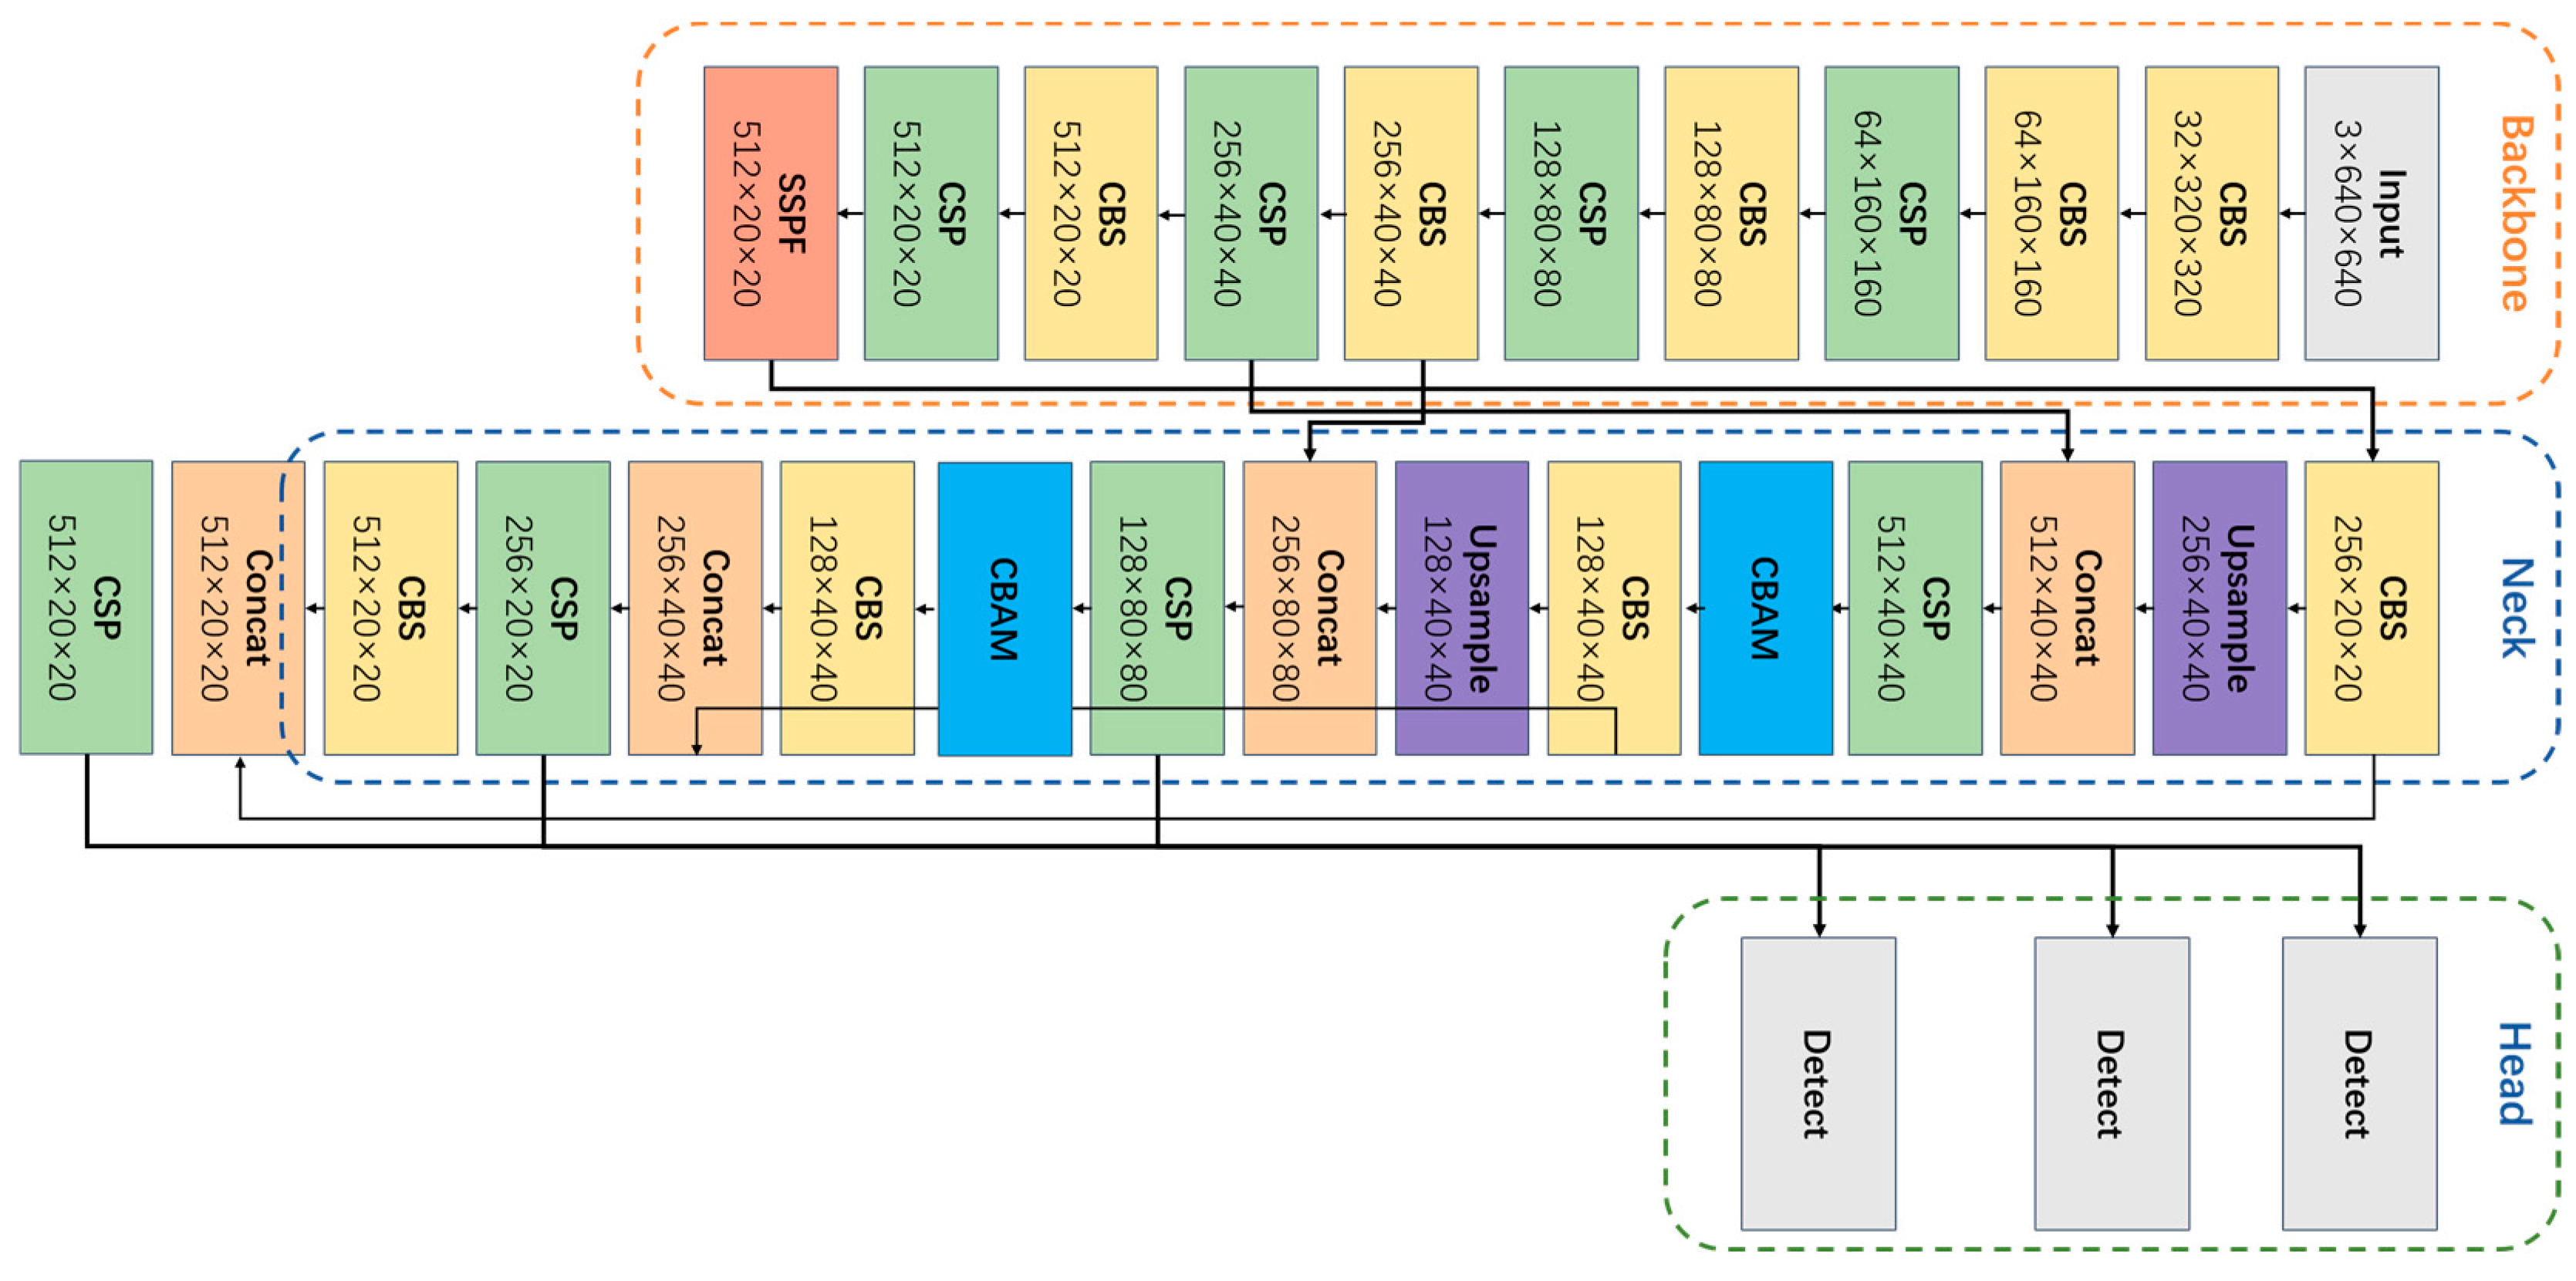
The overall structure of the model studied in this paper is shown in Figure 12. First, we used Mosaic to enhance the input image. Then, the resulting enhanced graph was used as the input to the model. After modeling the image data, the first layer performed a convolution operation using a 6×6 size convolution kernel, which is equivalent to the Focus module of the original model. The output of this layer is then passed to the backbone module. In the backbone module, all of the convolution operations are replaced by DP in the MobileNetV3 module. The neck module is responsible for feature fusion, and it uses the C-C3 module to extract key features. Before the final prediction output image is produced, NMS is used to eliminate the redundant prediction anchor frames.

2.5. Experimental Environment and Parameters

The experimental session of this study was conducted using the PyTorch framework on a remote server running Linux. The server was equipped with an Intel(R) Xeon(R) Gold 6330 CPU @ 2.00 GHz, 80 GB of RAM, and an NVIDIA GeForce RTX 3090 (24 GB) graphics card. Utilizing a GPU instead of a CPU for deep learning model training can significantly reduce the training time. The experimental environment was configured with a CUDA 11.3 parallel computing framework and CUDNN 8.2 deep neural network acceleration library. The input image size was set to 640 × 640, the batch size was set to 16, the learning rate was set to 0.001, and the training step size was set to 80. In order to avoid differences in the model validation results due to the change of equipment, the training and testing of the model as well as the validation were performed on the same remote server (provided by AutoDL) to save time and avoid discrepancies. The detailed environment configuration is shown in Table 1 and the training parameter settings are shown in Table 2.

3. Results

Evaluation Indicators

To assess the effectiveness of the model, we utilized evaluation metrics such as precision, recall, average precision, and mean average precision. Precision measures the probability that all positive samples detected by the model are indeed positive, while recall indicates the probability of the model correctly identifying positive samples out of the total number of actual positive samples. AP (average precision) is calculated by measuring the area enclosed by the precision recall curve and the axes using integration to determine the model’s performance on each category. Once the value of AP is obtained for each category, the value of mAP (mean average precision) can be calculated by averaging the AP of all categories. This provides an overall representation of the model’s performance across all categories. In the experiments, we mainly used mAP (0.5) and mAP (0.5:0.95) as the evaluation metrics. mAP (0.5) is the mAP when the IoU (intersection over union) is set to 0.5, and mAP (0.5:0.95) denotes the mAP in the range of IoU critical values from 0.5 to 0.95. The formula for each metric is shown below:
p r e i s o n = T P T P + F P
r e c a l l = T P T P + F N
m A P = 1 N i = 1 N A P i
where TP (true positive) denotes the number of positive samples correctly predicted by the model. Similarly, FP (false positive) denotes the number of positive samples incorrectly predicted by the model, and FN (false negative) denotes the number of negative samples incorrectly predicted by the model.
In order to test the effect of light weighting the model and evaluate its performance in complex forest scenes, we introduce additional evaluation metrics such as the number of parameters in the model, frames per second (FPS), and FLOPs(G). FPS represents the number of frames of image data processed by the model per second, while FLOPs(G) represents the number of floating point operations performed by the model per second.
Finally, after a series of data processing operations such as data cleaning, enhancement, and labeling, the rare wildlife dataset specifically used for WL-YOLO model training was obtained, which contains a total of 14,953 pieces of data, and the details of the data are shown in the following Table 3.
In the backbone network, we have implemented the CBAM attention mechanism. However, due to the multiple options available for its introduction location, different placement of the mechanism may result in varied model outcomes. Our goal is to enhance the model’s focus on essential features. Therefore, selecting the optimal introduction location for the CBAM attention mechanism module is essential. Prior to conducting large-scale comparison experiments, we first conducted ablation experiments to test the different introduction locations of CBAM. We organized four groups of comparison experiments based on the placement of CBAM within the MobileNet networks. These groups included placing CBAM at the beginning of all MobileNet networks, after the 3rd, 6th, and 9th MobileNet networks, and at the end of the backbone network. These groups were labeled as Group 1, Group 2, Group 3, and Group 4, respectively. The primary focus of the comparison was on accuracy and detection speed in order to assess the impact of the CBAM introduction location on the model’s effectiveness. The experimental results are shown in Table 4.
Through multiple comparison experiments, it is evident that placing the CBAM mechanism at the end of the backbone network outperforms several alternative introduction schemes in terms of overall performance. While some approaches show slightly faster detection speeds for individual groups, there remains a noticeable gap in detection accuracy. After conducting multiple rounds of experiments, it has been concluded that positioning the CBAM mechanism at the end of the backbone network is the most effective solution currently available.
We fed the produced dataset into WL-YOLO for training, testing, and validation. To ensure the objectivity and fairness of the experimental results and avoid episodic results caused by equipment or other factors, this study conducted ten training batches on the same server with the same configuration. The results for all metrics were averaged, and they consistently showed no significant deviation. As can be seen from Table 5, the WL-YOLO model demonstrated excellent performance in wildlife category recognition across all categories, achieving recognition accuracies of over 90% in each category. Moreover, there was minimal variation in performance between categories. A confusion matrix serves as a vital tool for evaluating deep learning models, providing a more intuitive means of comparing the classification results against the actual predictions. In this particular experiment, a confusion matrix was primarily utilized to visually evaluate the performance of WL-YOLO detection, as depicted in Figure 13.
In this experiment, the WL-YOLO model was trained to detect and classify rare wild animals, and the R_Curve, P_Curve, F1_Curve, and PR_Curve graphs during the training process are shown in Figure 14, and these curves demonstrate the ability of the WL-YOLO model to learn the features of various types of animals. P_Curve and R_Curve represent the accuracy and recall of the model in different categories of animal recognition, respectively, F1_Curve represents the accuracy of the model in recognizing different types of animals, and PR_Curve represents the value of mAP (0.5).
As shown in the figure above, the different colored curves represent various wildlife species. It can be observed from these curves that the model exhibits high values for precision, F1, and recall when the confidence is around the equilibrium point. This provides evidence that the model’s training has yielded improved results.
Deep learning-based target detection algorithms are mainly categorized into two types: one-stage and two-stage. The two-stage algorithm first generates candidate regions and then utilizes a convolutional neural network for classification and detection. This approach is primarily represented by the Faster R-CNN model. On the other hand, the one-stage algorithm is represented by the YOLOv5m model. To demonstrate the superior computational efficiency and improved wildlife detection performance of the WL-YOLO model, we compared it to various models. These models included the original YOLOv5 series model, a well-known one-stage algorithm, along with its variants—YOLOv5m-MobileNetV3 and YOLOv5m-CBAM. Additionally, for a two-stage algorithm perspective, we also considered the Faster R-CNN model as a representative example. We inputted the same dataset into the comparison model for training. We then adjusted each model’s parameters to optimize them. In order to provide a more objective and comprehensive comparison, we evaluated the models based on the following facets: mAP (mean average precision), precision, parameters, FLOPs (floating operations per second—in billions), and FPS (frames per second). The results of the comparison are presented in Table 6.
By analyzing the table, we can see that Faster R-CNN, as a representative model of the two-stage algorithm, does have certain advantages in terms of detection accuracy, thanks to its excellent feature extraction capability. However, it is limited by the fact that it consumes a significant amount of computation power and time in generating the region of interest. Consequently, its performance in speed indexes such as FPS is poor, leading to the conclusion that it is not well-suited for real-time detection of wildlife in a complex forest environment.
And when compared to the YOLOv5 series models, WL-YOLO not only achieves a new breakthrough in rapid detection but also enhances accuracy while reducing the rates of misses and false detections.
Figure 15 illustrates the fluctuation of the loss function throughout the training of both the wildlife detection model, WL-YOLO, and the main comparison model. It is evident that the WL-YOLO model stabilizes after 80 epochs. Additionally, in comparison to several other models, the loss function of WL-YOLO exhibits minimal fluctuations during training, indicating a faster convergence speed in the pre-training process. While several other models have larger final loss values or more drastic fluctuations, it is clear that our proposed WL-YOLO model is easier to train, converges faster, and demonstrates its effectiveness from a computational standpoint.
To better showcase the ability of WL-YOLO in detecting wildlife targets, categorizing wildlife target categories, and detecting concealed wildlife targets in complex backgrounds, we created a dedicated test dataset. This dataset consists exclusively of wildlife image data captured in complex forest environment backgrounds. The specific detection results can be observed in Figure 16. As seen in the figure, WL-YOLO successfully detects the wildlife targets present in the image data. This includes instances where the background environment is cluttered, the target’s pattern is concealed, and the lighting conditions are poor. WL-YOLO exhibits superior performance in handling these challenges. Furthermore, when there are multiple wildlife targets in the image, the model can accurately identify and select all targets by automatically determining the suitable anchor frame based on the size of the targets.

4. Discussion

4.1. The Advantages of Our Approach

The development of deep learning has introduced new methods and opportunities for wildlife conservation [54]. A key challenge in achieving effective wildlife conservation is the rapid and accurate detection of wildlife in complex forest environments [4]. To address this issue, we propose a fast wildlife detection model called WL-YOLO, which is specifically designed for such intricate forest environments. The WL-YOLO model is based on the widely used one-stage algorithm, the YOLO model. It can be observed from the experiments that in the task of wildlife target detection in complex forest environments, the search and detection of targets is somewhat hindered by factors such as ambient light and obstacles. However, due to our redesigned feature extraction module, our WL-YOLO model shows certain advantages in detection speed compared to two-stage models like Fast R-CNN, and it exhibits no obvious defects in accuracy. With its lightweight model setup, our model can be seamlessly deployed on mobile devices for wildlife conservationists to utilize in the field.
The current mainstream target detection and recognition models have demonstrated excellent performance [16]. However, the requirements of the wildlife detection task differ from regular target recognition tasks. Most real-time monitoring of wildlife takes place in complex forest environments. To protect wildlife effectively, the target size, completeness, and clarity of wildlife image data can vary significantly [55]. Therefore, the model needs to have a strong ability for fast detection and be capable of detecting targets in complex environments. Our WL-YOLO model not only inherits the advantages of the lightweight structure found in the YOLO series but also significantly reduces the model’s parameters by utilizing the outstanding low-cost computational performance of MobileNetV3. As a result, the training cost is greatly reduced [56]. Although we have reduced numerous parameters and eliminated unnecessary structures, incorporating the redesigned C-C3 module and constructing the feature extraction network enhances the model’s recognition accuracy. It also improves its ability to detect and identify small or hidden wildlife in complex backgrounds. Overall, our model demonstrates better performance and is better suited for the task of detecting wildlife in complex forest environments.

4.2. Limitations and Potential Improvements

Compared to traditional machine learning methods, deep learning-based recognition methods have certain limitations. They rely on a large number of datasets and their accuracy is not as high as traditional machine learning methods. However, the deep learning method eliminates the need for manual screening of features and reduces the need for staff and resources to analyze the features. Additionally, with the continuous development of wildlife monitoring equipment such as trap cameras and long-range drones, there will be a greater amount of more comprehensive image data available. As a result, the recognition effect of the deep learning model will improve along with the quality of the data.
At this stage, our wildlife detection task still relies solely on wildlife image data features. However, there is a lot of additional expert knowledge that can be leveraged in enhancing the wildlife detection and classification task. This includes information such as animal body size, habitat details, DNA barcoding, and more. In comparison to improving the model structure alone, incorporating expert knowledge can significantly boost the model’s performance. However, the current model lacks scalability and does not allow for the utilization of expert knowledge from other modalities as additional features to aid recognition.
Currently, we have achieved some results in model light weighting by reducing the number of parameters and computation required by the model. However, there are still more effective ways to improve computational efficiency and achieve better performance in terms of accuracy. These methods include, but are not limited to, model distillation, pruning, and other techniques that may yield superior performance. Additionally, according to the experimental results, it is evident that the current model can only achieve better results in the case of small targets or partially occluded objects. It shows better convergence speed and accuracy in these scenarios. However, when the target is only visible in a small part or is highly occluded, the performance may not be as good as high-precision models like the two-stage Fast R-CNN. Therefore, further improvements need to be implemented in subsequent iterations.

5. Conclusions

In this paper, we propose a lightweight deep learning method for real-time detection of wildlife in complex forest environments. Our approach involved constructing a large-scale image dataset of rare wildlife, which included both visible and infrared image data. The goal was to enable fast and accurate detection of wildlife in these challenging environments. In this study, we have innovatively improved the YOLOv5s model by utilizing the lightweight structure of MobileNetV3 as a replacement for the backbone feature extraction module in the YOLO model. Additionally, we have redesigned the feature extraction module C_C3 in the neck, combining the attention mechanism with the convolutional neural network. This improvement enables the model to effectively focus on wildlife targets, including smaller and incomplete ones, which aligns with the actual work requirements of frontline field workers involved in wildlife detection. Compared to the YOLOv5s model, which has the smallest number of parameters among the YOLOv5 series models, the WL-YOLO model has 44.73% fewer parameters, 145.81% faster detection speed, and 16.4% higher accuracy. After a series of tests and validations, it has been proven that WL-YOLO outperforms other models in terms of accuracy, lightweight design, and detection speed. The findings of this paper offer technical support for the prompt detection of wildlife by frontline field workers and also serve as a theoretical reference for optimizing the relevant model. In our future work, we will further explore the optimization techniques for the model and conduct research on the dynamic expansion method of the extensive wildlife dataset. This will enable us to achieve real-time updates on the wildlife species that can be identified by the model.

Author Contributions

Conceptualization, Z.M.; Data curation, F.C.; Investigation, D.X.; Methodology, Z.M.; Project administration, F.C.; Supervision, F.X.; Validation, Y.D. and Y.X.; Writing—original draft, Z.M.; Writing—review and editing, Y.D., F.X. and F.C. All authors have read and agreed to the published version of the manuscript.

Funding

This research was funded by the Outstanding Youth Team Project of Central Universities, grant number QNTD202308; National Key R&D Program of China, grant number 2022YFF1302700; The Emergency Open Competition Project of National Forestry and Grassland Administration, grant number 202303.

Data Availability Statement

Data are contained within the article.

Conflicts of Interest

The authors declare no conflicts of interest.

Abbreviations

The following abbreviations are used in this manuscript:
YOLOYou Only Look Once
WL-YOLOWild Life—You Only Look Once
CBAMConvolutional Block Attention Module
YOLOv5sYou Only Look Once v5—small
SPPSpatial Pyramid Pooling
SESqueeze and Extraction
RCNNRegional convolutional neural network
FLOPSFloating-point operations
CNNConvolutional neural network
CUDAComputer unified device architecture
cuDNNCUDA Deep Neural Network library

References

  1. Linchant, J.; Lisein, J.; Semeki, J.; Lejeune, P.; Vermeulen, C. Are unmanned aircraft systems (UAS s) the future of wildlife monitoring? A review of accomplishments and challenges. Mammal Rev. 2015, 45, 239–252. [Google Scholar] [CrossRef]
  2. Vogeler, J.C.; Cohen, W.B. A review of the role of active remote sensing and data fusion for characterizing forest in wildlife habitat models. Rev. De Teledetección 2016, 1, 1–14. [Google Scholar] [CrossRef]
  3. Wang, D.; Shao, Q.; Yue, H. Surveying wild animals from satellites, manned aircraft and unmanned aerial systems (UASs): A review. Remote Sens. 2019, 11, 1308. [Google Scholar] [CrossRef]
  4. Verma, G.K.; Gupta, P. Wild animal detection using deep convolutional neural network. In Proceedings of the 2nd International Conference on Computer Vision & Image Processing: CVIP 2017; Springer: Singapore, 2018; Volume 2. [Google Scholar]
  5. Nguyen, H.; Maclagan, S.J.; Nguyen, T.D.; Nguyen, T.; Flemons, P.; Andrews, K.; Ritchie, E.G.; Phung, D. Animal recognition and identification with deep convolutional neural networks for automated wildlife monitoring. In Proceedings of the 2017 IEEE International Conference on Data Science and Advanced Analytics (DSAA), Tokyo, Japan, 19–21 October 2017. [Google Scholar]
  6. Roopashree, Y.A.; Bhoomika, M.; Priyanka, R.; Nisarga, K.; Behera, S. Monitoring the Movements of Wild Animals and Alert System using Deep Learning Algorithm. In Proceedings of the 2021 International Conference on Recent Trends on Electronics, Information, Communication & Technology (RTEICT), Bangalore, India, 27–28 August 2021. [Google Scholar]
  7. Ojo, M.O.; Adami, D.; Giordano, S. Experimental evaluation of a LoRa wildlife monitoring network in a forest vegetation area. Future Internet 2021, 13, 115. [Google Scholar] [CrossRef]
  8. Gastón, A.; Blázquez-Cabrera, S.; Ciudad, C.; Mateo-Sanchez, M.C.; Simon, M.A.; Saura, S. The role of forest canopy cover in habitat selection: Insights from the Iberian lynx. Eur. J. Wildl. Res. 2019, 65, 1–10. [Google Scholar] [CrossRef]
  9. Norouzzadeh, M.S.; Morris, D.; Beery, S.; Joshi, N.; Jojic, N.; Clune, J. A deep active learning system for species identification and counting in camera trap images. Methods Ecol. Evol. 2021, 12, 150–161. [Google Scholar] [CrossRef]
  10. Lee, S.; Song, Y.; Kil, S.-H. Feasibility analyses of real-time detection of wildlife using UAV-derived thermal and RGB images. Remote Sens. 2021, 13, 2169. [Google Scholar] [CrossRef]
  11. Norouzzadeh, M.S.; Nguyen, A.; Kosmala, M.; Swanson, A.; Palmer, M.S.; Packer, C.; Clune, J. Automatically identifying, counting, and describing wild animals in camera-trap images with deep learning. Proc. Natl. Acad. Sci. USA 2018, 115, E5716–E5725. [Google Scholar] [CrossRef] [PubMed]
  12. Hou, J.; He, Y.; Yang, H.; Connor, T.; Gao, J.; Wang, Y.; Zeng, Y.; Zhang, J.; Huang, J.; Zheng, B.; et al. Identification of animal individuals using deep learning: A case study of giant panda. Biol. Conserv. 2020, 242, 108414. [Google Scholar] [CrossRef]
  13. Li, Y.; Li, S.; Du, H.; Chen, L.; Zhang, D.; Li, Y. YOLO-ACN: Focusing on small target and occluded object detection. IEEE Access 2020, 8, 227288–227303. [Google Scholar] [CrossRef]
  14. Girshick, R. Fast r-cnn. In Proceedings of the IEEE International Conference on Computer Vision, Santiago, Chile, 7–13 December 2015. [Google Scholar]
  15. Ren, S.; He, K.; Girshick, R.; Sun, J. Faster r-cnn: Towards real-time object detection with region proposal networks. In Proceedings of the Advances in Neural Information Processing Systems 28, Montreal, QC, Canada, 7–12 December 2015; Volume 28. [Google Scholar]
  16. Vecvanags, A.; Aktas, K.; Pavlovs, I.; Avots, E.; Filipovs, J.; Brauns, A.; Done, G.; Jakovels, D.; Anbarjafari, G. Ungulate detection and species classification from camera trap images using RetinaNet and faster R-CNN. Entropy 2022, 24, 353. [Google Scholar] [CrossRef]
  17. Altobel, M.Z.; Sah, M. Tiger detection using faster r-cnn for wildlife conservation. In Proceedings of the 14th International Conference on Theory and Application of Fuzzy Systems and Soft Computing–ICAFS-2020 14, Budva, Montenegro, 27–28 August 2021; Springer International Publishing: Berlin/Heidelberg, Germany, 2021. [Google Scholar]
  18. Peng, J.; Wang, D.; Liao, X.; Shao, Q.; Sun, Z.; Yue, H.; Ye, H. Wild animal survey using UAS imagery and deep learning: Modified Faster R-CNN for kiang detection in Tibetan Plateau. ISPRS J. Photogramm. Remote Sens. 2020, 169, 364–376. [Google Scholar] [CrossRef]
  19. He, K.; Gkioxari, G.; Dollár, P.; Girshick, R. Mask r-cnn. In Proceedings of the IEEE International Conference on Computer Vision, Venice, Italy, 22–29 October 2017. [Google Scholar]
  20. Tang, J.; Zhao, Y.; Feng, L.; Zhao, W. Contour-Based Wild Animal Instance Segmentation Using a Few-Shot Detector. Animals 2022, 12, 1980. [Google Scholar] [CrossRef]
  21. Kassim, Y.M.; Byrne, M.E.; Burch, C.; Mote, K.; Hardin, J.; Larsen, D.R.; Palaniappan, K. Small object bird detection in infrared drone videos using mask R-CNN deep learning. Electron. Imaging 2020, 32, 1–8. [Google Scholar] [CrossRef]
  22. Haucke, T.; Steinhage, V. Exploiting depth information for wildlife monitoring. arXiv 2021, arXiv:2102.05607. [Google Scholar]
  23. Wong, A.; Famuori, M.; Shafiee, M.J.; Li, F.; Chwyl, B.; Chung, J. YOLO nano: A highly compact you only look once convolutional neural network for object detection. In Proceedings of the 2019 Fifth Workshop on Energy Efficient Machine Learning and Cognitive Computing-NeurIPS Edition (EMC2-NIPS), Vancouver, BC, Canada, 13 December 2019. [Google Scholar]
  24. Yu, K.; Tang, G.; Chen, W.; Hu, S.; Li, Y.; Gong, H. MobileNet-YOLO v5s: An improved lightweight method for real-time detection of sugarcane stem nodes in complex natural environments. IEEE Access 2023, 11, 104070–104083. [Google Scholar] [CrossRef]
  25. Zeng, T.; Li, S.; Song, Q.; Zhong, F.; Wei, X. Lightweight tomato real-time detection method based on improved YOLO and mobile deployment. Comput. Electron. Agric. 2023, 205, 107625. [Google Scholar] [CrossRef]
  26. Jin, R.; Xu, Y.; Xue, W.; Li, B.; Yang, Y.; Chen, W. An Improved Mobilenetv3-Yolov5 Infrared Target Detection Algorithm Based on Attention Distillation. In International Conference on Advanced Hybrid Information Processing; Springer International Publishing: Cham, Switzerland, 2021; pp. 266–279. [Google Scholar]
  27. Mun, J.; Kim, J.; Do, Y.; Kim, H.; Lee, C.; Jeong, J. Design and Implementation of Defect Detection System Based on YOLOv5-CBAM for Lead Tabs in Secondary Battery Manufacturing. Processes 2023, 11, 2751. [Google Scholar] [CrossRef]
  28. Andrew, W.; Greatwood, C.; Burghardt, T. Visual localisation and individual identification of holstein friesian cattle via deep learning. In Proceedings of the IEEE International Conference on Computer Vision Workshops, Venice, Italy, 22–29 October 2017. [Google Scholar]
  29. Wei, R.; He, N.; Lu, K. YOLO-Mini-Tiger: Amur Tiger Detection. In Proceedings of the 2020 International Conference on Multimedia Retrieval, Dublin, Ireland, 8–11 June 2020. [Google Scholar]
  30. Roy, A.M.; Bhaduri, J.; Kumar, T.; Raj, K. WilDect-YOLO: An efficient and robust computer vision-based accurate object localization model for automated endangered wildlife detection. Ecol. Inform. 2023, 75, 101919. [Google Scholar] [CrossRef]
  31. Zhang, M.; Gao, F.; Yang, W.; Zhang, H. Wildlife Object Detection Method Applying Segmentation Gradient Flow and Feature Dimensionality Reduction. Electronics 2023, 12, 377. [Google Scholar] [CrossRef]
  32. Ma, D.; Yang, J. Yolo-animal: An efficient wildlife detection network based on improved yolov5. In Proceedings of the 2022 International Conference on Image Processing, Computer Vision and Machine Learning (ICICML), Xi’an, China, 28–30 October 2022; pp. 464–468. [Google Scholar]
  33. Liu, K.; Wang, J.; Zhang, K.; Chen, M.; Zhao, H.; Liao, J. A lightweight recognition method for rice growth period based on improved YOLOv5s. Sensors 2023, 23, 6738. [Google Scholar] [CrossRef]
  34. Wang, X.; Wu, Z.; Jia, M.; Xu, T.; Pan, C.; Qi, X.; Zhao, M. Lightweight SM-YOLOv5 tomato fruit detection algorithm for plant factory. Sensors 2023, 23, 3336. [Google Scholar] [CrossRef] [PubMed]
  35. Liu, L.; Mou, C.; Xu, F. Improved Wildlife Recognition through Fusing Camera Trap Images and Temporal Metadata. Diversity 2024, 16, 139. [Google Scholar] [CrossRef]
  36. Wang, G.; Gan, X.; Cao, Q.; Zhai, Q. MFANet: Multi-scale feature fusion network with attention mechanism. Vis. Comput. 2023, 39, 2969–2980. [Google Scholar] [CrossRef]
  37. Ji, Y.; Zhang, H.; Wu, Q.J. Salient object detection via multi-scale attention CNN. Neurocomputing 2018, 322, 130–140. [Google Scholar] [CrossRef]
  38. Wang, G.; Gan, X.; Cao, Q.; Zhai, Q. MAPoseNet: Animal pose estimation network via multi-scale convolutional attention. J. Vis. Commun. Image Represent. 2023, 97, 103989. [Google Scholar]
  39. Wang, L.; Cao, Y.; Wang, S.; Song, X.; Zhang, S.; Zhang, J.; Niu, J. Investigation into recognition algorithm of helmet violation based on YOLOv5-CBAM-DCN. IEEE Access 2022, 10, 60622–60632. [Google Scholar] [CrossRef]
  40. Cao, L.; Song, P.; Wang, Y.; Yang, Y.; Peng, B. An Improved Lightweight Real-Time Detection Algorithm Based on the Edge Computing Platform for UAV Images. Electronics 2023, 12, 2274. [Google Scholar] [CrossRef]
  41. Jia, L.; Wang, T.; Chen, Y.; Zang, Y.; Li, X.; Shi, H.; Gao, L. MobileNet-CA-YOLO: An Improved YOLOv7 Based on the MobileNetV3 and Attention Mechanism for Rice Pests and Diseases Detection. Agriculture 2023, 13, 1285. [Google Scholar] [CrossRef]
  42. Yang, W.; Liu, T.; Jiang, P.; Qi, A.; Deng, L.; Liu, Z.; He, Y. A Forest Wildlife Detection Algorithm Based on Improved YOLOv5s. Animals 2023, 13, 3134. [Google Scholar] [CrossRef]
  43. Zheng, Y.; Zhang, Y.; Qian, L.; Zhang, X.; Diao, S.; Liu, X.; Cao, J.; Huang, H. A lightweight ship target detection model based on improved YOLOv5s algorithm. PLoS ONE 2023, 18, e0283932. [Google Scholar] [CrossRef]
  44. Jiang, T.; Li, C.; Yang, M.; Wang, Z. An improved YOLOv5s algorithm for object detection with an attention mechanism. Electronics 2022, 11, 2494. [Google Scholar] [CrossRef]
  45. Jiang, T.; Li, C.; Yang, M.; Wang, Z. YOLOv5s FMG: An improved small target detection algorithm based on YOLOv5 in low visibility. IEEE Access 2023, 11, 75782–75793. [Google Scholar]
  46. Zhang, C.; Ding, H.; Shi, Q.; Wang, Y. Grape cluster real-time detection in complex natural scenes based on YOLOv5s deep learning network. Agriculture 2022, 12, 1242. [Google Scholar] [CrossRef]
  47. Chen, G.; Zhou, H.; Li, Z.; Gao, Y.; Bai, D.; Xu, R.; Lin, H. Multi-Scale Forest Fire Recognition Model Based on Improved YOLOv5s. Forests 2023, 14, 315. [Google Scholar] [CrossRef]
  48. Luo, X.; Wu, Y.; Wang, F. Target detection method of UAV aerial imagery based on improved YOLOv5. Remote Sens. 2022, 14, 5063. [Google Scholar] [CrossRef]
  49. Lu, X.; Lu, X. An efficient network for multi-scale and overlapped wildlife detection. Signal Image Video Process. 2023, 17, 343–351. [Google Scholar] [CrossRef]
  50. Petso, T.; Jamisola, R.S., Jr.; Mpoeleng, D. Review on methods used for wildlife species and individual identification. Eur. J. Wildl. Res. 2022, 68, 3. [Google Scholar] [CrossRef]
  51. Ukwuoma, C.C.; Qin, Z.; Yussif, S.B.; Happy, M.N.; Nneji, G.U.; Urama, G.C.; Ukwuoma, C.D.; Darkwa, N.B.; Agobah, H. Animal species detection and classification framework based on modified multi-scale attention mechanism and feature pyramid network. Sci. Afr. 2022, 16, e01151. [Google Scholar] [CrossRef]
  52. Woo, S.; Park, J.; Lee, J.Y.; Kweon, I.S. Cbam: Convolutional block attention module. In Proceedings of the European Conference on Computer Vision (ECCV), Munich, Germany, 8–14 September 2018. [Google Scholar]
  53. Liu, B.; Qu, Z. AF-TigerNet: A lightweight anchor-free network for real-time Amur tiger (Panthera tigris altaica) detection. Wildl. Lett. 2023, 1, 32–41. [Google Scholar] [CrossRef]
  54. Zualkernan, I.; Dhou, S.; Judas, J.; Sajun, A.R.; Gomez, B.R.; Hussain, L.A. An IoT system using deep learning to classify camera trap images on the edge. Computers 2022, 11, 13. [Google Scholar] [CrossRef]
  55. Khatri, K.; Asha, C.S.; D’Souza, J.M. Detection of animals in thermal imagery for surveillance using GAN and object detection framework. In Proceedings of the 2022 International Conference for Advancement in Technology (ICONAT), Goa, India, 21–22 January 2022; pp. 1–6. [Google Scholar]
  56. Geethanjali, P.; Rajeshwari, M. Advances in Ecological Surveillance: Real-Time Wildlife Detection Using MobileNet-SSD V2 CNN. 2023. Available online: https://www.researchgate.net/profile/Geethanjali-P-2/publication/377077516_Advances_in_Ecological_Surveillance_Real-Time_Wildlife_Detection_using_MobileNet-SSD_V2_CNN_Machine_Learning/links/6594414e0bb2c7472b2bc699/Advances-in-Ecological-Surveillance-Real-Time-Wildlife-Detection-using-MobileNet-SSD-V2-CNN-Machine-Learning.pdf (accessed on 20 December 2023).
Figure 1. Schematic diagram of target detection in complex environments affected by environmental conditions, where each row represents a different scenario of changing environmental dynamics, natural concealment, light changes, and tree occlusion. Where the green box inside each picture represents the wildlife target to be identified in the picture.
Remotesensing 16 01350 g001
Figure 2. The two main study areas of this research are presented separately: the Northeast Tiger and Leopard National Park, and the Giant Panda National Park. The main wildlife species in each study area are indicated in the upper right corner of the respective pictures. The blue and green dots in the first and second images represent the exact location of the two study areas, which have been labelled with “Study Area”.
Remotesensing 16 01350 g002
Figure 3. Some of the images in the dataset are presented as samples. The dataset includes a vast amount of visible image data as well as infrared image data.
Remotesensing 16 01350 g003
Figure 4. The overall research methodology is illustrated in Figure. It primarily comprises dataset construction, model design, model training, and validation. The model design phase consists of model structure design, model lightweighting, and the incorporation of an attention mechanism. All relevant models were trained and compared during the training and validation process.
Remotesensing 16 01350 g004
Figure 5. The figure illustrates a comparison of the number of animal images before and after data augmentation. The blue bars represent the number of image data for each animal in the original dataset, while the yellow bars represent the number of image data for each animal in the augmented dataset. Upon comparing the dataset before and after augmentation, it is evident that the number of images for each category in the enlarged dataset is more evenly distributed, with approximately 1000 images for each category.
Remotesensing 16 01350 g005
Figure 6. The YOLOv5 model structure diagram mainly consists of three components: the backbone, neck, and head. These components contain modules such as CBS, CSP, and SPPF. The backbone serves as the backbone network for feature extraction. The neck is situated between the backbone and the head, and is used to further utilize the features extracted by the backbone in order to improve the model’s robustness. The head is responsible for making predictions based on the output of the network. Where different colored squares represent different types of network modules, light yellow for CBS module, light green for CSP module, orange-red for SPPF module, blue for CBAM module, orange for Concat module, purple for Upsample module and grey for Input and Detection module.
Remotesensing 16 01350 g006
Figure 7. The schematic illustrates the workflow of the channel attention mechanism and the spatial attention mechanism, with the upper half representing the channel attention mechanism and the lower half representing the spatial attention mechanism.
Remotesensing 16 01350 g007
Figure 8. Schematic diagram illustrating the structure of the CBAM model, including the spatial attention mechanism and the channel attention mechanism. The channel attention module operates on the input features by performing global maximum pooling and global average pooling to generate a weight matrix based on the channel. Subsequently, the spatial attention module calculates the weight matrix based on the space.
Remotesensing 16 01350 g008
Figure 9. The backbone structure of WL-YOLO primarily comprises MobileNet and CBAM modules. To improve the extraction of image features, 11 MobileNets are integrated for feature extraction. Additionally, CBAM attention is incorporated at the end of the network to enhance the model’s receptive field. The pink squares represent our new MobileNet module, the grey ones represent the input module, the light yellow ones represent the Focus module, the light green ones represent the convolution module, and the orange ones represent the CBAM module.
Remotesensing 16 01350 g009
Figure 10. Diagram of the neck structure of the WL-YOLO, which mainly consists of the C-C3 module and the CBAM module. To further extract the backbone processed features, multiple C3 modules fused with CBAM are added in the middle of the neck network. The light orange color represents the C3 module, the light green color represents the Conv module, the orange-red color represents the CBAM module, the blue color represents the Concat module and the purple color represents the Upsample module.
Remotesensing 16 01350 g010
Figure 11. Unlike traditional attention mechanisms that are superimposed, WL-YOLO’s C-C3 module integrates channel and spatial attention mechanisms structurally. The input features are passed through a convolutional network layer and then output after the computation of channel and spatial weight matrices.
Remotesensing 16 01350 g011
Figure 12. Schematic diagram of the overall structure of the WL-YOLO model. The overall network architecture of the YOLOv5s is maintained, with the same backbone, neck, and head networks. However, we have replaced these networks with new modules and changed the size of the detection head in the head network. The pink squares represent our new MobileNet module, the grey ones represent the input and output modules, the light yellow ones represent the Focus module, the light green one represents the convolution module, the orange one represents the CBAM module, the purple one represents the Upsample module, the light orange one represents the C3 module, and the light blue one represents the Concat module, and the different colors represent different network modules.
Remotesensing 16 01350 g012
Figure 13. Confusion matrix of WL-YOLO training outputs. The accuracy of the predictions for each category is indicated, and it can be seen that for most of the wildlife categories, the model’s predictive accuracy can be maintained at a high level.
Remotesensing 16 01350 g013
Figure 14. Changes in P_Curve, R_Curve, F1_Curve, and PR_Curve during the WL-YOLO training process.
Remotesensing 16 01350 g014
Figure 15. Upon comparing the changes in loss function among WL-YOLO, Faster R-CNN, and YOLOv5m variants of the model, it is evident that the WL-YOLO model converges faster when compared to the other models (The light pink line in the figure represents the variation of the loss function during the actual training of the WL-YOLO model, and in order to make it look more intuitive, we have increased the smoothing, which is shown by the orange line on the way).
Remotesensing 16 01350 g015
Figure 16. The WL-YOLO model was tested for its practical applications. In this experiment, we deliberately selected wildlife detection scenarios under various conditions, such as low light, incomplete targets, multiple targets in the scene, and blurred targets. It is evident that WL-YOLO can achieve superior results in wildlife target detection tasks across a range of conditions.
Remotesensing 16 01350 g016
Table 1. Experimental environment setup.
ParametersValue
CPUIntel(R) Xeon(R) Gold 6330 CPU @ 2.00 GHz
GPUNVIDA GeForce RTX 3090 (24 GB)
RAM80
SystemUbuntu 20.04
Python3.8
PyTorch1.11.0
CUDA11.3
Cudnn8.2
Table 2. Experimental model parameter settings.
ParametersValue
Dropout0.005
Workers8
Epoch80
Batch_size10
Momentum0.937
Learning_rate0.001
Table 3. Information about the data contained in the dataset, including the quantity as well as the type of data.
Wildlife ClassesQuantitiesTypology
Amur Leopard1089visible image/infrared image
Amur Tiger1121visible image/infrared image
Badger1199visible image/infrared image
Black Bear1071visible image
Leopard Cat1237visible image/infrared image
Musk Deer963visible image/infrared image
Red Fox638visible image/infrared image
Red Panda1191visible image/infrared image
Otter951visible image/infrared image
Sika Deer1365visible image
Weasel958visible image/infrared image
Wild Boar1150visible image/infrared image
Wolf1043visible image/infrared image
Marten977visible image/infrared image
Total14953
Table 4. Comparative table of results of ablation experiments, each group representing a scenario introduced by CBAM.
Evaluation MetricsGroup 1Group 2Group 3Group 4
mAP (0.5)96.3696.9197.2297.25
Precision94.1294.7395.1195.14
FPS62615861
Table 5. Accuracy of WL-YOLO model for recognition of different species.
Wildlife ClassesPrecision
Amur Leopard0.9621
Amur Tiger0.9931
Badger0.9622
Black Bear0.9916
Leopard Cat0.9826
Musk Deer0.9932
Red Fox0.9929
Red Panda0.9935
Otter0.9433
Sika Deer0.9838
Weasel0.9820
Wild Boar0.9712
Wolf0.9107
Marten0.9910
Total0.9632
Table 6. Comparison of the performance of YOLOv5 series models as well as improved models and Faster R-CNN models under different evaluation metrics.
MethodParametersPrecisionmAP (0.5)FLOPs (G)FPSModel Size (MB)
YOLOv5m2092385194.7696.7648.24144.1
YOLOv5l4656370994.8195.11109.34998.14
YOLOv5s702502382.288.1315.924.914.99
YOLOv5x862003391.2392.728.24032.22
YOLOv5n487215782.5188.524.63417.1
YOLOv5m-MobileNetV3984351291.7794.7737.15235.8
YOLOv5m-CBAM2093375295.1695.7354.14744.17
YOLOv5s-CBAM762341184.1487.1214.12327.17
YOLO-animal761124583.1785.527.54126.91
WD-YOLO702742392.6088.404.44027.14
Mask R-CNN2467321094.7395.7152.13455.01
Fast R-CNN23000000095.6196.4244.735542.75
Faster R-CNN23068902495.9297.7497.234584.37
WL-YOLO388287395.1497.253.7618.5
Disclaimer/Publisher’s Note: The statements, opinions and data contained in all publications are solely those of the individual author(s) and contributor(s) and not of MDPI and/or the editor(s). MDPI and/or the editor(s) disclaim responsibility for any injury to people or property resulting from any ideas, methods, instructions or products referred to in the content.

