Article

Influence of Assimilation of NEXRAD-Derived 2D Inner-Core Structure Data from Single Radar on Numerical Simulations of Hurricane Charley (2004) near Its Landfall

1
Nanjing Nriet Industrial Co., Ltd., Nanjing 211106, China
2
Glarun Technology China Electronics Technology Group Corporation Co., Ltd., Nanjing 211106, China
3
Department of Atmospheric Sciences, University of Utah, Salt Lake City, UT 84112, USA
4
National Center for Atmospheric Research, Boulder, CO 80301, USA
5
State Key Laboratory of Atmospheric Boundary Layer Physics and Atmospheric Chemistry (LAPC), Institute of Atmospheric Physics, Chinese Academy of Sciences, Beijing 100029, China
*
Author to whom correspondence should be addressed.
Remote Sens. 2024, 16(8), 1351; https://doi.org/10.3390/rs16081351
Submission received: 21 February 2024 / Revised: 26 March 2024 / Accepted: 26 March 2024 / Published: 11 April 2024
(This article belongs to the Special Issue Remote Sensing for High Impact Weather and Extremes)

Abstract

:
This study presents the first research that assimilates the ground-based NEXRAD observations-derived two-dimensional (2D), azimuthally averaged radar radial velocity and reflectivity within 60 km of radius from the hurricane center to examine their influence on the analysis and prediction of a hurricane near and after its landfall. The mesoscale community Weather Research and Forecasting (WRF) model and its four-dimensional variational (4D-VAR) data assimilation system are utilized to conduct data assimilation experiments for Hurricane Charley (2004). Results show that assimilation of the radar inner-core data leads to better forecasts of hurricane tracks, intensity, and precipitation. The improved forecast outcomes imply that the changes in dynamical, thermal, and moisture structures from data assimilations made more reasonable conditions for the hurricane development near and after its landfall. Overall results indicate that the assimilation of the radar-derived 2D inner-core structure could be a feasible way to utilize the radar data for improved hurricane prediction.

1. Introduction

Tropical cyclones (TCs), as one of the natural disasters, have led to tremendous destruction of coastal and inland regions through extreme high wind speed and heavy rainfall. Therefore, a better forecast of TC, especially near its landfall, is of great importance to the public to effectively warn and reduce the economic damage and death [1].
Over the past several decades, the TC forecasts have improved significantly [1,2,3,4,5]. According to Rogers et al. [6], the official 48 h TC track and intensity forecast errors have reduced by 45% and 17% in the past 15 years, respectively. Meanwhile, many studies have acknowledged that the accurate forecasts of TCs from numerical simulations are closely related to the initial thermal and dynamic structures of storm inner-core [7,8,9,10]. Improvements in the accuracy of TC inner-core structures could lead to better forecast skills [3]. Therefore, it is necessary to assimilate more observation data into the numerical models to produce a more accurate description of TC vortex structures, especially the TC inner-cores.
TCs often spend most of their lifetimes over oceans where the conventional observations are relatively sparse [10,11,12]. As a result, the radar observation with high temporal and spatial resolution, which has the capability of sampling the detailed TCs inner-core three-dimensional (3D) structures [12,13,14,15,16], has become an important data source for data assimilation (DA) in mesoscale and microscale weather analyses and forecasting [14,17]. Specifically, airborne radar data are mostly used in TC studies due to their mobility and capability of supplying additional observation over the ocean; thus, they also offer useful data sources for numerical simulations with data assimilation [1,10,17,18]. Previous studies indicated that the assimilations of radar observations have improved the environmental conditions and caused a positive influence on TC forecasts near their landfalls. In most of these studies, dual-Doppler radar-derived TC structures have been used. However, the real-time application capability of these dual-Doppler radars is limited due to the elaborate data processing requirements [19,20]. Therefore, assimilating single-Doppler radar data in a model remains the primary option [20,21].
In addition, most of the aforementioned studies assimilate the airborne Doppler radar data; the data from coastal ground-based radar are seldom used [14]. This is because the locations of most coastal radars are far away from the TC inner-core before their landfalls, and they could not capture the detailed inner-core structures unless the TCs have been very close inland. Furthermore, most of the previous studies mainly focus on data assimilations with high-resolution 3D radar data, which is composed of axisymmetric and asymmetric structure data. And, compared to the complex and unclear asymmetric structure data, the axisymmetric structure data has been derived and applied to WRF vortex initialization successfully [19,20]. Therefore, whether the direct assimilation of an axisymmetric TC inner-core structure with 2D azimuthally averaged radar data could improve the TC forecast requires further study.
In this study, we will assimilate the data from a single Doppler radar, Key West (KBYX, 24.59°N, 81.70°W) coastal radar, on the sea-island, which is close to the TC inner-core prior to its landfall inland, to examine whether the radar data from such type of location could improve the TC forecasts as early as possible. Specifically, we will examine a new way to assimilate the radar observations by direct assimilation of an axisymmetric TC inner-core structure with 2D azimuthally averaged radar observations to see if that could improve the TC forecast. Hurricane Charley (2004), which made landfall in Florida from 11 to 14 on August 2004, was chosen as a case study based on the radar data availability.

2. Materials and Methods

2.1. A Brief Overview of Hurricane Charley (2004)

According to the National Hurricane Center (NHC) Report [22], the tropical storm Charley became a hurricane on 11 August 2004. It continued to strengthen and reach the Hurricane Category 2 status around 15:00 UTC on 12 August. After moving across Cuba, the Charley turned toward the north-northwest of Florida at 00:00 UTC on 13 August. It strengthened rapidly from Category 3 to Category 4 near its landfall around 19:45 UTC on 13 August with the maximum sustained winds near 66.88 ms−1. Continuing north-northwestward at a slightly faster forward speed, the center of Charley passed near Kissimmee and Orlando around 01:30 UTC on 14 August with maximum sustained winds of 33.44–36.01 ms−1. By 06:00 UTC on 14 August, Charley passed through the Florida state and moved toward the ocean. At the time, Charley was the most intense hurricane landfall in the United States since Hurricane Andrew (1992) and its best track information are shown in Table 1. During its landfall, it caused a swath of destruction across the state. In this study, the focused time period is from 12:00 UTC on 13 August to 06:00 UTC on 14 August, which covers the near landfall and the hurricane evolution over land.

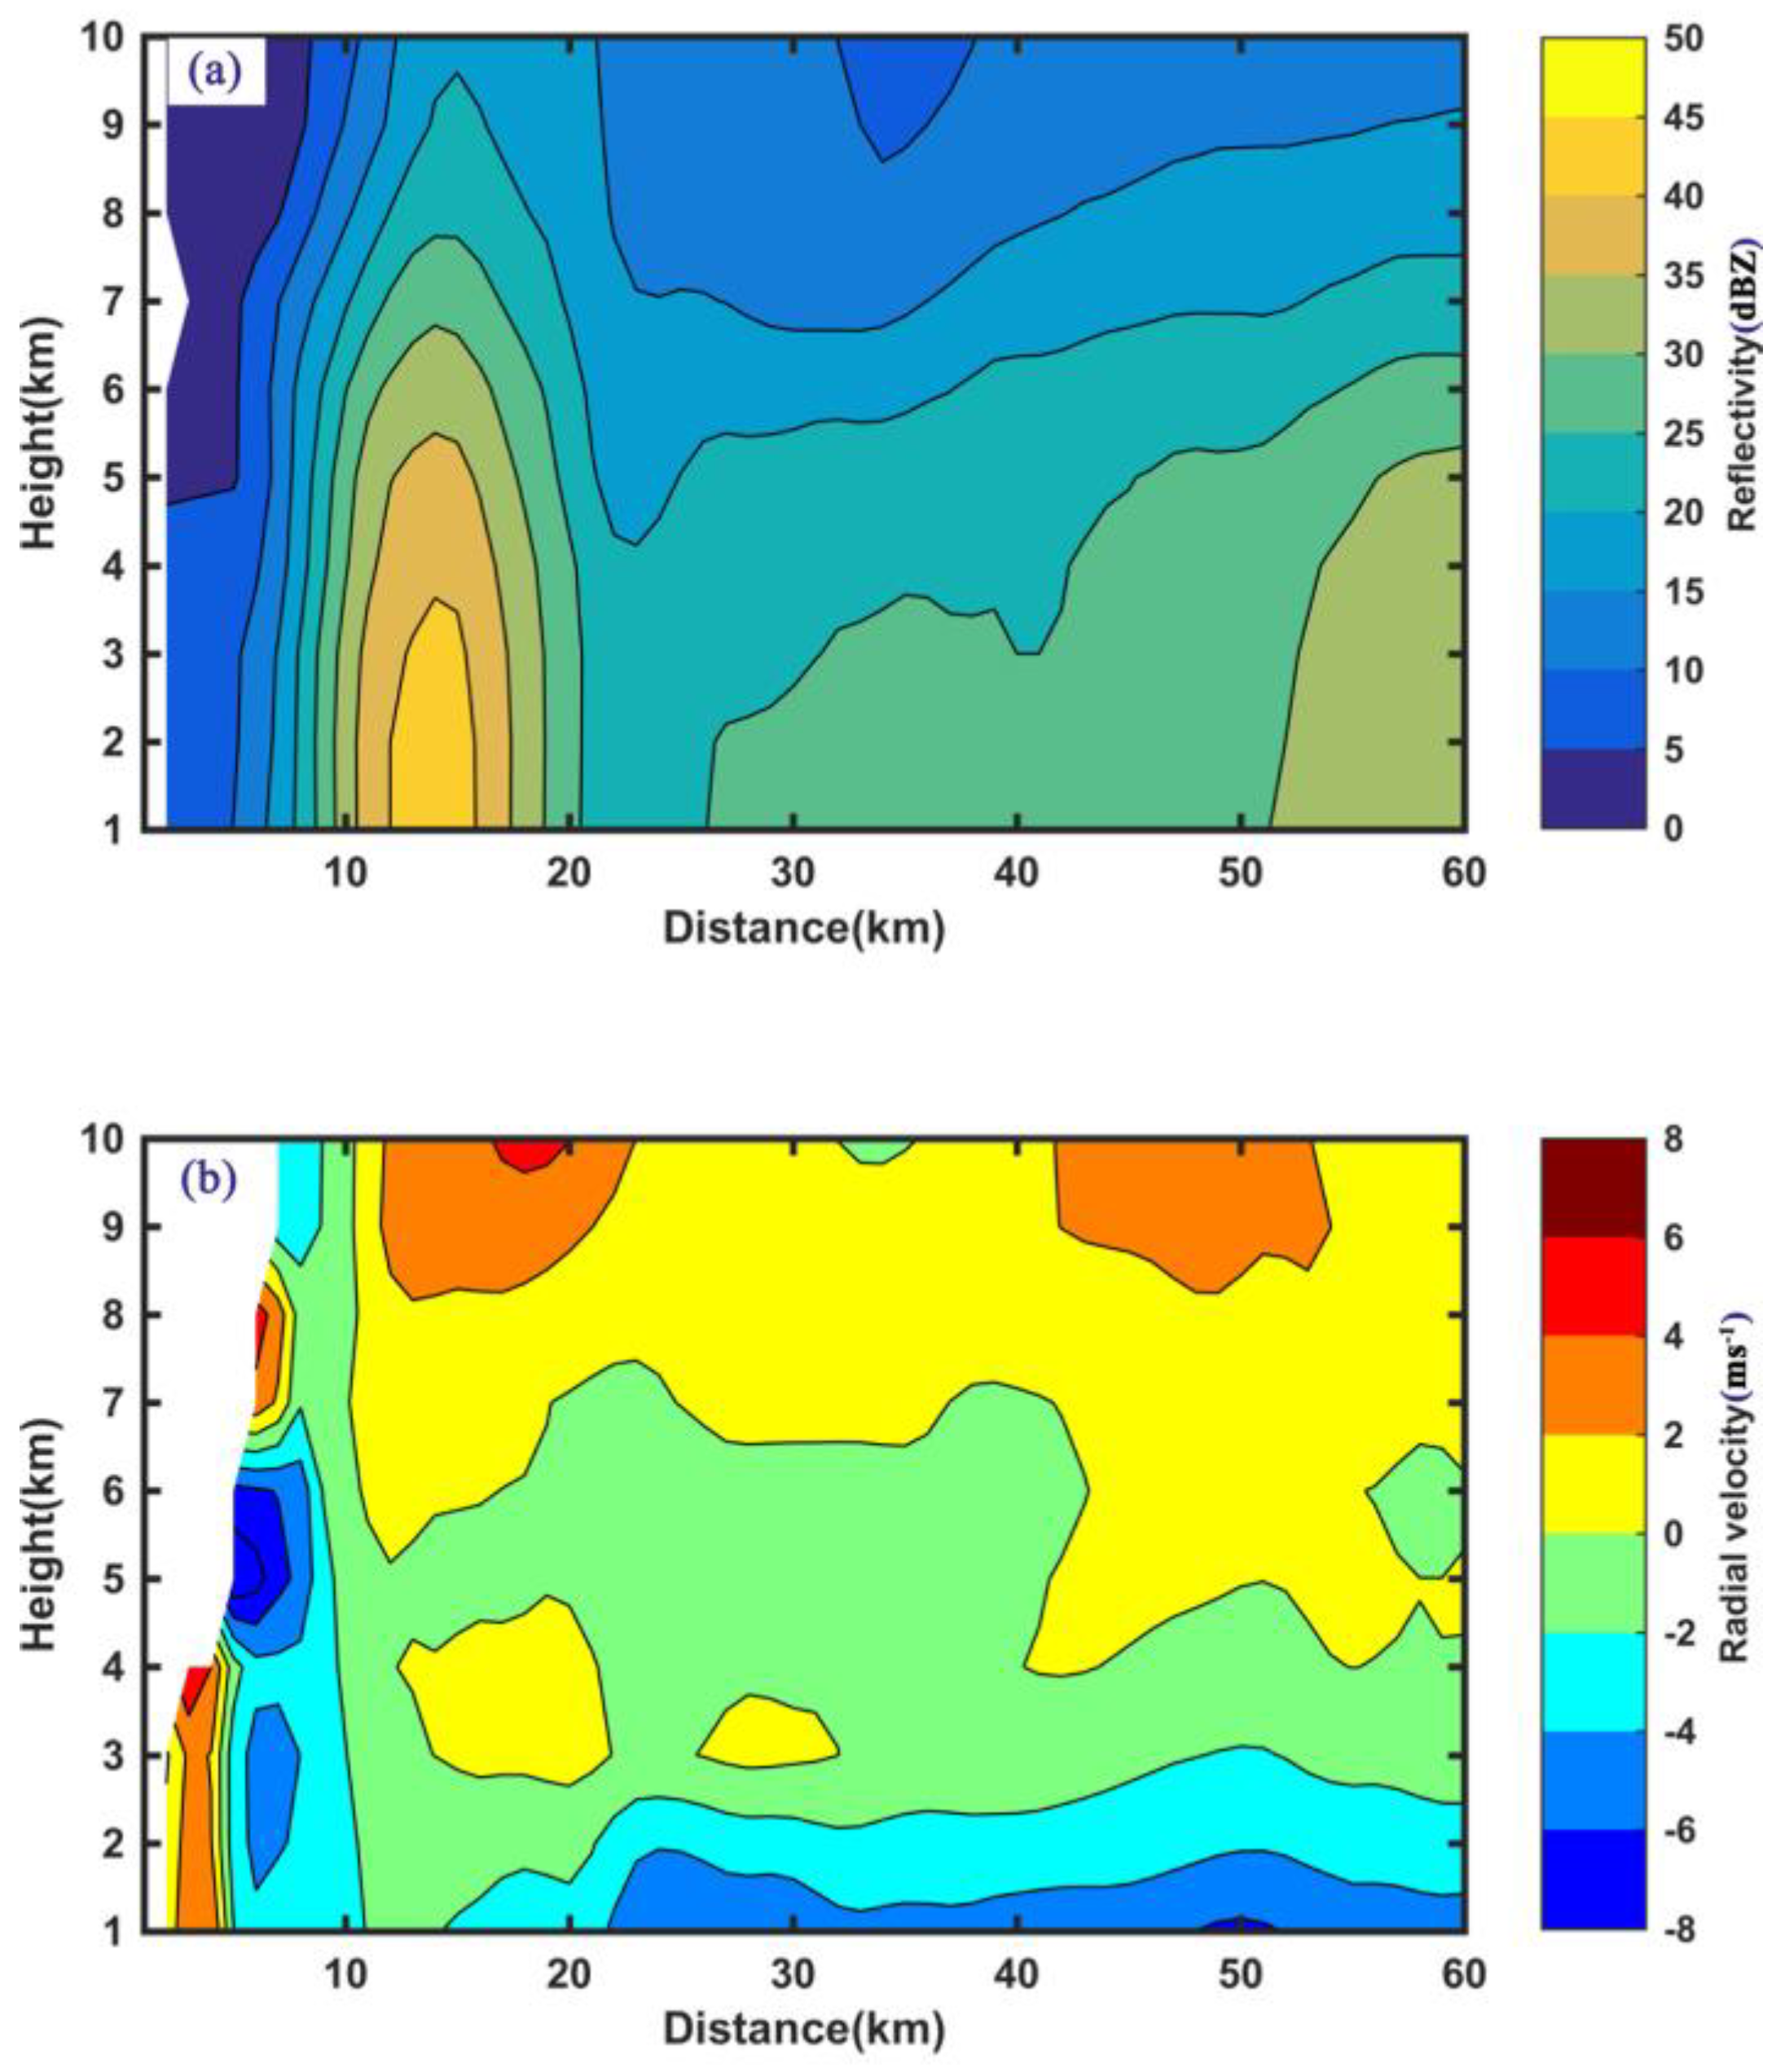
2.2. Doppler Radar Data

The Weather Surveillance Radar-1988 Doppler (WSR-88D) program is a joint effort of the Department of Commerce (DOC), the Department of Defense (DOD), and the Department of Transportation (DOT) and this radar network was put into operation in 1996 [15]. The Doppler radar radial velocity and reflectivity observations used in this paper (4 h period from 08:00 UTC to 12:00 UTC on 13 August 2004) are from the single coastal radar station named KBYX with high temporal (<6 min) and spatial (~1 km) resolutions [21]. In order to obtain the 2D structure of TC from a single radar, a ground-based velocity track display (GBVTD; see details in [19]) technique was utilized. With this GBVTD algorithm, the 3D TC structure from radar can be deduced into 2D axisymmetric and asymmetric structures. Following Lee and Bell [21], the available radar data used in this study were the axisymmetric structure of radar data, available as azimuthally averaged inner-core radar radial velocity and reflectivity from 1 km to 10 km of height levels. Each level has 60 averaged values from radius of 1 km to 60 km with an interval of 1 km in radial and vertical directions centered on the track of Hurricane Charley (Figure 1).
According to Lee and Bell [21], prior to the creation of a 2D inner-core structure, the radar data went through quality control, including ground clutter, sea clutter, and other noise [23,24]. The observation errors of radar radial velocity (RV) and radar reflectivity (RF) are 2 ms−1 and 2 dBZ, respectively.

2.3. Experiment Design

The hurricane forecast simulations are conducted using version 3.8.1 of the WRF model [25] and the WRF Data Assimilation (WRFDA) system using the 4D-VAR method [26] and are employed for assimilation experiments. Compared to the 3D-VAR data assimilation method that is commonly applied for the assimilation of conventional large-scale observations [27,28], the 4D-VAR radar data assimilation can lead to a better forecast result [28]. The WRF model is compiled with a moving nest based on an automatic vortex-following algorithm which is designed to follow the movement of TCs [25].
The simulations are conducted using two-way interactive nested domains with the grid sizes of 100 × 100, 142 × 142, and 100 × 100 and horizontal grid spacings of 36, 12, and 4 km, respectively. The number of vertical Eta levels is 34 and the altitude range is automatically generated using the WRF model. Following a series of previous studies, the boundary conditions are derived from the National Centers for Environmental Prediction (NECP) Global Forecast System final (FNL) gridded reanalysis dataset [1,2,3,9,10,11] with the resolution of 1° × 1°. The model physics scheme choices for hurricane application (Table 2) are based on the WRF official user guide and cumulus process for outer domains of 36 and 12 km only.
To examine whether the assimilation of 2D radar structure data could improve the hurricane forecast, the control (CTRL) experiment without radar data assimilations was set as follows: The WRF model was integrated 5h from 06:00 UTC to 11:00 UTC on 13 August to provide a first guess for data assimilation and all conventional data available are assimilated into the model to decrease the spin-up time [29]. Then, the forecast continues till 06:00 UTC on 14 August. For the radar data assimilation experiments, three cases were conducted with various configurations with assimilation of radar observations (Table 3) and the radar data were assimilated into the innermost domain. To ensure the radar data quality and the stability of the first guess, the assimilation time was chosen at 11:00 UTC on 13 August, when the hurricane was far away from the Cuba inland. The first guess (background) was the same as CTRL and the background error covariance was generated using the National Meteorological Center method (now known as NCEP) for both CTRL and radar data assimilation experiments. Considering the radar observations could only reflect the averaged state of the hurricane’s inner-core structure, the assimilation window was set up for 30 min in all experiments from 11:00 UTC to 11:30 UTC on 13 August. Inside the DA system, the radar data quality was further examined by the default quality-control process. After the DAs, new initial analysis fields and boundary conditions were produced and the model simulations were integrated from 11:00 UTC on 13 August to 06:00 UTC on 14 August. The comparison between these experiments mainly focused on the time of 18:00 UTC on 13 August, which is near and before the hurricane’s landfall.

3. Results

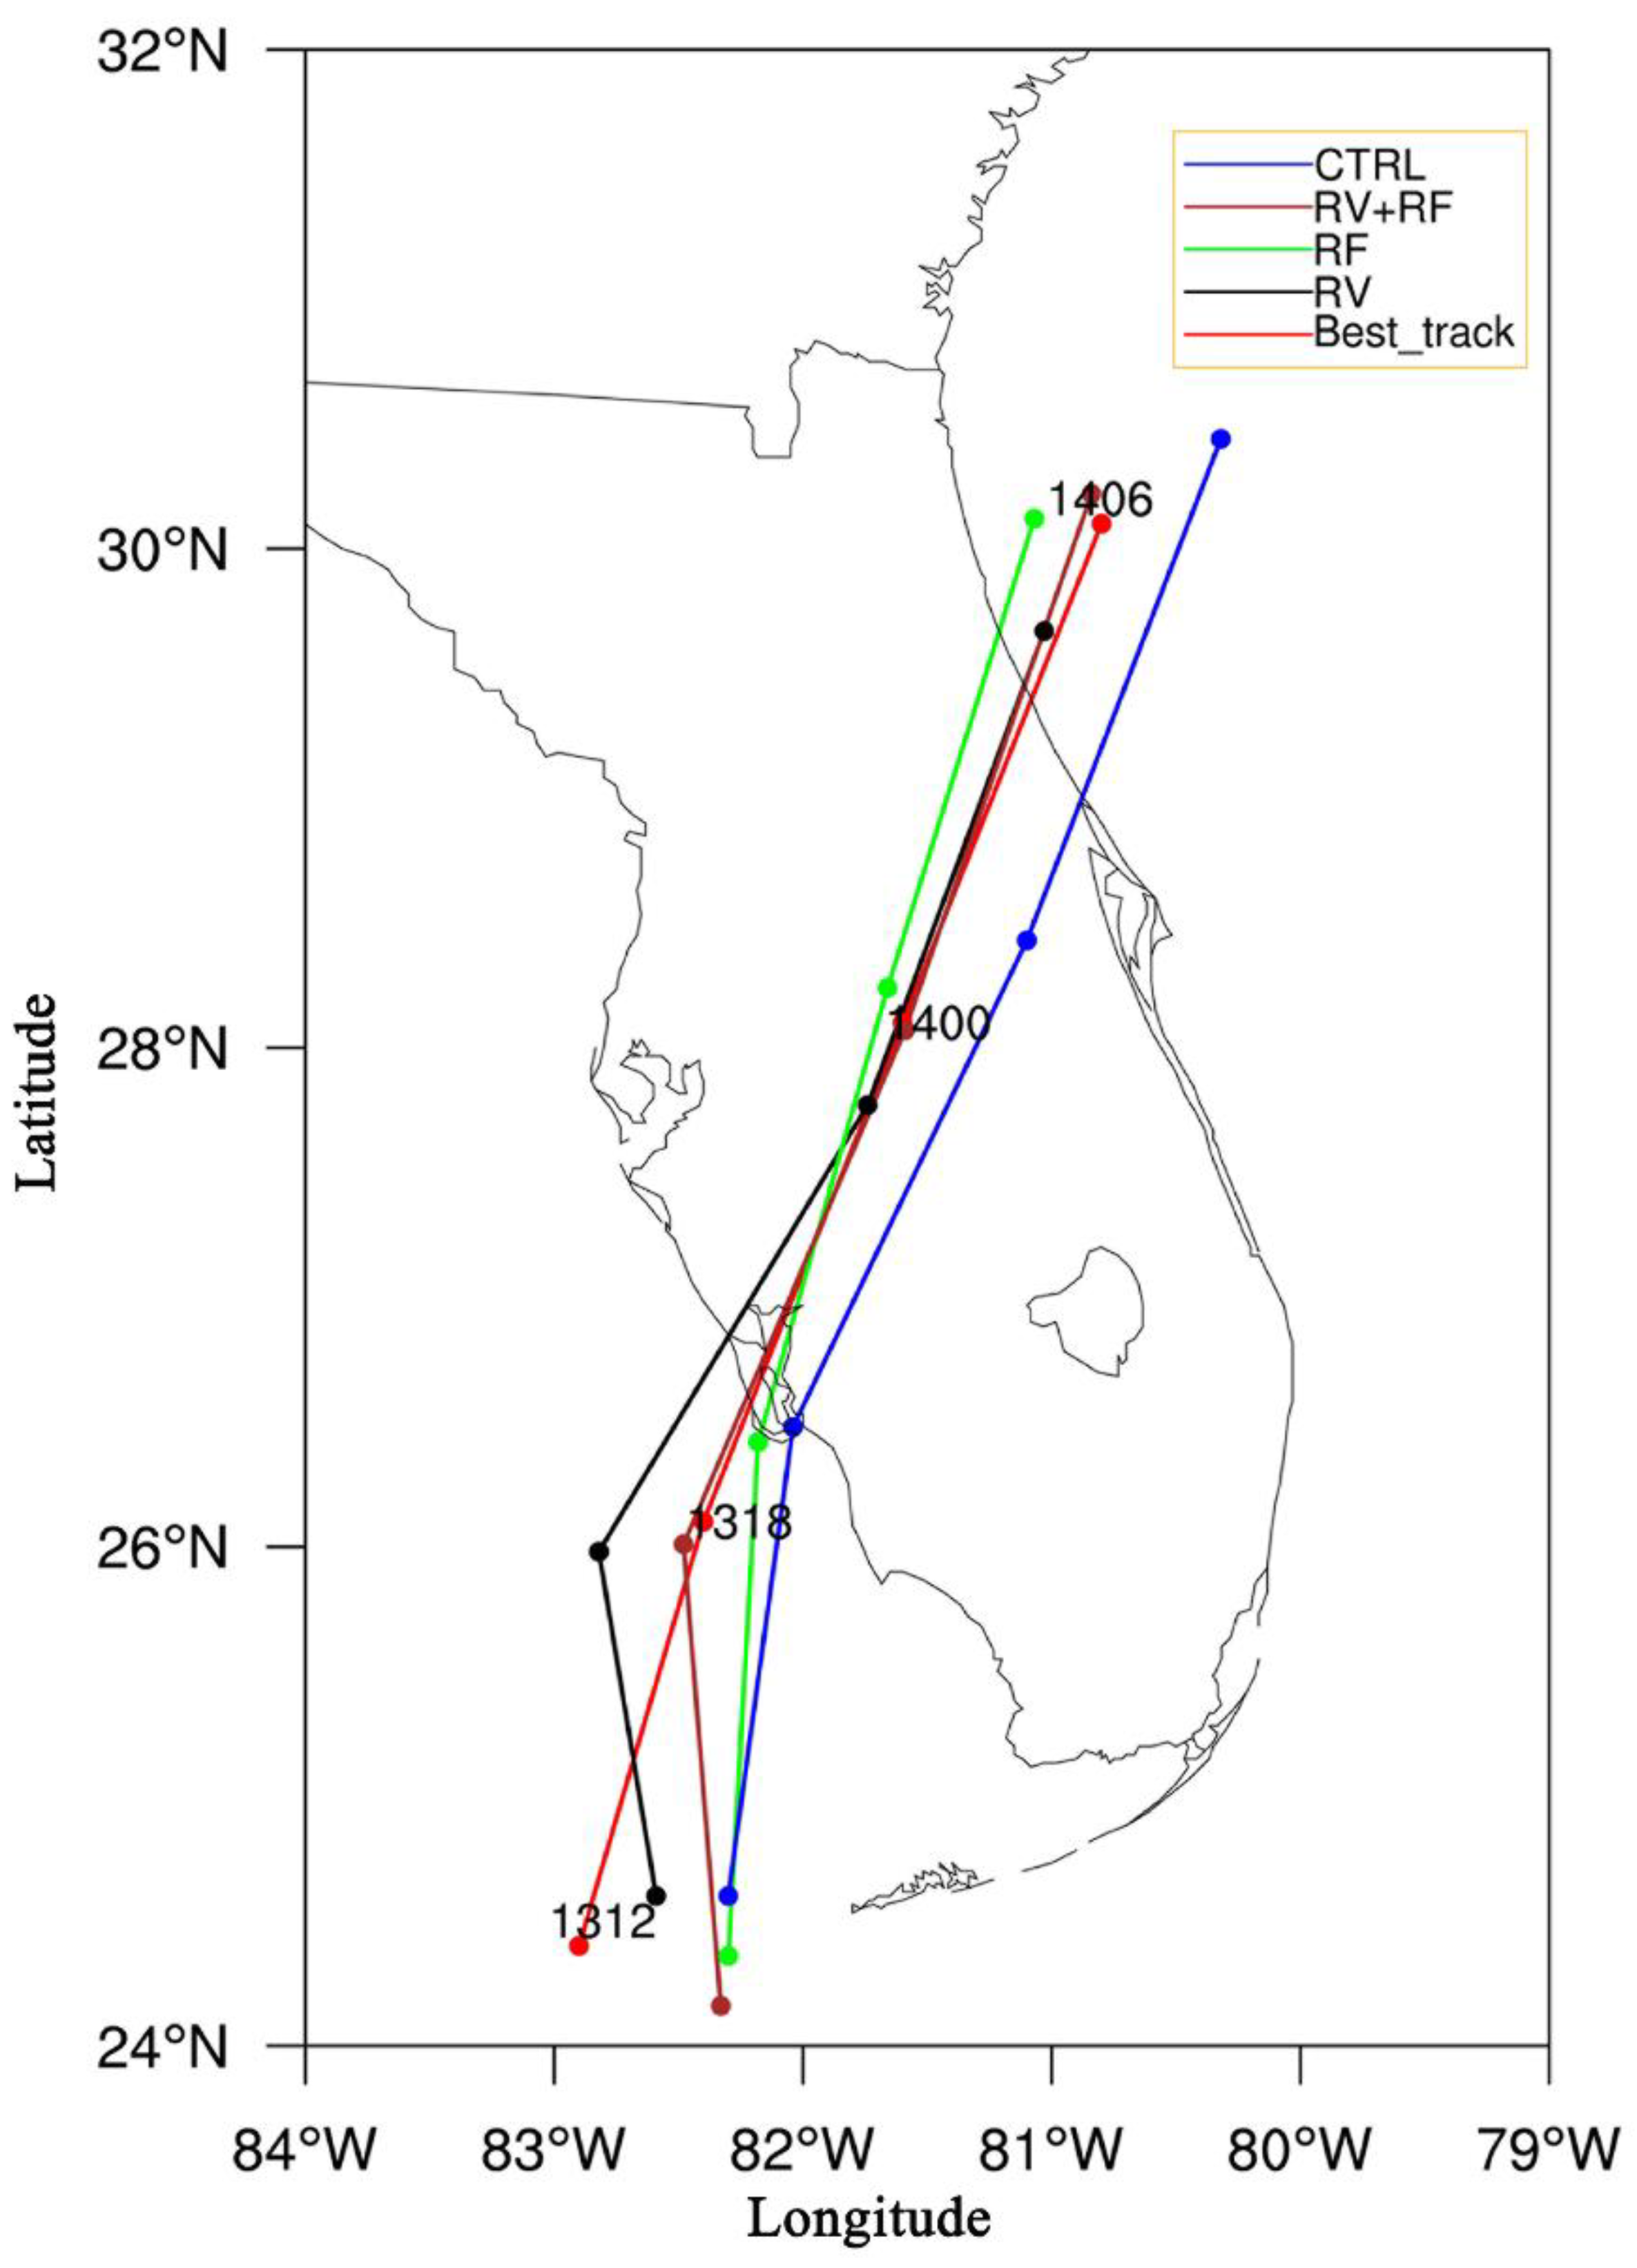
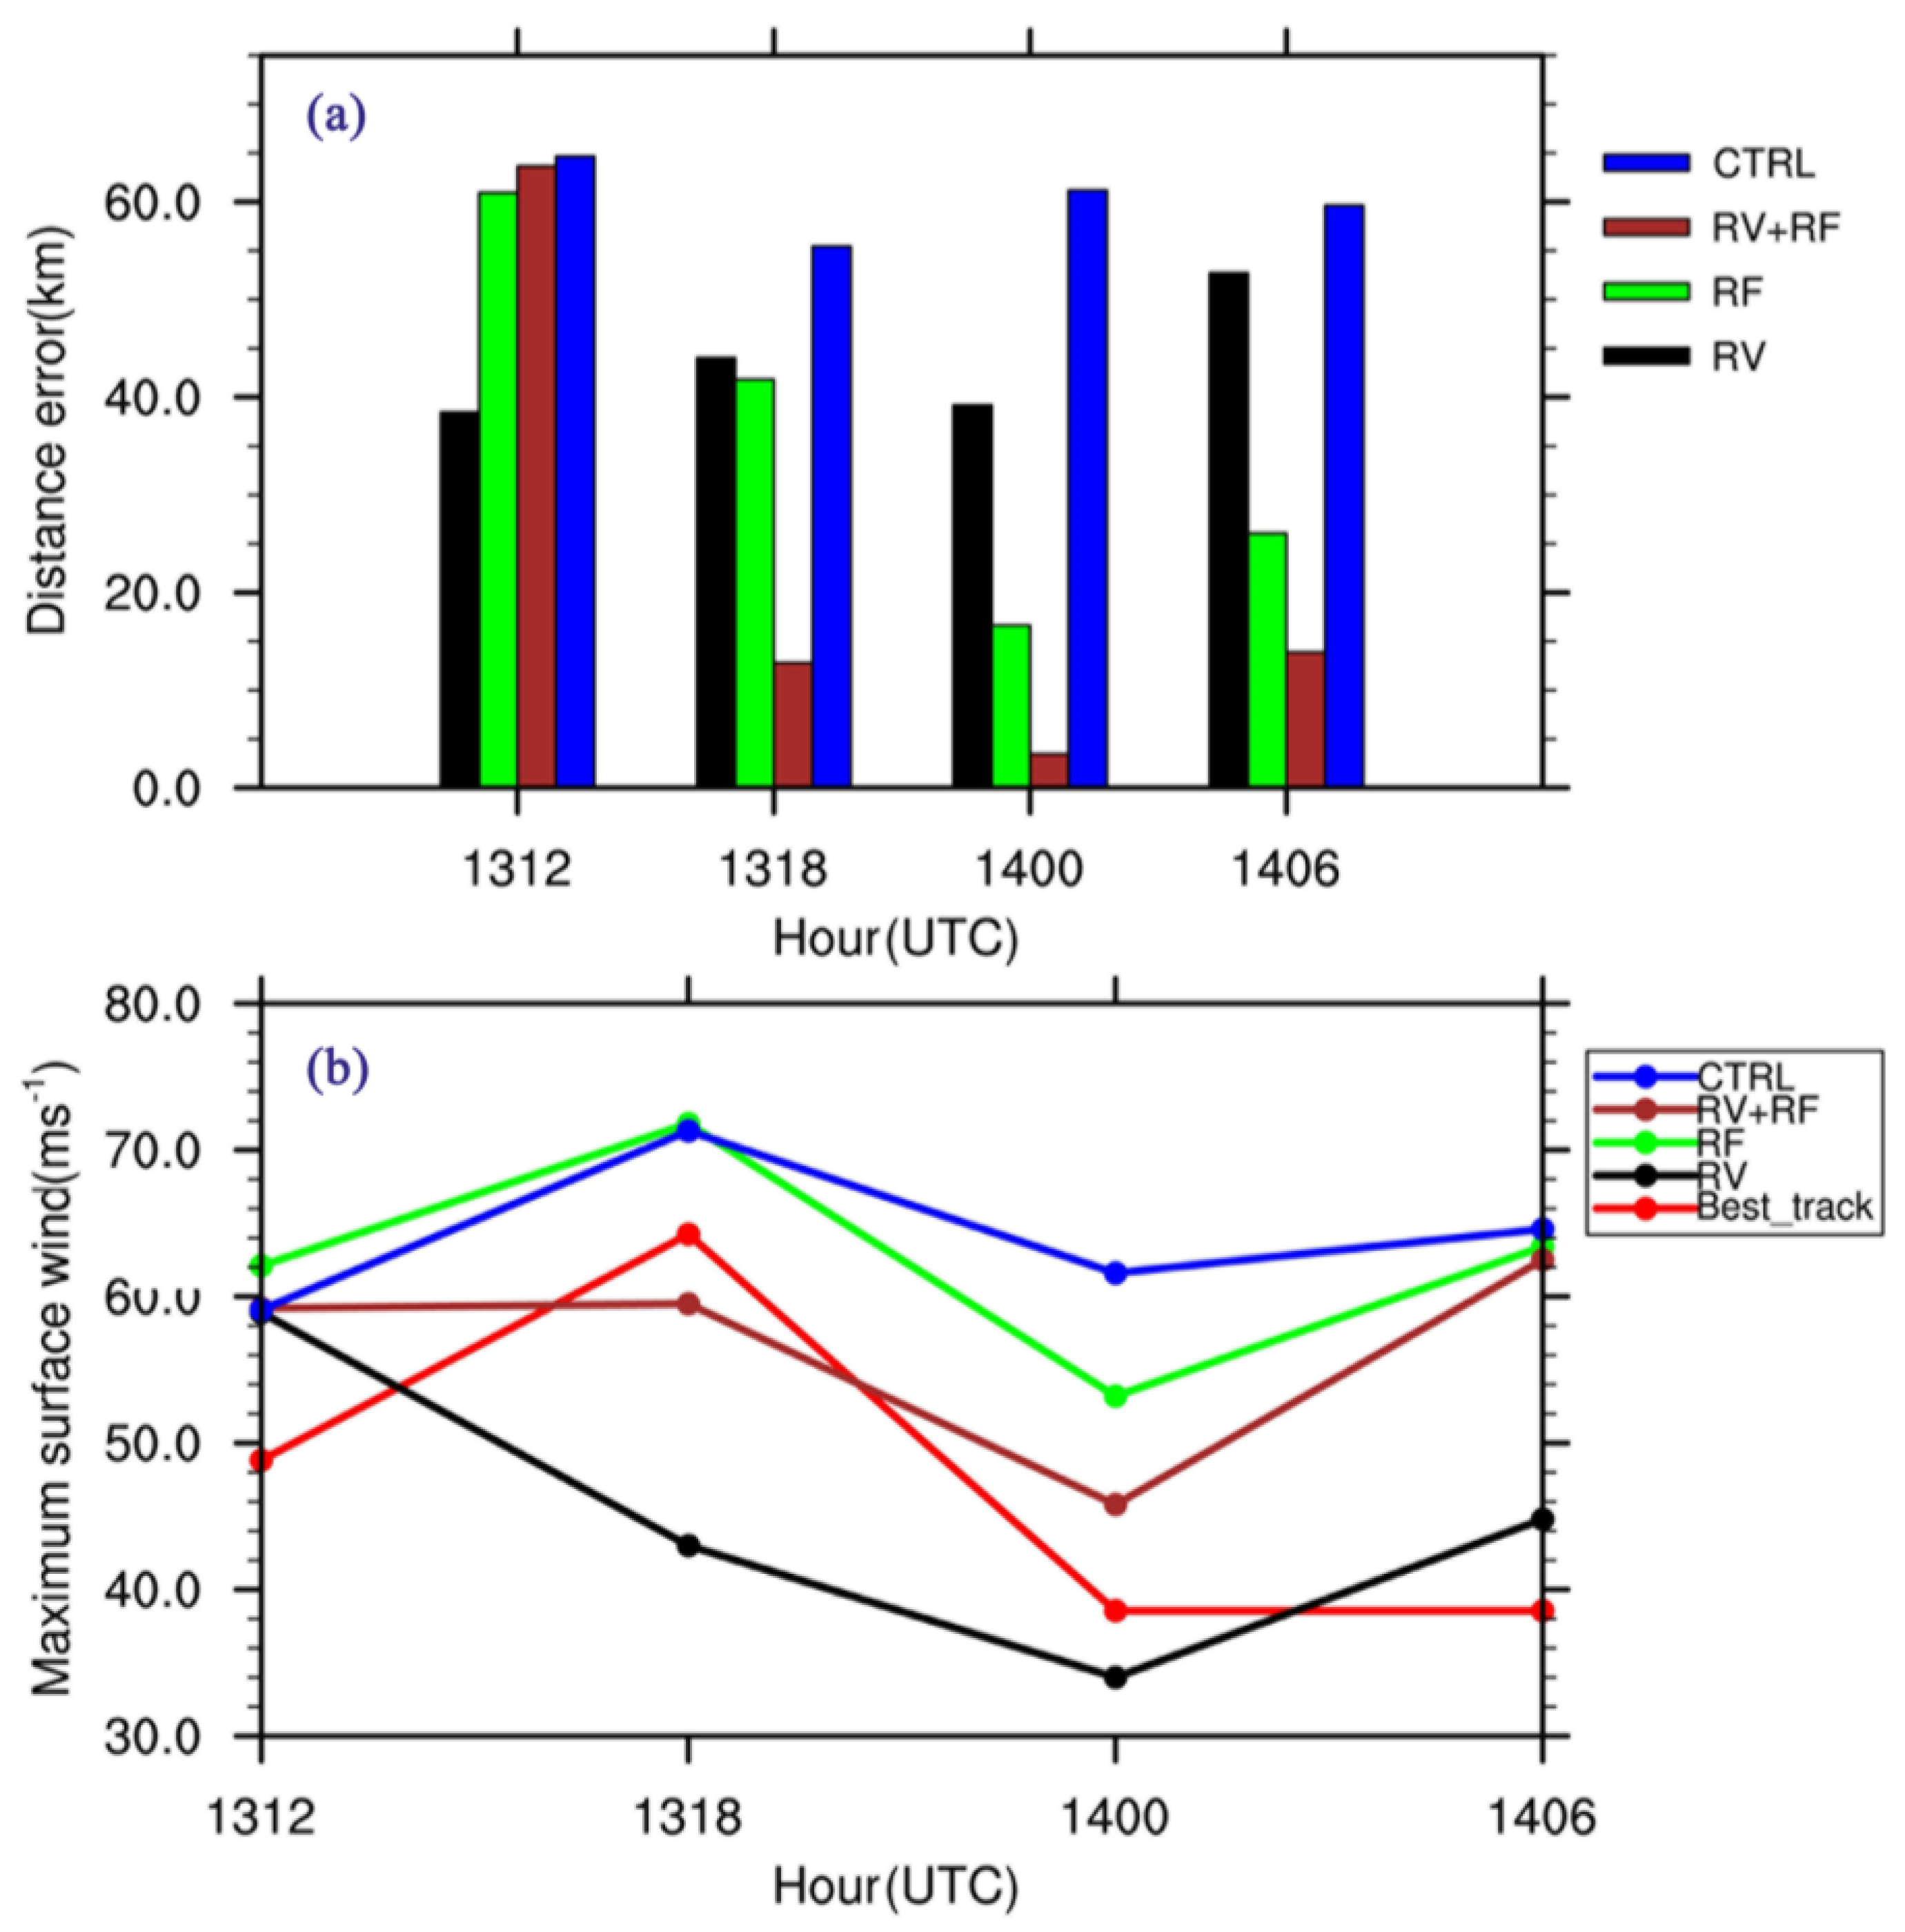
3.1. Hurricane Track and Intensity Forecasts

Track forecasts from CTRL and experiments with radar DA were compared with the National Hurricane Center’s (NHCs) best track data (Figure 2). It is obvious that the CTRL forecasts have the most eastern tracks and fastest moves, compared to the best track data and DA experiments. As shown in Figure 3a, the averaged distance errors of CTRL, RV, RF, and RV + RF are 60, 44, 36, and 23 km, respectively. All simulations with DA have better track forecasts than CTRL does, especially the RV + RF experiment. Among the simulations with DA, the storm from RV moves slower than that from RF. During the entire period, the forecasts near and after landfall have the smallest track errors, implying that the assimilation of 2D radar-derived inner-core structures from coastal radar on the sea-island could help improve the hurricane landfall forecasts in advance.
Figure 3b shows the intensity forecasts of maximum wind speed (MWS). The assimilation of radial velocity leads to overall negative biases, compared to the positive biases from experiments with assimilation of radar reflectivity. Nevertheless, in terms of public warning, an overestimated forecast of MWS is much better than an underestimate one. When we concentrate on the period near and after the landfall (13:18 UTC and 14:00 UTC), among these DA experiments, the assimilation of both radar radial velocity and reflectivity has the best forecasts with a mean wind speed error of 6 ms−1, compared to the errors in CTRL, RV, and RF of 15, 13, and 11 ms−1.
Overall, among these simulations with radar DA, the RV + RF experiment leads to the best forecasts. Moreover, the assimilation of radar reflectivity has relatively better results than that of the assimilation of radial velocity. It is likely to be related to the condition that the reflectivity usually varies with radius, while the radial velocity often varies with angle [20]. When these two variables are averaged along with radius circles, the radial velocity would lose more characteristics than radar reflectivity. Therefore, in terms of azimuthally averaged hurricane inner-core structure, radial velocity would have worse representation than the reflectivity.

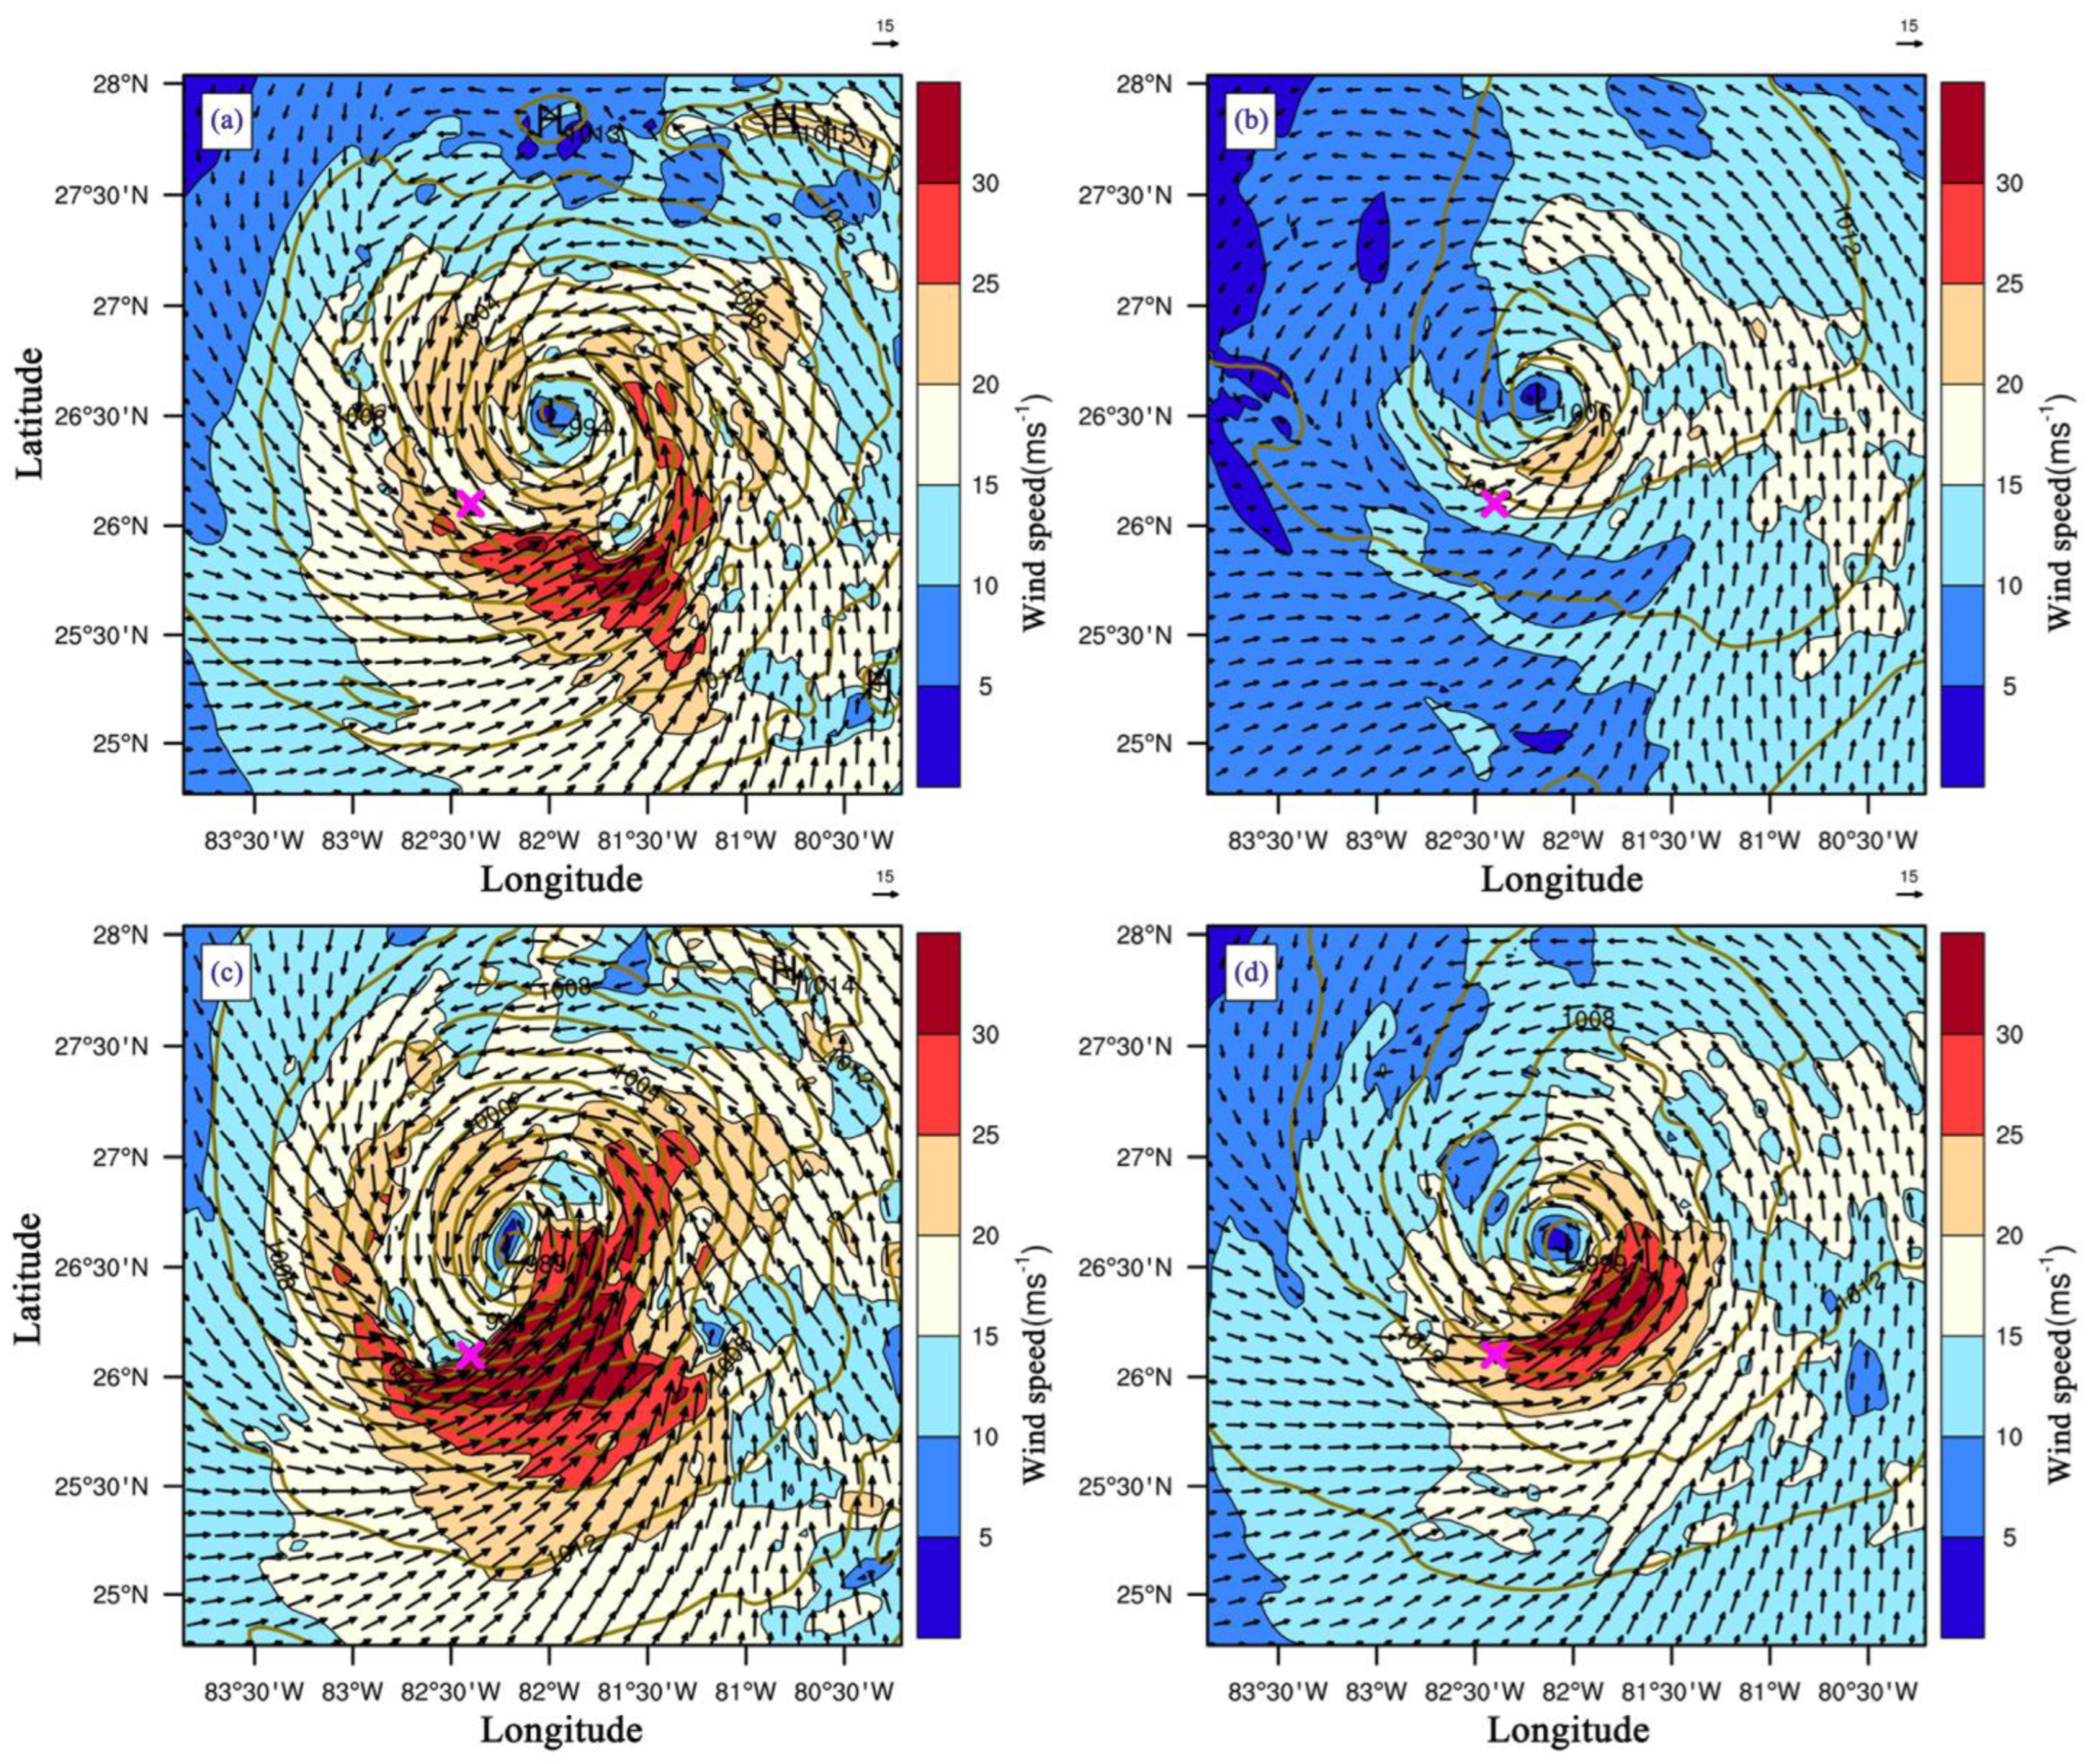
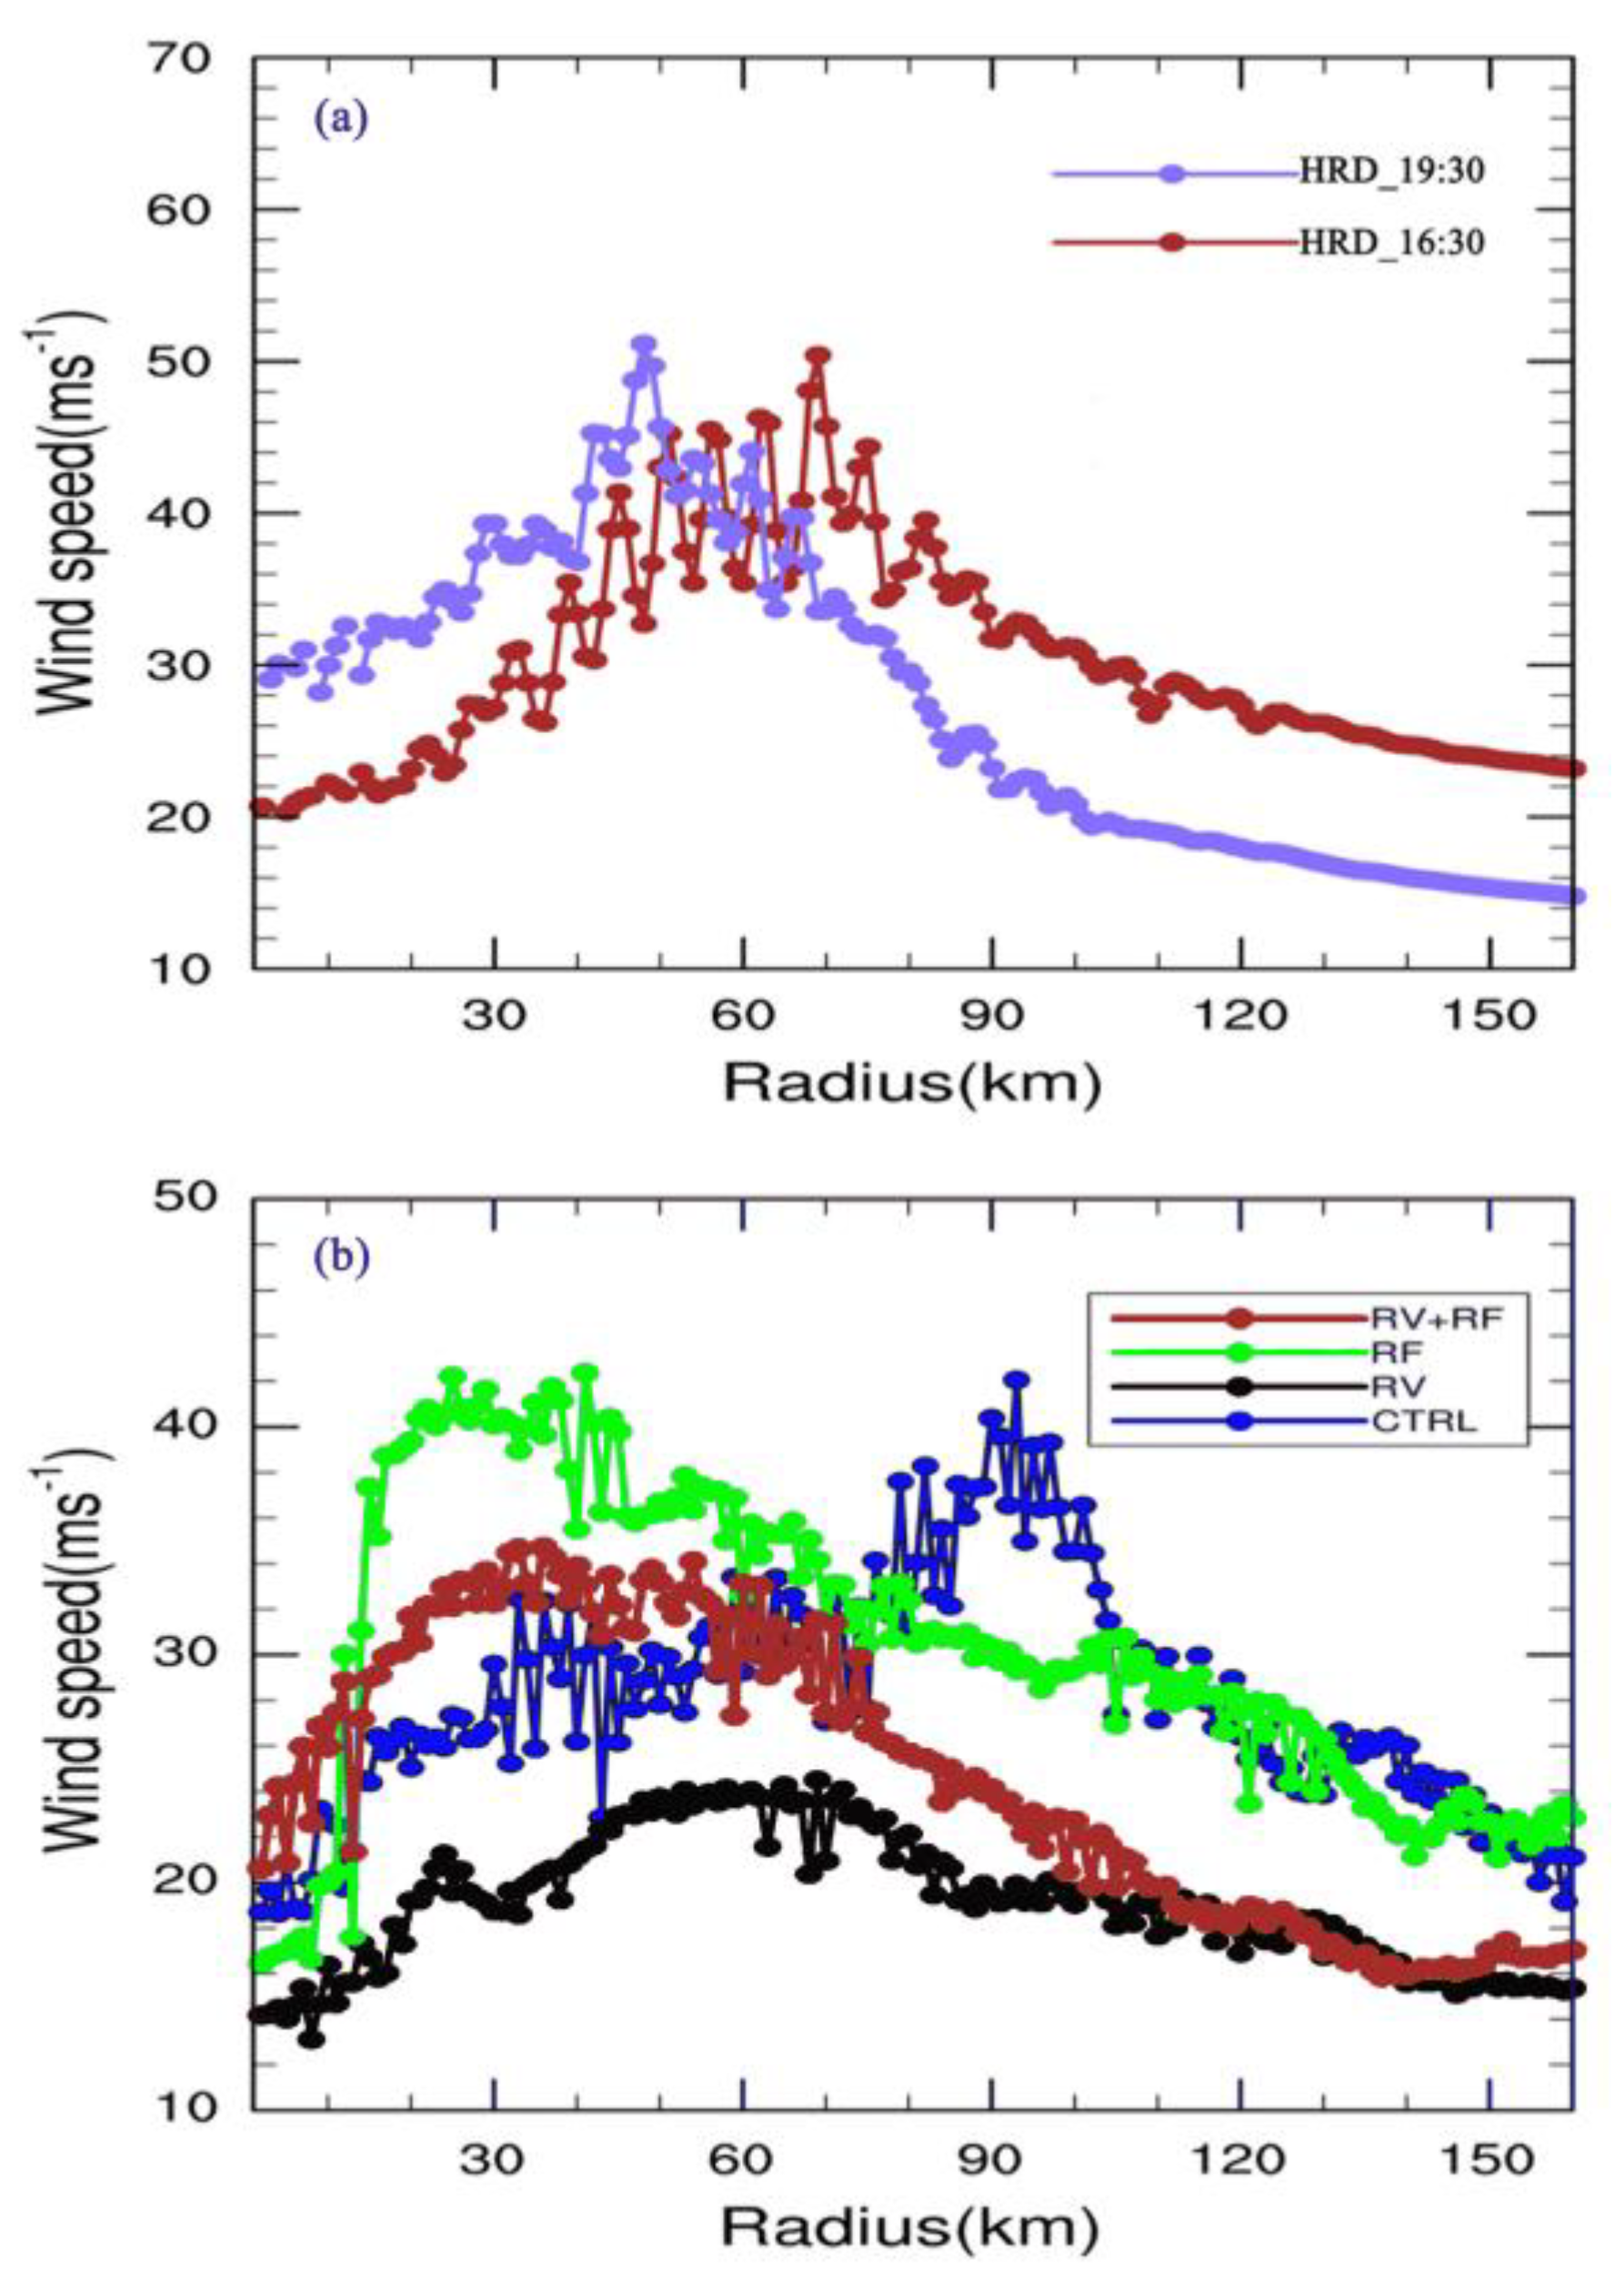
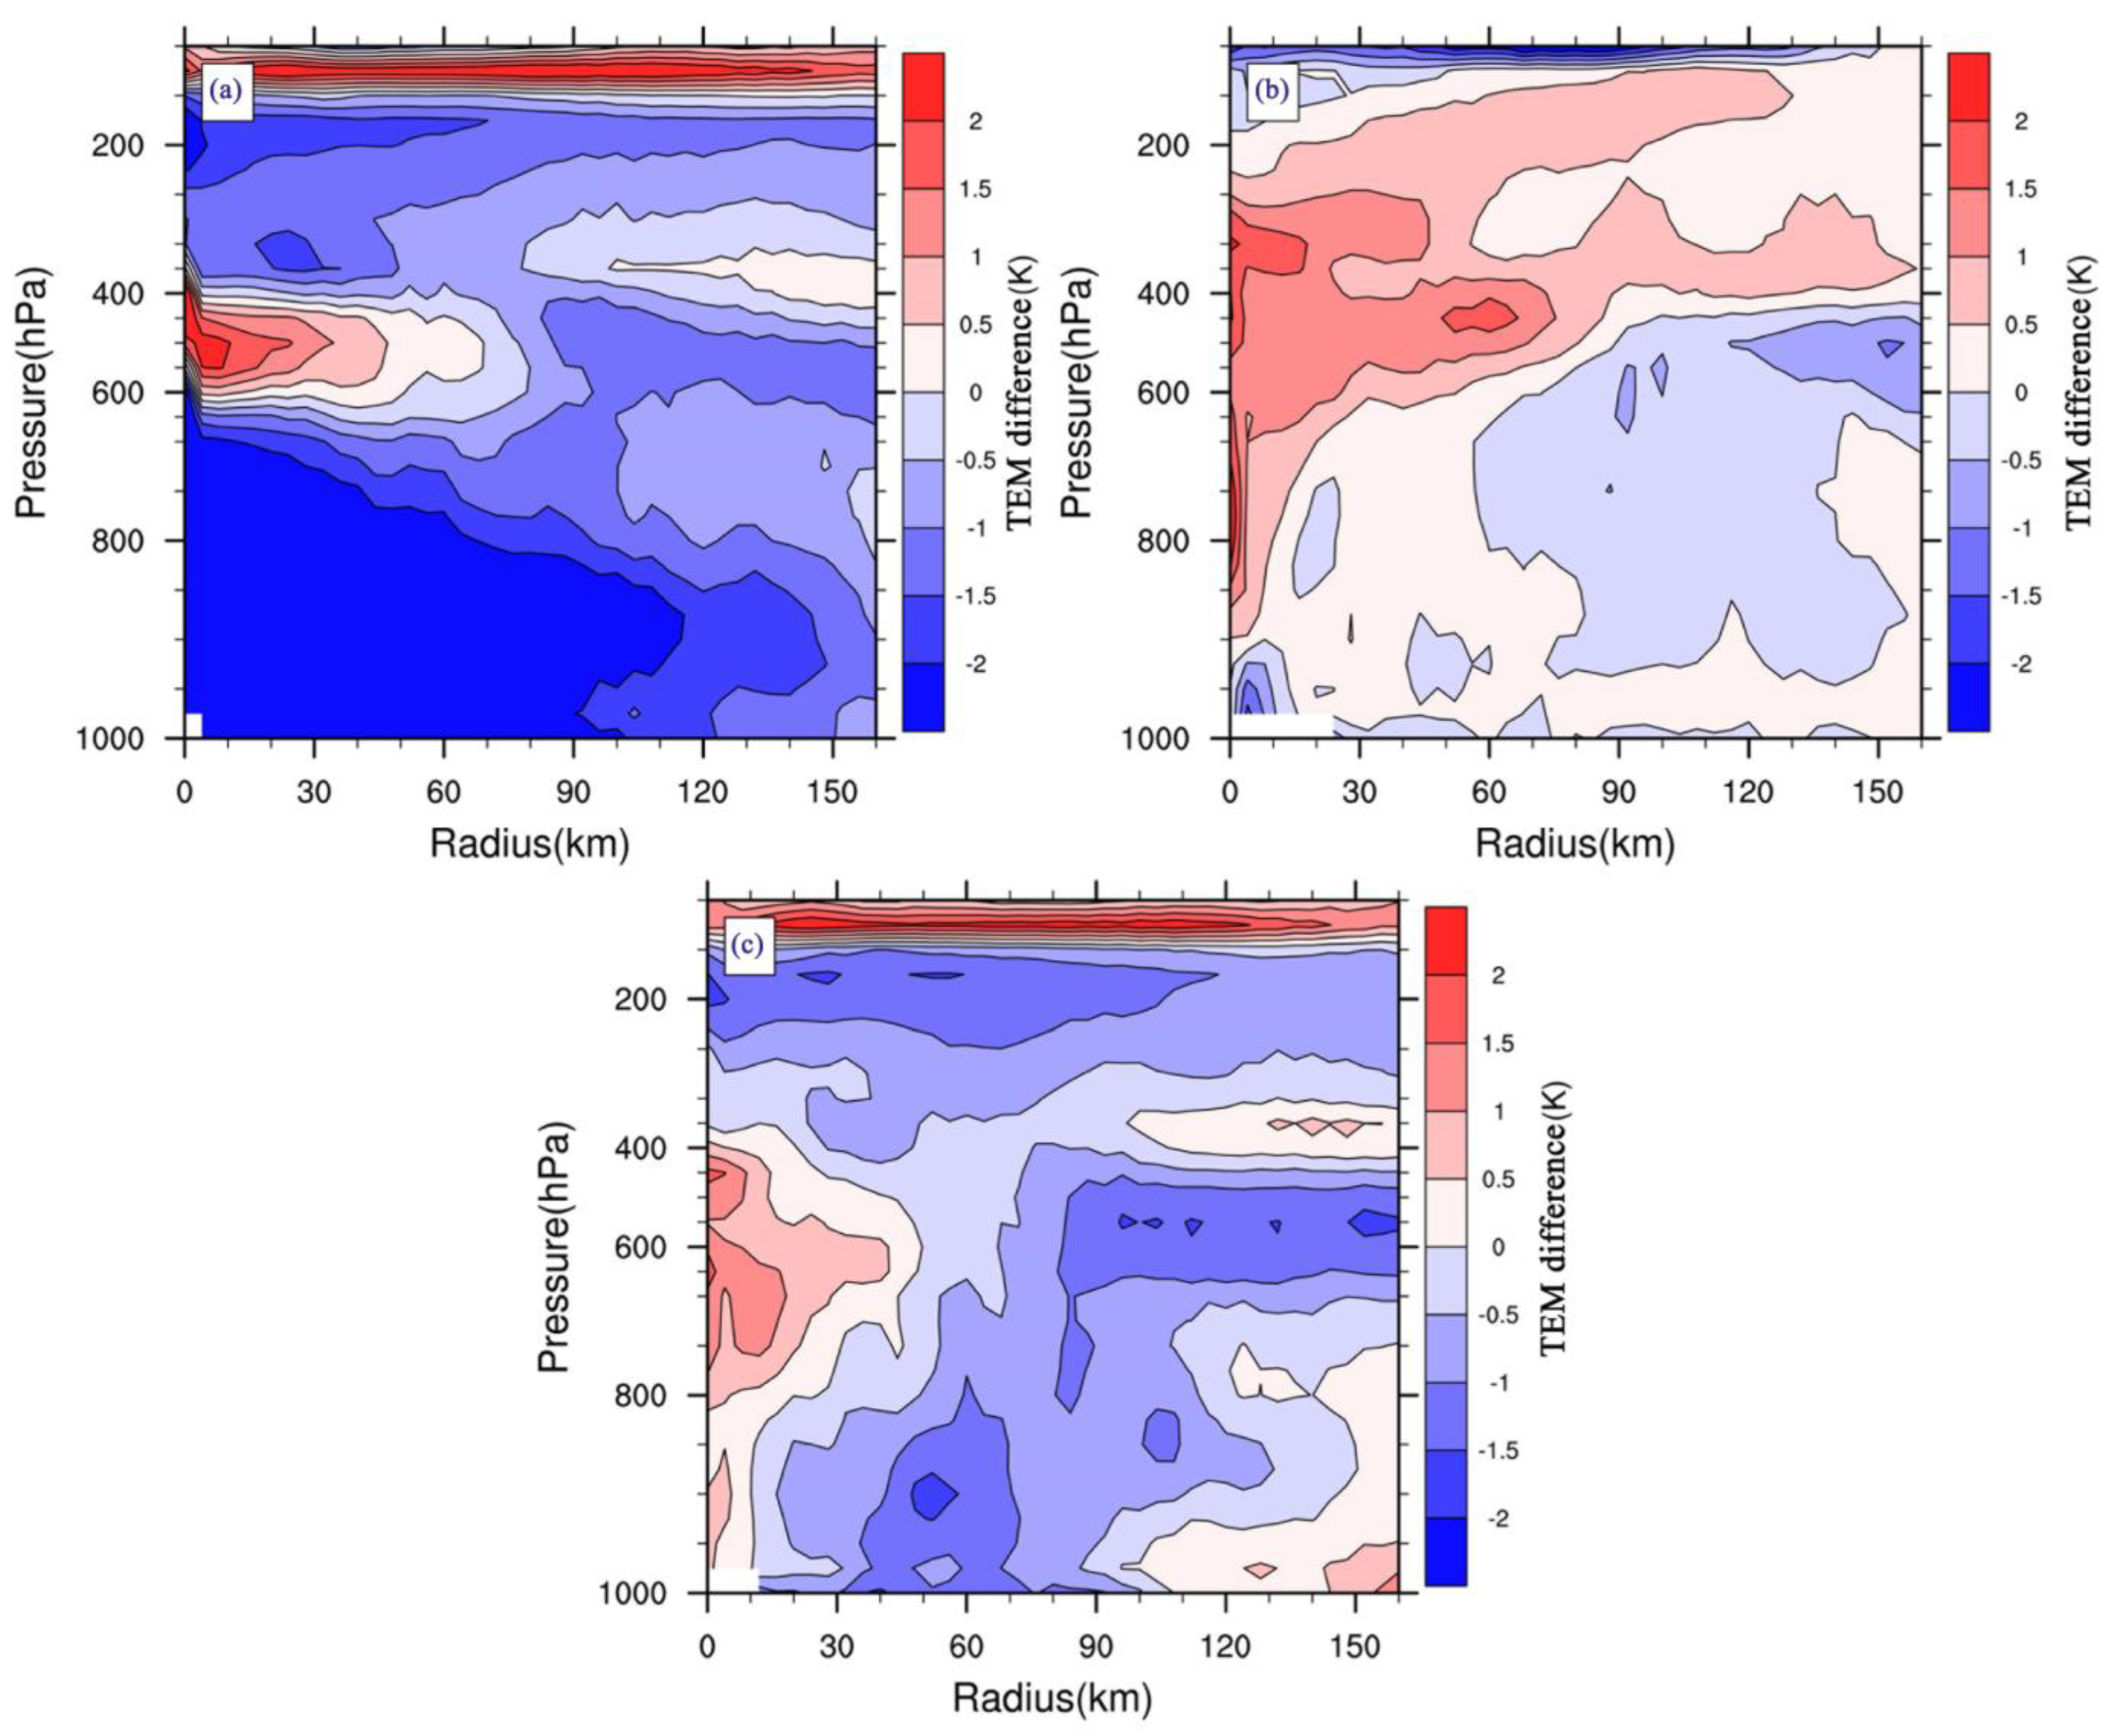
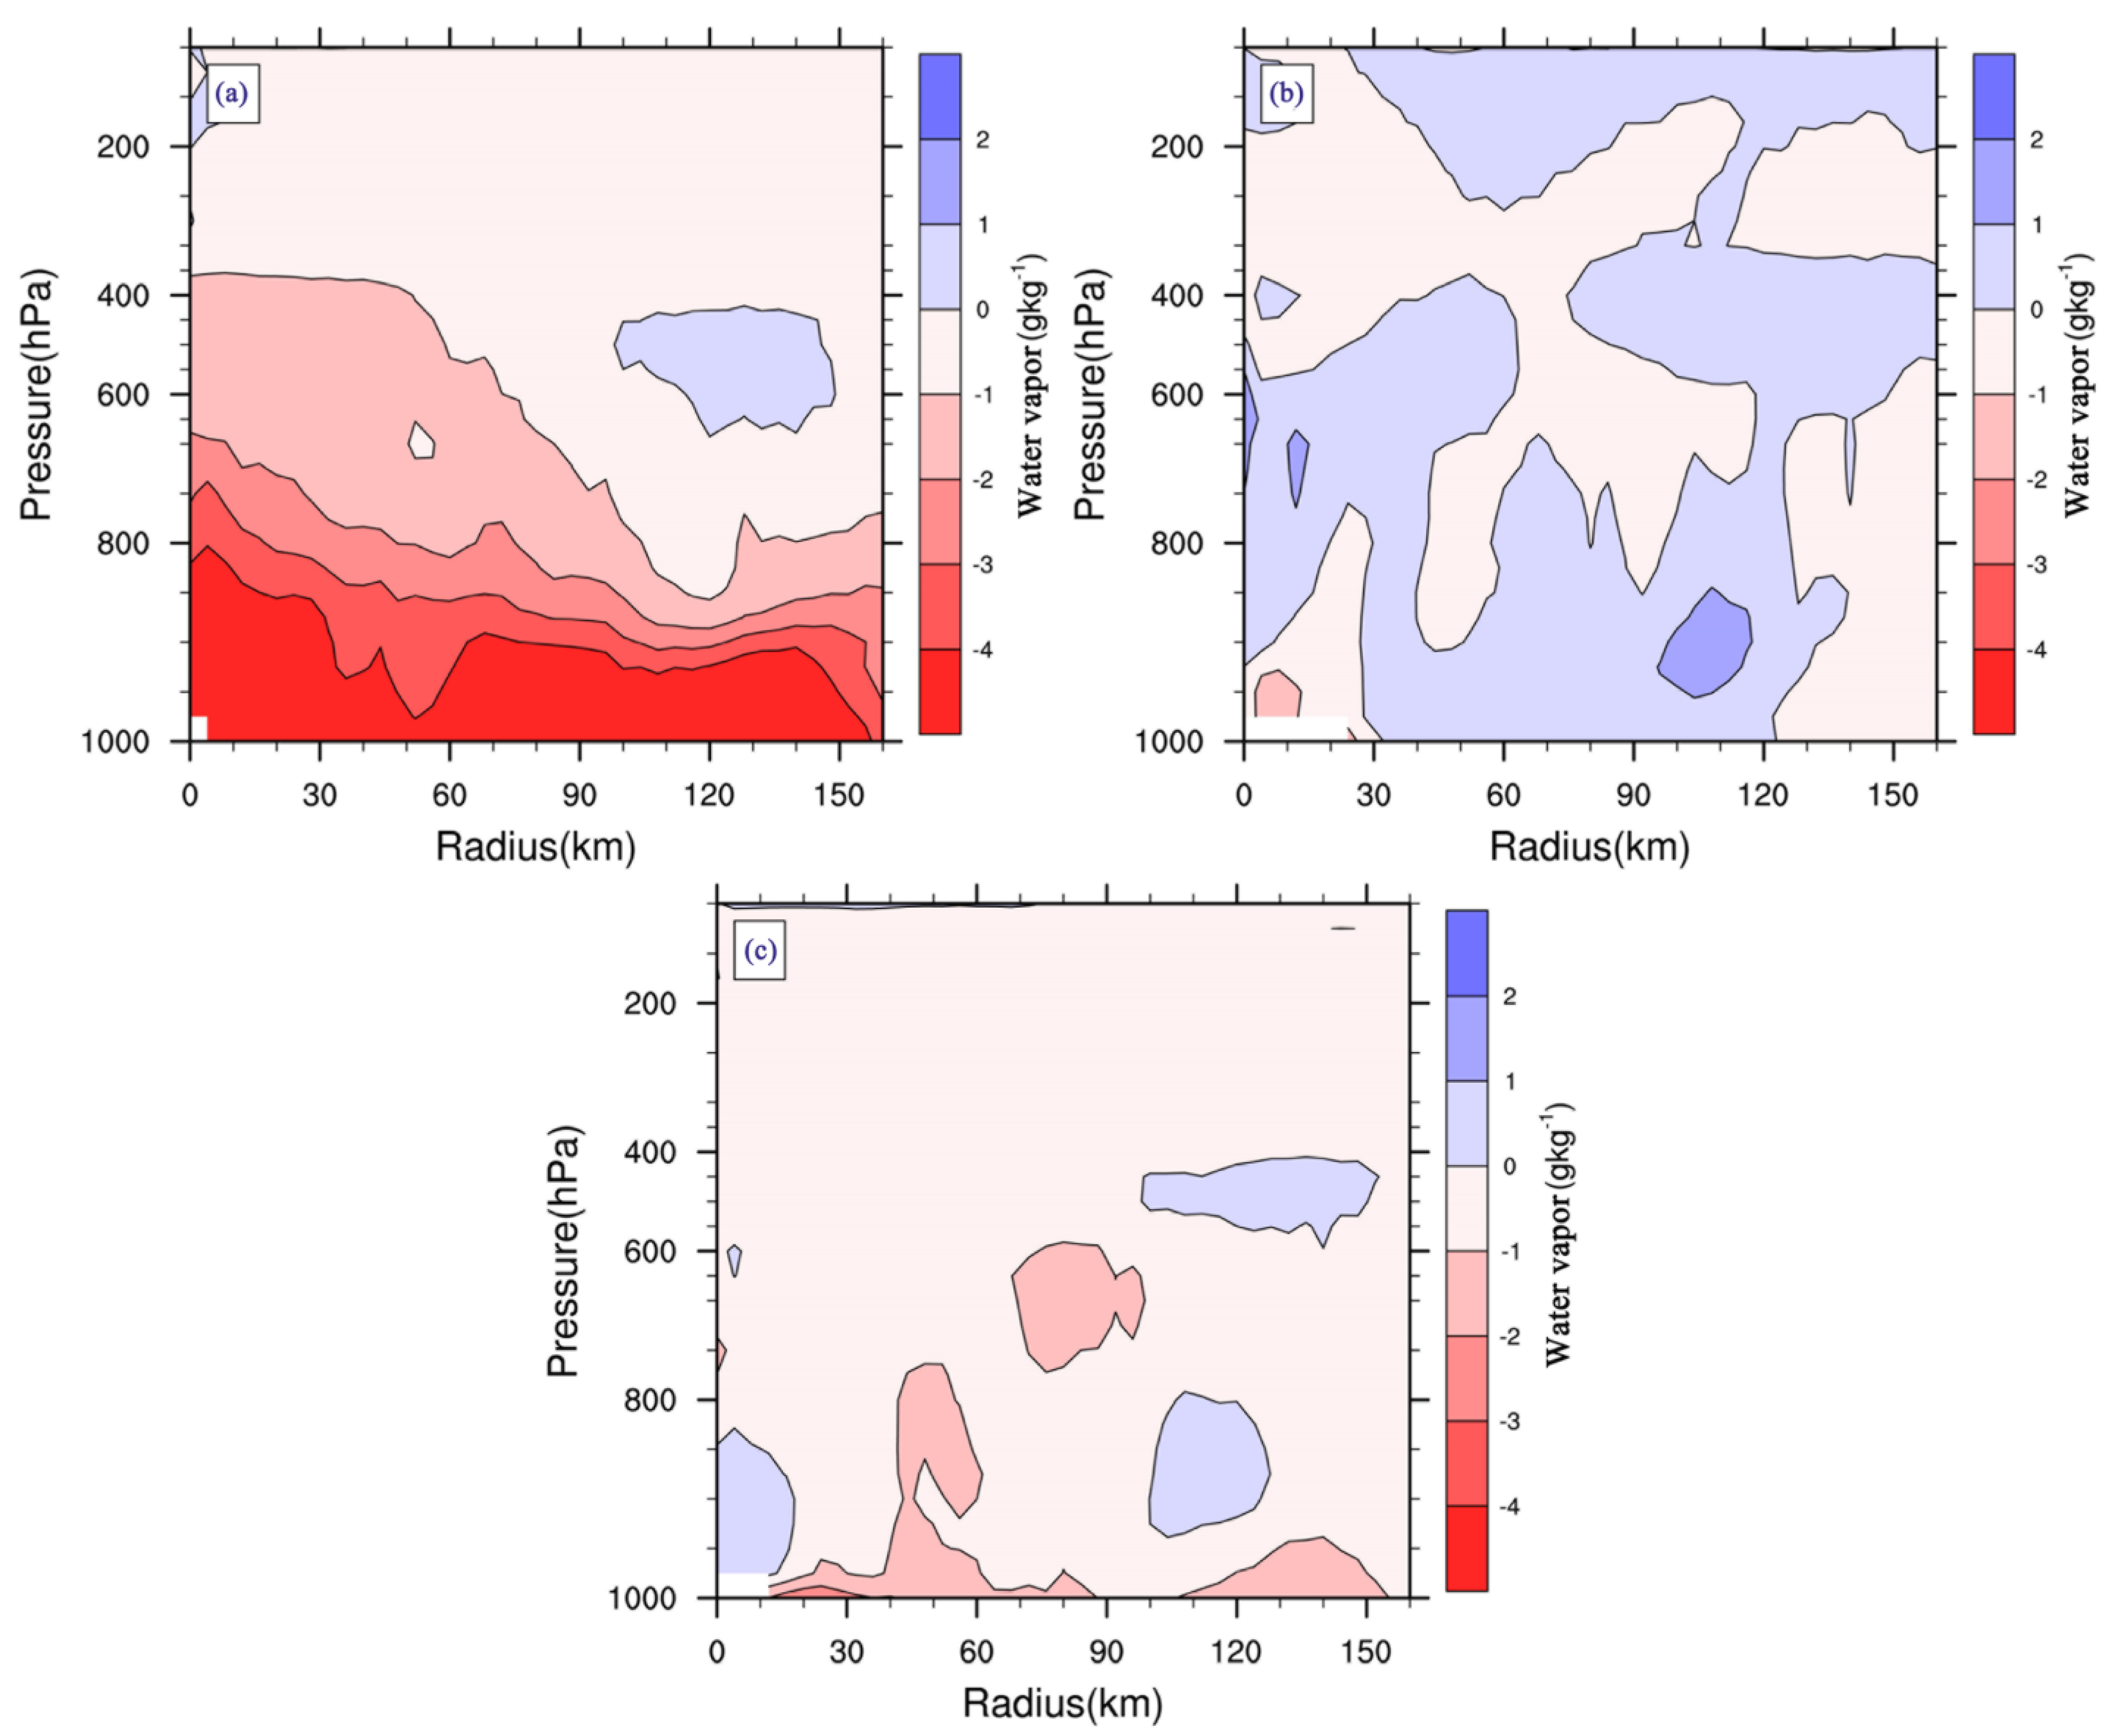
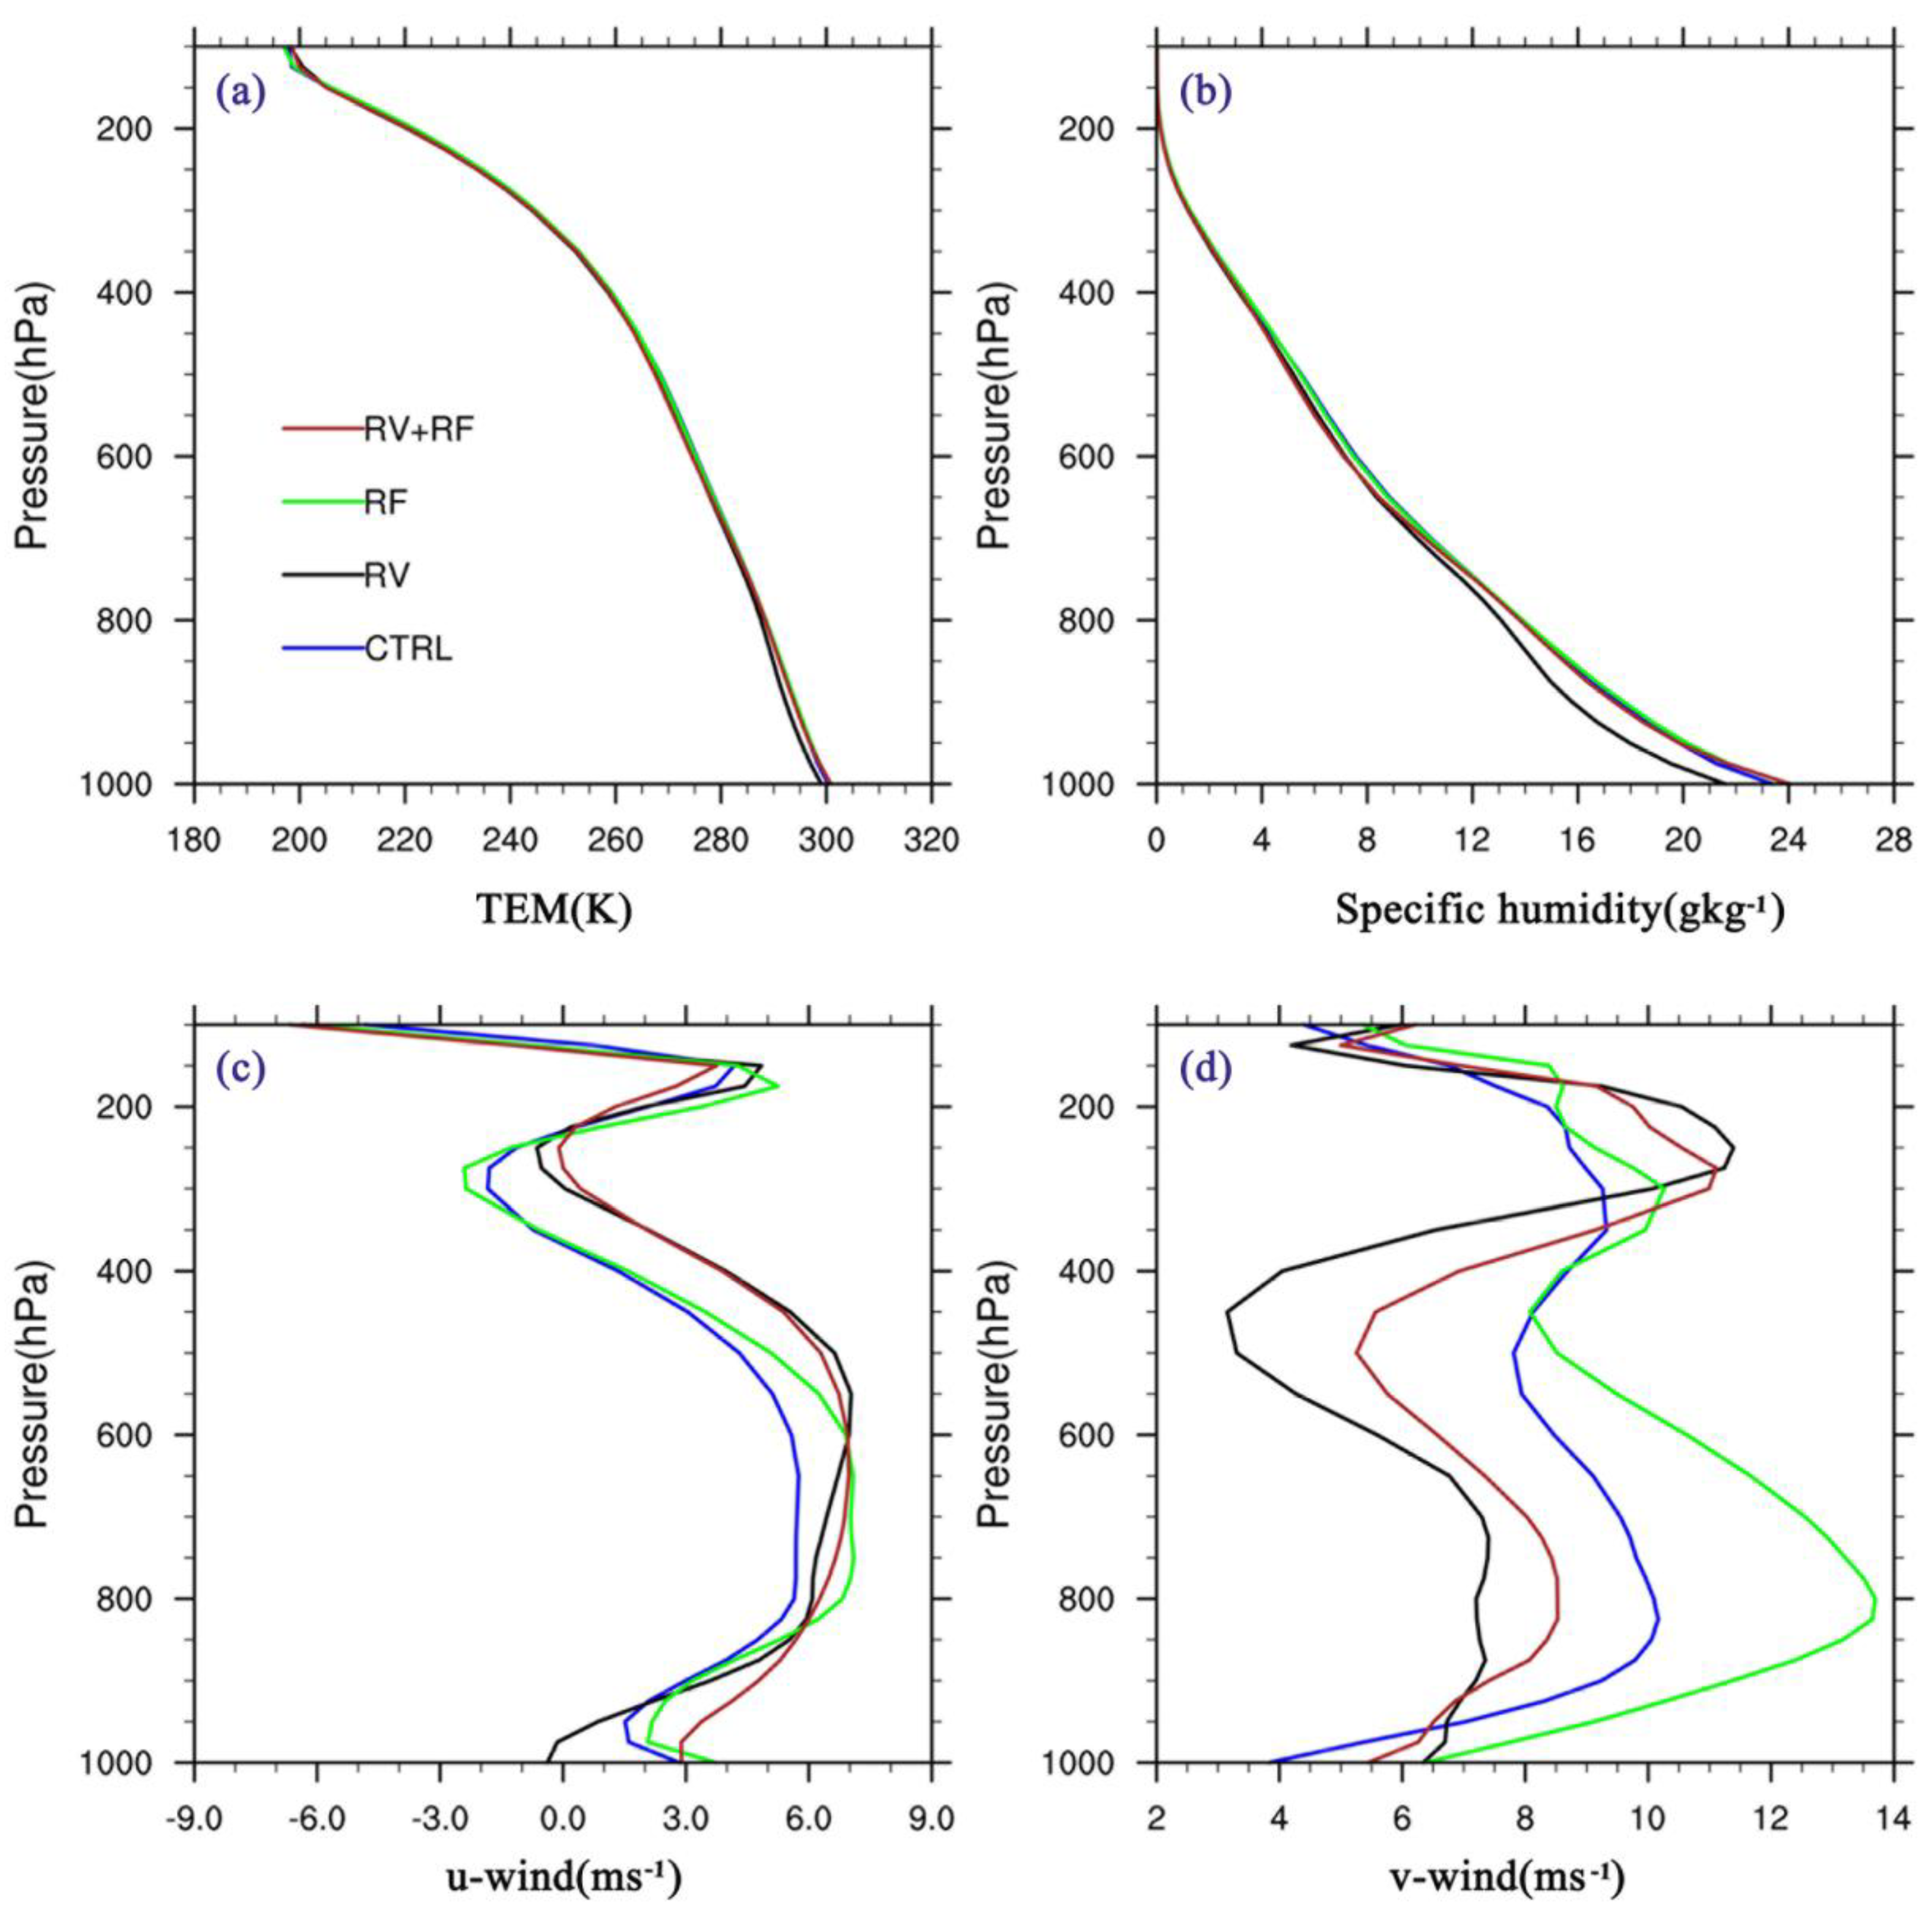
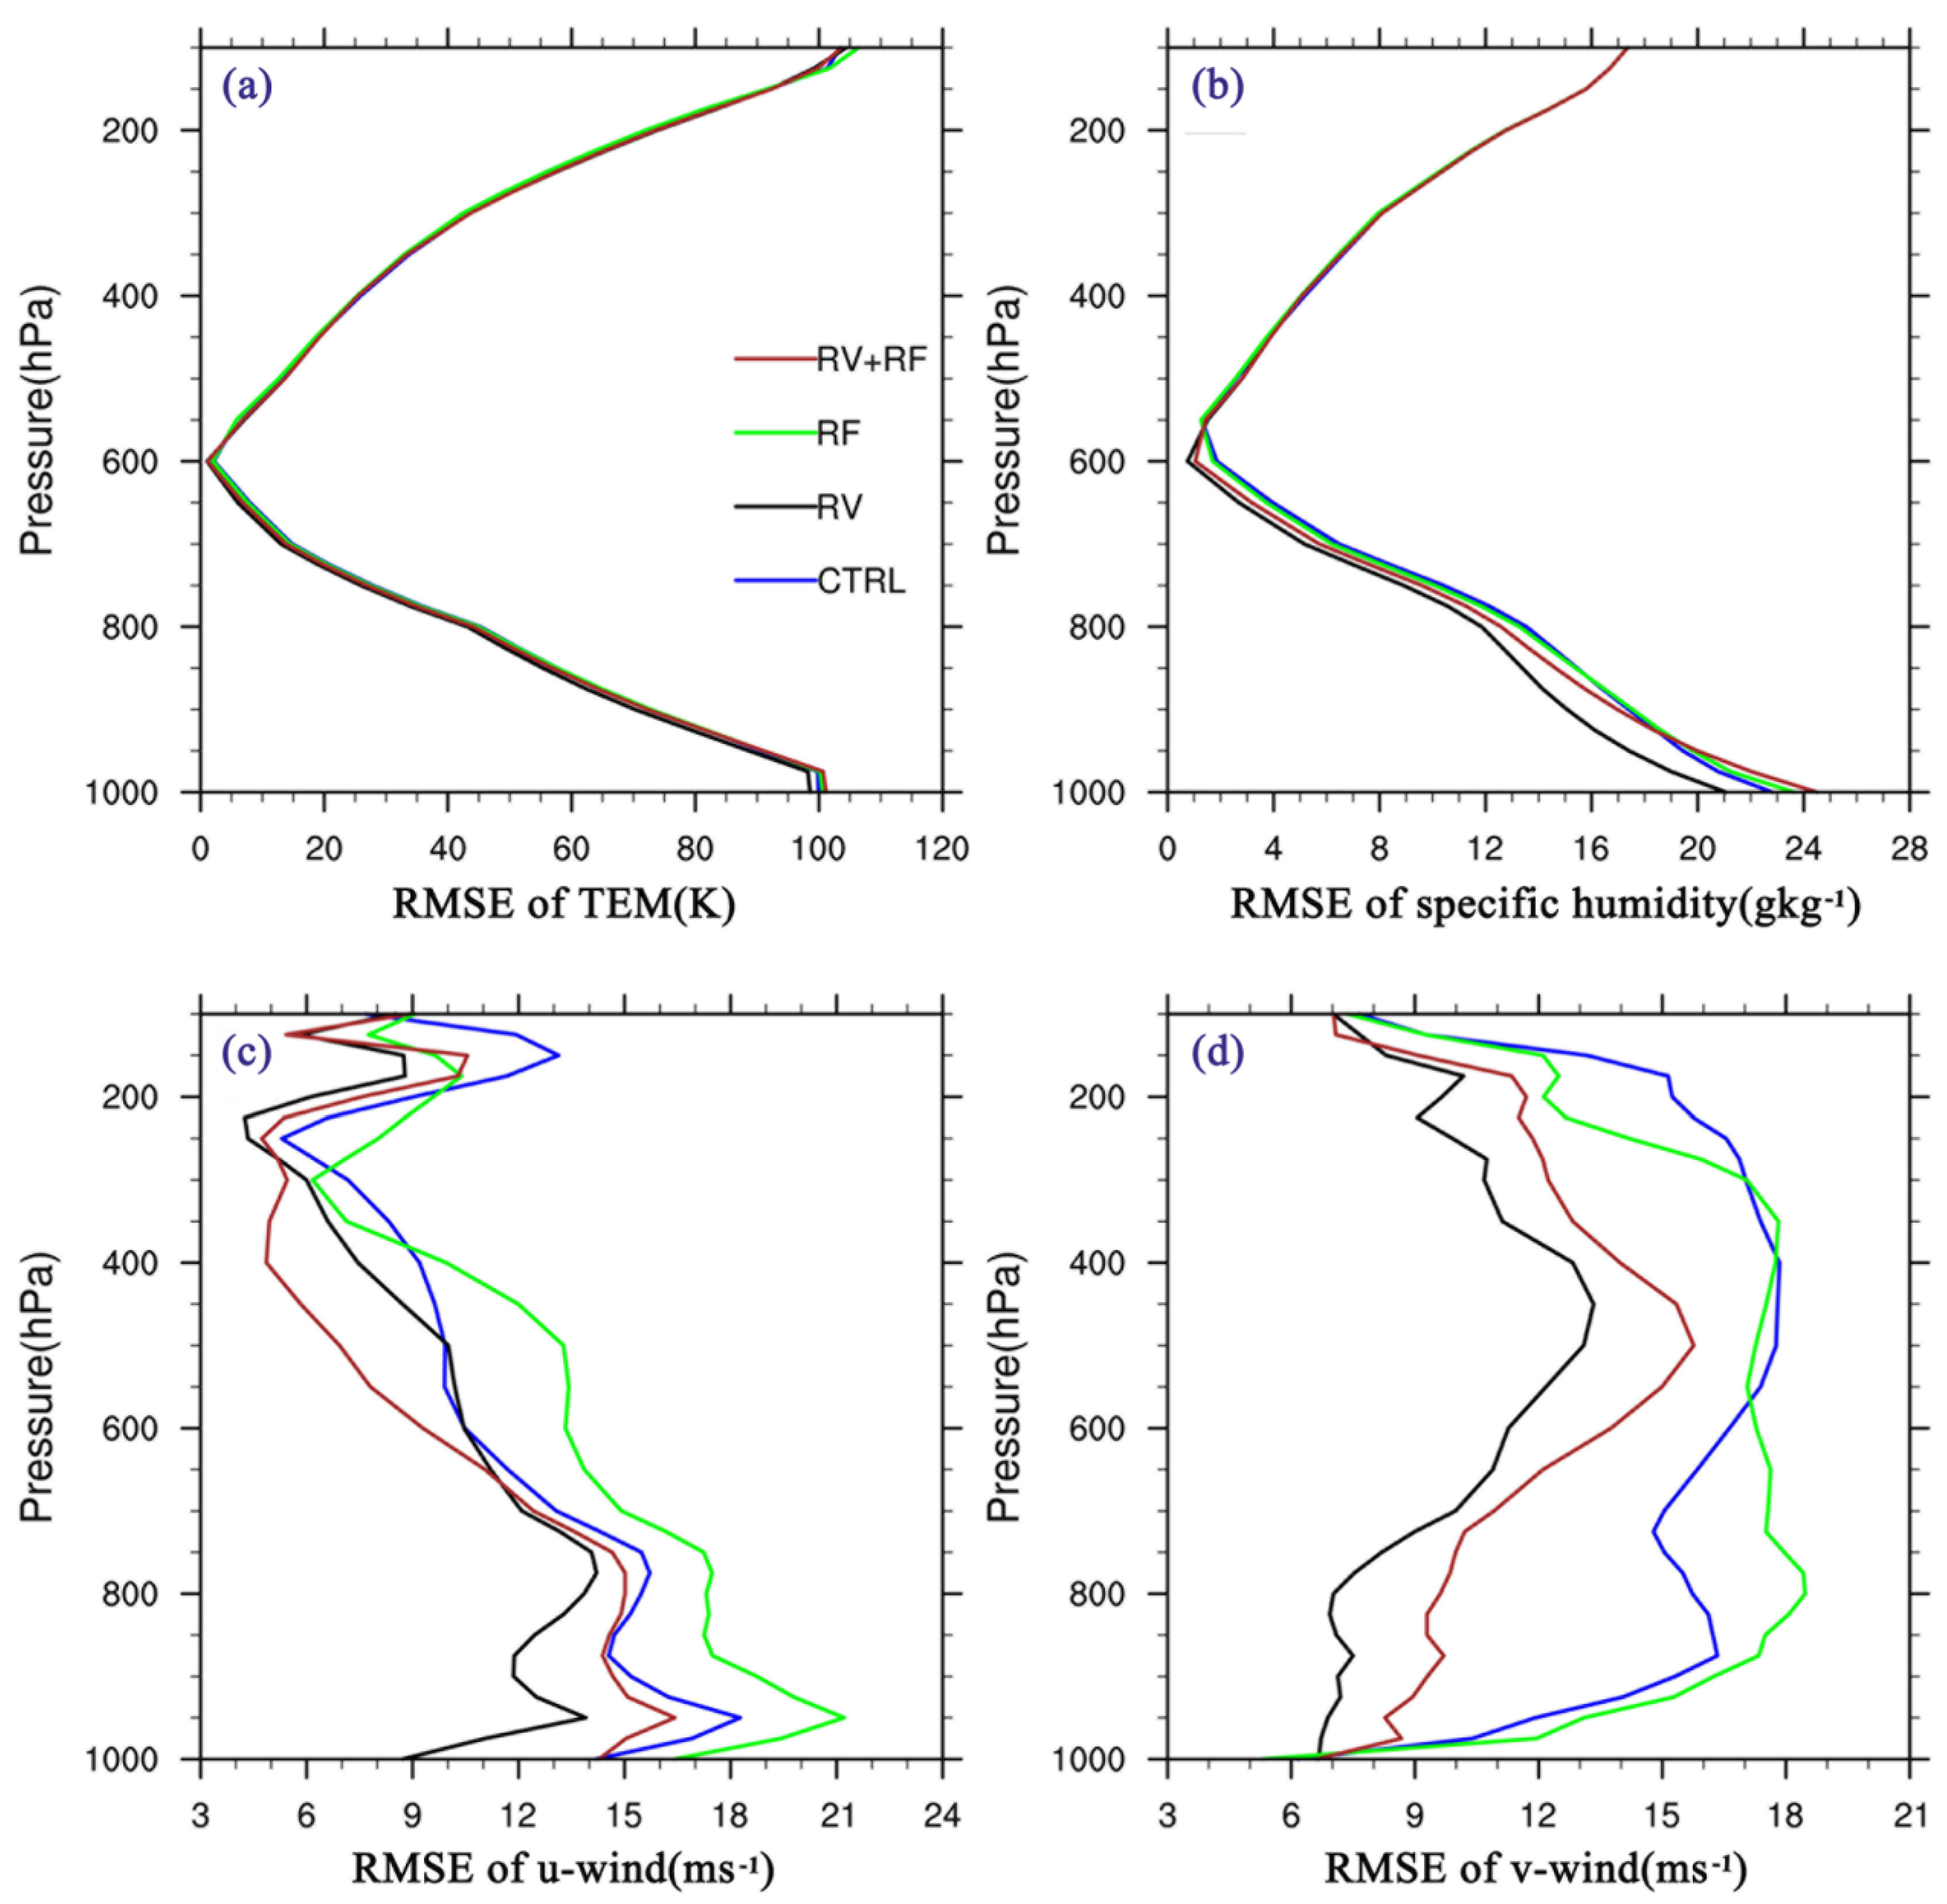
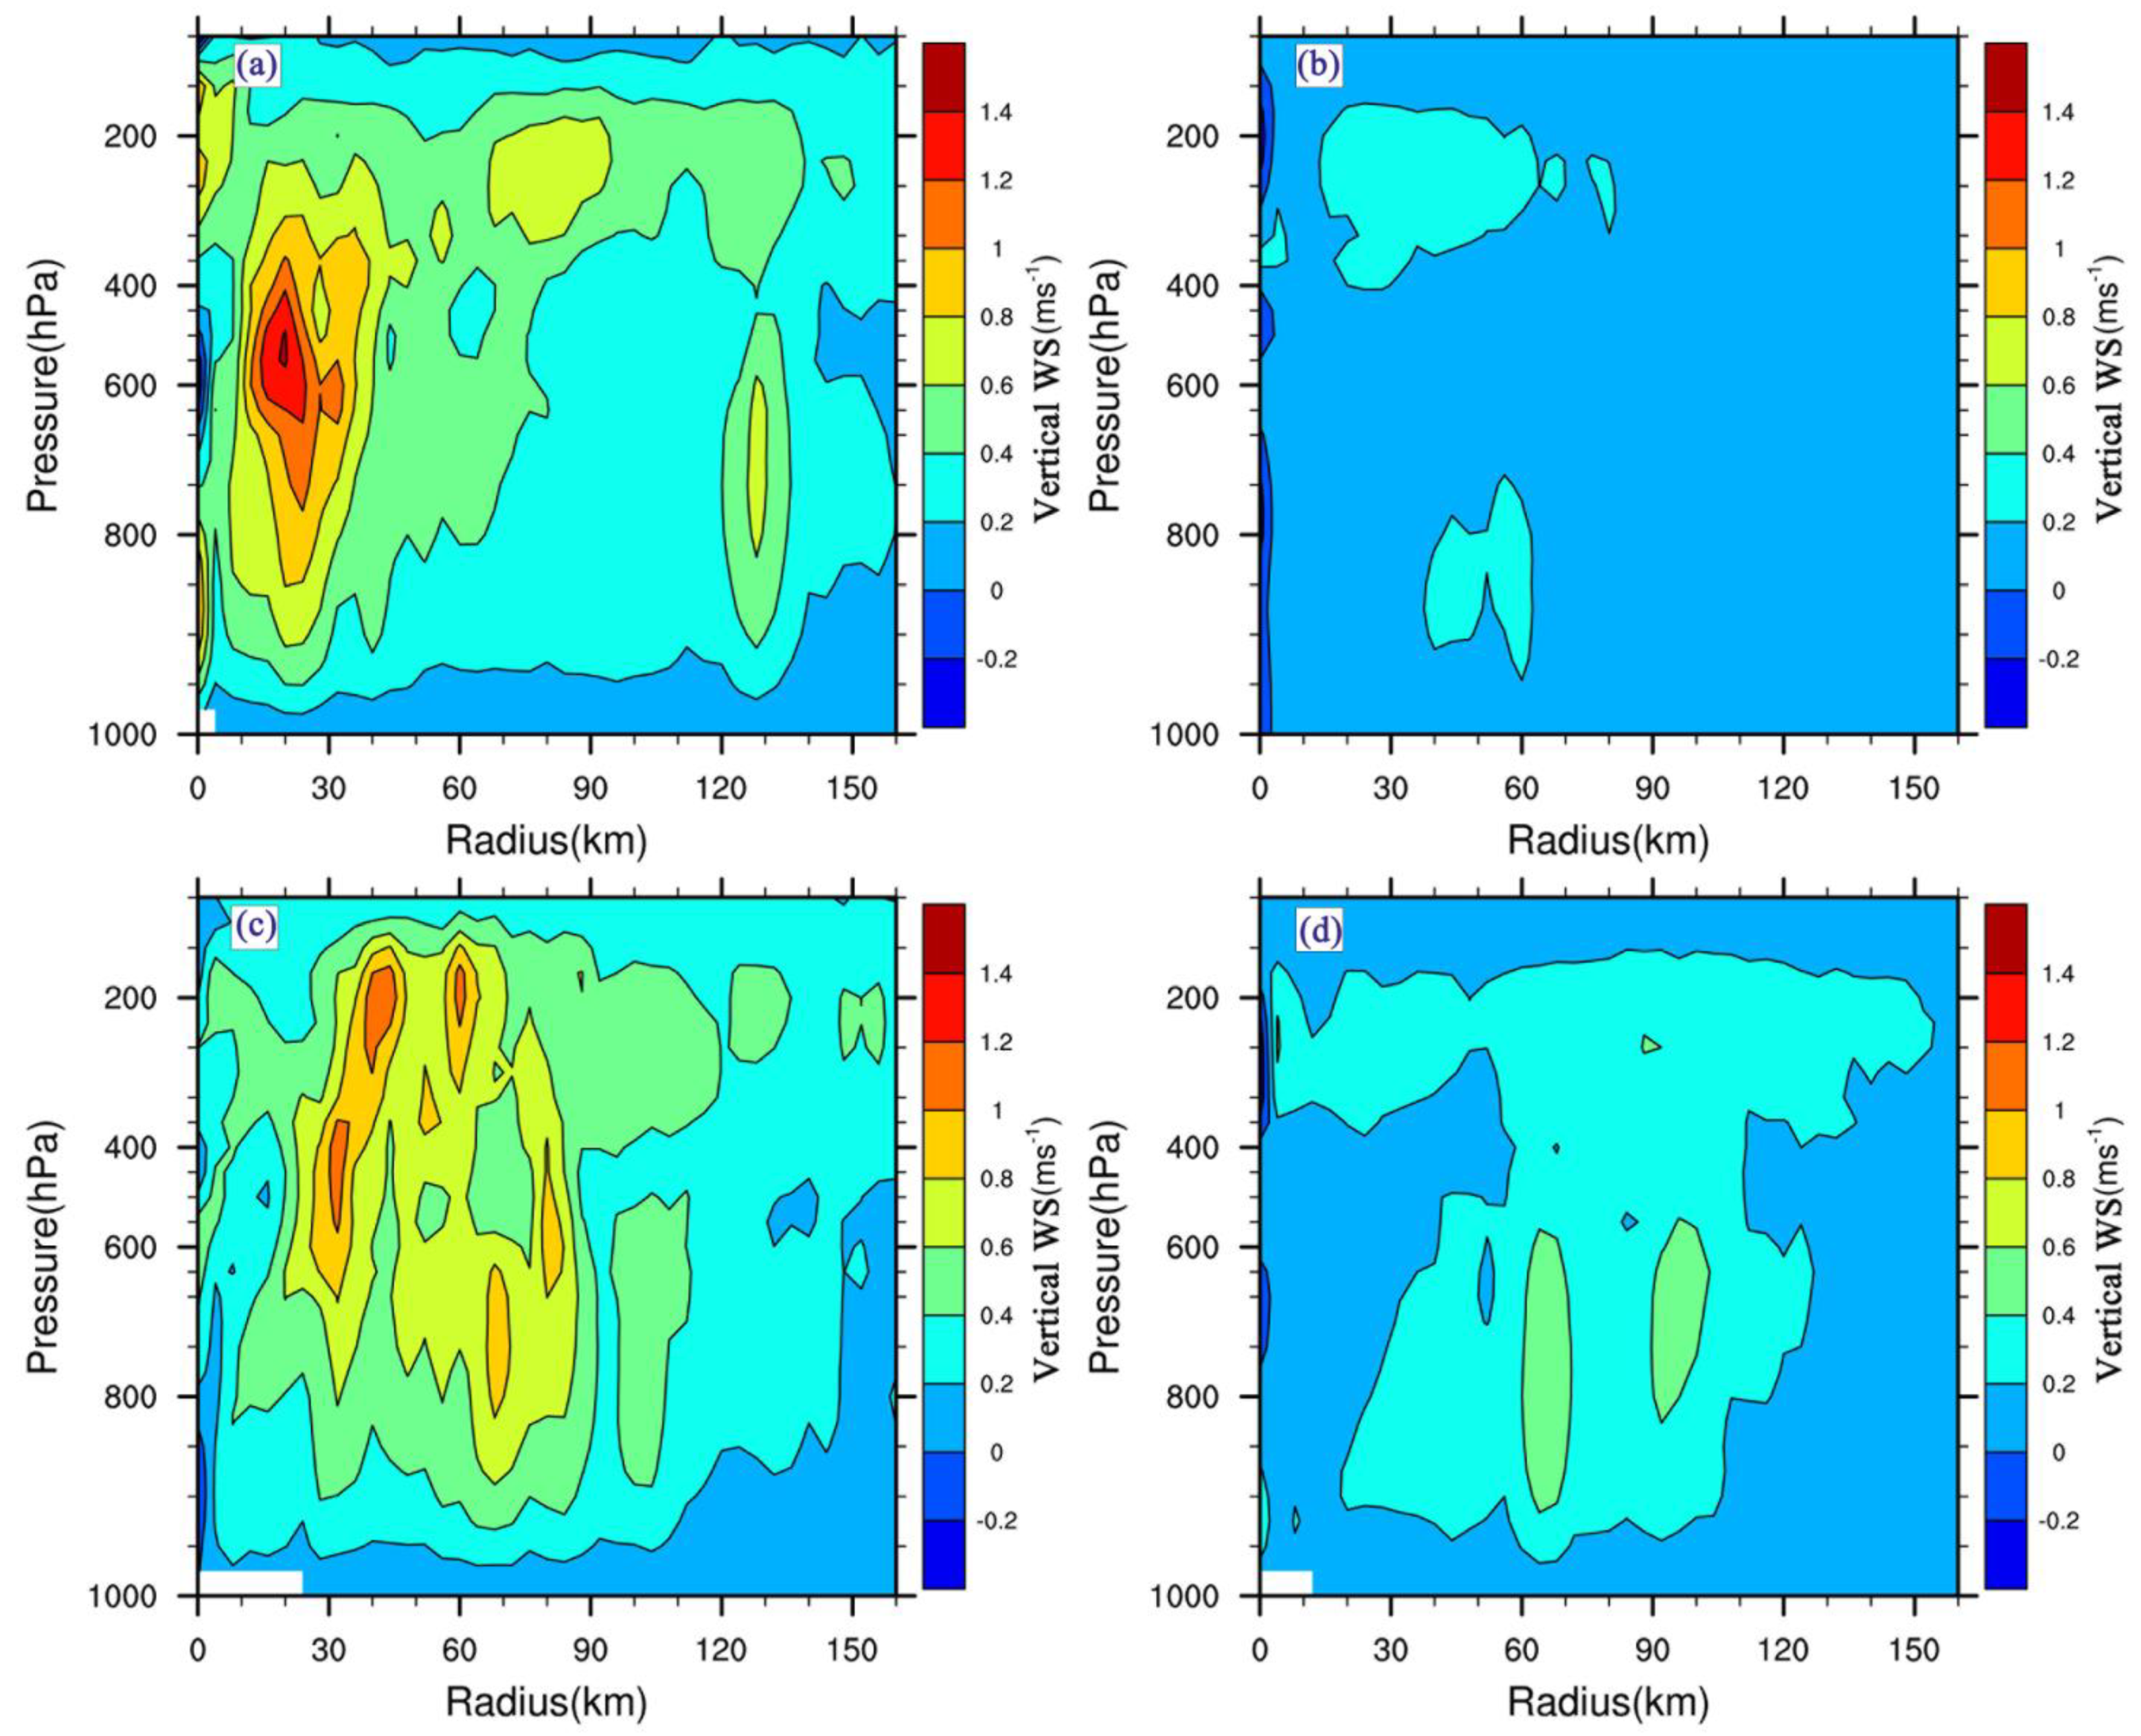
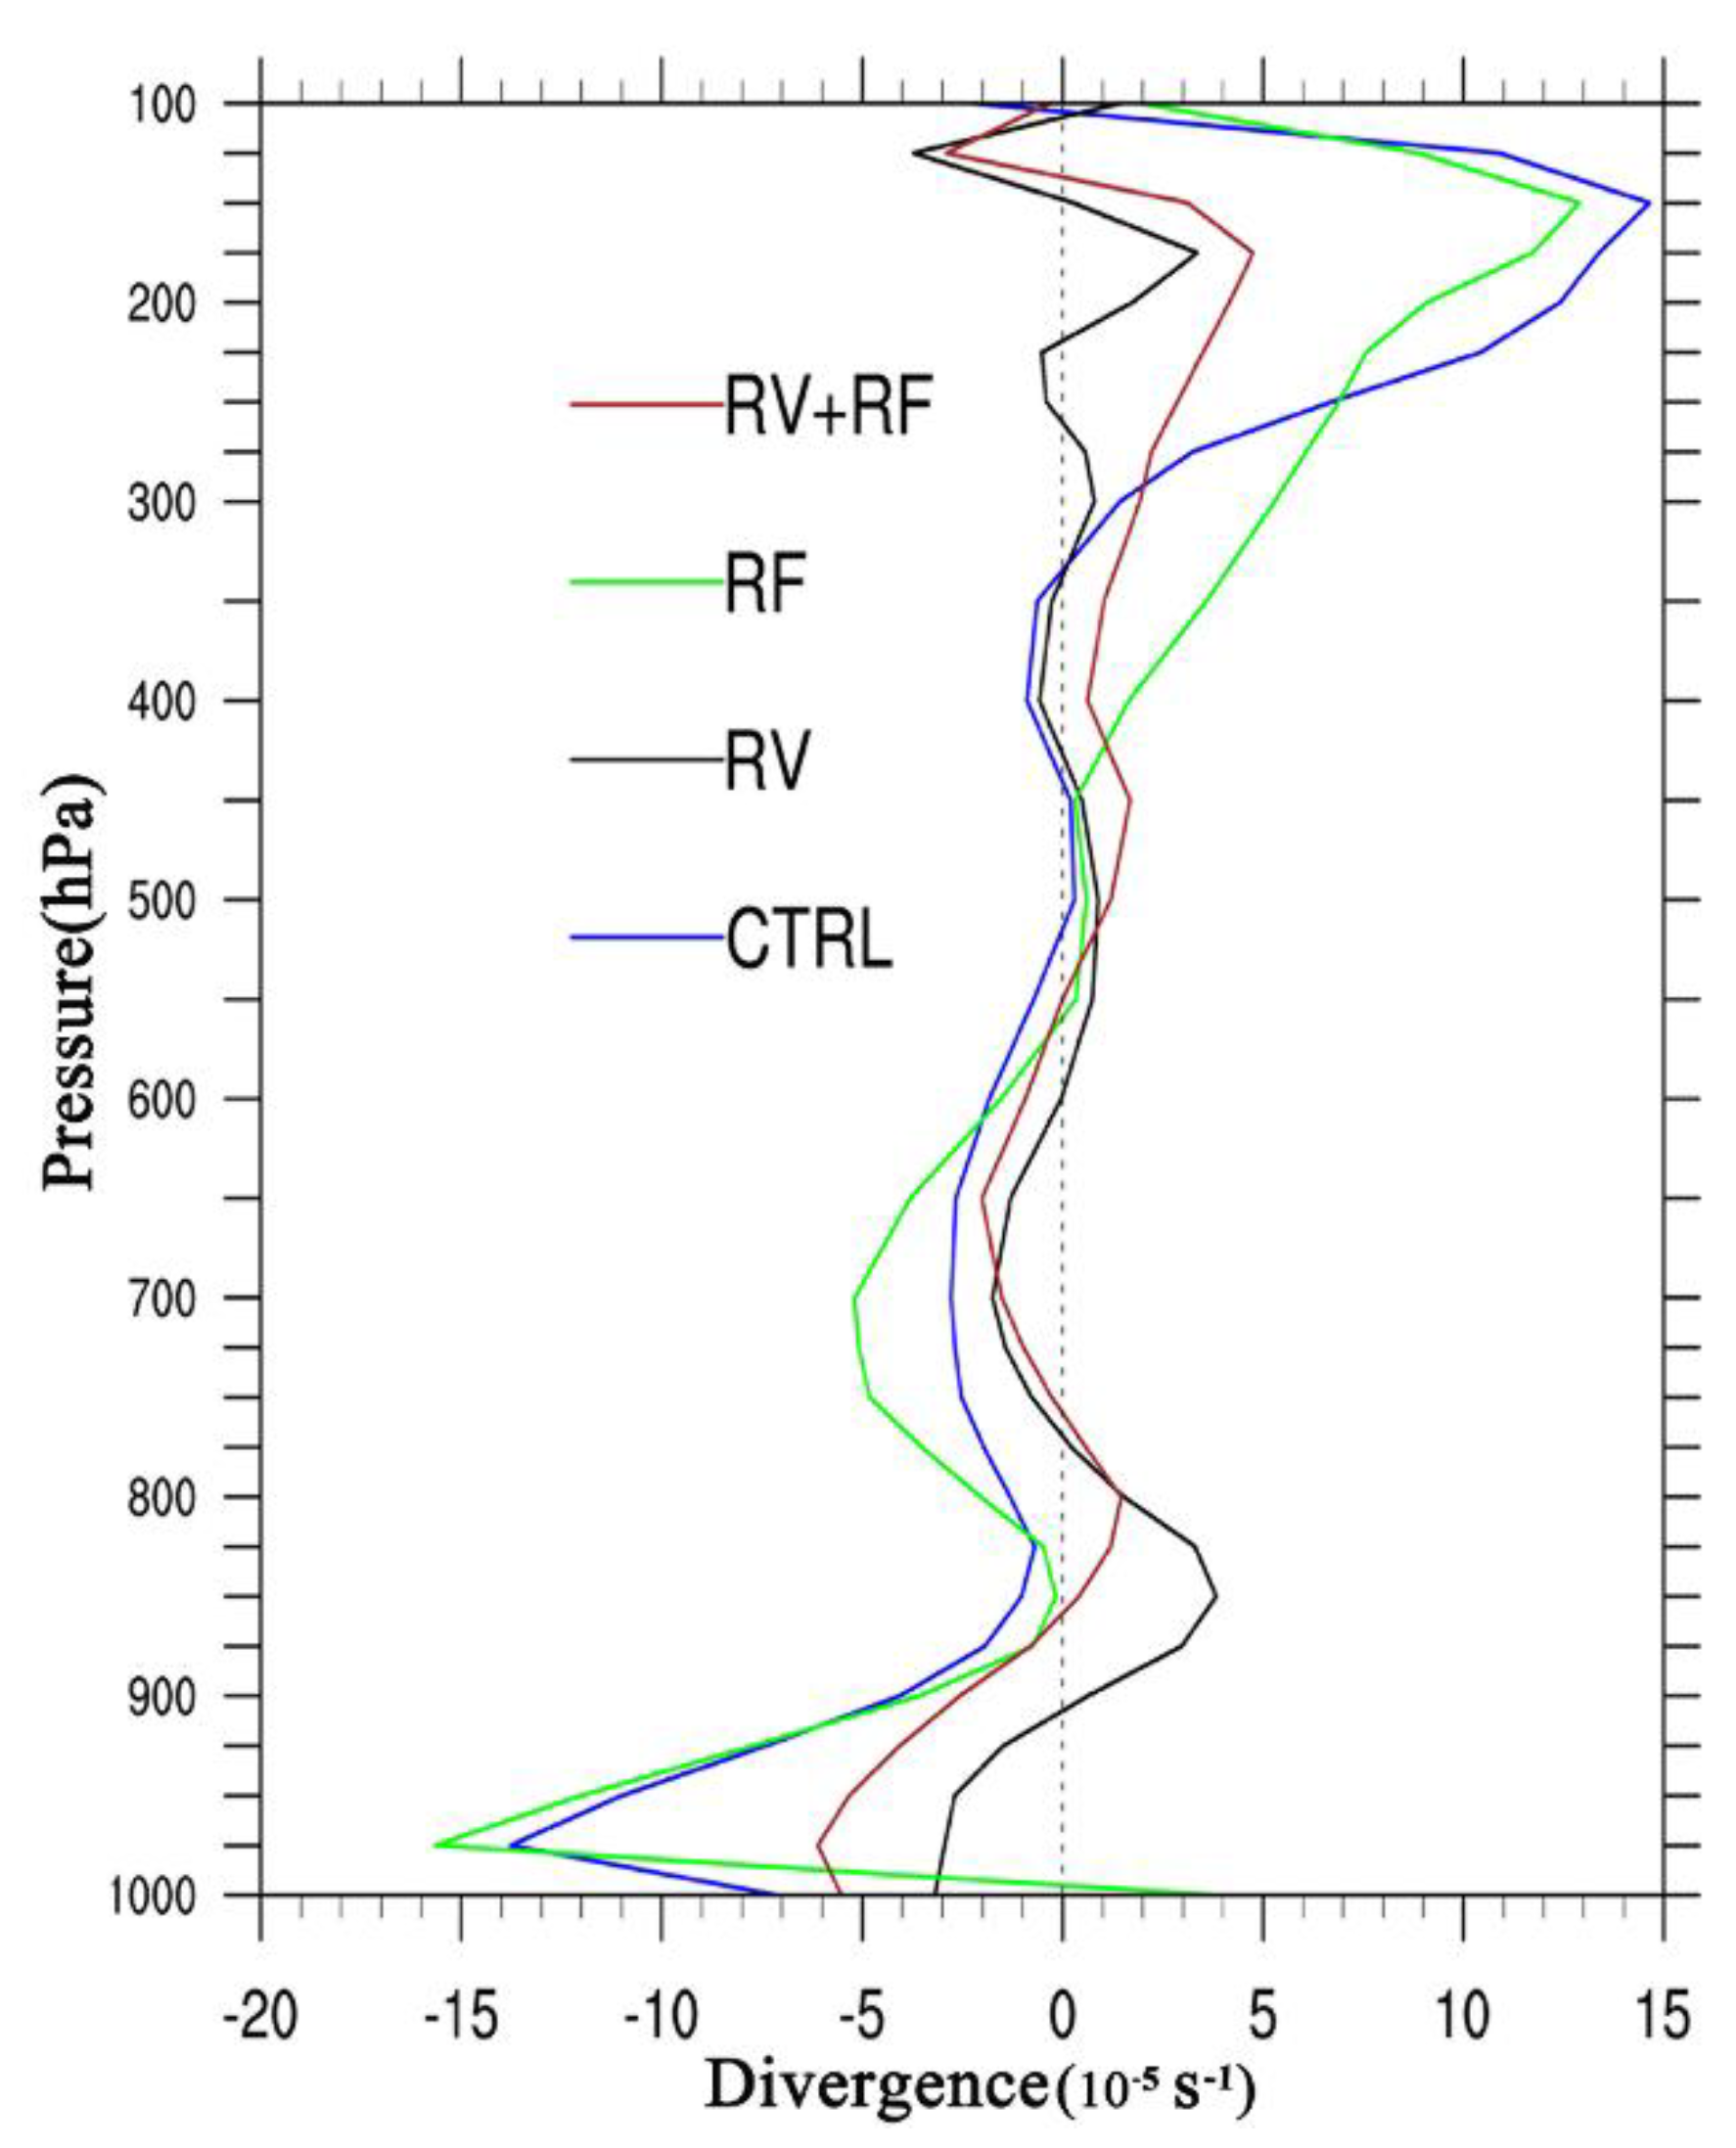
3.2. Hurricane Structures

Most of the previous studies in radar DA suggested that DA would influence the hurricane structure effectively during the forecast periods. In this section, we mainly compare the hurricane structure with and without the DA at the time of 18:00 UTC on 13 August before and near landfall, which represents an important phase for public warning.
Figure 4 displays the surface wind field and sea-level pressure (SLP) field from CTRL, RV, RF, and RV + RF. Compared to the CTRL simulation, the RV simulation weakens the wind speed greatly, while the southwest wind is strengthened at the same time. In contrast, the RF simulation increases the wind speed significantly, both the south and north wind. The RV + RF simulation increases the wind speed near the center and decreases the wind speed around the margin. This is consistent with the result in Figure 2 that the hurricane tracks of CTRL and RF move more quickly than those of RV and RV + RF. It also implies that the wind speed from RV + RF is more reasonable than that from RV and RF.
Figure 5 compares the radius of maximum wind speed in the inner-core region. The H*WIND analysis from the Hurricane Research Division (HRD) website [30] of the radius of maximum wind at 18:00 UTC is about 60 km (Figure 5a), while the simulations from CTRL, RV, RF, and RV + RF are about 90, 60, 35, and 40 km (Figure 5b), respectively. These radii from DA simulations are much closer to the observed value than that from CTRL, although there are magnitude differences between them. It also indicates the DA simulations have improved the wind speed radial structure, compared to CTRL.
Figure 6 shows the differences in temperature (TEM) between the simulations with DA and CTRL (DA minus CTRL) at 18:00 UTC on 13 August 2004. As revealed in Figure 6, there are notable reductions of temperature in all DA simulations, especially RV and RV + RF, while the innermost warm cores are enhanced in the core region at the same time, especially for RF. Overall, the assimilation of radial velocity decreases the temperature predominantly in the core region for RV and RV + RF. Powell [31] commented that the cooling effect in storms is ultimately responsible for the increase in pressure. Therefore, compared to CTRL simulation, the maximum SLP forecasts from RV and RV + RF are larger, while that from RF simulation is smaller. It is reaffirmed that the dominant cooling effect would weaken the hurricane development, which is similar to the result from Powell [31].
Similar to the temperature field, the water vapor differences are shown in Figure 7. The distributions of water vapor differences are similar to temperature differences. In general, the decrease in water vapor is dominant in simulations with DA. Pu and Zhang [32] found that the moist condition is more beneficial in developing the vortex, while dry conditions could decay the vortex. According to their conclusion, it seems that the assimilations of radar data in this case would weaken the hurricane and potentially make the hurricane close to the best track when compared to CTRL forecasts. As a consequence, the hurricane track forecasts from DA simulations have been improved, despite small improvement in intensity forecasts. It also would reduce the potential source of precipitation.
In order to analyze the impact of DA at various pressure levels, we calculate the mean values of temperature, specific humidity, u-component and v-component of wind in the innermost domain (Figure 8). The largest changes in these variables often occur at lower levels, which shows that the DA influence often occurs at lower levels. The changes of temperature and specific humidity are smaller than those of wind speed. For the v-wind, the decreasing tendency is dominant, compared to the primary increasing tendency in the u-wind. Especially, the negative u-wind values of RV at low levels indicate the enhancement of east wind, which may be favorable for a westward hurricane forecast of RV. Similarly, the larger v-wind of RF or CTRL strengthens the south wind and maybe improves the probability of northward forecast. Overall, the impacts of radial velocity and reflectivity on wind speed are significant. Combining the results given in Figure 2, the change in wind speed is consistent with the tack forecasts at 18:00 UTC. The root-mean-square-error (RMSE) between simulations and North American Regional Reanalysis (NARR) over the innermost domain are shown in Figure 9. Generally, it is obvious that the RV has the smallest RMSE, while the RF has the largest RMSE. It indicates that the forecasts from the assimilation of radial velocity are closer to analysis, compared to the assimilation of reflectivity.
In addition, the vertical wind speed in Figure 10 indicates that the CTRL simulation results in the largest convection. After the assimilation of radial velocity, it reduces greatly over the whole inner-core. Meanwhile, the assimilation of reflectivity leads to a small reduction in vertical wind speed. The assimilation of both radial velocity and reflectivity also decreases the vertical wind speed greatly around the hurricane center. To further examine the vertical motion, Figure 11 illustrates the domain averaged divergence at all levels (negative divergence means convergence), it is apparent that the convergence at lower levels and divergence at higher levels all decrease significantly, especially in the RV and RV + RF experiments. The weakening of convergence and vertical wind speed at low levels are not favorable for deep convection. It also reveals a potential decrease in precipitation.

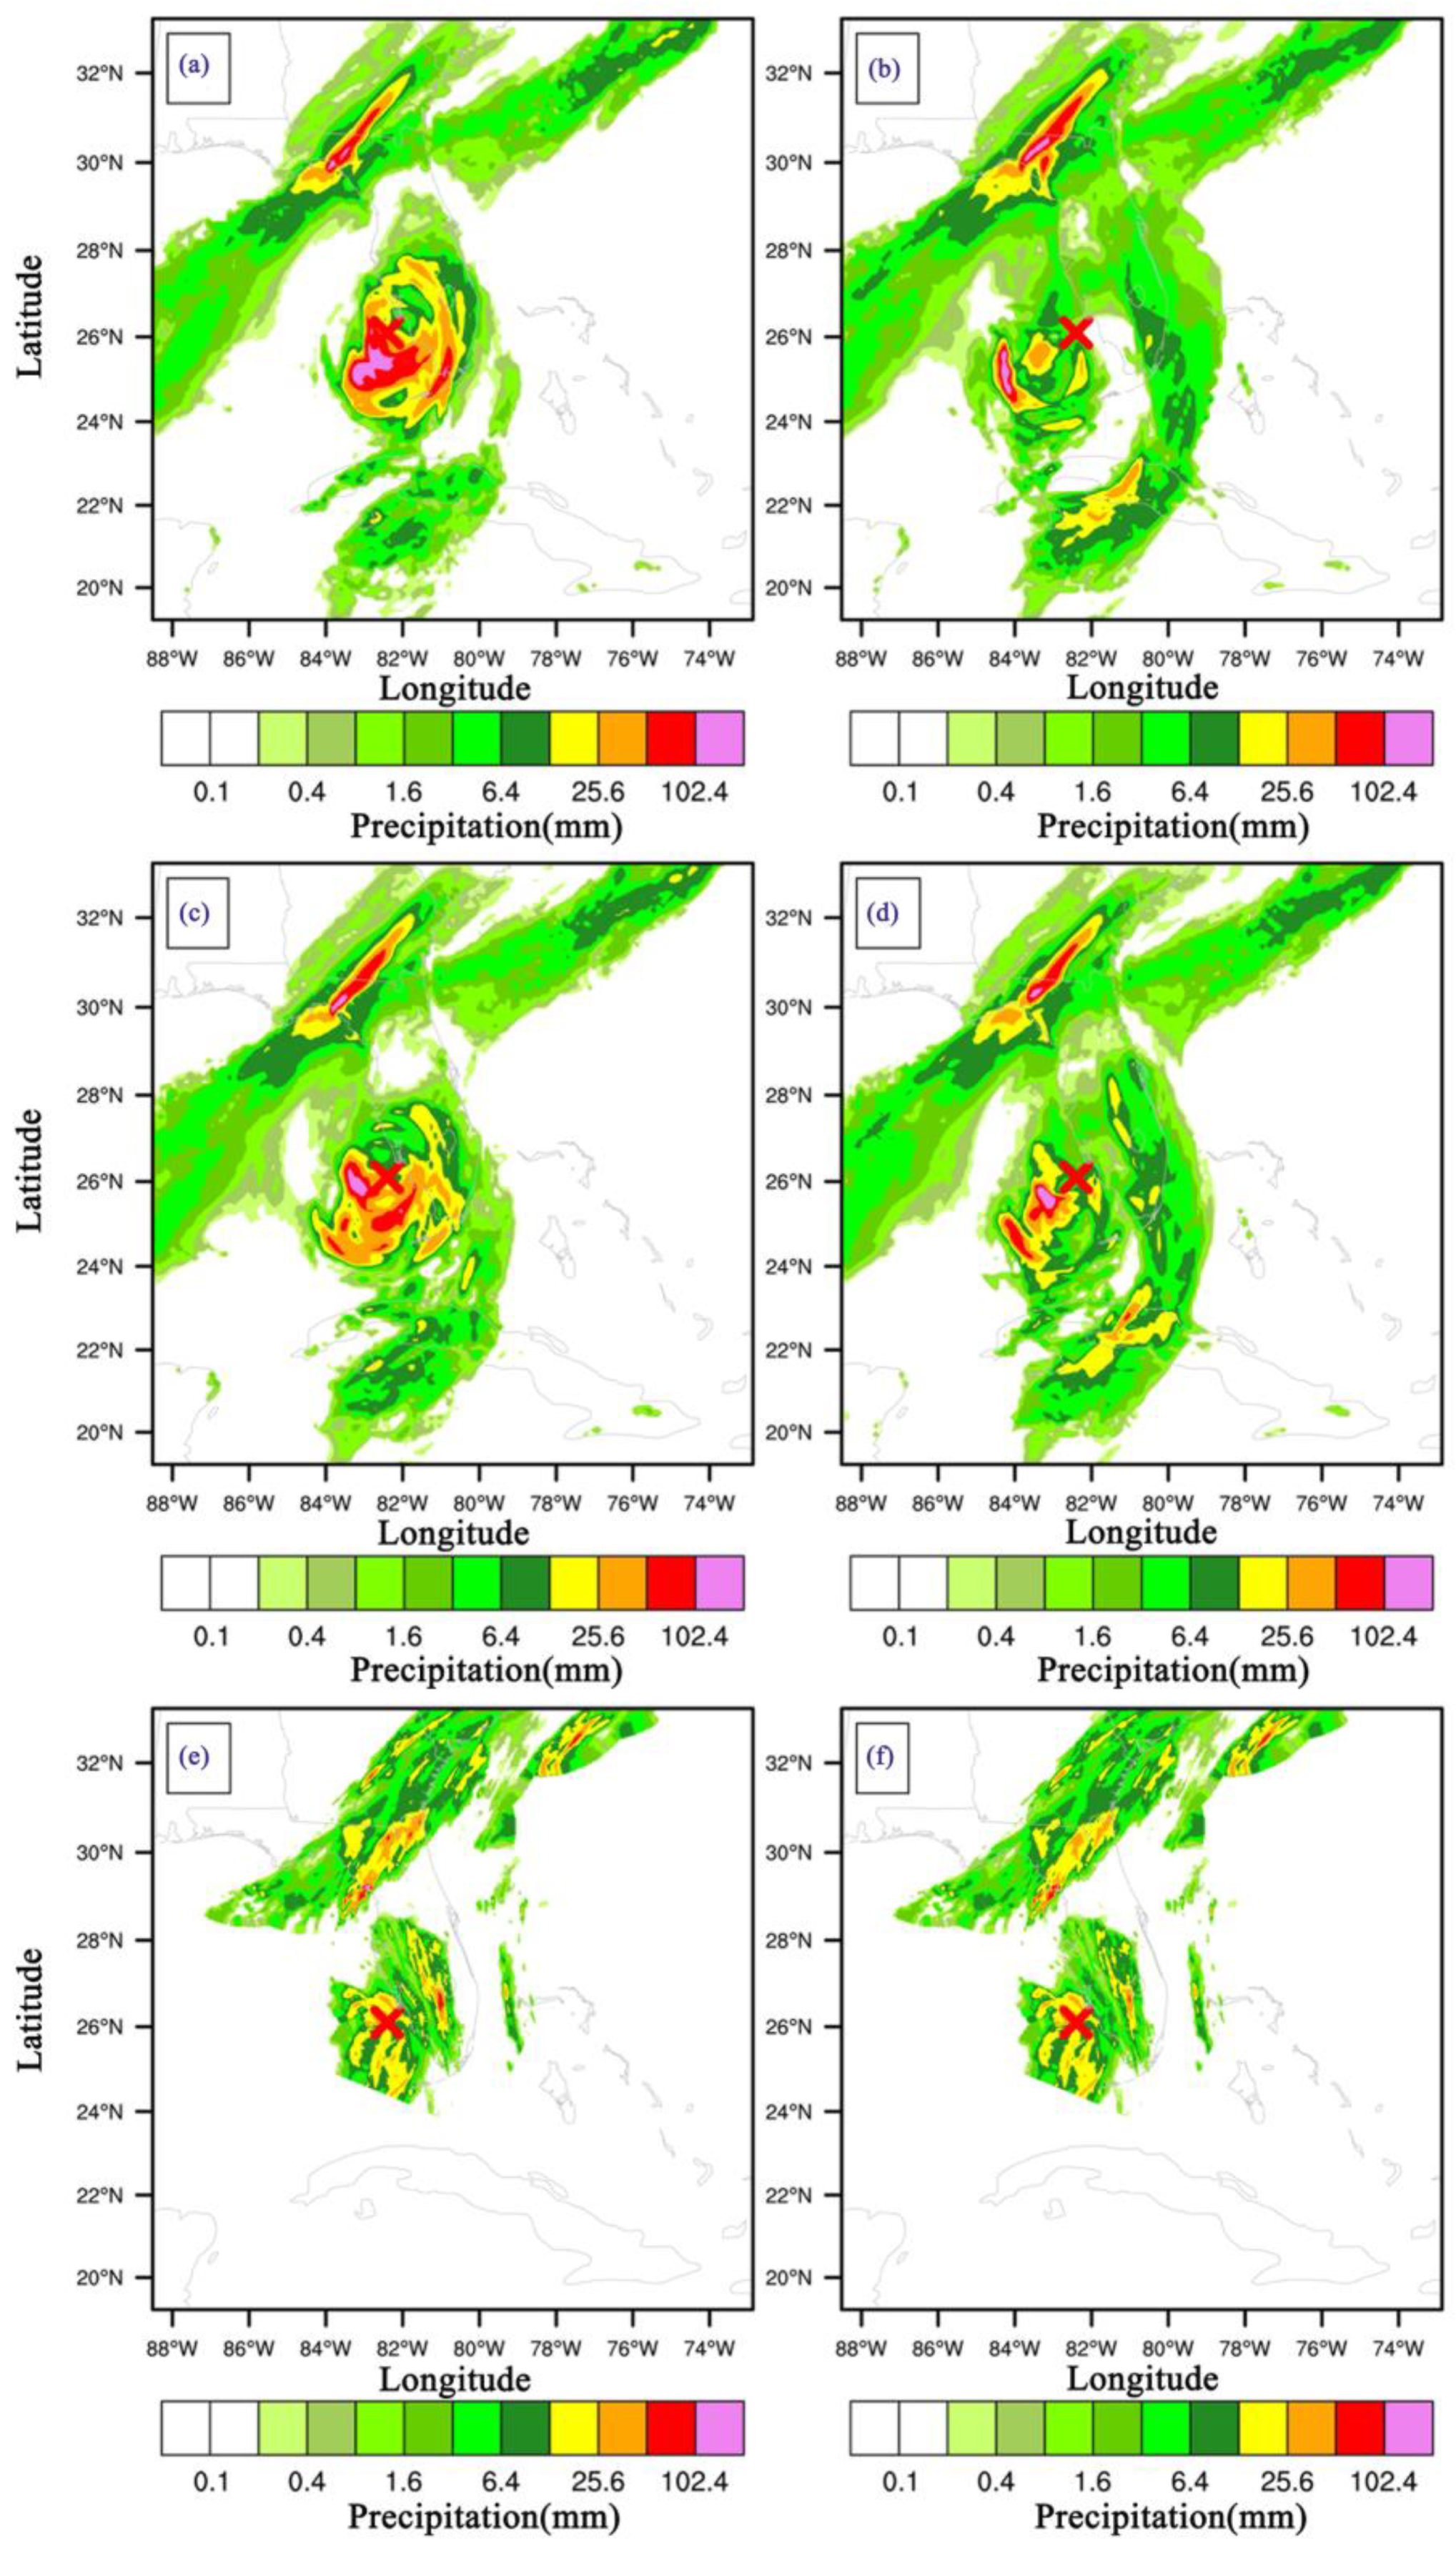
3.3. Precipitation Forecasts

Heavy rainfall is one of the serious natural disasters and usually causes incredible floods near the hurricane landfall area [1]. Therefore, the accurate forecast of precipitation is also of great importance to public warning and prevention.
Figure 12 compares the total accumulated precipitation during the 6 h forecast period ending at 18:00 UTC on 13 August, from CTRL, RV, RF, and RV + RF along with the corresponding NCEP Stage IV precipitation analysis [33] and Climatology-Calibrated Precipitation Analysis (CCPA) [34]. As shown in Figure 12, the precipitation forecasts from CTRL and DA simulations all overestimate the accumulated precipitation. However, compared with the CTRL simulation, the DA simulations generally decrease the accumulated precipitation, especially the maximum precipitation. And, these reductions often occur near the hurricane center which manifests the data assimilation around the inner-core and has impact on precipitation when most of the radar data are assimilated. During these DA simulations, the reductions of precipitation from RV and RV + RF are larger than that from RF. The magnitudes of precipitation from DA simulations are closer to the analysis productions, although the DA simulations extend the lighter precipitation area. In addition, the probability distribution functions (PDFs) of precipitation are calculated and displayed in Table 4. For the lighter precipitation, the PDFs of all simulations are overestimated against CCPA data, while the PDFs from DA simulations are smaller than those from CTRL, especially the RV simulation. For the flood warning, the extreme heavy precipitation forecast is more important. The PDF of precipitation (>100 mm) from RV + RF is closer to the PDF from CCPA analysis. Overall, the assimilations of radar data improve the precipitation forecast, especially the assimilation of both radial velocity and reflectivity for extremely heavy precipitation in this study.

4. Discussion

In this study, based on the coastal WSR-88D radar on the sea-island, which is usually close to the hurricane’s inner-core before its landfall, the 2D averaged structure of Hurricane Charley (2004) was assimilated into the WRF model with its 4D-VAR system. A series of numerical simulations were conducted to examine whether the assimilation of 2D radar velocity or reflectivity data could improve the hurricane forecasts in advance. The impacts of radar data assimilation on the change of atmospheric structure and precipitation near landfall were also evaluated.
The assimilation of radar data improved the hurricane track forecasts significantly, while the improvement of intensity forecasts is not as obvious. The result is consistent with the conclusion in Davis [35] that the intensity forecast is more difficult than track and has improved slowly in recent decades. In addition, the assimilation of RV + RF leads to a better forecast than the assimilation of RF and RV, followed by RF, and RV is the last. This result is different from most previous studies in that the assimilation of radial velocity (RV) is better than that of reflectivity regarding the forecast impacts [2,3,12]. The reason for these differences is likely related to the assimilation of the 2D structure of radar data since this averaged structure of reflectivity is likely more representative than the averaged structure of radial velocity.
After the assimilation of radar data, the dynamic, thermal, and moisture structures of hurricane were adjusted. Fovell [36] pointed out that the structure differences in simulations could influence the hurricane motion. Diagnoses of forecast results show that changes in hurricane structures are more reasonable corresponding to the evolution of the hurricane. Among these structures, the decaying tendencies of hurricane structures are dominant as the hurricane is weakening after the landfall. Compared to the larger impacts of assimilation of RV on thermal and moisture structures, assimilation of both RV and RF have great impacts on dynamic structure, and the impact of assimilation mainly occurs at low levels.
Due to the reductions of temperature, moisture, vertical wind speed, convergence, and their interactions within forecasts with the assimilation of radar data, the adjustments to the precipitation field and the maximum wind speed are obvious, compared to the CTRL simulation. The precipitation forecasts from experiments with data assimilations, especially the RV and RV + RF, are closer to the observation, although more light precipitation values are produced by assimilations.
Overall results from this study have shown that the assimilation of 2D averaged hurricane inner-core structure from radar observations adjusted the simulated 3D hurricane structure obviously, which could lead to great improvements in forecasting hurricane track, intensity, and precipitation. Although this study is based one case only, limited by the radar data availability, it proved the concept that it is feasible to assimilate the radar-derived 2D inner-core structure data into the numerical model to improve hurricane forecasts [20,21]. More case studies are needed in future work.

Author Contributions

Conceptualization, J.L. and Z.P.; methodology, J.L., Z.P. and W.-C.L.; formal analysis, J.L. and Z.P.; data curation, W.-C.L.; writing—draft preparation, J.L.; writing—review and editing, J.L., Z.P., W.-C.L. and Z.G.; visualization, J.L.; supervision, Z.P. All authors have read and agreed to the published version of the manuscript.

Funding

This study was not supported by the research grant that is currently active.

Data Availability Statement

The NCEP FNL Analysis data were freely downloaded from https://rda.ucar.edu/datasets/ds083.3/, accessed on 27 July 2023. The Radar data used in this work are provided by the co-author, Wen-Chau Lee.

Acknowledgments

The work presented in this article are conducted during first author’s visit at the Department of Atmospheric Sciences, University of Utah, in 2017.

Conflicts of Interest

The authors have no conflicts of interest.

References

  1. Pu, Z.; Li, X.; Sun, J. Impact of airborne Doppler radar data assimilation on the numerical simulation of intensity changes of Hurricane Dennis near a landfall. J. Atmos. Sci. 2009, 66, 3351–3365. [Google Scholar] [CrossRef]
  2. Zhao, K.; Xue, M. Assimilation of coastal Doppler radar data with the ARPS 3DVAR and cloud analysis for the prediction of Hurricane Ike (2008). Geophys. Res. Lett. 2009, 36, 12. [Google Scholar] [CrossRef]
  3. Zhang, F.; Weng, Y.; Gamache, J.-F.; Marks, F.D. Performance of convection-permitting hurricane initialization and prediction during 2008–2010 with ensemble data assimilation of inner-core airborne Doppler radar observations. Geophys. Res. Lett. 2011, 38, L15810. [Google Scholar] [CrossRef]
  4. Joo, S.; Eyre, J.; Marriott, R. The impact of MetOp and other satellite data within the Met Office global NWP system using an adjoint-based sensitivity method. Mon. Weather Rev. 2013, 141, 3331–3342. [Google Scholar] [CrossRef]
  5. Zhu, T.; Boukabara, S.A.; Garrett, K. Comparing Impacts of Satellite Data Assimilation and Lateral Boundary Conditions on Regional Model Forecasting: A Case Study of Hurricane Sandy (2012). Weather Forecast. 2017, 32, 595–608. [Google Scholar] [CrossRef]
  6. Rogers, R.F.; Black, M.L.; Chen, S.; Black, R.A. An evaluation of microphysics fields from mesoscale model simulations of tropical cyclones. Part I: Comparisons with observations. J. Atmos. Sci. 2007, 64, 1811–1834. [Google Scholar] [CrossRef]
  7. Kossin, J.P.; Eastin, M.D. Two distinct regimes in the kinematic and thermodynamic structure of the hurricane eye and eyewall. J. Atmos. Sci. 2001, 58, 1079–1090. [Google Scholar] [CrossRef]
  8. Houze, R.A.; Chen, S.; Lee, W.-C.; Rogers, R.F.; Moore, J.A.; Stossmeister, G.J.; Bell, M.M.; Cetrone, J.; Zhao, W.; Brodzik, S.R. The Hurricane Rainband and Intensity Change Experiment: Observations and modeling of Hurricanes Katrina, Ophelia, and Rita. Bull. Amer. Meteor. Soc. 2006, 87, 1503–1521. [Google Scholar] [CrossRef]
  9. Pu, Z.; Li, X.; Zipser, E.J. Diagnosis of the initial and forecast errors in the numerical simulation of the rapid intensification of Hurricane Emily (2005). Weather Forecast. 2009, 24, 1236–1251. [Google Scholar] [CrossRef]
  10. Zhang, L.; Pu, Z.; Lee, W.-C.; Zhao, Q. The influence of airborne Doppler radar data quality on numerical simulations of a tropical cyclone. Weather Forecast. 2012, 27, 231–239. [Google Scholar] [CrossRef]
  11. Pu, Z.; Li, X.; Velden, C.; Aberson, S.; Liu, W. Impact of aircraft dropsonde and satellite wind data on the numerical simulation of two landfalling tropical storms during TCSP. Weather Forecast. 2008, 23, 62–79. [Google Scholar] [CrossRef]
  12. Weng, Y.; Zhang, F. Assimilating airborne Doppler radar observations with an ensemble Kalman filter for convection-permitting hurricane initialization and prediction: Katrina (2005). Mon. Weather Rev. 2012, 140, 841–859. [Google Scholar] [CrossRef]
  13. Reasor, P.D.; Montgomery, M.T.; Marks, F.D.; Gamache, J.F. Low-wavenumber structure and evolution of the hurricane inner core observed by airborne dual-Doppler radar. Mon. Weather Rev. 2000, 128, 1653–1680. [Google Scholar] [CrossRef]
  14. Zhao, Q.; Jin, Y. High-resolution radar data assimilation for Hurricane Isabel (2003) at landfall. Bull. Amer. Meteor. Soc. 2008, 89, 1355–1372. [Google Scholar] [CrossRef]
  15. Murillo, S.T.; Lee, W.-C.; Bell, M.M.; Marks, F.D.; Dodge, P.P.; Barnes, G.M. Intercomparison of GBVTD-retrieved circulation centers and structures of Hurricane Danny (1997) from two coastal WSR-88Ds. Mon. Weather Rev. 2011, 139, 153–174. [Google Scholar] [CrossRef]
  16. Zhang, F.; Weng, Y. Predicting hurricane intensity and associated hazards: A five-year real-time forecast experiment with assimilation of airborne Doppler radar observations. Bull. Amer. Meteor. Soc. 2015, 96, 25–33. [Google Scholar] [CrossRef]
  17. Xiao, Q.; Zhang, X.; Davis, C.; Tuttle, J.; Holland, G.; Fitzpatrick, P.J. Experiments of hurricane initialization with airborne Doppler radar data for the Advanced Research Hurricane WRF (AHW) model. Mon. Weather Rev. 2009, 137, 2758–2777. [Google Scholar] [CrossRef]
  18. Li, Z.; Pu, Z.; Sun, J.; Lee, W.-C. Impacts of 4DVAR assimilation of airborne Doppler radar observations on numerical simulations of the genesis of Typhoon Nuri (2008). J. Appl. Meteor. Climatol. 2014, 53, 2325–2343. [Google Scholar] [CrossRef]
  19. Lee, W.-C.; Jou, J.-D.; Chang, P.-L.; Deng, S.-M. Tropical cyclone kinematic structure retrieved from single Doppler radar observations. part I: Interpretation of Doppler velocity patterns and the GBVTD technique. Mon. Weather Rev. 1999, 127, 2419–2439. [Google Scholar] [CrossRef]
  20. Zhao, K.; Xue, M.; Lee, W.-C. Assimilation of GBVTD-retrieved winds from single-Doppler radar for short-term forecasting of super typhoon Saomai (0608) at landfall. Q. J. R. Meteorol. Soc. 2012, 138, 1055–1071. [Google Scholar] [CrossRef]
  21. Lee, W.-C.; Bell, M.M. Rapid intensification, eyewall contraction, and breakdown of Hurricane Charley (2004) near landfall. Geophys. Res. Lett. 2007, 34, 2. [Google Scholar] [CrossRef]
  22. Landsea, C.; Franklin, J. Atlantic Hurricane Database Uncertainty and Presentation of a New Database Format. Mon. Weather Rev. 2013, 141, 3576–3592. [Google Scholar] [CrossRef]
  23. Oye, R.; Mueller, C.; Smith, C. Software for radar data translation, visualization, editing, and interpolation. In Proceedings of the 27th Conference on Radar Meteorology, Vail, CO, USA, 9–13 October 1995; pp. 359–361. [Google Scholar]
  24. Brewster, K.; Hu, M.; Xue, M.; Gao, J. Efficient assimilation of radar data at high resolution for short-range numerical weather prediction. In Proceedings of the World Weather Research Program Symposium on Nowcasting Very Short Range Forecasting, Toulouse, Tolouse, France, 5–9 September 2005; Volume 3. [Google Scholar]
  25. Skamarock, W.C.; Klemp, J.B.; Dudhia, J.; Gill, D.O.; Barker, D.; Duda, M.G.; Huang, X.-Y.; Wang, W.; Powers, J.G. A Description of the Advanced Research WRF Version 3 (No. NCAR/TN-475+STR); University Corporation for Atmospheric Research: Boulder, CO, USA, 2008. [Google Scholar] [CrossRef]
  26. Huang, X.-Y.; Xiao, Q.; Barker, D.M.; Zhang, X.; Michalakes, J.; Huang, W.; Henderson, T.; Bray, J.; Chen, Y.; Ma, Z.; et al. Four-dimensional variational data assimilation for WRF: Formulation and preliminary results. Mon. Weather Rev. 2009, 137, 299–314. [Google Scholar] [CrossRef]
  27. Barker, D.M.; Lee, M.S.; Guo, Y.-R.; Huang, W.; Huang, H.; Kuo, Y.-H.; Rizvi, S.; Xiao, Q. WRF-Var—A unified 3/4DVAR variational data assimilation system for WRF. In Proceedings of the Sixth WRF/15th MM5 Users’ Workshop, Boulder, CO, USA, 1 January 2005; p. 17. [Google Scholar]
  28. Sun, J.; Wang, H. Radar data assimilation with WRF 4DVAR. Part II: Comparison with 3DVAR for a squall line over the U.S. Great Plains. Mon. Weather Rev. 2013, 141, 2245–2264. [Google Scholar] [CrossRef]
  29. Liu, Y.; Zhuo, L.; Han, D. Developing spin-up time framework for WRF extreme precipitation simulations. J. Hydrol. 2023, 620, 129443. Available online: https://www.sciencedirect.com/science/article/pii/S0022169423003852 (accessed on 19 February 2024). [CrossRef]
  30. Powell, M.D.; Houston, S.H.; Amat, L.R.; Morisseau-Leroy, N. The HRD real-time hurricane wind analysis system. J. Wind Eng. Ind. Aerodyn. 1998, 77–78, 53–64. [Google Scholar] [CrossRef]
  31. Powell, M.D. Changes in the low-level kinematic and thermodynamic structure of Hurricane Alicia at landfall. Mon. Weather Rev. 1987, 115, 75–99. [Google Scholar] [CrossRef]
  32. Pu, Z.; Zhang, L. Validation of AIRS temperature and moisture profiles over tropical oceans and their impact on numerical simulations of tropical cyclones. J. Geophys. Res. 2010, 115, D24114. [Google Scholar] [CrossRef]
  33. Lin, Y.; Mitchell, K.E. 1.2 the NCEP stage II/IV hourly precipitation analyses: Development and applications. In Proceedings of the 19th Conference on Hydrology, American Meteorological Society, San Diego, CA, USA, 9–13 January 2005. [Google Scholar]
  34. Hou, D.; Charles, M.; Luo, Y.; Toth, Z.; Zhu, Y.; Krzysztofowicz, R.; Lin, Y.; Xie, P.; Seo, D.-J.; Pena, M.; et al. Climatology-calibrated precipitation analysis at fine scales: Statistical adjustment of stage IV toward CPC gauge-based analysis. J. Hydrometeor. 2014, 15, 2542–2557. [Google Scholar] [CrossRef]
  35. Davis, C.; Wang, W.; Chen, S.S.; Chen, Y.; Corbosiero, K.; DeMaria, M.; Dudhia, J.; Holland, G.; Klemp, J.; Michalakes, J.; et al. Prediction of landfalling hurricanes with the Advanced Hurricane WRF Model. Mon. Weather Rev. 2008, 136, 1990–2005. [Google Scholar] [CrossRef]
  36. Fovell, R.G.; Corbosiero, K.L.; Kuo, H.-C. Cloud microphysics impact on hurricane track as revealed in idealized experiments. J. Atmos. Sci. 2009, 66, 1764–1778. [Google Scholar] [CrossRef]
Figure 1. An example of 2D azimuthally averaged (a) RF and (b) RV data at 11:00 UTC on 13 August 2004.
Remotesensing 16 01351 g001
Figure 2. Comparison of hurricane locations between the best-track and simulations. The “1312” in figure means 12:00 UTC on 13 August, and so on.
Remotesensing 16 01351 g002
Figure 3. Comparisons of (a) track distance error (km) and (b) maximum wind speed (ms−1) between the best-track and simulations. The “1312” in figure means 12:00 UTC on 13 August, and so on.
Remotesensing 16 01351 g003
Figure 4. Comparisons of 10 m wind field and sea-level pressure field from (a) CTRL and three assimilated simulations ((b): RV, (c): RF, (d): RV + RF) at 18:00 UTC on 13 August 2004 near landfall. Hereafter, the pink x symbol indicates the hurricane center location from best track.
Remotesensing 16 01351 g004
Figure 5. The surface radial profiles of maximum wind speed from (a) Hurricane Research Division Analyses at 16:30 UTC and 19:30 UTC on 13 August 2004 and (b) WRF simulations at 18:00 UTC on 13 August 2004.
Remotesensing 16 01351 g005
Figure 6. The differences of azimuthally averaged temperature of (a) RV minus CTRL, (b) RF minus CTRL, and (c) RV + RF minus CTRL at 18:00 UTC on 13 August 2004 (near landfall time).
Remotesensing 16 01351 g006
Figure 7. The differences of azimuthally averaged water vapor of (a) RV minus CTRL, (b) RF minus CTRL, and (c) RV + RF minus CTRL at 18:00 UTC on 13 August 2004 (near landfall time).
Remotesensing 16 01351 g007
Figure 8. Vertical distributions of averaged (a) temperature (K), (b) specific humidity (gkg−1), (c) u-component of wind (ms−1), and (d) v-component of wind (ms−1) at 18:00 UTC on 13 August 2004 (near landfall time).
Remotesensing 16 01351 g008
Figure 9. Vertical distributions of RMSE (simulations vs. NARR) of (a) temperature (K), (b) specific humidity (gkg−1), (c) u-component of wind (ms−1), and (d) v-component of wind (ms−1) at 18:00 UTC on 13 August 2004 (near landfall time).
Remotesensing 16 01351 g009
Figure 10. Comparisons of vertical wind speed from (a) CTRL and three assimilated simulations ((b): RV, (c): RF, and (d): RV + RF) at 18:00 UTC on 13 August 2004 (near landfall time).
Remotesensing 16 01351 g010
Figure 11. Comparisons of divergence field from simulations at 18:00 UTC on 13 August 2004 (near landfall time).
Remotesensing 16 01351 g011
Figure 12. Comparison of 6 h accumulated precipitation (mm) from (a) CTRL, (b) RV, (c) RF, (d) RV + RF, (e) Stage IV, and (f) CCPA at 18:00 UTC on 13 August 2004 (near landfall time). The red x symbol indicates the hurricane center location from best track.
Remotesensing 16 01351 g012
Table 1. The best track information on Hurricane Charley (2004) from NHC.
TimeLatitude (°)Longitude (°)Maximum Wind Speed (WS) (ms−1)Minimum Sea-Level Pressure (SLP) (hPa)
12:00 UTC on 13 August24.4−82.948.83969
18:00 UTC on 13 August26.1−82.464.25947
00:00 UTC on 14 August28.1−81.638.55970
06:00 UTC on 14 August30.1−80.838.55993
Table 2. The list of WRF physics schemes for assimilation experiments.
Physical ProcessesParameterization Schemes
MicrophysicsWRF Single-Moment 6-class
Surface layerUnified Noah Land Surface Model
Land surfaceRevised MM5 Monin-Obukhov
Planetary boundary layerYonsei University
Longwave radiationRapid Radiative Transfer Model
Shortwave radiationDudhia
CumulusTiedtke
Table 3. The list of WRF experiments.
ExperimentsDescription
CTRLControl simulation without radar data assimilation
RVAssimilation of radar radial velocity
RFAssimilation of radar reflectivity
RV + RFAssimilation of radar radial velocity and reflectivity
Table 4. The absolute PDF biases between simulations and CCPA.
Precipitation (mm)CTRLRVRFRV + RF
0~0.017.776.837.217.31
0.01~0.112.419.0910.789.46
0.1~17.564.137.905.04
1~1014.583.8312.527.19
10~10013.8216.4313.6314.80
100~10000.660.200.250.18
Averaged9.476.758.727.33
Disclaimer/Publisher’s Note: The statements, opinions and data contained in all publications are solely those of the individual author(s) and contributor(s) and not of MDPI and/or the editor(s). MDPI and/or the editor(s) disclaim responsibility for any injury to people or property resulting from any ideas, methods, instructions or products referred to in the content.

