This section is organized into three parts that will cover the analysis results that re-affirm the OLI absolute radiance scale. The first part covers the OLI response stability, signal-to-noise values, and residual non-linearity. The second part covers the results of the OLI working solar diffuser-based, transfer-to-orbit impact evaluation. The last part covers the OLI working stim-lamp-based, transfer-to-orbit evaluation, and while it will show results for all of the narrow bandwidth spectral bands, its main role is in defining the level of the transfer-to-orbit impact for the Cirrus band absolute radiance scale.
3.1. OLI Response Stability, Noise Levels, and Residual Non-Linearity
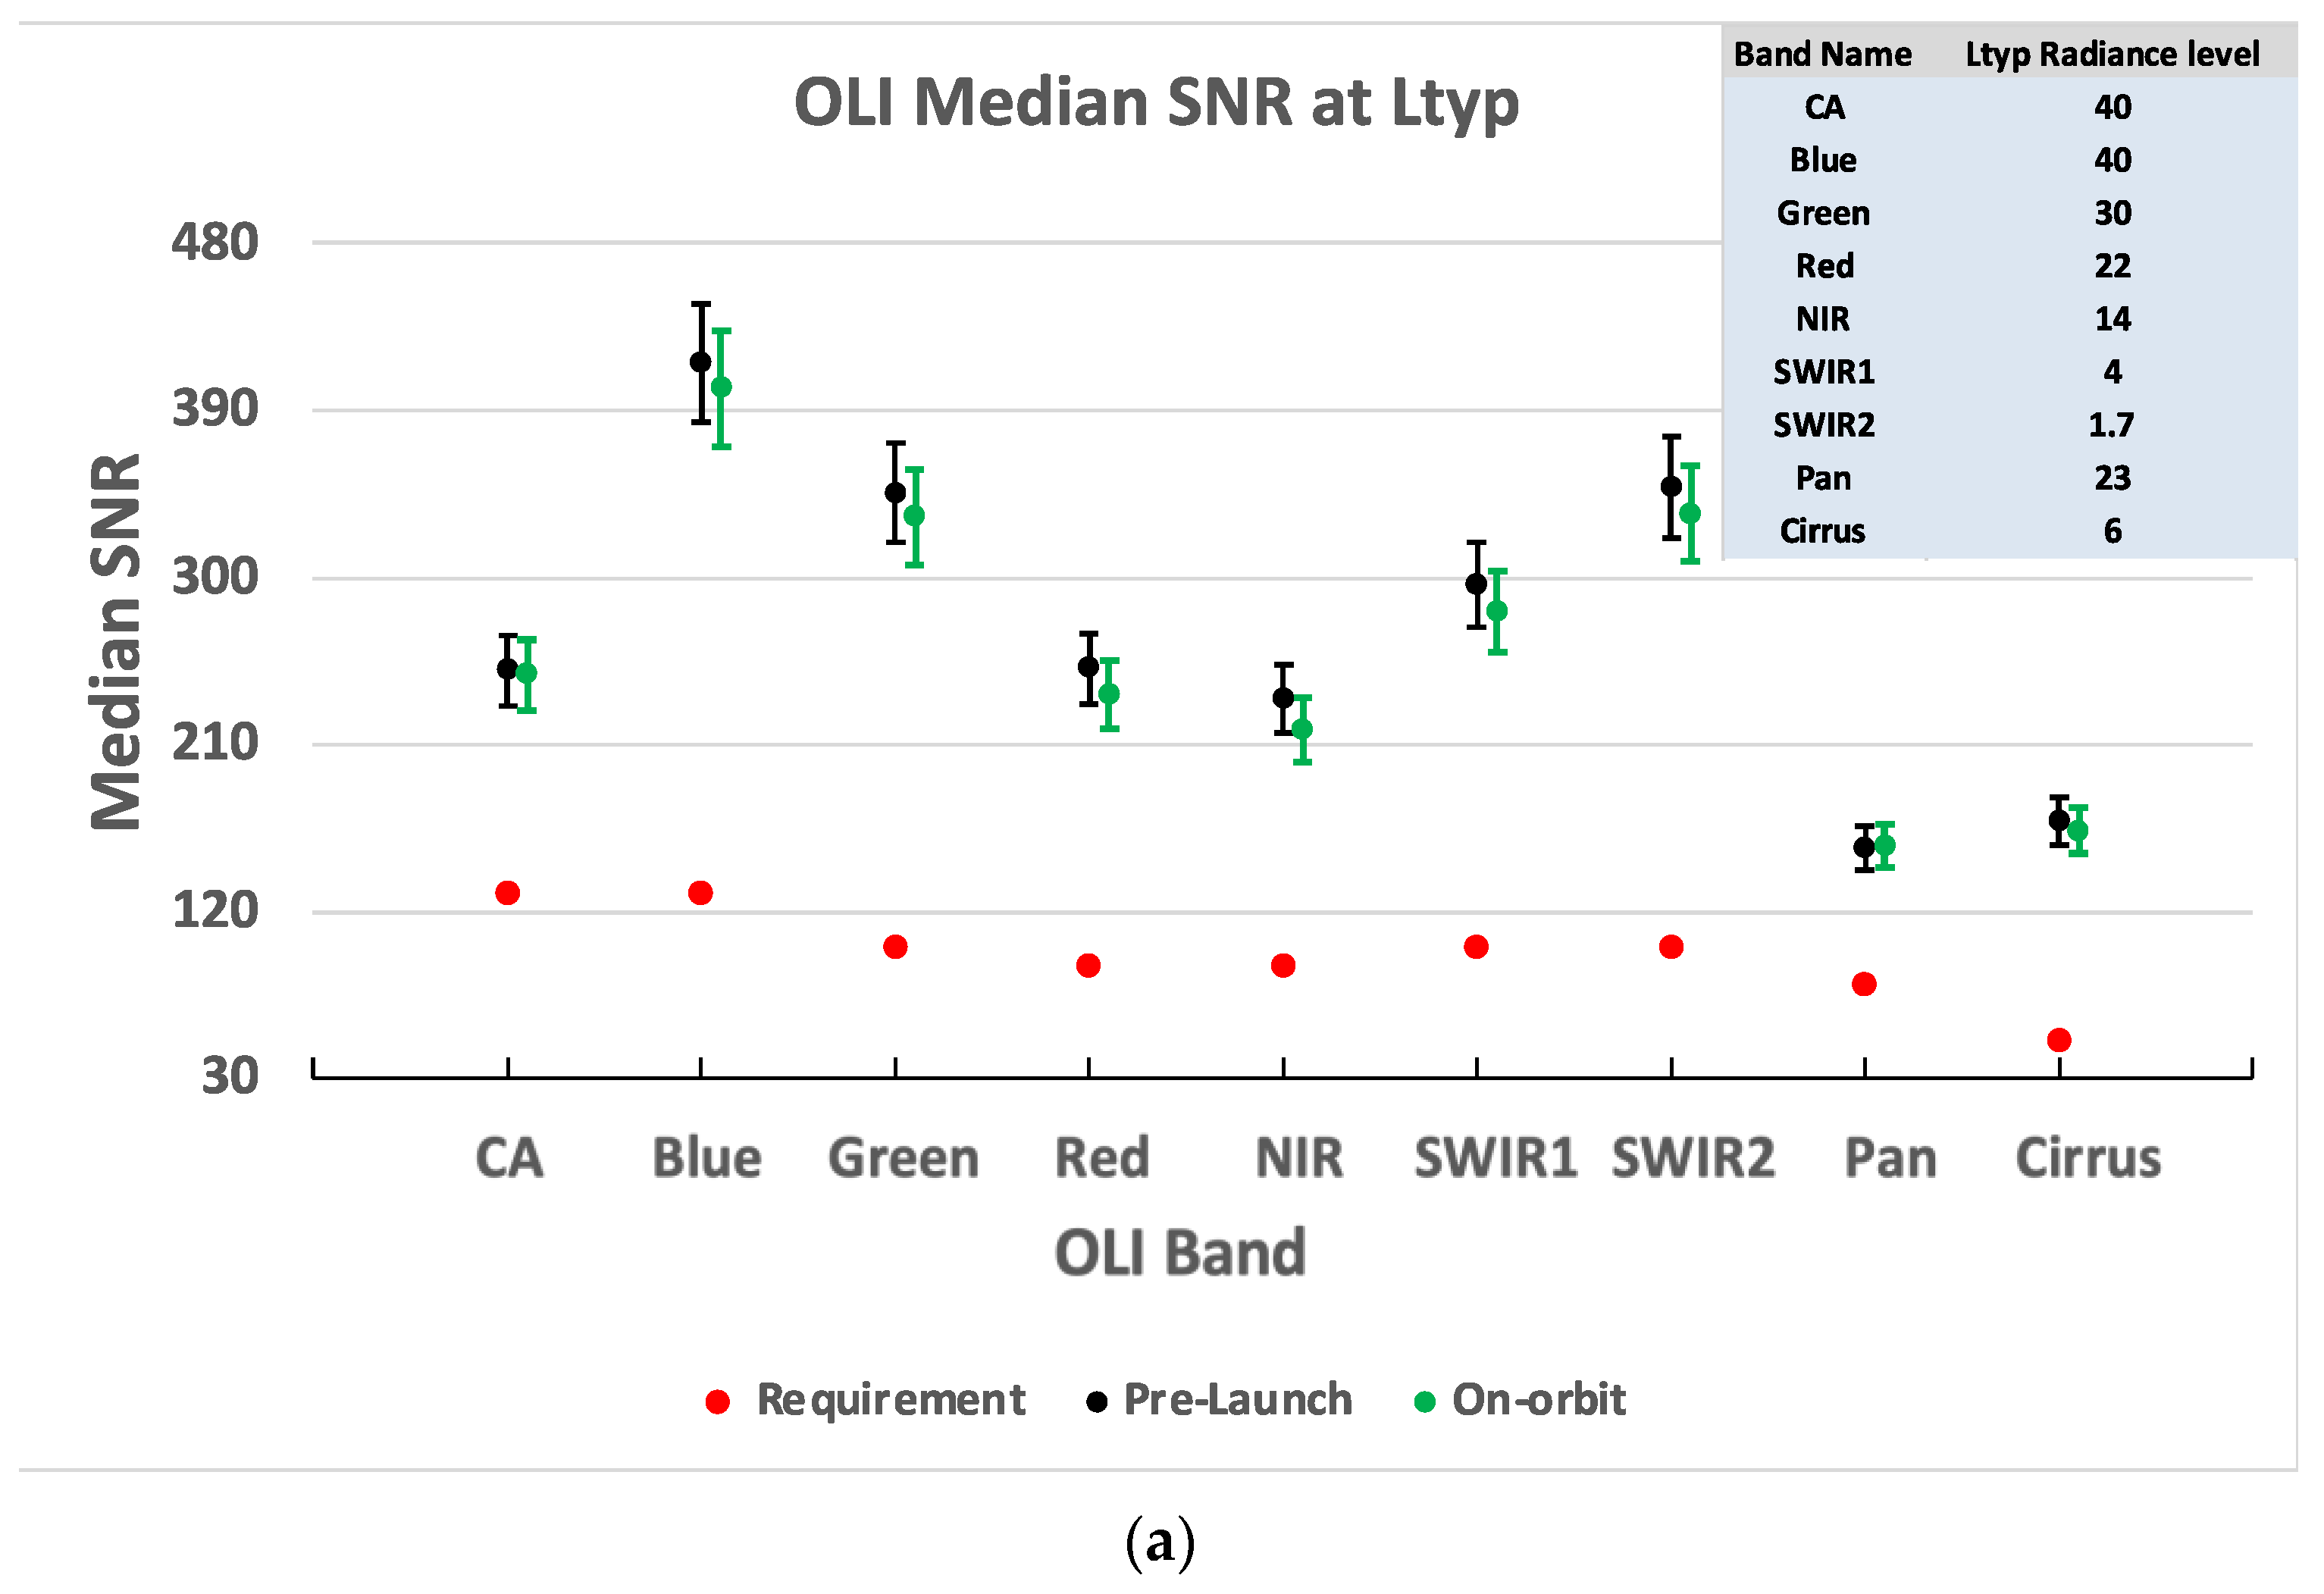
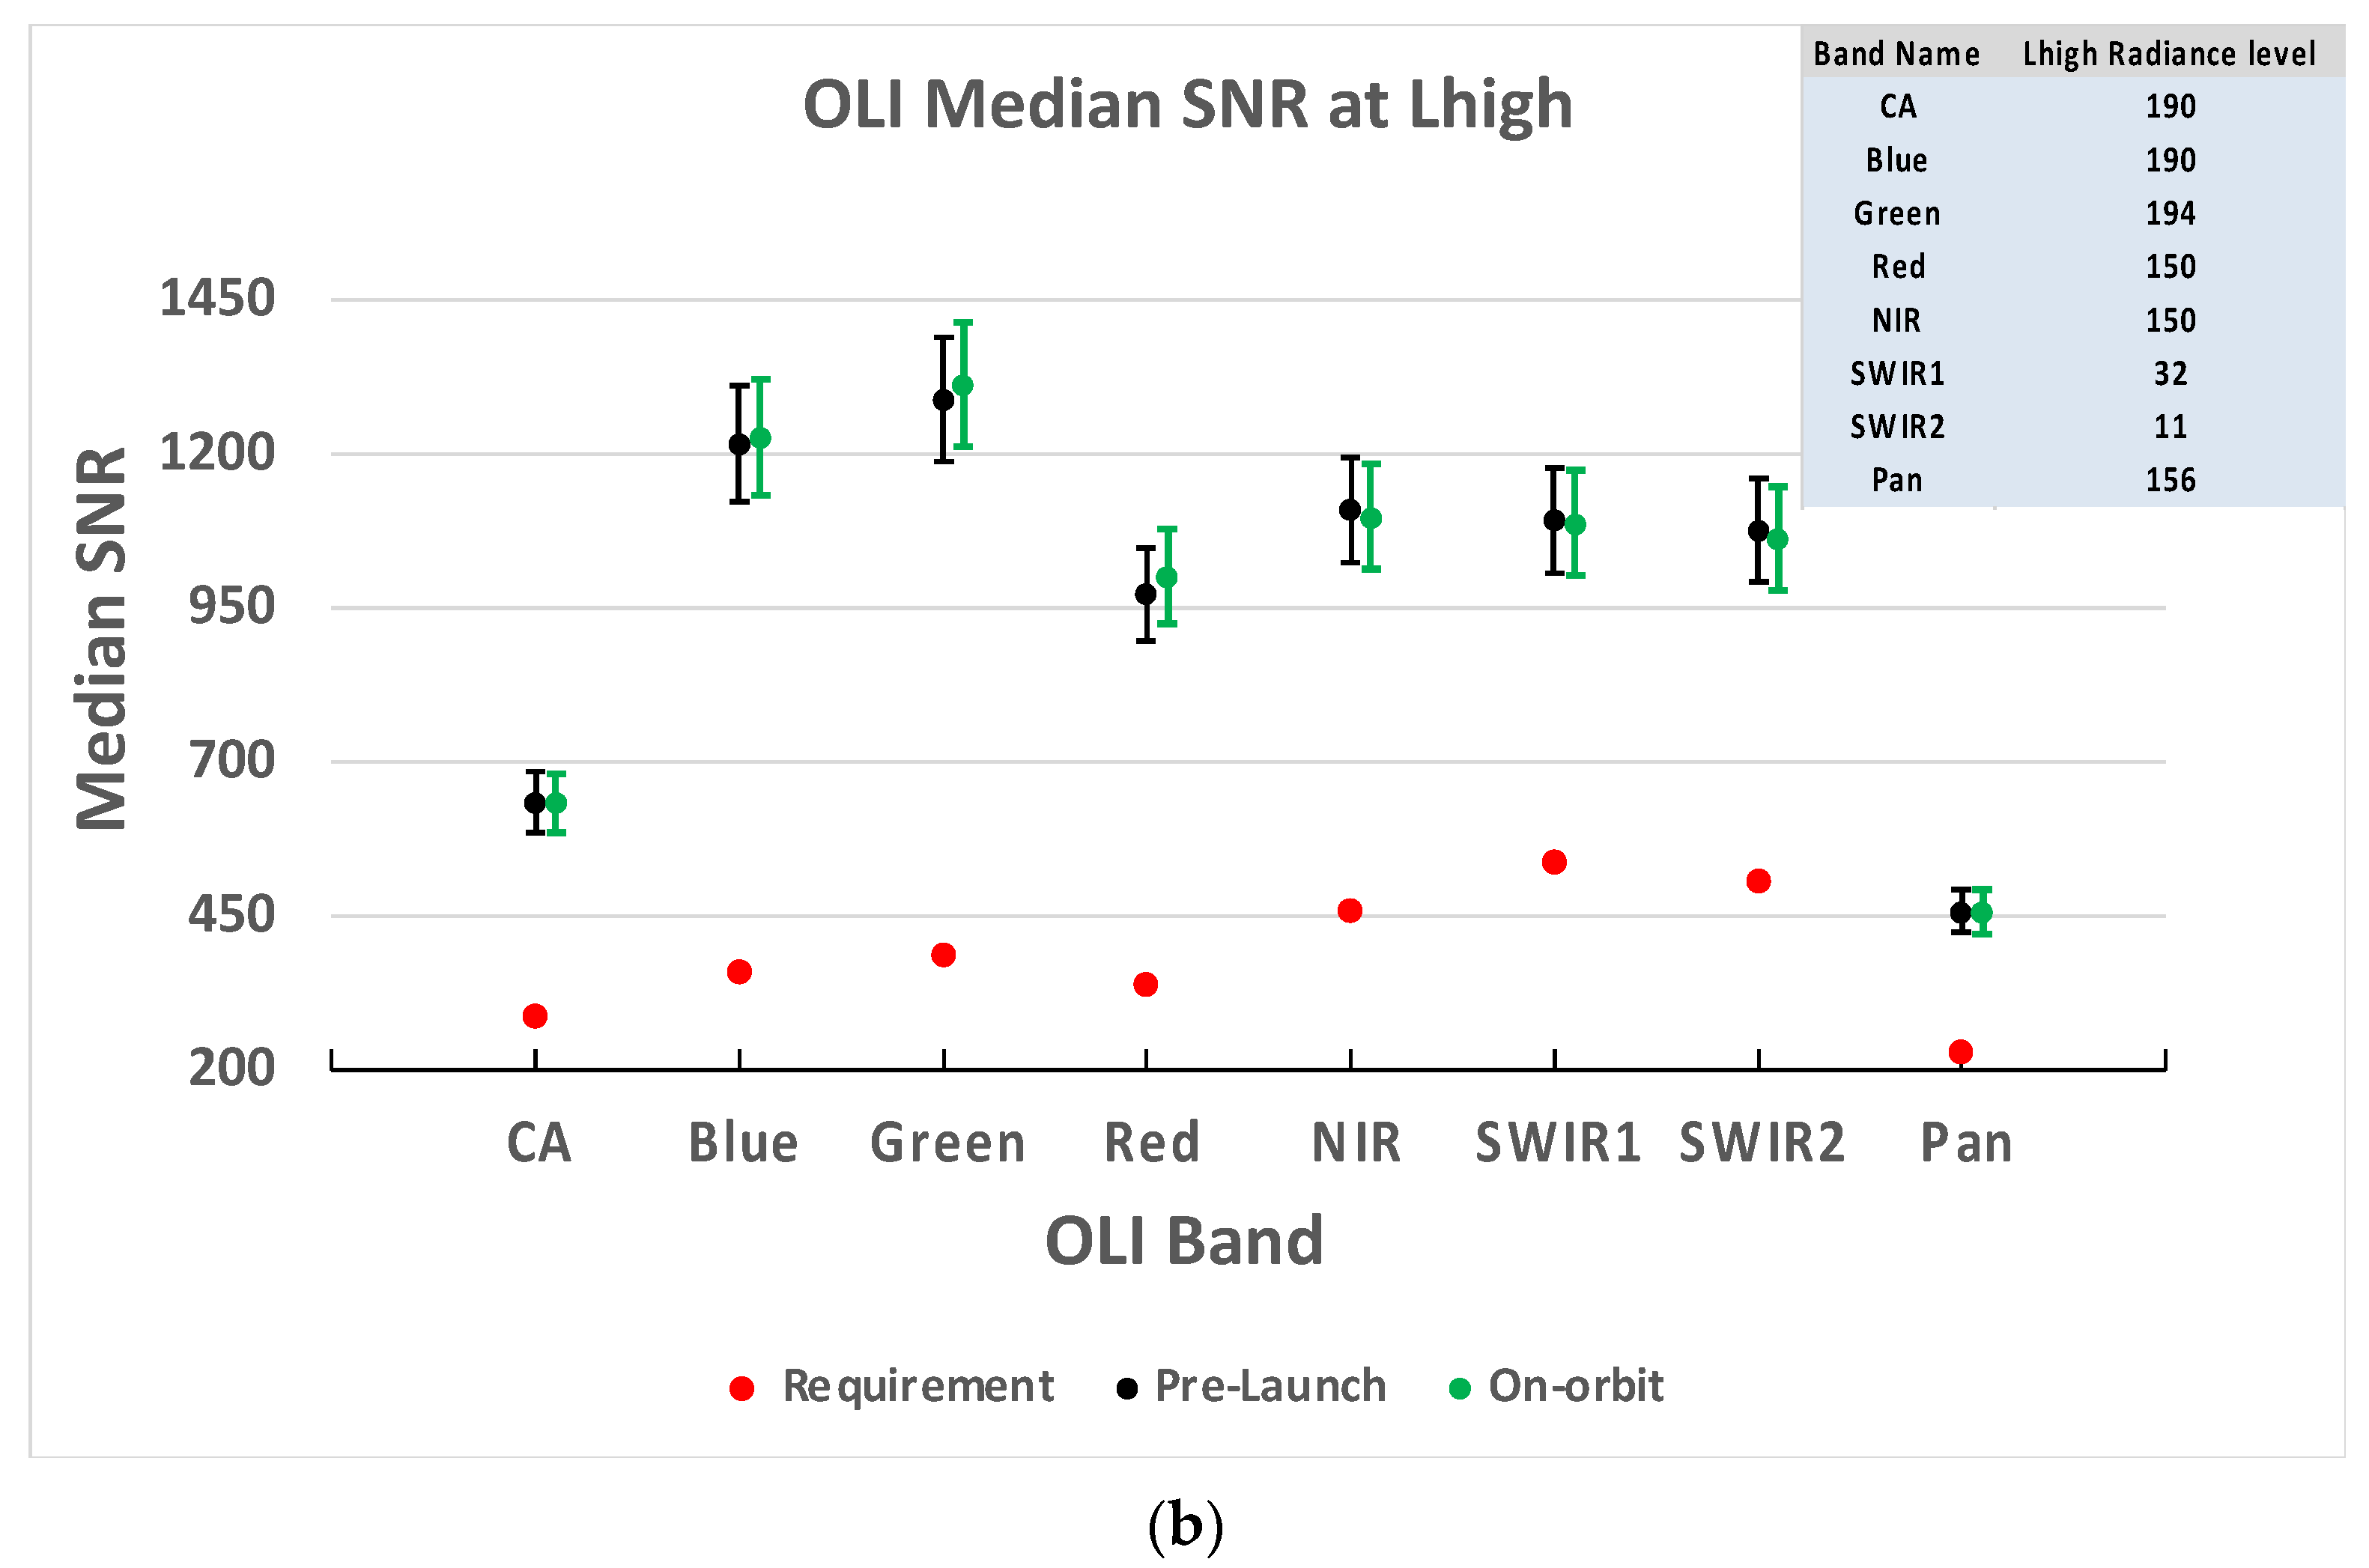
The noise analysis on orbit was assessed in a similar manner to how it was assessed during the pre-launch testing, using shutter, working SL, and working solar diffuser datasets. One small difference was that, during the pre-launch, the evaluation of the SNR vs. signal relationship used the DSS-illuminated datasets and not the solar diffuser datasets. Since the OLI absolute radiance scale is a band average-level characteristic, we reported the OLI signal-to-noise, response stability, and residual non-linearity metric for the band average results. Starting with the estimated SNR, results are reported for the band median evaluated at the two signal levels of Ltyp and Lhigh in the same manner as they were reported pre-launch. The results illustrate the worst-case conservative estimate for the SNR values shown that include a subtraction of 7.76%. The value of 7.76% is associated with the worst-case SNR-estimated uncertainty. This evaluation uses shutter dark data, stim lamp data, and either solar diffuser or DSS peak signal data to derive per-band least squares fit model parameters for the SNR vs. signal level. The total uncertainty that was associated with the SNR calculation was computed from the root sum of squares of three terms. These terms are the least square model-fit residuals, the estimated residual non-linearity, and the uncertainty in the radiometric signal. Notice that all of these terms are expected to retain their pre-launch levels, hence the uncertainty for the SNR remains a fixed value valid for both pre-launch and on orbit. From the perspective of the transfer-to-orbit analysis, it is assumed that all spectral bands and all signal levels can use the same 7.76% conservative level of uncertainty. Plotted in
Figure 5a,b are the worst case median SNR at Ltyp and SNR at Lhigh values computed from pre-launch and on-orbit datasets with the conservative 7.76% uncertainty error bars added to both. The SNR values in
Figure 5 match within the one-sigma error bar for both Ltyp and Lhigh. This confirms that no change occurred for the noise performance of the OLI on orbit.
Table 4 summarizes the range in the differences for SNR between pre-launch and on orbit states for Ltyp and Lhigh for all spectral bands. This table shows that for all bands and both signal levels, the estimated SNR match is within the one-sigma level of 7.76%. The summary table shows that for Ltyp the delta ranged between −0.5% for the Panchromatic band and 7.1% for the NIR band with a median change of 3.8% for all of the spectral bands. For Lhigh SNR, the change was between −2.9% for the Red band and 1.2% for the SWIR2 band with a median change of 0.3%.
The long-term stability characteristics of the OLI were defined for the response stability over the duration of the 5-year lifetime of the OLI system. The pre-launch values reported are conservative estimates of the mean with the addition of two times the standard deviation level of the OLI instability for each spectral band. The stability assessment also included an additional offset bias to account for the 5-year pristine solar diffuser panel aging degradation. The pre-launch result started with the estimated results for the 16-day short-term stability, to which is added the mean plus twice the standard deviation computed terms and an additional value of 0.028% to account for the 5-year aging degradation of the solar diffuser response uncertainty. The diffuser aging degradation impact was derived from pre-launch measurements on diffuser material witness samples that concluded that the UV exposure of the diffuser panels will cause a change of no more than 0.1% per hour of sunlight. Since the pristine diffuser total on-orbit operation over 5 years will not exceed 17 min of sun exposure, the aging impact for this duration was computed to be 0.028%.
On orbit, the estimate of the long-term stability was derived from the trending analysis of daily working SL collects and the repeated working solar diffuser collects, from which we compute the 16-day stability value and the two-sigma drift fit uncertainty. The 16-day stability drift is derived from the initial trend of nearly 70 days of OLI operation after the instrument response appeared to approach a steady state plateau (omitting the first two datasets for the SL and solar diffuser collects). To illustrate this, a plot for the on-orbit Coastal Aerosol band trending data is shown in
Figure 6. The trend analysis is repeated for every band and both the solar diffuser and stim lamps datasets. The 16-day stability on-orbit results are shown in
Table 5 for both the stim lamp and solar diffuser. The last line of
Table 5 shows the roll-up results for the on-orbit long-term stability values that use a root sum square of three bolded-value lines to compute the total on-orbit long-term stability. The 16-day stability mean and two-sigma variation estimates from the observations of the solar diffuser panel and the SL are condensed into the two bolded-value lines. These bolded lines use the largest derived mean level for 16-day stability, from the solar diffuser and the stim-lamp datasets, in each spectral band and the smallest two-sigma stability estimate of variation in the results, from the same datasets. The rationale for using the smallest value among the solar diffuser and the stim lamp two-sigma uncertainty was due to the observation, that for both pre-launch and on orbit states, the two-sigma scatter and variability about the stability estimates were the dominating factors impacting the 5-year stability values.
Observations made during the analysis show that variation between the sources used in the evaluation between the pre-launch and on orbit states impact the resultant two-sigma levels. The on-orbit source and collect conditions repeatability are harder to control and for that reason we obtained a more correct estimate for the core OLI detector response stability when we used the smallest two-sigma values. It is interesting to note that, in general, for all spectral bands except for the CA and Blue bands, the stim lamp-based two-sigma estimate was always lower than the solar diffuser results. The last line in
Table 5 shows that seven out of nine bands resulted in equal, or even lower, values compared with the pre-launch long-term stability results. Only for the Red and Panchromatic spectral bands was the on-orbit stability estimate doubled from 0.1% to 0.2%, and their estimated two-sigma variations were as high as five times worse than the pre-launch levels. Furthermore, in the context of the transfer to orbit, these two spectral bands’ change impact was less the 0.1% and it was not a significant value, especially when the results for all bands showed on-orbit-derived long-term stability values that were better than 0.2%. These results illustrated that the long-term stability on orbit during the initial 70 days of operation was at the same level predicted pre-launch. The Red and Pan spectral bands that exhibited the higher uncertainty on orbit were most likely a limitation dominated by stim lamp source stability for these spectral bands. Since during the initial 70 days of operation the spacecraft activities involved many non-routine operations, these might have induced additional instability in the SL source collects. When re-evaluating this analysis after a year of operation we found the CA 16-day stability mean value from the stim lamp data to be <0.01% rather than the 0.02%; however, the two-sigma uncertainty level was still high, most likely due to the low signal level produced by the stim lamp.
The last radiometric-related performance characteristics of OLI response that we could confirm on orbit were the non-linearity characteristics. For Landsat 9 OLI, the pre-launch characterization was conducted with an improved protocol in which the signal levels were controlled in-band, and the test collect sequences enabled decoupling non-linearity from non-uniformity [
11]. This improved non-linearity characterization, and enabled better understanding of the integration time sweep datasets and how they relate to radiance-based non-linearity collects. This enabled the Landsat 9 OLI to use datasets at two signal levels for the on-orbit non-linearity characterization. The addition for Landsat 9, was in the set of stim lamp integration time sweep (ITS) collects, whereas for Landsat 8 we only had the solar diffuser set of ITS collects. The updated sequence of operation produced the same 21 integration times for both the solar diffuser data and the post-warmup-period stim lamp illumination. These enabled us to track changes for the non-linearity over time, relative to the pre-launch non-linearity correction, all while covering a wider portion of the OLI’s dynamic range. The analysis of these on-orbit results from this new set of integration time collects confirmed that we were correcting the non-linearity to within <0.5% across the dynamic range for all bands [
23].
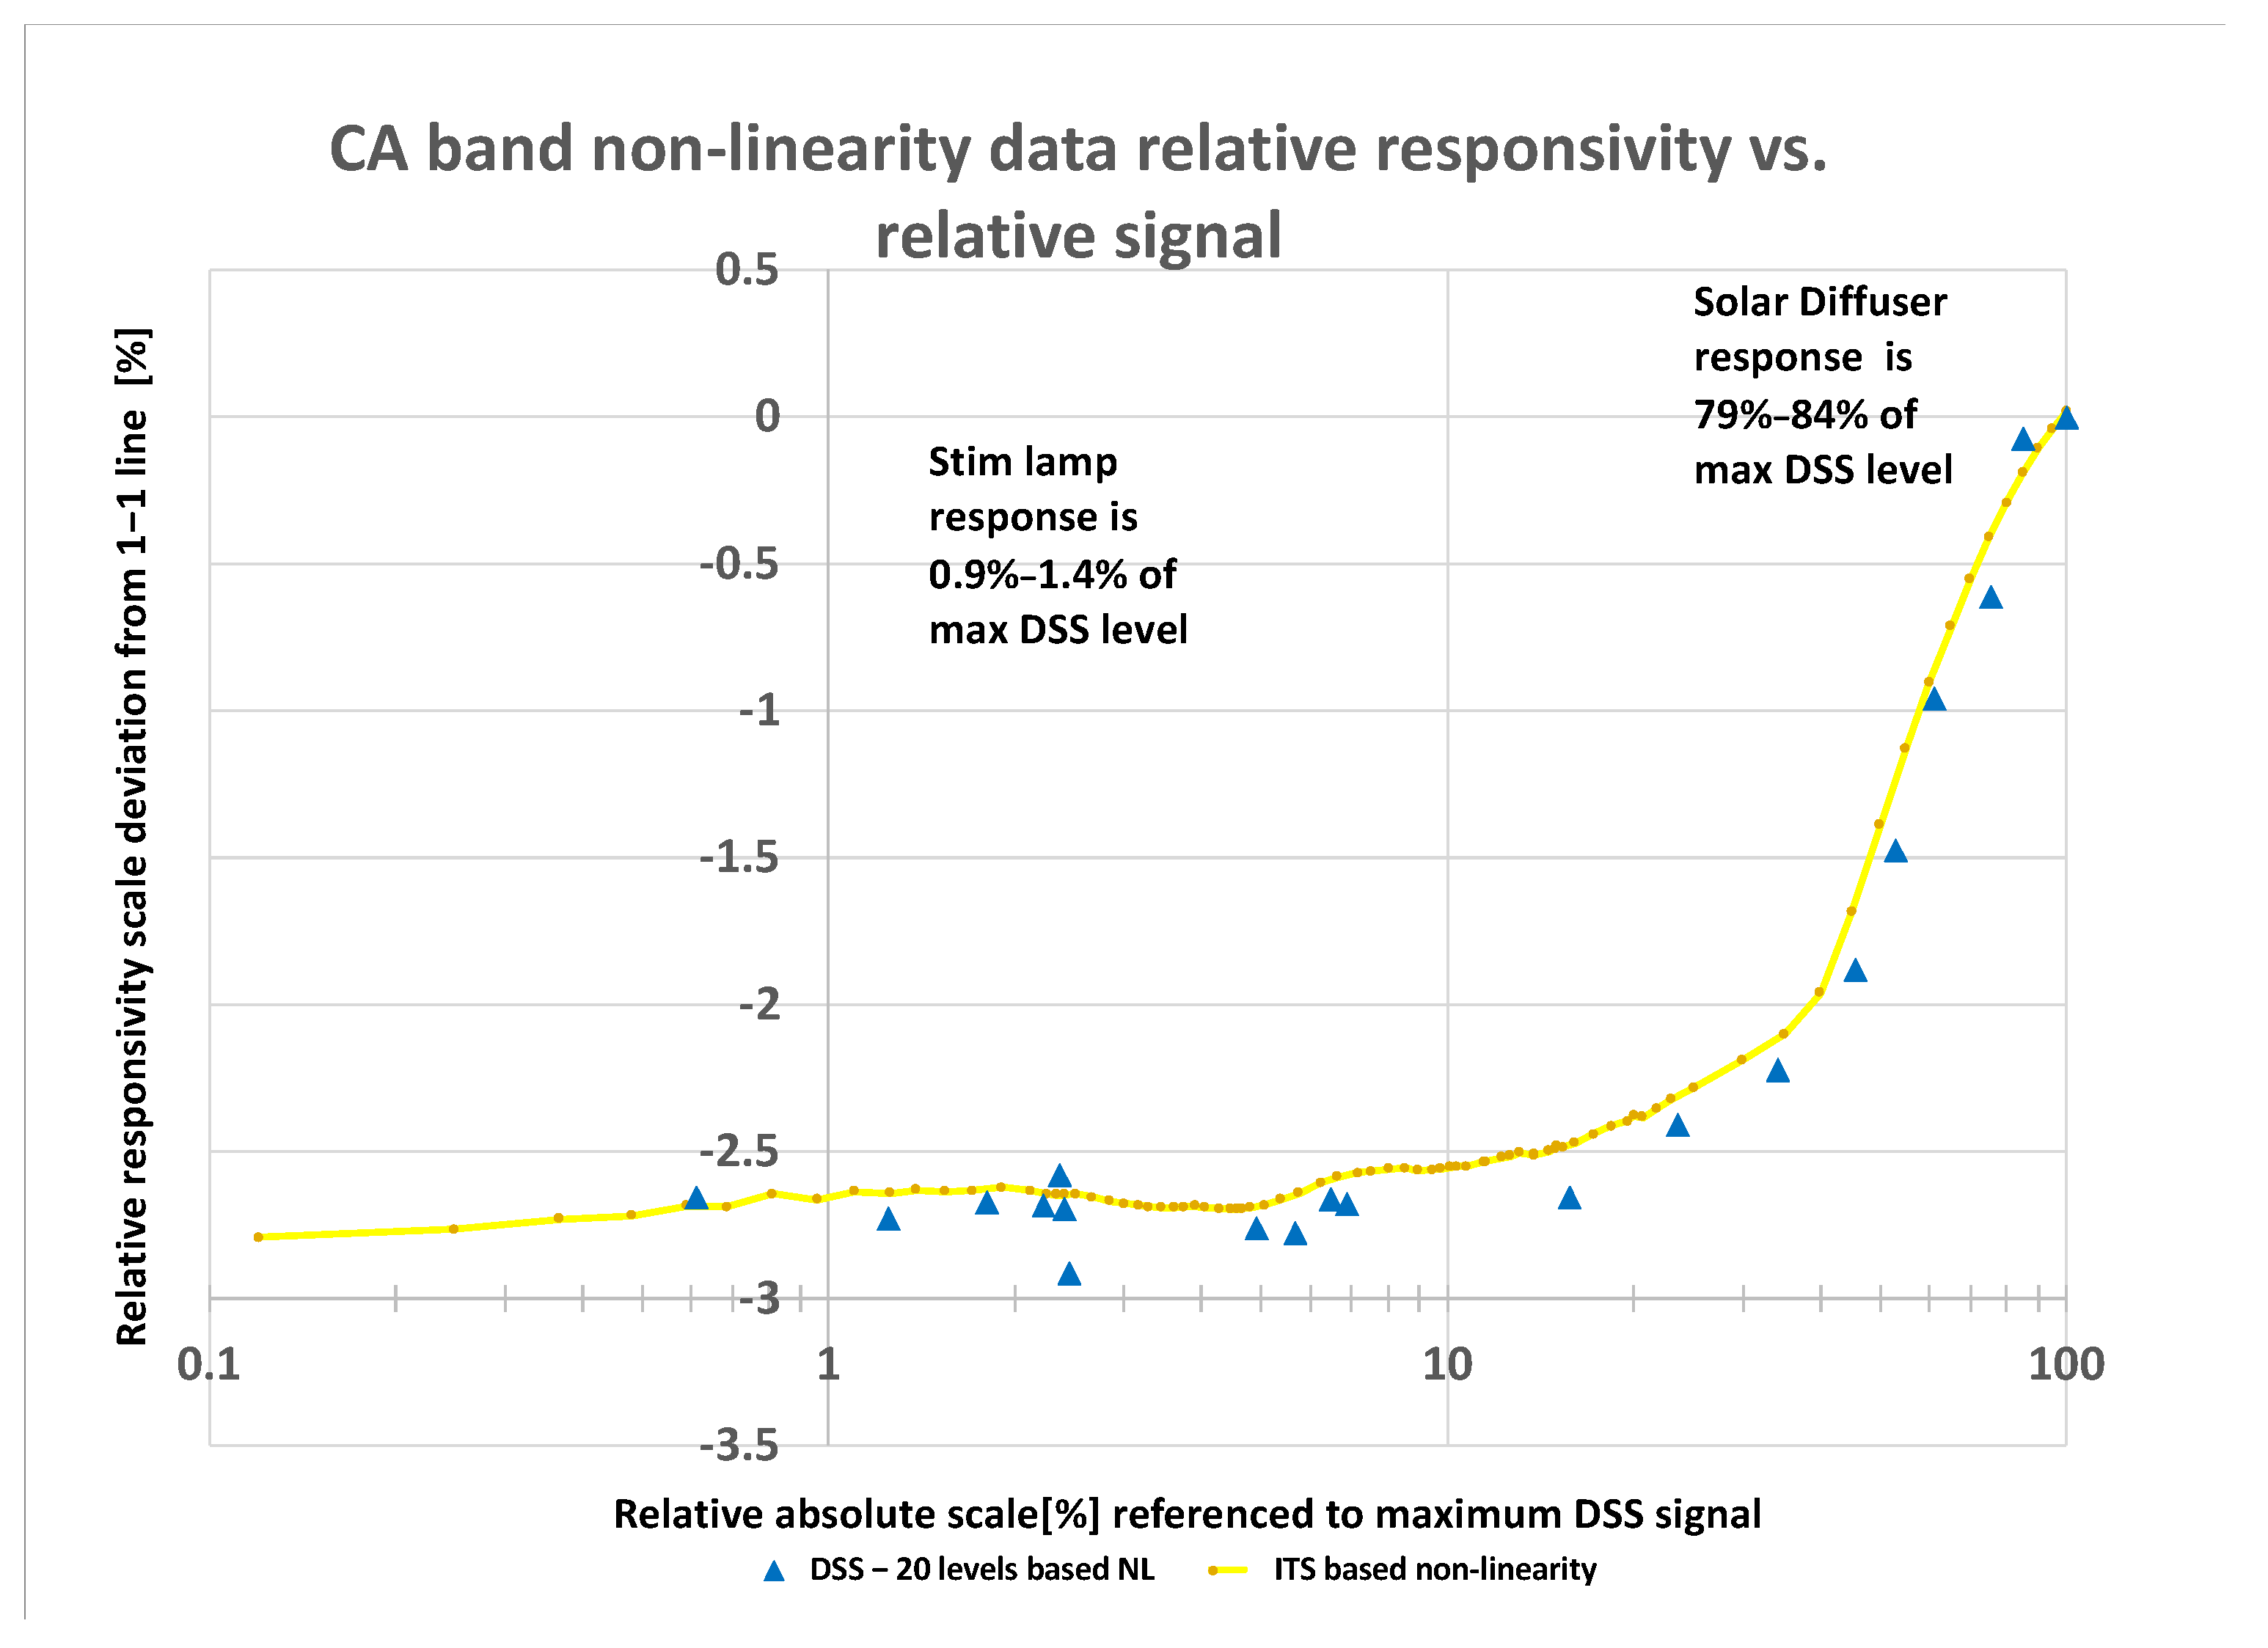
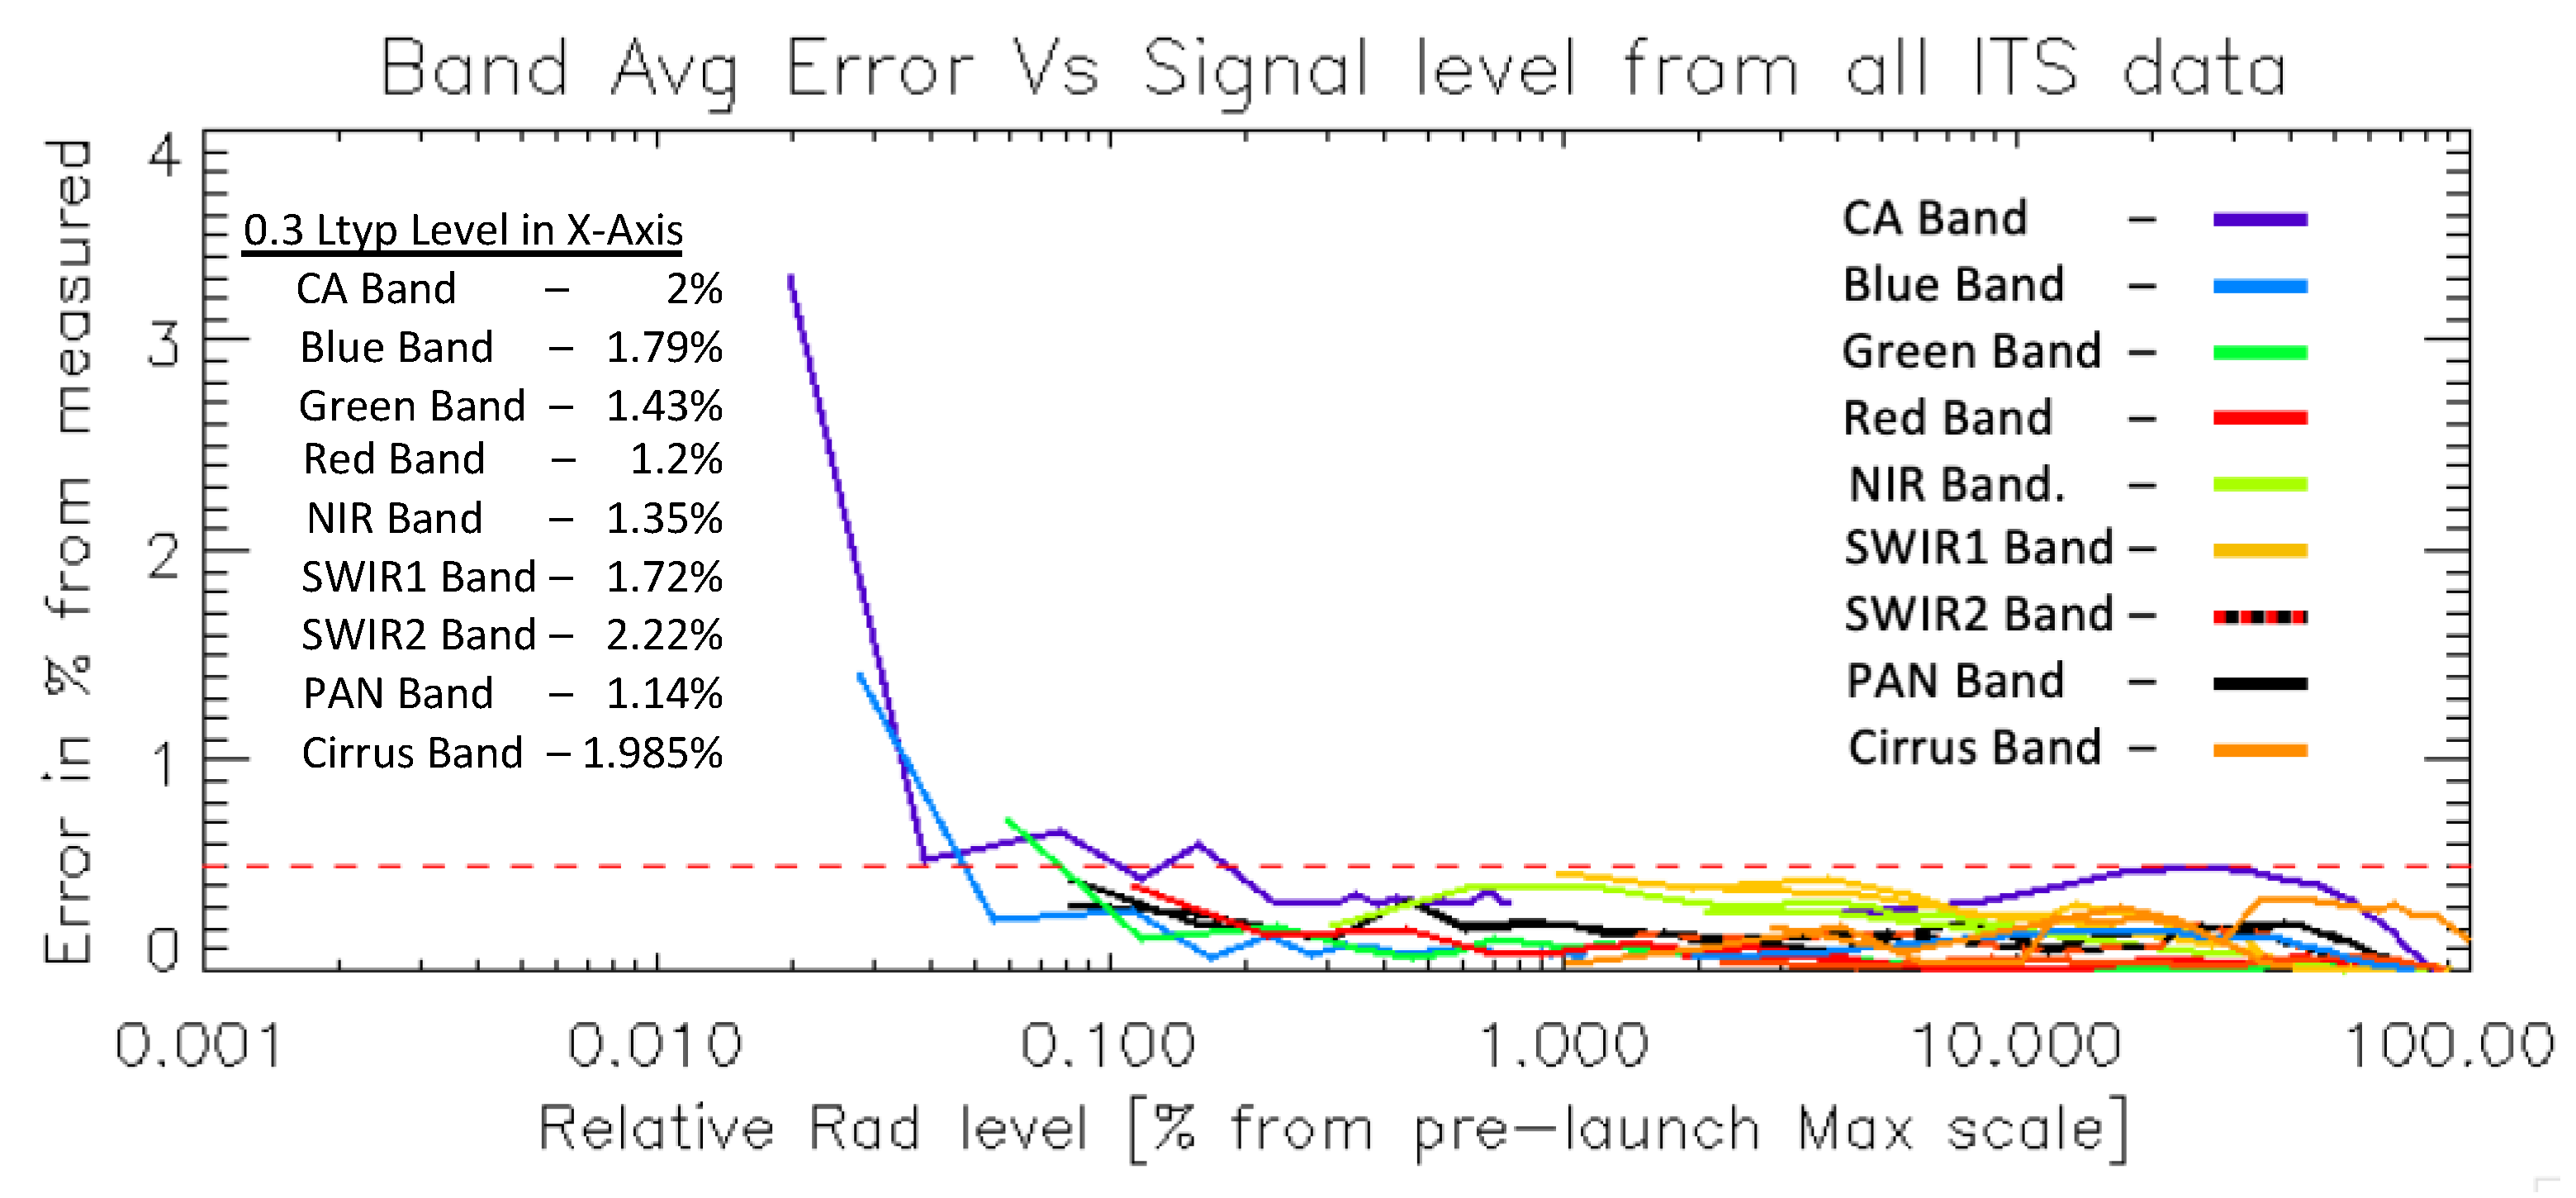
Illustrated by
Figure 7 is the on-orbit residual band average error after a non-linearity correction-derived pre-launch was applied. The estimated on-orbit non-linear relative error was computed in reference to the expected linear signal. The expected linear signal was computed as the product of the SL nominal signal response and the ratio of each integration time value to the nominal integration time. The horizontal dashed red line in
Figure 7 illustrates the 0.5% residual non-linearity desired limit. Clearly all bands were meeting this requirement limit over two orders of magnitude in the dynamic range. Notice that, for each band, the on-orbit-derived validation started at a different maximum signal level as it was dependent on the signal viewed with the solar diffuser. Only the shorter wavelength bands of CA, Blue, and Green showed that the mean response for the ITS lamp data could jump above the 0.5% and this occurred only at signals that were below 0.2% of the dynamic range. As a reference, this signal level is about 10 times smaller than the 0.3 Ltyp signal (the lowest signal where OLI requirements are defined). The remining spectral bands maintained the residual of <0.5% non-linearity across three orders of magnitude in the dynamic range. The uncertainty associated with the residual non-linearity plot will naturally increase as the signal level decreases. The on-orbit residual non-linearity check allowed us to state with certainty that for post linearity corrections (the residual error between the peak solar diffuser and the peak stim lamp responses) the error was nearly at the level of the total long-term stability response values shown in
Table 5.
3.2. Solar Diffuser Collects-Based Transfer to Orbit
This segment focuses on the measurements of the OLI response to the on-board reflectance scale absolute calibration reference, i.e., the working solar diffuser panel, when it was sun-illuminated, both pre-launch and on orbit. We show results derived from pre-launch predictions and on-orbit solar diffuser collects. In this section we focus on the bolded outlined parts of the process illustrated in
Figure 4a,b. While the pre-launch values for the solar diffuser data were based on the BATC processing system, to further enhance the confidence in the interpretation of on-orbit results, the raw OLI response to the sun-illuminated solar diffuser was converted to radiance using two independent processing systems, the USGS official Landsat Product Generation System (LPGS) processing and BATC processing. While both the USGS processing and BATC processing follow the same core steps, each has its own independently derived calibration parameters and non-linearity corrections. Furthermore, computation summaries for the on-orbit response will be shown for the first working panel solar diffuser collect on orbit and for the average of seven SD collects that occurred after the OLI approached a nominal response stability level. In all of the tables and plots in this section, the spectral radiance results are given in units of watt per meter squared per micrometer per steradian (W/m
2 sr µm). All measured radiances reported (pre-launch or on orbit) are normalized to the earth–sun distance of 1 A.U. by multiplying the radiance by the earth–sun (E–S) distance square as known for each of the collect dates. The E–S distance is based on the cyclical earth–sun distance vs. DOY (day of the year) in A.U. units [
24].
The results reported are organized into three parts that relate to the radiometric scale on-orbit revalidation. The first part is the comparison of the band average radiance response using the pre-launch-derived TOA-predicted radiance and the actual early evaluation for the TOA on orbit after all of the collects are normalized to 1[AU] earth–sun distance, accounting for the variations between the collects’ dates (
Table 6,
Table 7 and
Table 8). The second part checks the OLI TOA radiance response to the actual solar illumination diffuser panels against the predicted TOA response using the ChKur [
25] and Thuillier [
26] exo-atmospheric solar irradiance models (
Table 9,
Table 10 and
Table 11). The reason for the use of these specific models is that ChKur was the long-term reference in the Landsat missions’ vicarious calibration analysis and at the time Landsat 8 and Landsat 9 were built, the Thuillier model was the Committee on Earth Observation Satellites (CEOS) recommended reference solar irradiance spectrum model [
27,
28,
29]. The last part of this results section shows the results for the TOA update to the reflectance conversion coefficients and comparison between the final on-orbit values and the pre-launch estimates (
Table 12). While this part is not a critical element in the transfer to orbit, it is reported in this article for the reasons described in
Section 2.
The radiance values shown in
Table 6 include both the on-orbit results and the pre-launch estimates for TOA-predicted radiance. The pre-launch TOA-predicted radiance values were based on the working panel solar diffuser heliostat datasets taken in the two best test conditions collect dates. These were the key inputs for evaluating the agreements between the pre-launch and on-orbit results. As
Figure 6 illustrates, the first two solar collects on orbit (depicted in the figure by the faded coloring) occurred when the OLI had not yet reached optimal on-orbit stability. This can be resolved in two possible methods. Option one, is to consider the trend-based correction as an additional stability error factor. This factor will be used to adjust the first collect date prior to assessing the impact of the transfer to orbit of the radiometric scale. The second option is to use the average of the seven working solar diffuser collects that span over the 36 days and that are taken after the OLI reaches nearly its nominal stability operations. As shown in
Table 7 and
Table 8 we selected to show the results for both evaluation-method options. For Landsat 9 OLI, the near nominal stability operation was reached about 10 days after the initial turn-on.
Table 6 lists the four types of measured results that illustrate results from the single first collect and the average of seven collects processed by each of the processing systems.
Table 7 and
Table 8 are showing the evaluated changes in the on-orbit response relative to the pre-launch-based TOA predictions for each of the four on-orbit processed versions against each of the corresponding pre-launch reference collects. In the rightmost columns of
Table 7 and
Table 8 we include the heliostat test configuration uncertainty two-sigma levels that the on-orbit changes need to be checked against. Uniquely for
Table 7, due to the temporary added OLI instability error of the first collect, we included the per band additional estimated uncertainty associated with that collect. In
Table 7, the comparison of the evaluated change impact is shown as a % relative to the pre-launch results. The values of these comparisons show that all bands and all processing systems results are under the k = 2 heliostat collects uncertainty. While additional error due to the OLI first collect day instability can be considered for these datasets, it was not needed. When considering the results for the average response shown in
Table 8, the variations in the results between the two independent processing systems for all bands agree within <0.15%. In contrast, the comparisons that are based on a single collect, as seen in the results shown in
Table 7, illustrate a larger mismatch between the processing systems. Comparing between the differences of the two pre-launch reference collect dates, we can see a difference of up to ~0.6% between the two collects. The most likely reasoning for this level of difference is the uncertainty for the atmospheric transmission values derived. Accounting for such variation is included in the overall heliostat uncertainty budget. Examining the values of both
Table 7 and
Table 8 while being conservative, we can state that the transfer to orbit based on the working solar diffuser results alone, shows a change impact level that is <~3.9% for all bands (excluding the Cirrus band). Since the level of 3.9% is less than the lowest heliostat k = 2 uncertainty level, we can conclude that no significant change occurred on orbit. For all subsequent analysis steps discussed in this article that involved on-orbit data, we selected to use results from the multiple collects average TOA radiance response since these hold a reduced level of stability uncertainty.
In the second part of the solar diffuser response analysis, we show the comparison between the exo-atmospheric solar irradiance spectral models-based TOA predictions to both the pre-launch (
Table 9) and on-orbit (
Table 10) measured responses. Since the OLI radiance calibration path is separate from the reflectance calibration, we do not expect the radiance to agree with any model-based results within the heliostat uncertainty levels. A recent publication by Thuillier G. et al. also discussed variations between various solar irradiance models [
30]. However, we do expect that the differences between the measured and models-based radiances to be maintained for both the pre-launch and on-orbit collects, at levels that are within the heliostat uncertainty. The comparison that tests this expected result is summarized in
Table 11, and in that manner, it adds one more evaluation for the transfer-to-orbit-induced impact.
Table 9 shows the comparison of the two evaluated models to the two pre-launch heliostat collects as processed with the BATC processing system.
Table 9 model-based values were computed based on the compilation of diffuser laboratory measured reflectance factors, the OLI final relative spectral response data, and the model spectral radiance.
Table 9 results list the mismatch between the two models in each of the pre-launch collect dates as a percent change relative to the model-based predicted TOA values. The largest mismatch between the pre-launch measured values and the models-based TOA radiance occurred for the SWIR2 Thuillier model. This is expected since the baseline radiance and reflectance values from the NIST start with higher uncertainties for the SWIR spectral bands. Since all laboratory measurements that tie the reference calibration articles to the NIST scales occurred in ambient conditions, it is expected that for the SWIR bands the uncertainties grow. For ambient testing, it has been shown that the atmospheric path transmission induces higher uncertainties for radiance measurements in the NIR and SWIR spectral bands [
20]. Water vapor and particle scatter are examples for some of the causes that impact these longer wavelengths signal losses. Examining the SWIR bands results for the ChKur model,
Table 9 shows that at least one of the two heliostat collects matched the model-predicted results within the k = 2 heliostat expected uncertainties.
Table 10 shows the collated summary for the evaluation of the average-based on-orbit solar diffuser response against the two solar irradiance spectral models. Compared to the pre-launch results in
Table 9,
Table 10 results demonstrate a better agreement between the on-orbit measurements and for both of the solar irradiance model-based predictions. Specifically, for the ChKur model, both processing systems showed the on-orbit measurements agreed at a level that is less than the k = 2 heliostat measurement uncertainty and nearly approach the direct OLI reflectance scale uncertainty (
Table 3). Comparing between the results for each of the models, in
Table 10 both processing systems show the same differences vs. spectral band signature seen with the pre-launch heliostat results. The worst band was, again, the SWIR2 with a difference of nearly 3.4% between the two models.
Table 11 bolded values columns on the right side illustrate the change in the assessment from the TOA model-based predictions. In a way, these values can be interpreted as the model-based assessments for the transfer-to-orbit impact. The values shown summarize the per model results derived per band from the average of both processing systems, and the assessed changes from pre-launch to on orbit. In the two leftmost columns of
Table 11, we summarize
Table 9 pre-launch results as an average per model from the two pre-launch observations. These pre-launch average values are the reference values that the on-orbit results from
Table 10 are compared against. The sign of the model-based transfer-to-orbit impact is forced to match the sign seen in the
Table 10 on-orbit values. These results again illustrate that the SWIRS bands are suspected to have the largest impact. When examining the results closer, we can see that these are impacted mainly by that large mismatch to the models in the pre-launch data and the larger model-specific uncertainties.
In the last and third part of the diffuser-based observations, updated TOA on-orbit measured radiance were used from both the working and the pristine diffusers to replace the estimated pre-launch predicted values. This leads to an update for the reflectance conversion factors, which, like the absolute calibration gain parameters, are a set of band average values. While a quick on-orbit update can be made as early as 46 days after turn-on, the actual official on-orbit value for this parameter was evaluated towards the end of the commissioning period. This way, we follow the same process made for Landsat 8 that allows the evaluation of both working and pristine solar diffuser reflectance panels. This allowed us to obtain a larger set of datapoints and to compute the values after all additional relative gains and other gain refinements had been applied. Some of the radiometric adjustments applied were the gain updates that aimed to cross-calibrate the radiometric scales of Landsat 8 and Landsat 9. In addition, during the end of the commissioning period, unlike during the early orbit operation, the spacecraft follows the WRS-2 ground track after it reached its final orbit altitude and all on-orbit calibration collect sequences follow a pre-scheduled cycle. The combined effect of these aids the OLI in reaching a plateau in its level of radiometric response stability. In
Table 12, the change applied to the radiance to reflectance conversion factors between the pre-launch and on orbit states is shown along with the actual parameter values. This table illustrates that the updates made are still within the expected transfer-to-orbit known uncertainty and the two-sigma total radiometric scale uncertainties. The data reveal that the largest update was in the Cirrus band with 9.37%, and the second largest was for the Green band, with −5.17%. For the Green band, the two-sigma combined heliostatheliostat expected uncertainty and stability error was 5.51% (
Table 7). This illustrates that the Green band, even after all gain updates are included, still re-validates its pre-launch calibration within the expected uncertainty levels. The negative value means the radiance measured on orbit was higher than expected pre-launch. At the same time, the Cirrus band that had no gain updates at the end of the commissioning resulted in a change value of 9.37%, which is approaching the two-sigma limit of the system performance requirement. The solar diffuser data alone cannot confirm if this level of change is due to actual transfer-to-orbit impact or an error made in the assigned pre-launch calibration radiance gain parameters. The question related to the transfer-to-orbit impact on the Cirrus band is resolved in the next section, where we use the stimulation lamp datasets. The root cause for the observed change was not resolved until we obtained more joint solar and lunar on-orbit data with both Landsat 8 and Landsat 9 systems. Ultimately, follow-on investigation and data analysis through the first year of on-orbit operation revealed the root cause to be an error in the applied pre-launch gain parameter that resulted in applying a wrong pre-launch radiance scale. After the mistake was corrected by applying the correct pre-launch parameters to the USGS processing, which adjusted the absolute radiance scale for the Cirrus band, it was confirmed that the pre-launch to on-orbit change in the reflectance factor variation dropped to a level of 3.32%, which is close to the results computed for other OLI spectral bands, and the new update level is within the two-sigma uncertainty limit confirmation range. Please note that, due to this planned, early on-orbit update to the reflectance conversion factors, the Cirrus band radiance scale error did not impact the uncertainty level of early released USGS TOA reflectance science products.
Table 12.
End of OLI commissioning period Radiance to Reflectance conversion factors Compared to Pre-launch estimates. The units for the conversion factors are [m
2 x sr x µm/W] as they are described in the CPF configuration control document [
31].
Table 12.
End of OLI commissioning period Radiance to Reflectance conversion factors Compared to Pre-launch estimates. The units for the conversion factors are [m
2 x sr x µm/W] as they are described in the CPF configuration control document [
31].
| Band Name | TOA Radiance to Reflectance Conversion Factor | On-Orbit Update Change as (1-On-Orbit/Pre-Launch) × 100 [%] |
|---|
| Pre-Launch [ m2 sr µm/W] | On-Orbit Update [m2 sr µm/W] |
|---|
|
Coastal Aerosol
| 0.00153916 | 0.00159491 | −3.62 |
|
Blue
| 0.00147994 | 0.00155286 | −4.93 |
|
Green
| 0.00160683 | 0.00168997 | −5.17 |
|
Red
| 0.00193829 | 0.00199388 | −2.87 |
|
NIR
| 0.00326860 | 0.00324993 | 0.57 |
|
SWIR 1
| 0.01304526 | 0.01300925 | 0.28 |
|
SWIR 2
| 0.03857498 | 0.03852789 | 0.12 |
|
Pan
| 0.00173765 | 0.00176143 | −1.37 |
|
Cirrus
| 0.00864384 | 0.00783421 | 9.37 |
3.3. Simulation Lamp Color Temperature Analysis and Validation of Cirrus Band Transfer-to-orbit Performance
In this section, the results of pre-launch color temperature (CT) model fit parameters and residual error are used to compute updated on-orbit color temperature model results. Since
Section 3.2 confirmed that no credible change occurred throughout the launch, the processing of stim lamp data used the same pre-launch calibration parameters to convert the OLI digital counts response to calibrate radiance response. The residual CT model error computed relative to pre-launch measurements aimed to minimize the error among all spectral bands. The residual error was computed as a relative error to the model-based response (i.e., gain error); this way, when a model-based update is made on orbit (finding the new color temperature fit), the pre-launch-based relative residual error correction can be applied to the new color temperature illumination. The assumption that the model error is going to remain the same for both on orbit and pre-launch was rooted in the fact the light bulbs used the transmission of the system and the responses all remained invariant within the expected uncertainties. An error in that assumption may result in additional residual difference between the stim lamp-based and the solar diffuser-based paths for the assessment of the transfer-to-orbit impact. Such additional error terms can be considered a systematic error that accounts for several changes that occur in the stim lamp operations that are not accounted for by the model fit parameters. This leads to an extra correction mainly due to changes in the stim lamp system rather than in the OLI FPA response. Based on experience with the stim lamp on-orbit operation of Landsat 8 OLI, the SL source was expected to mainly have an impact to its modeled color temperature and associated transmission scaling parameters. However, an additional adjustmentto the pre-launch residual error may be needed if the CT gap is large. Lastly, we report, for all spectral bands, the comparison between the computed and readjusted model radiance to OLI direct on-orbit calibrated radiance response. From this summary comparison, the most important output is the value computed for the Cirrus band.
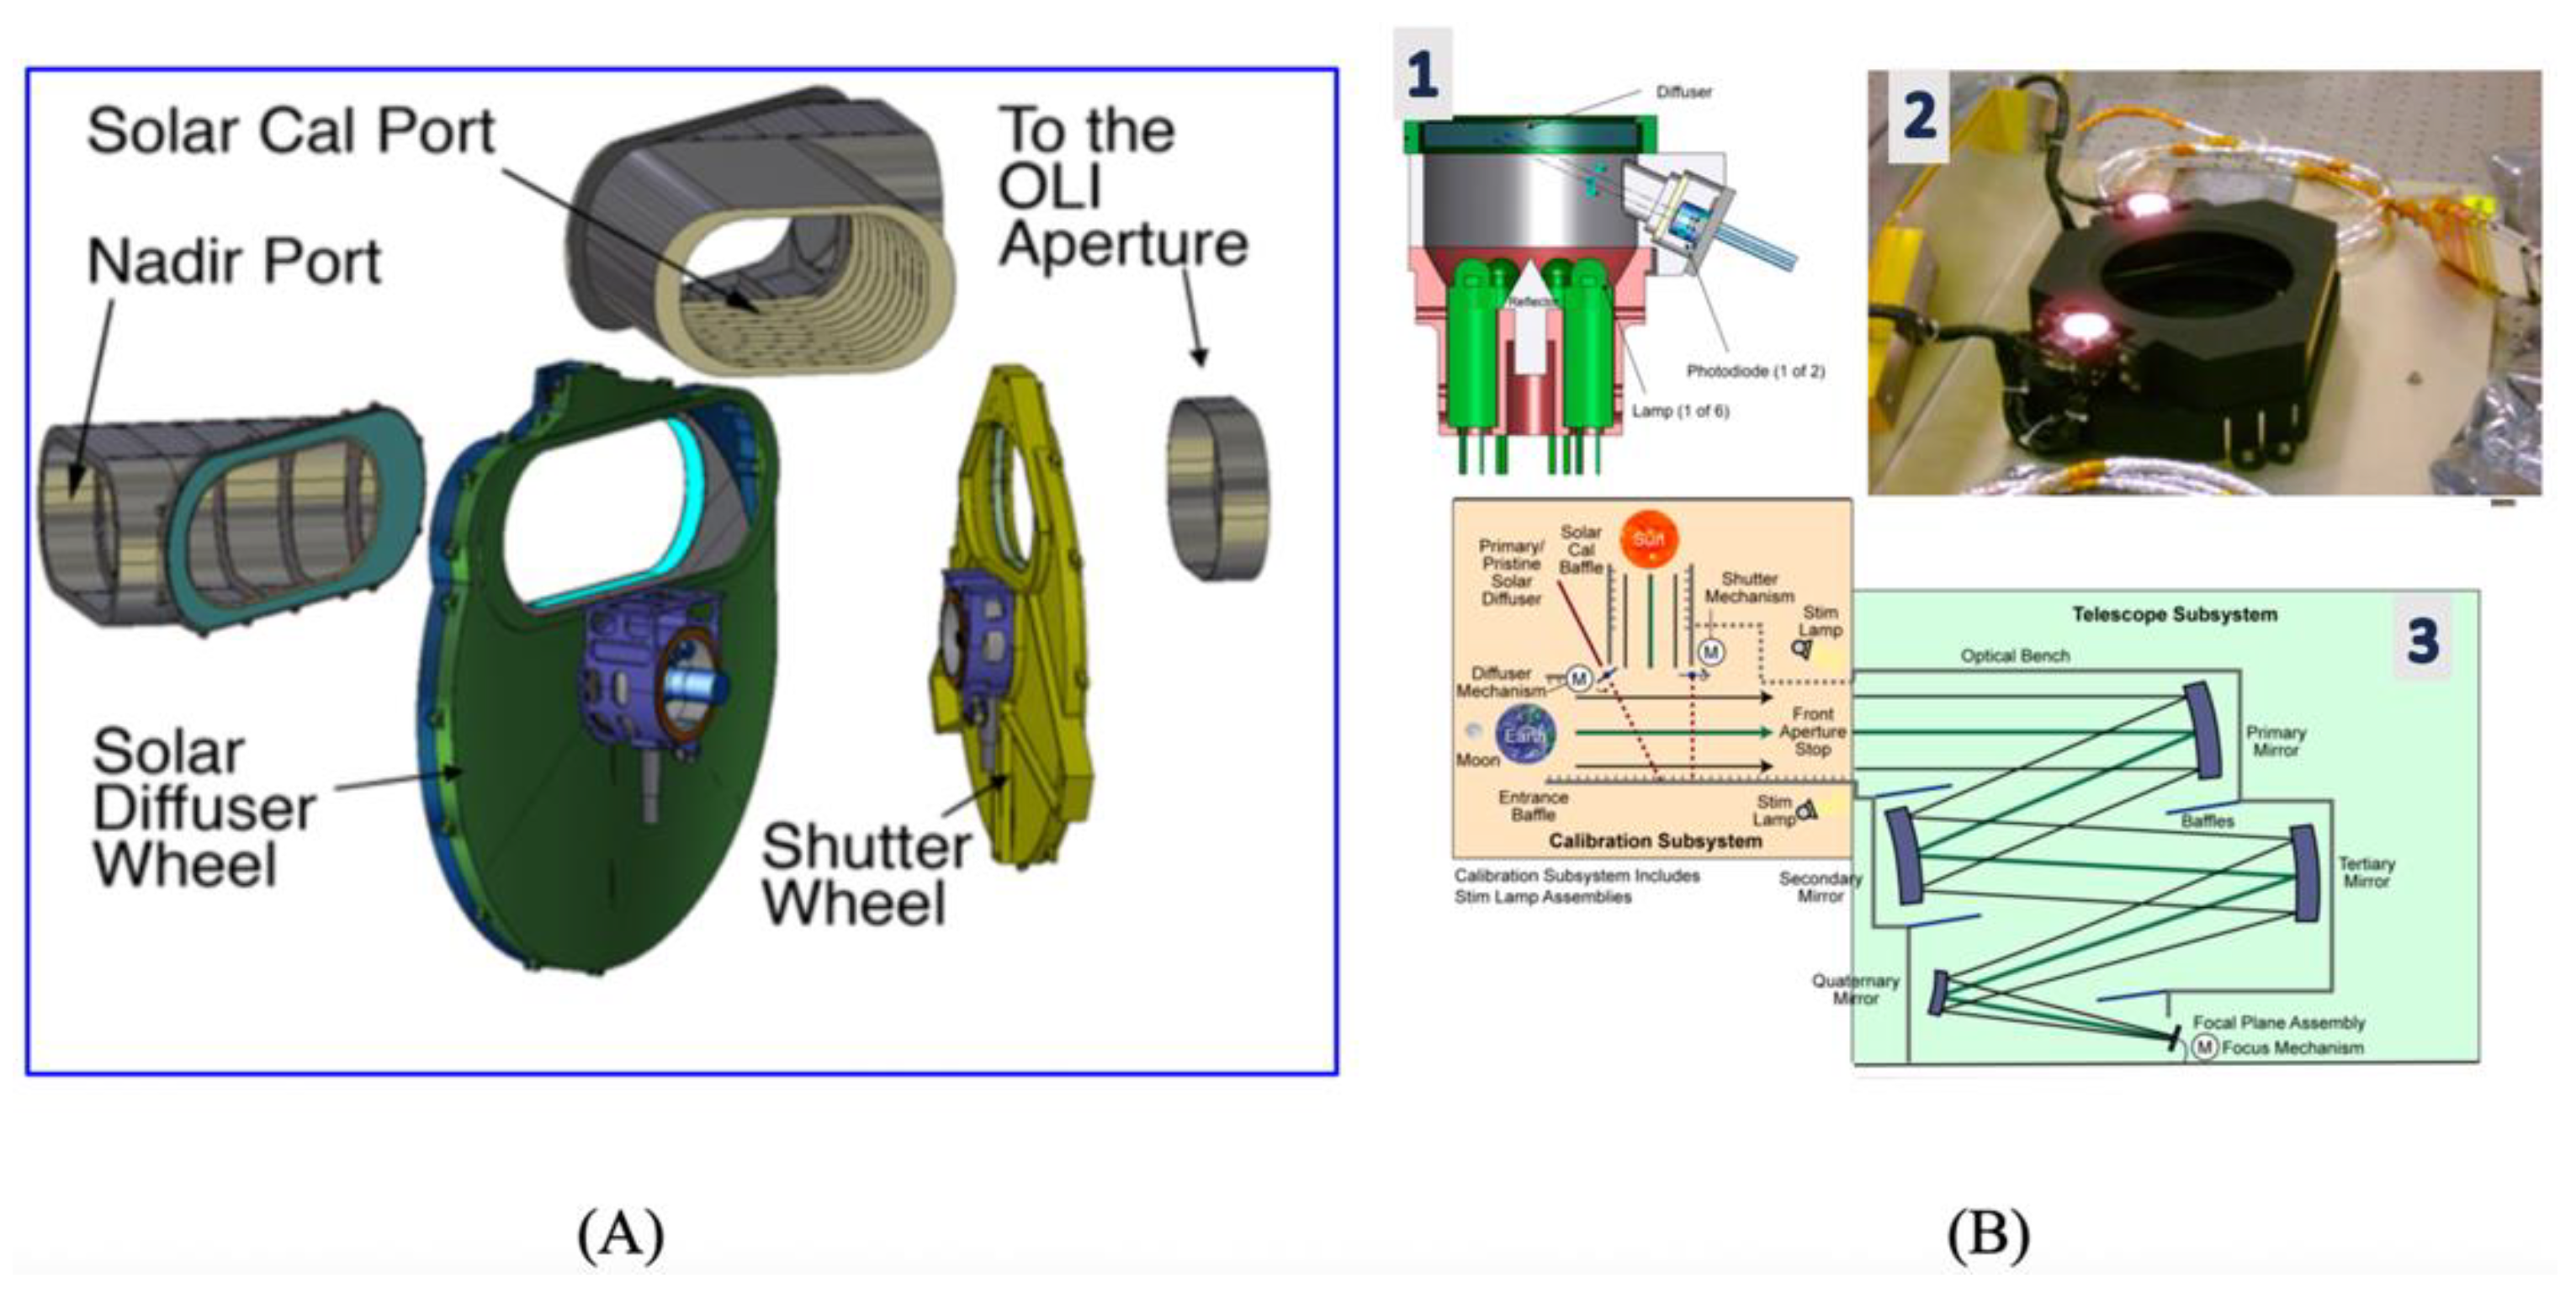
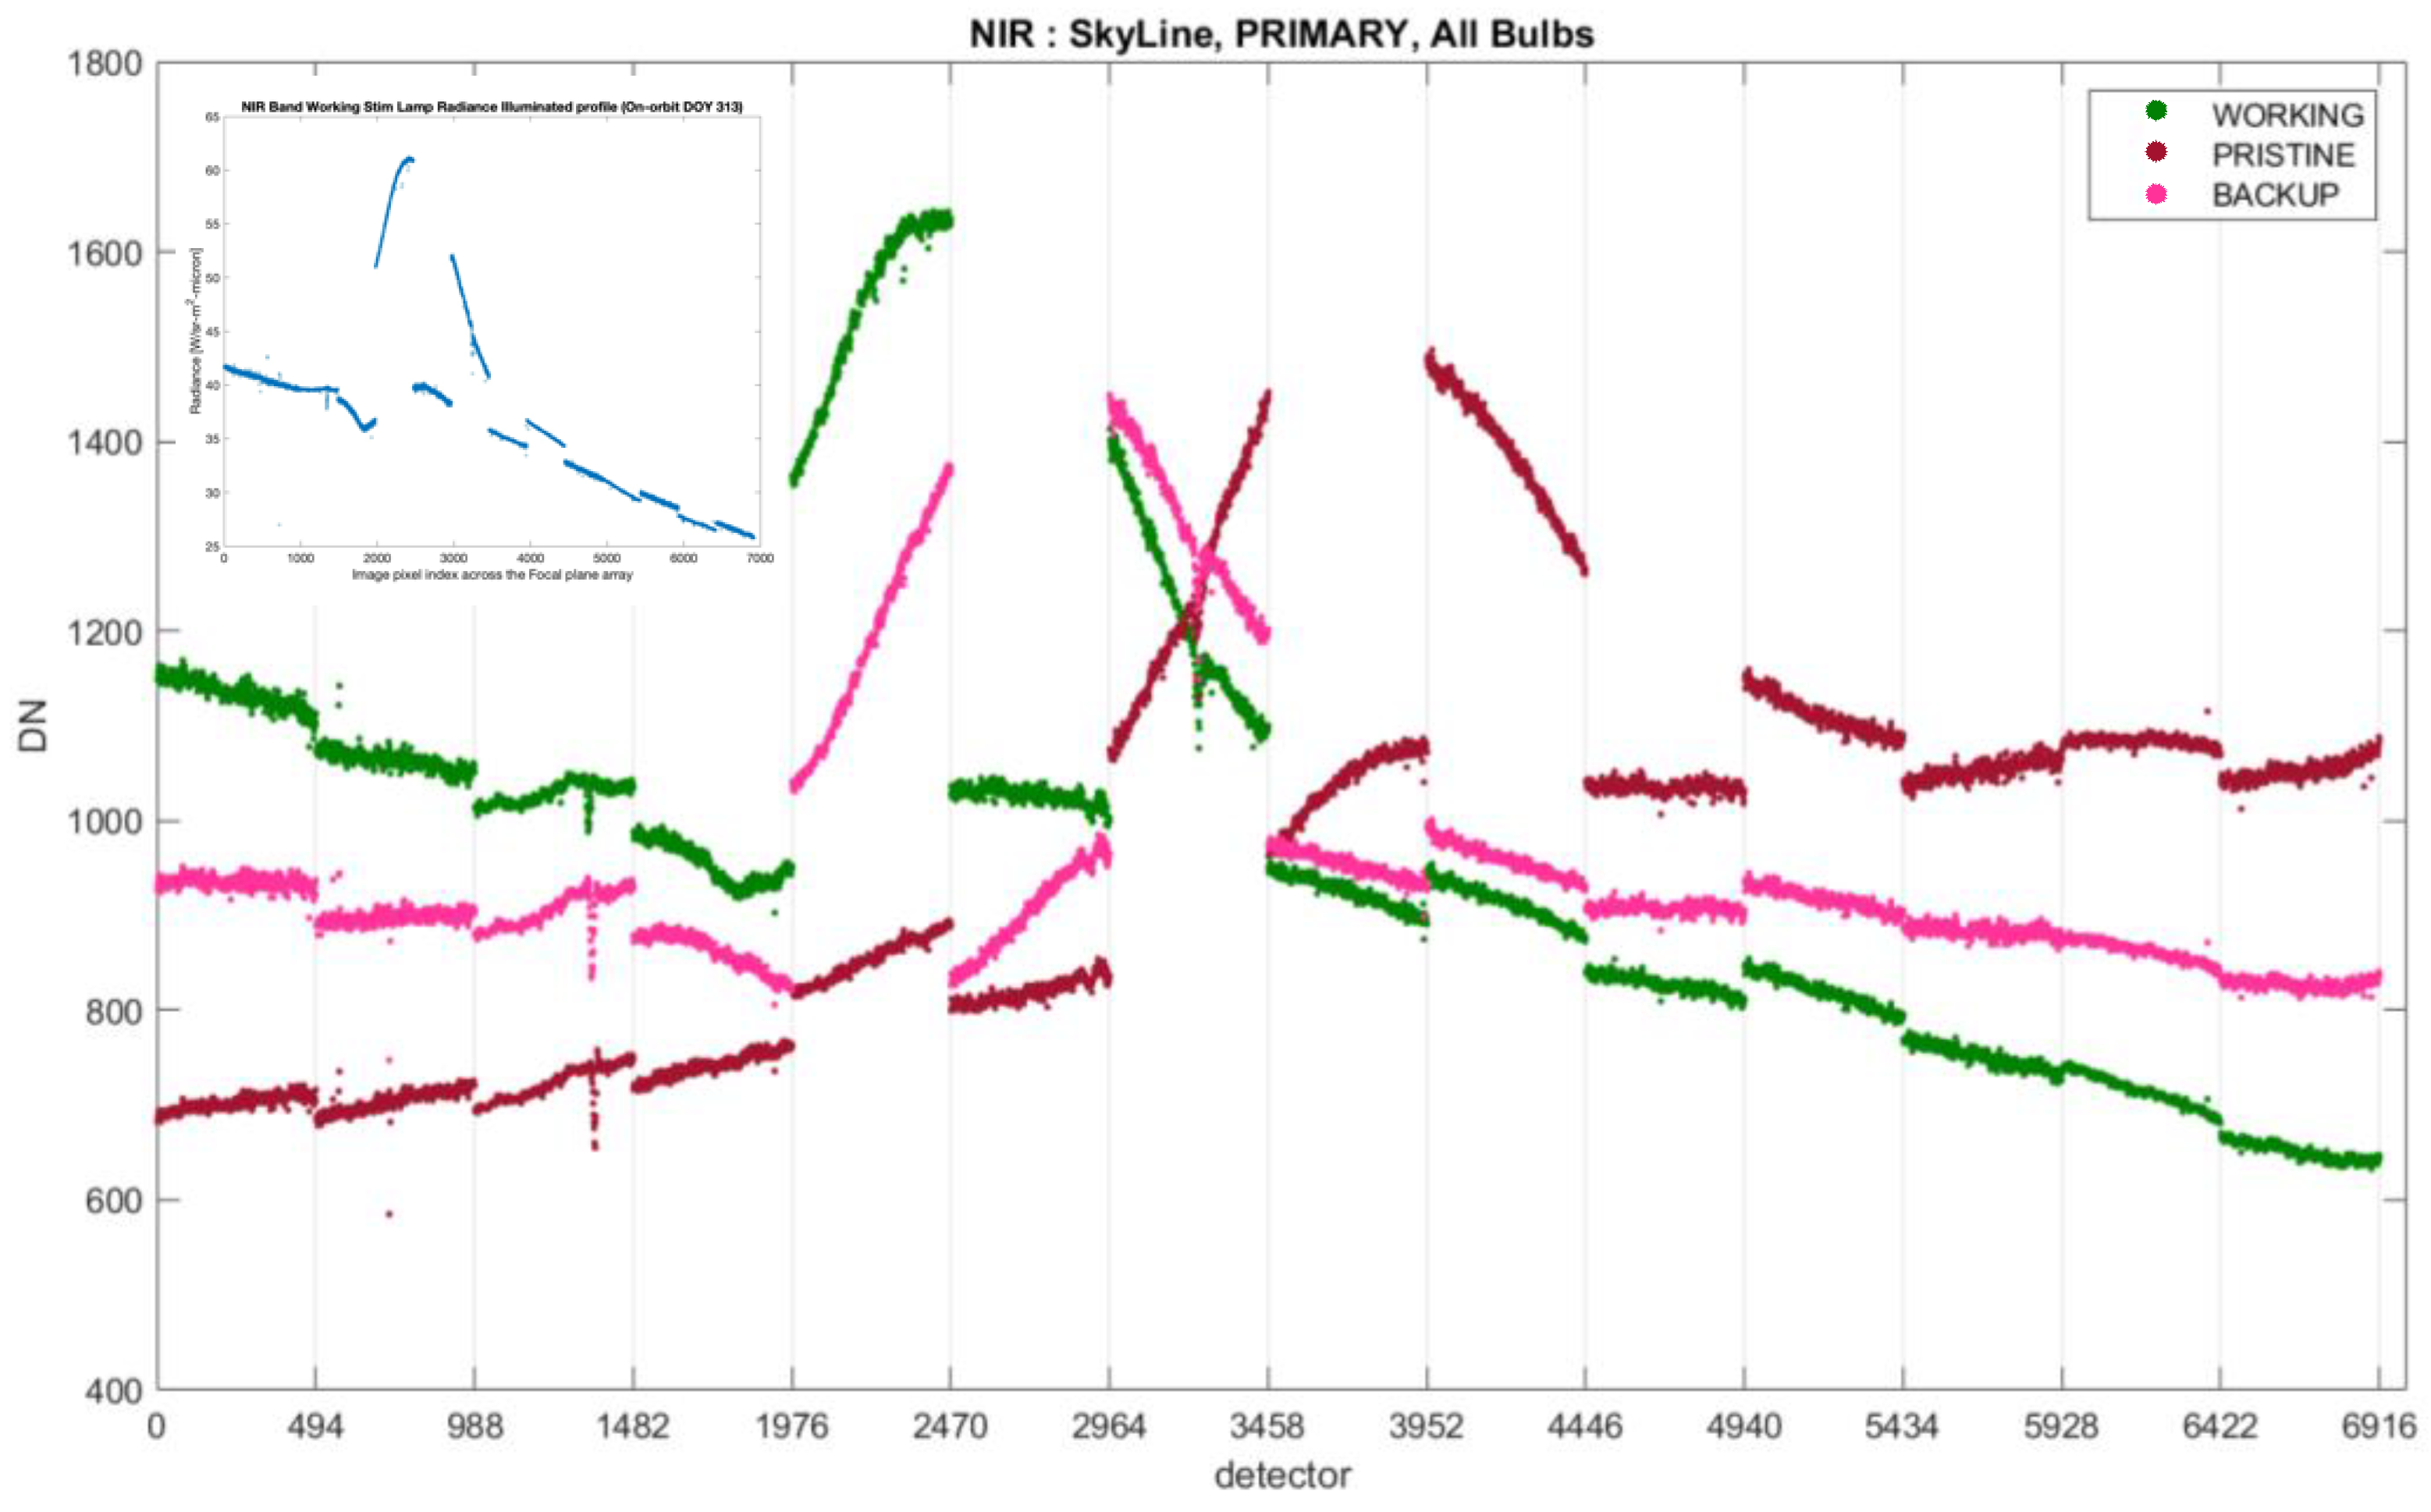
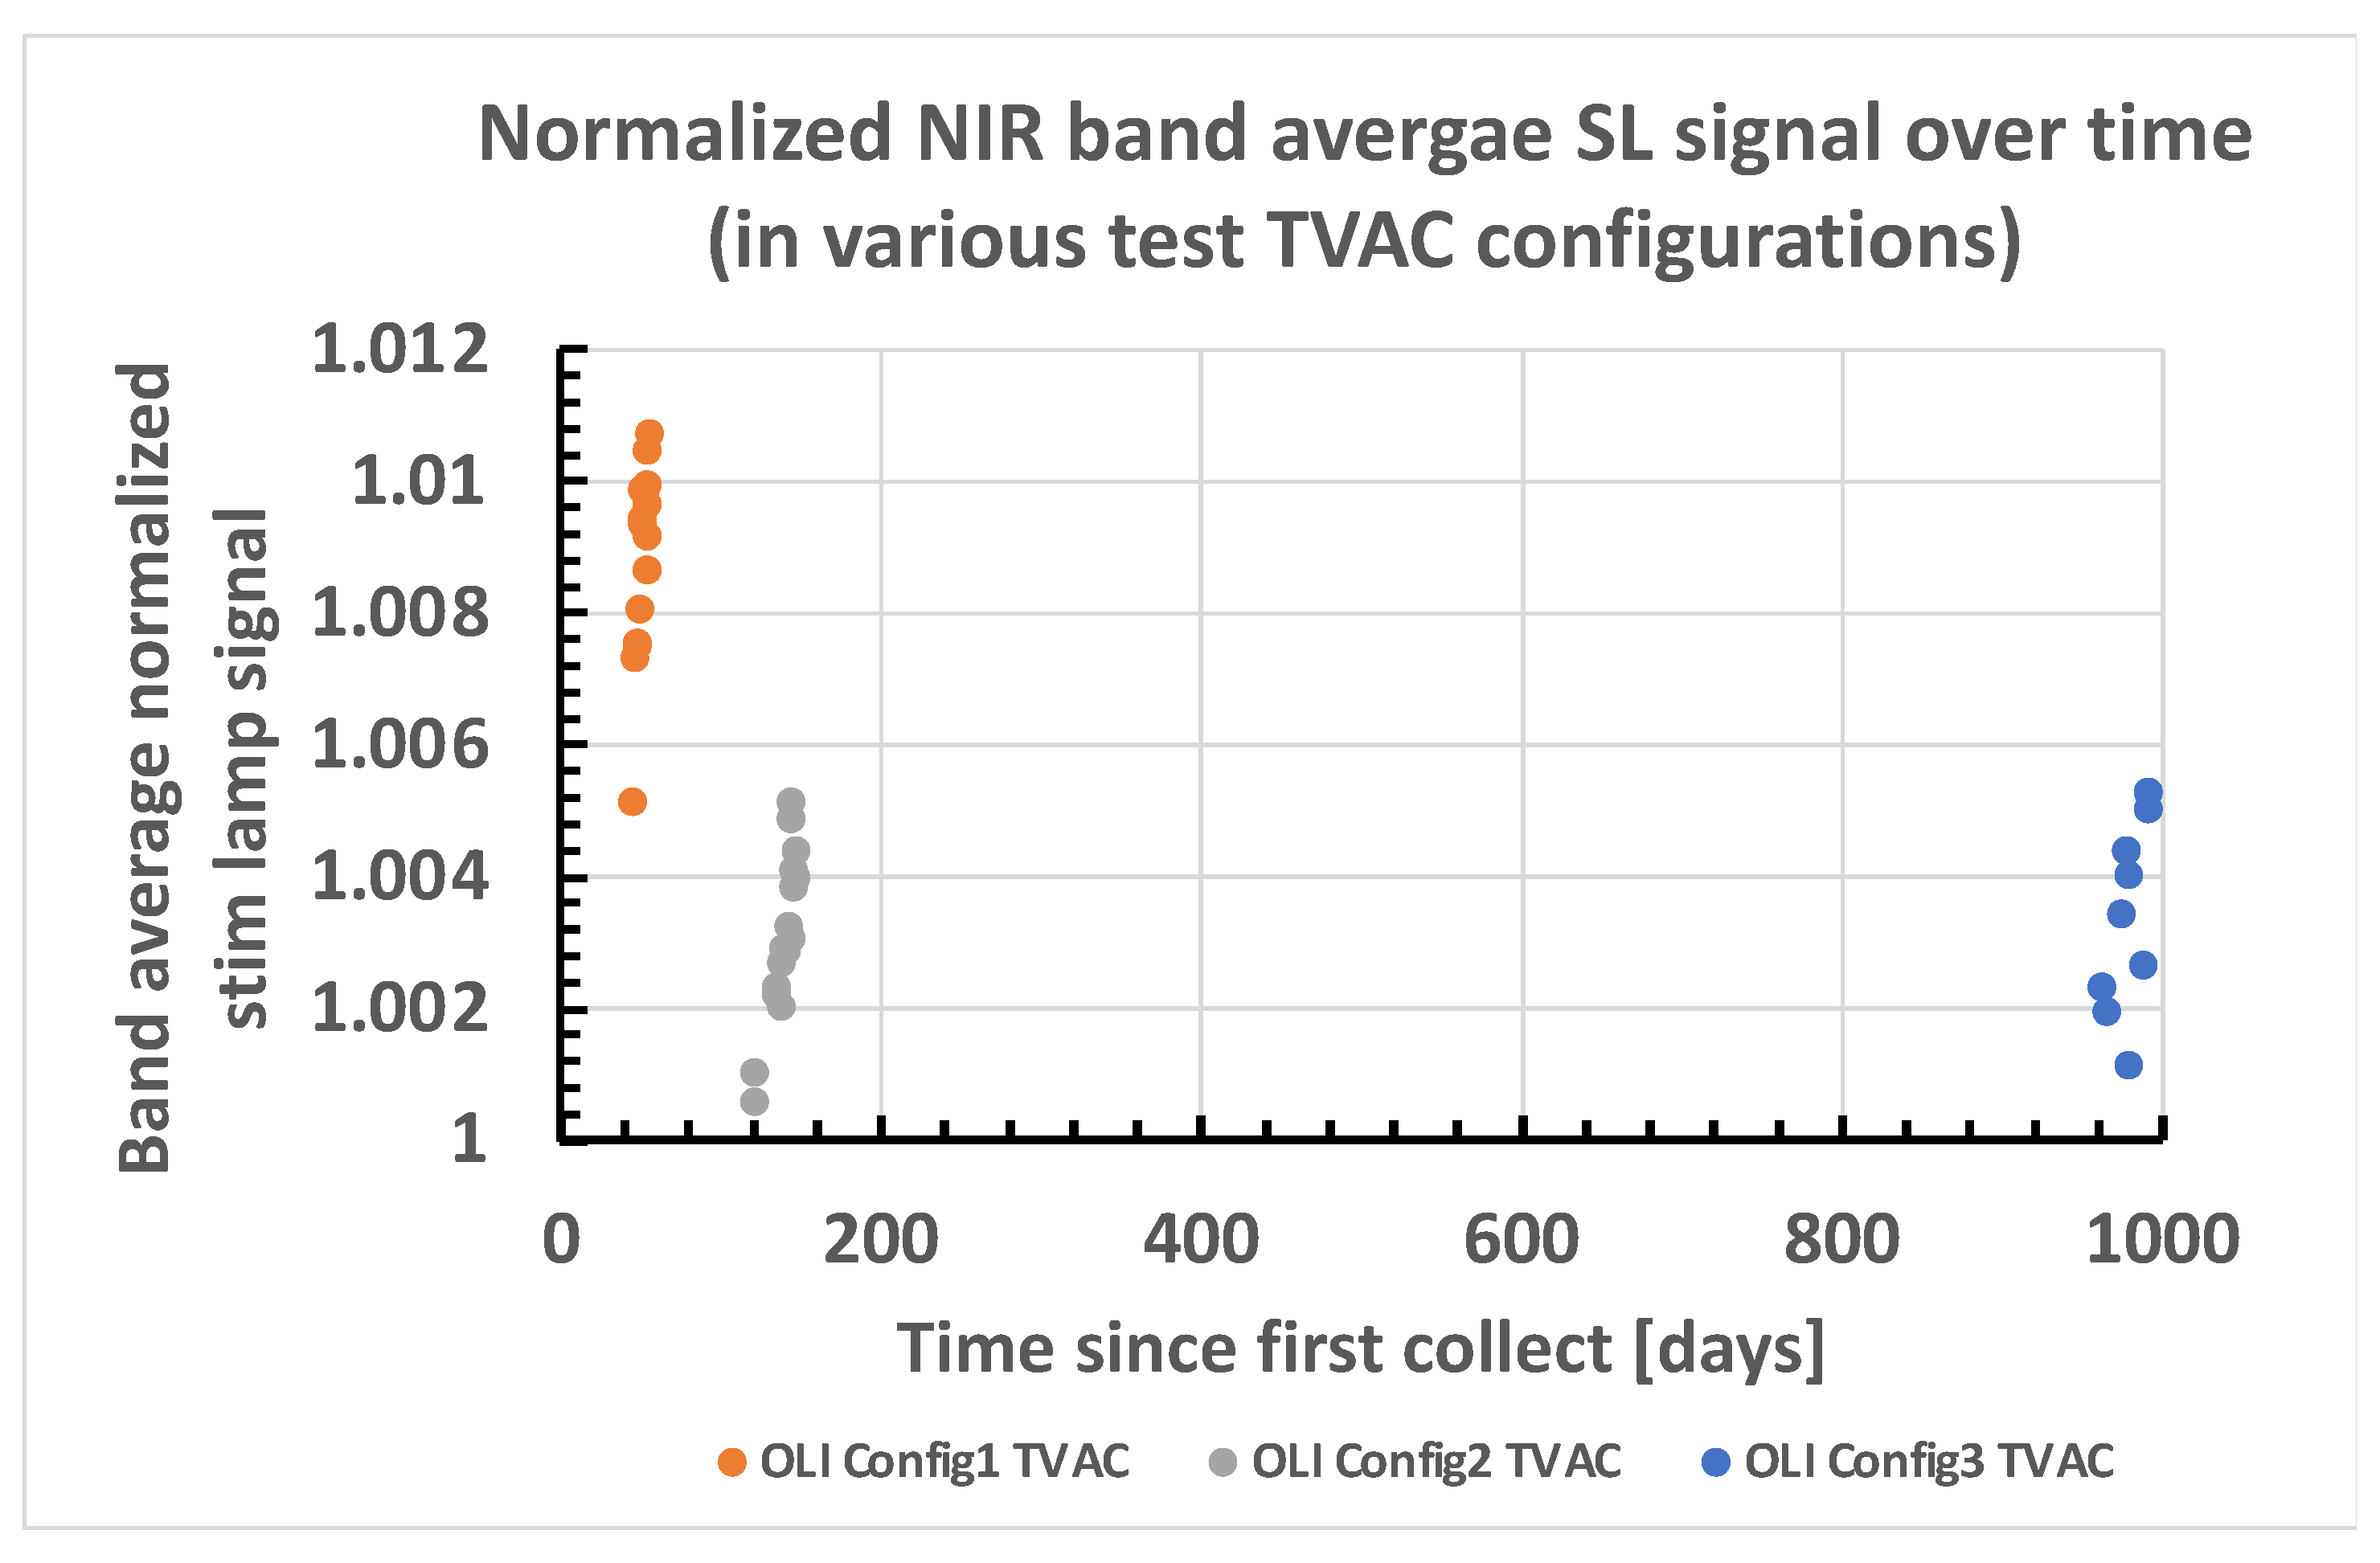
The Landsat 9 OLI stim lamp subsystem is identical in design to that of the Landsat 8 OLI stim lamp. Both systems use tungsten-halogen bulbs that illuminate the full focal plane while passing through the entire telescope subsystem and produce a non-uniform signal. The main difference between Landsat 8 and Landsat 9 is in the different lamp pairs that are being turned on together, producing different illumination patterns on the focal plane (
Figure 1). This alone is a strong demonstration for the dependance of the signal profiles, and the spectral throughput of the stim lamp system, on the physical position of the bulb relative to the stim lamp diffuser. Furthermore, we know that the filament sag position is another factor that impacts the SL power output. However, as seen throughout the pre-launch testing, each fixed configuration stim lamp demonstrated pre-launch stability and repeatability performance on the order of <0.5%, with a two-sigma worst case (
Figure 8). Therefore, the stim lamp can be used to monitor the band average response both on orbit and pre-launch, mimicking a secondary calibration reference that is stable and sensitive enough to validate the impact of the transfer to orbit. During pre-launch radiometric scale realization, the calibration of the stim lamp response was tied to our primary radiance-integrating sphere reference. On orbit, while using the same pre-launch calibration parameters, we evaluated the stim lamp response in comparison to the OLI working solar diffuser panel. That serves as the solar-illuminated on-board NIST traceable absolute reflectance calibration reference.
The spectral information about the working lamp is summarized in a three-part fit model that includes an effective color temperature, a scaling factor, and residual error for the modeled fit. The model is based on the blackbody plank-function radiance for a body at a temperature set by the CT model parameter. The model is scaled by the scaling factor and lastly the residual error between the measured and the modeled radiance for a fixed CT value is computed. The process for determining the optimal CT parameter for the lamp is an iterative numerical evaluation. Excluded from the computation was the Pan band, as it is a wide spectral response band that will not fit the task of finding the best fit spectral signature. The final CT set per detector was the mean value of two estimates for the optimal fit that aimed to both balance the error among all narrow spectral bands and minimize it. Lastly, to minimize the variability and uncertainty in the derived final CT fit values, for each spectral band, the data used for the fit involved the zone of detectors that were near the peak SL signal. The mean results from multiple collects for each test configuration were used to determine the final CT model fit values. Using this fixed CT value, we computed the new per detector scaling factor and the associated residual error parameters. Pre-launch we had three stim lamp configurations: two during instrument level testing TVAC and one during the spacecraft TVAC configuration. The color temperature fit model and the residual error in all eight bands (excluding the Pan band) were computed for all data collects and are listed in
Table 13 and
Table 14. For each configuration, three collects from different days were evaluated to understand the analysis and stim lamp stability impacts on the results.
In
Table 13, each set of TVAC testing configuration results includes a summary for the mean and variance values for the CT temperature as well as the residual error. The last bolded line in
Table 13 lists the summary of the overall baseline residual error from the pre-launch that was then used during the on-orbit processing analysis (i.e., the green outlined frame in
Figure 4b).
Table 14 lists the on-orbit SL model fit results after applying the pre-launch expected residual error. The last two bolded lines in this table show the final estimates of the impact of the TTO on the OLI as derived from the SL-based assessments. The data shown sampled both early collect days in 2021 that included DOY 304, 326, and 338, as well as collects taken once we were in the final orbit position that included, in 2021, DOY 345 and, in 2022, DOY 36 and 132. Like in the pre-launch summaries per configuration, the on-orbit results were collated to mean and variance values. After the SL to SD error matching adjustment to the SL model fit, the residual error was applied by adding 13% to the per band mean residual error, and the results are shown in a bolded line of
Table 14. These values represent the estimated net OLI TTO impact as evaluated with the SL collects. The associated estimates for the k = 2 uncertainty in the SL-based assessment were mainly impacted by the SL to SD adjustment that its root cause linked to the SL operational change. In pre-launch, the CT change among the various configurations was less than the 6K shift to on orbit causing the SL to change its effective CT by nearly 50K. Still, the within configuration-derived stability for the CT and the residual errors were just as good, if not even better, on orbit, when compared to the pre-launch values. The results, as illustrated in
Table 14 and
Figure 9, highlight that the Cirrus band residual error, which was derived from the stim lamp analysis, is in the same family as the other spectral bands. Hence, this leads to the re-confirmation that the Cirrus band radiance scale established during pre-launch is still valid within the expected band measurements uncertainties.
In
Table 14, the adjusted on-orbit stim lamp-based transfer-to-orbit residual fit error of the Cirrus band resulted in a value of 0.98%. When accounting for the pre-launch variability in the residual error and the stim lamp stability, this results in a worst-case estimate for this band that can reach the level of 1.8%, which is still within the radiometric uncertainty error bar reach, and that can cross the 0% change line. The stim lamp path to revalidating the radiance scale worked well due to the ability to relate the SL results to solar diffuser-based analysis.
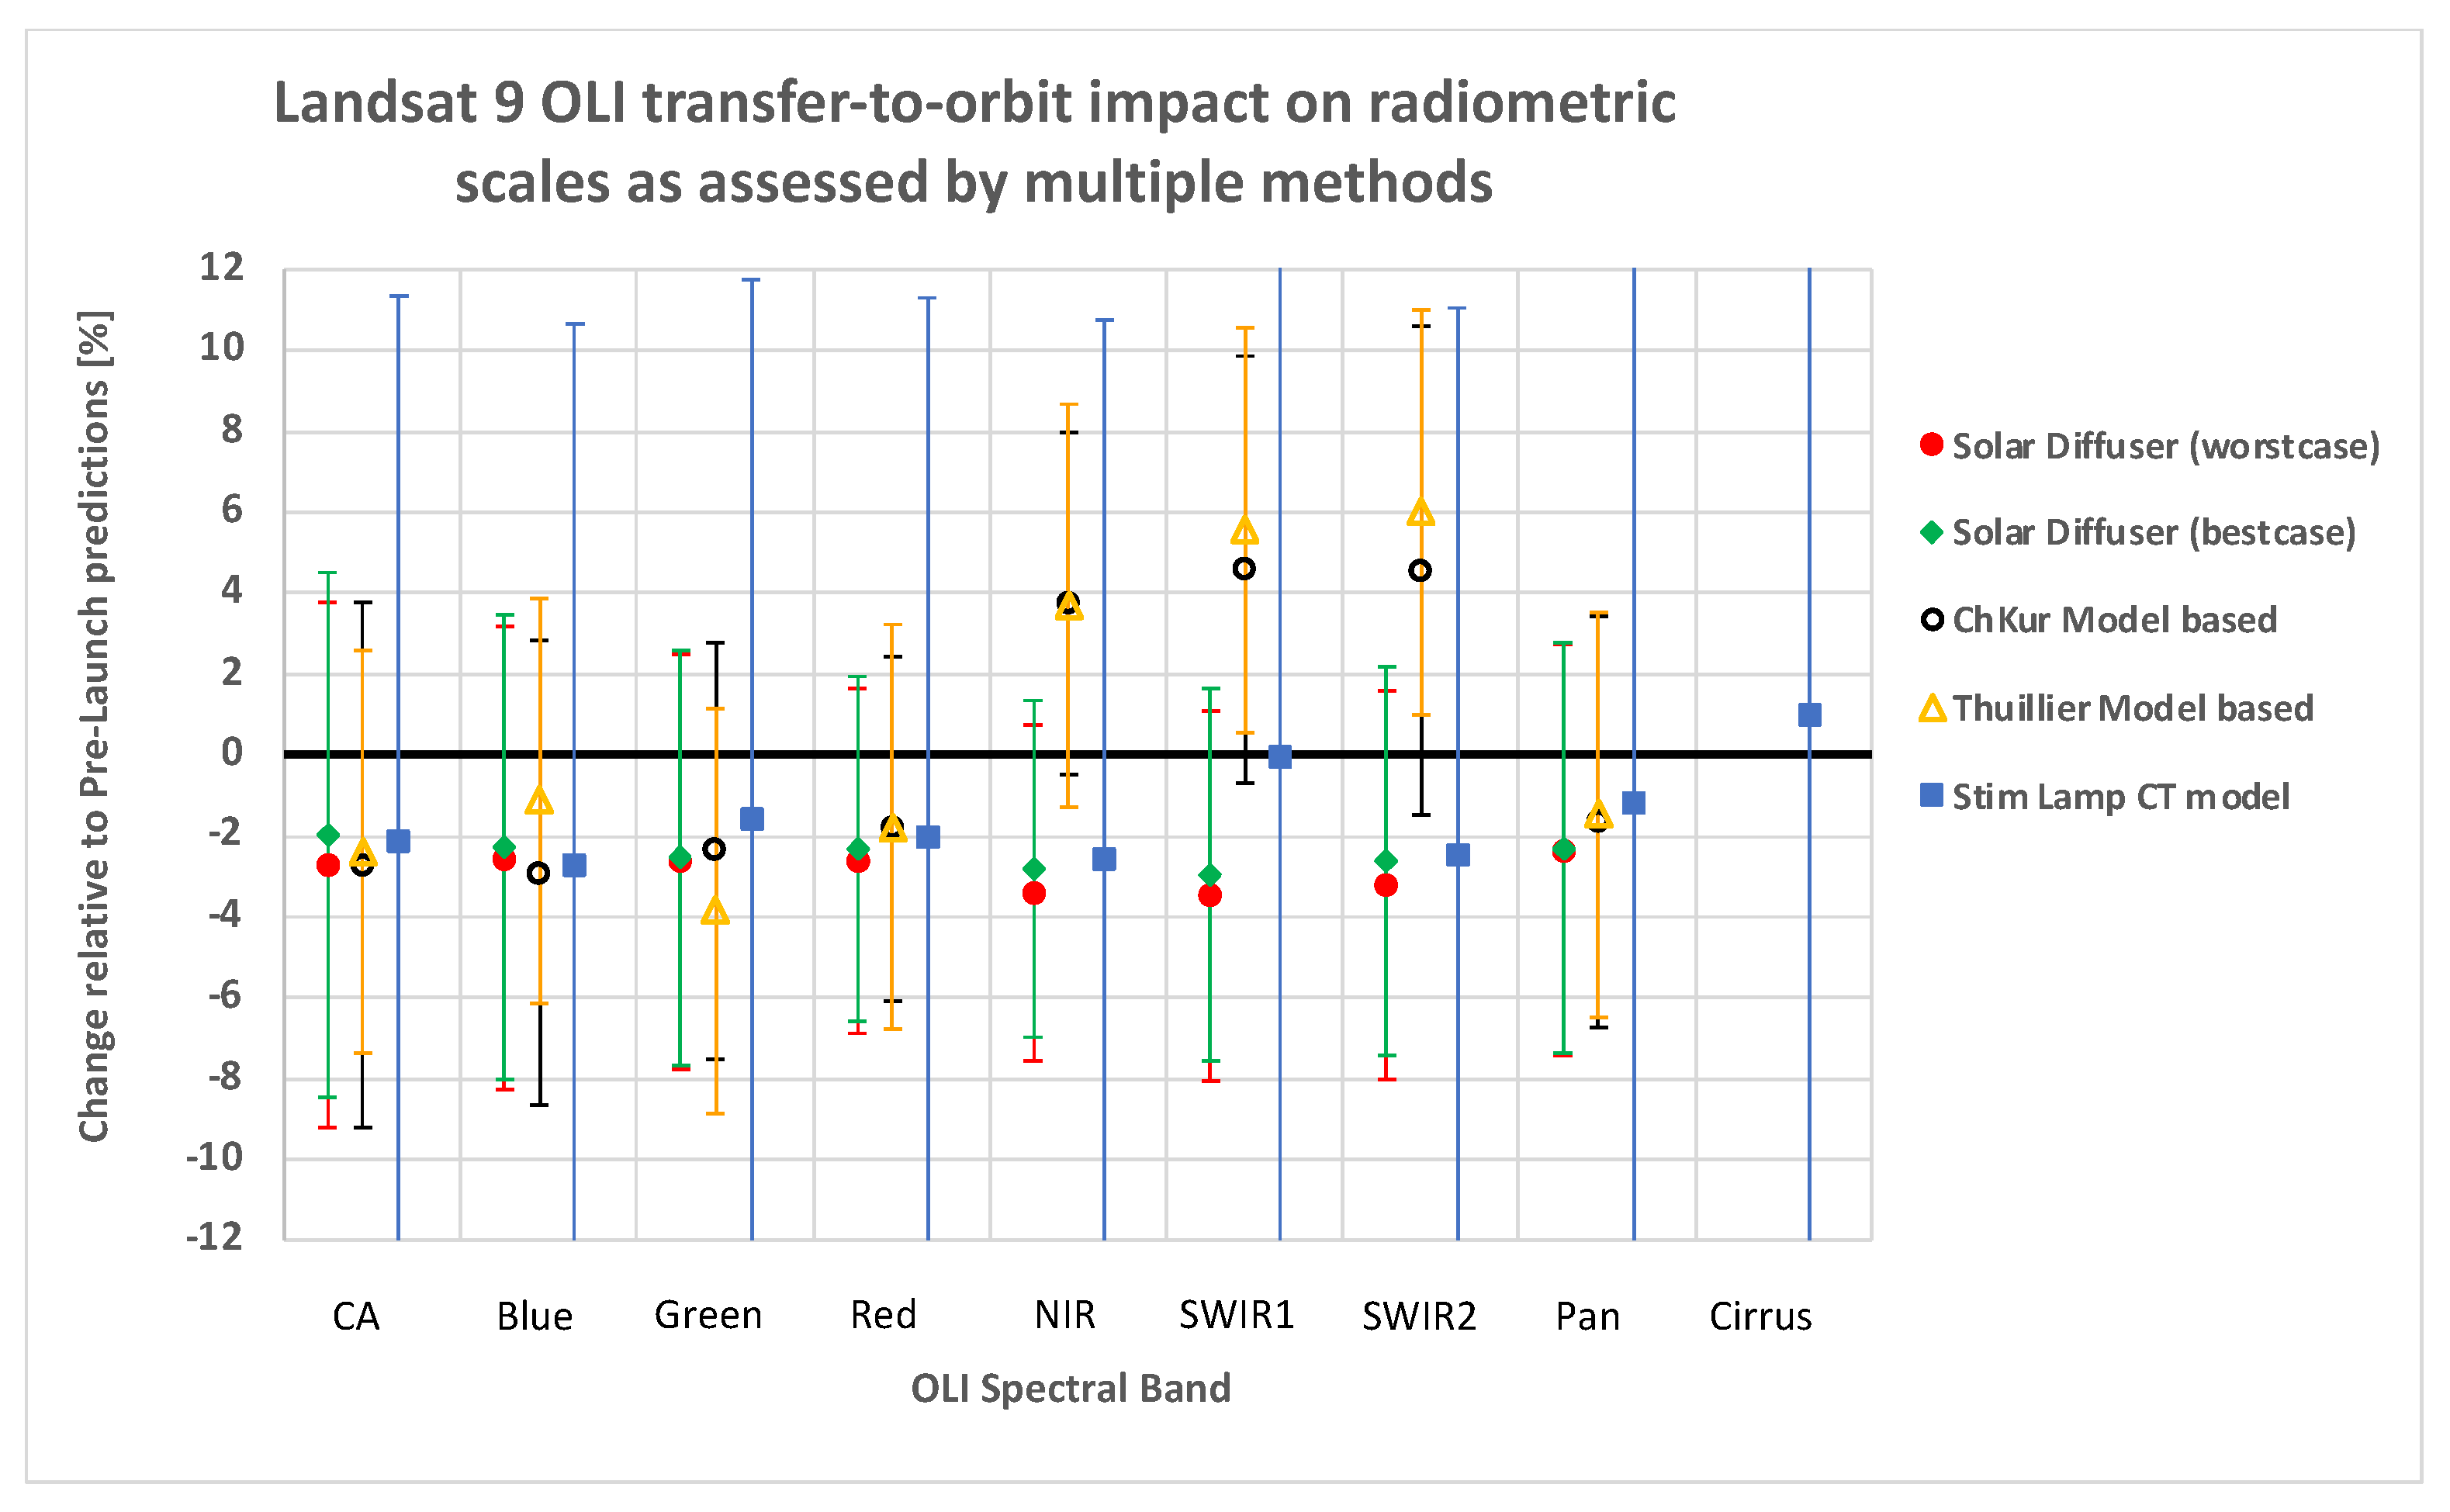
In
Figure 9, all of the results from methods used in this article for the revalidation of the radiometric scales for all bands are shown together with the associated k = 2 uncertainties in each, depicted by the error bars. The solar diffuser best and worst values in
Figure 9 are showing the estimates computed by two independent processing systems in reference to two collect dates. The error bars from all bands and methods, except for the SWIR1 and SWIR2 model-based results from the Thuillier model, cross the plot’s 0% change line. This affirms that the transfer to orbit via the launch event did not change the absolute radiometric scale at a level beyond the expected uncertainties, hence it can be considered the same as had been established pre-launch. In
Figure 9, the model-based NIR and SWIR band results show a positive error sign rather than the negative errors seen with the SL and SD-based analysis. The positive values in this plot mean that the NIR and SWIR band on-orbit responses were lower than the model predicts.
Table 11 Thuillier model-based results show that, for these spectral bands, the pre-launch heliostat results carry most of the cause for the higher transfer-to-orbit impact estimate. The direct on-orbit results in
Table 10 illustrate that only the SWIR2 band resulted in a measured error that was larger than the expected k = 2 error bars.


