Article

Optimal and Multi-View Strategic Hybrid Deep Learning for Old Landslide Detection in the Loess Plateau, Northwest China

1
College of Geological Engineering and Geomatics, Chang’an University, Xi’an 710054, China
2
State Key Laboratory of Loess, Xi’an 710054, China
3
Big Data Center for Geosciences and Satellites, Chang’an University, Xi’an 710054, China
4
Key Laboratory of Western China’s Mineral Resource and Geological Engineering, Ministry of Education, Xi’an 710054, China
5
Key Laboratory of Ecological Geology and Disaster Prevention, Ministry of Natural Resources, Xi’an 710054, China
6
China Aero Geophysical Survey and Remote Sensing Center for Natural Resources, Beijing 100083, China
*
Author to whom correspondence should be addressed.
Remote Sens. 2024, 16(8), 1362; https://doi.org/10.3390/rs16081362
Submission received: 26 January 2024 / Revised: 31 March 2024 / Accepted: 9 April 2024 / Published: 12 April 2024

Abstract

:
Old landslides in the Loess Plateau, Northwest China usually occurred over a relatively long period, and their sizes are usually smaller compared to old landslides in the alpine valley areas of Sichuan, Yunnan, and Southeast Tibet. These landslide areas may have been changed either partially or greatly, and they are usually covered with vegetation and similar to their surrounding environment. Therefore, it is a great challenge to detect them using high-resolution remote sensing images with only orthophoto view. This paper proposes the optimal-view and multi-view strategic hybrid deep learning (OMV-HDL) method for old loess landslide detection. First, the optimal-view dataset in the Yan’an area (YA-OP) was established to solve the problem of insufficient optical features in orthophoto images. Second, in order to make the process of interpretation more labor-saving, the optimal-view and multi-view (OMV) strategy was proposed. Third, hybrid deep learning with weighted boxes fusion (HDL-WBF) was proposed to detect old loess landslides effectively. The experimental results with the constructed optimal-view dataset and multi-view data show that the proposed method has excellent performance among the compared methods—the F1 score and AP (mean) of the proposed method were improved by about 30% compared with the single detection model using traditional orthophoto-view data—and that it has good detection performance on multi-view data with the recall of 81.4%.

1. Introduction

Landslides play an important role in the landscape evolution of the Loess Plateau in northwestern China. Every year, one third of the geohazards in China occur in the Loess Plateau [1], and most of them are landslides, which cause substantial damage to buildings, farmland, gas and oil pipelines, highways and railways, and even human life [2,3,4]. It has been determined that more than 14,544 landslides have occurred in the Chinese Loess Plateau [5]. Field investigation of geological hazards in the Loess Plateau suggests that earthquakes, rainfall, and human activities are common triggers for loess landslides [6]. In addition to new landslides, there is a risk that old landslides could slide again. An old landslide is the result of prolonged and intricate geological processes occurring on slopes [7], while most old landslides are stable, triggers such as human activities, earthquakes, and rainfall can lead to the reactivation of these old landslides. In the 1950s, the Wolongsi old landslide in the Xi’an-Baoji section of the Longhai Railway slid again, with a sliding area about 33 × 104 m 2 and a volume of about 2.0 × 10 7   m 3 , pushing the Longhai Railway southward by more than 100 m and interrupting the railway for several days. From the 1950s to the 1970s, more than 170 large and medium-sized landslides occurred along the 98 km from Baoji Gorge to Changxing, nearly half of which were old landslides [8]. Recently, Hu et al. [9] investigated the Beiguo landslide in Heyang County, Shaanxi Province, China, and found that since 2011, there have been several signs of local reactivity. In 2017, the landslide was completely triggered by rainfall. Zhang et al. [10] presented a typical case (the Zhongzhai landslide) triggered by a succession of torrential rainfall occurrences in October 2021 in Niangniangba town, Tianshui, Gansu, China, which buried two houses and damaged another two houses. In order to reduce the losses caused by the reactivation of old landslides, it is necessary to detect old landslides in Loess Plateau, accurately and efficiently, used for early warning of reactivation landslides.
At present, researchers pay more attention to the detection of new landslides. Compared with old loess landslides, new loess landslides generally have obvious signs, such as bare ground and discontinuity of vegetation. As for old landslides, due to the relatively long time since its occurrence, the shape of landslides have typically changed greatly and may be covered by dense vegetation. Therefore, determining how to detect old loess landslides effectively is a challenging topic.
Remote sensing data have been applied to agriculture [11,12,13], forestry [14,15], meteorology [16,17], and other fields successfully, including images from satellites [18,19] and unmanned aerial vehicles (UAVs) [20,21]. Remote sensing has the advantages of wide observation range, fast speed, and short cycle of obtaining data with high spatial resolution, so detecting landslides with remote sensing technology has become a trend [22].
Traditional landslide detection methods are mainly based on visual interpretation [23]. The landslide is identified through certain interpretation signs such as discontinuities in vegetation texture, landslide back wall, and shear cracks, etc. Most of the visual interpretations are conducted directly using aerial or satellite images [24]. This relies heavily on the knowledge of experts. Therefore, manual interpretation is labor intensive and time consuming when there is a large amount of data to be interpreted, and this method is inefficient for the detection of old loess landslides across a large area [25].
Next, machine learning (ML) methods began to be proposed for automatic detection. Colors, textures, and edges in the image were used as landslide-detection features for machine learning methods.Bui et al. [26] used support vector machine (SVM) to detect landslides in tropical environments with a combination of airborne synthetic aperture radar (AIRSAR) data and susceptibility mapping based on a geographic information system. Furthermore, Dou et al. [27] proposed an ensemble method consisting of four models (SVM-Stacking, SVM, SVM-Bagging and SVM-Boosting) to obtain landslide susceptibility data. Similarly, Tavakkoli et al. [28] proposed a method that incorporates object-based image analysis (OBIA) with three machine learning methods for landslide detection. These machine learning methods have greatly improved the efficiency of landslide detection. However, it has a disadvantage that manual features were designed but not learned, which leads to a lack of generalization [29].
Recently, an increasing number of deep learning methods have been used in the field of remote sensing [30,31,32] and to detect landslides [33,34,35,36,37]. Ye et al. [38] used deep belief networks (DBN) to predict landslide susceptibility. Ji et al. [39] used convolution neural network (CNN)-based methods to detect landslides with high accuracy. Li et al. [40] used Faster-RCNN (Region-CNN) to detect landslides within large-scale satellite images. Wang et al. [41] proposed a novel deep learning method for landslide identification, combining YOLO and U-Net models. However, CNN-based models have some limitations in modeling global information due to their use of convolutional kernels. In 2017, the transformer method was proposed with a self-attention mechanism, which can learn global features well, and was first used for natural language processing (NLP) [42]. Then, Dosovitskiy et al. [43] proposed vision transformer (ViT), which was the first successful application of transformer in image classification tasks. After that, an increasing number of object detection models based on transformer were proposed, and these were used for landslide detection with remote sensing images. Tang et al. [44] proposed the transformer-based semantic segmentation model (SegFormer) to identify coseismic landslides, and this has better performance compared with CNNs in landslides detection. Lv et al. [45] proposed a pyramid vision transformer (PVT) model for landslides detection, which directly models the global information of different scales in remote sensing images. These transformer-based models can detect landslides well with the advantage that they can learn global features better. However, there are still great challenges for old loess landslide detection using high-resolution remote sensing images, mainly including:
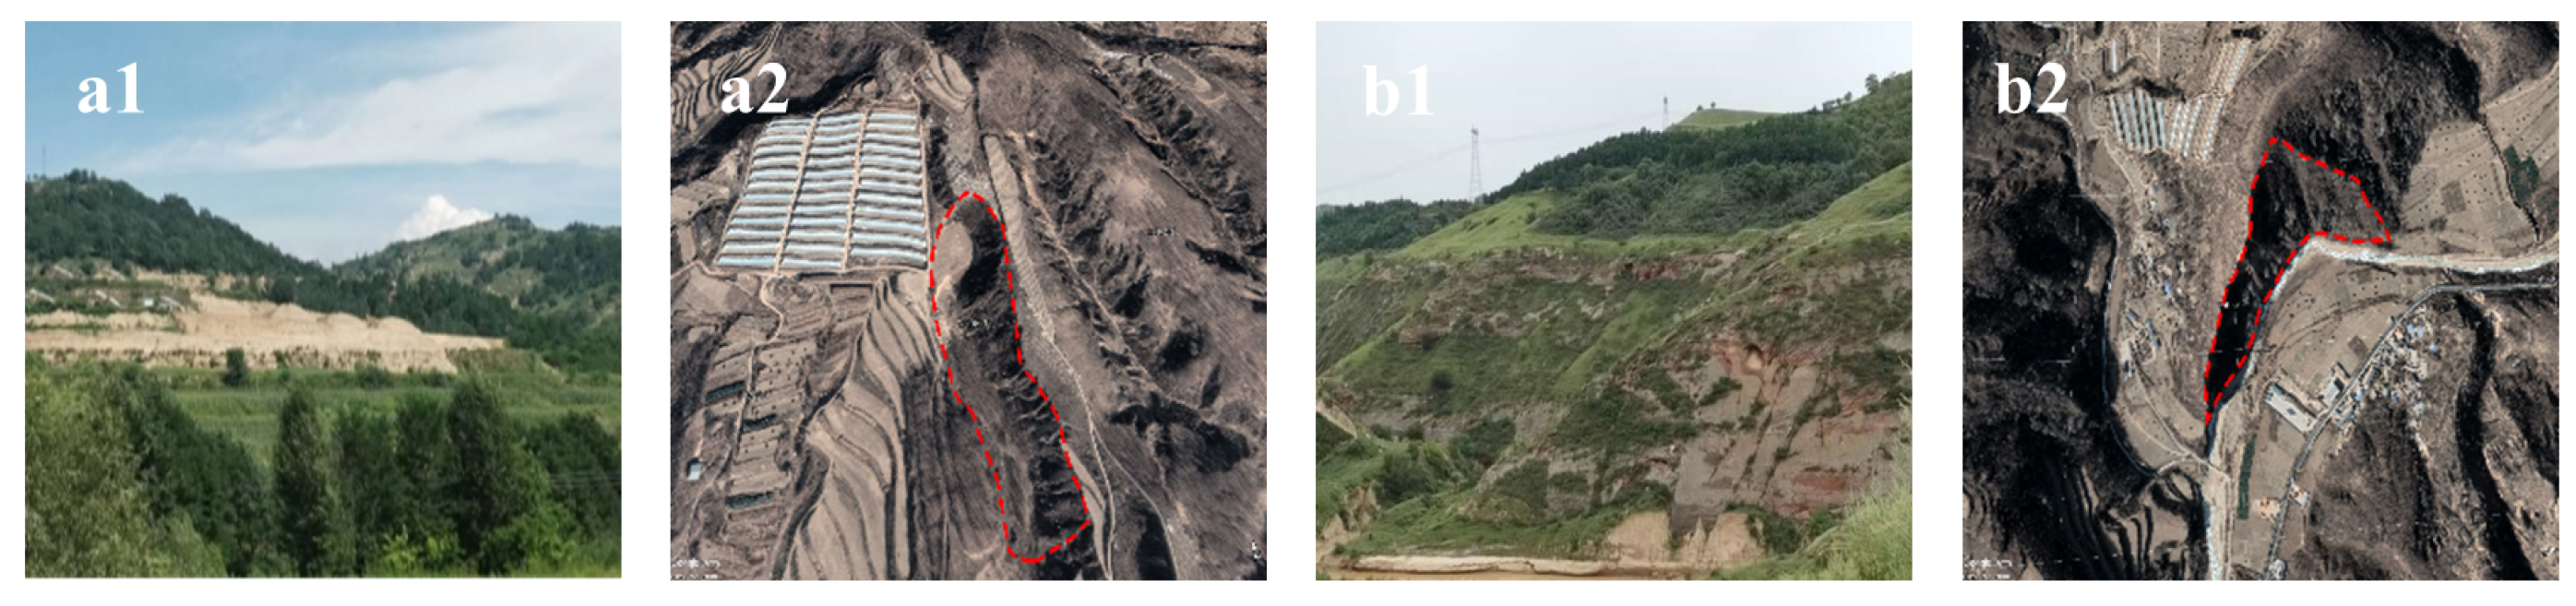
  • Old loess landslides occurred over a relatively long period, and due to the loose and porous character of loess, the shapes of landslides have been changed for a long time, and may be covered with vegetation, which make it difficult to recognize them in high-resolution remote sensing images.
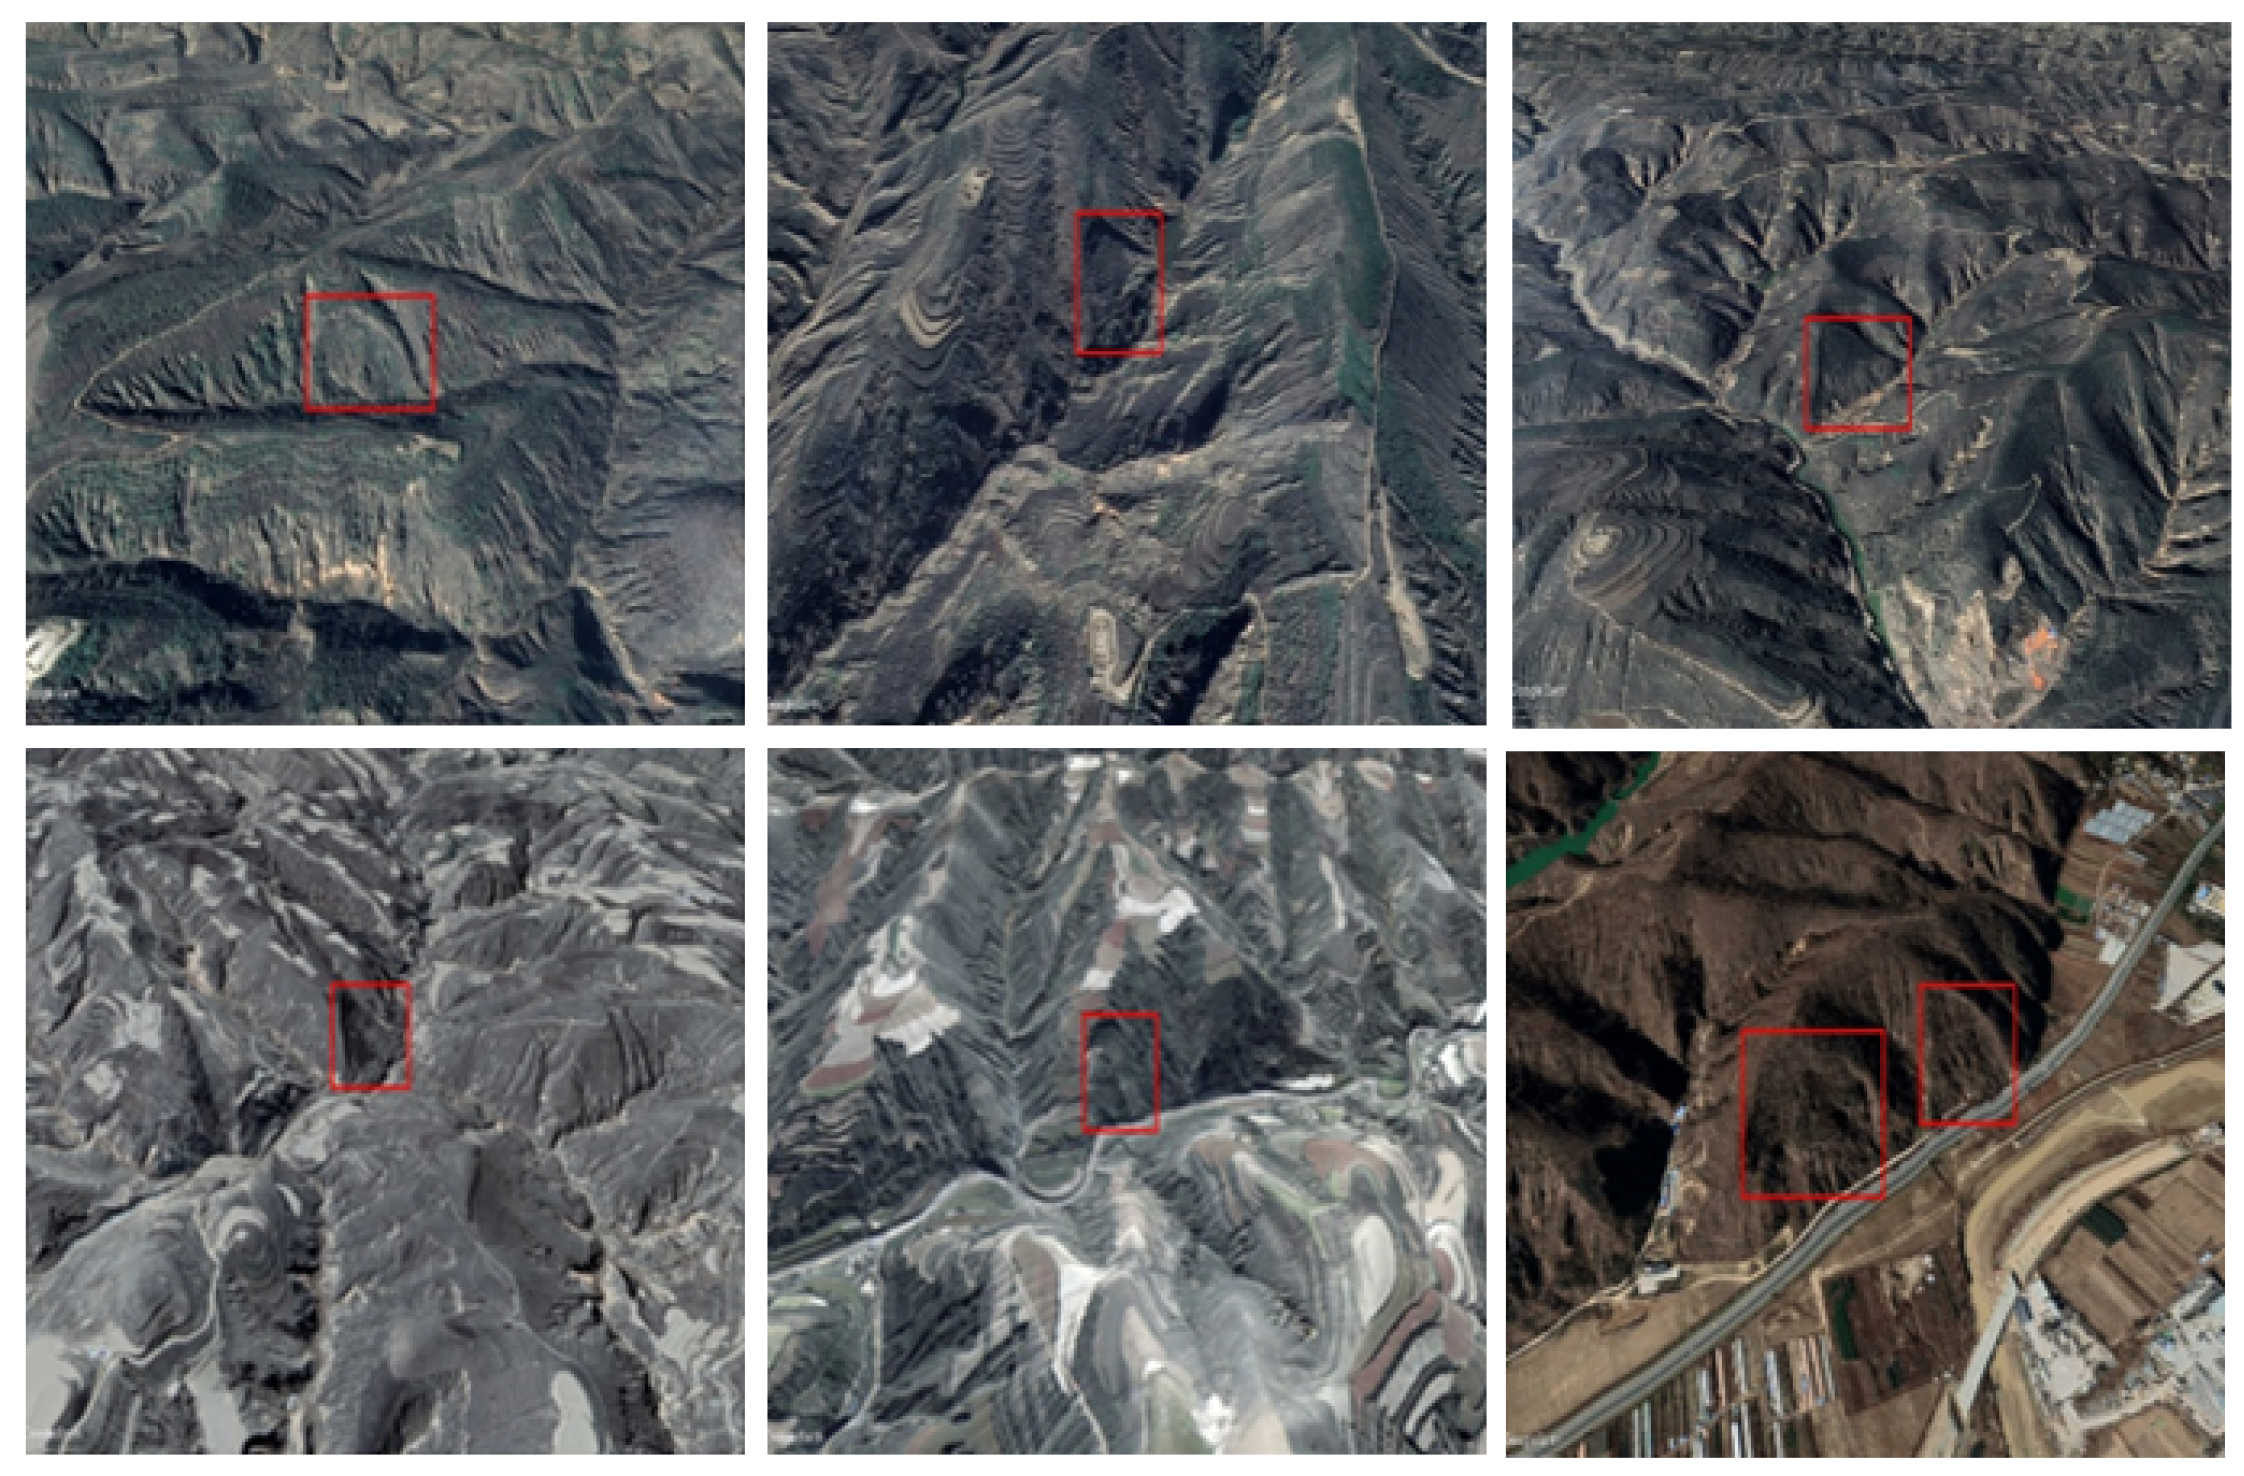
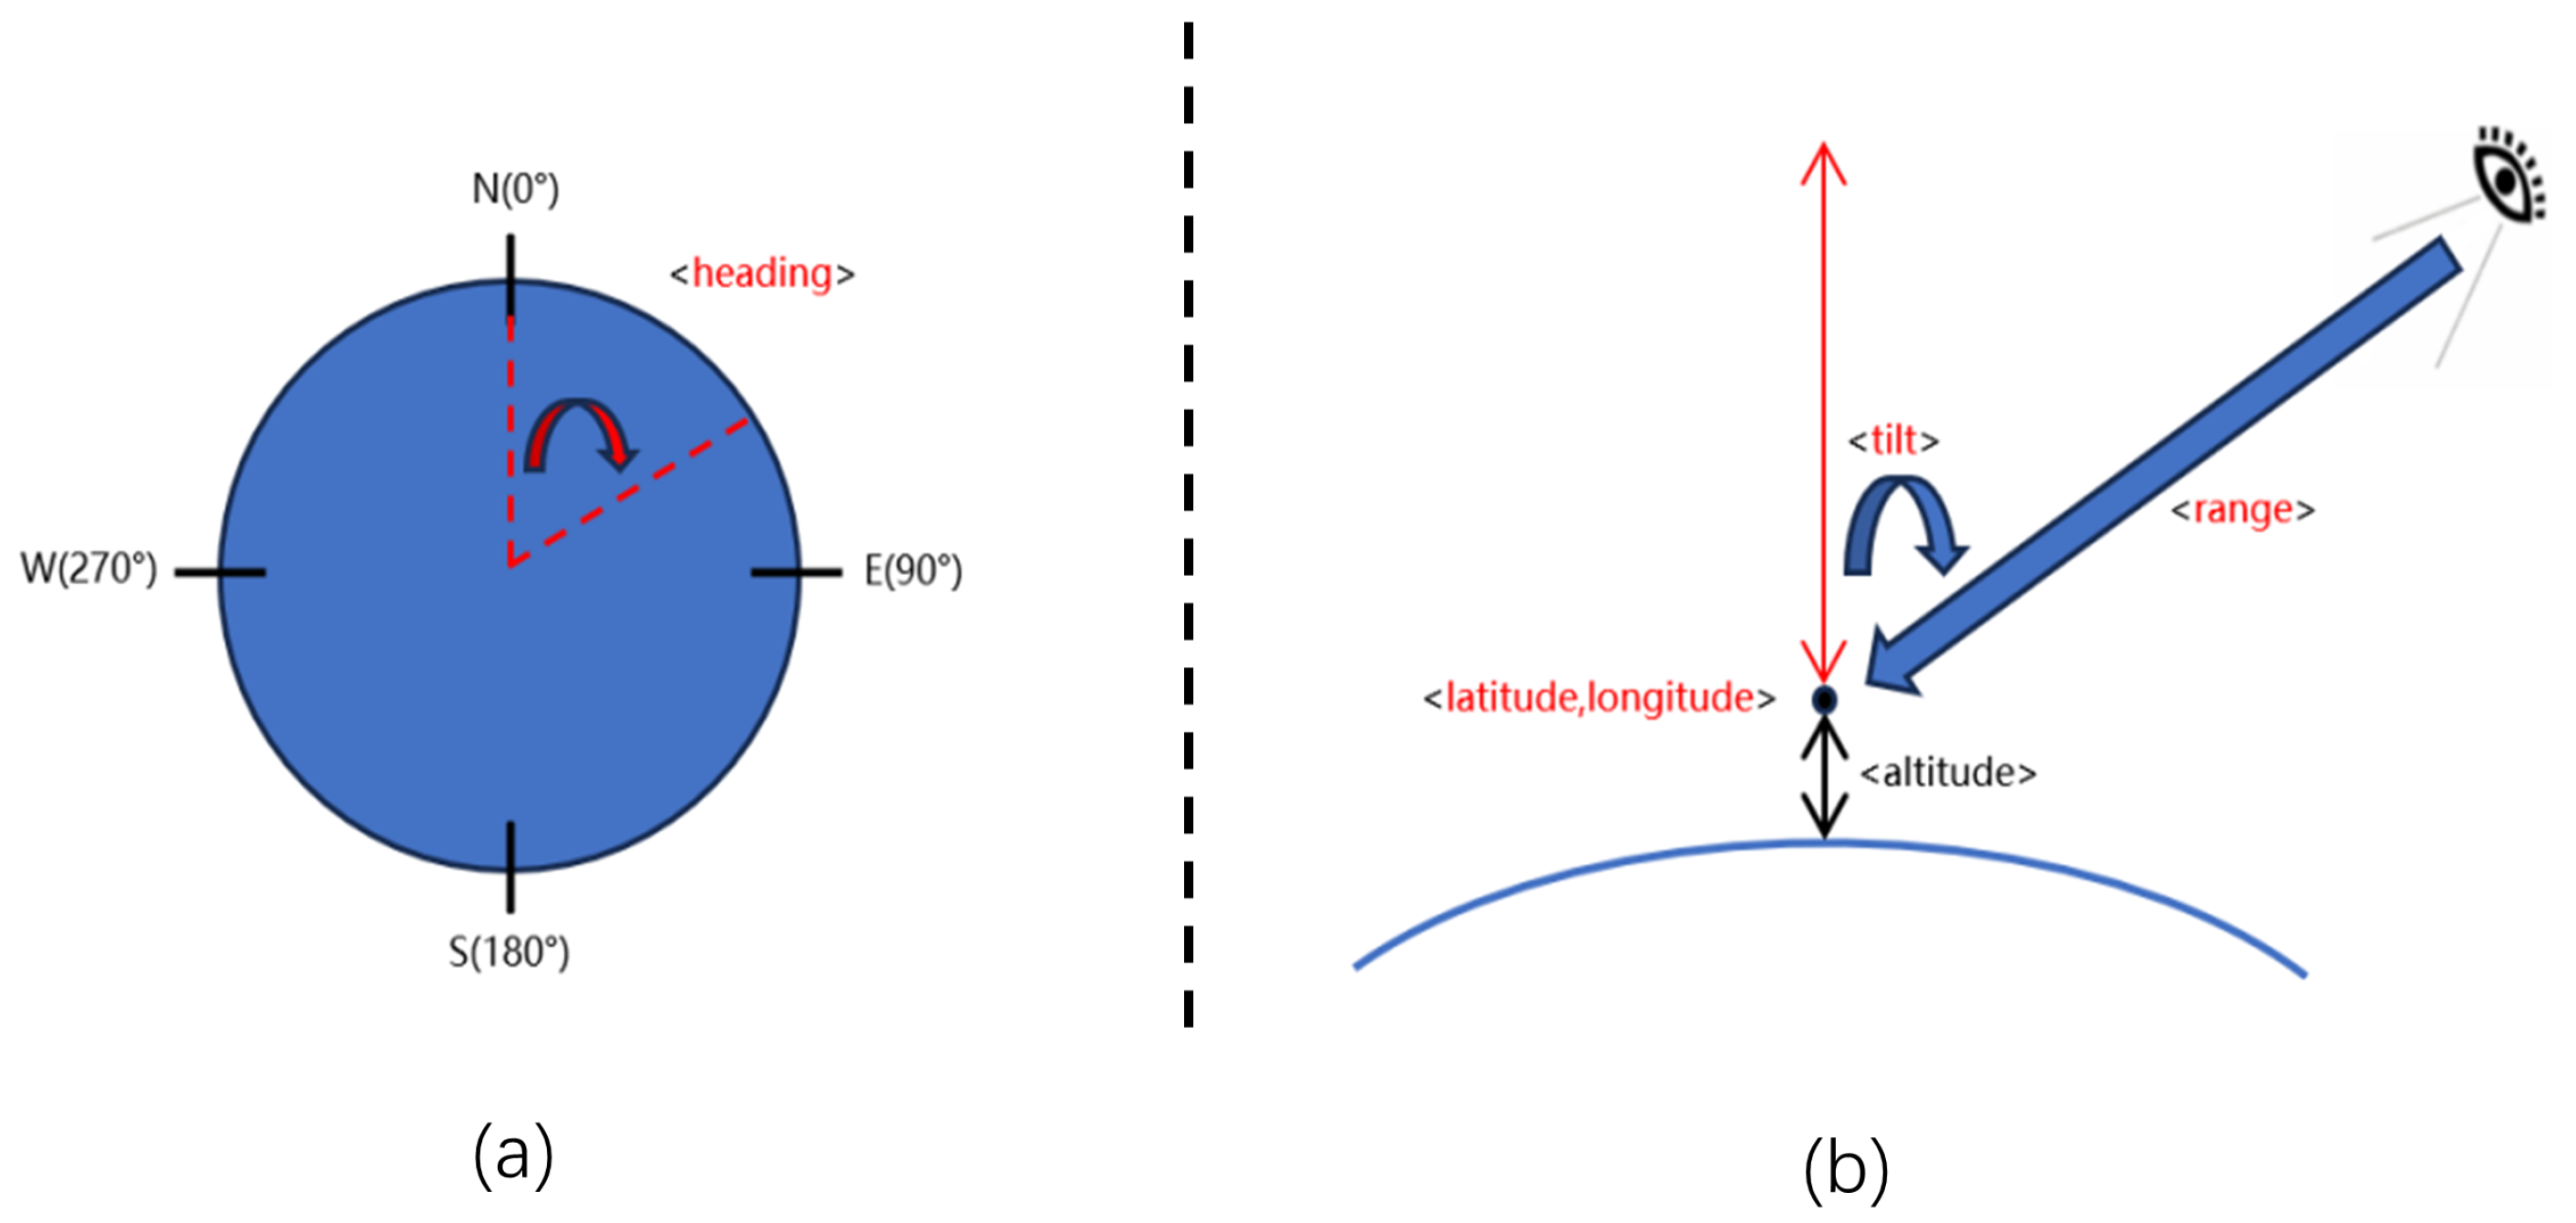
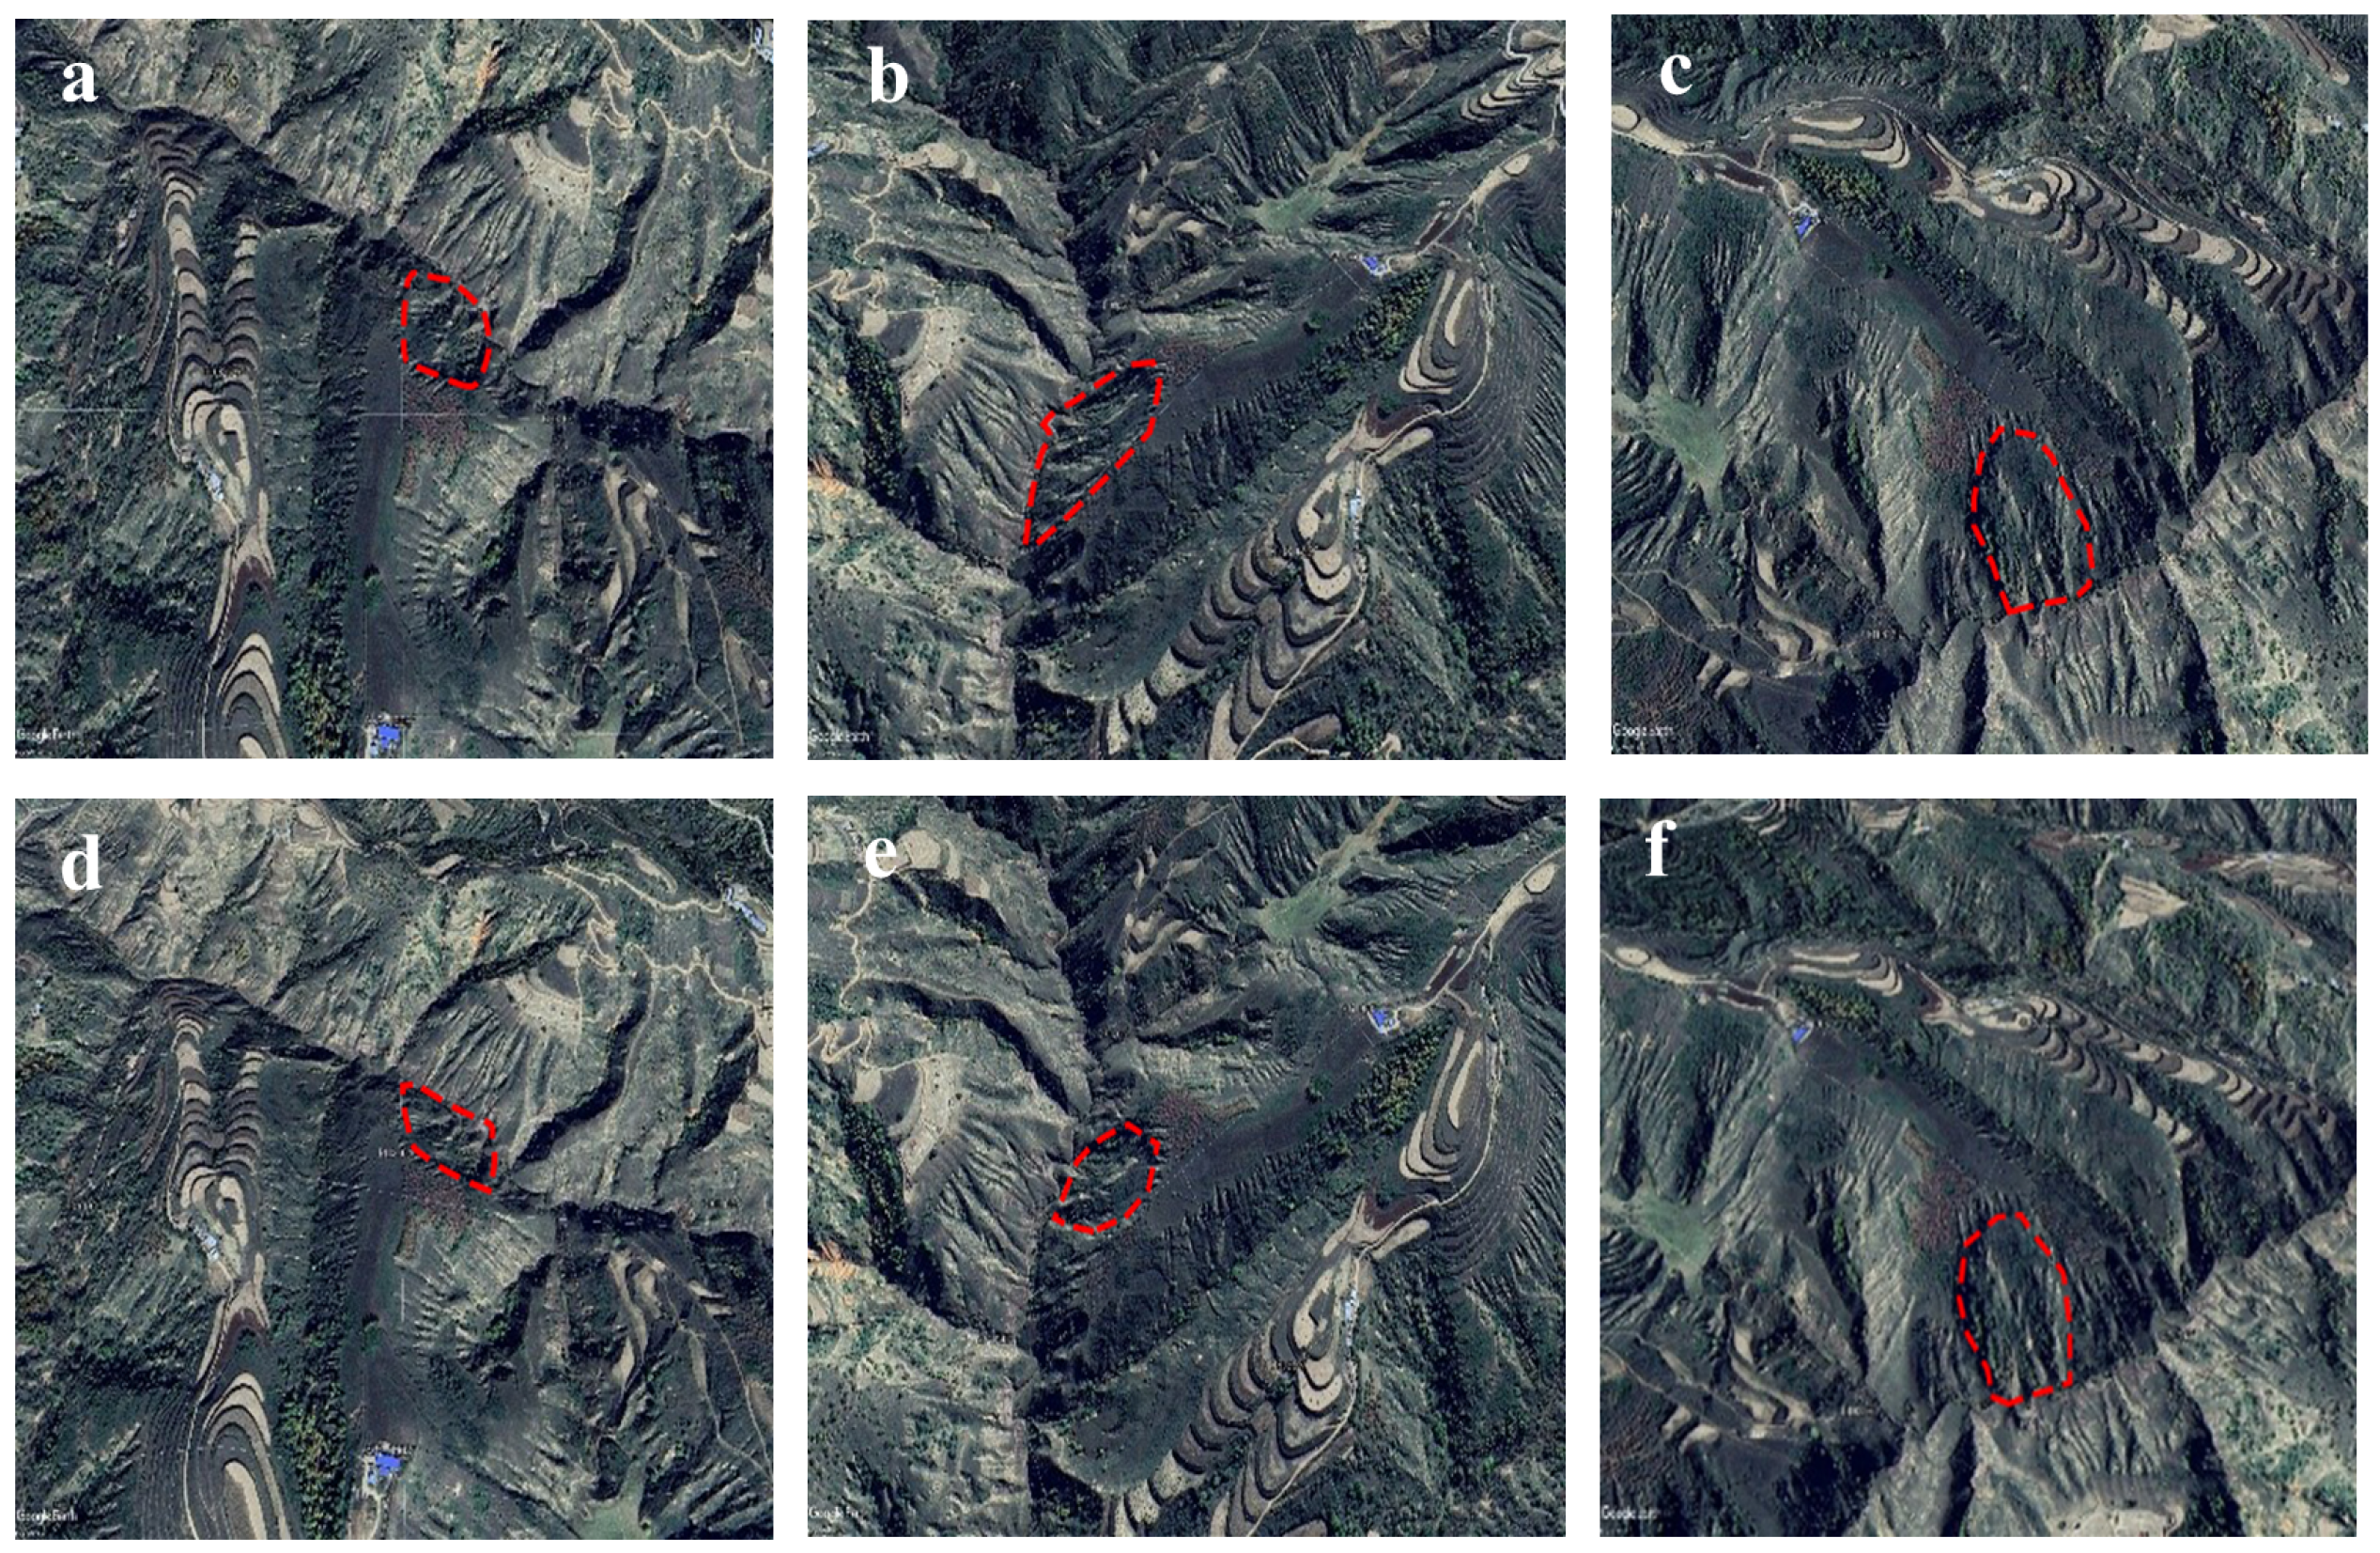
  • The high-resolution remote sensing image only contains the orthophoto-view of old loess landslides, which is difficult for training models to recognize. Actually, experts usually interpret old landslides by rotating the view angle in order to find more features and recognize them (Figure 1). There is still no effective automatic method to simulate this process to detect old loess landslides intelligently.
  • Detection models based on CNNs or transformers only extract local or global features of remote sensing images, respectively. They cannot utilize various features in the image effectively, which makes detection more difficult.
In this paper, considering the above challenges and the properties of CNNs and transformers and inspired by the interpretation process of human experts from different views, a novel optimal-view and multi-view strategic hybrid deep learning (OMV-HDL) method was proposed to detect old loess landslides effectively. The OMV-HDL consists of two steps: a training step and a detection step. During the training step, the optimal-view dataset is established to train the HDL model. During the detection step, the multi-view images are obtained by multi-view automatic cropping (MAC), and they are then fed to the trained hybrid deep learning (HDL) model in parallel to detect old loess landslides independently. After that, detection results from various views are fused by the weighted boxes fusion (WBF) algorithm to yield the final result. The proposed method has a high detection performance for old loess landslides. The main contributions of this paper are as follows:
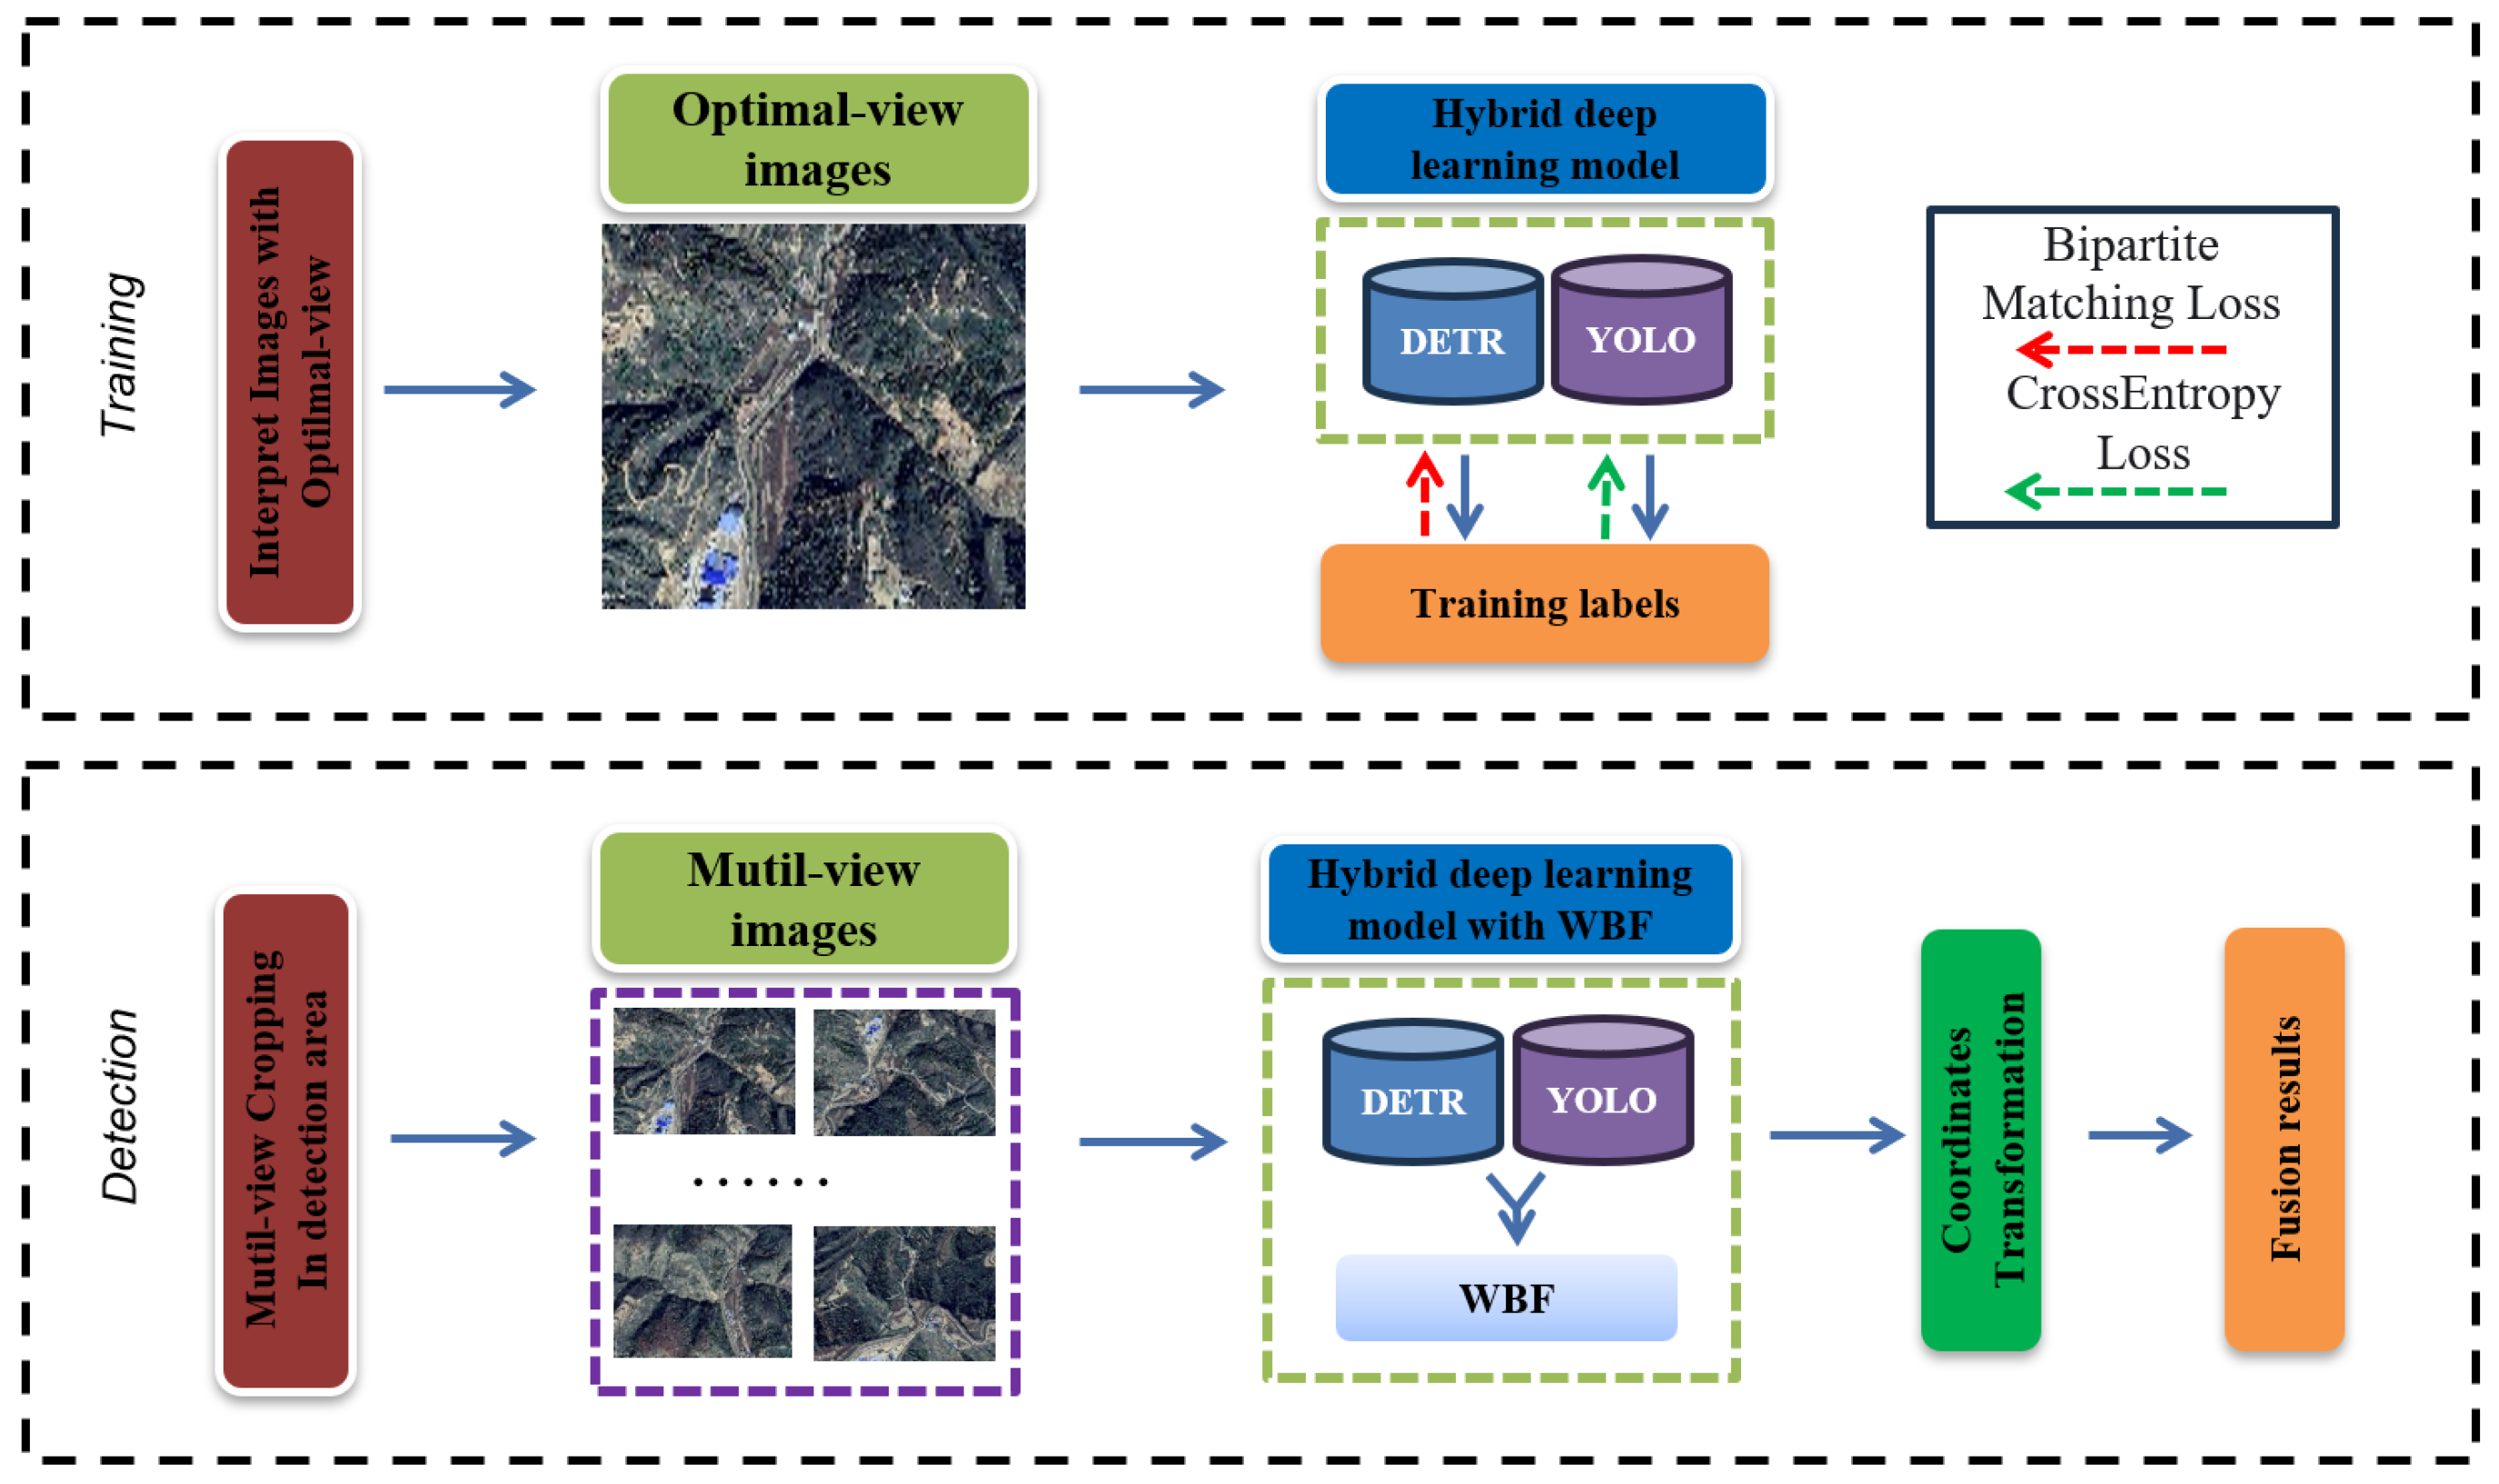
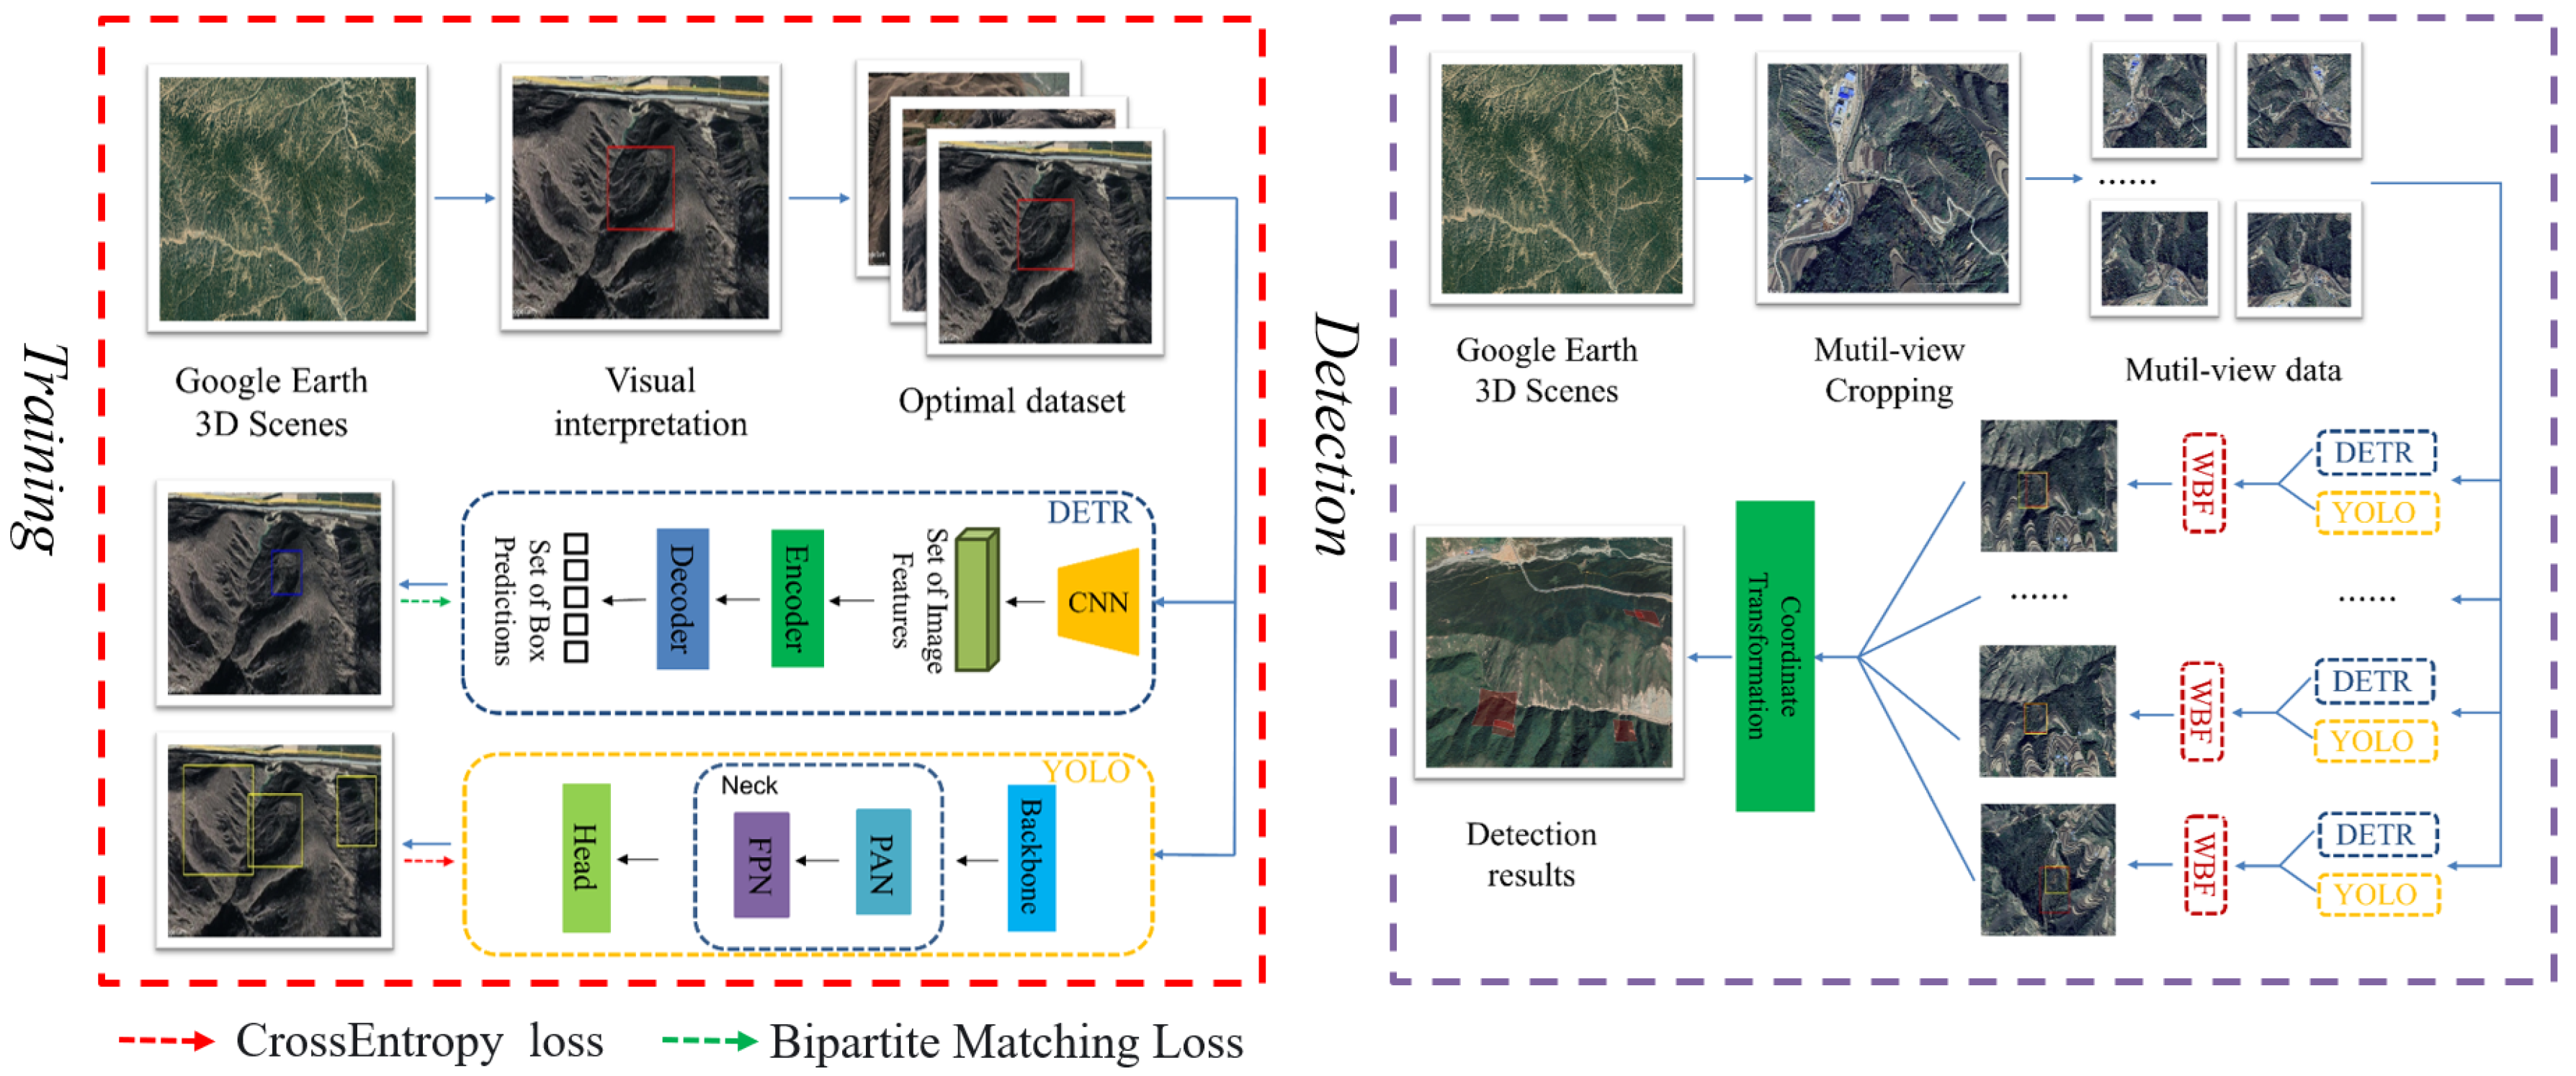
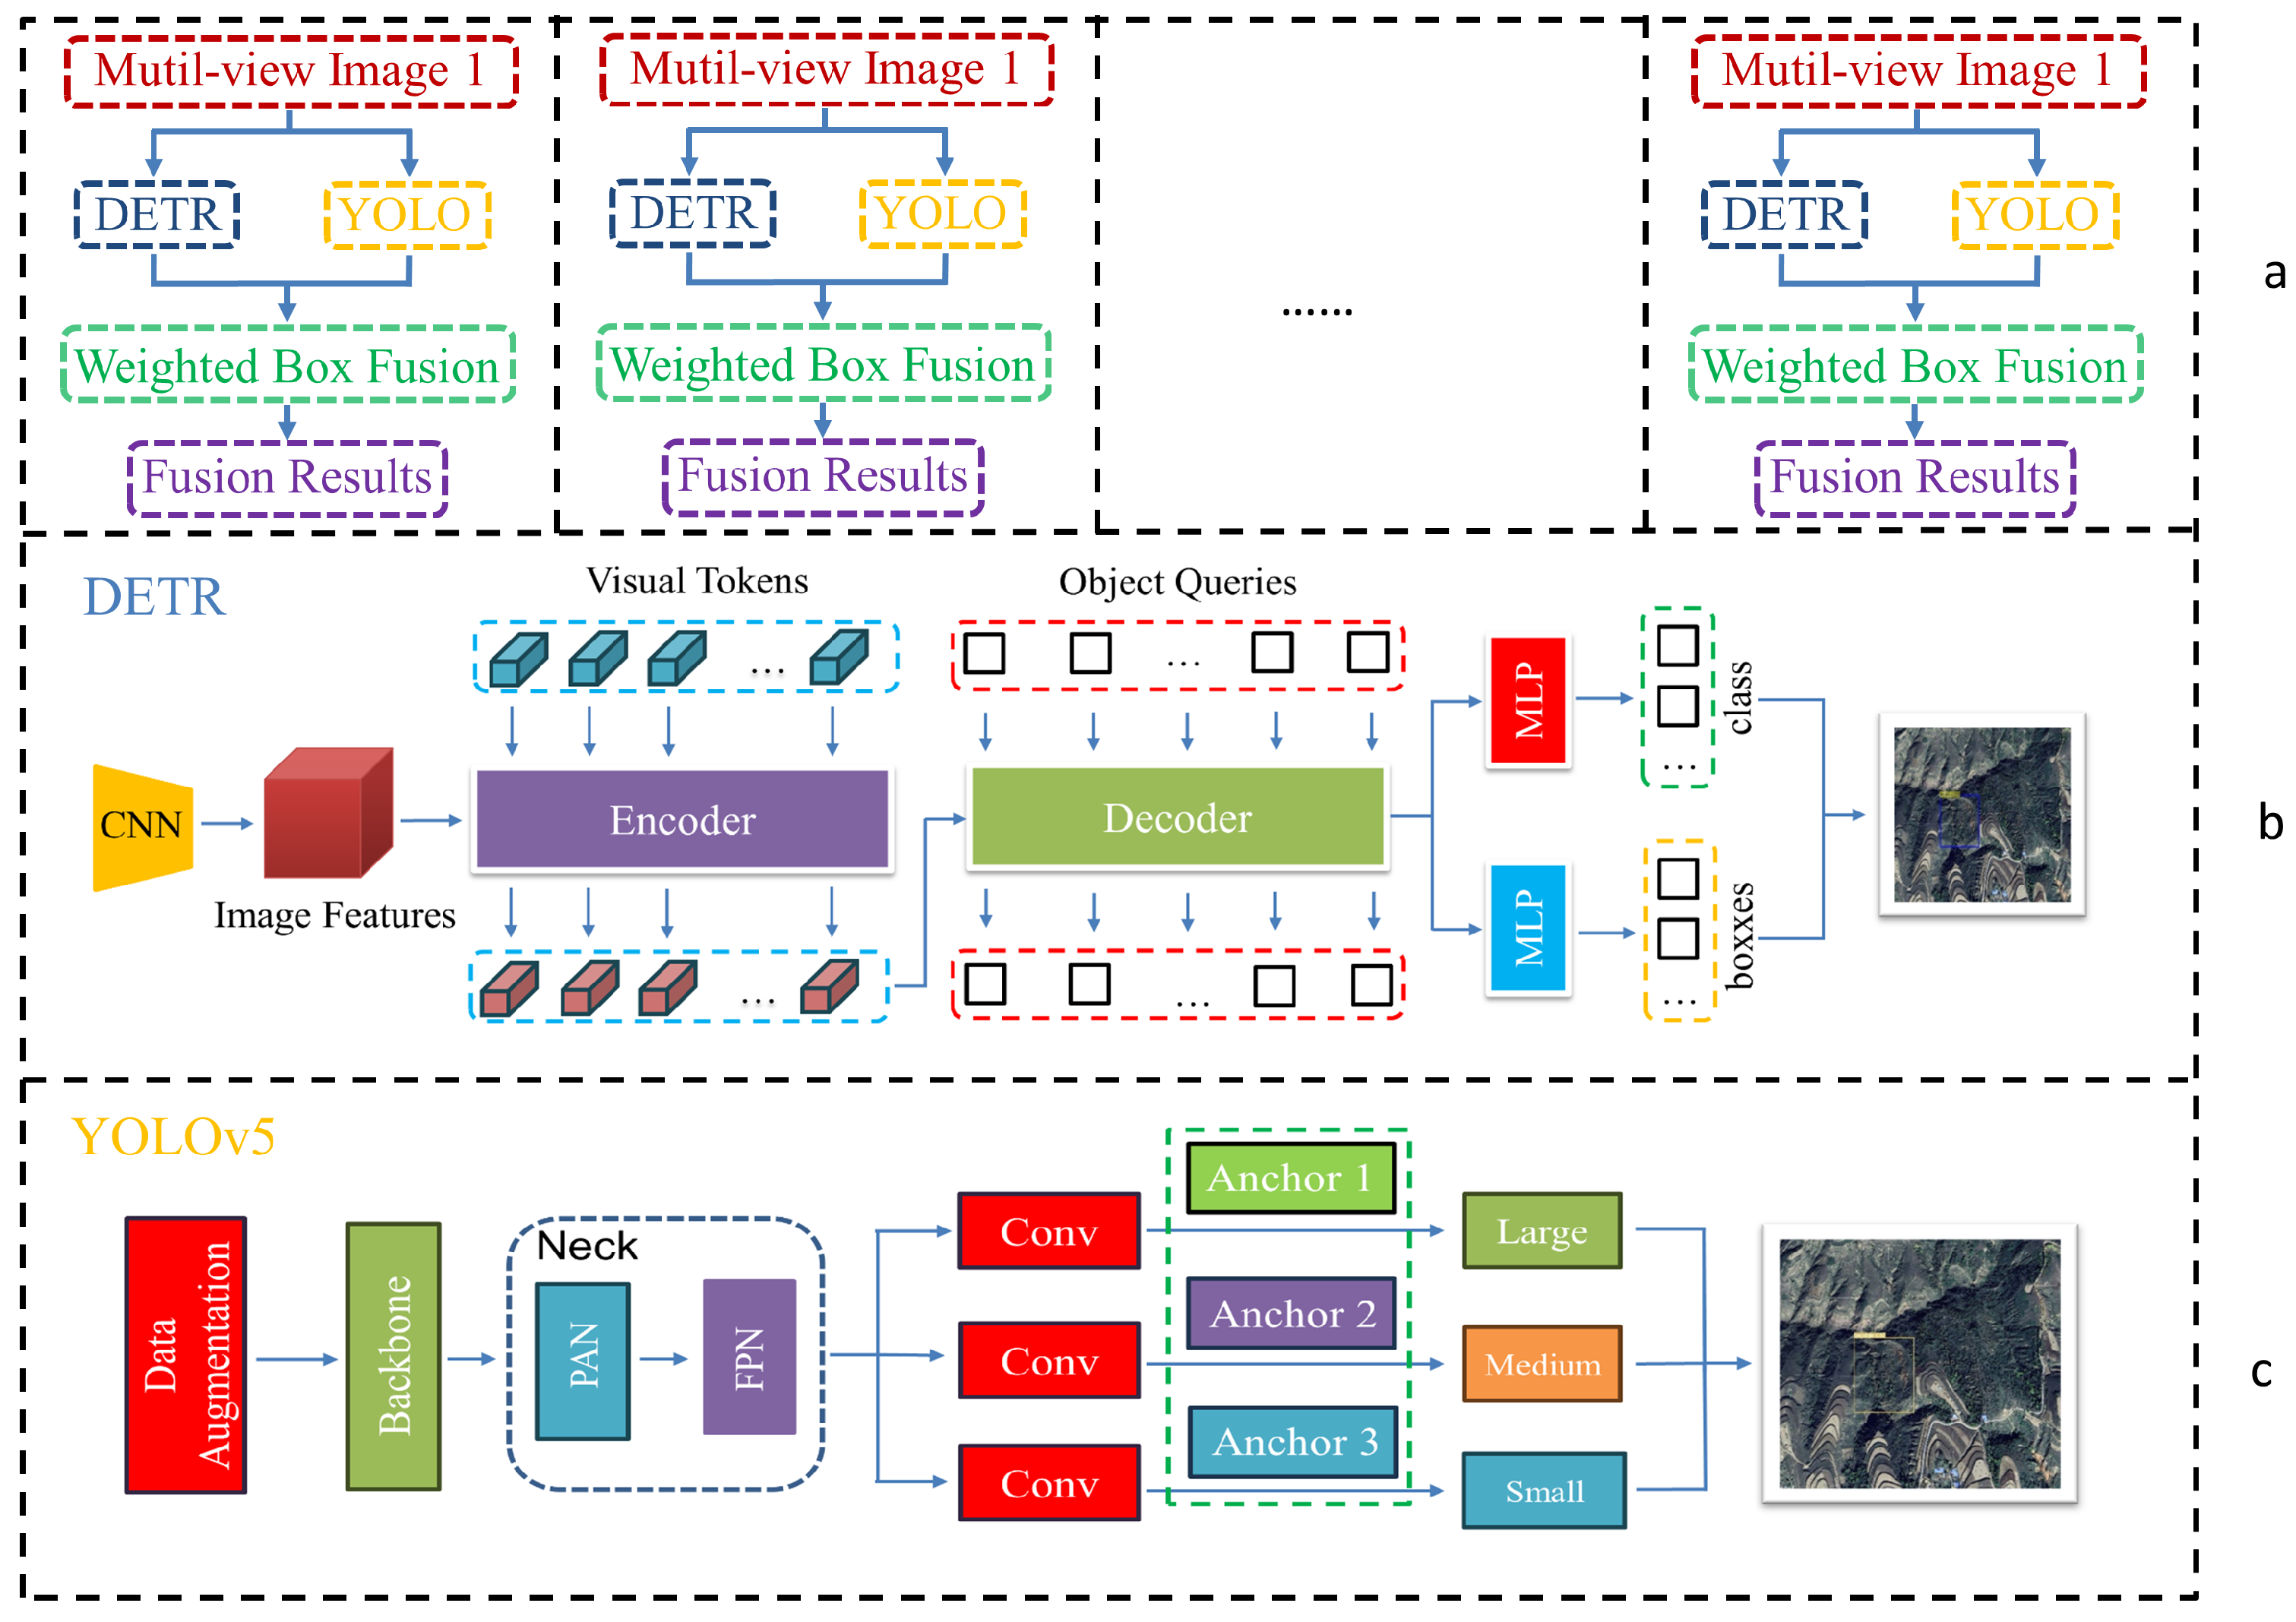
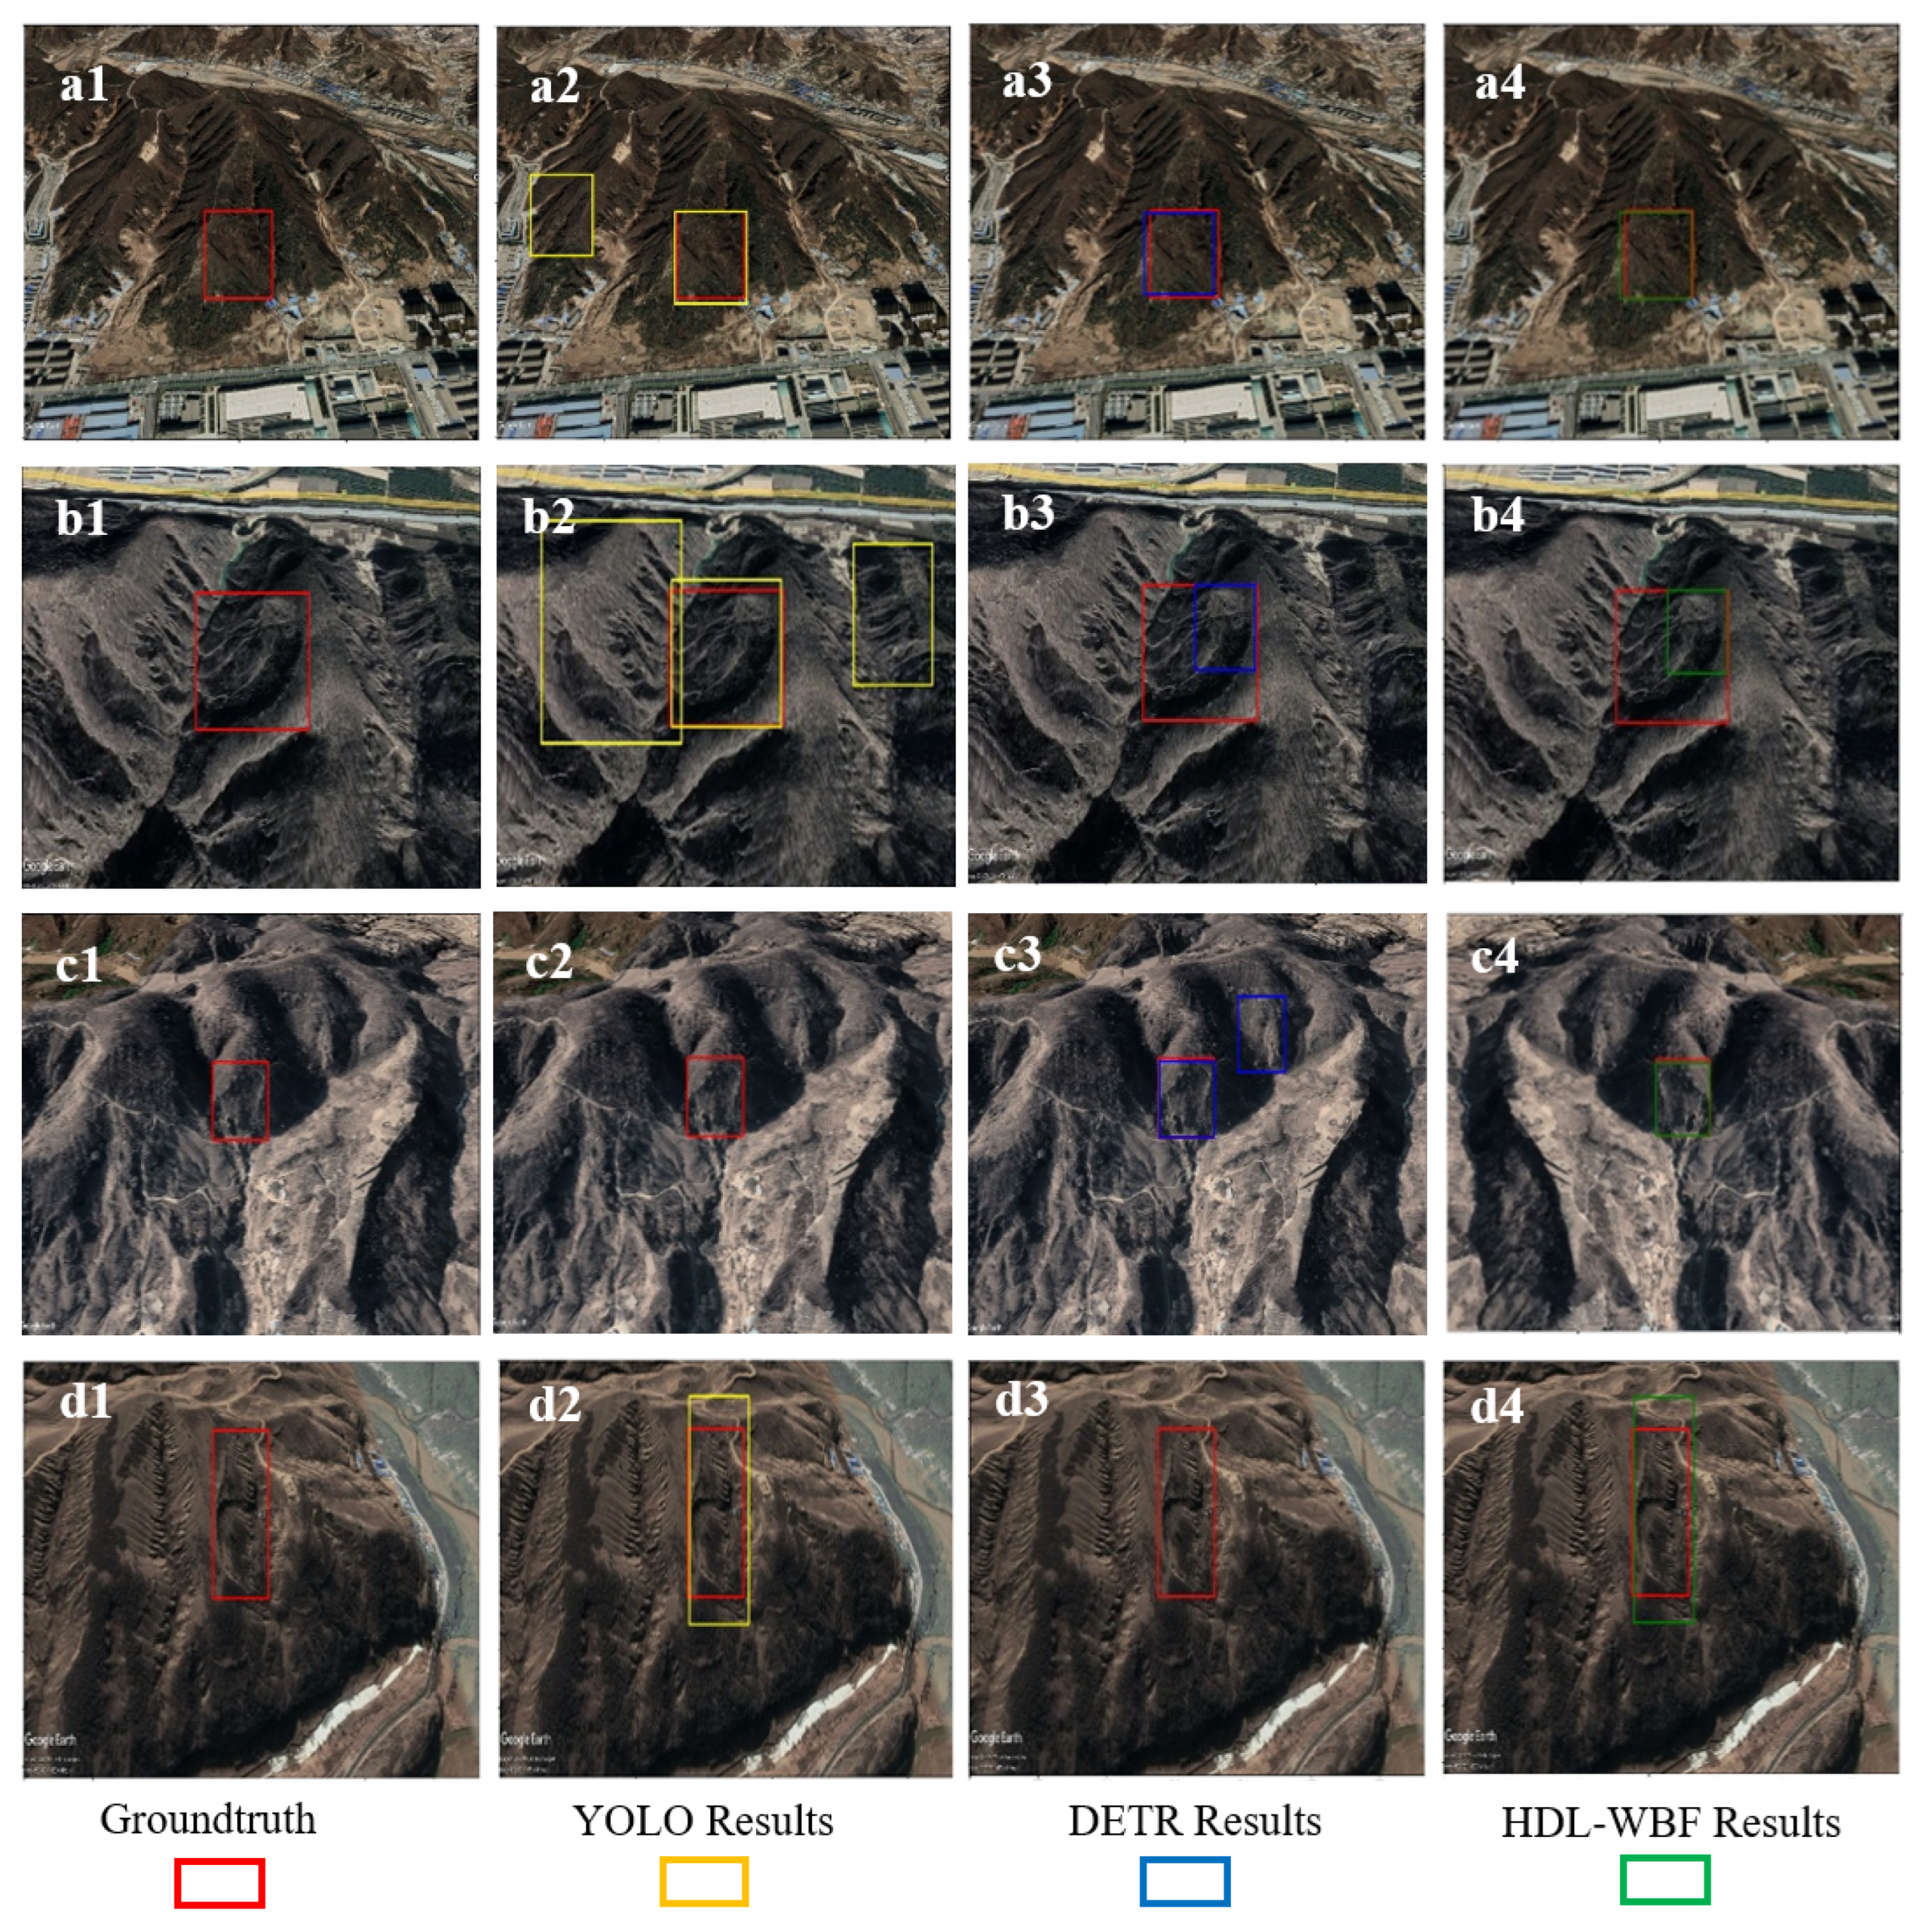
  • A HDL model which combines the advantages of CNNs and transformers was proposed, and it can extract global and local features of images at the same time. As such, it can detect old loess landslides effectively. The proposed method consists of the YOLOv5 object detection model based on CNNs and the detection transformer (DETR) model, and weighted boxes fusion (WBF) was introduced to fuse the results of the proposed hybrid deep learning model and to obtain comprehensive detection results.
  • The optimal and multi-view (OMV) strategy was proposed to detect old landslides effectively and efficiently. During the training process, more obvious features of old landslides can be learned from optimal-view images, while traditional learning methods only use orthophoto images, in which old landslides cannot be observed clearly. During detection in a new area, because the optimal view is unknown, we propose the multi-view strategy instead to detect old landslides with a trained model, which can be implemented in parallel without increasing detection time.
  • An optical remote sensing dataset with optimal images from the Yan’an area (YA-OP) was constructed as a benchmark for old landslide detection, and it can be used for related research about old landslides in the Loess Plateau.
The rest of this paper is organized as follows: Section 2 illustrates the details of the study area, Section 3 describes the proposed method for old loess landslide detection, Section 4 presents the experimental results, and conclusions are given in Section 5.

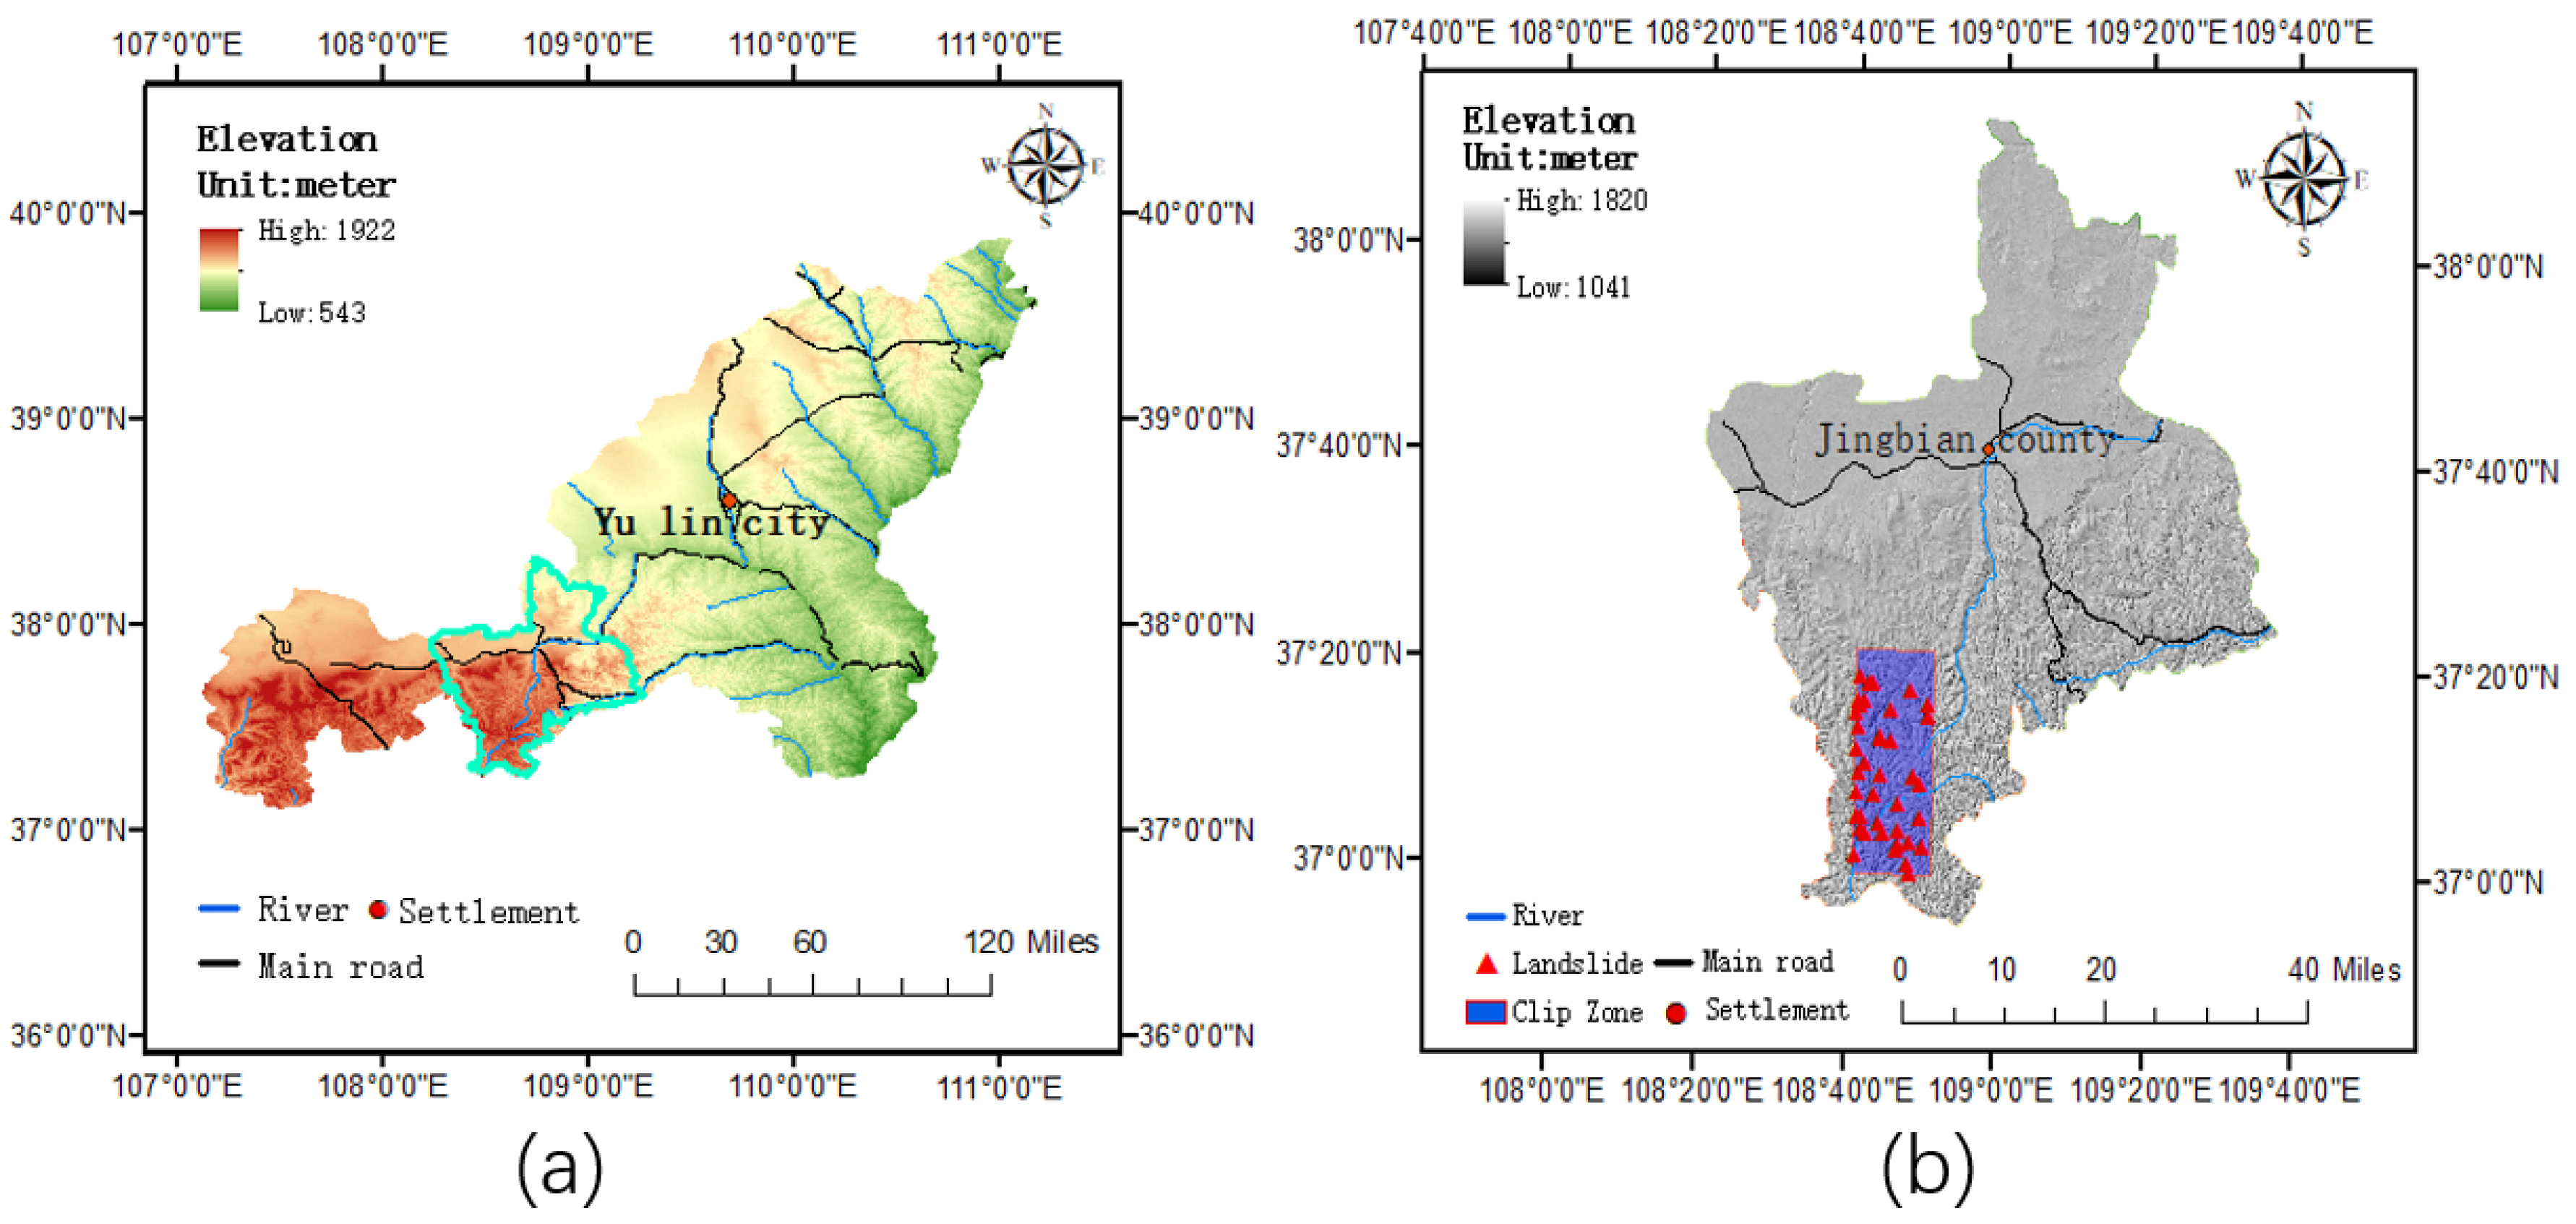
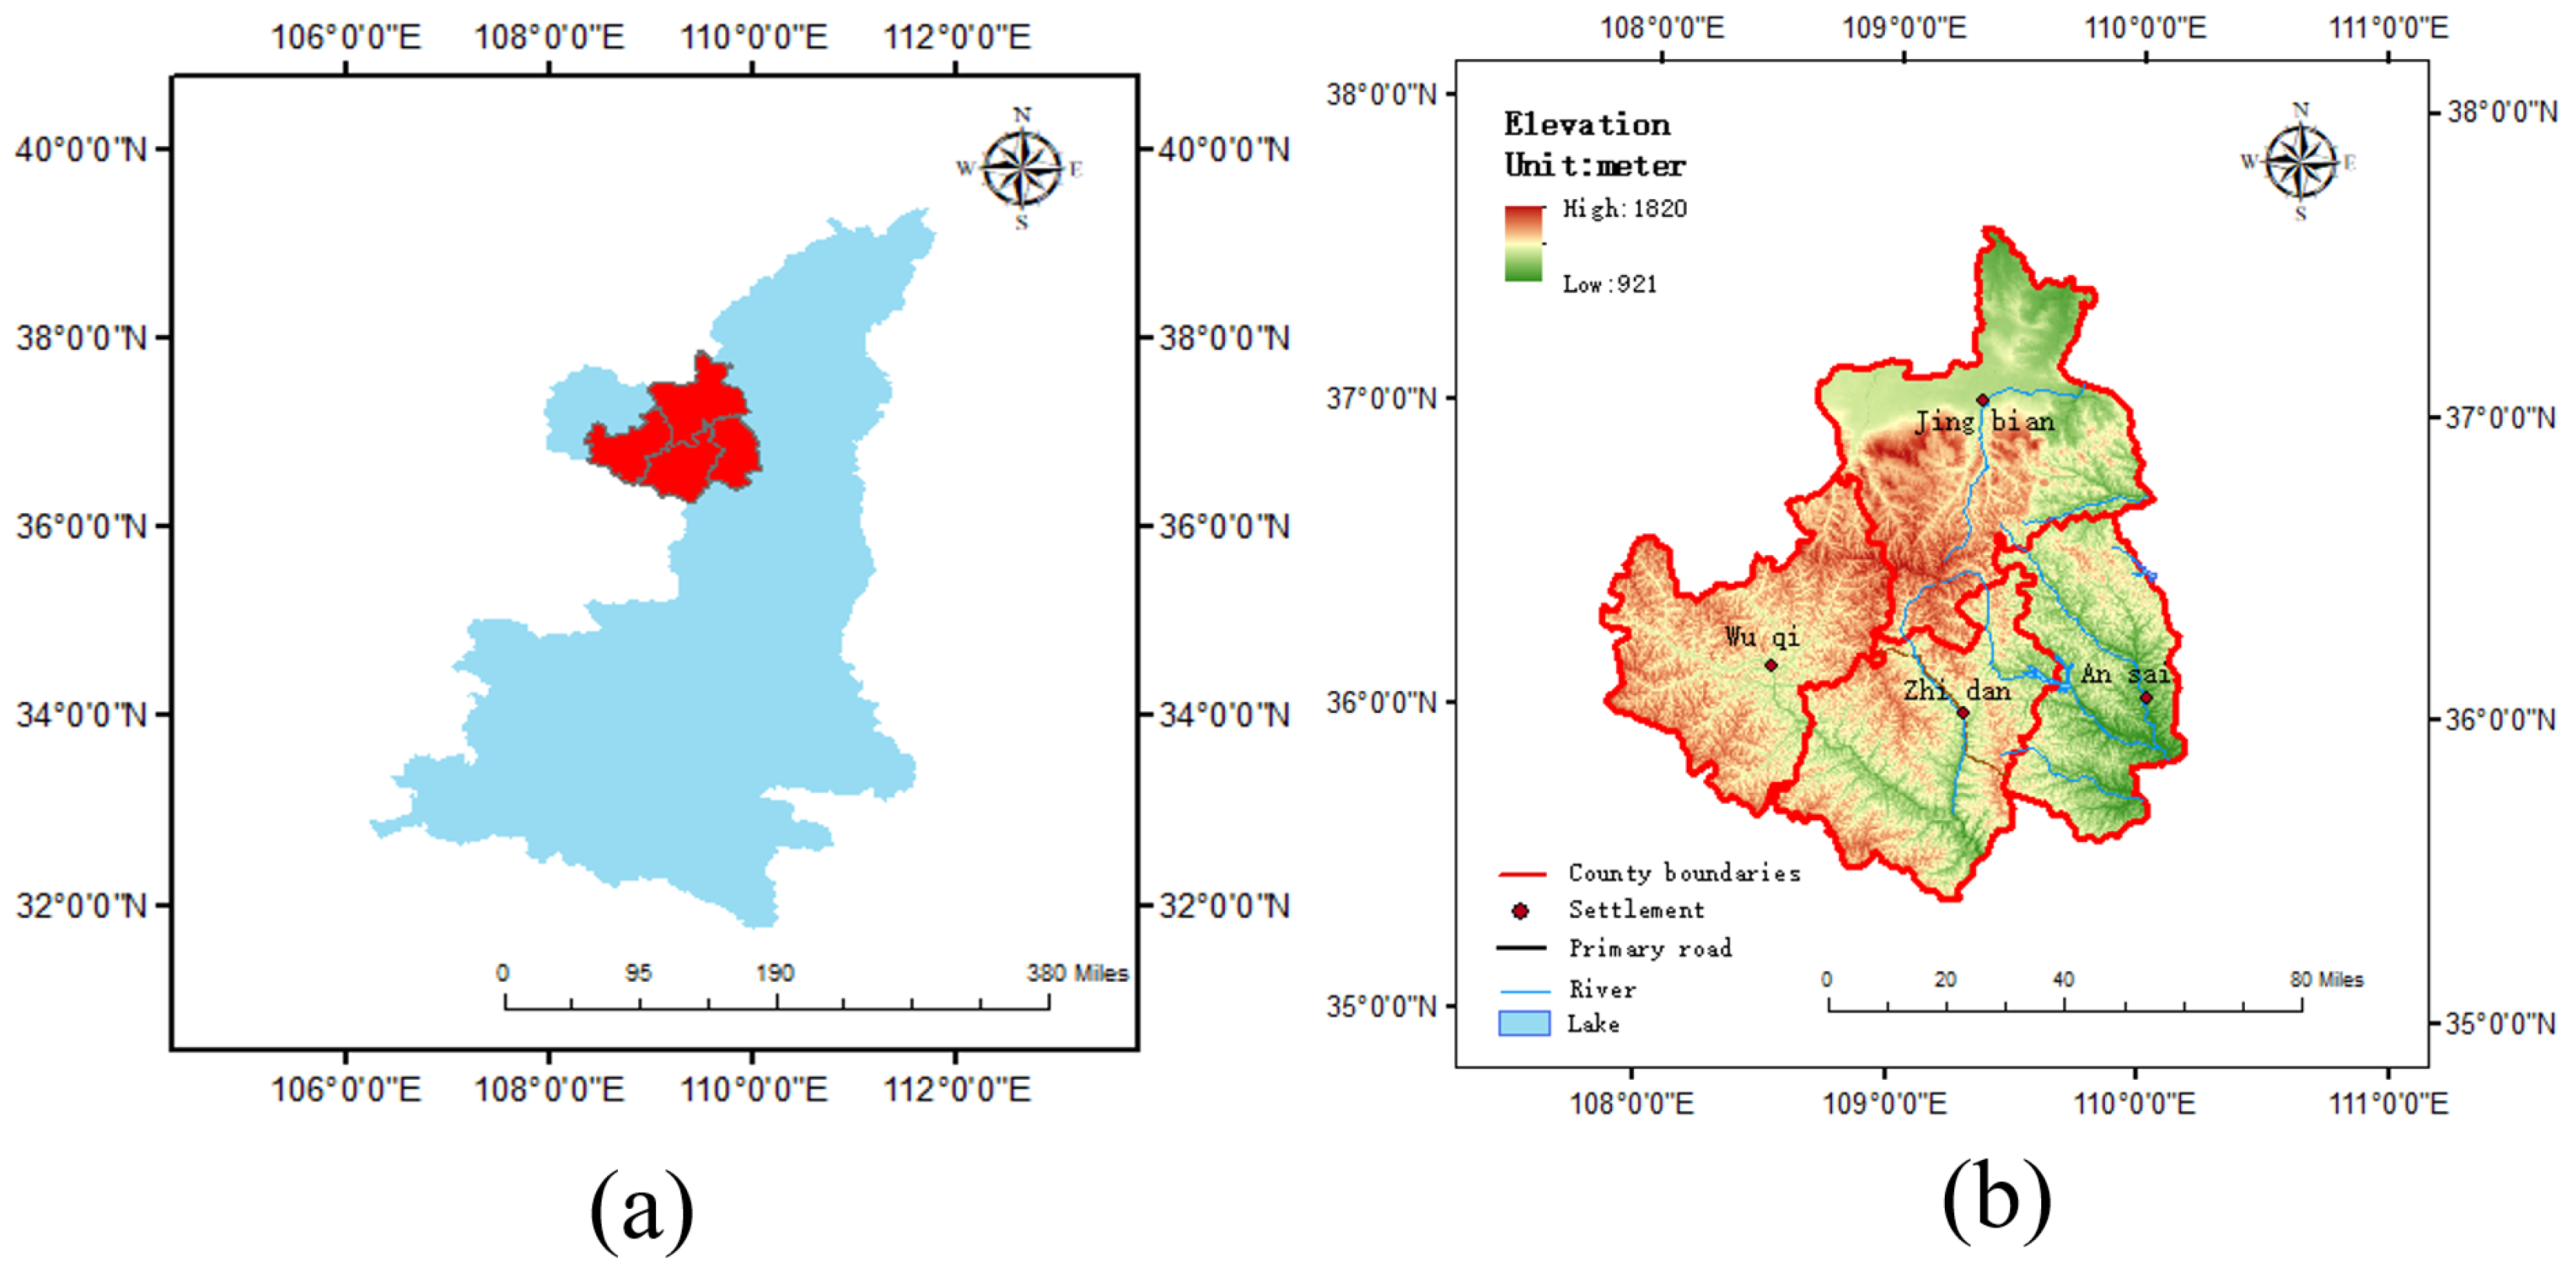
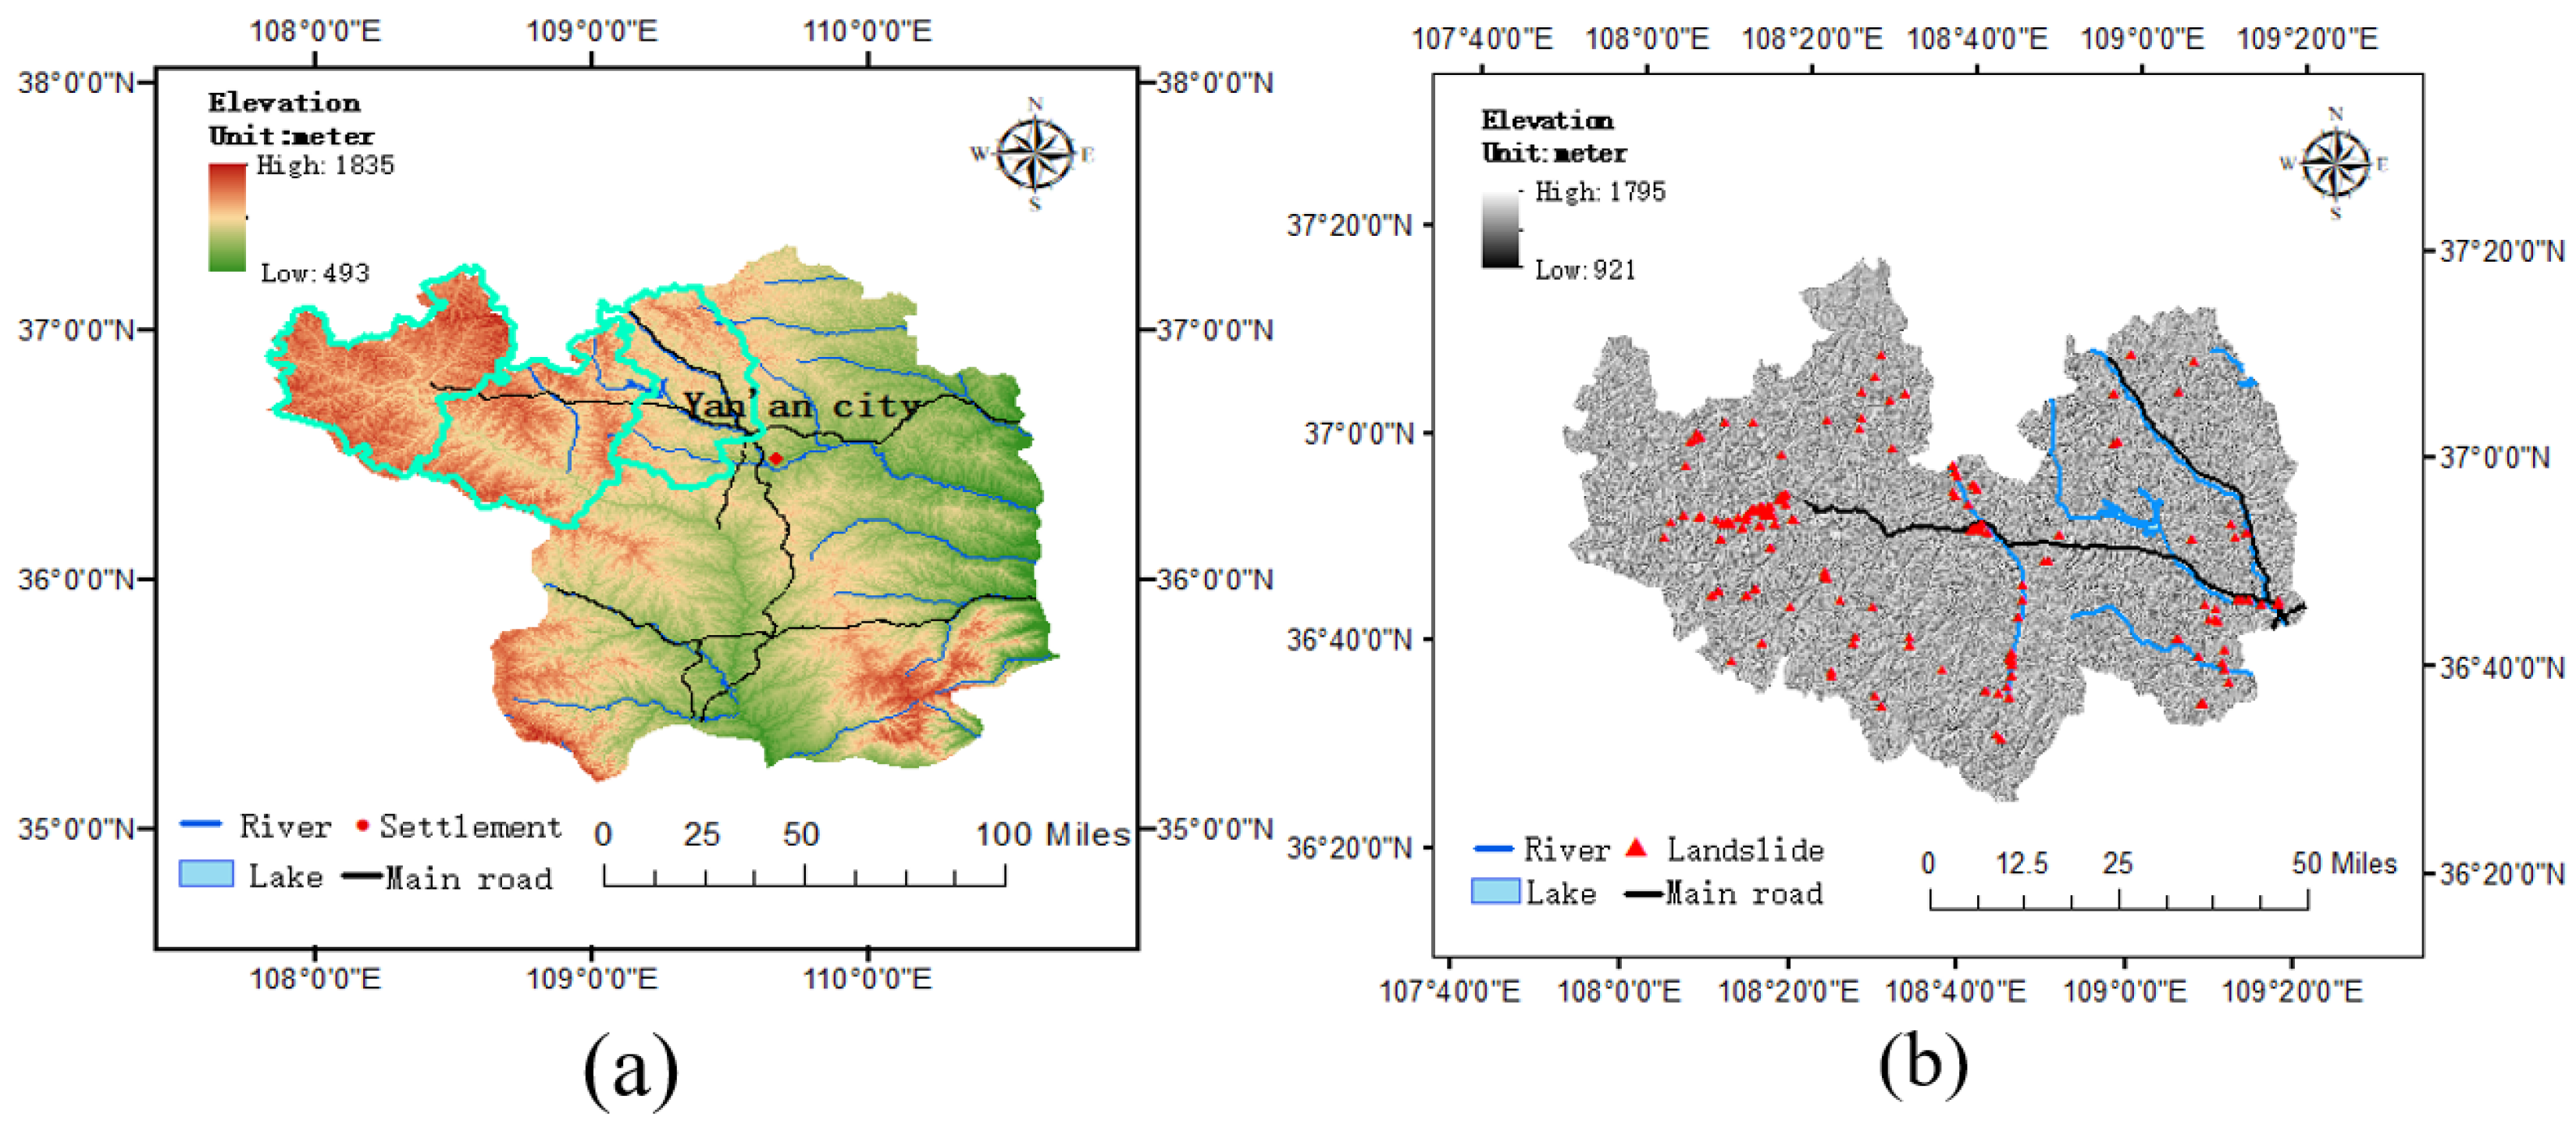
2. Description of the Study Area

The study area is located in the north of Shaanxi province, China, which includes four counties: Wuqi, Ansai, Zhidan, and Jingbian. Among them, Wuqi, Zhidan, and Ansai counties belong to the jurisdiction of Yan’an City, while Jingbian county belongs to the jurisdiction of Yulin City. The location of this area is between the latitudes of 36 21 15 N– 38 02 33 N and the longitudes of 107 39 27 E– 109 25 14 E, which indicate the central part of the Loess Plateau (Figure 2).
This area has an inland arid and semi-arid climate four distinct seasons, sufficient sunlight, and a large temperature difference between day and night, with an annual average daily temperature range of 10.9∼14.9 °C across the entire area. The average annual temperature is 7.7∼10.6 °C, with an average annual sunshine of 2300–2700 h and an average annual precipitation of about 500 mm.
This area has a large thickness of loess accumulation, which leads to severe soil erosion, crisscrossing gullies, fragmented terrain, and the frequent occurrence of geological disasters such as landslides and collapses. Being covered by loess, the landslides that occur most often in this area are loess landslides, with the rare occurrence of rocky landslides. Loess landslides are mainly developed in the middle and shallow surface, with few deep landslides.
The main development characteristics of the loess landslide in this area include the cracks on the slope, multi-level terraces, small-scale collapse and landslide at the front edge. For old loess landslides, global features including double groove with same source (Figure 3a) and armchair-shape (Figure 3b) are usually to be observed.
Double groove with same source refers to a phenomenon that two grooves are formed on both sides of the landslide body, and merge into the same ditch in the upstream. This is due to the erosive effect of water flows. When it rains, the water in landslide body will dash to both sides of the slope, resulting in this phenomenon. Armchair-shape refers to a phenomenon that the backwall of the landslide usually presents Armchair-shape.
In addition to these global features, old loess landslides also have some local features. Such as landslide backwall, radial cracks on the slope, differences between the vegetation and the surrounding areas (Figure 3b). These local features can help to the detection of old loess landslides.

3. Materials and Methods

3.1. Data for Training and Detection

In this paper, we established the optimal-view dataset and proposed multi-view automatic cropping (MAC) to obtain multi-view data.The optimal dataset was obtained through manual interpretation. Experts interpreted images not in the orthophoto-view image but in the Google 3D Scene, in which we rotated images to the most optimal-view and then labeled them as samples. The optimal-view dataset has 176 samples, and the spatial resolution of each sample is about 1 m. Multi-view images were obtained by MAC, specifically by modifying the parameters of the Google location file. Images from different views were generated in Google 3D Scenes automatically.

3.1.1. Optimal-View Dataset for Training

The study area of the optimal-view dataset is located in the Wuqi, Ansai, and Zhidan counties, Yan’an city. The location of this area is between the latitudes of 36 21 15 N– 37 23 42 N and the longitudes of 107 39 27 E– 109 25 14 E (Figure 4).
In this area, we interpreted over 300 old loess landslide samples through manual interpretation in Google 3D Scene. These samples had different colors and different resolutions, which can enhance the generalization of models.
However, there are two difficulties in interpreting old loess landslides: (1) Old loess landslides had occurred over a relatively long period, meaning that many are covered by dense vegetation and have experienced long-term erosion by water flow and wind, making manual interpretation more difficult. (2) Manual interpretation is highly labor intensive, and the experience level of interpreters varies. Interpreters who lack interpretation experience are prone to misinterpreting artificial earthworks or surface erosion as old landslides (Figure 5), causing the dataset to become untrustworthy. To solve these problems, we verified all samples on site. After on-site investigation, we removed samples that were labeled incorrectly. In the end, an optimal-view dataset containing 176 correctly labeled samples was obtained (Figure 6).

3.1.2. Multi-View Images for Detection

In 3D Scenes on Google Earth, the lens position can be determined by longitude and latitude as well as three parameters: heading (the angle between the heading direction and due north), tilt (the tilt angle relative to the horizontal line), and range (the relative distance of the satellite from the target) (Figure 7). By changing these five parameters, images from different views can be automatically captured in 3D Scenes on Google Earth.
According to the sizes and characteristics of old loess landslides in the Loess Plateau [46], we set the range to 1200, the longitude interval of each image to 0.009467 , and the latitude interval of each image to 0.0072 . The heading was set to every 120 within 360 , and the tilt was set to 30 and 45 (Table 1). Therefore, one original orthophoto-view image can be expanded into six multi-view images (Figure 8).

3.2. Optimal-View and Multi-View Strategic Hybrid Deep Learning Method

We proposed the optimal-view and multi-view strategic hybrid deep learning (OMV-HDL) method for old landslide detection (Figure 9). The OMV-HDL has two steps: the training step and the detection step. During the training step, the optimal-view dataset is established first with manual interpretation. During manual interpretation, we rotate images in Google Earth 3D Scene until their optical features are obvious; then, we mark old loess landslides and save them as labels. Compared with the method of interpreting old loess landslides in orthophoto-view, images obtained using the optimal-view interpretation method have more obvious optical features. After that, the optimal-view dataset is used to train the hybrid deep learning (HDL) model, which consists of YOLOv5 and DETR models. Compared to the single deep learning model, the HDL model can extract both global and local features of old loess landslides at the same time, so it displays a significant improvement in old loess landslide detection accuracy. During the detection step, MAC is performed in order to obtain multi-view images automatically in the detection area. Then, the HDL model trained on the optimal-view dataset is used to detect old loess landslides in multi-view images. The HDL model can run in parallel, meaning that the detection results of the images from various views can be obtained at the same time.
Next, in order to remove and fuse the redundant prediction boxes, the weighted boxes fusion (WBF) algorithm is applied, which combines the results of multiple redundant bounding boxes into one, more accurate box, rather than a simple deletion. Then, the coordinates of all of the images in the computer coordinate system are converted into geographic coordinates through Google 3D Scene. Meanwhile, WBF is used again to remove and fuse the redundant prediction boxes with six different views. At last, the final detection results of old loess landslides are obtained.

3.2.1. Optimal-View and Multi-View Strategy

In order to utilize features from various views of landslides for detection, we obtained the multi-view images using MAC. However, the process of labeling all multi-angle images requires is highly labor intensive. Specifically, the workload will increase by N times compared to orthophoto-view images, where N is the number of multi-view images in one scene. With the aim of making this process less labor intensive, we proposed the optimal-view and multi-view (OMV) strategy (Figure 10).
In the OMV strategy, the optimal-view dataset is used to train the HDL model, and multi-view data are used to detect old loess landslides. With this method, we can take full advantage of optical features from various views with only a slight increase in the interpretation requirements. This method contains two steps: a training step and a detection step. During the training step, by capturing the optical remote sensing images of old loess landslides with the most obvious optical features, the optimal-view dataset is constructed to train the HDL model. However, without knowing old landslides in the new study area, it is impossible to find images with the optimal view angle. To solve this problem, in the detection step, we captured optical remote sensing images with six different views automatically, which helps one to find landslides more easily as in the optimal-view angle. Then, the HDL model trained on the optimal-view dataset can be used in parallel to detect old loess landslides in multi-view images. With the OMV strategy, features of old loess landslides were learned better and with less effort in interpretation work.

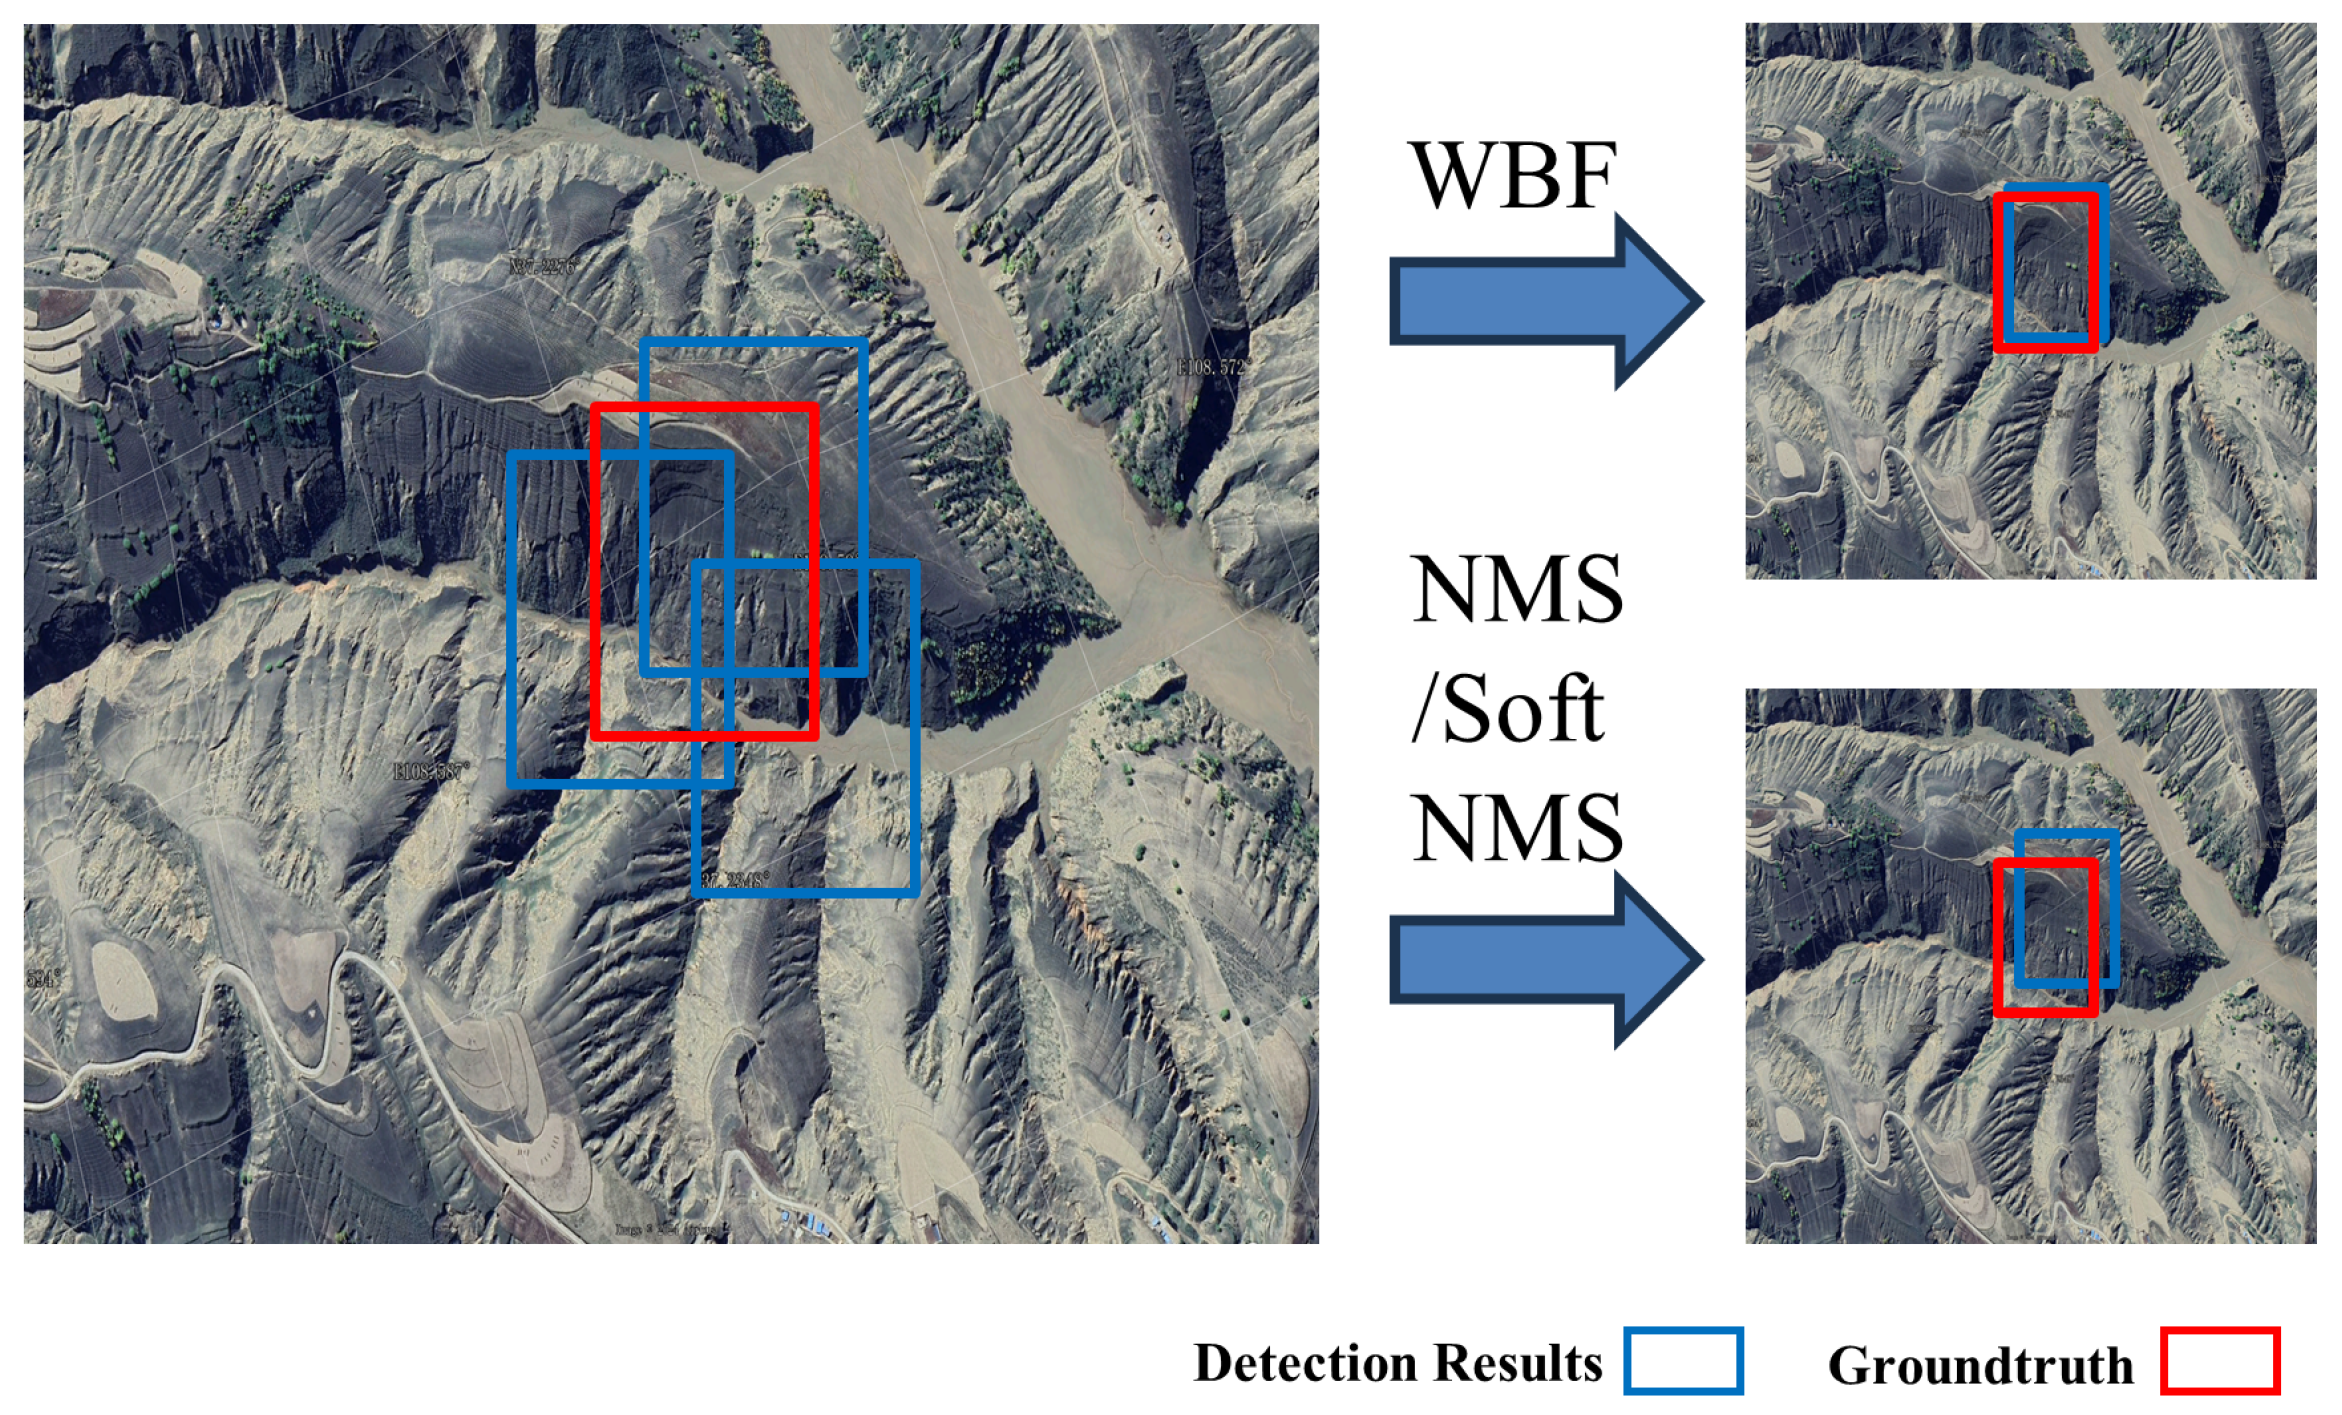
3.2.2. Hybrid Deep Learning Model with Weighted Boxes Fusion

Due to the different concerns of the CNN and DETR models, a single model based on CNN or transformer can only extract local or global features of images, respectively, which leads to the insufficient usage of features. To solve this problem, we propose hybrid deep learning model with weighted boxes fusion (HDL-WBF) method to detect old loess landslides in parallel with mutil-view images (Figure 11). The HDL model consists of two models: DETR and YOLOv5. Among them, the DETR model pays more attention to global features of old loess landslides, while the YOLOv5 model pays more attention to local features old loess landslides. In addition, to fuse results from the two models, the WBF algorithm was applied, which is more accurate at fusing results from two different models than the non-max suppression (NMS) algorithm.
In this method, the input image was fed into the YOLOv5 and DETR models, respectively. In the YOLOv5 model, data augmentation, such as mosaic, changing the brightness, adding noise, random scaling and cropping, flipping, and rotating, was applied first. Then, the thus augmented image was fed into the backbone to extract features. After that, these features were fed into the neck structure, which consisted of spatial pyramid pooling (SPP) and path aggregation network (PAN), to fuse the multi-scale features of the image. SPP is a pyramid pooling structure that can pool feature maps of different sizes, thereby enhancing the model’s perception ability for targets with different scales, and PAN is a multi-scale feature fusion structure that can effectively fuse features from different levels and avoid information loss. Then, the YOLOv5 model used three different heads for detection, and a strategy named anchor was used to improve the detection accuracy. Anchors are prior boxes of different sizes and aspect ratios, and they can be obtained by using the K-means clustering algorithm to cluster the target boxes in the training set. By setting different scale prior boxes, there exists a higher probability of prior boxes that have good matching with the target object, which makes the model easier to train. At last, the fusion results of three different scales and the final detection results of the YOLOv5 model were obtained. In the DETR model, the input image was first fed into CNN to extract image features, after which a three-dimensional feature map was generated. Then, the feature map was encoded by position information and split into visual tokens. Next, these visual tokens were fed into the transformer encoder, and output tokens were generated with the same size. Then, these output tokens were fed into the transformer encoder with N (N = 100, the number of object queries) object queries, and N output queries were obtained. At last, two multi-layer perceptrons with unshared weights were used to map the output queries of the transformer decoder into two outputs, one for classification and one for position regression. According to these two outputs, the final detection results were obtained.
Redundant detection boxes can be generated by adding the results from the two models simply. To avoid this problem, we used the WBF algorithm to remove and fuse redundant prediction boxes. Object detection models often use NMS [47] and Soft-NMS [48] to filter the final results from the prediction boxes of the models. These two algorithms are effective at filtering the results a single model. If the results are from different models, then the performance is unsatisfactory [49]. This is because NMS and Soft-NMS simply delete redundant boxes without considering the confidence differences between different models, which cannot make full use of all the information of prediction boxes (Figure 12).
The WBF algorithm uses the confidences and coordinates of all prediction boxes to construct the final prediction box, leading to more accurate prediction results. Specifically, the WBF algorithm has the following steps:
  • Create a new List B. The prediction boxes for each model are added to the List B, and elements (each box) of the list are sorted in descending order according to confidence.
  • Create two empty lists: List L is used to store all the prediction boxes belonging to the same target, and List F is used to store the fusion prediction boxes of each target.
  • Iterate over all of the prediction boxes of List B. Find the matching box in List F (the IoU of two boxes is greater than the threshold).
    I o U = A r e a o f O v e r l a p A r e a o f U n i o n
  • If no matching box is found, then the prediction box in List B is added as a new box to the end of Lists L and F, and then the next box in List B is iterated.
  • If a match is found, add the box to the same position in List L that corresponds to the matching box in List F.
  • Using the following fusion formula, the new coordinates and confidence scores for all T boxes at each location in the List L are recalculated. In these formulas, C represents the confidence scores of the resulting fusion box, and X 1 , 2 and Y 1 , 2 represent the upper-left and lower-right corner coordinates of the resulting fusion box, and i is the number of prediction boxes for the same target.
    C = i = 1 T C i T
    X 1 , 2 = i = 1 T C i × X 1 , 2 i i = 1 T C i
    Y 1 , 2 = i = 1 T C i × Y 1 , 2 i i = 1 T C i
  • After processing all the boxes in List B, the confidence score in List F is recalculated using Formula (5), where N is the total number of models.
    C = T N

4. Experimental Results and Analysis

4.1. Evaluation Indices and Experimental Settings

4.1.1. Evaluation Indices

Statistical index-based methods were used to evaluate and compare the performance of different models. In this paper, four precision indicators were utilized, including recall, precision F1 score, and average precision (AP). These can be defined by four types of possible outcomes, including true positive (TP), false positive (FP), true negative (TN), and false negative (FN). Hence, recall is the ratio of true positive samples to all true samples, precision is the ratio of true positive samples to all positive samples, and F1 score is a composite indicator which takes precision and recall into consideration. The formulas for these indicators are as follows:
R e c a l l = T P T P + F N
P r e c i s i o n = T P T P + F P
F 1 s c o r e = 2 × R e c a l l × P r e c i s i o n R e c a l l + P r e c i s i o n
A P I o U = x refers to the average accuracy when the IoU threshold is set to x. As shown in the formula, P n and R n are the precision and recall of prediction boxes at an IoU threshold of x. Each prediction box has a confidence score. If the prediction box exceeds the confidence threshold, it will be retained; if not, it will be discarded. Different confidence score thresholds correspond to different levels of precision and recall. Establish a two-dimensional coordinate system with the recall as the horizontal axis and the precision as the vertical axis. By connecting points whose coordinates represent their recall and precision, the P-R curve will be obtained, and the area of the P-R curve between two the axes is A P I o U = x .
A P I o U = x = n ( R n R n 1 ) P n

4.1.2. Experimental Settings

The hardware configuration used for the experiment in this paper is as follows: Intel Xeon(R) Silver 4216 Cpu, Geforce RTX 3090 Gpu*2, and running memory 128 G. The software we used includes Pycharm 2021.2, Google Earth Pro 7.3.6.9796, Anaconda 4.11.0, and Python 3.9.18, and the framework used for deep learning was PyTorch 2.3. The optimal-view dataset was divided into training, validation, and testing data with a ratio of 8:1:1. During preprocessing in the YOLOv5 model, all of the images were resized to 640 × 640, and data augmentation methods including mosaic, random affine, and mixup were applied. In the experiment, the number of training epochs was 200, and the batch size was 16. The initial learning rate was 0.001, and the weight decay was 0.0005. The momentum was 0.937. During the image preprocessing process of the DETR model, resnet50 was used as the backbone. The number of training epochs was 200, and the batch size was 8. The initial learning rate was 0.0001, and the weight decay was 0.0001. The momentum was 0.937, and there were 8 encoder and decoder layers. The number of attention heads was 8. In WBF, the IoU and confidence thresholds were 0.5 and 0.7, respectively.

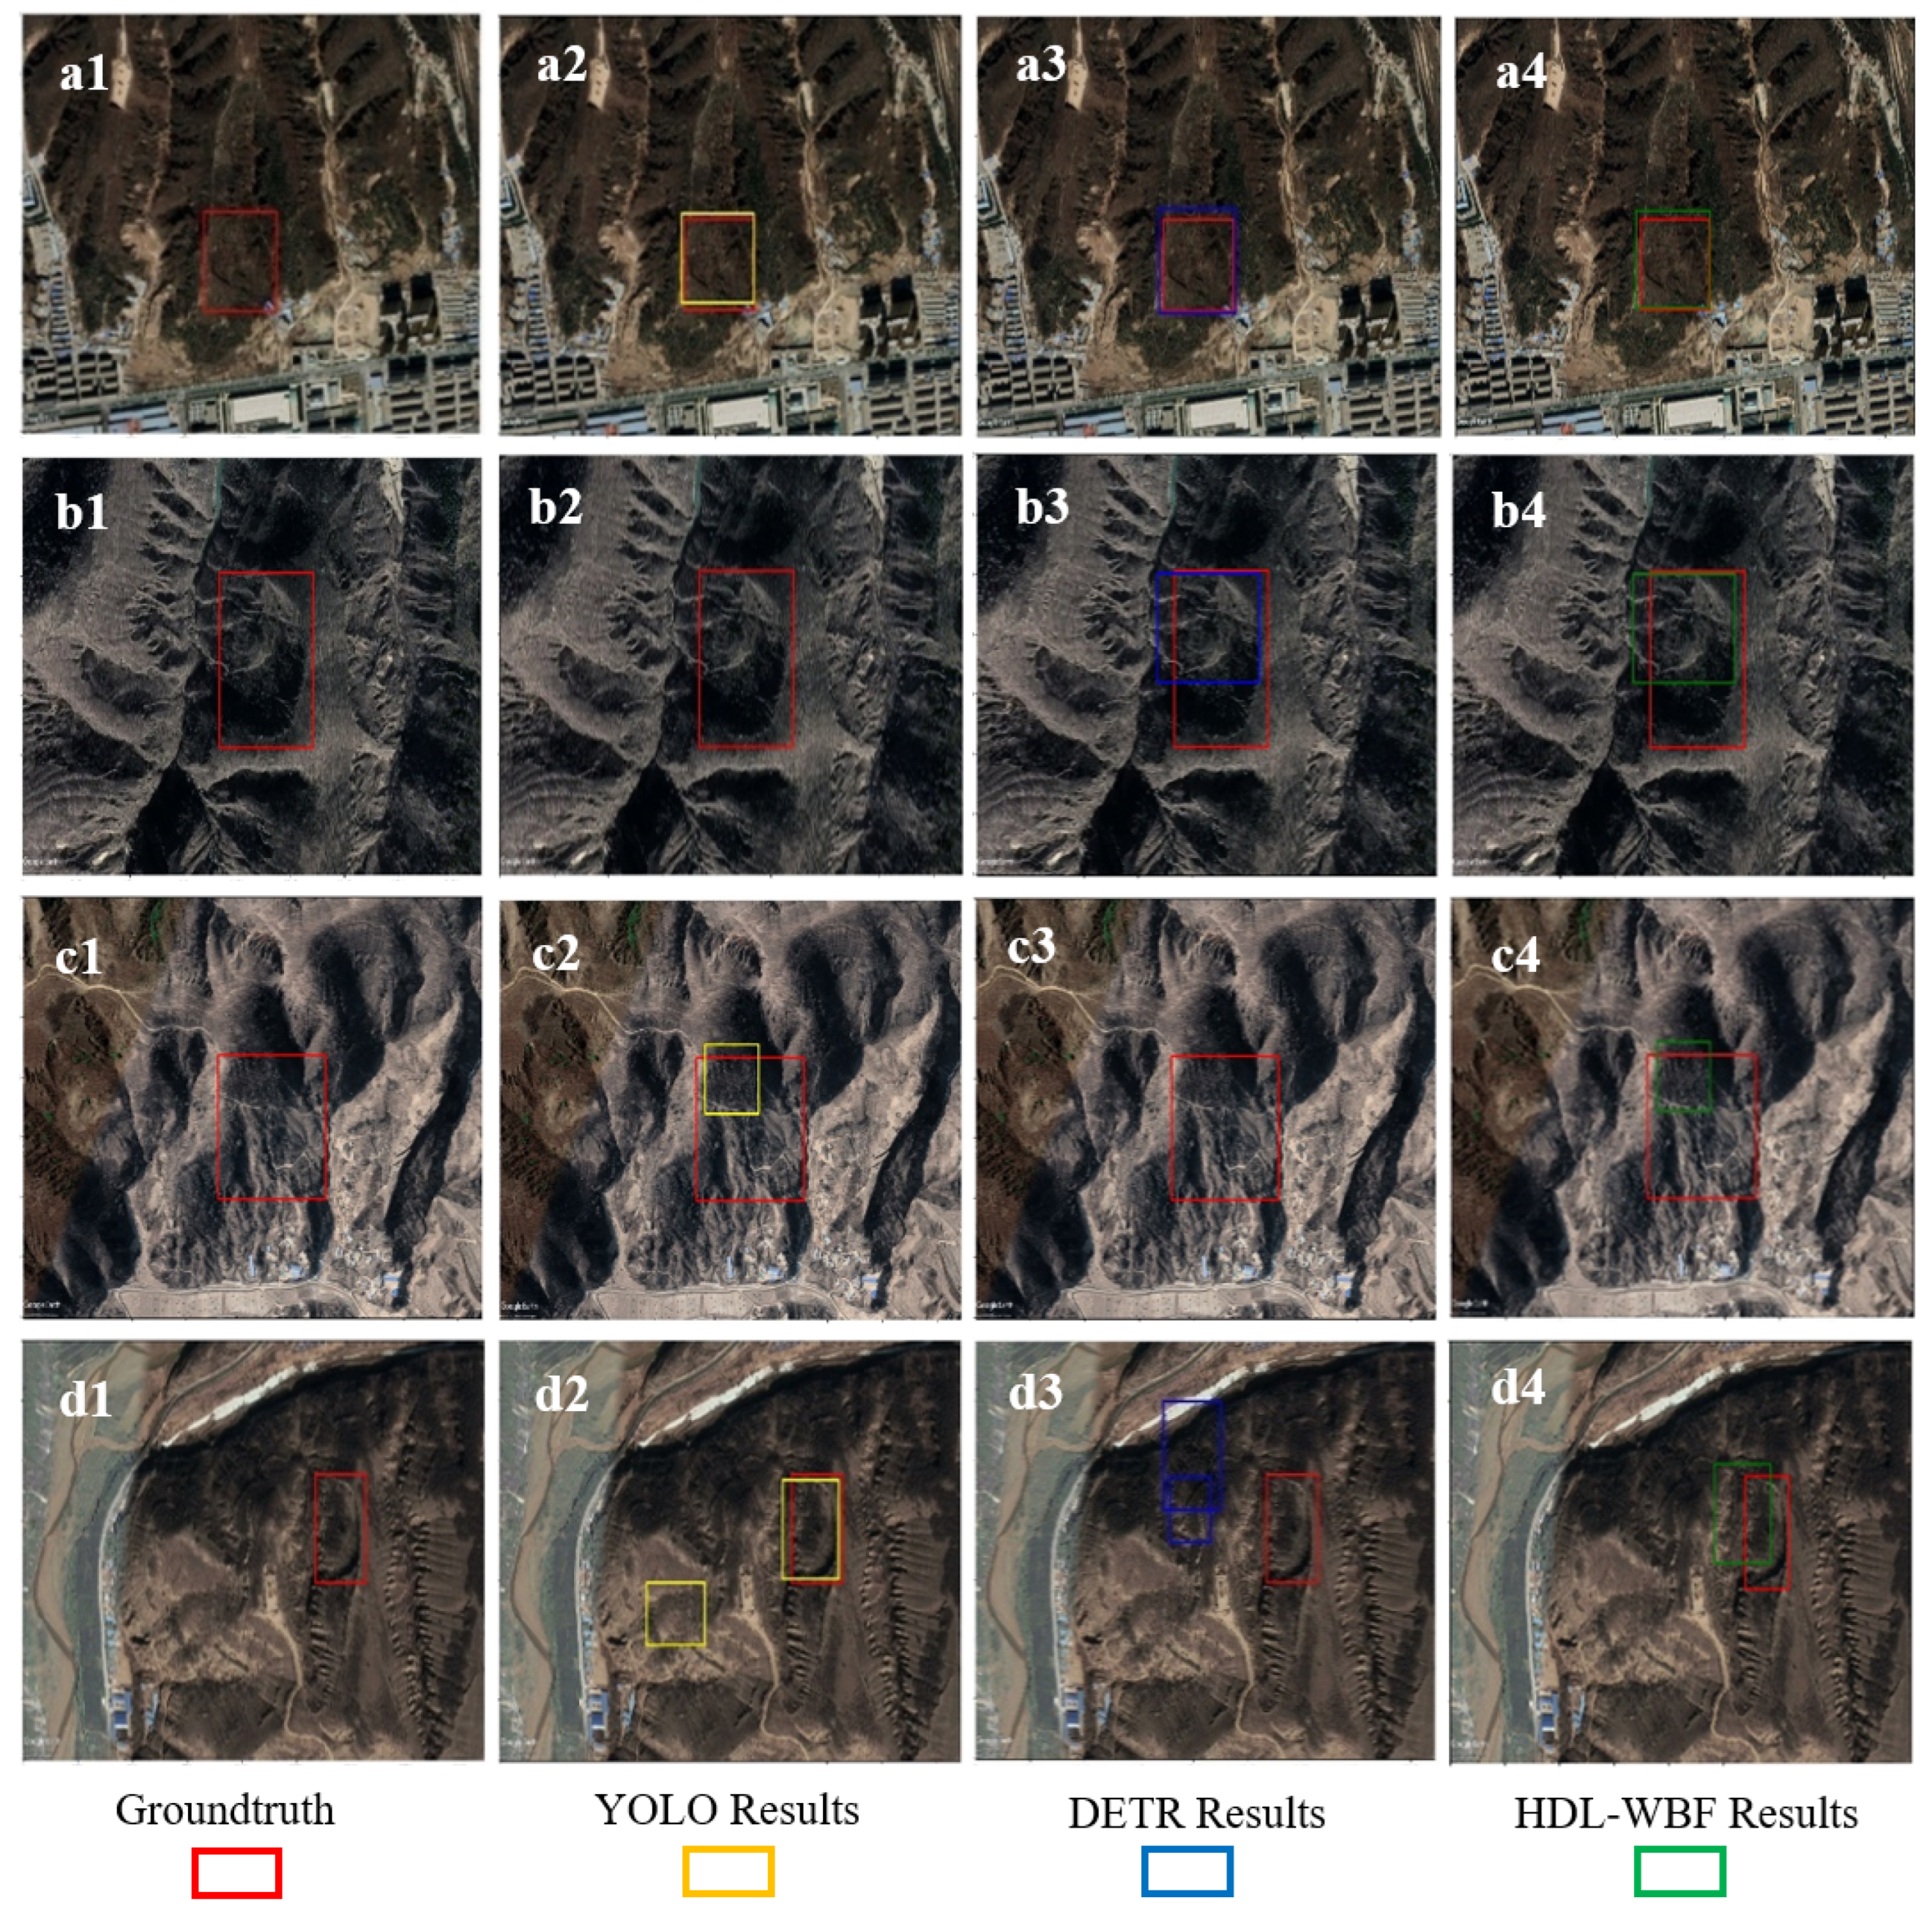
4.2. Performance of HDL-WBF on Yan’an Optimal-View Dataset

In this section, we compare the results of the orthophoto-view dataset and the optimal-view dataset and compared the results with different models.
Based on the optimal-view dataset, we reset the tilt and heading parameters of each image to zero. After interpretation, the orthophoto-view dataset was established. We trained the hybrid deep learning model on the orthophoto-view dataset. The test results of the proposed model are shown in Figure 13 (including instances of four old landslides), and they were compared with those of the YOLO and DETR models. The ground truths of four landslides are shown in images a1–d1. The test results of YOLO, DETR, and HDL-WBF are shown in images a2–d2, a3–d3, and a4–d4, respectively.
From the results of image a, it is observed that the test results from the YOLOv5 and DETR models predicted the ground truth correctly, as did those from the HDL-WBF. As for the results of image b, the YOLOv5 model missed the ground truth. However, the DETR model and the HDL predicted the ground truth correctly. In image c, the situation of the two models was reversed, but HDL-WBF still predicted the ground truth correctly. This shows that the DETR model and the YOLOv5 model have different concerns about old loess landslides, while HDL combined the advantages of these two models and obtained a better result. Furthermore, it is also shown that the WBF algorithm can fuse the results of these two models well and reduce the occurrence of missed detection. In the results of image d, it can be seen that the YOLOv5 model has two prediction boxes. One prediction box is correct, but the other is wrong. Two prediction boxes from the DETR model are incorrect. As for the HDL model, using the WBF algorithm, all of the prediction boxes of the two models were fused according to confidence scores in order to generate a new prediction box, and it is closer to the ground truth. This shows that, as a detection result fusion algorithm, WBF can reduce the impact of false position on the results.
We also trained the hybrid deep learning model on the optimal-view dataset. The test results of the proposed model are shown in Figure 14 (including instances of four old landslides), and they were compared with the YOLO and DETR models. The ground truths of four landslides are shown in images a1–d1. The test results of YOLO, DETR, and HDL-WBF are shown in images a2–d2, a3–d3, and a4–d4, respectively. From the results of images a and b, it can be seen that WBF can effectively remove the incorrect detection box. From the results of images c and d, we can see that there are some ground truths that are not detected by the YOLOv5 or DETR models but that are detected by HDL-WBF. This proves that the results from YOLOv5 or DETR have a certain complementarity and that the WBF can effectively combine the results of the two models.
The test results of the single YOLOv5 model, single DETR model, and HDL-WBF are listed in Table 2, respectively. First, it can be seen from Table 2 that the performance of DETR is much better than that of YOLOv5 on the optimal-view dataset (OP) and the orthophoto-view dataset (OR). Specifically, its F1 score and AP (mean) from the optimal dataset have show an improvement of 0.205 and 0.317, respectively. On the orthophoto-view dataset, it displayed an improvement of 0.211 and 0.290, respectively. Compared to the CNN-based model focusing on local features, the DETR model, which focuses on global features, has a better old loess landslide detection performance. In addition, we can see that the performance of the HDL-WBF is better than that of the DETR model on the optimal-view dataset (OP) and the orthophoto-view dataset (OR). Its F1 score and AP (mean) on the optimal dataset displayed an improvement of 0.047 and 0.055, respectively. On the orthophoto-view dataset, it showed an improvement of 0.046 and 0.011, respectively. This proves that, compared to single models, the hybrid learning model (HDL) can extract both local and global features of the image simultaneously, which helps it to detect old loess landslides. Finally, from the overall results, it can be seen that the F1 score and AP (mean) on the optimal-view (OP) dataset present an average improvement of 5–10% compared to the orthophoto-view dataset (OR), which proves that the proposed method of labeling optimal-view images to establish the optimal-view dataset for training is effective.

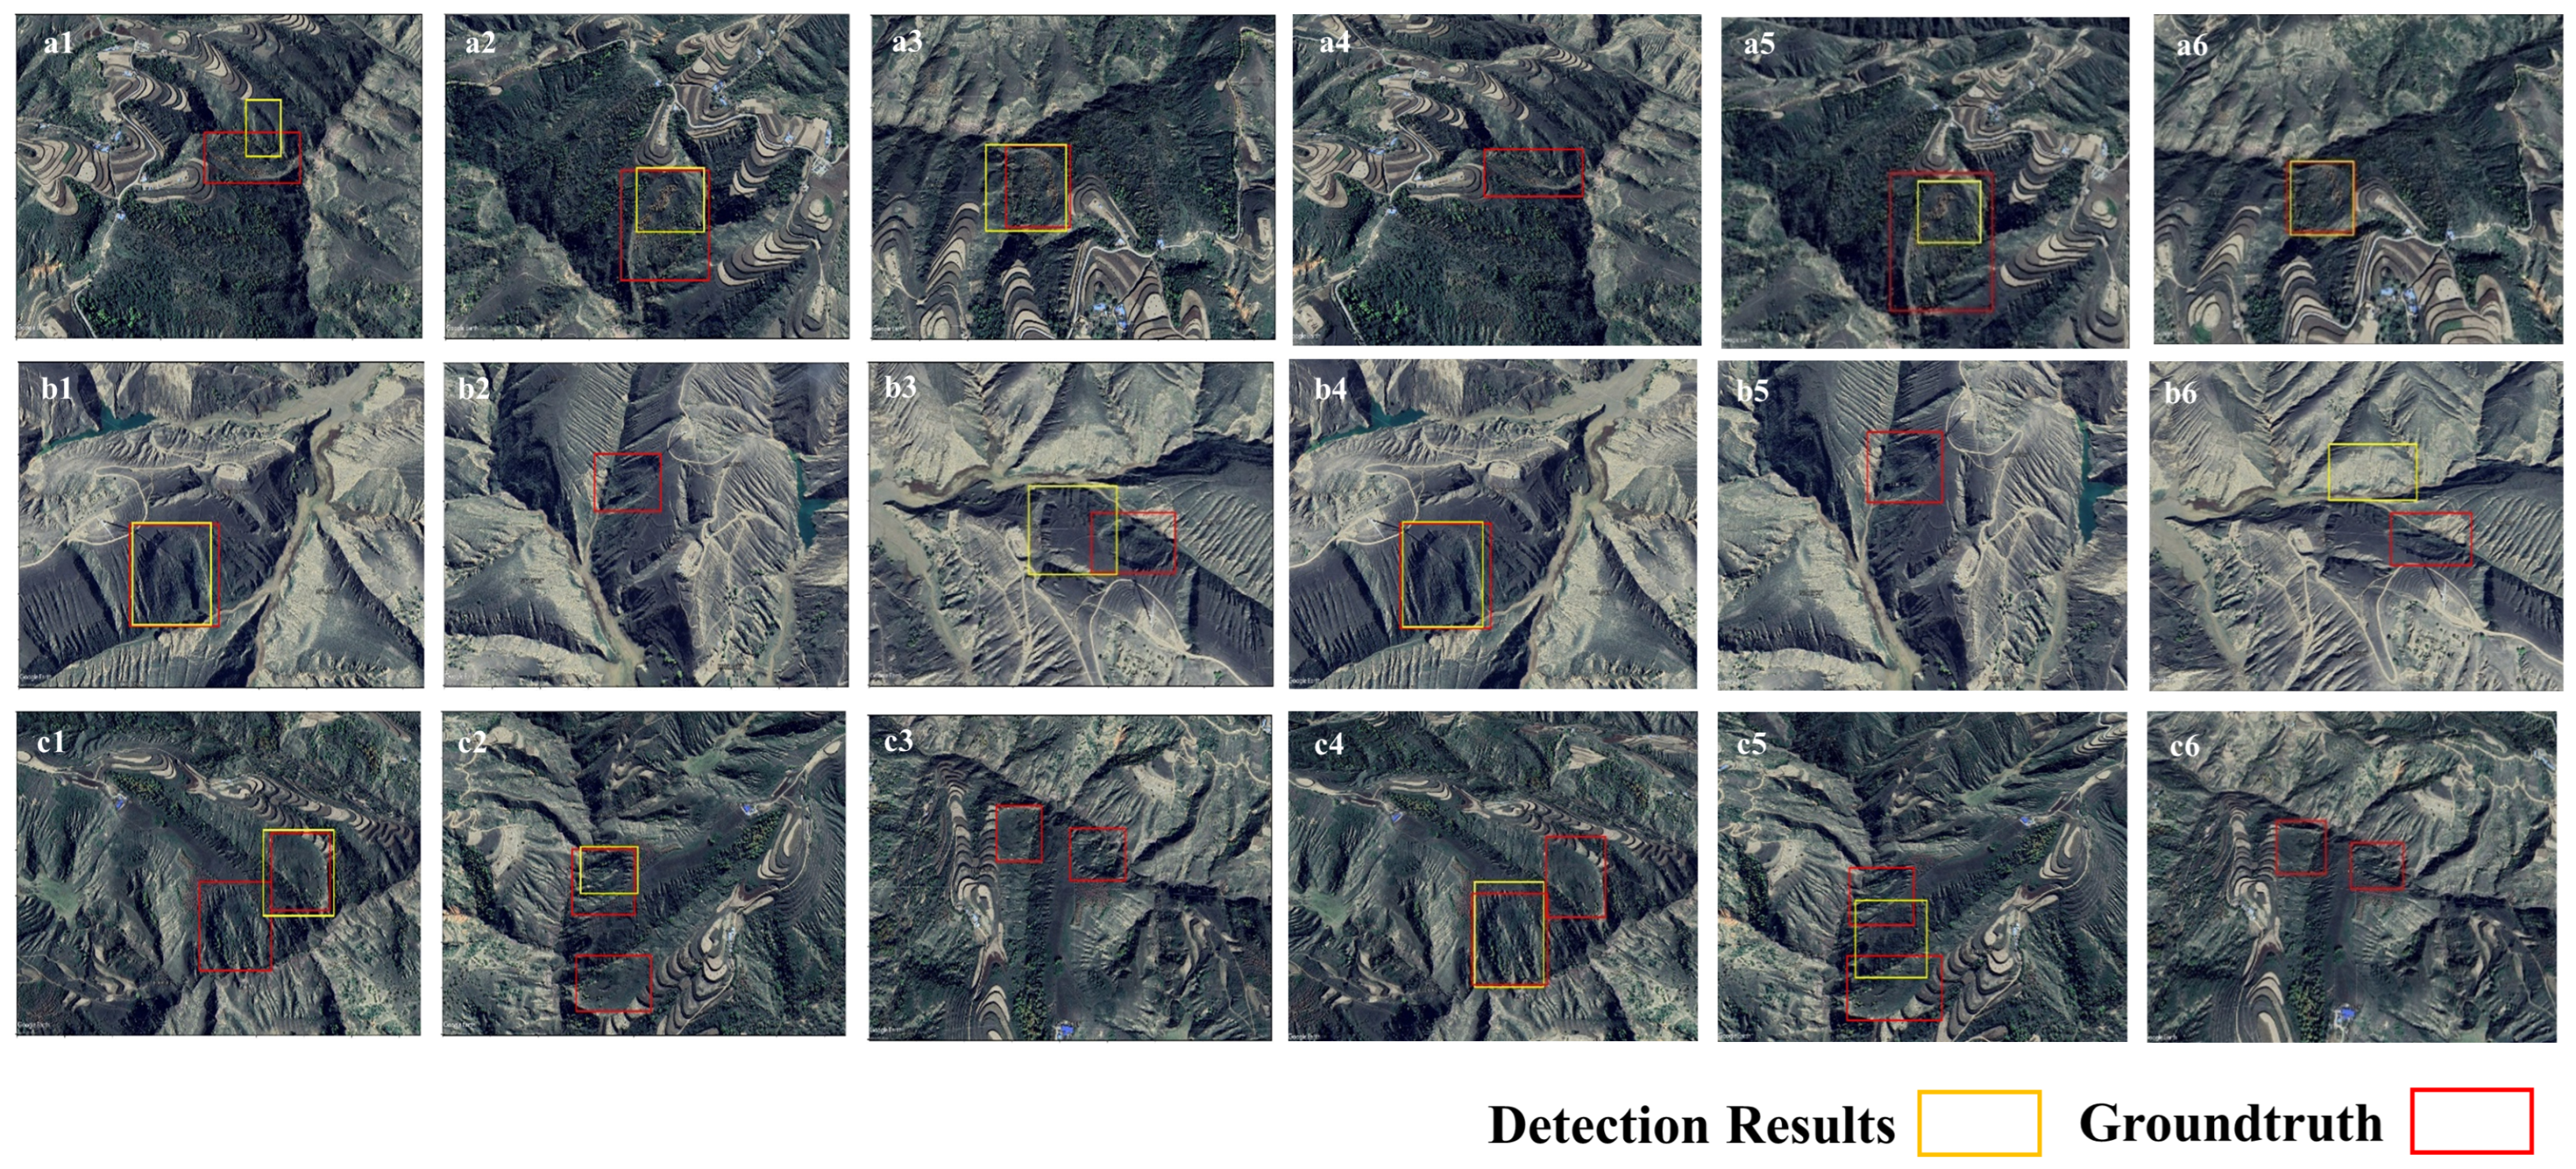
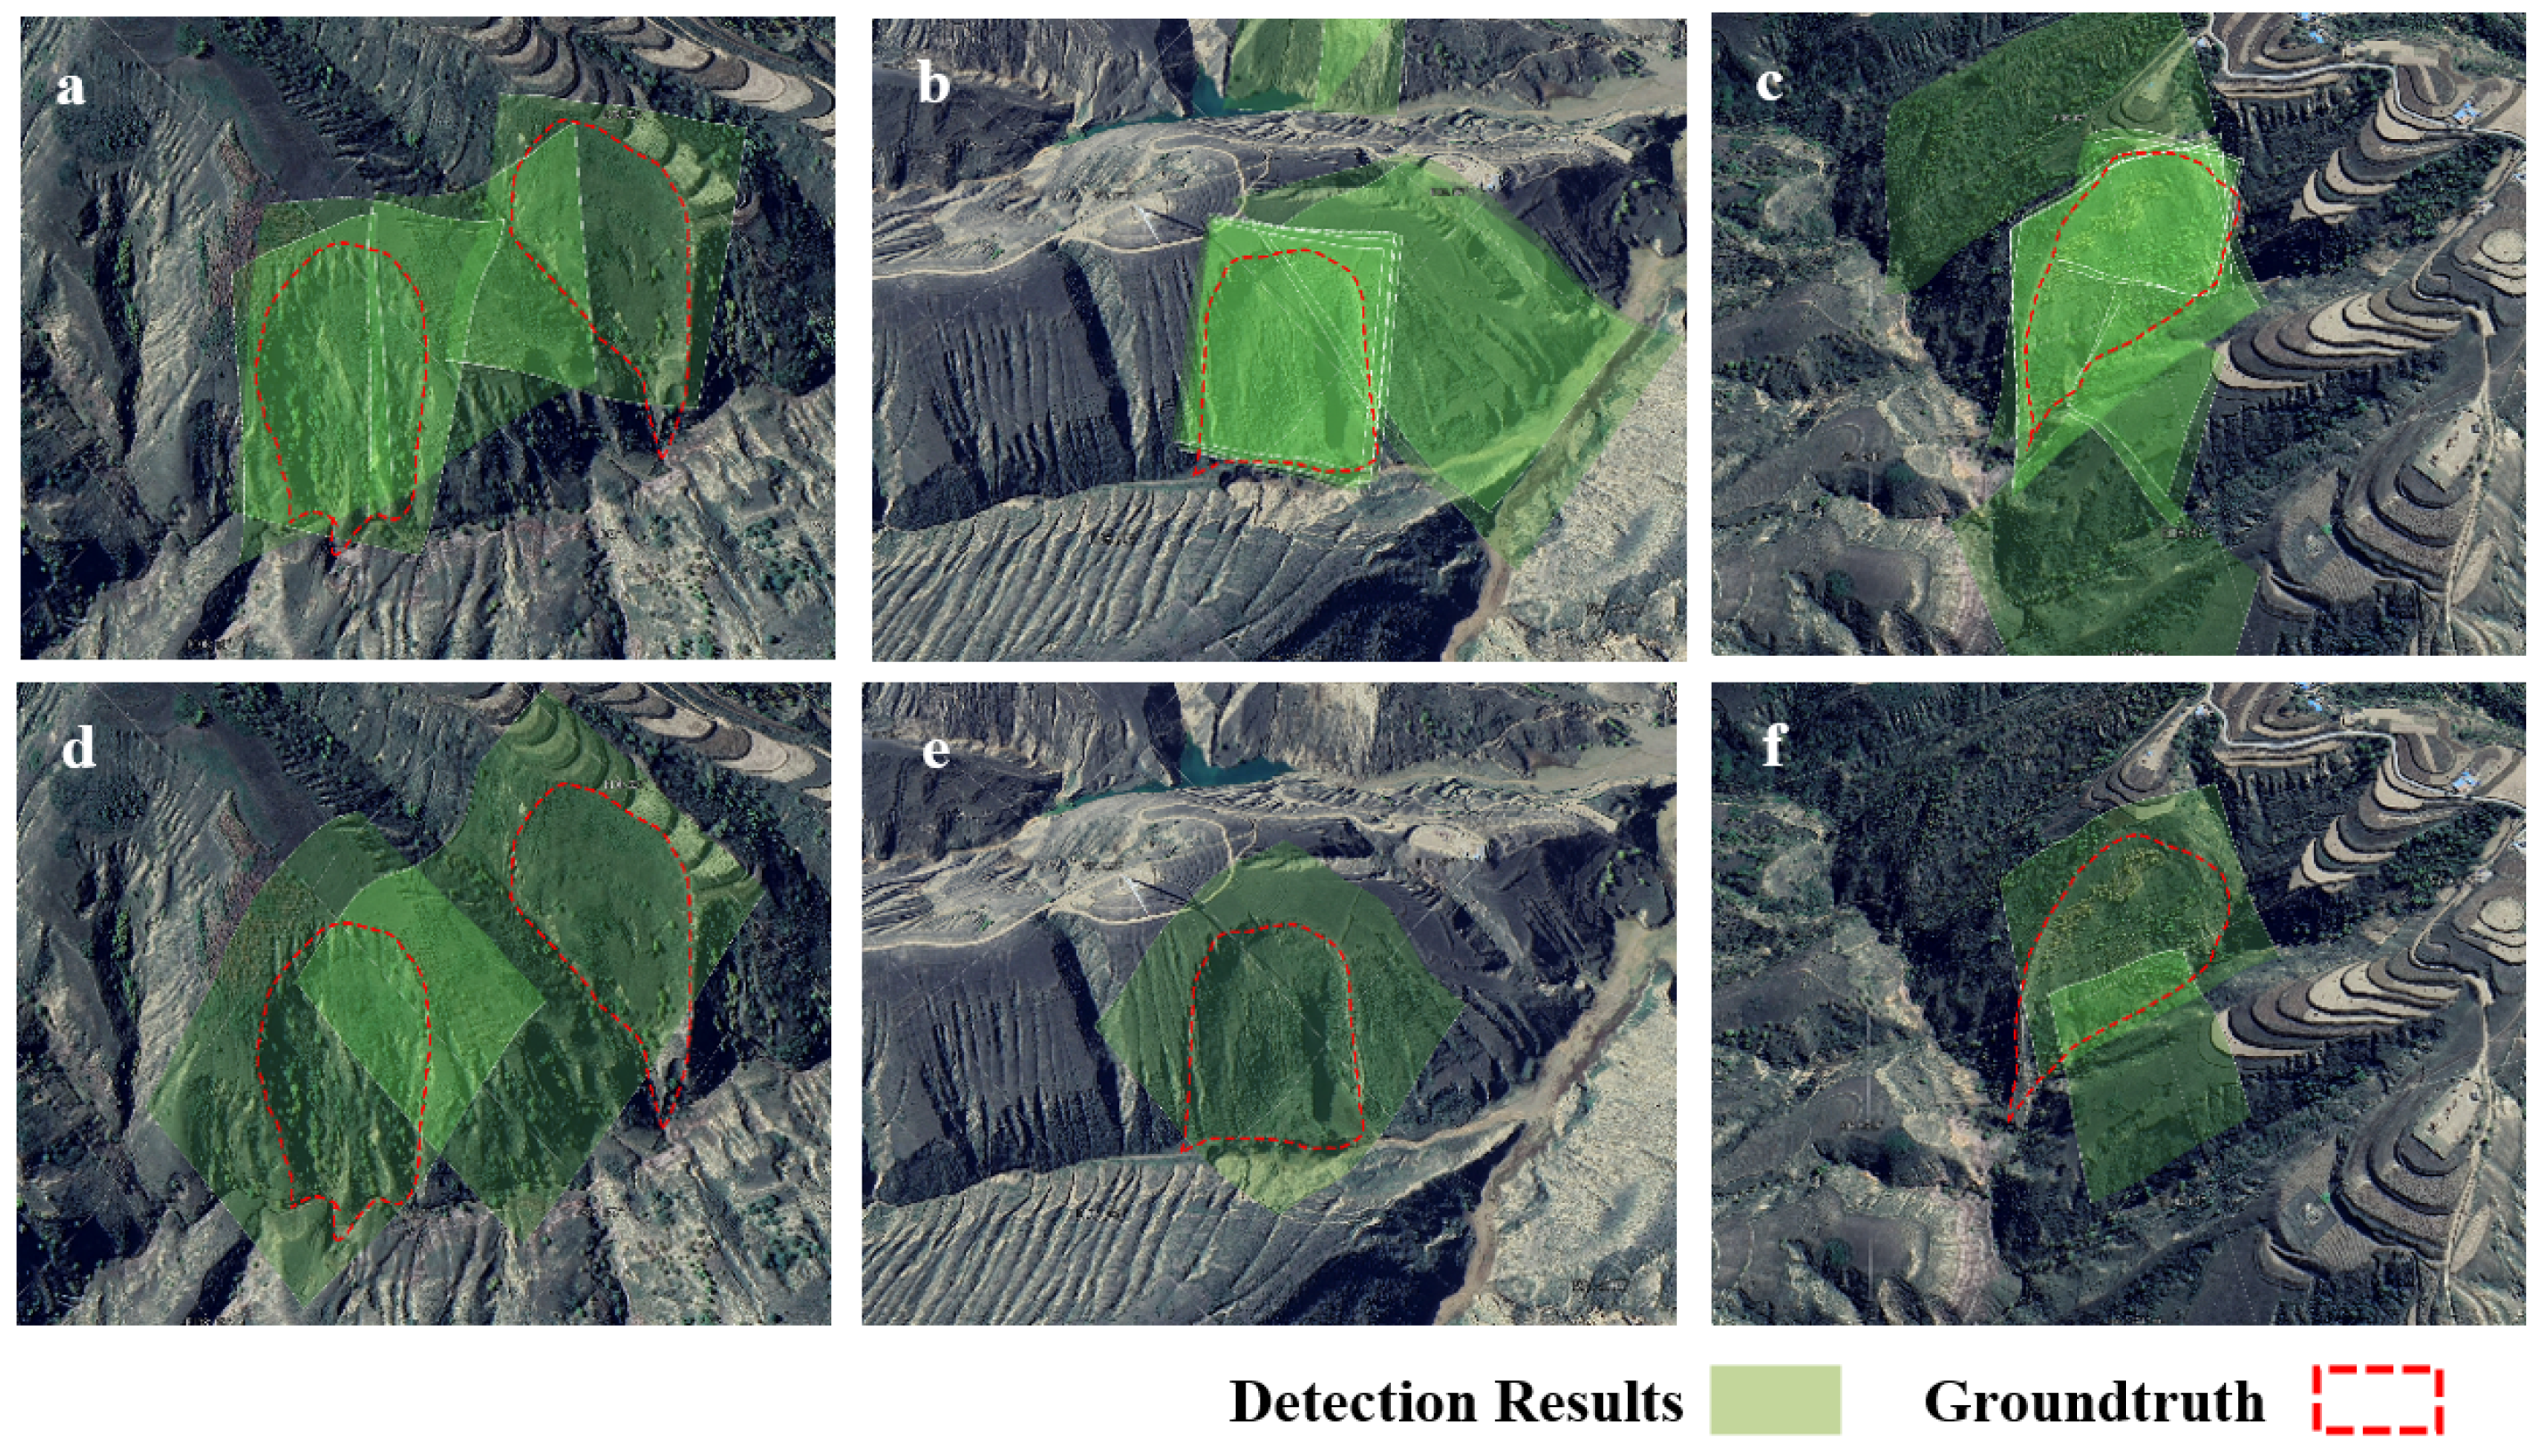
4.3. Verification of HDL-WBF Using Multi-View Images in Jingbian County

In this section, in order to verify the HDL trained on the optimal-view dataset for old loess landslide detection, we used MAC to obtain multi-view data in the Jingbian area for detection. The location of this area is between the latitudes of 36 57 42 N and 38 02 02 N and the longitudes of 108 17 40 E and 109 20 18 E (Figure 15). In this area, we interpreted 43 old loess landslides to verify the performance of the optimal and multi-view (OMV) strategy we proposed, and several detection results from multi-view images are shown in Figure 16.
First, the multi-view images were detected by HDL, which was trained on the optimal-view dataset, and some of the detection results are shown in Figure 16. From the detection results of image a, it can be seen that landslides from different views in a2, a3, a5, a6 have been detected successfully. However, in a1, HDL-WBF produced an incorrect prediction box, and in a6, HDL-WBF missed the detection. In the detection results of image b, the same situation happened in b2, b5 and b6. As for image c, in c1, c2, c4, and c5, two landslides were not detected in one image at the same time, while in c3 and c6, HDL-WBF missed the detection. These results proved that detecting landslides from only one angle of view can lead to false detection and missed detection because optical features may be not obvious. However, if multi-view images are used, optical features from multiple viewpoints are observed, and the detection model is able to obtain better results from images due to the more obvious optical features.
Next, we used Google Earth 3D Scene to convert detection labels from different views to the geographic coordinate system. The WBF algorithm was applied again to remove the redundant prediction boxes, and we obtained the results from multi-view detection. In order to enable the WBF algorithm to fuse detection boxes with geographic coordinates, normalization was first applied to convert latitude and longitude coordinates in the lower-left and upper-right corners of the prediction box to decimals between 0 and 1. After normalization, the x and y coordinates of the upper-left and lower-right corners of the prediction box were input into the WBF to obtain the x and y coordinates of the upper-left and lower-right corners of fused prediction boxes. Afterward, the longitude and latitude coordinates of the upper-left and lower-right corners of the final fused prediction boxes were obtained after inverse normalization. Finally, according to the latitude and longitude coordinates of the upper-left and lower-right corners of each fused prediction box after WBF processing, a KML (keyhole markup language) file containing all of the coordinates of the detection results was generated.
From Figure 17, we can see that although images a, b, and c have incorrect detection results in several views in Figure 16, after conversion into the geographic coordinate system, these detection results can cover ground truth. In d, e, f, we can see that redundant boxes are removed effectively, and false positives have been significantly reduced after WBF. Old loess landslides are detected accurately. All test results are shown in Table 3, and coordinates are shown in Figure 18.
In Table 3, we can see that out of all 43 of the interpreted old loess landslides, 35 were detected and 8 were missed, translating to a recall rate of 81.4%. Compared with the test results from the optimal-view dataset, although the recall rate of HDL-WBF has slightly reduced, it still shows a good detection performance on the multi-view data.

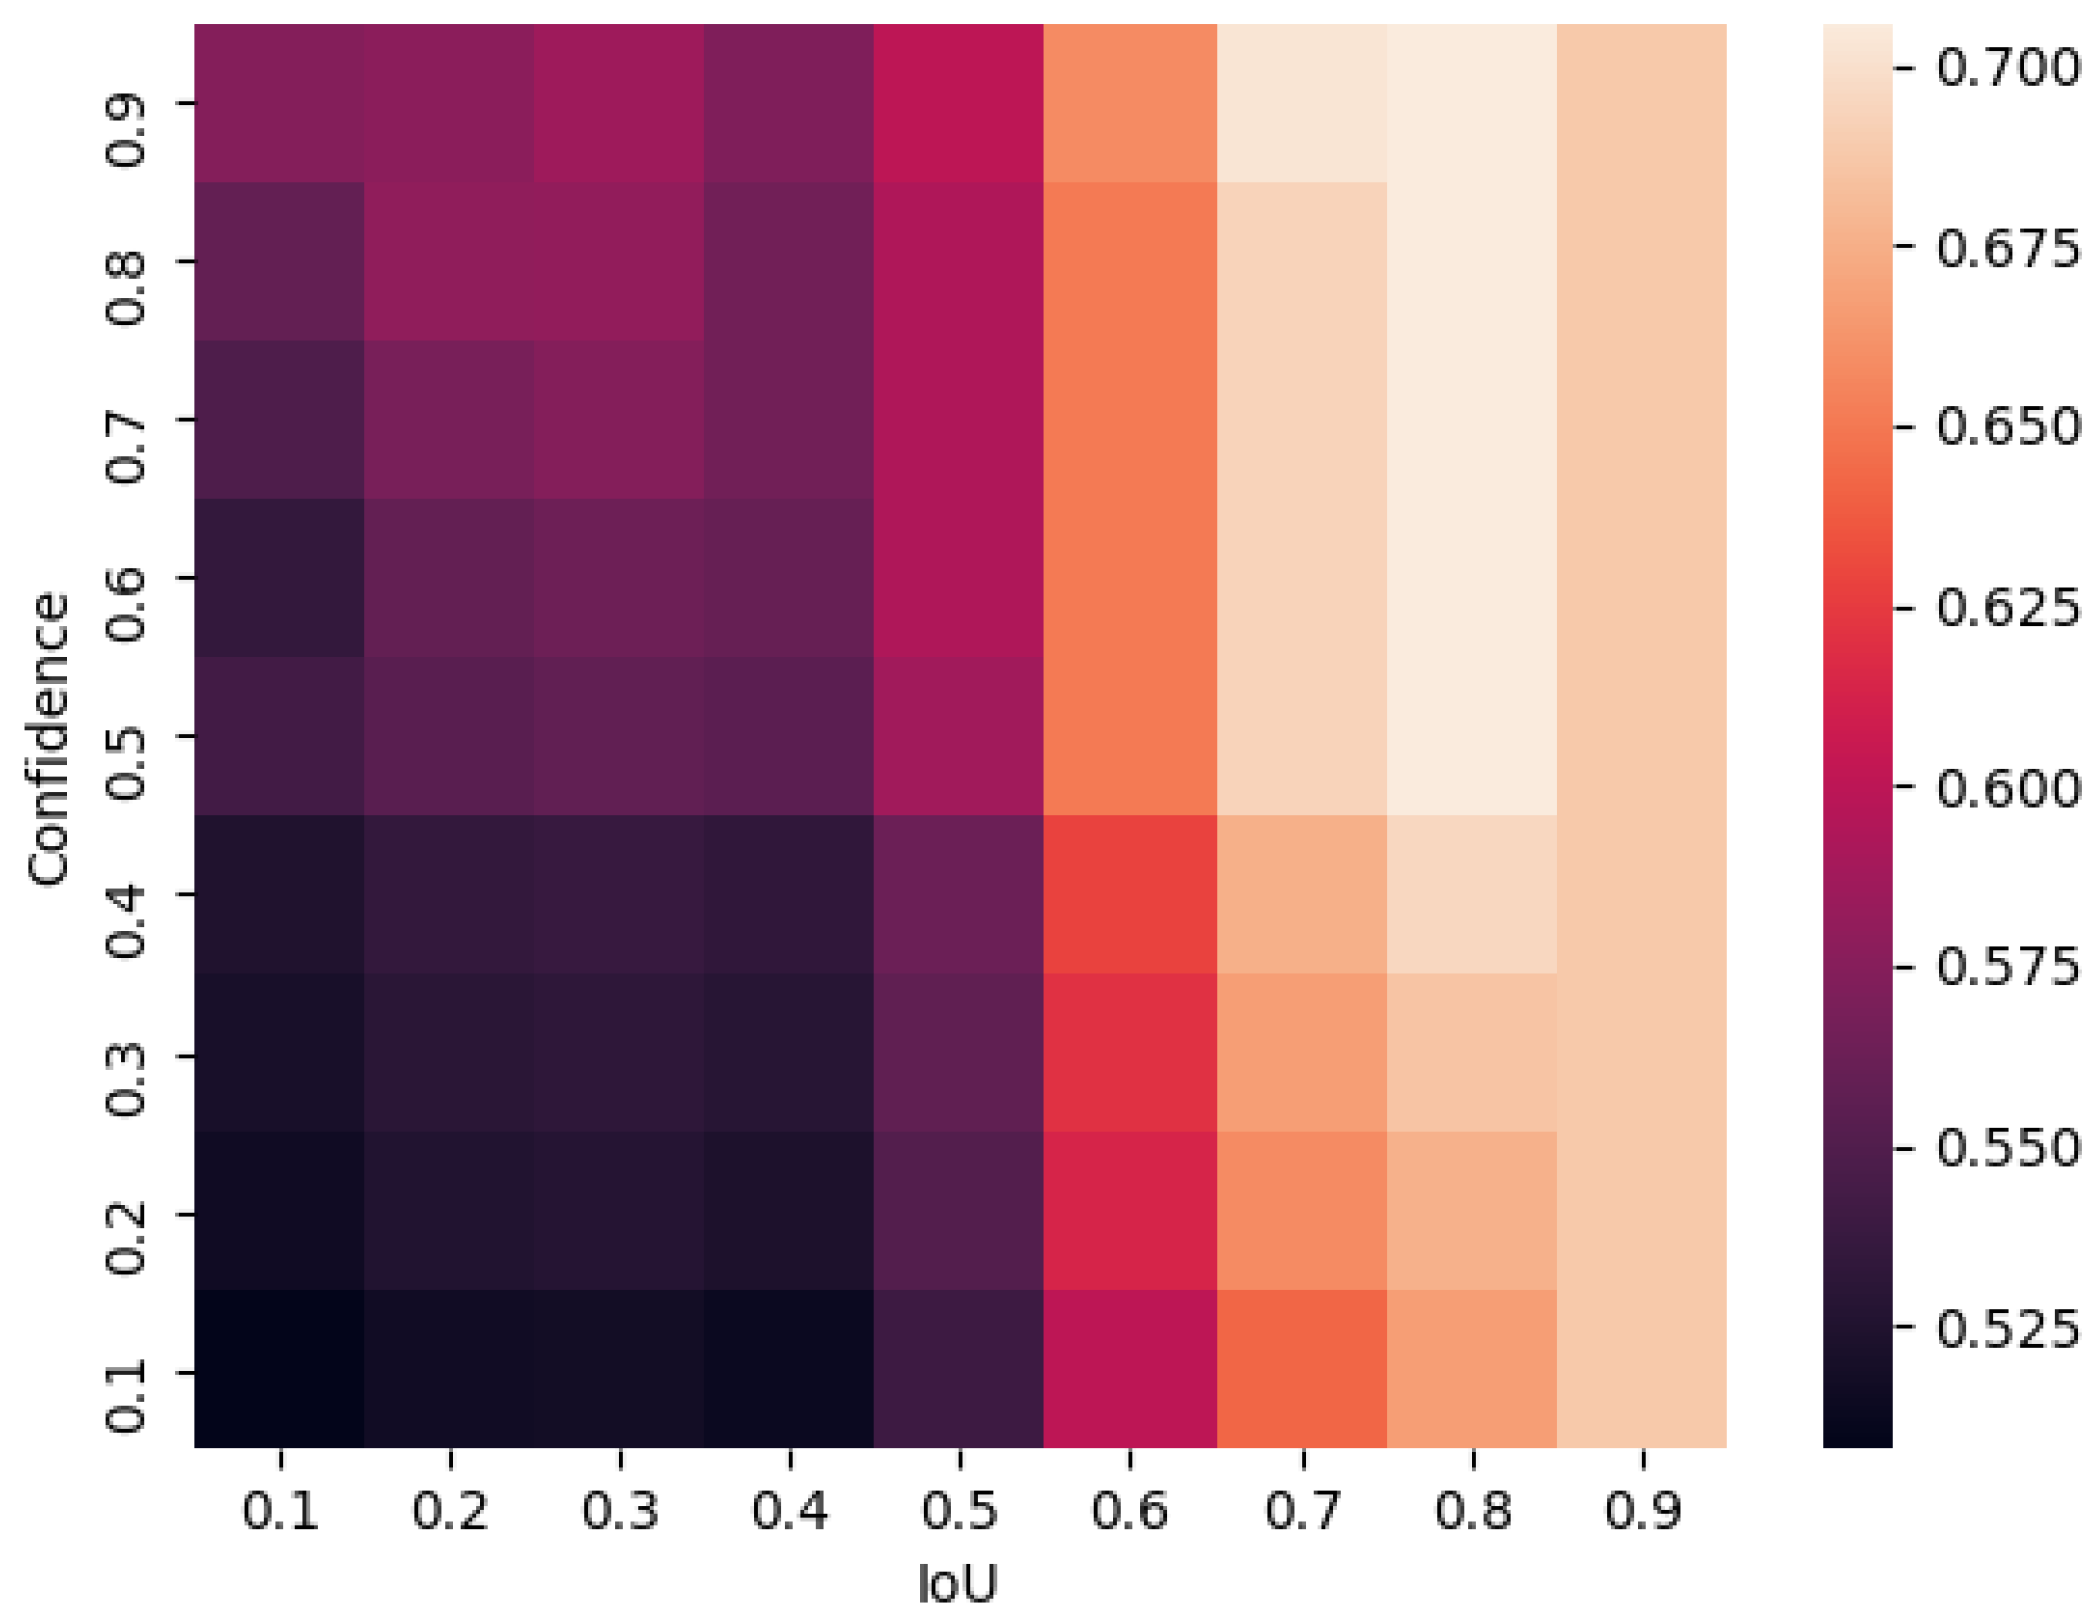
4.4. Experiments of WBF

In this section, we studied the influence of the parameters of WBF on optimal-view dataset. In the WBF algorithm, there are two parameters that affect the final fusion result. One is the IoU threshold. If the IoU of the two boxes is higher than the IoU threshold, then the coordinates of the two boxes will be fused. The other parameter is the confidence threshold. If the confidence score of a box is lower than this threshold, it will be removed.
In the experiment, these two thresholds were divided with intervals of 0.1, and 100 different parameter combinations were be obtained. The F1 score was used to evaluate each combination, and the results are shown in Figure 19.

5. Discussion

Observations from the results of the experiment using the Yan’an optimal-view dataset and orthophoto-view dataset are summarized as follows:
First, it is seen that the performance of DETR is much better than YOLOv5 in both datasets. This is because the DETR model pays more attention to the global features of the image, such as the overall shape of the landslide, the surface deformation around the landslide, and the geomorphological features. However, the CNN-based YOLO model pays more attention to the local features of the image, such as the local optical features of the landslide body, the landslide tongue, and the backwall of the landslide in the image, as well as the local vegetation discontinuity and surface deformation at the edge of the landslide. For old loess landslides, after experiencing wind, sand, and water erosion, the overall shape and geomorphological features of the landslide have not changed too much. Compared with these global features, the local features tend to become less noticeable, which makes old loess landslides more difficult to identify. Second, the performance of the HDL-WBF is better than the DETR model in both datasets. This indicates that the WBF fusion algorithm can fuse the results of DETR and YOLOv5 effectively. In addition, it shows that the results of DETR and YOLOv5 are complementary, that is, these two models pay attention to different features. Third, from the overall results, it is seen that the performance of DETR, YOLOv5, and HDL-WBF on the optimal-view dataset are better than those on the orthophoto-view dataset. This proves that optimal-view images have more abundant optical features compared to the orthophoto images, which can help with the detection of old loess landslides which do not have obvious optical features in orthophoto-view.
From the results of the experiment on multi-view images in Jingbian county, it is observed that although the HDL-WBF model was not trained using multi-view images, it still obtained good detection results. This indicates that the optimal-view and multi-view strategy we proposed is effective at detecting old loess landslides.
Finally, in the WBF experiments, it can be observed that with the increasing of IoU and confidence thresholds, the F1 score grows roughly. This is because, as the IoU threshold and confidence threshold increase, the detected results become more accurate, causing the F1 score to increase. However, we can see that when the confidence threshold is greater than 0.5 and the IoU threshold is greater than 0.8, the F1 score decreases slightly. This occurs because, as the accuracy increases, additional boxes that may be close to the ground truth are discarded, resulting in a decrease in recall rate, which affects F1 score. Therefore, from the perspective of the overall variation of F1 score, the optimal threshold for IoU is 0.8, and the optimal threshold for confidence is in the range of 0.5 to 0.9.
Although the proposed model has achieved good results in testing and detection, it has some drawbacks. First, compared with orthophoto-view images, the process of interpreting optimal-view images still requires more labor. If self-supervised methods are used in interpretation, labor costs will be reduced further. Second, the optimal IoU threshold and confidence threshold of WBF in our method were obtained by analyzing images used in the experiment, not by automatic selection. It may be necessary to conduct experiments to update the optimal thresholds when the proposed method is used in areas such as Sichuan and Yunnan provinces, where landslides have different types of vegetation and sizes.

6. Conclusions

In this paper, an OMV-HDL method was proposed for the detection of old loess landslides using high-resolution remote sensing images. In this method, we proposed an OMV strategy to make learning the features of old landslides easier, and the hybrid HDL-WBF model was proposed to extract various features of old landslides. During the training step, compared with the YOLOv5 model trained on the orthophoto-view dataset, the HDL model trained on the optimal-view dataset demonstrated improvements of about 30% in F1 score and about 40% in AP (mean), respectively. During the detection step, the recall of the HDL-WBF when detecting multi-view images in Jingbian County was 81.4%, which proves that the trained HDL-WBF has strong generalization performance even in a new area. Finally, we discussed the influence of the parameters of the WBF algorithm on the F1 score. In the future, we will add additional high-quality samples to the optimal-view dataset and improve the efficiency of MAC.

Author Contributions

All the authors made significant contributions to this work. Conceptualization, J.X. (Jiangbo Xi) and S.G.; methodology, S.G. and J.X. (Jiangbo Xi); software and experiments, S.G.; validation, Z.Z., J.X. (Jiahuan Xu), D.G., Z.G., J.Y. and Q.W.; writing—original draft preparation, S.G.; writing—review and editing, S.G., J.X. (Jiangbo Xi) and Z.L.; funding acquisition, D.G. and Z.G. All authors have read and agreed to the published version of the manuscript.

Funding

This research was supported in part by the National Key R&D Program of China (2023YFC3008300&2023YFC3008304); in part by Major Program of the National Natural Science Foundation of China (41941019); in part the National Key R&D Program of China (2022YFC3004302); in part by National Natural Science Foundation of China (42371356, 42171348, 41929001); in part by the Shaanxi Province Science and Technology Innovation Team (2021TD-51), the Shaanxi Province Geoscience Big Data and Geohazard Prevention Innovation Team (2022); in part by the Fundamental Research Funds for the Central Universities (300102262202, 300102260301/087, 300102260404/087, 300102262902, 300102269103, 300102269304, 300102269205, 300102262712); in part by the founding from China Aero Geophysical Survey and Remote Sensing Center for Natural Resources (2022267).

Data Availability Statement

The data presented in this study are available on request from the corresponding author.

Conflicts of Interest

The authors declare no conflict of interest.

References

  1. Wang, S.; Peng, J.; Zhuang, J.; Kang, C.; Jia, Z. Underlying mechanisms of the geohazards of macro Loess discontinuities on the Chinese Loess Plateau. Eng. Geol. 2019, 263, 105357. [Google Scholar] [CrossRef]
  2. Cui, Y.; Xu, C.; Xu, S.; Chai, S.; Fu, G.; Bao, P. Small-scale catastrophic landslides in loess areas of China: An example of the March 15, 2019, Zaoling landslide in Shanxi Province. Landslides 2020, 17, 669–676. [Google Scholar] [CrossRef]
  3. Ma, S.; Shao, X.; Xu, C.; Xu, Y. Insight from a Physical-Based Model for the Triggering Mechanism of Loess Landslides Induced by the 2013 Tianshui Heavy Rainfall Event. Water 2023, 15, 443. [Google Scholar] [CrossRef]
  4. Wang, G.; Li, T.; Xing, X.; Zou, Y. Research on loess flow-slides induced by rainfall in July 2013 in Yan’an, NW China. Environ. Earth Sci. 2015, 73, 7933–7944. [Google Scholar] [CrossRef]
  5. Peng, J.; Wang, S.; Wang, Q.; Zhuang, J.; Huang, W.; Zhu, X.; Leng, Y.; Ma, P. Distribution and genetic types of loess landslides in China. J. Asian Earth Sci. 2019, 170, 329–350. [Google Scholar] [CrossRef]
  6. Zhen-jiang, M.; Peng-hui, M.; Jian-bing, P. Characteristics of loess landslides triggered by different factors in the Chinese Loess Plateau. J. Mt. Sci. 2021, 18, 3218–3229. [Google Scholar] [CrossRef]
  7. Zhang, Y.; Ren, S.; Liu, X.; Guo, C.; Li, J.; Bi, J.; Ran, L. Reactivation mechanism of old landslide triggered by coupling of fault creep and water infiltration: A case study from the east Tibetan Plateau. Bull. Eng. Geol. Environ. 2023, 82, 291. [Google Scholar] [CrossRef]
  8. Guanglao, H. The Historical Transformation of the Landsliding Causes and Factors in the Border Slopes of Loessial Highland in the Baoji-Changxing Area. J. Chang. Univ. Earth Sci. Ed. 1986, 8, 23–27. [Google Scholar]
  9. Hu, S.; Qiu, H.; Wang, N.; Wang, X.; Ma, S.; Yang, D.; Wei, N.; Liu, Z.; Shen, Y.; Cao, M.; et al. Movement process, geomorphological changes, and influencing factors of a reactivated loess landslide on the right bank of the middle of the Yellow River, China. Landslides 2022, 19, 1265–1295. [Google Scholar] [CrossRef]
  10. Sun, X.; Zeng, P.; Li, T.; Zhang, L.; Jimenez, R.; Dong, X.; Xu, Q. A Bayesian approach to develop simple run-out distance models: Loess landslides in Heifangtai Terrace, Gansu Province, China. Landslides 2023, 20, 77–95. [Google Scholar] [CrossRef]
  11. Gumma, M.K.; Thenkabail, P.S.; Panjala, P.; Teluguntla, P.; Yamano, T.; Mohammed, I. Multiple agricultural cropland products of South Asia developed using Landsat-8 30 m and MODIS 250 m data using machine learning on the Google Earth Engine (GEE) cloud and spectral matching techniques (SMTs) in support of food and water security. Giscience Remote Sens. 2022, 59, 1048–1077. [Google Scholar] [CrossRef]
  12. Hou, Y.; Wu, Y.; Wu, L.; Pei, L.; Zhang, Z.; Ding, D.; Wang, G.; Li, Z.; Zhang, Y. Identifying Crop Growth Stages from Solar-Induced Chlorophyll Fluorescence Data in Maize and Winter Wheat from Ground and Satellite Measurements. Remote Sens. 2023, 15, 5689. [Google Scholar] [CrossRef]
  13. Du, Y.; Jiang, J.; Liu, Z.; Pan, Y. Combining a Crop Growth Model with CNN for Underground Natural Gas Leakage Detection Using Hyperspectral Imagery. IEEE J. Sel. Top. Appl. Earth Obs. Remote Sens. 2022, 15, 1846–1856. [Google Scholar] [CrossRef]
  14. Tang, X.; Zang, Z.; Lin, H.; Wang, X.; Wen, Z. Using a Vegetation Index to Monitor the Death Process of Chinese Fir Based on Hyperspectral Data. Forests 2023, 14, 2444. [Google Scholar] [CrossRef]
  15. Zhu, Y.; Zhou, J.; Liu, M.; Man, W.; Chen, L. Annually Spatial Pattern Dynamics of Forest Types under a Rapid Expansion of Impervious Surfaces: A Case Study of Hangzhou City. Forests 2024, 15, 44. [Google Scholar] [CrossRef]
  16. Gao, Y.; Guan, J.; Zhang, F.; Wang, X.; Long, Z. Attention-Unet-Based Near-Real-Time Precipitation Estimation from Fengyun-4A Satellite Imageries. Remote Sens. 2022, 14, 2925. [Google Scholar] [CrossRef]
  17. Tichý, O.; Eckhardt, S.; Balkanski, Y.; Hauglustaine, D.; Evangeliou, N. Decreasing trends of ammonia emissions over Europe seen from remote sensing and inverse modelling. Atmos. Chem. Phys. 2023, 23, 15235–15252. [Google Scholar] [CrossRef]
  18. Tan, X.; Deng, M.; Chen, K.; Shi, Y.; Zhao, B.; Liu, Q. A spatial hierarchical learning module based cellular automata model for simulating urban expansion: Case studies of three Chinese urban areas. Giscience Remote Sens. 2024, 61, 2290352. [Google Scholar] [CrossRef]
  19. Chen, H.; Qi, Z.; Shi, Z. Remote Sensing Image Change Detection with Transformers. IEEE Trans. Geosci. Remote Sens. 2022, 60, 5607514. [Google Scholar] [CrossRef]
  20. Roman, A.; Navarro, G.; Caballero, I.; Tovar-Sanchez, A. High-spatial resolution UAV multispectral data complementing satellite imagery to characterize a chinstrap penguin colony ecosystem on deception island (Antarctica). Giscience Remote Sens. 2022, 59, 1159–1176. [Google Scholar] [CrossRef]
  21. He, L.; Liao, K.; Li, Y.; Li, B.; Zhang, J.; Wang, Y.; Lu, L.; Jian, S.; Qin, R.; Fu, X. Extraction of Tobacco Planting Information Based on UAV High-Resolution Remote Sensing Images. Remote Sens. 2024, 16, 359. [Google Scholar] [CrossRef]
  22. Han, Z.; Li, Y.; Du, Y.; Wang, W.; Chen, G. Noncontact detection of earthquake-induced landslides by an enhanced image binarization method incorporating with Monte-Carlo simulation. Geomat. Nat. Hazards Risk 2019, 10, 219–241. [Google Scholar] [CrossRef]
  23. Fiorucci, F.; Ardizzone, F.; Mondini, A.C.; Viero, A.; Guzzetti, F. Visual interpretation of stereoscopic NDVI satellite images to map rainfall induced landslides. Landslides 2019, 16, 165–174. [Google Scholar] [CrossRef]
  24. Su, Z.; Chow, J.K.; Tan, P.S.; Wu, J.; Ho, Y.K.; Wang, Y.H. Deep convolutional neural network-based pixel-wise landslide inventory mapping. Landslides 2021, 18, 1421–1443. [Google Scholar] [CrossRef]
  25. Sato, H.P.; Hasegawa, H.; Fujiwara, S.; Tobita, M.; Koarai, M.; Une, H.; Iwahashi, J. Interpretation of landslide distribution triggered by the 2005 Northern Pakistan earthquake using SPOT 5 imagery. Landslides 2007, 4, 113–122. [Google Scholar] [CrossRef]
  26. Bui, D.T.; Shahabi, H.; Shirzadi, A.; Chapi, K.; Alizadeh, M.; Chen, W.; Mohammadi, A.; Bin Ahmad, B.; Panahi, M.; Hong, H.; et al. Landslide Detection and Susceptibility Mapping by AIRSAR Data Using Support Vector Machine and Index of Entropy Models in Cameron Highlands, Malaysia. Remote Sens. 2018, 10, 1527. [Google Scholar] [CrossRef]
  27. Dou, J.; Yunus, A.P.; Bui, D.T.; Merghadi, A.; Sahana, M.; Zhu, Z.; Chen, C.W.; Han, Z.; Pham, B.T. Improved landslide assessment using support vector machine with bagging, boosting, and stacking ensemble machine learning framework in a mountainous watershed, Japan. Landslides 2020, 17, 641–658. [Google Scholar] [CrossRef]
  28. Tavakkoli Piralilou, S.; Shahabi, H.; Jarihani, B.; Ghorbanzadeh, O.; Blaschke, T.; Gholamnia, K.; Meena, S.R.; Aryal, J. Landslide Detection Using Multi-Scale Image Segmentation and Different Machine Learning Models in the Higher Himalayas. Remote Sens. 2019, 11, 2575. [Google Scholar] [CrossRef]
  29. Stumpf, A.; Kerle, N. Object-oriented mapping of landslides using Random Forests. Remote Sens. Environ. Interdiscip. J. 2011, 115, 2564–2577. [Google Scholar] [CrossRef]
  30. Xi, J.; Ersoy, O.K.; Cong, M.; Zhao, C.; Qu, W.; Wu, T. Wide and Deep Fourier Neural Network for Hyperspectral Remote Sensing Image Classification. Remote Sens. 2022, 14, 2931. [Google Scholar] [CrossRef]
  31. Xi, J.; Cong, M.; Ersoy, O.K.; Zou, W.; Zhao, C.; Li, Z.; Gu, J.; Wu, T. Dynamic Wide and Deep Neural Network for Hyperspectral Image Classification. Remote Sens. 2021, 13, 2575. [Google Scholar] [CrossRef]
  32. Xi, J.; Ersoy, O.K.; Fang, J.; Wu, T.; Wei, X.; Zhao, C. Parallel Multistage Wide Neural Network. IEEE Trans. Neural Netw. Learn. Syst. 2023, 34, 4019–4032. [Google Scholar] [CrossRef] [PubMed]
  33. Jiang, W.; Xi, J.; Li, Z.; Ding, M.; Yang, L.; Xie, D. Landslide Detection and Segmentation Using Mask R-CNN with Simulated Hard Samples. Geomat. Inf. Sci. Wuhan Univ. 2023, 48, 1931–1942. [Google Scholar] [CrossRef]
  34. Jiang, W.; Xi, J.; Li, Z.; Zang, M.; Chen, B.; Zhang, C.; Liu, Z.; Gao, S.; Zhu, W. Deep Learning for Landslide Detection and Segmentation in High-Resolution Optical Images along the Sichuan-Tibet Transportation Corridor. Remote Sens. 2022, 14, 5490. [Google Scholar] [CrossRef]
  35. Chen, X.; Zhao, C.; Lu, Z.; Xi, J. Landslide Inventory Mapping Based on Independent Component Analysis and UNet3+: A Case of Jiuzhaigou, China. IEEE J. Sel. Top. Appl. Earth Obs. Remote Sens. 2024, 17, 2213–2223. [Google Scholar] [CrossRef]
  36. Chen, X.; Zhao, C.; Xi, J.; Lu, Z.; Ji, S.; Chen, L. Deep Learning Method of Landslide Inventory Map with Imbalanced Samples in Optical Remote Sensing. Remote Sens. 2022, 14, 5517. [Google Scholar] [CrossRef]
  37. Habumugisha, J.M.; Chen, N.; Rahman, M.; Islam, M.M.; Ahmad, H.; Elbeltagi, A.; Sharma, G.; Liza, S.N.; Dewan, A. Landslide Susceptibility Mapping with Deep Learning Algorithms. Sustainability 2022, 14, 1734. [Google Scholar] [CrossRef]
  38. Ye, C.; Li, Y.; Cui, P.; Liang, L.; Pirasteh, S.; Marcato, J., Jr.; Goncalves, W.N.; Li, J. Landslide Detection of Hyperspectral Remote Sensing Data Based on Deep Learning with Constrains. IEEE J. Sel. Top. Appl. Earth Obs. Remote Sens. 2019, 12, 5047–5060. [Google Scholar] [CrossRef]
  39. Ji, S.; Yu, D.; Shen, C.; Li, W.; Xu, Q. Landslide detection from an open satellite imagery and digital elevation model dataset using attention boosted convolutional neural networks. Landslides 2020, 17, 1337–1352. [Google Scholar] [CrossRef]
  40. Li, H.; He, Y.; Xu, Q.; Deng, J.; Li, W.; Wei, Y. Detection and segmentation of loess landslides via satellite images: A two-phase framework. Landslides 2022, 19, 673–686. [Google Scholar] [CrossRef]
  41. Wang, H.; Liu, J.; Zeng, S.; Xiao, K.; Yang, D.; Yao, G.; Yang, R. A novel landslide identification method for multi-scale and complex background region based on multi-model fusion: YOLO + U-Net. Landslides 2024, 21, 901–917. [Google Scholar] [CrossRef]
  42. Vaswani, A.; Shazeer, N.; Parmar, N.; Uszkoreit, J.; Jones, L.; Gomez, A.N.; Kaiser, L.; Polosukhin, I. Attention Is All You Need. arXiv 2017, arXiv:1706.03762. Available online: http://arxiv.org/abs/1706.03762 (accessed on 12 June 2017).
  43. Dosovitskiy, A.; Beyer, L.; Kolesnikov, A.; Weissenborn, D.; Zhai, X.; Unterthiner, T.; Dehghani, M.; Minderer, M.; Heigold, G.; Gelly, S.; et al. An Image is Worth 16x16 Words: Transformers for Image Recognition at Scale. arXiv 2020, arXiv:2010.11929. Available online: http://arxiv.org/abs/2010.11929 (accessed on 22 October 2020).
  44. Tang, X.; Tu, Z.; Wang, Y.; Liu, M.; Li, D.; Fan, X. Automatic Detection of Coseismic Landslides Using a New Transformer Method. Remote Sens. 2022, 14, 2884. [Google Scholar] [CrossRef]
  45. Lv, P.; Ma, L.; Li, Q.; Du, F. ShapeFormer: A Shape-Enhanced Vision Transformer Model for Optical Remote Sensing Image Landslide Detection. IEEE J. Sel. Top. Appl. Earth Obs. Remote Sens. 2023, 16, 2681–2689. [Google Scholar] [CrossRef]
  46. Xu, Y.; Allen, M.B.; Zhang, W.; Li, W.; He, H. Landslide characteristics in the Loess Plateau, northern China. Geomorphology 2020, 359, 107150. [Google Scholar] [CrossRef]
  47. Gool, L.V.; Neubeck, A. Efficient Non-Maximum Suppression. In Proceedings of the 2006 18th International Conference on Pattern Recognition, Los Alamitos, CA, USA, 20–24 August 2006; Volume 3, pp. 850–855. [Google Scholar] [CrossRef]
  48. Bodla, N.; Singh, B.; Chellappa, R.; Davis, L.S. Soft-NMS—Improving Object Detection with One Line of Code. In Proceedings of the 2017 IEEE International Conference on Computer Vision (ICCV), Venice, Italy, 22–29 October2017. [Google Scholar] [CrossRef]
  49. Solovyev, R.; Wang, W.; Gabruseva, T. Weighted boxes fusion: Ensembling boxes from different object detection models. Image Vis. Comput. 2021, 107, 104117. [Google Scholar] [CrossRef]
Figure 1. (a) Orthophoto-view image and (bf) multi-view images of old landslides. Red—old loess landslide in orthophoto-view. Cyan—old loess landslides in different view.
Remotesensing 16 01362 g001
Figure 2. Overview of the study area. (a) The location of the study area in Shaanxi Province. (b) Detail of the study area.
Remotesensing 16 01362 g002
Figure 3. Global and local features of old loess landslides: (a) double groove with same source (global feature); (b) armchair-shape of landslides (global feature); and radial cracks on the slope, main scrap on top, and discontinuities of vegetation (local features).
Remotesensing 16 01362 g003
Figure 4. The study area of the optimal-view dataset. (a) The location of the study area in Yan’an City. (b) Detail of the optimal-view dataset in the study area.
Remotesensing 16 01362 g004
Figure 5. Misinterpreted samples: (a1,a2) artificial earthwork misinterpreted as old landslide; (b1,b2) erosion misinterpreted as old landslide.
Remotesensing 16 01362 g005
Figure 6. Samples of old landslides in the optimal-view dataset. Red box—groundtruth.
Remotesensing 16 01362 g006
Figure 7. Illustration of five parameters: (a) heading (b) longitude, latitude, range, and tilt.
Remotesensing 16 01362 g007
Figure 8. Multi-view images of an old landslide: (a) heading—0, tilt—45; (b) heading—120, tilt—45; (c) heading—240, tilt—45; (d) heading—0, tilt—30; (e) heading—120, tilt—30; (f) heading—240, tilt—30.
Remotesensing 16 01362 g008
Figure 9. Flowchart of the OMV-HDL method. During the training step, the hybrid deep learning model (HDL) was trained on the optimal-view dataset. During the detection step, the trained hybrid deep learning model was used with weighted boxes fusion (HDL-WBF) to detect old loess landslides in multi-view images.
Remotesensing 16 01362 g009
Figure 10. Optimal-view and multi-view strategy. In this strategy, optimal-view images are used for training, and multi-view images are used for detection.
Remotesensing 16 01362 g010
Figure 11. (a) Hybrid deep learning model with weighted boxes fusion (HDL-WBF) used to detect multi-view images in parallel. (b) Structure of the HDL-WBF. (c) Structure of YOLOv5.
Remotesensing 16 01362 g011
Figure 12. Results of the NMS/soft-NMS and WBF algorithms. Blue—different models’ predictions. Red—ground truth.
Remotesensing 16 01362 g012
Figure 13. Test results of different models in orthophoto-view images. For each column, (a1d1) are the ground truths of four old loess landslides, and (a2d2), (a3d3), and (a4d4) are the test results of YOLO, DETR, and HDL-WBF, respectively.
Remotesensing 16 01362 g013
Figure 14. Test results of different models in optimal-view images. For each column, (a1d1) are the ground truths of four old loess landslides, and (a2d2), (a3d3), and (a4d4) are the test results of YOLO, DETR, and HDL-WBF, respectively.
Remotesensing 16 01362 g014
Figure 15. The study area for multi-view images. (a) The location of the study area in Yan’an city. (b) The distribution of old loess landslides in the study area.
Remotesensing 16 01362 g015
Figure 16. Detection results from multi-view images of three old landslides. (a1a6), (b1b6), and (c1c6) were the results for the first, the second, and the third old landslides, respectively.
Remotesensing 16 01362 g016
Figure 17. Detection results from multi-view images in Google Earth Scene: (ac) before WBF, (df) after WBF.
Remotesensing 16 01362 g017
Figure 18. Distribution of detected and missed old loess landslides. Red triangle—detected old loess landslides. Green triangle—missed old loess landslides.
Remotesensing 16 01362 g018
Figure 19. Heatmap of F1 score. The decimal in the horizontal axis represents the IoU threshold, and the confidence threshold is shown in the vertical axis. The different colors in the scale bar represent different F1 score values in the heatmap.
Remotesensing 16 01362 g019
Table 1. Heading and tilt settings of multi-view images.
Heading120°120°240°240°
Tilt30°45°30°45°30°45°
Table 2. Test results of different models on the optimal-view dataset and the orthophoto-view dataset.
ModelPrecisionRecallF1 Score AP IoU = 0.50 AP IoU = 0.70 AP IoU = 0.90 AP (Mean)
YOLOv5 (OR)0.7540.5330.6250.5640.5370.4150.505
DETR (OR)0.8140.8460.8300.8790.8770.7100.822
HDL-WBF (OR)0.8260.9340.8770.9360.9370.7580.877
YOLOv5 (OP)0.7690.5880.6660.6390.5950.6750.636
DETR (OP)0.8650.8890.8770.9480.9280.9010.926
HDL-WBF (OP)0.8571.00.9230.9460.9320.9320.937
Table 3. Detection results.
TOTALDetected (TP)Missed (FN)Recall
4335881.4%
Disclaimer/Publisher’s Note: The statements, opinions and data contained in all publications are solely those of the individual author(s) and contributor(s) and not of MDPI and/or the editor(s). MDPI and/or the editor(s) disclaim responsibility for any injury to people or property resulting from any ideas, methods, instructions or products referred to in the content.

