Article

A Google Earth Engine Platform to Integrate Multi-Satellite and Citizen Science Data for the Monitoring of River Ice Dynamics

by
Mohamed Abdelkader
1,*,
Jorge Humberto Bravo Mendez
1,
Marouane Temimi
1,
Dana R. N. Brown
2,
Katie V. Spellman
2,
Christopher D. Arp
3,
Allen Bondurant
3 and
Holli Kohl
4
1
Department of Civil, Environmental and Ocean Engineering (CEOE), Stevens Institute of Technology, Hoboken, NJ 07030, USA
2
International Arctic Research Center, University of Alaska Fairbanks, Fairbanks, AK 99775, USA
3
Water and Environmental Research Center, Institute of Northern Engineering, University of Alaska Fairbanks, Fairbanks, AK 99775, USA
4
NASA Goddard Space Flight Center and Science Systems and Applications, Inc., Greenbelt, MD 20771, USA
*
Author to whom correspondence should be addressed.
Remote Sens. 2024, 16(8), 1368; https://doi.org/10.3390/rs16081368
Submission received: 23 February 2024 / Revised: 2 April 2024 / Accepted: 5 April 2024 / Published: 12 April 2024
(This article belongs to the Special Issue New Insights in Remote Sensing of Snow and Glaciers)

Abstract

:
This study introduces a new automated system that blends multi-satellite information and citizen science data for reliable and timely observations of lake and river ice in under-observed northern regions. The system leverages the Google Earth Engine resources to facilitate the analysis and visualization of ice conditions. The adopted approach utilizes a combination of moderate and high-resolution optical data, along with radar observations. The results demonstrate the system’s capability to accurately detect and monitor river ice, particularly during key periods, such as the freeze-up and the breakup. The integration citizen science data showed added values in the validation of remote sensing products, as well as filling gaps whenever satellite observations cannot be collected due to cloud obstruction. Moreover, it was shown that citizen science data can be converted to valuable quantitative information, such as the case of ice thickness, which is very useful when combined with ice extent derived from remote sensing. In this study, citizen science data were employed for the quantitative assessment of the remote sensing product. Obtained results showed a good agreement between the product and observed river status, with a Critical Success Index of 0.82. Notably, the system has shown effectiveness in capturing the spatial and temporal evolution of snow and ice conditions, as evidenced by its application in analyzing specific ice jam events in 2023. The study concludes that the developed system marks a significant advancement in river ice monitoring, combining technological innovation with community engagement.

1. Introduction

The monitoring of river ice conditions, particularly in northern regions like Alaska, is of paramount importance due to the direct impact of ice dynamics on local ecosystems, transportation, and safety [1,2,3,4,5,6]. Alaska’s expansive and remote landscapes present unique challenges in acquiring consistent and reliable observational data. In situ measurements of ice conditions are often spatially and temporarily limited by geographical inaccessibility and logistical constraints, emphasizing the need for alternative monitoring strategies [4,7].
Emerging cloud-based solutions have revolutionized the monitoring of weather and climate hazards, offering robust platforms for data processing and analysis. The Google Earth Engine (GEE), launched in 2010, epitomizes this advancement by providing a web-based platform that facilitates the manipulation and analysis of large-scale geographical datasets [8]. GEE’s cloud computing infrastructure enables real-time access to a vast catalogue of satellite imagery and geographic data, significantly enhancing the capacity for environmental monitoring and research. The platform’s ability to provide high-resolution satellite images without the need for local downloading streamlines the process of studying and comparing different temporal scenarios, thereby offering valuable insights into environmental transformations [9]. For instance, applying the GEE for the detection of the transformation of open water into ice and vice versa in lakes and rivers could provide substantial benefits to northern communities. This specific application illustrates the practical utility of the GEE in addressing vital ice conditions that have direct implications on the livelihood and safety of these communities.
Recent studies have further demonstrated the efficacy of the GEE in addressing various environmental challenges. The extensive data repository and computational power of the GEE have been pivotal in developing applications for the monitoring and analyzing of weather and climate-related hazards [10]. Notably, studies have effectively utilized the GEE’s capabilities to address and manage natural disasters such as agricultural disasters, floods, droughts, and wildfires [11,12,13,14,15,16,17,18,19]. For instance, the real-time monitoring of flood extents has been significantly advanced through the employment of the GEE’s high-resolution satellite datasets and rapid processing capabilities. Similarly, drought analysis has benefited from the GEE’s abilities to process large-scale temporal datasets, thus enabling researchers to discern patterns and trends which are critical for drought prediction and management. Additionally, the monitoring of wildfire dynamics has been revolutionized by the GEE’s capacity to deliver near real-time satellite data, aiding in the prompt assessment of fire spread and severity. These applications underscore the versatility and robustness of the GEE as a tool for environmental monitoring, offering a comprehensive platform for researchers and decision makers to tackle complex climatic and ecological issues [10].
Furthermore, the incorporation of supervised classification methods, such as classification and regression trees [20], random forest [21], naive bayes [22], and support vector machine [23], in the GEE has facilitated the efficient and accurate analysis of remote sensing data. This integration is crucial for developing adaptable and user-friendly applications for monitoring climate and weather hazards.
The importance of making data accessible cannot be overstated, particularly in bridging the gap between research and operational applications in the context of ice-induced hazard monitoring. Accessible data promote a more comprehensive understanding of these hazards, enabling timely and effective decision-making processes [24,25,26,27]. Moreover, the integration of citizen science data plays a pivotal role in complementing remote sensing research. Citizen science is defined in this paper as a collaboration between public environmental observers and professional scientists to address a public or scientific concern [28], and we focus here on contributory citizen science where public participants primarily collect, submit observations, and access data products, but play a limited role in data analysis [29]. Citizen science programs, through large scale initiatives like the NASA-supported Global Learning and Observations to Benefit the Environment (GLOBE) program in over 140 countries around the world, and regional initiatives like the Fresh Eyes on Ice project in Alaska, offer valuable ground-truthing and observational data that enhance model validation and provide a more nuanced understanding of local environmental conditions [9,30,31]. The inclusion of such data not only enriches scientific research, but also fosters a stronger connection between science and the community, encouraging public engagement, placing science in context of community life and mutual learning of both scientists and public participants [32].
In this study, we introduce an automated framework that supports FAIR (Findable, Accessible, Interoperable, and Reusable) science principles, facilitating remote sensing and citizen science data sharing for both research and operational purposes. This study delves into various aspects of river ice monitoring, including the multi-source satellite observation approach for detection, the processing and analysis methods, and the integration of multi-source data in the Google Earth Engine. We explore the capabilities of the near real-time monitoring system, along with a spatial and temporal analysis of ice conditions. Lastly, we assess the impact of this system on the community, highlighting the practical implications of this integrative approach to monitoring river ice conditions in Alaska.

2. Materials and Methods
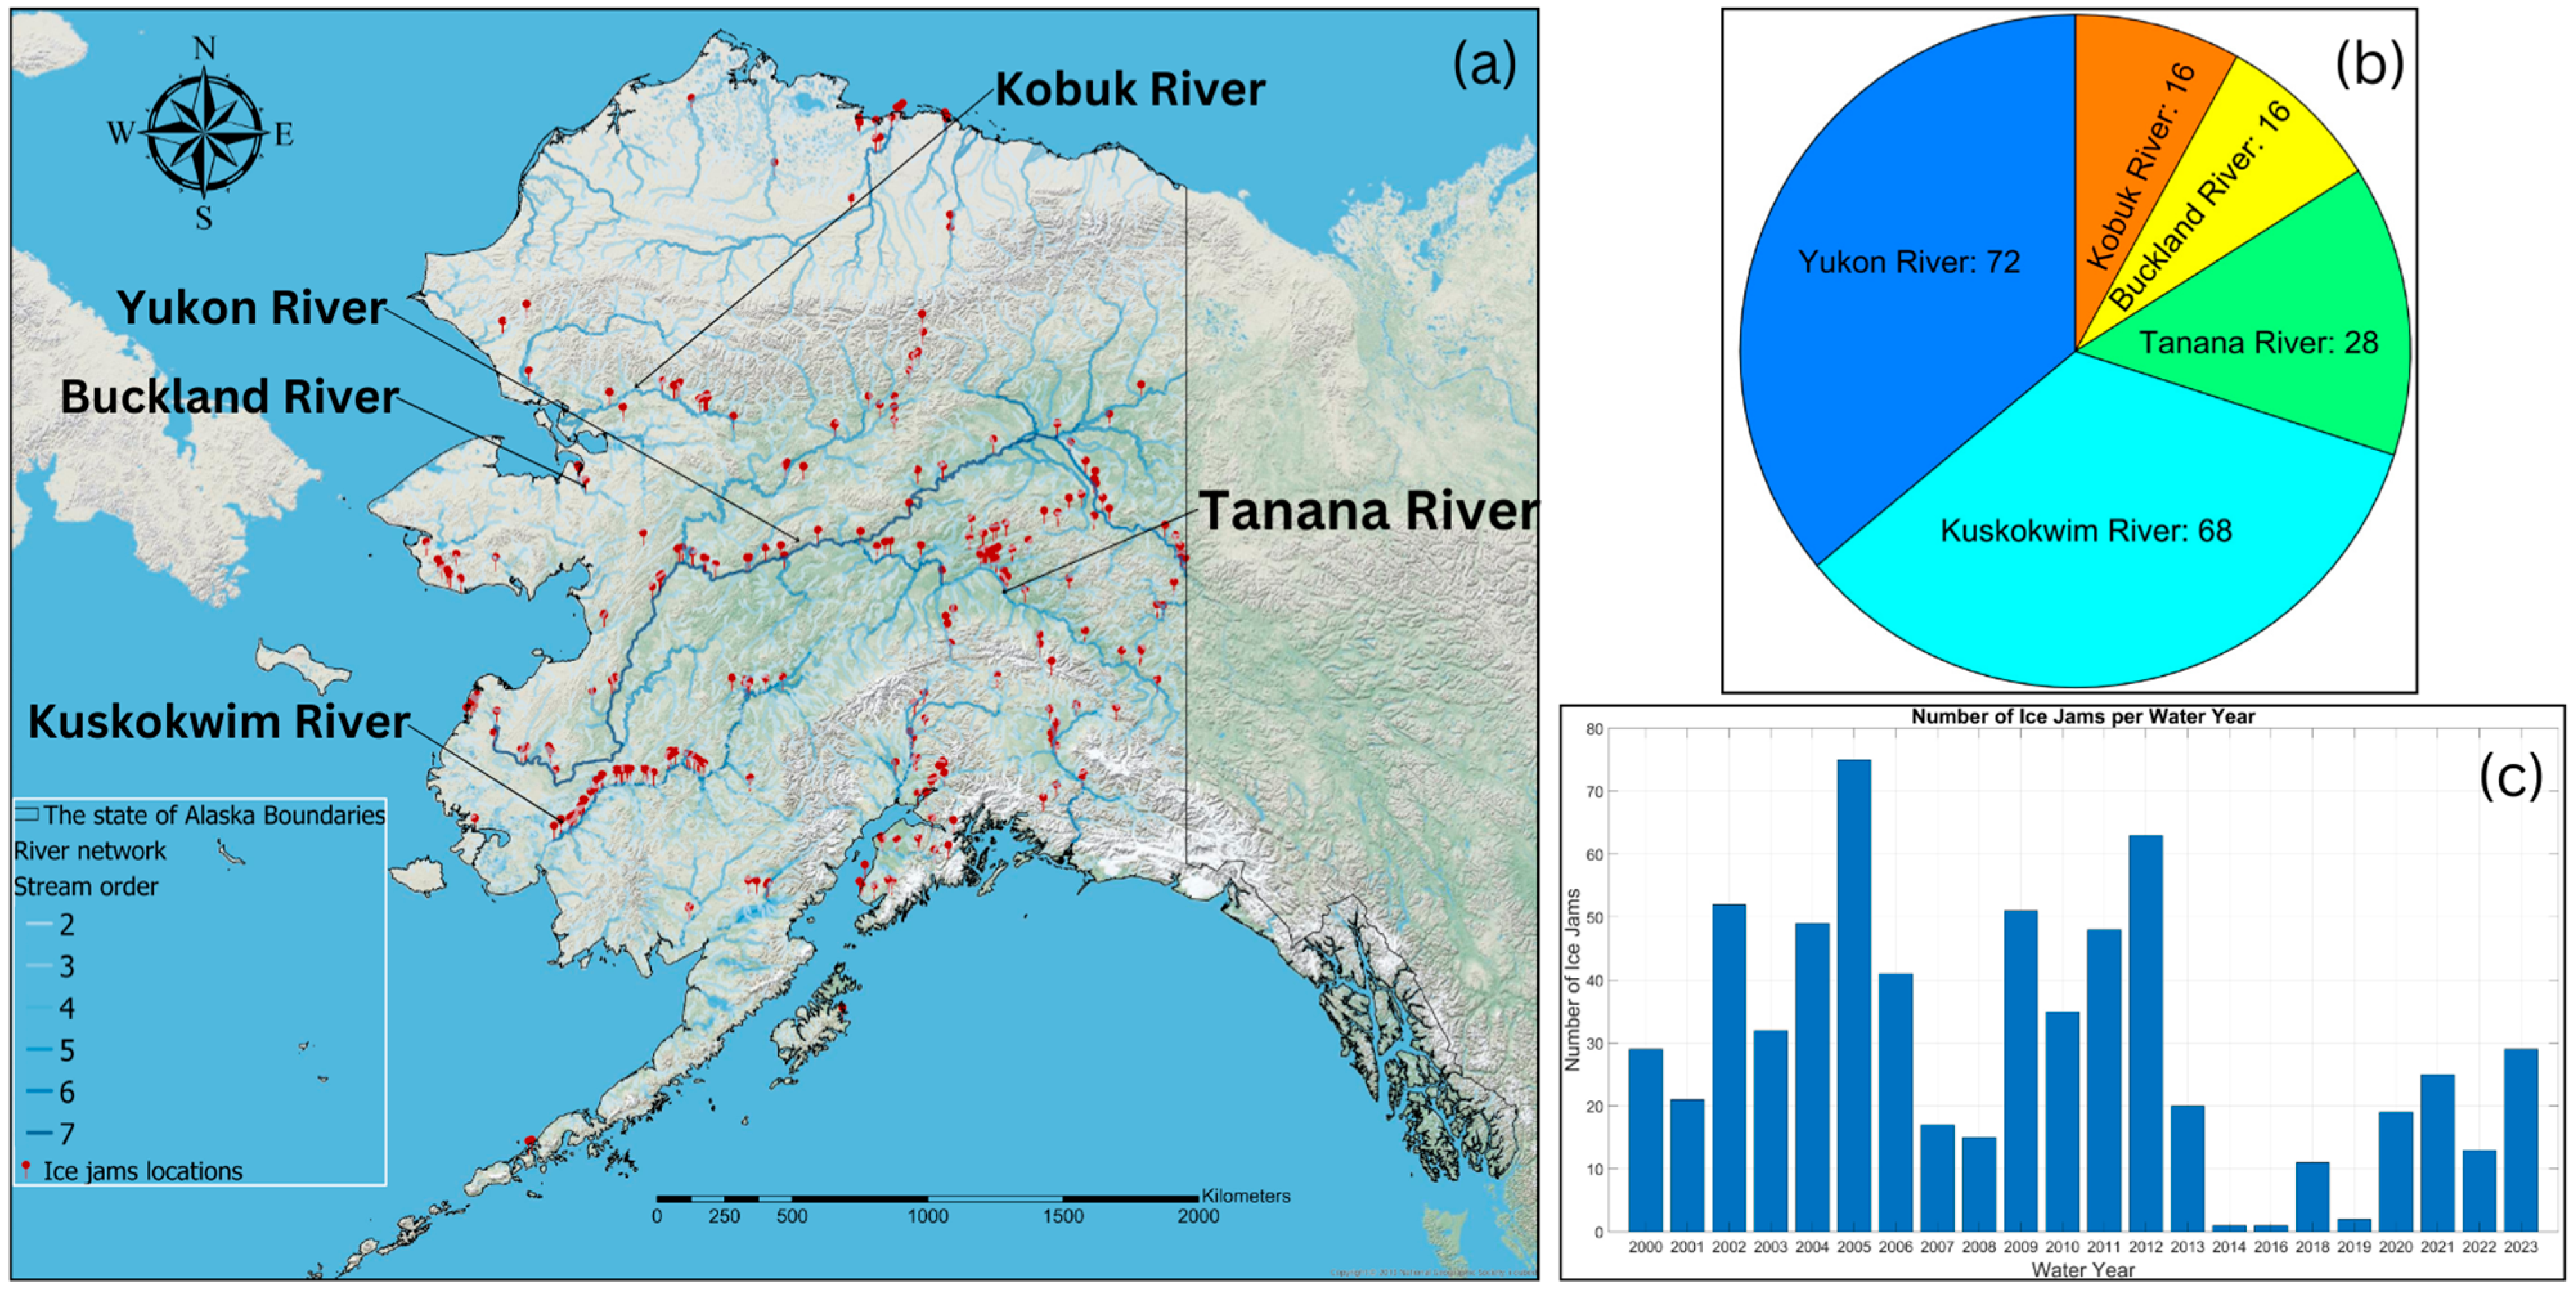
2.1. Study Area

The study area for this research encompasses the vast and diverse landscapes of Alaska, a region characterized by a range of physiographic and hydro-climatic regions [33,34]. This area, integral for our analysis of river ice conditions, is depicted in Figure 1a, showcasing the geographical area and river network of the region. In Alaska, most municipalities are not connected to the road system, with 86% of communities depending on rivers and coastal waterways as the primary means of transportation and access to resources. This reliance on waterways for connectivity underscores the critical role of rivers in the daily lives of Alaskans, particularly in remote and rural areas where traditional road infrastructure is minimal or non-existent. Thus, the transformation of river ice cover significantly impacts the accessibility and safety of transportation routes, making the monitoring and understanding of river ice conditions vital for these communities [35,36].
Alaska’s terrestrial environment includes tundra, boreal forests, and coastal rainforests, each presenting unique climatic and environmental characteristics. The boreal forest region, spanning central Alaska, is particularly notable for its long, cold winters with low precipitation, predominantly as snow and extensive areas of discontinuous permafrost. Mirroring this, the Tundra region, from central Yukon to Alaska’s northern coast, endures similarly harsh winters under a continuous permafrost, making it an integral part of the study’s scope. The permafrost significantly influences hydrological connectivity within basins, with surface runoff confined to the seasonally thawed active layer, leading to high runoff response rates and surface ponding during the spring melt period [37]. This dynamic interplay, compounded by the decay of river ice cover driven by various energy inputs, sets the stage for spring flooding. The gradual weakening and eventual fragmentation of the ice cover, especially under conditions of an early spring freshet, amplify the risk of ice jamming, thus intensifying the severity of flood events [37,38].
An essential component of our methodology involves monitoring ice jams and related hazards. We utilize data from the Cold Regions Research and Engineering Laboratory (CRREL) Ice Jam Database, spanning the water years from 2000 to 2023, to enhance our understanding regarding these critical ice-related phenomena. This database, as shown in Figure 1c, documents a total of 649 ice jam events, with a significant number of these occurrences reported at ungauged sites. These data provide a broader perspective regarding the ice jam phenomena beyond the limitations of traditional hydrometric gauging stations. The rivers experiencing the most ice jams during the past 23 water years include the Yukon, Kuskokwim, Tanana, Buckland, and Kobuk, as illustrated in Figure 1b.
This study area’s distinct characteristics significantly impact various Alaskan communities, with Fairbanks, Anchor Point, Buckland, Circle, Crooked Creek, Eagle, Fairbanks, Iliamna, Kivalina, Kobuk, Nome, Prospect Camp, and Stevens Village being notably affected by ice-induced hazards. Our analysis aims to provide a multifaceted understanding of ice conditions in these regions, aiding in the development of more efficient monitoring and management strategies for river ice phenomena in Alaska.

2.2. Multisatellite Approach for River Ice Detection

The accurate detection of river ice conditions poses significant challenges, one of which is the scarcity of in situ observations in the remote and often inaccessible regions of Alaska. Such limitations underscore the necessity of robust and reliable alternative methods of monitoring. Remote sensing offers a viable solution to this predicament, harnessing the capability of Earth observation systems to capture the expansive and systematic data pertinent to ice dynamics [39,40,41,42,43,44,45,46].
In this study, we leverage multisatellite imagery that integrates various sources of remote sensing observations, detailed in Table 1, to surmount common limitations in river ice monitoring caused mainly by cloud blockage and revisit cycle. This integrated method combines the strengths of both optical sensors and Synthetic Aperture Radar (SAR) sensors. The strategic use of these diverse sensing modalities allows for the mitigation of certain limitations associated with remote sensing observations. For instance, the issue of cloud cover, which often obscures optical sensor data, can be bypassed by the all-weather, day-and-night imaging capability of SAR. Furthermore, the variability in spatial resolution and the temporal constraints imposed by satellite revisit times are addressed through the suggested approach, ensuring a more continuous and precise monitoring system.
The cornerstone of our methodological framework is the Stevens River Ice Mapping System, derived from the Visible Infrared Imaging Radiometer Suite (VIIRS) observations [44]. The merits of the VIIRS, including its advanced imaging capabilities and frequent revisit cycle, make it an invaluable tool for the surveillance of ice conditions. This product utilizes an automated deep learning technique for the near real-time satellite monitoring of river ice conditions in northern watersheds of the United States and Canada. This method capitalizes on moderate-resolution imagery from the VIIRS bands aboard the NOAA-20 and NPP satellites. A U-Net deep learning algorithm is employed for the semantic segmentation of images, effectively handling varying cloud and land surface conditions [44].
The automated system generates detailed maps, delineating classes such as water, land, vegetation, snow, river ice, cloud, and cloud shadow. This segmentation enables a nuanced understanding of the river ice conditions, crucial for monitoring hydraulic and hydrological processes in these regions. The verification of this system’s outputs has been quantitatively affirmed by comparing it with existing ice extent maps in the northeastern US and New Brunswick, Canada. This comparison yielded a probability of detection of 0.77 and a false alarm rate of 0.12, suggesting commendable accuracy [44].
While the VIIRS River Ice product forms the core of the presented system, additional remote sensing products are also integrated, as outlined in Table 1, including Sentinel-1, Sentinel-2, Sentinel-3, and Landsat 8 and 9 datasets, each contributing unique capabilities for ice conditions monitoring. The other remote sensing data are sourced directly from the GEE data catalog [47]. It is worth noting that the time latency for data from Landsat 9, Sentinel-1, Sentinel-2, and Sentinel-3 to be available in the GEE catalog is 24 h. However, for Landsat 8, the latency extends to 3 days. Sentinel-1 data play a crucial role, leveraging the single co-polarization (VV) band. Following this processing, the emphasis is on differentiating between open water and ice cover conditions across rivers and lakes, providing a clear distinction, which is essential for accurate monitoring.
Sentinel-2 data integrated in the system represent the Harmonized Sentinel-2 MultiSpectral Instrument’s Level-2A product, more specifically, the atmospherically corrected surface reflectance. This dataset utilizes the Red (B4), Green (B3), and Blue (B2) bands, each pixel measuring 10 m, thus enabling the high-resolution analysis of ice and water bodies. Similarly, Landsat 8 and Landsat 9 data are integral to our system, employing atmospherically corrected surface reflectance images. The Red (SR_B4), Green (SR_B3), and Blue (SR_B2) bands from both satellites are used to construct detailed images that are critical for our system. For Sentinel-3, RGB bands were selected, and band-specific scale factors were applied based on recommended conversion values within the dataset image collection webpage [48]. Further specifics on the wavelength, offset, and scale of these utilized bands can be found on the respective GEE image collection webpages, offering users and researchers detailed insight into the data’s properties and application.

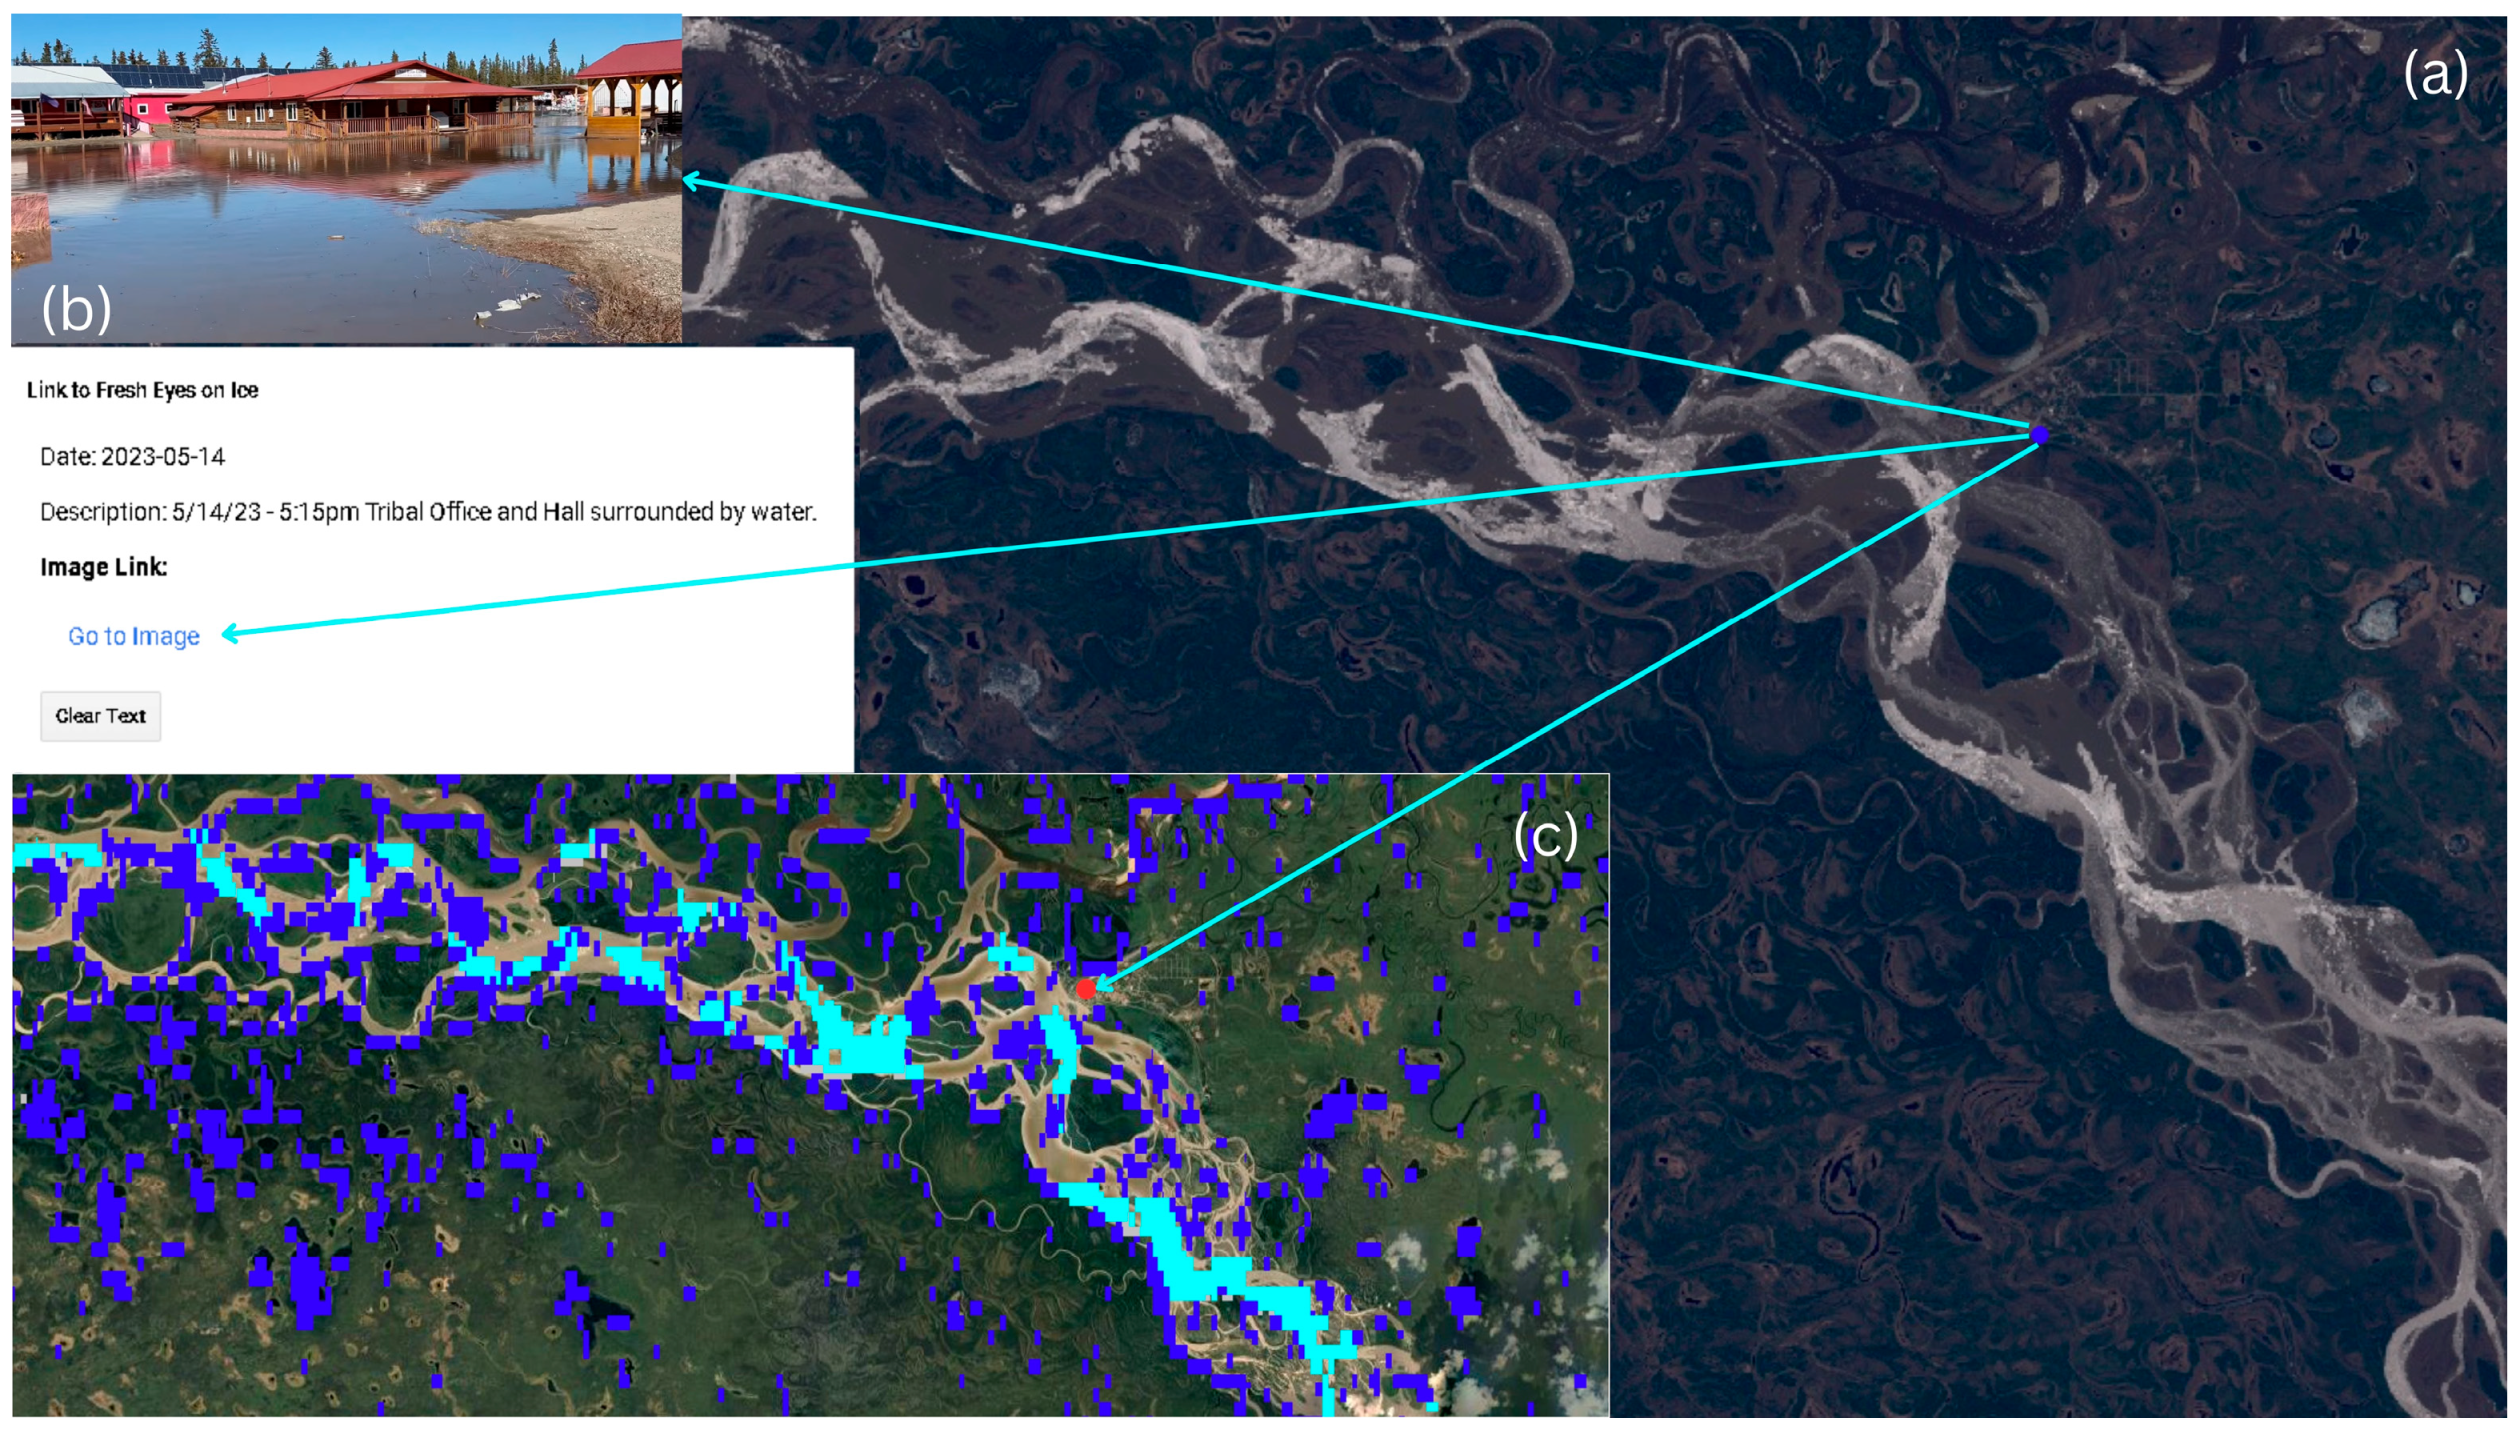
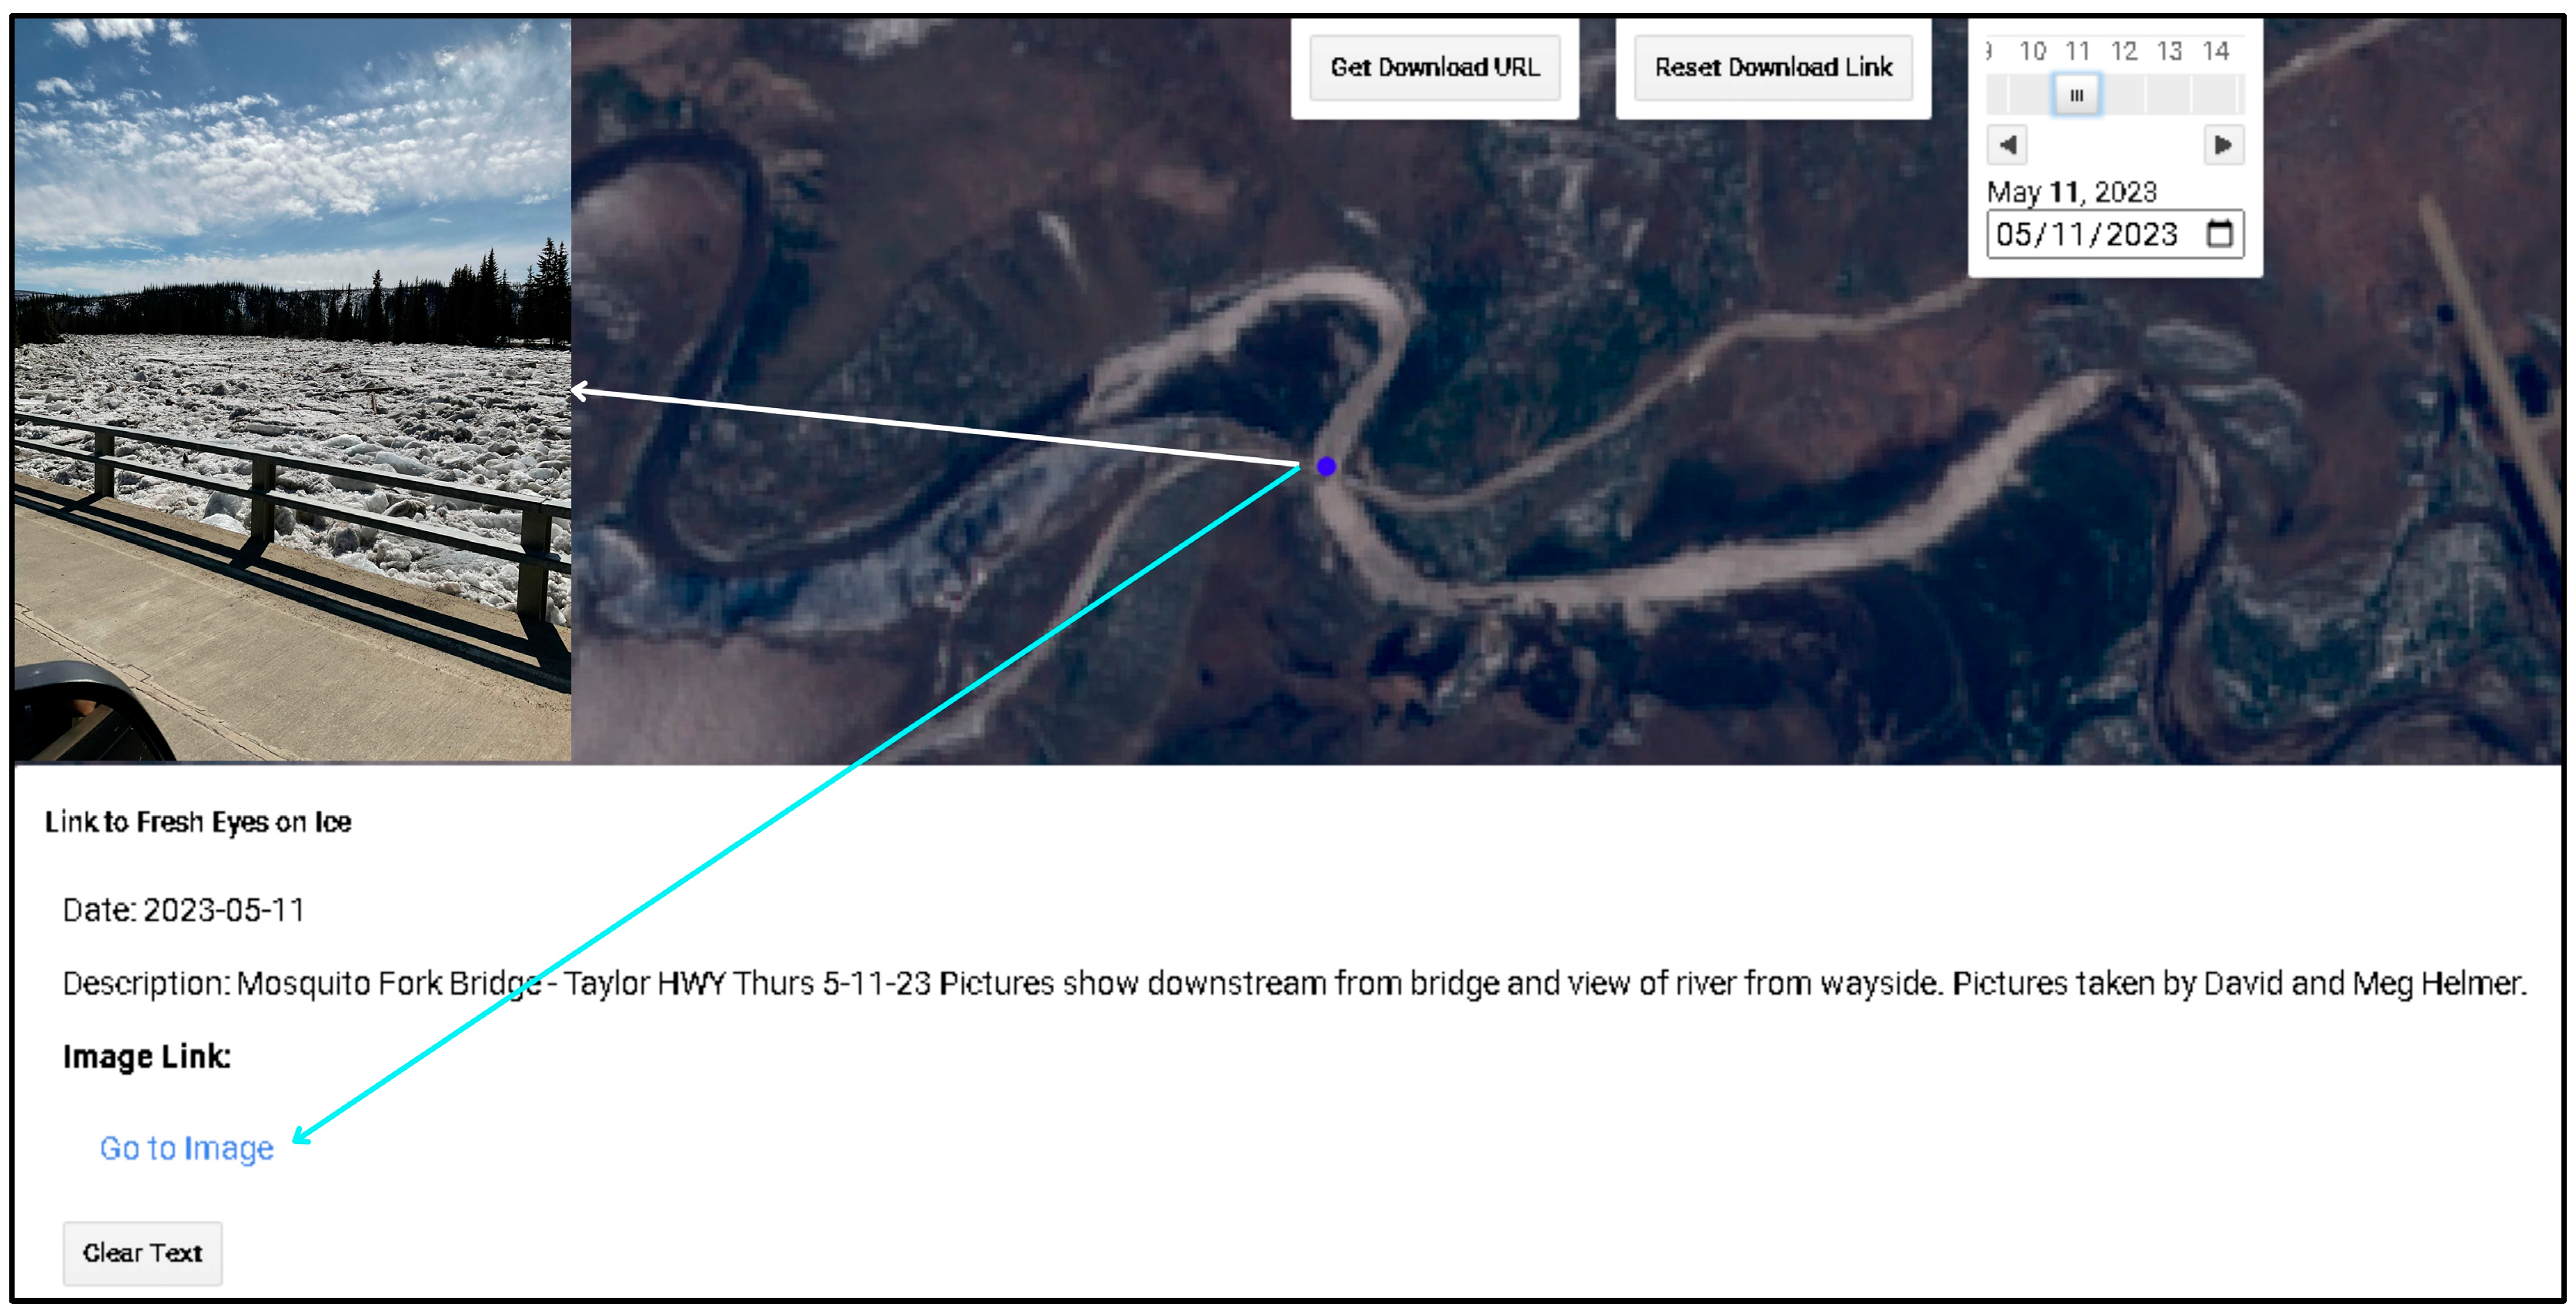
2.3. Integration of Citizen Science Data

In the realm of contemporary environmental monitoring, the integration of citizen science data plays a pivotal role, enhancing the scope and accuracy of observational datasets [29]. The suggested monitoring system utilized data acquired from the Fresh Eyes on Ice project. The Fresh Eyes on Ice project is a community-based river and lake ice monitoring and citizen science program based in Alaska, operated by University of Alaska Fairbanks in collaboration with a number of local, state, Tribal, and federal partners. Interested individuals, youth groups, schools, families, and local scientists collect photo observations and ice and snow thickness data. Data are submitted through the program’s website or the GLOBE Observer app, a collaborative platform engaging public participation in scientific research [49,50]. All citizen science photo observations were submitted to the Fresh Eyes on Ice project with free, prior, and informed consent. The protocol for data collection was reviewed by the University of Alaska Fairbanks Institutional Review Board, and was determined an exempt activity under 45 CFR 46 (IRB Review reference number 1841855–1).
A notable feature of the GLOBE Observer App’s Land Cover Module is its proficiency in facilitating the collection of photo observations of landscapes, proving particularly effective in capturing the nuances of ice conditions. The data collated through this app is transmitted to NASA and the GLOBE Program, contributing to a global understanding of land cover changes [30]. Specifically, in the context of Alaska, the data collected during the frozen seasons are integrated into the Fresh Eyes on Ice research database. These photographic contributions flow in near-real time to the National Weather Service Alaska-Pacific River Forecast Center (APRFC), serving as a crucial resource for spring flood forecasting and disseminating winter travel safety warnings.
In addition to these individual observations, the project is augmented by ground-based photographic data from fixed river ice cameras [51]. These cameras are strategically deployed across various regions of Alaska, including reaches along the Yukon River, Innoko River, Colville River, Kuskokwim River, Noatak River, Teedriinjik River, Tanana River, Copper River, and Kantishna River. The integration of these fixed camera feeds offers a continuous and comprehensive view of the evolving ice conditions, thereby enriching the dataset and enhancing the reliability of the monitoring efforts. This combination of citizen-contributed data and fixed camera observations stands as a testament to the power of collaborative science in understanding and responding to environmental changes, particularly in the challenging and dynamic landscapes of Alaska.

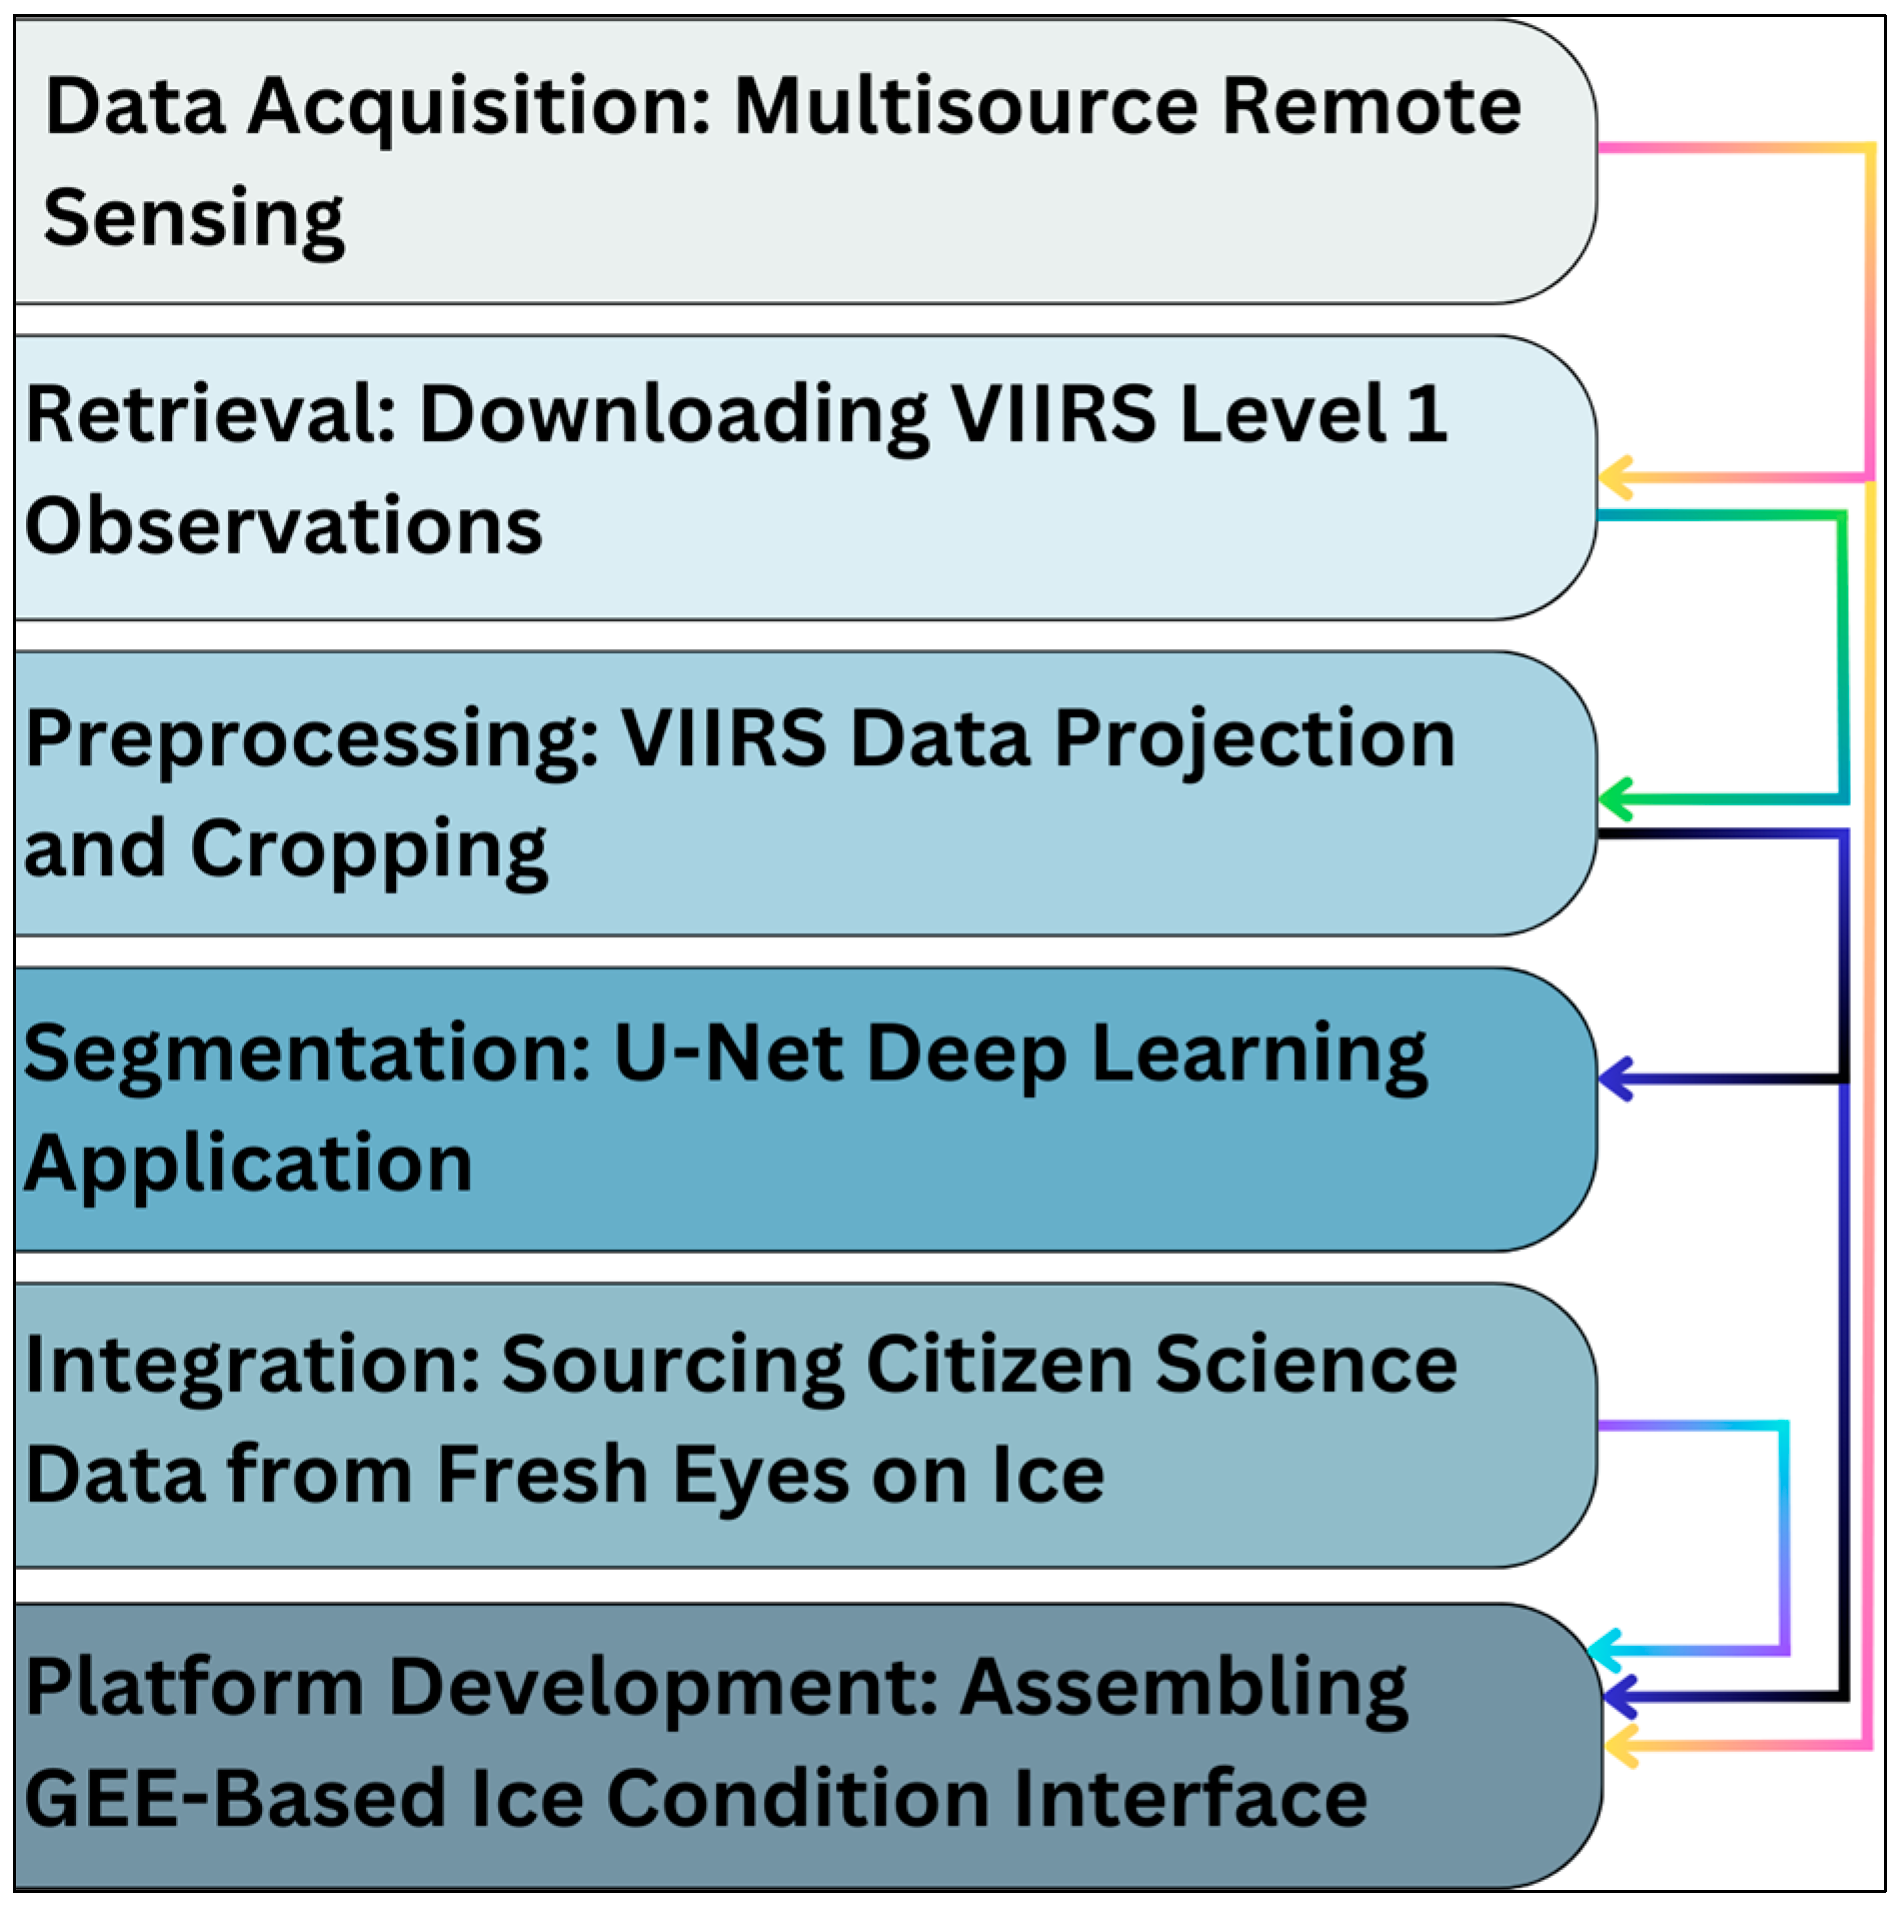
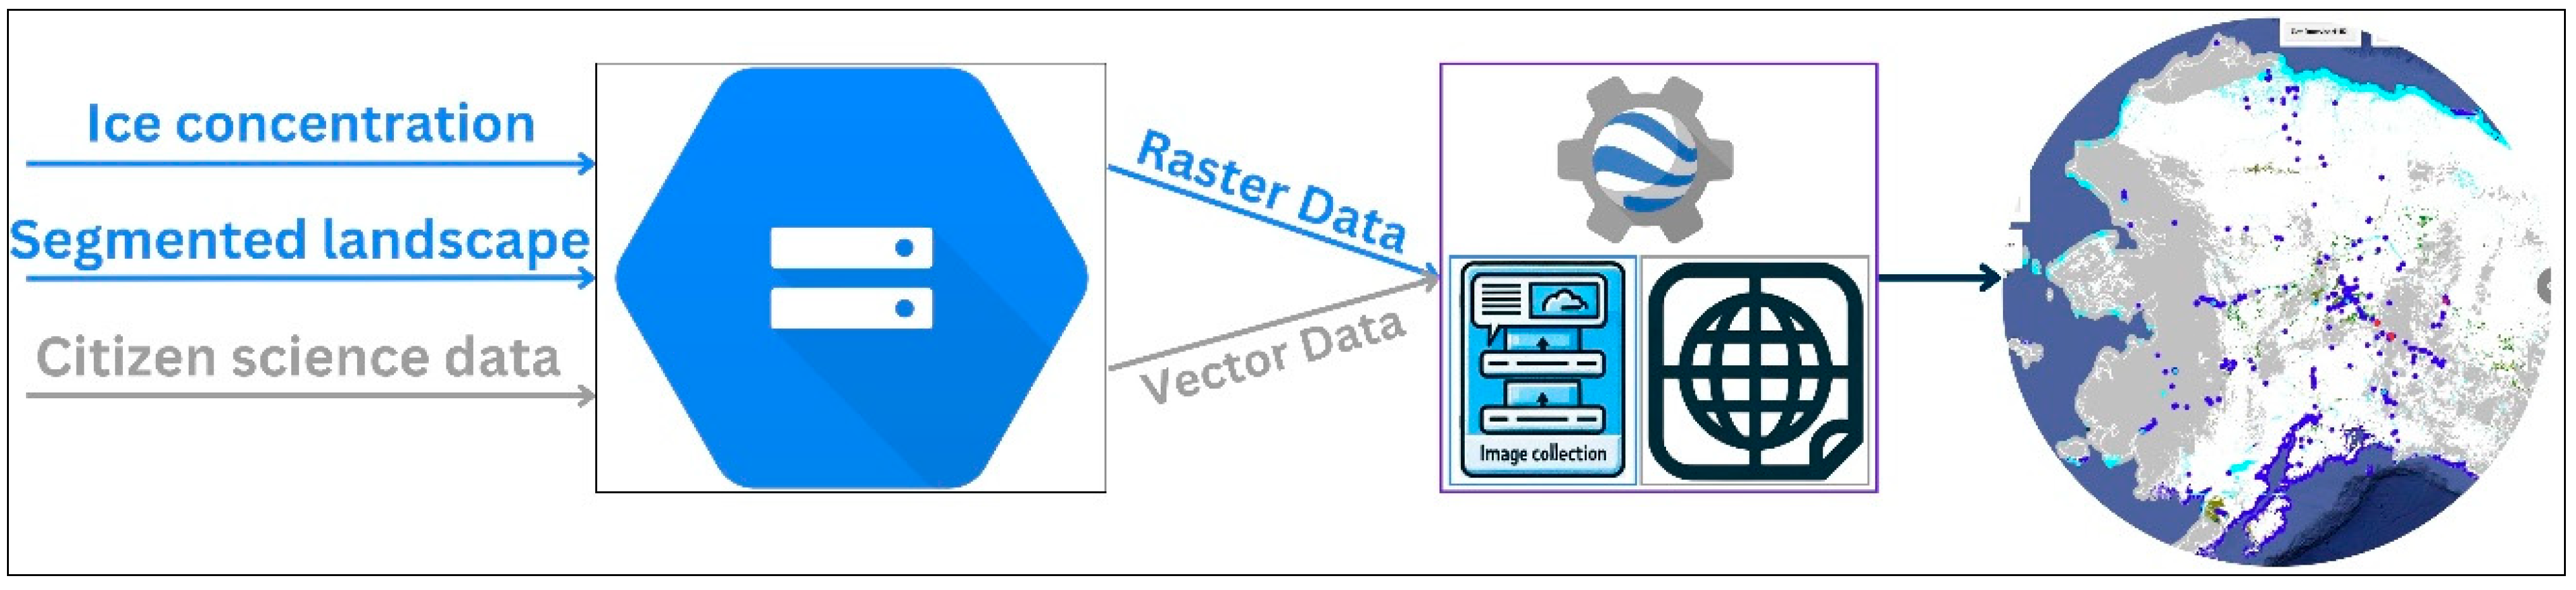
2.4. Data Processing and Analysis Framework

In this study, data processing and analysis is instrumental in synthesizing a comprehensive understanding of river ice conditions in Alaska. This method relies on a combination of multi-source data, incorporating remote sensing imagery, ground-based observations from cameras, and citizen science data.
The automated system operates through a series of methodical steps, presented in Figure 2. The segmented river ice product, a primary output of this system, is generated from VIIRS imagery. Following this, the data undergo projection and cropping which are specific to our region of interest. A pre-trained U-Net model then processes these data, producing segmented images that categorize various features such as River Ice, Snow, Water, Vegetation, and Land. Subsequent to this segmentation, the data is uploaded and displayed on a publicly available website through a GEE application. Another notable advantage of this system is the reduced latency in posting segmented VIIRS images on the platform. While the latency for VIIRS products available in the GEE can range from 3 to 15 days, depending on the product, the images posted in our system are available with a significantly reduced delay, which we have quantified to be just 1 day. This reduction in latency enhances the timeliness and relevance of the data for users and decision makers.
One of the challenges encountered in this endeavor is the limitations of the GEE in hosting high computational algorithms and a limited suite of machine learning algorithms. This poses a challenge in real-time or near-real-time data posting. Our methodological framework addresses this gap by providing a robust method that enables researchers to publish data effectively, positioning the GEE as a viable platform for transitioning research findings to operational applications. The system is fully automated. The process initiates with the downloading and processing of VIIRS images to generate the River Ice product. This is followed by uploading these images to a cloud environment and subsequently posting them on the GEE platform for user access.
This focus on an automated system underscores its significance in an environment, where manual data handling and processing are impractical. By predefining all tasks, the system not only ensures efficiency and accuracy, but also facilitates continuous monitoring and analysis, which are critical for understanding and responding to the dynamic and challenging ice conditions prevalent in Alaska.

2.5. System Development Process

In the advancement of the user interface for river ice monitoring on the Google Earth Engine, the incorporation of FAIR science principles was prioritized. The initiation of the development process was marked by the identification of diverse stakeholders who could benefit from a river ice monitoring system. A paramount design criterion was the accessibility of the system through an online platform, catering to the broad spectrum of potential users.
Subsequent to the determination of stakeholder needs, the design emphasis was placed on user friendliness and the integration of multi-source ice condition data. This integrated approach was intended to furnish users with a comprehensive system for river ice monitoring. The target audience was delineated to include members from the academic sector, public service agencies, private sector companies, and the general public, with special attention paid to riverside community members in Alaska (Table 2). We collaboratively determined the target audience, with input from Fresh Eyes on Ice partners and insights derived from ongoing discussions within the cold regions hydrology community [52].
The system’s architecture was tailored to support information dissemination across this wide span of users. The utility of river ice information was recognized as critical during the key seasonal periods. During the freeze-up period, the system was designed to support transportation planning and the continuity of daily activities which can potentially be impacted by ice formation. Conversely, in the breakup period, the system was aimed at aiding in the anticipation and mitigation of ice-induced hazards.
A key element in the development of the user interface on the GEE is the data integration and posting workflow, as depicted in Figure 3. This process employs an automated script, pivotal for the efficient and effective transition of segmented images to Google Storage. The procedure entails uploading both ice concentration images and their segmented counterparts into separate, designated buckets in Google Storage. This differentiation in storage buckets facilitates streamlined data management and retrieval.
Furthermore, data procured from the Fresh Eyes on Ice Portal are fetched via an Application Programming Interface (API), specifically using a Web Feature Service (WFS). WFS is a standard protocol recognized by the Open Geospatial Consortium (OGC) for querying and retrieving geospatial features. After retrieval, the data is uploaded to Google Storage into a distinct bucket dedicated to this dataset. This separation of data sources into different buckets is instrumental in maintaining an organized and coherent data structure. The data from the portal are available in various table formats [53]. The entire process of requesting and receiving this data is handled in the cloud, utilizing the Google Compute Engine.
An automated code, specifically developed and deployed on a Google Cloud Service—namely, the Compute Engine—plays a crucial role in this workflow. This code is responsible for transferring the data from the Google Storage buckets directly to the GEE. Within the GEE, this data is then systematically placed into pre-created image collections, designated for the river ice product, and tables, formatted as Shapefiles, for the citizen science data information. A crucial aspect of this process is ensuring that all these image collections and tables are set for public access. This measure is essential for integrating the data into the web-based application hosted on GEE, ensuring accessibility to a broad spectrum of users.
The workflow heavily relies on Google Storage as the intermediary between the local machine and the GEE cloud environment. This service is crucial for the migration of images and data to the cloud, serving as a pivotal link in the chain of data processing and dissemination. By utilizing Google Storage, the workflow achieves a seamless transfer of data from its source to the cloud, thereby enhancing the efficiency and reliability of the data integration and posting process on GEE. This approach not only streamlines the data management process, but also significantly contributes to the advancement of remote sensing applications in river ice monitoring, ensuring that data are readily available and accessible for analysis.
In summary, the user interface on the Google Earth Engine was developed with the intention of providing an accessible, user-friendly platform that adheres to FAIR principles. It serves as an essential tool for various stakeholders who rely on timely and accurate river ice information for decision-making and operational purposes.

3. Results

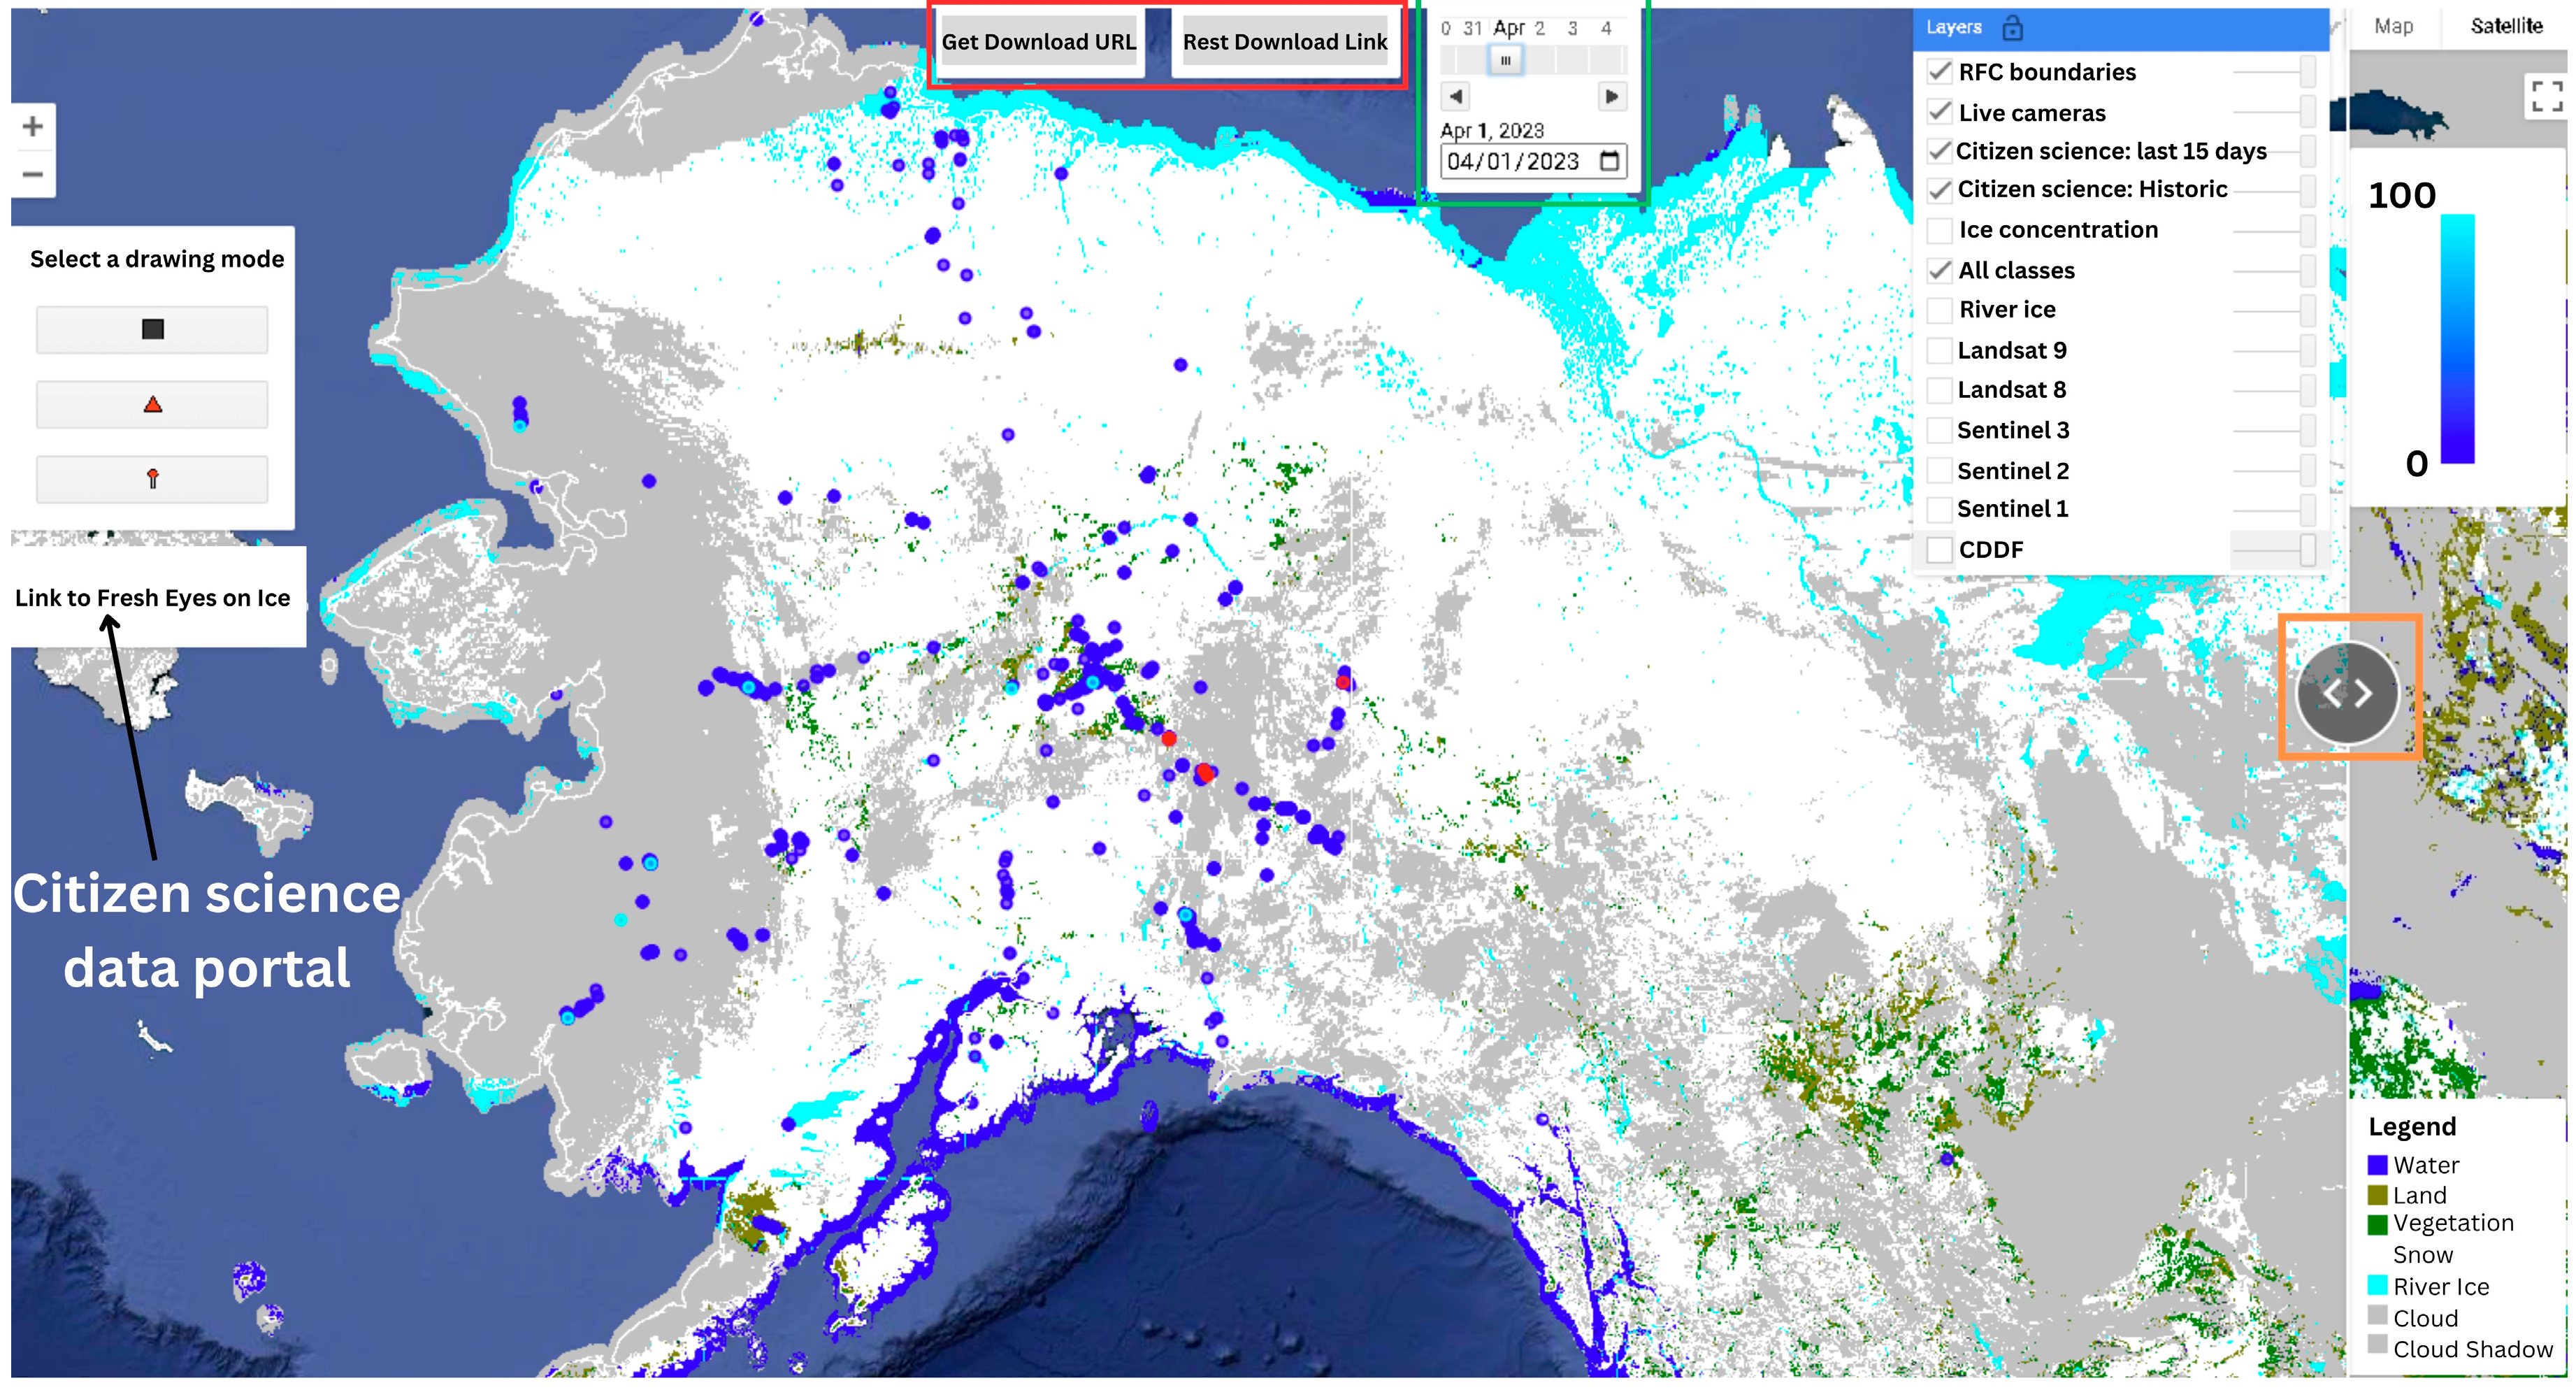
3.1. User Interface for the River Ice Monitoring System

The development of a user-friendly application was central to enhancing the capabilities of near real-time monitoring system for river ice conditions. As depicted in Figure 4, the interface design focused on creating interactive tools which are accessible to a broad range of users. This approach was instrumental in addressing the varying needs of different user groups, from researchers and local communities to government agencies and private sector entities.
One of the key features of the interface is the ability for users to activate or deactivate layers of remote sensing and citizen science data. This flexibility allows users to tailor the information displayed according to their specific requirements. The comprehensive legend provided for the segmented VIIRS River Ice product includes detailed classifications of land and varying levels of ice concentration, thus enhancing the interpretability of the data.
Users have the capability to select specific dates for visualizing available remote sensing observations. This feature is particularly useful for conducting the comparative analyses of ice conditions, either within the same period or for retrospective analysis. It enables users to visualize the inter-annual variability of ice conditions in a selected region by comparing current and historical data. The interface splitter further augments this capability, allowing users to simultaneously view ice conditions from different selected dates in separate panels.
It is important to highlight that, within our interface, users have the flexibility to individually display remote sensing products by activating the desired product (Figure 4). High-resolution optical products like Sentinel-2, Landsat 8, and Landsat 9 provide detailed imagery of land cover, enabling the detection of ice in both large and narrow channels. Conversely, moderate resolution optical products, such as the VIIRS river ice (375 m) product and Sentinel-3 (300 m), are more suited for monitoring ice conditions over mid-sized and large rivers only. During the development of our system, the use of low-Earth orbit sensors, like VIIRS onboard the NOAA-20 spacecraft and SLSTR onboard Sentinel-3, was instrumental. Despite their moderate resolution, these sensors can rapidly acquire data on a global scale. Furthermore, the inclusion of Sentinel-3, akin to VIIRS observations, significantly enhances our system with its daily temporal- and continental-scale spatial coverage.
The availability of a wide range of satellite images in the system mitigates the limitations posed by cloud cover in observing ice conditions. This not only enhances the reliability of the observations, but also opens new opportunities for inferring additional information, such as ice movement dynamics. Another significant feature is the drawing mode toolbox, which includes options for rectangle, polygon, or point selection. This tool allows users to conduct time series analysis within a defined area of interest. Once an area is selected, users can observe changes in water, ice, and snow extents over time. This function is invaluable for efficiently retrieving temporal evolution data of the landscape concerning ice, water, and snow dynamics.
To further facilitate GIS analysis, the system allows users to select an area of interest and download a GeoTiff file using the “Get Download URL” button. This feature, however, is limited to files up to 30 MB in size. Additionally, users can activate layers displaying ground-based observations. The first layer shows recent citizen science data collected over the past 15 days, allowing users to view the locations and details of recent image contributions. This is particularly valuable for local communities to stay updated on the current ice conditions in various Alaskan regions. The second layer features historical citizen science data, which are crucial for retrospective analysis and research activities. This data serves as ground truths for validating, assessing, and improving both modeling and remote sensing products related to ice conditions and ice-induced hazards, such as ice jams and flooding.
Lastly, the interface includes a layer displaying near real-time images from eight strategically deployed cameras across Alaska. During periods of prevalent cloud cover, when satellite-based observations are hindered, these cameras provide a reliable alternative for localized, reach-based observations. Users can access the latest camera observations through the “Link to Fresh Eyes on Ice” panel, enhancing the system’s utility in monitoring river ice conditions during critical freeze-up and breakup periods. The developed interface of the near real-time monitoring system represents a significant advancement in river ice monitoring. Its comprehensive, user-friendly design, coupled with interactive features and data integration, significantly enhances the capability of stakeholders to monitor, analyze, and respond to river ice conditions in Alaska.

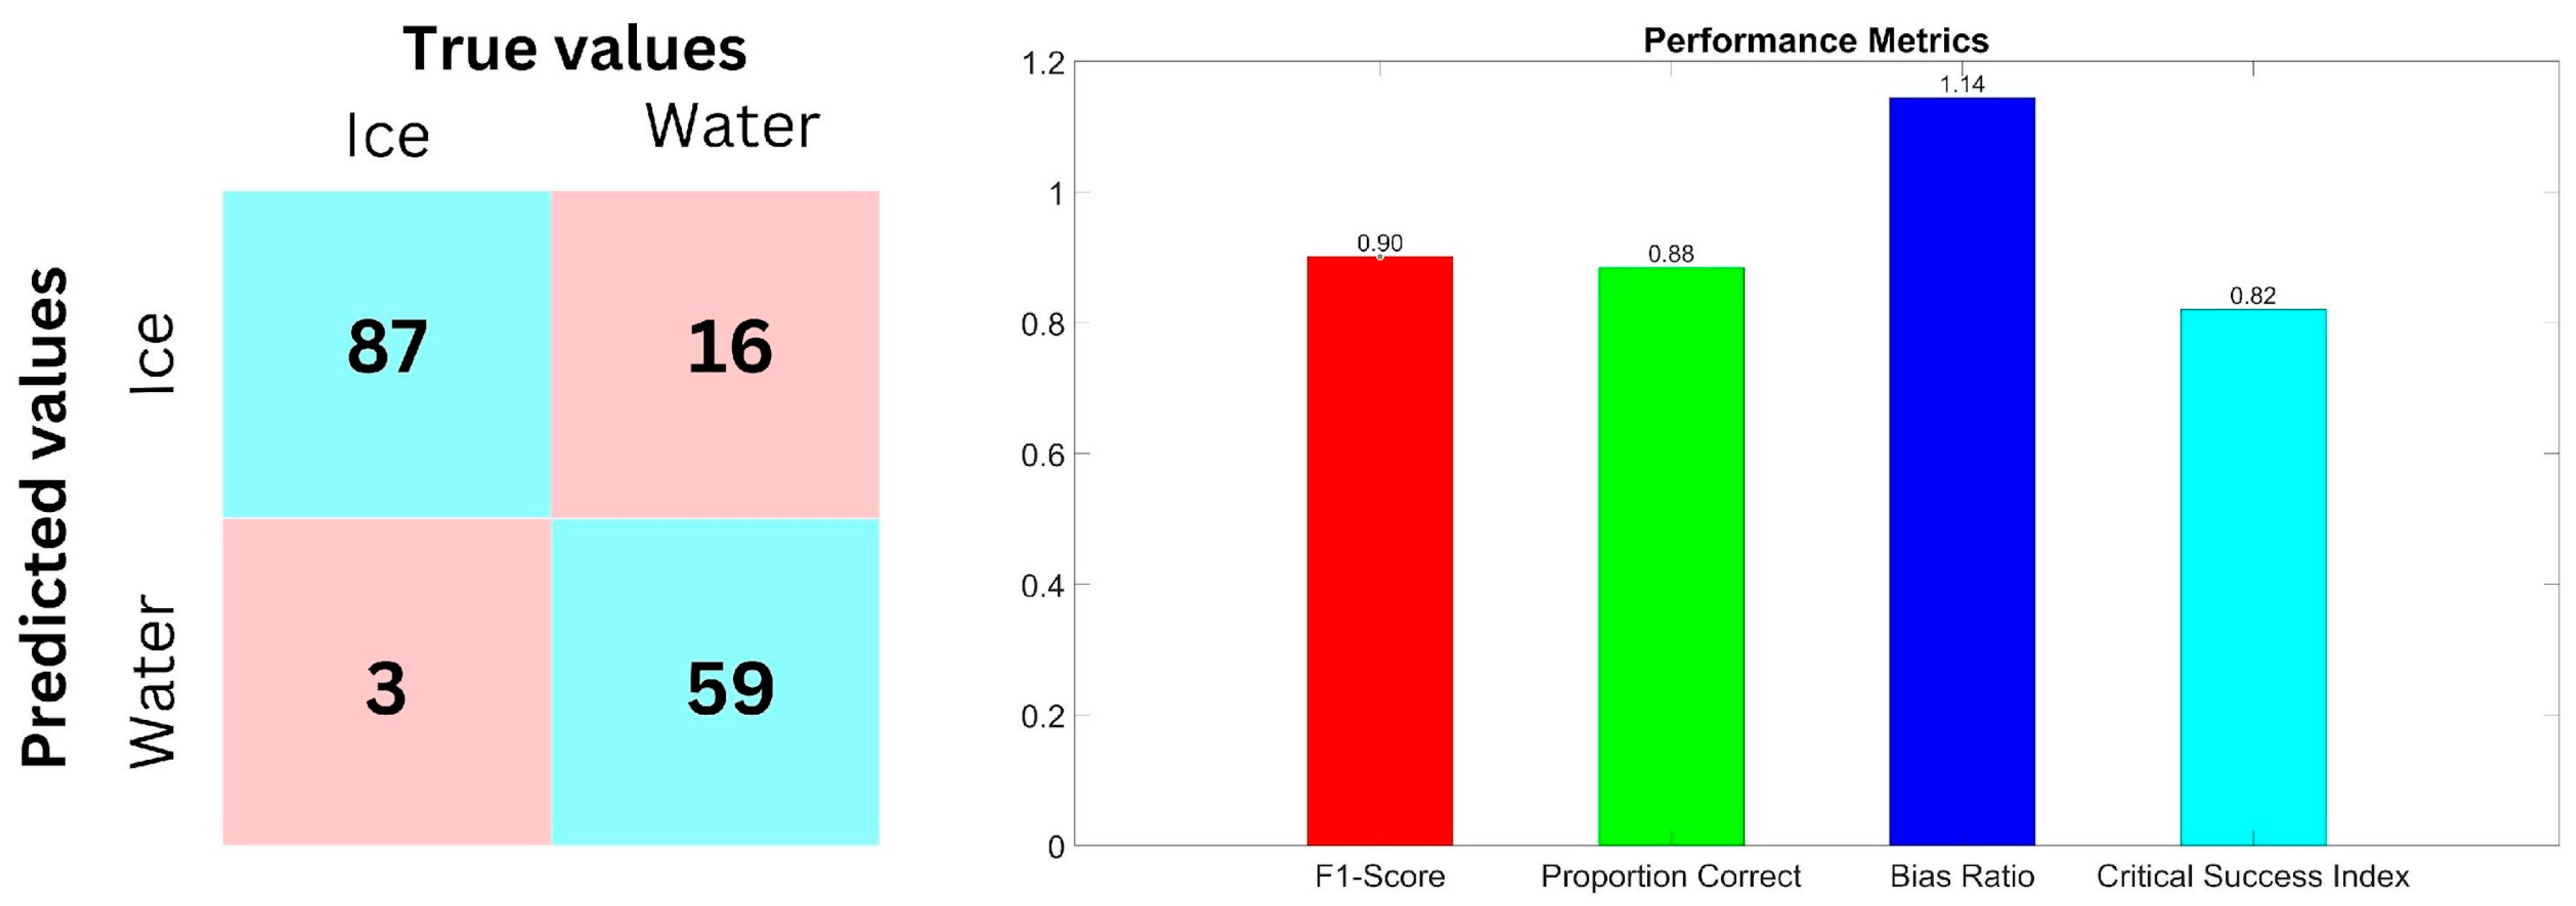
3.2. Evaluating VIIRS River Ice Product with Citizen Science Data

In this study, citizen science data were leveraged for the assessment of the VIIRS River Ice product, focusing on images collected during the water year 2023. A total of 1027 images, showing varied river conditions across different dates of the water year, were initially available for analysis. A GIS-based process was then employed to refine this dataset, focusing only on the mid-size and large rivers likely to be captured in VIIRS observations, in accordance with the river presentations in Figure 1. Subsequent to this selection, a temporal and spatial matchup between the citizen science data and VIIRS pixels was conducted. This process involved the exclusion of pixels classified as cloud or snow, limiting the assessment to those indicating water or ice. As a result of this geospatial filtering and pixel class restriction, a total of 165 citizen science observations were identified as corresponding to VIIRS pixels depicting water or ice.
The evaluation of the accuracy of the VIIRS River Ice product was conducted through the generation of a confusion matrix and the calculation of various assessment metrics. These included the F1-score (F1), the proportion correct (PC), the bias ratio (B), and the critical success index (CSI) (Figure 5). For more details regarding these metrics and their calculation methods, readers are referred to [44].
This approach underlines the utility of integrating citizen science data in validating remote sensing products, providing a methodological framework for assessing the accuracy and applicability of the VIIRS River Ice product in monitoring river conditions.
In the conducted analysis, a comprehensive evaluation of the VIIRS River Ice product against the observed data was carried out, focusing on the detection of ice presence. The results manifested a commendable alignment between the observed and predicted datasets, as evidenced by the calculated metrics. The F1 score, standing at 0.90, signifies a high degree of accuracy and precision in the classification process, reflecting the model’s effectiveness in correctly identifying ice occurrences. Similarly, the proportion correct metric, at 0.88, further corroborates the high level of overall accuracy in the predictions, indicating a substantial proportion of correct classifications relative to the total number of observations.
The critical success index value of 0.82 provides additional insight into the model’s performance, particularly in its ability to successfully predict “true ice” events. This metric, emphasizing the correct predictions of the target class, underscores the model’s robustness in distinguishing ice cover effectively. However, the bias ratio of 1.14 reveals a slight tendency towards overestimation in ice pixel predictions. This minor skewness towards ice detection can be primarily attributed to the challenging conditions during the breakup period. During this phase, the presence of a mix of open water and ice cover on the rivers introduces complexity to the classification task, thereby leading to some water pixels being classified as ice. It is important to mention that the false positive detections were further investigated and found to be occurring predominantly in April and May, reflecting the breakup period.
Furthermore, this study highlights the instrumental role of citizen science data in validating remote sensing products, especially in the absence of comprehensive benchmark datasets. The synergistic use of ground-based observations and remote sensing data paves the way for more refined and accurate environmental monitoring and analysis. Such integrations are pivotal in enhancing our understanding of dynamic natural processes and in the development of reliable remote sensing products that can effectively inform and support various environmental and climatic studies.

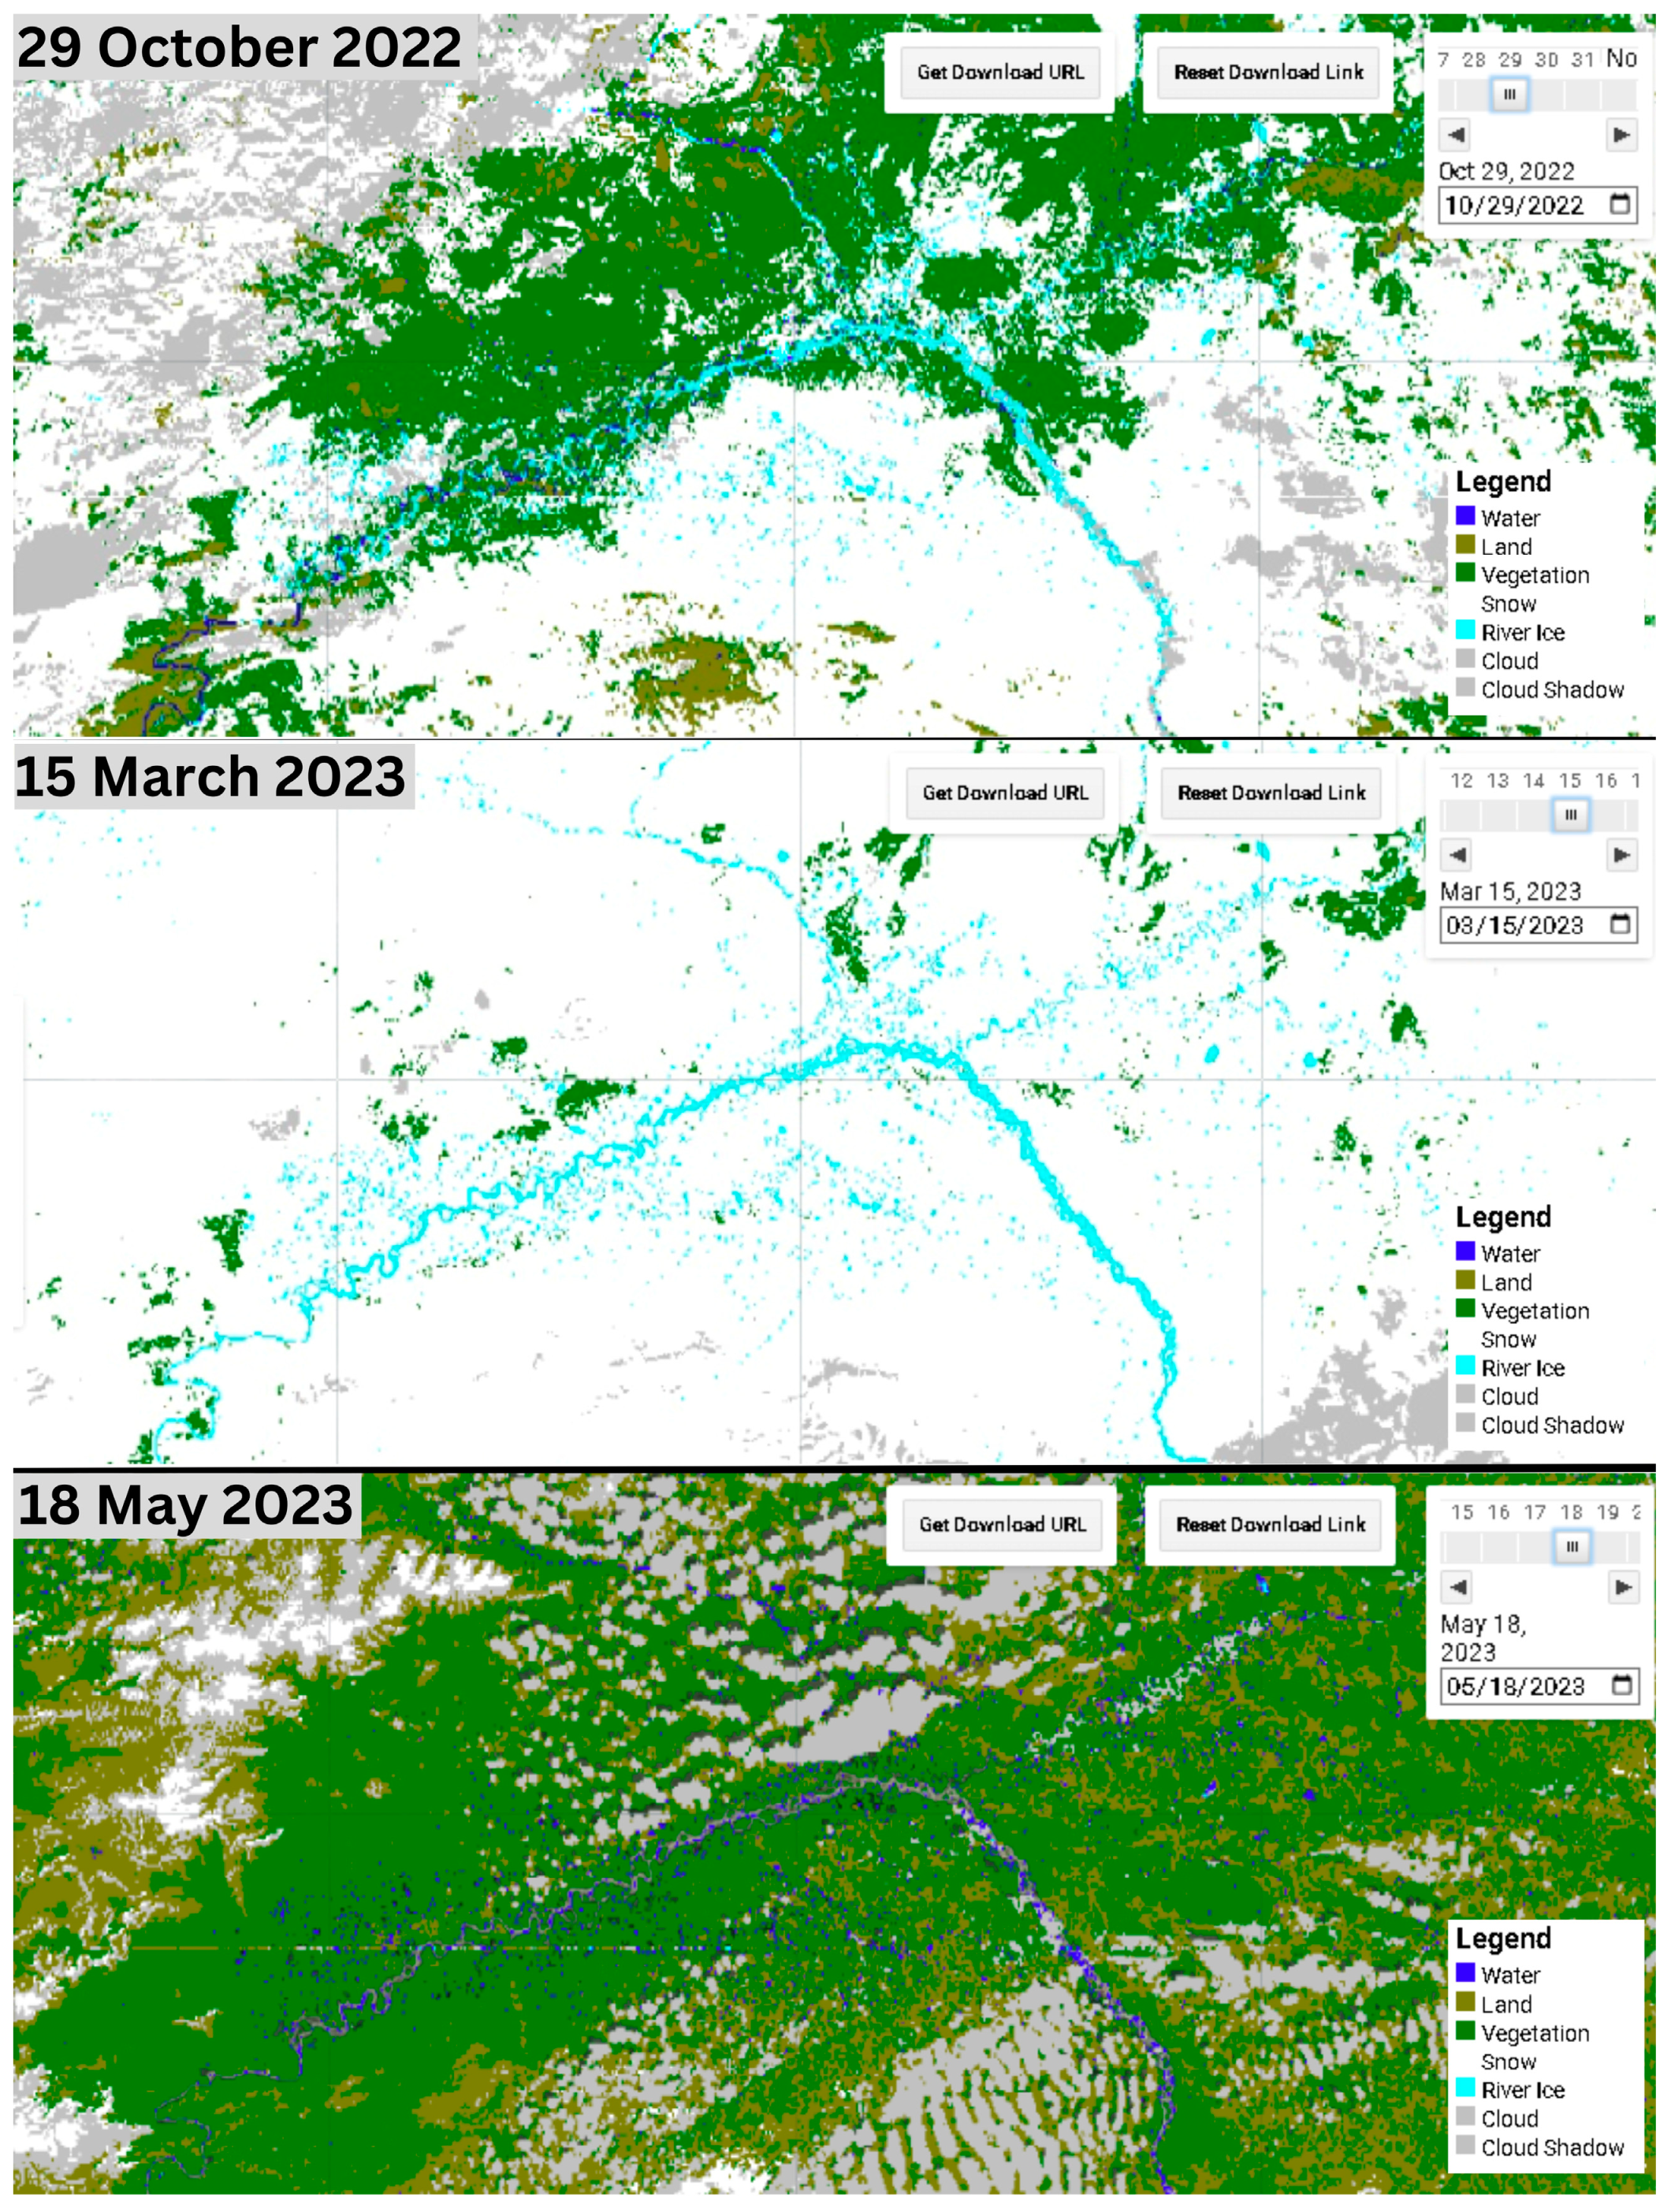
3.3. Spatial and Temporal Analysis of Ice Conditions

In order to comprehensively understand the seasonal dynamics of ice conditions in Alaska, the system presented in this study could be leveraged by users to conduct this analysis. It enables the enhanced visualization and analysis of ice conditions through the integration of various landscape and river ice classes, including cloud coverage information. This functionality is a vital component of the system, particularly in discerning the spatiotemporal evolution of ice, snow, and water cover, as demonstrated in Figure 6.
A crucial capability of the system is its proficiency in detecting the seasonal changes in snow and ice cover across Alaska, leveraging the VIIRS River Ice product. Figure 6 exemplifies this by presenting the seasonal transition in ice cover in the selected section of the Yukon River for the water year 2023. The onset of snow cover, marking the beginning of the river freeze-up, was observed to begin in October 2022. Throughout the winter season, ice cover remains prevalent, as evident in the imagery from March 2023. A significant shift is observed in May, where open water conditions become predominant, accompanied by a notable reduction in snow cover.
The system offers a wide range of users the ability to explore these seasonal changes in ice conditions. Moreover, it facilitates the detection of precursors to ice freeze-up and breakup events. For example, the start of snow accumulation provides valuable insights into the freeze-up period. Conversely, the inference of snowmelt, discernible from the reduction in snow cover, serves as an indicator of the onset of snowmelt-generated runoff, which contributes to ice breakup.
While the VIIRS River Ice product provides guidance regarding the broad spatial and temporal changes in ice conditions, delving into more localized processes necessitates additional data, particularly from high-resolution satellite sources. One notable observation from Figure 6 is the impact of cloud cover, which significantly hinders the clarity of ice condition monitoring over the entirety of Alaska. Moreover, the moderate resolution of sensors limits the effective monitoring of smaller rivers.
Therefore, a multi-source satellite data approach is essential, with high-resolution products offering near real-time information to overcome these limitations. The integration of various data sources enhances the system’s capability to provide a more detailed and accurate representation of ice conditions, thereby supporting a wide array of applications, from environmental monitoring to hazard prediction and mitigation. This multifaceted approach underscores the importance of leveraging diverse remote sensing technologies to achieve a comprehensive understanding of river ice dynamics in Alaska.

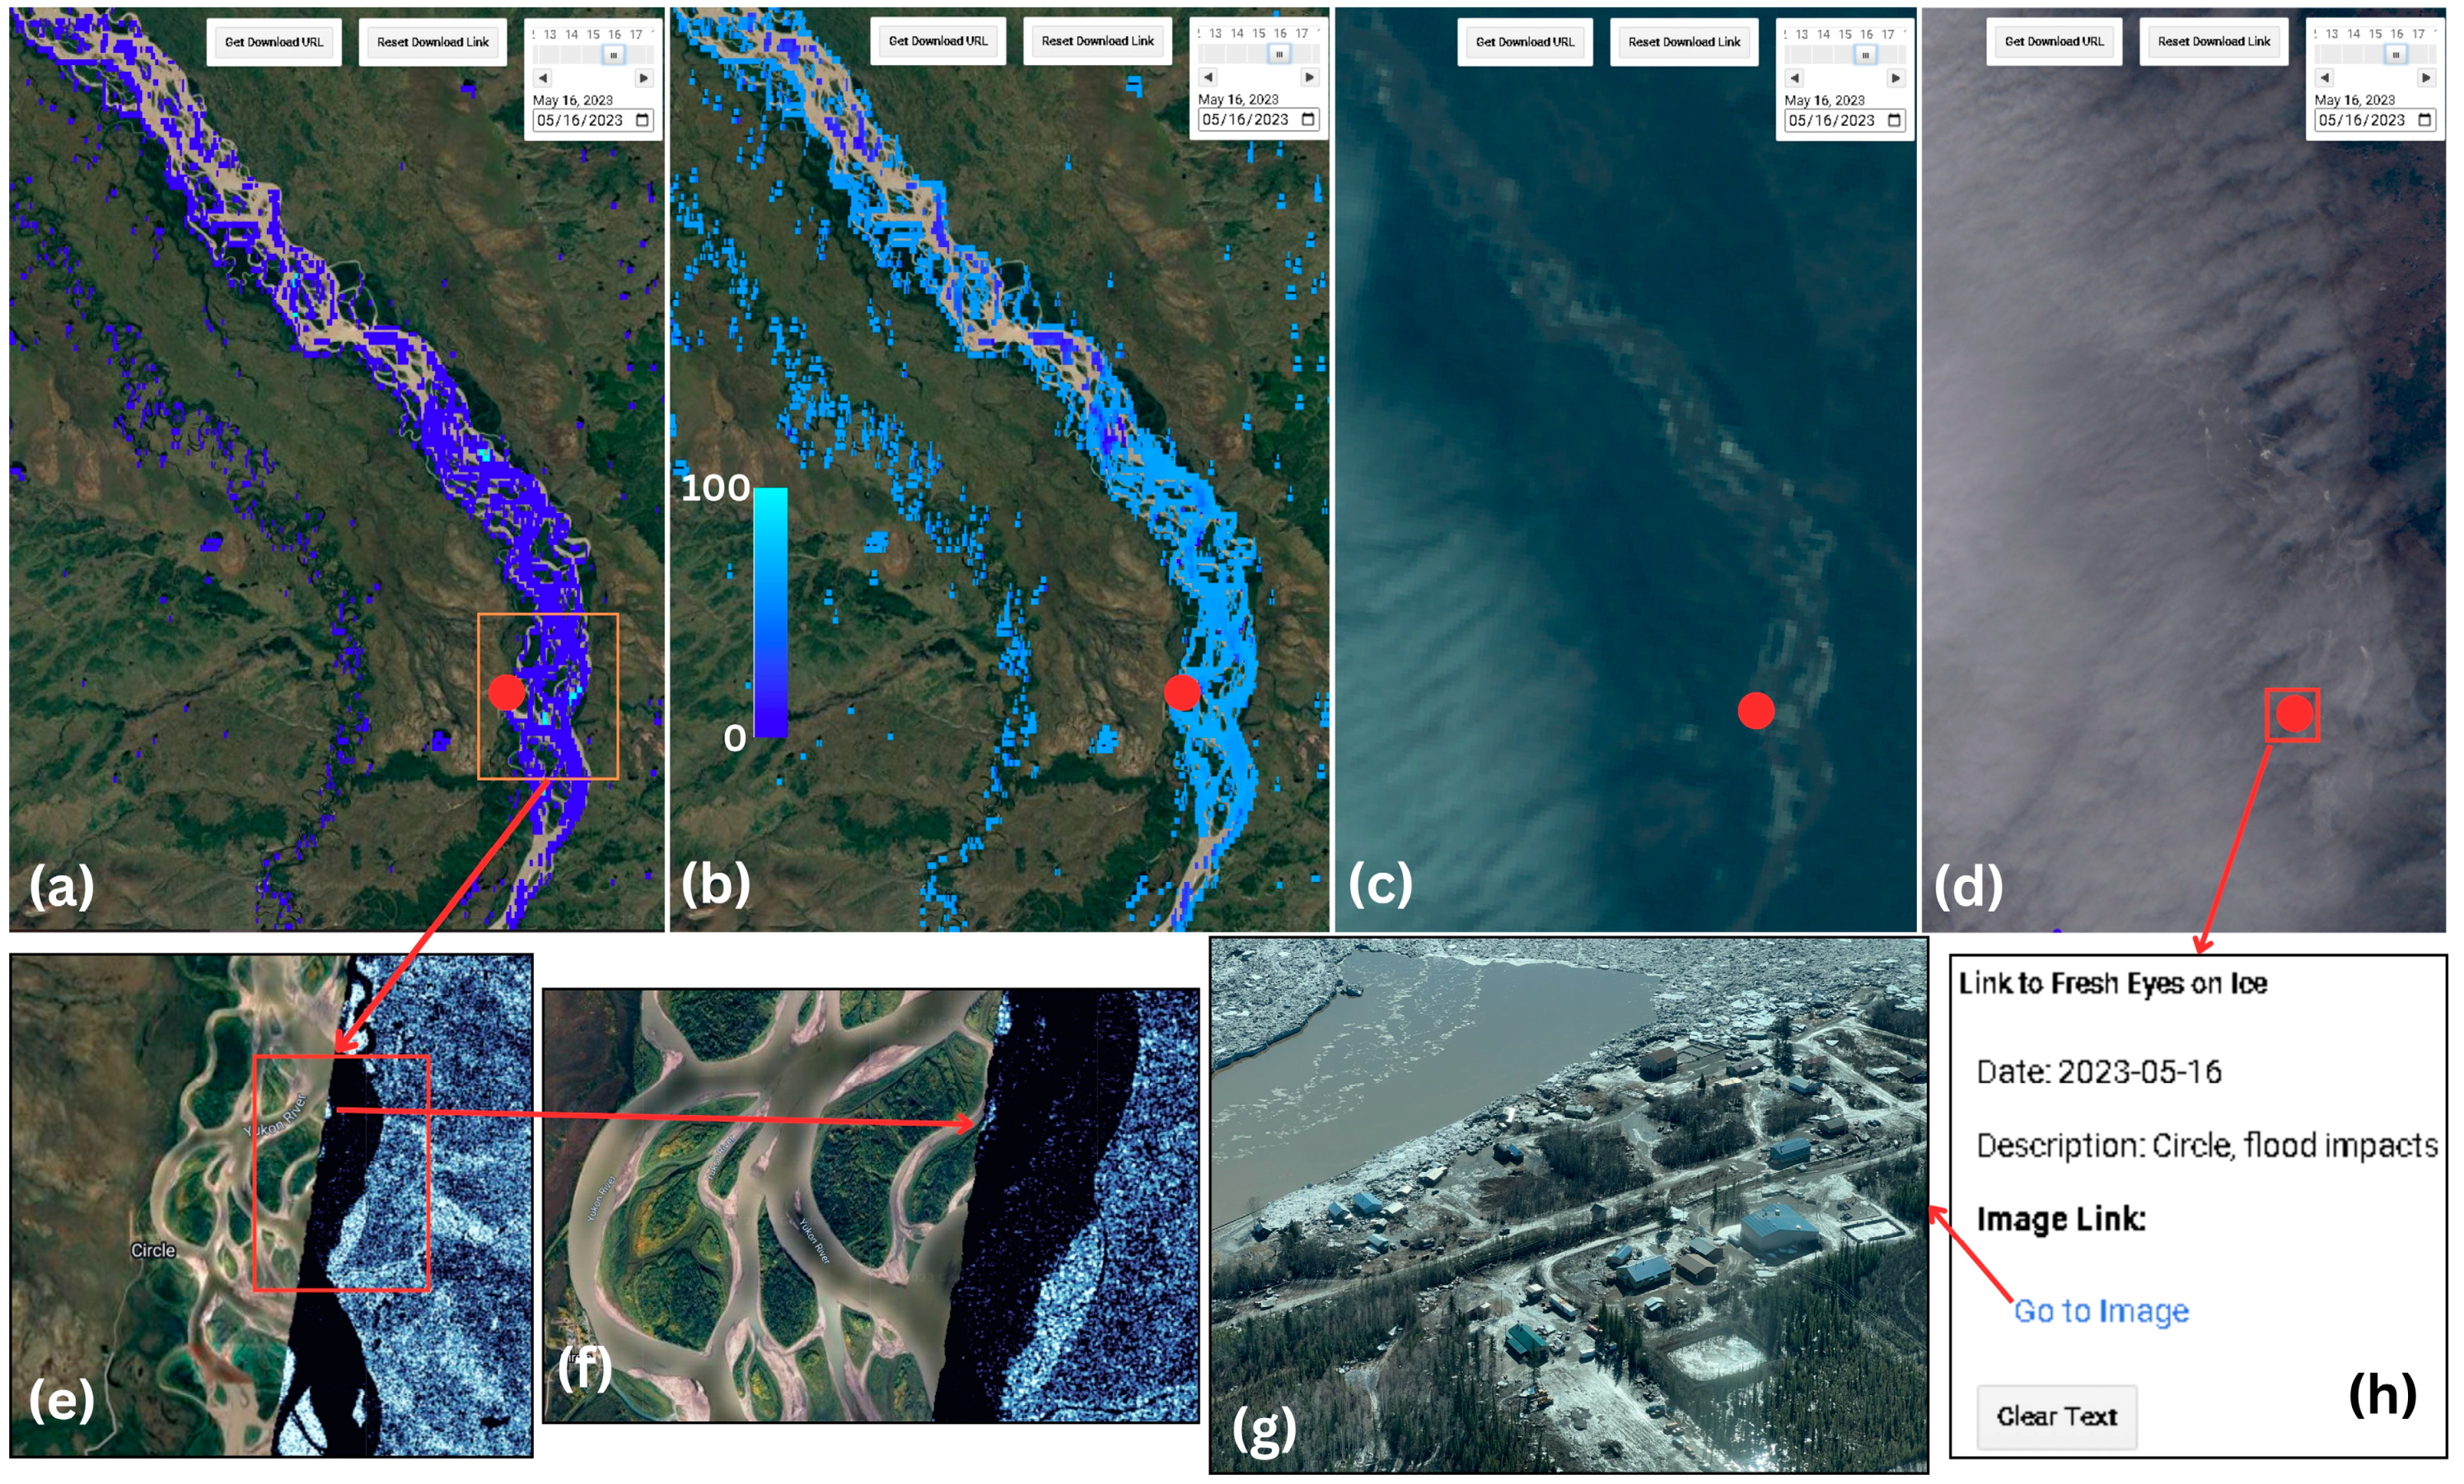
3.4. Monitoring Ice-Induced Hazards

In the context of enhancing our understanding of ice conditions, the application of multi-source remote sensing data becomes particularly evident in the analysis of an ice jam-induced flooding event along the Yukon River in Fort Yukon on 14 May 2023. This event exemplifies the synergy achieved through the integration of various remote sensing observations (Figure 7).
The segmented images from the VIIRS River Ice product, as illustrated in Figure 7c, effectively demonstrate the extent of ice and the associated water over land, indicative of flooding due to the ice jam. The moderate resolution of VIIRS imagery provides a broad scale perspective, but does have limitations in capturing finer details in narrower river sections. This limitation is addressed by the high-resolution imagery from Sentinel-2, as depicted in Figure 7a. Sentinel-2 imagery offers a clearer and more detailed view of ice and water extents, especially in narrower rivers where the VIIRS product may not be as effective. The ability of Sentinel-2 to distinguish between ice and open water during breakup periods significantly enriches the spatial analysis of ice conditions.
Further supporting this analysis is the integration of citizen science data, as showcased in Figure 7b. Images from the Fresh Eyes on Ice portal offer ground-level insights into the severity and consequences of ice-induced flooding, providing a perspective that cannot be offered through satellite-based observations alone. This comprehensive approach is vital for thoroughly addressing various aspects of ice-induced hazards, from mapping ice breakup in both wide and narrow rivers to assessing flood damage.
The information collated thus far is invaluable for subsequent studies, particularly in integrating remote sensing data into hydrodynamic models for operational forecasting. The acquisition of satellite images before the event also plays a crucial role in assessing the triggers of ice jams, thus contributing to the development of models that predict ice-induced hazards both in terms of occurrence and impact.
The geolocation of citizen science data is critically important for accurately assessing ice-induced hazards. Accurate location data increase the utility and relevance of these observations, linking them directly to specific geographical areas of interest or concern. However, these observations have a major limitation: they do not provide detailed information regarding ice type and thickness. While citizen science and satellite observations offer valuable spatial and temporal insights, understanding the specifics of ice characteristics during ice jams events remains a challenge, highlighting the necessity for more in situ measurements. This analysis underscores the importance of capturing changes in water levels during breakup and ice jam events to complement this integrated approach to river ice monitoring.
In the continuous exploration of leveraging multi-source remote sensing data for river ice monitoring, a notable case occurred along the Forty-Mile River near Chicken on 11 May 2023, as depicted in Figure 8. This incident of ice jamming presents a scenario where the integration of various data sources proves indispensable.
For this particular event, the VIIRS River Ice product encountered limitations due to the narrow width of the river, failing to capture the ice jam event effectively. However, the Sentinel-2 observation played a crucial role in this scenario. The high-resolution imagery from Sentinel-2 successfully captured sections where ice was accumulated, as well as areas of open water. This level of detail is critical for identifying the length of the ice jams and assessing the potential damage in the upstream areas of the jam.
Moreover, the citizen science data collected in the region provided invaluable insights. The visual information from these ground-level observations helped in identifying the nature of the jam as a breakup jam and offered a clearer perspective on the ice characteristics—aspects that could not be discerned using the satellite images alone.
This case exemplifies the importance of having multi-source data for monitoring ice-induced hazards. The combination of high-resolution satellite imagery and citizen science data creates a more comprehensive monitoring system. While remote sensing observations provide a broad and continuous view of the ice conditions, citizen science data can contribute ground-truth insights, particularly regarding the physical characteristics and types of ice jams. Such an integrated approach enhances the accuracy and depth of river ice monitoring, allowing for more effective hazard assessment and management.
Again, this case highlights the synergy between remote sensing and citizen science data, demonstrating how the latter can significantly complement and enrich remote sensing observations, particularly in instances where satellite imagery alone may not provide the complete picture. This integrated methodology underscores the value of diverse data sources in enriching our understanding and response to ice-induced hazards.
Through leveraging the multi-source remote sensing data, we examined a significant post-ice jam event that occurred on 16 May 2023, as illustrated in Figure 9. This event was marked by near-record flooding at Circle, affecting most structures, including the airport access road, and underscored the value of multi-source data in evaluating ice-induced hazards.
The VIIRS River Ice product revealed that the channels were predominantly open water, but this did not capture much of the floating ice, as shown in Figure 9a. However, a more nuanced understanding of the channel conditions was obtained from the VIIRS ice concentration product (Figure 9b). This product indicated a high ice concentration level within the channels, with concentrations exceeding 60%.
Further clarity was provided by RGB images from Sentinel-3 observations, which effectively captured the accumulated ice near the river banks and in the meandering channels (Figure 9c). On the contrary, available Sentinel-2 images were largely obscured by cloud cover, limiting their utility in visualizing the floating ice (Figure 9d).
A key addition to the observational capabilities was the high-resolution SAR data, though its geographical coverage was limited. The sections captured by this data source clearly depicted the floating ice (Figure 9e,f). Advanced raster visualization tools were employed to better visualize the floating ice, using an ice color palette that was stretched to backscatter amplitude values [55]. Once again, the value of multi-source remote sensing data was demonstrated in mapping and monitoring ice-induced hazards. The comprehensive nature of these data allowed for a detailed assessment of the event’s impact, particularly in terms of the extent and characteristics of the floating ice.
Additionally, the event’s effects were captured through photographic images, providing a ground-level perspective on the flood’s impact near Circle. These images, accessible through the Fresh Eyes on Ice portal, are saved under the historical data layer (Figure 9g,h). They offer a clear visualization of the event’s consequences, complementing the satellite data and providing a holistic view of the situation. This integration of various data sources, from satellite imagery to ground-based photographs, underscores the importance of a multi-faceted approach in understanding and responding to environmental hazards, particularly those which are as dynamic and impactful as ice jams and their effects.

4. Discussion

The research conducted in this study has provided key insights into the capabilities of the near real-time monitoring system and the spatial and temporal analysis of ice conditions. The results derived from these sections highlight several critical aspects of river ice monitoring using an automated system.
The automated system, as evidenced by our qualitative assessments, has proven to be highly reliable in monitoring the dynamics of river ice, particularly during crucial periods such as ice formation and breakup. Its ability to capture the phenology of river ice with accuracy underscores its utility as an invaluable tool in river ice monitoring. By leveraging an existing automated framework, the system enhances the monitoring capabilities across Alaska, offering detailed and timely insights into river ice conditions with minimal human intervention. This represents a significant stride in the field, especially in providing an efficient solution for monitoring in regions that typically receive less observational coverage.
While the utilization of the Google Earth Engine (GEE) image collections offers numerous advantages, it does pose some limitations in terms of advanced image processing capabilities like image filtering, segmentation, and classification. The framework developed in this study addresses these limitations by guiding users on how to create and publicly share their own image collections within the GEE. This approach not only expands the utility of the GEE, but also empowers users to tailor the data processing to their specific needs, thereby enhancing the overall efficacy of the monitoring system.
The system presented in this study exemplifies an advanced approach to automated ice monitoring. By integrating various remote sensing datasets and leveraging machine learning algorithms, the system facilitates a comprehensive analysis of ice conditions. This integration is pivotal for understanding the complex and dynamic nature of ice phenomena and for providing actionable insights for stakeholders.
Despite its numerous strengths, the tool does have limitations that need to be acknowledged. For instance, the image download capability is currently confined to the river ice product. Additionally, while the system imports Sentinel and Landsat observations directly from the GEE cloud server, these images are provided in a pre-processed format. This limits the users’ ability to further preprocess or calibrate the raw images according to their specific requirements, such as thermal noise removal or radiometric calibration. Acknowledging and addressing these limitations is crucial for the continuous improvement and adaptation of the system in order to meet diverse user needs.
An intriguing prospect for the further development of multi-source remote sensing system is its application in operational hydrology, specifically in enhancing real-time response and predictive capabilities for river ice phenomena. To augment the practical utility of the system, particularly for operational purposes in hydrology, the implementation of advanced features such as ice jam prediction and user alert communication is highly recommended for future advancements.
The envisaged expansion includes the integration of advanced machine learning models leveraging the wealth of data generated by the system. These models can be trained to predict potential ice jams, thereby enabling the system to issue timely alerts to users, particularly in vulnerable or high-risk areas [56]. This proactive approach would not only enhance the system’s utility for monitoring, but would also elevate its role in disaster preparedness and response.
Furthermore, collaborative efforts with existing operational programs, such as the NWS River Watch program [57], are significantly enriched through the integration of citizen science data. Notably, the APRFC actively utilizes citizen science data for their monitoring endeavors. This synergy originated during the pandemic when traditional aerial surveys were limited, sparking the Fresh Eyes on Ice initiative. This program encouraged local communities to contribute their observations, reinforcing the longstanding tradition of community engagement in the River Watch program. Locals, recognizing the pivotal role of river forecasts in their daily lives, readily participate by providing valuable, ground-level insights. The remote sensing product and the associated portal have been fine-tuned through this interaction, ensuring validation and relevance. Features, such as the ability to download river ice data directly from the app, were introduced in response to specific requests from a weather agency, exemplifying the user-driven evolution of our system. Engaging with these programs led by weather agencies could facilitate a more targeted approach to data collection and dissemination, ensuring that the information gathered is both relevant and actionable. Additionally, such collaboration would aid in communicating specific data collection needs to users and communities in Alaska, thereby fostering a culture of active participation and data sharing.
Enhanced communication strategies could lead to the collection of larger datasets, which are crucial for tracking the movement of ice across different locations. This expanded dataset would not only improve the accuracy of predictive models, but also provide valuable insights for long-term hydrological studies and environmental management. In essence, by integrating predictive capabilities and strengthening ties with operational hydrology programs, the system can evolve from a purely monitoring tool to an active participant in disaster prevention and response. This transition would mark a significant leap forward in leveraging remote sensing and citizen science for operational hydrology, particularly in the context of river ice monitoring.
Feedback from the community and users of the river ice monitoring system underscores the critical role of engagement and iterative improvement in developing effective environmental tools. A webinar held in January 2024 was particularly effective in highlighting the system’s intuitive design and educational potential, alongside constructive suggestions for incorporating more personalized visualization options and local knowledge. The wide range of attendees, from scientists and students to educators and community members, reflects the system’s broad appeal and the importance of engaging a diverse audience to gather comprehensive feedback and foster a collaborative environment for environmental monitoring and education. This approach not only fosters community involvement, but also ensures that the system remains adaptable and responsive to the evolving needs of users, thereby enhancing its effectiveness in monitoring and responding to river ice dynamics and related hazards.
In summary, this study underscores the significance of an automated, multi-source remote sensing system in enhancing the monitoring of river ice conditions. The integration of advanced image processing techniques and the usability of the system represent substantial advancements in the field. Equally important is the inclusion of citizen science data, which provides invaluable ground-truth observations that complement remote sensing datasets. This synergistic approach, combining technological innovation with community engagement, enriches the analysis and interpretation of ice conditions. Recognizing and addressing the system’s limitations, including the need for broader image processing capabilities and the constraints in data pre-processing, is crucial for extending its applicability and effectiveness in river ice monitoring. Emphasizing the collaborative use of remote sensing and citizen science data not only improves the accuracy of our observations, but also fosters a more comprehensive understanding of river ice dynamics.

5. Conclusions

This study represents a significant advancement in the field of remote sensing applied to river ice monitoring, particularly in the challenging and under-observed regions of Alaska. By integrating a range of technologies, including the Google Earth Engine, cloud computing, and deep learning, alongside traditional remote sensing methods and citizen science data, the research offers a comprehensive FAIR approach to environmental monitoring and hazard assessment.
The development of an automated, multi-source remote sensing system has demonstrated its efficacy in providing near real-time, accurate, and detailed insights into river ice conditions. This system successfully harnesses the power of big data to enhance our understanding and responsiveness to the dynamic nature of river ice and related hazards. We have also illustrated possible applications and usages of the system, such as validating remote sensing data, conducting temporal and spatial analyses of land cover, and monitoring ice-induced hazards, showcasing its versatility.
The inclusion of citizen science data is particularly noteworthy, as it provides ground-truth observations that greatly complement satellite imagery, thereby enriching the analysis. Despite these advancements, the study also acknowledges the limitations of the current system, such as the need for broader image processing capabilities within the GEE and constraints in data pre-processing. These limitations highlight areas for future improvement and underline the ongoing need for innovation and development in the field.
In summary, this research contributes significantly to environmental management and hazard assessment in Alaska, offering a robust and accessible tool for river ice monitoring. It lays the foundation for future work that can further refine and expand the capabilities of remote sensing in understanding and managing the complexities of river ice dynamics and their broader environmental and societal impacts.

Author Contributions

Conceptualization, M.A., M.T. and D.R.N.B.; methodology, M.A., J.H.B.M. and M.T.; software, M.A., J.H.B.M., M.T. and J.H.B.M.; validation, M.A.; formal analysis, M.A., M.T., D.R.N.B. and K.V.S.; resources, M.T., K.V.S., C.D.A. and D.R.N.B.; data collection, K.V.S., D.R.N.B., C.D.A., A.B. and H.K.; data curation, M.A., J.H.B.M., H.K. and A.B.; writing—original draft preparation, M.A. writing—review and editing, M.T., D.R.N.B. and K.V.S.; visualization, M.A. and J.H.B.M. All authors have read and agreed to the published version of the manuscript.

Funding

The authors acknowledge the partial support received from the Cooperative Institute for Research to Operations in Hydrology (CIROH) under Federal Award Number: NA22NWS4320003, Subaward Number: A22-0305-S003, and National Aeronautics and Space Administration (NASA) ROSES Citizen Science for Earth Systems Program [Award # 80NSSC22K1915].

Data Availability Statement

The generated VIIRS-based river ice maps can be accessed and downloaded in GeoTIFF format (size limited to 30 MB per image) using the Google Earth Engine enable interface available at https://web.stevens.edu/ismart/land_products/rivericemapping.html (accessed on 27 March 2023). Fresh Eyes on Ice observation network data is available at https://fresheyesonice.org/ (accessed on 27 March 2023). A tutorial of the web application is available as a HydroShare resource accessible at: http://www.hydroshare.org/resource/ede5012241d64e10a223f96a3648d7e9 (accessed on 27 March 2023).

Acknowledgments

We extend our thanks to the local observers for their contributions, which have greatly improved the accuracy and effectiveness of our river ice monitoring efforts.

Conflicts of Interest

Author Holli Kohl was employed by the company NASA Goddard Space Flight Center and Science Systems and Applications, Inc. The remaining authors declare that the research was conducted in the absence of any commercial or financial relationships that could be construed as a potential conflict of interest.

References

  1. Yang, X.; Pavelsky, T.M.; Allen, G.H. The Past and Future of Global River Ice. Nature 2020, 577, 69–73. [Google Scholar] [CrossRef] [PubMed]
  2. Beaton, A.; Whaley, R.; Corston, K.; Kenny, F. Identifying Historic River Ice Breakup Timing Using MODIS and Google Earth Engine in Support of Operational Flood Monitoring in Northern Ontario. Remote Sens. Environ. 2019, 224, 352–364. [Google Scholar] [CrossRef]
  3. Chu, T.; Lindenschmidt, K.E. Integration of Space-Borne and Air-Borne Data in Monitoring River Ice Processes in the Slave River, Canada. Remote Sens. Environ. 2016, 181, 65–81. [Google Scholar] [CrossRef]
  4. Richards, E.; Stuefer, S.; Rangel, R.C.; Maio, C.; Belz, N.; Daanen, R. An Evaluation of GPR Monitoring Methods on Varying River Ice Conditions: A Case Study in Alaska. Cold Reg. Sci. Technol. 2023, 210, 103819. [Google Scholar] [CrossRef]
  5. Gatto, L.W. Monitoring River Ice with Landsat Images. Remote Sens. Environ. 1990, 32, 1–16. [Google Scholar] [CrossRef]
  6. Vuyovich, C.M.; Daly, S.F.; Gagnon, J.J.; Weyrick, P.; Zaitsoff, M. Monitoring River Ice Conditions Using Web-Based Cameras. J. Cold Reg. Eng. 2009, 23, 1–17. [Google Scholar] [CrossRef]
  7. Brown, D.R.N.; Arp, C.D.; Brinkman, T.J.; Cellarius, B.A.; Engram, M.; Miller, M.E.; Spellman, K.V. Long-Term Change and Geospatial Patterns of River Ice Cover and Navigability in Southcentral Alaska Detected with Remote Sensing. Arct. Antarct. Alp. Res. 2023, 55, 2241279. [Google Scholar] [CrossRef]
  8. Gorelick, N.; Hancher, M.; Dixon, M.; Ilyushchenko, S.; Thau, D.; Moore, R. Google Earth Engine: Planetary-Scale Geospatial Analysis for Everyone. Remote Sens. Environ. 2017, 202, 18–27. [Google Scholar] [CrossRef]
  9. Pérez-Cutillas, P.; Pérez-Navarro, A.; Conesa-García, C.; Zema, D.A.; Amado-Álvarez, J.P. What Is Going on within Google Earth Engine? A Systematic Review and Meta-Analysis. Remote Sens. Appl. Soc. Environ. 2023, 29, 100907. [Google Scholar] [CrossRef]
  10. Waleed, M.; Sajjad, M. On the Emergence of Geospatial Cloud-Based Platforms for Disaster Risk Management: A Global Scientometric Review of Google Earth Engine Applications. Int. J. Disaster Risk Reduct. 2023, 97, 104056. [Google Scholar] [CrossRef]
  11. Castillo, E.B.; Turpo Cayo, E.Y.; De Almeida, C.M.; López, R.S.; Rojas Briceño, N.B.; Silva López, J.O.; Gurbillón, M.Á.B.; Oliva, M.; Espinoza-Villar, R. Monitoring Wildfires in the Northeastern Peruvian Amazon Using Landsat-8 and Sentinel-2 Imagery in the GEE Platform. ISPRS Int. J. Geo-Inf. 2020, 9, 564. [Google Scholar] [CrossRef]
  12. DeVries, B.; Huang, C.; Armston, J.; Huang, W.; Jones, J.W.; Lang, M.W. Rapid and Robust Monitoring of Flood Events Using Sentinel-1 and Landsat Data on the Google Earth Engine. Remote Sens. Environ. 2020, 240, 111664. [Google Scholar] [CrossRef]
  13. Ghaffarian, S.; Farhadabad, A.R.; Kerle, N. Post-Disaster Recovery Monitoring with Google Earth Engine. Appl. Sci. 2020, 10, 4574. [Google Scholar] [CrossRef]
  14. Liu, Z.; Liu, H.; Luo, C.; Yang, H.; Meng, X.; Ju, Y.; Guo, D. Rapid Extraction of Regional-Scale Agricultural Disasters by the Standardized Monitoring Model Based on Google Earth Engine. Sustainability 2020, 12, 6497. [Google Scholar] [CrossRef]
  15. Khan, R.; Gilani, H. Global Drought Monitoring with Big Geospatial Datasets Using Google Earth Engine. Environ. Sci. Pollut. Res. 2021, 28, 17244–17264. [Google Scholar] [CrossRef]
  16. Mehmood, H.; Conway, C.; Perera, D. Mapping of Flood Areas Using Landsat with Google Earth Engine Cloud Platform. Atmosphere 2021, 12, 866. [Google Scholar] [CrossRef]
  17. Scheip, C.M.; Wegmann, K.W. HazMapper: A Global Open-Source Natural Hazard Mapping Application in Google Earth Engine. Nat. Hazards Earth Syst. Sci. 2021, 21, 1495–1511. [Google Scholar] [CrossRef]
  18. Venkatappa, M.; Sasaki, N.; Han, P.; Abe, I. Impacts of Droughts and Floods on Croplands and Crop Production in Southeast Asia—An Application of Google Earth Engine. Sci. Total Environ. 2021, 795, 148829. [Google Scholar] [CrossRef]
  19. Yan, Y.; Zhuang, Q.; Zan, C.; Ren, J.; Yang, L.; Wen, Y.; Zeng, S.; Zhang, Q.; Kong, L. Using the Google Earth Engine to Rapidly Monitor Impacts of Geohazards on Ecological Quality in Highly Susceptible Areas. Ecol. Indic. 2021, 132, 108258. [Google Scholar] [CrossRef]
  20. Supervised Classification. Google Earth Engine. Google for Developers. Available online: https://developers.google.com/earth-engine/guides/classification (accessed on 20 November 2023).
  21. Ee.Classifier.SmileRandomForest. Google Earth Engine. Google for Developers. Available online: https://developers.google.com/earth-engine/apidocs/ee-classifier-smilerandomforest (accessed on 20 November 2023).
  22. Ee.Classifier.SmileNaiveBayes. Google Earth Engine. Google for Developers. Available online: https://developers.google.com/earth-engine/apidocs/ee-classifier-smilenaivebayes (accessed on 20 November 2023).
  23. Ee.Classifier.Libsvm. Google Earth Engine. Google for Developers. Available online: https://developers.google.com/earth-engine/apidocs/ee-classifier-libsvm (accessed on 20 November 2023).
  24. Orlecka-Sikora, B.; Lasocki, S.; Kocot, J.; Szepieniec, T.; Grasso, J.R.; Garcia-Aristizabal, A.; Schaming, M.; Urban, P.; Jones, G.; Stimpson, I.; et al. An Open Data Infrastructure for the Study of Anthropogenic Hazards Linked to Georesource Exploitation. Sci. Data 2020, 7, 89. [Google Scholar] [CrossRef]
  25. Garcia-Silva, A.; Gomez-Perez, J.M.; Palma, R.; Krystek, M.; Mantovani, S.; Foglini, F.; Grande, V.; De Leo, F.; Salvi, S.; Trasatti, E.; et al. Enabling FAIR Research in Earth Science through Research Objects. Futur. Gener. Comput. Syst. 2019, 98, 550–564. [Google Scholar] [CrossRef]
  26. Cannon, M.; Kelly, A.; Freeman, C. Implementing an Open & FAIR Data Sharing Policy—A Case Study in the Earth and Environmental Sciences. Learn. Publ. 2022, 35, 56–66. [Google Scholar] [CrossRef]
  27. Hut, R.; Drost, N.; Van De Giesen, N.; Van Werkhoven, B.; Abdollahi, B.; Aerts, J.; Albers, T.; Alidoost, F.; Andela, B.; Camphuijsen, J.; et al. The EWaterCycle Platform for Open and FAIR Hydrological Collaboration. Geosci. Model Dev. 2022, 15, 5371–5390. [Google Scholar] [CrossRef]
  28. Citizen Science: Public Participation in Environmental Research; Dickinson, J.L.; Bonney, R. (Eds.) Cornell University Press, Comstock Publishing Associates: Ithaca, NY, USA, 2015. [Google Scholar] [CrossRef]
  29. Shirk, J.L.; Ballard, H.L.; Wilderman, C.C.; Phillips, T.; Wiggins, A.; Jordan, R.; McCallie, E.; Minarchek, M.; Lewenstein, B.V.; Krasny, M.E.; et al. Public Participation in Scientific Research: A Framework for Deliberate Design. Ecol. Soc. 2012, 17, 29. [Google Scholar] [CrossRef]
  30. Amos, H.M.; Starke, M.J.; Rogerson, T.M.; Colón Robles, M.; Andersen, T.; Boger, R.; Campbell, B.A.; Low, R.D.; Nelson, P.; Overoye, D.; et al. GLOBE Observer Data: 2016–2019. Earth Sp. Sci. 2020, 7, e2020EA001175. [Google Scholar] [CrossRef]
  31. Dodson, J.B.; Colón Robles, M.; Rogerson, T.M.; Taylor, J.E. Do Citizen Science Intense Observation Periods Increase Data Usability? A Deep Dive of the NASA GLOBE Clouds Data Set With Satellite Comparisons. Earth Space Sci. 2023, 10, e2021EA002058. [Google Scholar] [CrossRef]
  32. Bonney, R.; Cooper, C.B.; Dickinson, J.; Kelling, S.; Phillips, T.; Rosenberg, K.V.; Shirk, J. Citizen Science: A Developing Tool for Expanding Science Knowledge and Scientific Literacy. Bioscience 2009, 59, 977–984. [Google Scholar] [CrossRef]
  33. Zhang, T.; Osterkamp, T.E.; Stamnes, K. Some Characteristics of the Climate in Northern Alaska, U.S.A. Arct. Alp. Res. 1996, 28, 509–518. [Google Scholar] [CrossRef]
  34. Arp, D.; Cherry, E.; Brown, R.N.; Bondurant, C.; Endres, L. Observation-Derived Ice Growth Curves Show Patterns and Trends in Maximum Ice Thickness and Safe Travel Duration of Alaskan Lakes and Rivers. Cryosphere 2020, 14, 3595–3609. [Google Scholar] [CrossRef]
  35. Alaska Mapping Business Plan—Appendix 2: An Overview of Communities in Alaska. Available online: https://www.commerce.alaska.gov/web/dcra/communityinformation.aspx (accessed on 27 March 2024).
  36. Alaska Mapping Business Plan—Integrating Mapping, Risk Assessment and Resilience Planning. Available online: https://www.commerce.alaska.gov/web/dcra/PlanningLandManagement/RiskMAP/AlaskaMappingBusinessPlan.aspx (accessed on 27 March 2024).
  37. Newton, B.W.; Prowse, T.D.; De Rham, L.P. Hydro-Climatic Drivers of Mid-Winter Break-up of River Ice in Western Canada and Alaska. Hydrol. Res. 2017, 48, 945–956. [Google Scholar] [CrossRef]
  38. Beltaos, S. Threshold between Mechanical and Thermal Breakup of River Ice Cover. Cold Reg. Sci. Technol. 2003, 37, 1–13. [Google Scholar] [CrossRef]
  39. Qi, M.; Liu, S.; Yao, X.; Xie, F.; Gao, Y. Monitoring the Ice Phenology of Qinghai Lake from 1980 to 2018 Using Multisource Remote Sensing Data and Google Earth Engine. Remote Sens. 2020, 12, 2217. [Google Scholar] [CrossRef]
  40. Zakharova, E.; Agafonova, S.; Duguay, C.; Frolova, N.; Kouraev, A. River Ice Phenology and Thickness from Satellite Altimetry: Potential for Ice Bridge Road Operation and Climate Studies. Cryosphere 2021, 15, 5387–5407. [Google Scholar] [CrossRef]
  41. Zhang, X.; Yue, Y.; Han, L.; Li, F.; Yuan, X.; Fan, M.; Zhang, Y. River Ice Monitoring and Change Detection with Multi-Spectral and SAR Images: Application over Yellow River. Multimed. Tools Appl. 2021, 80, 28989–29004. [Google Scholar] [CrossRef]
  42. Altena, B.; Kääb, A. Quantifying River Ice Movement through a Combination of European Satellite Monitoring Services. Int. J. Appl. Earth Obs. Geoinf. 2021, 98, 102315. [Google Scholar] [CrossRef]
  43. Zhang, H.; Li, H.; Li, H.; Zhang, H.; Li, H.; Li, H. Monitoring the Ice Thickness in High-Order Rivers on the Tibetan Plateau with Dual-Polarized C-Band Synthetic Aperture Radar. Remote Sens. 2022, 14, 2591. [Google Scholar] [CrossRef]
  44. Temimi, M.; Abdelkader, M.; Tounsi, A.; Chaouch, N.; Carter, S.; Sjoberg, B.; Macneil, A.; Bingham-Maas, N. An Automated System to Monitor River Ice Conditions Using Visible Infrared Imaging Radiometer Suite Imagery. Remote Sens. 2023, 15, 4896. [Google Scholar] [CrossRef]
  45. Liu, B.; Ji, H.; Zhai, Y.; Luo, H. Estimation of River Ice Thickness in the Shisifenzi Reach of the Yellow River with Remote Sensing and Air Temperature Data. IEEE J. Sel. Top. Appl. Earth Obs. Remote Sens. 2023, 16, 5645–5659. [Google Scholar] [CrossRef]
  46. Chaouch, N.; Temimi, M.; Romanov, P.; Cabrera, R.; Mckillop, G.; Khanbilvardi, R. An Automated Algorithm for River Ice Monitoring over the Susquehanna River Using the MODIS Data. Hydrol. Process. 2014, 28, 62–73. [Google Scholar] [CrossRef]
  47. Earth Engine Data Catalog. Google for Developers. Available online: https://developers.google.com/earth-engine/datasets (accessed on 20 November 2023).
  48. Sentinel-3 OLCI EFR: Ocean and Land Color Instrument Earth Observation Full Resolution. Earth Engine Data Catalog. Google for Developers. Available online: https://developers.google.com/earth-engine/datasets/catalog/COPERNICUS_S3_OLCI (accessed on 26 March 2024).
  49. GLOBE Observer—GLOBE Observer—GLOBE.Gov. Available online: https://observer.globe.gov/ (accessed on 20 November 2023).
  50. Observation List. Available online: https://obs.feoi.axds.co/observations/ (accessed on 20 November 2023).
  51. River Ice Camera University of Alaska Fairbanks. Available online: https://fresheyesonice.org/view-data/realtime-data/river-ice-camera/ (accessed on 20 November 2023).
  52. Kealy, K.; Danielson, J.; Allen, D. Fresh Eyes on Ice: Assessment of the river ice information needs of Alaskans. In Technical Evaluation Report Prepared for the Fresh Eyes on Ice Program of the University of Alaska Fairbanks, National Weather Service, Tanana Chiefs Conference, and NASA GLOBE Observer; Goldstream Group LLC: Fairbanks, AK, USA, 2022. [Google Scholar]
  53. Fresh Eyes on Ice: Search. Available online: https://idevs.portal.axds.co/#search?type_group=all&page=1 (accessed on 10 December 2023).
  54. Land Products. I-SMART. Available online: https://web.stevens.edu/ismart/land_products/rivericemapping.html (accessed on 22 November 2023).
  55. Donchyts, G.; Baart, F. Advanced Raster Visualization. In Cloud-Based Remote Sensing with Google Earth Engine; Springer: Cham, Switzerland, 2024; pp. 527–556. [Google Scholar] [CrossRef]
  56. Madaeni, F.; Chokmani, K.; Lhissou, R.; Homayouni, S.; Gauthier, Y.; Tolszczuk-Leclerc, S. Convolutional Neural Network and Long Short-Term Memory Models for Ice-Jam Predictions. Cryosphere 2022, 16, 1447–1468. [Google Scholar] [CrossRef]
  57. River Watch Program. Available online: https://www.weather.gov/aprfc/riverWatchProgram (accessed on 22 November 2023).
Figure 1. Geographical location of the study area and main rivers network (a), pie chart of rivers with the highest ice jam frequencies (2000–2023) (b), histogram of temporal changes in ice jam numbers (2000–2023) (c).
Remotesensing 16 01368 g001
Figure 2. Methodological framework for monitoring ice conditions.
Remotesensing 16 01368 g002
Figure 3. Data integration and posting workflow in the Google Earth Engine.
Remotesensing 16 01368 g003
Figure 4. User interface of the river ice monitoring system [54]. The interface showcases the most recent citizen science data as red dots, historical citizen science data in blue, and live cameras in turquoise blue. The date selection tool is highlighted within the green box, data download options are enclosed in the red box, and the screen split feature is outlined in the orange box. A comprehensive legend detailing the displayed river ice maps and ice concentration levels is available in the portal.
Remotesensing 16 01368 g004
Figure 5. Confusion matrix and assessment metrics for the VIIRS River Ice product versus the Fresh Eyes on Ice dataset (Water Year 2023).
Remotesensing 16 01368 g005
Figure 6. Spatiotemporal evolution of ice, snow, and water cover over sections of the Yukon River, water year 2022.
Remotesensing 16 01368 g006
Figure 7. Monitoring ice-induced flooding over the Yukon River in Fort Yukon using multi-source data. Sentinel-2 observation (a), citizen science images (b), and VIIRS River Ice product images (c).
Remotesensing 16 01368 g007
Figure 8. Monitoring of the ice jam along the Forty Mile River near Chicken using Sentinel-2 and citizen science data.
Remotesensing 16 01368 g008
Figure 9. Monitoring the impact of near-record ice-induced flooding at Circle on 16 May 2023. VIIRS River Ice product (a), VIIRS ice concentration (b), Sentinel-3 image (c), Sentinel-2 image (d), Sentinel-1 image (e), Sentinel-1 image (a detailed zoom-in of image subfigure (e)) (f), citizen science data (g), and citizen science data description (h). The location of the citizen science data is indicated by a red dot.
Remotesensing 16 01368 g009
Table 1. Overview of integrated satellite data sources.
Satellite Sensor(s)Sensor TypeSpatial Resolution
Landsat 8OLI/TIRSOptical30 m
Landsat 9OLI-2/TIRS-2Optical30 m
Sentinel-1C- SARRadar10 m
Sentinel-2MSIOptical10 m
Sentinel-3SLSTROptical300 m
NOAA-20VIIRSOptical375 m
Table 2. User needs analysis for river ice monitoring system development in Alaska [52].
Target UserNeeds
Transportation Agencies
-
Predicting and managing ice-related disruptions in transport routes.
-
Ensuring the safety of the road and bridge infrastructure.
General Public
-
Accessing near real-time ice condition information for daily activities.
-
Safety information for the recreational use of water bodies.
Indigenous Communities
-
Maintaining traditional activities that depend on river conditions.
-
Preserving cultural practices linked to river ecosystems.
Scientific Researchers
-
Data for studying climatic patterns and ice dynamics.
-
Validation of models for ice cover prediction.
Weather Agencies
-
Enhancing weather forecasts with real-time ice coverage data.
-
Integrating ice conditions in emergency weather alerts.
Military
-
Supporting winter training and operations in the far north through reliable ice condition data.
-
Utilizing long records of ice data for strategic planning and operational safety.
Oil and Gas Companies
-
Monitoring ice conditions for safe drilling and transportation.
-
Planning and executing seasonal logistics.
Emergency Management Services
-
Preparing for and responding to ice-related emergencies.
-
Coordinating with other agencies for disaster relief efforts.
Marine Navigation Services
-
Navigational safety for boats and shipping vessels.
-
Ice movement forecasts for route planning.
Environmental Conservation Groups
-
Tracking the impact of climate change on river ecosystems.
-
Monitoring ice breakup patterns affecting wildlife.
Outdoor Recreation and Tourism Businesses
-
Providing clients with safe excursion planning.
-
Assessing ice conditions for sports and tourist activities.
Local Fishermen
-
Ensuring the safety and sustainability of fisheries.
-
Accessing updated information for fishing activities and safety measures.
Disclaimer/Publisher’s Note: The statements, opinions and data contained in all publications are solely those of the individual author(s) and contributor(s) and not of MDPI and/or the editor(s). MDPI and/or the editor(s) disclaim responsibility for any injury to people or property resulting from any ideas, methods, instructions or products referred to in the content.

