Abstract
In this article, we propose a joint waveform based on universal filtered multicarrier (UFMC) chirp for radar jamming and communication joint systems. Modulation of radar jamming chirp signals and communication signals on different subcarrier groups in the UFMC sub-band is used to achieve the waveform design. The jamming signal in the waveform contains a frequency shift coefficient that depends on the delay time, which can effectively improve the anti-frequency hopping ability and enhance the overall jamming efficiency. Simultaneously jamming signals can provide assistance in channel estimation and equalization of communication, improving the information transmission quality of communication subsystems. We concluded through reasonable trade-off analysis that the combined weight of radar jamming and communication is closely related to the overall performance of the waveform. The simulation results show that the proposed UFMC chirp synthesized waveform has good jamming and communication performance. Software defined radio (SDR) simulation experiments demonstrated the effectiveness of this method in practical environments.
1. Introduction
With the rapid development of information theory and electronic technology, the deployment and utilization of various electronic devices are showing exponential growth, and spectrum resources are becoming increasingly scarce. Radar and wireless communications, as important electronic systems, have been developing independently and each occupies a significant portion of spectrum resources. With the continuous improvement in information technology and the huge demand for high-quality services from infinite devices, the scope of their work is constantly penetrating into each other’s traditional spectrum range, leading to an increasingly tense contradiction in spectrum resources [1]. Due to their many similarities in signal processing algorithms, device usage, and system architecture, they are likely to share spectrum, which has sparked a strong interest in the coexistence, collaboration, and collaborative design of these two systems [2].
The design concept of the Joint Radar and Communication System (JRCS) is to integrate these two functions into one system, and the initial concept can be traced back to the 1960s [3]. The design of JRCS can be divided into two categories [4]. The first type is the physical integration of two functions into a system, which uses two dedicated hardware components and/or two different waveforms, stacked and/or separated in the time domain, frequency domain, or spatial domain [5,6,7]. For example, JRCS based on the sampling technique is proposed in reference [8], which transmits two signals on different frequency bands to avoid mutual interference. Reference [9] embeds different communication information into radar pulses to achieve JRCS, which can provide different symbol error rate (SER) performance, but its communication rate is very low, only on the order of Kbps. Reference [10] designed JCRS that can perform radar and communication simultaneously by allocating subcarriers of orthogonal frequency division multiplexing (OFDM) waveforms. However, the uncertainty of radar and communication channels can affect the performance of this method and increase the computational complexity of the system. The integration of such JRCS methods is relatively loose, and the benefits obtained may be limited; furthermore, each system will cause additional mutual interference, requiring signal processing work to mitigate these interferences [11,12]. The second type achieves more robust integration by sharing most hardware components and using the same waveform. Single spectrum shared transmission signals are used for both radar detection and data communication, known as dual function radar communication (DFRC). DFRC aims to optimize communication and radar performance, and most research has focused on designing such dual function waveforms [13]. Reference [14] provides a good review of the historical development and latest technologies of DFRC. Although DFRC can significantly improve spectral efficiency, its challenge lies in balancing the performance indicators of radar and communication systems, thereby improving radar resolution, communication, and bit error rate (BER) performance. For example, reference [15] proposed an algorithm for jointly designing transmission waveforms and reception filters, which maximizes the detection performance of DFRC systems and enables multi-user communication. However, as the number of communication users increases, the radar detection performance will decrease, and a basic balance is needed to ensure the joint performance of the system. In order to improve the detection/imaging performance of radar sensors and improve performance in multi-user communication, multiple input multiple output (MIMO) technology has been widely applied in DFRC systems [16,17]. However, most of the dual function waveforms generated by this method are based on pre-coding methods [18,19,20] or OFDM format [21,22,23]. This means that the generated bifunctional waveform may not necessarily provide the expected deterministic waveform characteristics, such as low peak to average power ratio (PAPR) or expected radar blur function [24].
In this multifunctional combination, in order to reduce the detection quality of noncooperative radars and protect the regions of interest (ROIs) from observation and detection, various electronic countermeasures are usually used, including stand-off supported jamming (SSJ) and self-defense jamming (SDJ). The research on electronic countermeasures (ECMs) and radar jamming methods has also attracted attention from the radar industry [25]. The methods and techniques for jamming radar can be broadly categorized into active jamming and passive jamming [26,27]. With the development of digital radio frequency memory (DRFM), the active jamming techniques have been increasingly researched [28]. In this regard, this article only discusses active jamming. Functionally, radar jamming can be further classified into suppression jamming [29,30,31] and deception jamming [32,33,34], each involving multiple forms. Suppression jamming involves injecting signals into the enemy radar to submerge echoes from real targets. This is achieved by generating wideband and narrowband active noise signals on the radar’s sweep frequency band, creating a suppression jamming environment. The introduction of artificial noise disrupts the normal operation of the radar by increasing its input noise level and reducing the signal-to-noise ratio (SNR). However, the pulse compression processing of radar signals results in a high processing gain for target echoes, making suppression jamming unsuitable for many scenarios due to the high jamming power output required [35]. Deception jamming, on the other hand, retransmits or modulates the intercepted radar signals to form false target signals with high processing gain, thereby masking the real target and protecting ROIs. Additionally deceptive jamming can generate low jamming signal ratios (JSRs) and realistic targets [36].
Similarly, the integrated design of joint radar jamming and communication is also necessary for two main reasons. Firstly, radar jamming signals have the characteristics of a wide beam, large bandwidth, and high energy. These characteristics make it difficult to successfully complete communication during radar jamming operation. Secondly, radar jammers that form a network need to interact with each other to better complete radar jamming tasks. If traditional technological means are used, radar jamming and communication need to be completed at different times and/or frequencies, which is equivalent to requiring additional time–frequency resources. The integrated design of joint radar jamming and communication can use the same time and spectrum to complete communication tasks while jamming, effectively avoiding additional consumption caused by issues such as the above. However, there has been very little research on the integration design of radar jamming and communication so far. Therefore, researching the integrated system of radar jamming and communication is not only crucial in the field of ECM, but also extends the scope of effective spectrum resource utilization and provides a basis to carry out new research areas.
The reference [37] first studied the combination method of radar jamming and communication. This approach employs false target jamming to elevate the detection threshold while maintaining an unchanged false alarm probability. By modulating the mapping of communication data, linear frequency modulation (LFM) signals with different Doppler slopes and frequency slopes can effectively carry multiple bits of data, thus interfering with radar signals while ensuring the completion of communication commands. However, its communication rate is very low and it is not suitable for large-scale communication scenarios.
As communication technology continues to evolve, the limitations of traditional multicarrier modulation techniques are becoming increasingly evident. OFDM has found widespread application in fourth-generation (4G) wireless communication systems, renowned for its efficient utilization of frequency resources and high-speed data rate processing capabilities. However, its high PAPR, interference among subcarriers, and inefficient use of frequency resources render it unsuitable for 5G and even 6G wireless communication [38]. UFMC has the potential to provide better performance compared to other waveform technologies, especially in multi-user scenarios and in the presence of channel impairments [39]. By reducing inter-carrier interference (ICI) and relaxing inter-carrier synchronization requirements, UFMC ensures enhanced performance in synthetic aperture radar (SAR) and integrated communication channels. Moreover, its avoidance of CP minimizes inter-symbol interference (ISI) and ICI, promoting spectrum efficiency and preventing errors in imaging targets. Its low delay spread also positions it more favorably than filter bank multicarrier (FBMC) in high-repetition-rate radar modes.
In the study of reference [40], an integrated waveform combining FBMC with radar jamming was proposed using FBMC chirp as the design waveform to minimize out-of-band signal leakage. However, the use of prototype filters in FBMC results in an increased signal duration. FBMC also faces challenges in scenarios involving burst communication and short-duration emergency communications, and it is poorly suited for MIMO systems. In addition, it falls short of simultaneously managing communication and jamming with targets. Therefore, FBMC is not the best multicarrier modulation method to combine with radar jamming. Reference [41] analyzed the performance of UFMC in JRCS and found that JRCS based on UFMC can improve overall performance in terms of spectrum efficiency and complexity. However, their advantages in radar jamming and communication integration design have not been fully explored.
2. Contributions of Our Work
In this work, we explore and demonstrate the potential of UFMC in combining radar jamming and communication. To the best of the authors’ knowledge, this is the first series of studies to combine radar jamming and communication through UFMC. In particular, this will be the first work to present the joint radar jamming and communication using UFMC. To that end, we:
- Generated UFMC chirp waveforms for the joint function of radar jamming and communication.
- Analyzed the advantages of UFMC in radar jamming and communication joint systems, discussed the constraints of joint waveforms, provided the auxiliary process of joint waveforms for communication subsystems, and provided a design trade-off analysis of radar jamming and communication.
- Conducted simulation experiments; the results indicate that the joint waveform based on UFMC chirp can effectively enable jamming with radar and exhibit excellent communication error rate performance.
- Implemented the proposed method on software defined radio (SDR) devices and demonstrated its feasibility.
The remaining sections of the paper are organized as follows: Section 3 introduces the configuration of the application scenarios. Section 4 presents the modulation principles of UFMC, compares UFMC with FBMC and OFDM, introduces the waveform design of UFMC chirp, and outlines the processing flow at the transmitting and receiving ends of the joint signal. Section 5 analyzes the constraints and evaluation metrics for the joint signal. Section 6 presents the simulation experiments, validating the feasibility of the proposed method in terms of communication and jamming functionalities. Section 7 presents the feasibility assessment of the proposed joint system using SDR-based hardware implementation. Finally, the research conclusions are summarized in Section 8.
3. Model Construction and Application Scenarios
In accordance with various application scenarios, devices adhere to varying design principles. Figure 1 illustrates the typical application scenario of the joint radar jamming and communication system proposed in this paper.
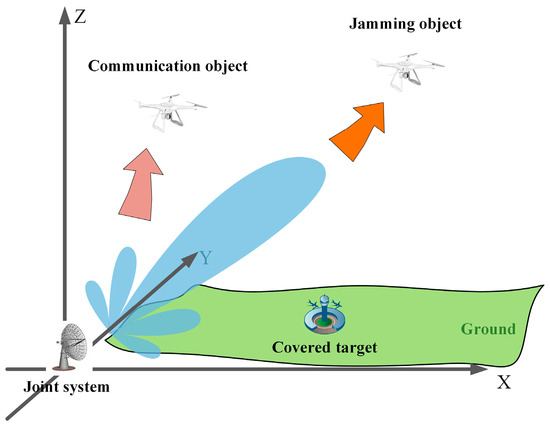
Figure 1.
Application scenario of joint communication and jamming system.
In Figure 1, the integrated system is deployed on the ground in response to an approaching unknown unmanned aerial vehicle (UAV), which may be operating in either tracking search mode or SAR imaging mode. To protect ground targets from reconnaissance, the unknown UAV’s signals would have to be jammed, preventing it from detecting the protected targets. Simultaneously, there are known UAVs taking off and departing, necessitating the fulfillment of communication requirements. Transmitting jamming signals and communication signals separately would pose a significant challenge, as the wide beam and high energy of jamming signals can impact the communication process. To ensure optimal communication quality, it is crucial to design jamming signals that incorporate communication data, addressing a critical requirement for the integrated system.
The ground-based integrated system effectively detects radar signals from jammed objects, followed by the generation of simulated target echo signals strategically designed to deceive the airborne radar systems of the jammed objects. This action disrupts their normal functioning, thereby protecting ground targets from detection. Concurrently, communication data is transmitted to the communication target. The communication target is equipped to assess the real-time behavior of the jammed objects and can execute commands based on the received communication data. Due to the relatively low directional requirements of the antenna for communication tasks, the communication target efficiently receives and processes joint signals emitted from sidelobes, ensuring the fulfillment of communication functions.
4. Implementation of Joint Plans
4.1. UFMC Modulation Principle
UFMC is a communication transmission scheme developed based on the principle of frequency division multiplexing. In UFMC, each symbol divides the signal bandwidth into multiple sub-bands, and each sub-band carries a corresponding number of subcarriers to facilitate communication. The structure of a single UFMC symbol is illustrated in Figure 2.
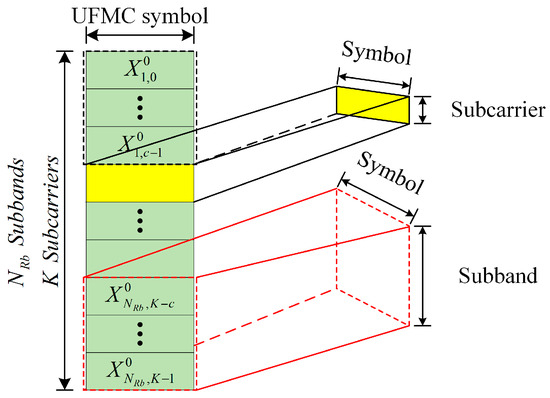
Figure 2.
The structure of the UFMC symbol.
In Figure 2, the yellow box represents the subcarriers of a single UFMC symbol, while the red dashed box illustrates the sub-band structure of a single UFMC symbol. A UFMC symbol is composed of a total of subcarriers, which are divided into sub-bands. Each sub-band contains subcarriers, where: . In the process of generating UFMC symbols, the input data are first divided into multiple low-rate sub-streams , such that refers to the number of UFMC symbol bits, and represents the number of sub-bands. The data of each sub-band undergo inverse discrete Fourier transform (IDFT) operations, transforming them into a time-domain digital resource block. Subsequently, a time-domain smoothing pulse shaping filter is applied to each resource block to reduce out-of-band leakage in the frequency domain. This method minimizes the out-of-band interference between adjacent sub-bands in neighboring resource blocks. Finally, these resource blocks are overlaid in the time domain to generate the baseband signal, which is then transmitted into the radio frequency (RF) domain. The signal in the time domain for transmission can be represented as:
such that:
where represents the modulation and weighting value of the subcarrier for the symbol, corresponds to the communication information carried by the subcarrier in the sub-band, , represents the inverse fast Fourier transform (IFFT) matrix, is the IFFT matrix for the sub-band block, and is the finite impulse response (FIR) filter matrix. is the filter matrix for the sub-band block and is a Toeplitz matrix with its first column as , such that is the length of the FIR filter, and the coefficient represents the FIR filter coefficients for the resource block, . Each filter coefficient is selected to be for every filter.
To evaluate the advantages of UFMC signals compared to OFDM and FBMC signals, a temporal structure analysis was conducted for these three modulation schemes. Modulation in both OFDM and UFMC signals utilizes QAM, while FBMC signals, to maintain a uniform symbol data rate, employ offset quadrature amplitude modulation (OQAM) modulation. The temporal characteristics of these three modulation schemes are illustrated in Figure 3.
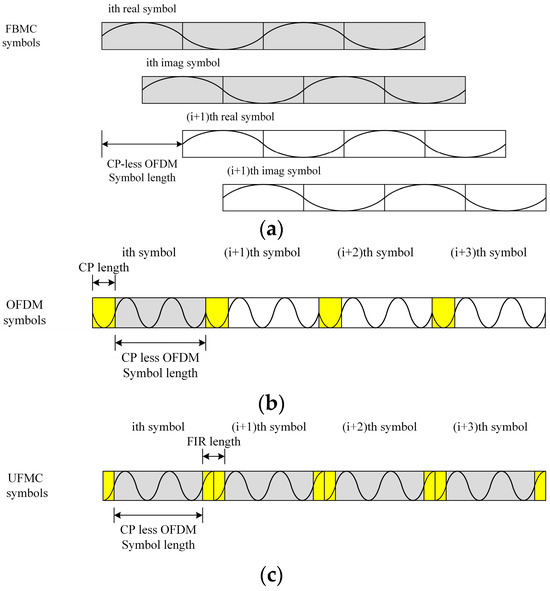
Figure 3.
Temporal comparison of symbols for OFDM, FBMC, and UFMC depicted in the time-domain: (a) CP-OFDM symbols; (b) FBMC-OQAM symbols; (c) UFMC symbols.
In Figure 3, given the length of the transmitted data (), to avoid ISI, a CP is added at the beginning of each OFDM symbol, thus forming a complete OFDM symbol. The total length of a single OFDM symbol is , such that is the CP length. In the case of FBMC, which employs OQAM modulation, the complex signal is partitioned into two components, and a transmission delay of half a symbol period is introduced between the first two to achieve full-speed signal transmission. Unlike OFDM, FBMC operates without the necessity of a CP for ISI mitigation. Assuming the prototype filter overlap factor for FBMC is , the length of a single FBMC symbol is .
Within the UFMC framework, sub-band filters create rising and falling regions at the start and end of a single UFMC symbol. The regions provide a ‘soft’ ISI protection for UFMC symbols, eliminating the need for a CP. However, the use of filters introduces an additional time-domain extension for UFMC. Assuming the time-domain extension length of the filter is , the length of a single UFMC symbol is . Note that is related to the length of the FIR filter used in UFMC and that the FIR filter length can be adjusted to change . If is adjusted to match , the length of a single UFMC symbol becomes equal to the length of an OFDM symbol, i.e., . Despite this equivalence, the out-of-band leakage of the UFMC spectrum is considerably smaller than that of OFDM, underscoring its superior spectral efficiency.
In general, the overlap factor used in FBMC is typically set to 4, resulting in a single FBMC symbol length equal to . In the context of the 802.11 protocol, where the length is , the length of a single UFMC and OFDM symbol is much smaller than the length of a single FBMC symbol. Additionally, due to the longer time sequence required to generate a single FBMC symbol, UFMC is more advantageous than FBMC for short-burst communication.
4.2. Joint Signal Design
The FBMC chirp [40] and OFDM chirp [42] waveforms have been proposed in previous studies, employing the fundamental principle of modulating chirp signals onto distinct subcarrier groups. Due to the inherent orthogonality of subcarriers in OFDM and FBMC signals, signals on different subcarrier groups naturally satisfy orthogonality. This characteristic facilitates signal separation both at the transmitter and receiver ends.
In order to achieve jamming functionality, UFMC signals are modulated with chirp signals, resulting in UFMC chirp. Note that the structure of UFMC chirp signals differs from that of pure OFDM chirp and FBMC chirp signals due to the inclusion of sub-band structures, along with the subcarriers in UFMC signals. This distinctive characteristic allows UFMC chirp signals to be flexibly applied to any sub-band, thus serving the dual purpose of multiple-target radar jamming and communication.
Figure 4 illustrates the frequency-domain structure of the UFMC chirp signal, where the integrated signal symbols are shaped by two signals within each sub-band block. Multiplexing of the signal frequency bands is achieved by dividing the available sub-band blocks into multiple sub-bands, modulating the information to be sent to each subcarrier within each sub-band, and subsequently transmitting these signals simultaneously. Note that two orthogonal UFMC chirp waveforms are generated by zero interleaving and shifting of a single chirp spectrum as the input sequence.
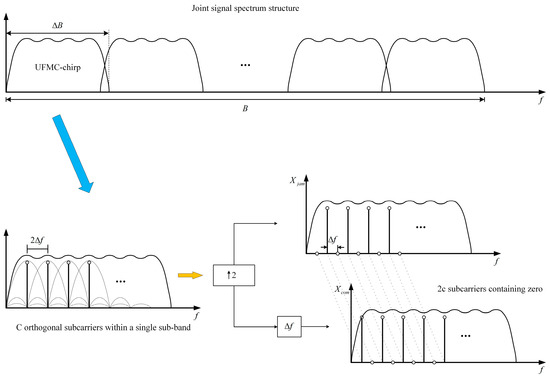
Figure 4.
Integrated signal symbols for subcarrier modulation.
The proposed integrated signal technology in this study leverages the orthogonality of discrete frequency components, specifically subcarriers. Assuming the input sequence spectrum consists of sub-band blocks, each sub-band block contains discrete spectral components spaced apart by . Initially, the input sequence is zero interleaved with zeros, as depicted by in Figure 4. Next, the interleaved input sequence is shifted by to obtain the second data sequence . These data sequences are then transformed into the time domain through the IDFT operation with points. Note that both sets comprise subcarriers, with each set only utilizing subcarriers to convey input data.
If the spectrum of a chirp signal is employed for UFMC modulation, then the time-domain generation matrix of the UFMC chirp signal can be expressed as:
where is the number of product signals, , is the row index of the matrix, is the column index of the matrix, is the pulse width of the chirp signal, and is the frequency modulation slope of the chirp signal, expressed by the ratio of the signal bandwidth to , (i.e., ). As shown by Equation (6), when generating orthogonal signals, the pulse width will also increase by a factor of .
In this paper, taking two orthogonal integrated radar jamming and communication signals as an example, the signal matrix is given by:
where is the communication signal to be modulated, is the modulation weight of the sub-band, , and is the pseudo-random sequence encoding the information carried by the subcarrier in the sub-band. is the designed jamming signal, such that is the frequency-domain representation of the jamming signal in the sub-band.
The radar signal intercepted by the integrated device being jammed is given by the expression:
The integrated device induces jamming effects on the intercepted radar signal through frequency shifting and retransmission, resulting in the transmitted jamming signal , such that represents the frequency shift amount. Consequently, the result of fixed frequency-shift jamming after undergoing time-domain matched filtering can be expressed as:
where represents convolution, denotes the conjugate operation, and is a rectangular window function. Based on Equation (9), the maximum peak in the output after signal-matched filtering occurs at , and this peak is generated by the offset from the true signal peak moment. When there is a change in the frequency modulation slope () between radar pulses, false targets exhibit range jumps, preventing them from accumulating at the same distance.
If the intercepted radar signal is delayed by time and then truncated, the result can be expressed as:
where is a positive integer, . From Equation (10), the second term () can form the frequency shift term of the jamming signal by letting . Moreover, as long as the values of and are fixed, the ratio of to remains constant, i.e., . This allows to vary with the change in , enabling false targets to accumulate at the same distance.
At this point, as long as the term is eliminated, the remaining terms, , can be used as the jamming signal for transmission. Note that Equation (10) can be transformed as follows:
Multiplying both sides of Equation (11) by yields the original time-domain expression of the jamming signal:
where . When comparing the conventional frequency-shifted retransmitted jamming signal with the expression of in Equation (12), the frequency shift amount of the generated jamming signal is . The ratio of this frequency shift to the frequency modulation slope depends on the values of and . The frequency-domain expression of can be written as:
where , represents the Fourier transform operator. Therefore, can be expressed as:
such that .
Based on the above analysis, the time-domain expressions for the communication signal and jamming signal derived from the signal generation matrix are as follows:
By superimposing and in the time domain, the UFMC chirp integrated signal can be obtained using the expression:
4.3. Joint Signal Processing Flow
The waveform design and processing method for radar jamming and communication integration based on UFMC chirp is depicted in Figure 5.
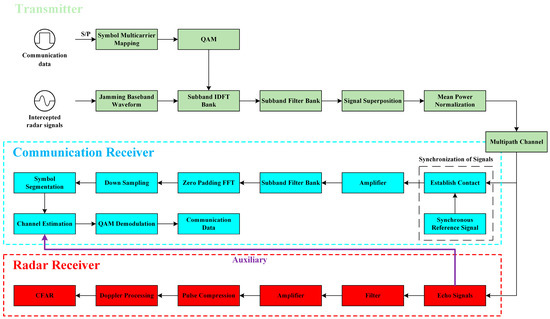
Figure 5.
Joint radar jamming and communication system flow based on UFMC chirp signal.
At the transmitter, the communication data are first converted from serial to parallel and then undergo multicarrier mapping to generate transmitted data. These data, after QAM modulation, produce frequency-domain communication signals. Simultaneously, the baseband waveforms of jamming signals are generated based on intercepted radar signals. The communication signals and jamming signals are superimposed and transformed into time-domain digital signals through sub-band IDFT. Sub-band filters are employed to reduce the out-of-band leakage of each sub-band. The time-domain signals of each sub-band are then superimposed, and before entering the radio frequency domain, their average value is removed, and the power is normalized to ensure uniform power across all transmitted signals. Following wireless transmission, in the jamming scenario, these signals reach the receiving end.
At the communication receiver, the received signal undergoes pulse synchronization first to determine the arrival time of the signal, ensuring accurate sampling. After amplification, it passes through a sub-band filter group to match the received signal and identify each sub-band. The signal undergoes zero-padding fast Fourier transform (FFT), followed by down-sampling to obtain the transmitted symbol information. Due to the impact of multiple paths in the channel, delays in the time domain are converted into phase differences in the frequency domain, affecting the demodulation results. Therefore, channel equalization is applied to the frequency signal to mitigate the influence of multipath channels. The jamming signal and communication signal are orthogonally demodulated and separated. Since the jamming signal is an LFM signal that does not carry communication data, it can be utilized for channel estimation, aiding in data recovery and assisting the communication system in restoring the original communication information.
When considering the impact of multipath channels in communication processing, assuming the number of multipath channels is , the integrated signal received at the communication end is given by:
where is the additive Gaussian white noise, is the Toeplitz channel matrix with its first column as , and is the channel impulse response on the path, expressed as:
where is the attenuation coefficient of the path and is the delay of the path.
The frequency-domain signal obtained by the communication target after receiving the time-domain signal, going through a matched filter, and undergoing FFT operation, can be expressed as:
where:
where is the frequency-domain signal on the sub-band at the receiver and is the information carried on the subcarrier in the sub-band. Following the joint signal generation principle outlined in Section 4.2, the UFMC chirp spectrum is obtained by up-sampling the spectrum of UFMC, resulting in the change in the number of subcarriers in each sub-band from to . refers to the frequency response of the multipath channel, and is the frequency-domain representation of the transmitted joint signal, determined by Equation (17). is the frequency-domain form of additive Gaussian white noise. The matrix can be expressed as:
where is the FFT transformation matrix, the conjugate transpose of is denoted as , is the FIR matched filter at the receiving end, and the conjugate transpose of is denoted as . After the communication system is designed, the value of can be precisely determined. Therefore, in Equation (20), when noise influence is not considered, it is only necessary to obtain the value of to demodulate the communication information.
Due to the up-sampling process in UFMC chirp, which shortens the original subcarrier spacing by half, two discrete frequency components are generated at fixed intervals. The two frequency components at fixed intervals have a strong correlation with the frequency selectivity of the channel. It can be approximated that these two channels are the same:
where . As per Equation (17), the frequency-domain information structure of the joint signal sent is intertwined with both communication information and jamming information. Therefore, Equation (26) can be decomposed into odd and even terms:
where is the communication information and is the jamming signal resulting from frequency-shifted retransmission, with its value given by Equation (14).
Since the frequency spectrum structure of the LFM signal is fixed, can be considered as a pilot signal suitable for channel estimation. The received part of can be expressed as:
where is the corresponding channel frequency response, is a known term derived from , and is Gaussian white noise. Channel estimation can be obtained through the least squares (LS) method, resulting in an estimated channel frequency response:
Based on the result from Equation (28), the corresponding channel frequency response for the transmission of communication information is obtained as:
By reversing Equation (33), the overall multipath channel frequency response for the received signal is obtained as . The channel can be equalized to recover the communication information and achieve the communication target.
At the radar receiver, this signal is considered as the reflected radar signal originating from the target but with superimposed jamming signals. Consequently, standard radar processing procedures are applied, employing moving target detection (MTD) technology to assess target motion. From the perspective of jamming, maintaining consistency in the jamming signal within each pulse repetition period is essential to obtain coherent processing gain. In addition, during the radar power detection process, the detection threshold should be controlled to maximize detection power. The constant false alarm rate (CFAR) detection algorithm, widely adopted in practical radar signal processing, regulates the threshold to ensure a constant false alarm rate throughout the detection process.
Specifically, CFAR can use the noise, jamming, or ground clutter around the target echo signal to estimate the power of clutter signals in space. Following variations in clutter signal power, it filters out noise signals and detects target signals by setting an appropriate threshold. However, in scenarios where jamming is present in the reference cells, CFAR tends to overestimate noise power. This results in a higher CFAR detection threshold than the actual target signal power, creating a masking effect on the target. At the same time, the elevated CFAR detection threshold diminishes the power of the jamming signal below the detection threshold, rendering the jamming signal undetectable by the opposing radar.
In situations involving multiple false targets, the power of jamming signals from false targets significantly surpasses the noise power. When the power of these jamming signals from false targets remains constant, the CFAR detector on the corresponding side detects multiple false targets. Consequently, the CFAR detection threshold experiences an increase under such circumstances.
5. System Constraints
Given the primary objective of designing the joint signal, namely achieving communication while simultaneously jamming, the design specifications for jamming are subject to more rigorous requirements, necessitating a more stringent approach. Referencing [40], the system constraints associated with the proposed joint signal in this study are thoroughly examined.
5.1. Design of Frequency Modulation Slope
According to Equation (8), the finely tuned signal with frequency modulation slope can be expressed as:
where is the frequency modulation slope mismatch value. The frequency-domain expression of can be derived from the method of stationary phase as:
The frequency-domain matched filtering of Equation (35) can be expressed as:
where is the frequency-domain representation of the matched filtering reference signal:
Substituting Equations (35) and (37) into Equation (36), the frequency-domain output of the matched filter is given by:
According to Equation (38), the positive and negative signs will yield different effects on . When , conducting the inverse Fourier transform on produces the time-domain expression after matched filtering:
When , Equation (39) becomes:
From the above derivation, it can be concluded that the pulse compression output of frequency modulation slope mismatch jamming is no longer in the form of a function, but approximates a rectangle with a width of:
In Equation (41), the width of the output rectangle is related to the frequency modulation mismatch slope. Selecting two mismatched frequency modulation slopes and , corresponding to and , respectively, the pulse compression results are illustrated in Figure 6. The figure reveals that a mismatch in the frequency modulation slope leads to a sharp decline in the amplitude of the pulse compression result, accompanied by a significant widening of the time width.
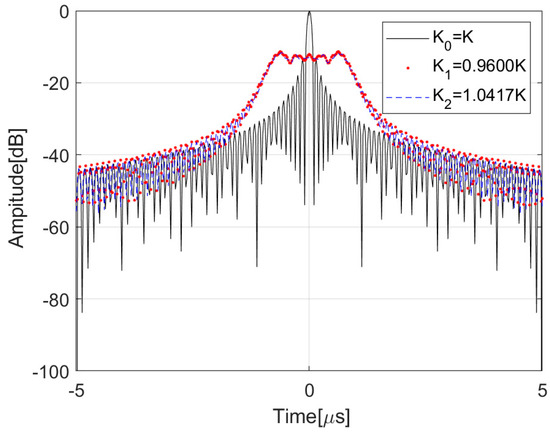
Figure 6.
The pulse compression results in different frequency modulation slope ratios.
The analysis of peak output and time delay expansion for the above chirp rates is shown in Figure 7. In the figure, the black dashed line represents the normalized peak value and effective time width of the pulse compression output of the chirp rate mismatched signal when the bandwidth changes with a time width of 50 µs. When the bandwidth is 10 MHz and the time width is 50 µs, the signal is in a matched state. Note that, under these conditions, the peak value of the pulse compression is highest, and the effective time width is minimal, forming an effective main lobe peak.
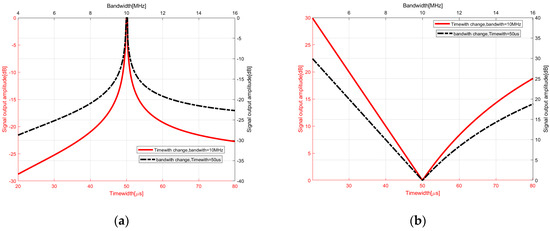
Figure 7.
Impact of effective pulse width on peak output of pulse compression for chirp rate mismatched signals: (a) peak pulse compression results under different frequency modulation slopes and bandwidth conditions; (b) pulse width results of pulse compression under different time widths and bandwidth conditions.
From a jamming perspective, the selected jamming pattern involves the generation of multiple false targets, which requires the chirp jamming signal to be in phase with the radar signal. Therefore, it is crucial to prevent a mismatch in the chirp rate to preserve the pulse compression gain:
5.2. Minimum Detectable Signal-to-Noise Ratio and Matched Gain Ratio
To enhance detection performance in a multi-target environment, two widely employed CFAR detection methods are the average CFAR for cluttered environments and the ordered statistic CFAR designed for scenarios with multiple targets. In general, average CFAR performs well in backgrounds with uniform noise and clutter distribution. However, its performance may diminish significantly when multiple false targets are distributed on both sides of the target detection unit.
Building on prior detection information and assuming knowledge of the false alarm probability and detection probability for ordered statistic CFAR, the signal-to-noise ratio (SNR) of the target echo pulse, after coherent accumulation and matched filtering, is derived in ordered statistic CFAR detection under the condition of no jamming:
The variables in the equation represent the following parameters: is the radar transmission power, is the radar transmit antenna gain, is the radar receive antenna gain, is the signal wavelength, is the target scattering cross-section, is the radial distance between the radar and the target, is the Boltzmann constant, is the effective noise temperature, is the signal bandwidth, is the receiver noise figure, and accounts for losses such as atmospheric losses and losses in the radar feedline.
The SNR for the joint radar jamming and communication integration system, assuming it is located in the direction of the transmitted jamming signal from the radar, can be expressed as:
where represents the loss ratio of the matching filter gain between the secondary frequency-shift jamming and the target echo, is the integrated signal transmission power of the joint system, is the jamming antenna gain of the joint system, and is the atmospheric loss and losses in the joint system. Based on Equation (12), the ratio of the jamming signal’s frequency shift to the frequency slope is dependent on and . Therefore, can be expressed as:
In the CFAR detection of the jammed radar system, given the false alarm probability , minimum detectable probability , and radar-related parameters, the minimum SNR required for the joint system can be determined. Substituting the obtained into Equation (44) yields the corresponding for the joint system.
As the jammed radar approaches the protected target, the radial distance between the radar and the target decreases. Figure 8 presents the joint system’s minimum required jamming SNR in this scenario and the minimum matching gain ratio for different positions. As shown in the figure, as decreases, the values for and both increase. This trend arises because as the distance decreases, the jammed radar receives stronger jamming signals, leading to an increase in SNR. The heightened SNR, in turn, results in an increase in the target echo-matched filter gain–loss ratio.
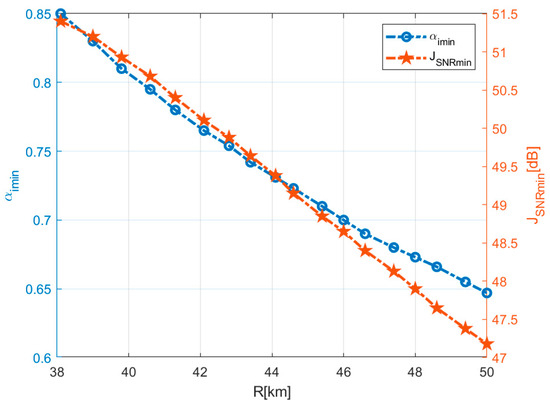
Figure 8.
Graph showing the required and at different positions.
5.3. Design of False Target Delay Interval
To ensure optimal jamming intensity, excessively large delay spacing for false targets should be avoided. Elevated false target density presents challenges in generating jamming signals, leading to heightened difficulty. Additionally, the impact of superposition introduces consequential reductions in the power and coherence of individual false target signals, thereby affecting jamming performance.
From Equation (45), it can be observed that as the delay increases, the jamming matching filter gain–loss ratio also increases. The delays corresponding to positive and negative shifts of the target can be expressed as:
Upon comparing Equations (46) and (47), it becomes apparent that the matching loss incurred beyond false targets surpasses the corresponding loss behind false targets. Denoting the maximum delays for positive and negative shifts of the target as and , the results of employing positive and negative frequency shifts at various positions to reduce the detection probability of the jammed radar to 0.1, as it progressively approaches the protected target, are shown in Figure 9.
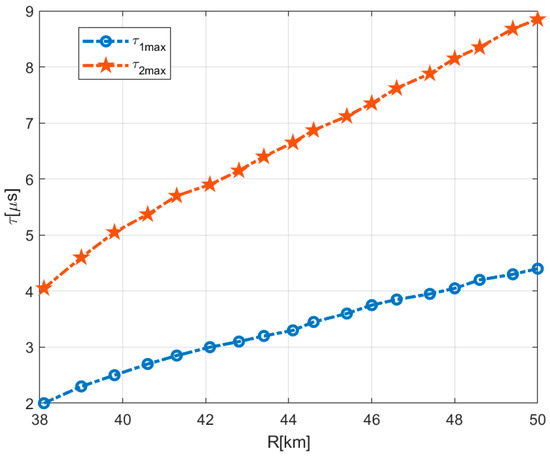
Figure 9.
Result chart of maximum delay of positive and negative frequency shifts at different positions.
Figure 9 shows that as the distance decreases, the maximum delay also decreases; however, the delay associated with a positive frequency shift remains lower than that with a negative frequency shift. This discrepancy can be attributed to the greater matching loss beyond false targets, resulting in a diminished detection capability of the jammed radar, which is more favorable for protecting the target under detection.
To enhance jamming suppression, the interval of false targets can be set to the length of the equivalent CFAR reference cell. From a communication standpoint, the delay interval is considered as the symbol width, influencing the maximum communication rate. The expression for communication rate can be written as:
where represents the pulse coherent accumulation number captured by the intercepted radar, and denotes the communication data carried by a single UFMC symbol using QAM modulation. Analysis of Equation (48) suggests that, when and are constant, a smaller delay interval leads to a higher communication rate.
5.4. Design of the Number of False Targets
The jamming signal from multiple false targets is composed of several components with different delays. The maximum delay of these false targets should not exceed the PRT of the intercepted radar signal. Therefore, the number of false targets in the jamming signal has an upper bound, which is defined by:
6. Simulation Experiments and Performance Analysis
To validate the effectiveness of the proposed design, this section details the parameters for joint simulation experiments involving the signal and target, along with the corresponding performance analysis.
6.1. Communication Performance Analysis
First, an analysis of the communication performance of UFMC chirp is conducted. The primary factor affecting the performance of UFMC is the subdivision of its sub-bands. To validate the performance results under different sub-band partitioning scenarios, the simulation parameters for UFMC chirp are provided in Table 1.

Table 1.
UFMC simulation parameter settings.
To highlight the advantages of UFMC chirp, a comparative analysis was conducted among four different modulation schemes: OFDM, FBMC chirp, parameter modulation, and UFMC chirp, all executed under identical experimental settings. The experimental results are presented in Figure 10.
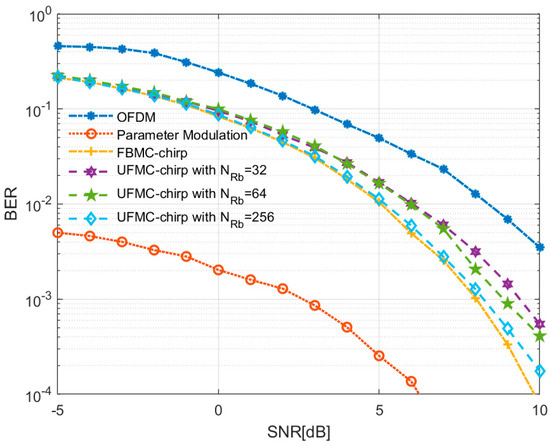
Figure 10.
Joint system communication performance results.
In Figure 10, the blue dashed line represents the bit error rate (BER) results of OFDM signals in Rayleigh channel conditions, the yellow plus sign line represents the results of FBMC chirp signals, and the red circle line represents the results of parameter modulation. The purple hexagon, green pentagram, and light blue rhombus lines represent the results of UFMC chirp under different sub-band partitioning. Analysis of the figure suggests that the communication performances of FBMC chirp, parameter modulation, and UFMC chirp surpass that of OFDM signals. This superiority can be attributed to the filter structures utilized in joint waveforms FBMC and UFMC, resulting in reduced out-of-band leakage and stronger subcarrier orthogonality. Consequently, the impact of ICI and ISI in a multipath environment is effectively mitigated. Moreover, the jamming component of the joint signal can assist in channel estimation, leading to additional improvements in BER performance.
Simultaneously, an increase in the number of UFMC sub-bands correlates with improved BER performance. The increased sub-bands contribute to less out-of-band leakage, facilitating the satisfaction of subcarrier orthogonality and ultimately enhancing BER performance. However, despite employing more UFMC sub-band partitions, the individual filtering of each subcarrier remains challenging, leading to some ICI and ISI jamming in UFMC chirp. This limitation prevents UFMC chirp from achieving better BER performance than FBMC.
In radar signal processing, the FFT operates in the slow time domain, leading to enhanced SNR after coherent accumulation processing. When SNR exceeds 6 dB, the parameter modulation approach achieves a BER below [37]. Therefore, coherent accumulation processing is crucial for both FBMC chirp and UFMC chirp to achieve satisfactory BER performance, requiring a relatively high SNR. This ensures the joint system’s capability to effectively jam while accurately completing communication tasks.
6.2. Jamming Performance Analysis
To meet the requirements for dense false target jamming, the simulation experiments employed a fixed number of false targets, set to . Each false target is placed around the true target. For ease of simulation analysis, the parameter in Equation (12) is set to the smallest positive integer, i.e., let . To assess the jamming effect of the integrated signal on the radar, the detection performance of the jammed radar is simulated using the parameters specified in Table 2.
Table 2.
Simulation radar parameter settings.
Figure 11a shows the time–frequency analysis results of the UFMC chirp-based relay jamming signal, encompassing 16 radar pulses and employing a Hamming window, which can be seen by taking one of the range lines and analyzing it in the time–frequency domain.
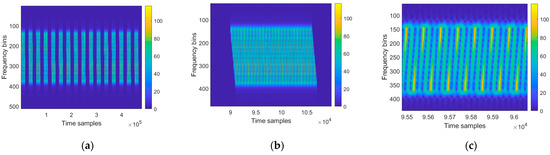
Figure 11.
Integrated waveform time–frequency analysis based on UFMC chirp: (a) overall time-frequency chart results; (b) the result with dense false target spacing; (c) the result of local magnification.
Figure 11b shows the analysis results of a single UFMC chirp jamming pulse in the time–frequency domain, and Figure 11c is a locally enlarged version of Figure 11b. The horizontal axis in the figure represents the time sample points, while the vertical axis represents the frequency sample points. From Figure 11c, it can be observed that the designed jamming signal in this article can target frequency, and the frequency of the jamming signal changes linearly over time and continues throughout the entire jamming cycle.
To further evaluate the radar jamming capability of the integrated system, a predefined real target and jamming signal are configured according to the specifications in Table 2. The processing results with and without jamming in the echo signal are illustrated in Figure 12a,d. Enlarged views of specific regions are provided in Figure 12b,e. In addition, Figure 12c,f depicts the impact on CFAR detection thresholds with and without multiple false target jamming.
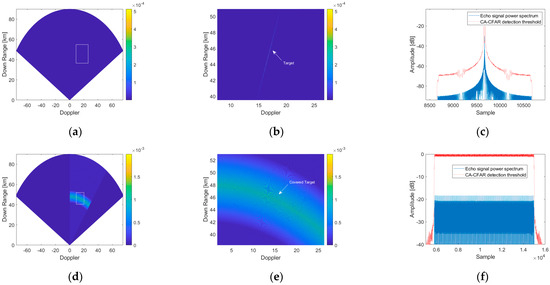
Figure 12.
The results of multi-false-target jamming under MTD and CFAR. The leftmost column (a,d) is the result of target echoes processed by MTD under the two cases; the second column (b,e) is the magnified MTD results; the third column (c,f) is the comparison of CFAR threshold.
From Figure 12a,b, it can be observed that in the absence of jamming, the target echo, after MTD processing, enables the accurate detection of the target’s position. Figure 12c shows the result after CFAR processing, indicating the successful detection of the real target by the radar system.
When the jamming signal designed in this study is introduced to the echo signal, as depicted in Figure 12d,e, the real target becomes submerged among a large number of false targets after MTD processing. Figure 12f represents the CFAR processing result, where the radar system fails to detect the real target. The jamming signal infiltrates the reference unit of the radar’s CFAR detection, causing the CFAR detection algorithm to estimate higher noise power. This results in a CFAR detection threshold exceeding 20 dB above the power of the target signal. As the increased CFAR detection threshold surpasses the power of the jamming signal, the radar system is unable to recognize the jamming signal, effectively achieving the objective of masking the real target.
6.3. The Trade-Off between Radar Jamming and Communication Performance
To highlight the impact of different interleaving factors on the radar jamming and communication capabilities of the joint signal, a comprehensive analysis was undertaken, involving systematic variations in the interleaving ratio between the two constituent components.
The process of signal interleaving increases the number of frequency-domain sampling points, resulting in periodic extension in the time domain of the joint signal. The ratio of interleaving between communication and jamming frequency points is given by the expression:
where represents the number of communication interleaving, and is the number of jamming interleaving. Let . When the interleaving ratio is , the time-domain duration of the joint signal will extend by a factor of compared to the original.
At the communication receiver, when , the communication system can use jamming signal frequency points adjacent to communication frequency points for auxiliary channel equalization. Conversely, if is less than , it results in a decrease in the communication rate of the joint signal. When , where is greater than , the communication rate of the joint signal increases, but the jamming signal frequency points are spaced significantly apart from the communication signal frequency points. In frequency selective fading channels, the effectiveness of auxiliary channel equalization gradually deteriorates with the increase in , resulting in a degradation of communication performance. The communication BER performance curves under different are depicted in Figure 13.
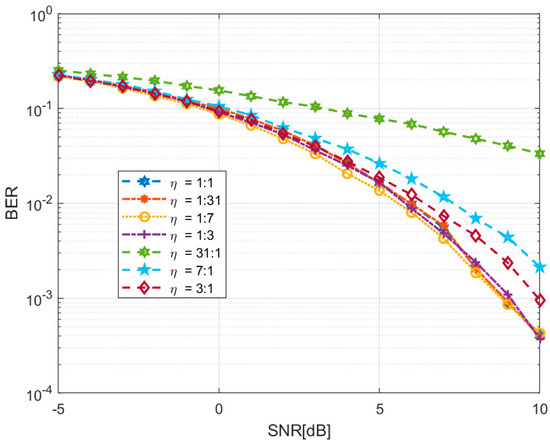
Figure 13.
The BER results under different .
In Figure 13, the blue hexagonal line, red cross line, yellow circular line, and purple plus sign line correspond to BER curves under the condition , while the green hexagonal line, blue pentagram line, and brown rhombus line depict the BER curves under the condition . Upon comparing the results in Figure 13, it can be observed that when , the BER performance is comparable across various interleaving scenarios. However, once , the BER performance degrades, and as continues to increase, the BER performance deteriorates further.
At the jammed radar end, under the condition of constant energy in the joint signal, the energy entering the radar within the time corresponding to the accumulated pulse count will decrease to . This reduction leads to a decrease in , causing a degradation of the jamming performance of the joint signal. Consequently, it fails to effectively obscure the true position of the target. The radar CFAR processing results obtained for different values of are illustrated in Figure 14.
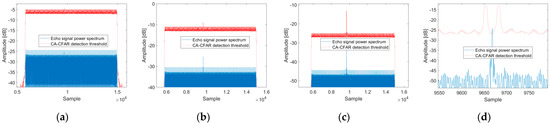
Figure 14.
The CFAR results under different : (a) the result of ; (b) the result of ; (c) the result of ; (d) the local magnification of (c).
Figure 14a,b depict CFAR results for and , respectively, while Figure 14c illustrates CFAR outcomes for . Figure 14d provides a magnified display of Figure 14c. Analysis of Figure 14 suggests that, with the power of the joint signal held constant, an incremental increase in results in a gradual reduction in the jamming capability of the signal until it can no longer mask the true target. This decline occurs as the number of jamming signal frequency points exceeds that of communication frequency points, a consequence of the periodic extension in the time domain, leading to a reduction in . Under specific conductions, such as , , and , the CFAR processing results align consistently with those presented in Figure 14a–c.
Combining the various simulation results reveals that different interleaving scenarios exert distinct effects on radar jamming and communication. In communication, when is greater than , the improvement in the communication rate is counterbalanced by a deterioration in BER performance. Conversely, when is less than , the BER performance remains unaffected by channel equalization, yet the communication rate continuously decreases. In jamming, the increase in the number of frequency-domain points for the joint signal, regardless of whether is greater than or is less than , leads to the dispersion of jamming energy in the time domain, thereby diminishing the jamming effect. Therefore, the ratio of interleaving between radar jamming and communication emerges as a performance trade-off. Based on the analyses and simulations presented, it can be concluded that under the condition of , denoting equal interleaving of communication and jamming, the overall performance of the joint signal is relatively better.
7. Hardware Implementation
The proposed joint radar jamming and communication system was validated on a SDR (the specific model was USRP X310, as shown in Figure 15) in a controlled laboratory environment to acquire data and evaluate its radar jamming and communication capabilities. The SDR generates integrated signals for radar jamming and communication tasks. The prototype is highly flexible since all parameters can be set, and the feasibility of the proposed waveform design was demonstrated. The specific experimental configuration and scenario are shown on the left side of Figure 15, consisting of a personal computer (PC) and a USRP. The internal signal processing flow of SDR is displayed on the right side.
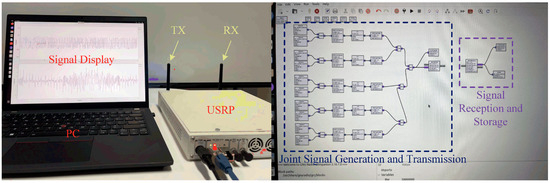
Figure 15.
Experimental platform and signal processing plow: SDR and PC.
The parameters were set as follows: signal bandwidth was 50 MHz, pulse repetition frequency (PRF) was 1 kHz, the number of UFMC sub-bands was 5, the communication jamming interweaving ratio was 1:1, and 4QAM was the selected modulation scheme. Data were collected on the PC to complete SAR imaging simulation and communication BER testing. The jamming echo data received by SDR were superimposed on the SAR imaging echo at the PC, and the results are shown in Figure 16.
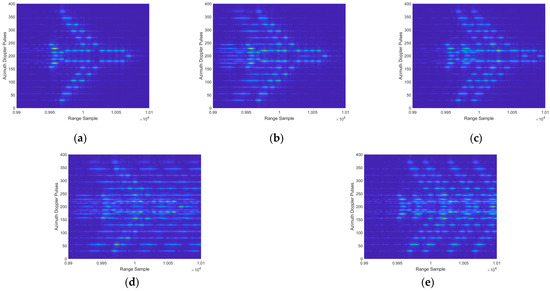
Figure 16.
SAR imaging results: (a) without jamming; (b) frequency shift jamming causes the result to appear before the real target; (c) frequency shift jamming causes the result to appear after the real target; (d) the result of increasing the number of jamming attempts on the basis of (b); (e) the result of increasing the number of jamming attempts on the basis of (c).
Figure 16a shows the SAR imaging results without jamming, and it can be seen that the imaging results are clearly visible at this time. Figure 16b,c, respectively, show the occurrence of false targets before and after the real target by setting the frequency shift of jamming signals. Figure 16d,e show the results of increasing the number of jamming signals to perform multiple false target jamming. Figure 16d is an extended version of Figure 16b, and Figure 16e is the extended result of Figure 16c. Under the influence of jamming, the image’s contrast is decreased and the detail information is covered by jamming, leading to multiple false targets in the range dimension.
Based on the above results, it can be seen that the integrated waveform of UFMC chirp proposed in this article can effectively jam with radar, and the leading or lagging positions of false targets are controllable, increasing the effectiveness of jamming. The BER result of communication is shown in Figure 17.
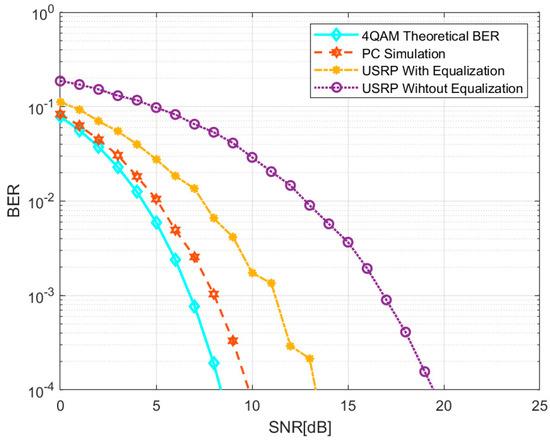
Figure 17.
BER from PC simulation and USRP testing.
In Figure 17, the blue diamond line represents the theoretical BER of 4QAM, the red hexagonal line represents the simulation results on the PC end, and the yellow star line and purple circle line represent the presence and absence of equalization BER in USRP, respectively. From the graph, it can be seen that as the SNR increases, all BER values show a downward trend. The PC simulation results are similar to the theory, but the imperfect equilibrium makes it impossible to match the theory. By comparing the BER curves of USRP, it can be seen that the BER performance has been improved after jamming signal assisted equalization. However, there is still some error between the measured results and the simulation results, which is due to the hardware damage of SDR itself and the complex and enclosed laboratory environment. When the SNR is greater than 15 dB, the BER is lower than , which can effectively complete the communication task.
The SDR experimental test results show that the proposed joint radar jamming and communication waveform have the ability to simultaneously achieve radar jamming and communication.
8. Conclusions
UFMC, a formidable contender among 5G waveforms, combines the strengths of FBMC and OFDM, resulting in a more effective trade-off. Its subcarrier partitioning, similar to FBMC, relaxes the requirement for subcarrier orthogonality. Moreover, UFMC eliminates the need for CP, leading to better spectral efficiency compared to OFDM. Its shorter time-domain symbols make it particularly suitable for burst communication scenarios. Additionally, UFMC exhibits excellent out-of-band suppression capabilities and achieves extremely high spectral efficiency, facilitating the concentration of jamming energy within the main lobe. This attribute extends the effective jamming distance, establishing UFMC as a superior choice for integrated radar jamming and communication systems compared to FBMC and OFDM.
The UFMC chirp joint waveform proposed in this study consolidates radar jamming and communication signals onto the same spectrum. In this innovative design, jamming signals can be modulated onto different sub-bands to increase the number of false targets generated within a single pulse period. At the same time, the frequency spectrum structure of the chirp signal is employed as the pilot segment in the communication signal. This aids in channel equalization, thereby enhancing overall communication performance. The integration of these features ensures the generation of dense false target jamming while simultaneously achieving high-speed communication transmission, completing diverse communication tasks.
The effectiveness of the proposed UFMC chirp method was substantiated through a series of simulation experiments. In a challenging multipath environment, UFMC chirp signals can enhance communication performance by increasing the number of sub-bands, aligning more closely with the characteristics of FBMC signals. Moreover, at the jamming end, the CFAR threshold can be raised by more than 20 dB, effectively shielding the target from detection. A detailed analysis of the interleaving ratio between communication and jamming is also presented, along with the identification of an optimal interleaving structure. This meticulous evaluation reinforces the efficacy of the integration waveform system proposed in this paper. In the actual environment simulation experiment of SDR, the proposed method effectively jams with SAR. The proposed system not only meets the current design requirements for joint radar jamming and communication systems, but also offers a practical and viable solution for integrated applications.
Author Contributions
Conceptualization, G.L.; Methodology, Z.H. and Q.Z.; Software, Z.H. and Q.Z.; Validation, B.M.; Formal analysis, G.L.; Investigation, Z.H.; Resources, B.M.; Data curation, Q.Z. and B.M.; Writing—original draft, Z.H. and Q.Z.; Writing—review & editing, G.L., B.M. and H.G.; Supervision, H.G.; Funding acquisition, G.L. and H.G. All authors have read and agreed to the published version of the manuscript.
Funding
This research received no external funding.
Data Availability Statement
The data presented in this study are available on request from the corresponding author.
Acknowledgments
The authors are thankful for the academic editor’s and reviewers’ comments on this work.
Conflicts of Interest
The authors declare no conflicts of interest.
References
- Liu, L.; Liang, X.; Li, Y.; Liu, Y.; Bu, X.; Wang, M. A Spatial–Temporal Joint Radar-Communication Waveform Design Method with Low Sidelobe Level of Beampattern. Remote Sens. 2023, 15, 1167. [Google Scholar] [CrossRef]
- Sturm, C.; Wiesbeck, W. Waveform Design and Signal Processing Aspects for Fusion of Wireless Communications and Radar Sensing. Proc. IEEE 2011, 99, 1236–1259. [Google Scholar] [CrossRef]
- Mealey, R.M. A Method for Calculating Error Probabilities in a Radar Communication System. IEEE Trans. Space Electron. Telem. 1963, 9, 37–42. [Google Scholar] [CrossRef]
- Zhang, J.A.; Liu, F.; Masouros, C.; Heath, R.W.; Feng, Z.; Zheng, L.; Petropulu, A. An Overview of Signal Processing Techniques for Joint Communication and Radar Sensing. IEEE J. Sel. Top. Signal Process. 2021, 15, 1295–1315. [Google Scholar] [CrossRef]
- Han, L.; Wu, K. Joint Wireless Communication and Radar Sensing Systems—State of the Art and Future Prospects. IET Microw. Antennas Propag. 2013, 7, 876–885. [Google Scholar] [CrossRef]
- Alaee-Kerahroodi, M.; Raei, E.; Kumar, S.; Bhavani Shankar, M.R. Cognitive Radar Waveform Design and Prototype for Coexistence with Communications. IEEE Sens. J. 2022, 22, 9787–9802. [Google Scholar] [CrossRef]
- Sen, P.; Harutyunyan, A.; Umar, M.; Kamal, S. Joint Communication and Radar Sensing: RF Hardware Opportunities and Challenges—A Circuits and Systems Perspective. Sensors 2023, 23, 7673. [Google Scholar] [CrossRef] [PubMed]
- Cohen, D.; Mishra, K.V.; Eldar, Y.C. Spectrum Sharing Radar: Coexistence via Xampling. IEEE Trans. Aerosp. Electron. Syst. 2018, 54, 1279–1296. [Google Scholar] [CrossRef]
- Blunt, S.D.; Yatham, P.; Stiles, J. Intrapulse Radar-Embedded Communications. IEEE Trans. Aerosp. Electron. Syst. 2010, 46, 1185–1200. [Google Scholar] [CrossRef]
- Ahmed, A.; Zhang, Y.D.; Hassanien, A. Joint Radar-Communications Exploiting Optimized OFDM Waveforms. Remote Sens. 2021, 13, 4376. [Google Scholar] [CrossRef]
- Kumar, S.; Mishra, K.V.; Gautam, S.; Shankar, M.R.B.; Ottersten, B. Interference Mitigation Methods for Coexistence of Radar and Communication. In Proceedings of the 2021 15th European Conference on Antennas and Propagation (EuCAP), Dusseldorf, Germany, 22–26 March 2021; pp. 1–4. [Google Scholar]
- Deng, H.; Himed, B. Interference Mitigation Processing for Spectrum-Sharing Between Radar and Wireless Communications Systems. IEEE Trans. Aerosp. Electron. Syst. 2013, 49, 1911–1919. [Google Scholar] [CrossRef]
- Pappu, C.S.; Beal, A.N.; Flores, B.C. Chaos Based Frequency Modulation for Joint Monostatic and Bistatic Radar-Communication Systems. Remote Sens. 2021, 13, 4113. [Google Scholar] [CrossRef]
- Wang, J.; Liang, X.-D.; Chen, L.-Y.; Li, Y.-L. Waveform Designs for Joint Wireless Communication and Radar Sensing: Pitfalls and Opportunities. IEEE Internet Things J. 2023, 10, 15252–15265. [Google Scholar] [CrossRef]
- Wu, W.; Tang, B.; Wang, X. Constant-Modulus Waveform Design for Dual-Function Radar-Communication Systems in the Presence of Clutter. IEEE Trans. Aerosp. Electron. Syst. 2023, 59, 4005–4017. [Google Scholar] [CrossRef]
- Xu, Z.; Petropulu, A. A Bandwidth Efficient Dual-Function Radar Communication System Based on a MIMO Radar Using OFDM Waveforms. IEEE Trans. Signal Process. 2023, 71, 401–416. [Google Scholar] [CrossRef]
- Wen, C.; Huang, Y.; Davidson, T.N. Efficient Transceiver Design for MIMO Dual-Function Radar-Communication Systems. IEEE Trans. Signal Process. 2023, 71, 1786–1801. [Google Scholar] [CrossRef]
- Liu, X.; Huang, T.; Shlezinger, N.; Liu, Y.; Zhou, J.; Eldar, Y.C. Joint Transmit Beamforming for Multiuser MIMO Communications and MIMO Radar. IEEE Trans. Signal Process. 2020, 68, 3929–3944. [Google Scholar] [CrossRef]
- Chen, L.; Liu, F.; Wang, W.; Masouros, C. Joint Radar-Communication Transmission: A Generalized Pareto Optimization Framework. IEEE Trans. Signal Process. 2021, 69, 2752–2765. [Google Scholar] [CrossRef]
- Liu, F.; Masouros, C.; Li, A.; Sun, H.; Hanzo, L. MU-MIMO Communications With MIMO Radar: From Co-Existence to Joint Transmission. IEEE Trans. Wirel. Commun. 2018, 17, 2755–2770. [Google Scholar] [CrossRef]
- Dokhanchi, S.H.; Shankar, M.R.B.; Stifter, T.; Ottersten, B. OFDM-Based Automotive Joint Radar-Communication System. In Proceedings of the 2018 IEEE Radar Conference (RadarConf18), Oklahoma City, OK, USA, 23–27 April 2018; pp. 0902–0907. [Google Scholar]
- Liu, Y.; Liao, G.; Xu, J.; Yang, Z.; Zhang, Y. Adaptive OFDM Integrated Radar and Communications Waveform Design Based on Information Theory. IEEE Commun. Lett. 2017, 21, 2174–2177. [Google Scholar] [CrossRef]
- Keskin, M.F.; Wymeersch, H.; Koivunen, V. MIMO-OFDM Joint Radar-Communications: Is ICI Friend or Foe? IEEE J. Sel. Top. Signal Process. 2021, 15, 1393–1408. [Google Scholar] [CrossRef]
- Wen, C.; Huang, Y.; Zheng, L.; Liu, W.; Davidson, T.N. Transmit Waveform Design for Dual-Function Radar-Communication Systems via Hybrid Linear-Nonlinear Precoding. IEEE Trans. Signal Process. 2023, 71, 2130–2145. [Google Scholar] [CrossRef]
- Wang, Y.; Jin, G.; Song, C.; Wang, Y.; Lu, P.; Han, S.; Lv, J.; Zhang, Y.; Wu, D.; Zhu, D. Parameterized and Large-Dynamic-Range 2-D Precise Controllable SAR Jamming: Characterization, Modeling, and Analysis. IEEE Trans. Geosci. Remote Sens. 2023, 61, 3279461. [Google Scholar] [CrossRef]
- Goj, W.W. Synthetic-Aperture Radar and Electronic Warfare; Artech House: Boston, MA, USA, 1993. [Google Scholar]
- Neng-Jing, L.; Yi-Ting, Z. A Survey of Radar ECM and ECCM. IEEE Trans. Aerosp. Electron. Syst. 1995, 31, 1110–1120. [Google Scholar] [CrossRef]
- Feng, D.; Xu, L.; Pan, X.; Wang, X. Jamming Wideband Radar Using Interrupted-Sampling Repeater. IEEE Trans. Aerosp. Electron. Syst. 2017, 53, 1341–1354. [Google Scholar] [CrossRef]
- Dumper, K.; Cooper, P.S.; Wons, A.F.; Condley, C.J.; Tully, P. Spaceborne Synthetic Aperture Radar and Noise Jamming. In Proceedings of the Radar 97 (Conf. Publ. No. 449), Edinburgh, UK, 14–16 October 1997; pp. 411–414. [Google Scholar]
- Ye, W.; Ruan, H.; Zhang, S.; Yan, L. Study of Noise Jamming Based on Convolution Modulation to SAR. In Proceedings of the 2010 International Conference on Computer, Mechatronics, Control and Electronic Engineering, Changchun, China, 24–26 August 2010; Volume 6, pp. 169–172. [Google Scholar]
- Garmatyuk, D.S.; Narayanan, R.M. ECCM Capabilities of an Ultrawideband Bandlimited Random Noise Imaging Radar. IEEE Trans. Aerosp. Electron. Syst. 2002, 38, 1243–1255. [Google Scholar] [CrossRef]
- Schuerger, J.; Garmatyuk, D. Deception Jamming Modeling in Radar Sensor Networks. In Proceedings of the MILCOM 2008—2008 IEEE Military Communications Conference, San Diego, CA, USA, 16–19 November 2008; pp. 1–7. [Google Scholar]
- Zhou, F.; Zhao, B.; Tao, M.; Bai, X.; Chen, B.; Sun, G. A Large Scene Deceptive Jamming Method for Space-Borne SAR. IEEE Trans. Geosci. Remote Sens. 2013, 51, 4486–4495. [Google Scholar] [CrossRef]
- Sun, Q.; Shu, T.; Yu, K.-B.; Yu, W. Efficient Deceptive Jamming Method of Static and Moving Targets Against SAR. IEEE Sens. J. 2018, 18, 3610–3618. [Google Scholar] [CrossRef]
- Yang, K.; Ye, W.; Ma, F.; Li, G.; Tong, Q. A Large-Scene Deceptive Jamming Method for Space-Borne SAR Based on Time-Delay and Frequency-Shift with Template Segmentation. Remote Sens. 2020, 12, 53. [Google Scholar] [CrossRef]
- Wang, Y.; Jin, G.; Shi, T.; Ma, R.; Zhang, Y.; Wu, D.; Zhu, D. Knowledge-Aided Precise Jamming Technique Against Spaceborne SAR System. IEEE Trans. Aerosp. Electron. Syst. 2024, 1–15. [Google Scholar] [CrossRef]
- Liu, G.; Yang, W.; Wang, Y.; Wang, Z.; Huang, D.; Li, P.; Bao, D.; Man, X.; Wu, B. Joint Communication Interference System Design Based on Parameter Modulation. Appl. Opt. 2022, 61, 1057. [Google Scholar] [CrossRef] [PubMed]
- Sharma, G.K.; Arya, R.K.; Nigam, V.S. Performance Analysis of UFMC for 5G Technologies with Different Channel Coding Techniques. In Proceedings of the 2023 International Conference on Signal Processing, Computation, Electronics, Power and Telecommunication (IConSCEPT), Karaikal, India, 25–26 May 2023; pp. 1–6. [Google Scholar]
- Heil, M.M.; Hammoodi, A.T.; Rasool, J.M. Multi-Windowing Technique for 5G and Beyond. J. Commun. 2023, 18, 714–721. [Google Scholar] [CrossRef]
- Liu, G.; Yang, W.; Bao, Y.; Wang, Y.; Li, P. Joint Communication and Jamming System Design Based on Filter Bank Multicarrier Chirp Waveform: Using for Curvilinear Flight Scenario. Remote Sens. 2023, 15, 1239. [Google Scholar] [CrossRef]
- Khelouani, I.; Elbahhar, F.; Elassali, R.; Idboufker, N. Performance Evaluation of 5G Waveforms for Joint Radar Communication over 77 GHz and 24 GHz ISM Bands. Energies 2022, 15, 2049. [Google Scholar] [CrossRef]
- Kim, J.H.; Younis, M.; Moreira, A.; Wiesbeck, W. A Novel OFDM Chirp Waveform Scheme for Use of Multiple Transmitters in SAR. IEEE Geosci. Remote Sens. Lett. 2013, 10, 568–572. [Google Scholar] [CrossRef]
Disclaimer/Publisher’s Note: The statements, opinions and data contained in all publications are solely those of the individual author(s) and contributor(s) and not of MDPI and/or the editor(s). MDPI and/or the editor(s) disclaim responsibility for any injury to people or property resulting from any ideas, methods, instructions or products referred to in the content. |
© 2024 by the authors. Licensee MDPI, Basel, Switzerland. This article is an open access article distributed under the terms and conditions of the Creative Commons Attribution (CC BY) license (https://creativecommons.org/licenses/by/4.0/).