Article

Automatic Building Roof Plane Extraction in Urban Environments for 3D City Modelling Using Remote Sensing Data

1
Faculty of Geo-Information Science and Earth Observation (ITC), University of Twente, 7521 AN Enschede, The Netherlands
2
GATE Institute, Sofia University “St. Kliment Ohridski”, 1113 Sofia, Bulgaria
*
Author to whom correspondence should be addressed.
Remote Sens. 2024, 16(8), 1386; https://doi.org/10.3390/rs16081386
Submission received: 24 January 2024 / Revised: 4 April 2024 / Accepted: 9 April 2024 / Published: 14 April 2024

Abstract

:
Delineating and modelling building roof plane structures is an active research direction in urban-related studies, as understanding roof structure provides essential information for generating highly detailed 3D building models. Traditional deep-learning models have been the main focus of most recent research endeavors aiming to extract pixel-based building roof plane areas from remote-sensing imagery. However, significant challenges arise, such as delineating complex roof boundaries and invisible boundaries. Additionally, challenges during the post-processing phase, where pixel-based building roof plane maps are vectorized, often result in polygons with irregular shapes. In order to address this issue, this study explores a state-of-the-art method for planar graph reconstruction applied to building roof plane extraction. We propose a framework for reconstructing regularized building roof plane structures using aerial imagery and cadastral information. Our framework employs a holistic edge classification architecture based on an attention-based neural network to detect corners and edges between them from aerial imagery. Our experiments focused on three distinct study areas characterized by different roof structure topologies: the Stadsveld–‘t Zwering neighborhood and Oude Markt area, located in Enschede, The Netherlands, and the Lozenets district in Sofia, Bulgaria. The outcomes of our experiments revealed that a model trained with a combined dataset of two different study areas demonstrated a superior performance, capable of delineating edges obscured by shadows or canopy. Our experiment in the Oude Markt area resulted in building roof plane delineation with an F-score value of 0.43 when the model trained on the combined dataset was used. In comparison, the model trained only on the Stadsveld–‘t Zwering dataset achieved an F-score value of 0.37, and the model trained only on the Lozenets dataset achieved an F-score value of 0.32. The results from the developed approach are promising and can be used for 3D city modelling in different urban settings.

1. Introduction

The rapid urban development and limited available land in urban areas have led to increased infrastructural developments above and below the ground surface [1]. The fundamental components of an urban area are buildings. The use of 3D building models in vector format is essential for creating accurate, interoperable, and efficient representations of urban environments. These models support a wide range of applications, from urban planning and design to disaster management and environmental analysis. Building structure mapping is a topic of ongoing study being explored in various industries since understanding these features helps to create detailed and realistic 3D city models [2]. Traditional 2D cadastral registration systems face challenges in capturing the evolving relationship between people and property in complex 3D urban environments [3]. Three-dimensional city models have emerged as a viable solution, offering a means to record and represent the various vertical developments within the 3D geographic information systems (GIS) [4]. Furthermore, 3D city models find applications in diverse fields, including urban planning, disaster management, energy efficiency, real estate, tourism, and serve as a cornerstone step toward realizing Urban Digital Twin [5].
Three-dimensional city models could be used as platforms for analytical and simulated analyses, opening avenues to unveil emergent patterns and behaviors within urban landscapes [6]. In the process of 3D model reconstruction, defining the desired level of detail (LOD) becomes essential. The concept of “levels of detail” (LODs) in the City Geography Markup Language (CityGML) standards offers a hierarchical division of the geometric and semantic representation of objects in a 3D city model [7]. Four LODs are defined in the Open Geospatial Consortium’s (2021) CityGML 3.0 standard [8]. Although the concept is centered mainly on buildings, it is meant for numerous thematic objects; the five cases mentioned increase in geometric and semantic complexity [9,10]. Around the world, there are many examples of 3D city models for large areas; an inventory by Santhanavanich (2020) demonstrates several examples of datasets containing building models of large cities or even nations [11]. However, the generation of these 3D city models generally relies on LIDAR point clouds, in which the extraction of building roof structures can be accomplished through point cloud segmentation [12]. This segmentation technique is complemented by integrating building footprints as a reference for each building segmentation [6], resulting in the creation of detailed roof structure comprising distinct roof planes. However, utilizing LIDAR is costly and may be challenging for many counties, particularly those in the path of development. Therefore, our study is focused on delineating building roof plane structures exclusively from aerial imagery to derive the geometry configuration of building rooftops, which afterwards serve as input for LOD2 3D city model creation [13].
In addition, the complexities associated with urban features pose substantial challenges for designing automated end-to-end frameworks that span the entire range from building information retrieval and feature extraction using remote-sensing data to complete 3D model reconstruction [14]. In this context, delineating building roof planes has become a central focus of recent research, mainly when a higher level of detail (LOD) of 3D city models is needed [15]. For this task, roof plane segmentation is an essential step in 3D building modeling. This process generates input data needed for reconstructing 3D building models at a minimum level of detail (LOD2) [16].
Despite many research attempts to delineate building rooftop planes from remote-sensing data, many of those attempts yield results in raster format, and limited exploration has been undertaken in the automated extraction of roof plane structures in vector format [17]. However, vector formats represent geometric objects with mathematical precision, allowing for accurate representation of building shapes and dimensions. In addition, vector formats facilitate the integration of building models with other geospatial data layers and are generally more efficient in terms of storage and processing compared to raster formats. To have precise vector 3D building models including their complex roof structures is crucial in 3D city modeling, where the accuracy of building footprints and heights is important for various applications, such as urban planning and disaster management. In that vein, the feasibility of manual extraction is compromised for large-scale projects due to significant investments in time and cost [18]. Therefore, machine-learning and deep-learning methods have emerged as promising solutions to address this challenge, enabling the automation of object delineation across diverse features, including buildings, roads, roofs, and land parcels, while ensuring efficient and accurate feature extraction [19]. However, the ability to mimic human-level perception for comprehensive geometric structures from images, especially in areas with complex topology or when a canopy or different obstacles obscure roof edges, remains a significant challenge in computer vision research [20].
Recent advancements are oriented towards achieving accurate 3D vector buildings in LOD2 with regularized outlines and straight edges [17]. Efforts are underway to explore end-to-end frameworks for accurate planar graph reconstruction of buildings [21]. Despite the diversity in input remote-sensing datasets, the inherent challenge persists due to varying roof topology configurations in different study areas [22]. Primarily, this challenge arises in achieving the capability to perform holistic structural reasoning, such as graph reconstruction derived from corners and edges—a formidable task for end-to-end neural networks [23].
A persistent challenge for developing automated feature extraction frameworks lies in obtaining, processing, and preparing suitable datasets. Thus, the complexity of built-up areas can lead to inaccuracies in the extracted features, giving rise to challenges, including such as occlusions, imprecise borders, and other issues [24], as highlighted in recent studies [25,26]. Understanding the configuration of building roof plane structures is paramount in developing detailed 3D models.
The presented research introduces a novel multi-stage framework for delineating and extracting roof plan structures from RGB images into a polygon vector format. The approach is to use HEAT [23] as a basis to detect corners and edges on the RGB input samples. Once all features have been detected, a planar graph of the identified structure on the input RGB image is obtained, which derives the framework’s next stage related to the planar graph’s vectorization. One of the achievements is that the proposed framework manages to extract even the invisible rooflines located under the vegetation. This is followed by a subsequent 3D modelling stage that combines the vector planar roof structures with digital elevation models to generate a LOD2 3D model of the applied study area. We have evaluated our framework in three different study areas: the Stadsveld–‘t Zwering area and Oude Mark area, both areas located in Enschede, The Netherlands, and the neighborhood of Lozenets, Sofia, Bulgaria. The qualitative and quantitative evaluations demonstrated that a model trained on a dataset from two different areas outperforms during the testing stage from all of the models trained in their specific areas.
The present study is organized as follows. Section 2 describes the study areas, presents the datasets employed in this study, and describes the two main stages utilized in our framework. Section 3 describes all the steps implemented in this study. Section 4 presents the quantitative and qualitative results obtained in our experiments. Following this, Section 5 presents a discussion of the main findings. Finally, Section 6 presents the conclusions of our study.

2. Materials and Methods
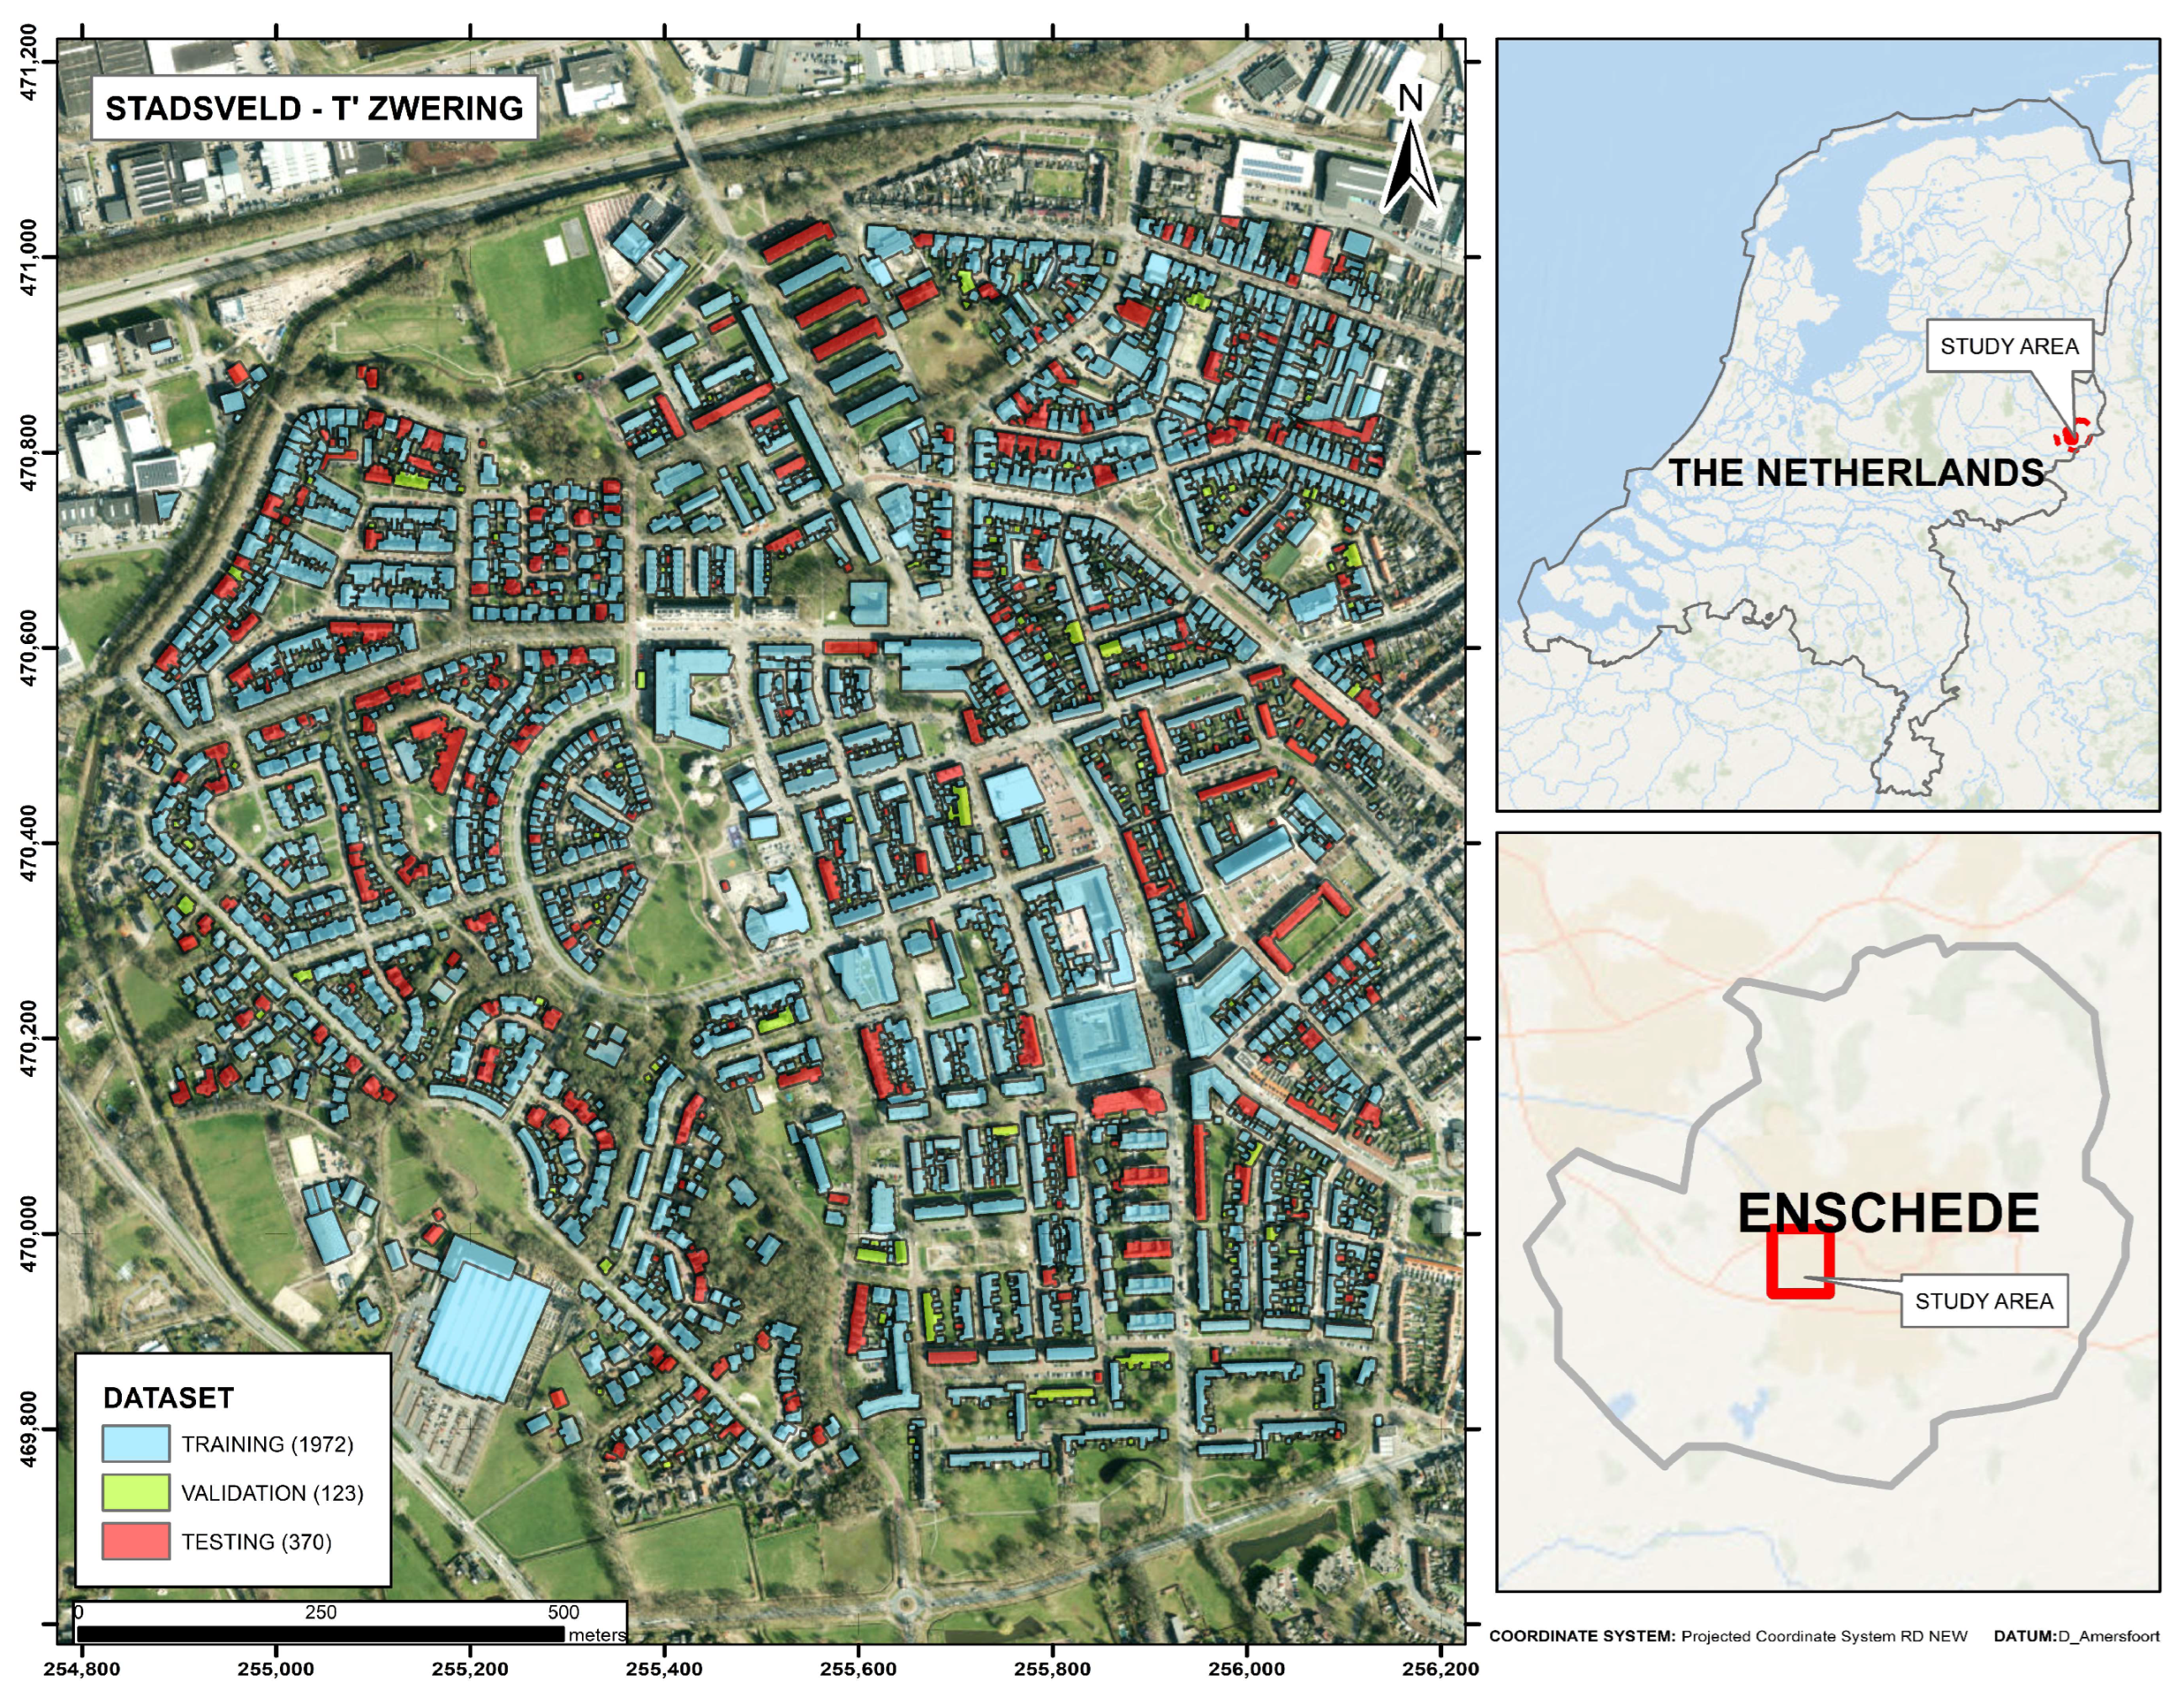
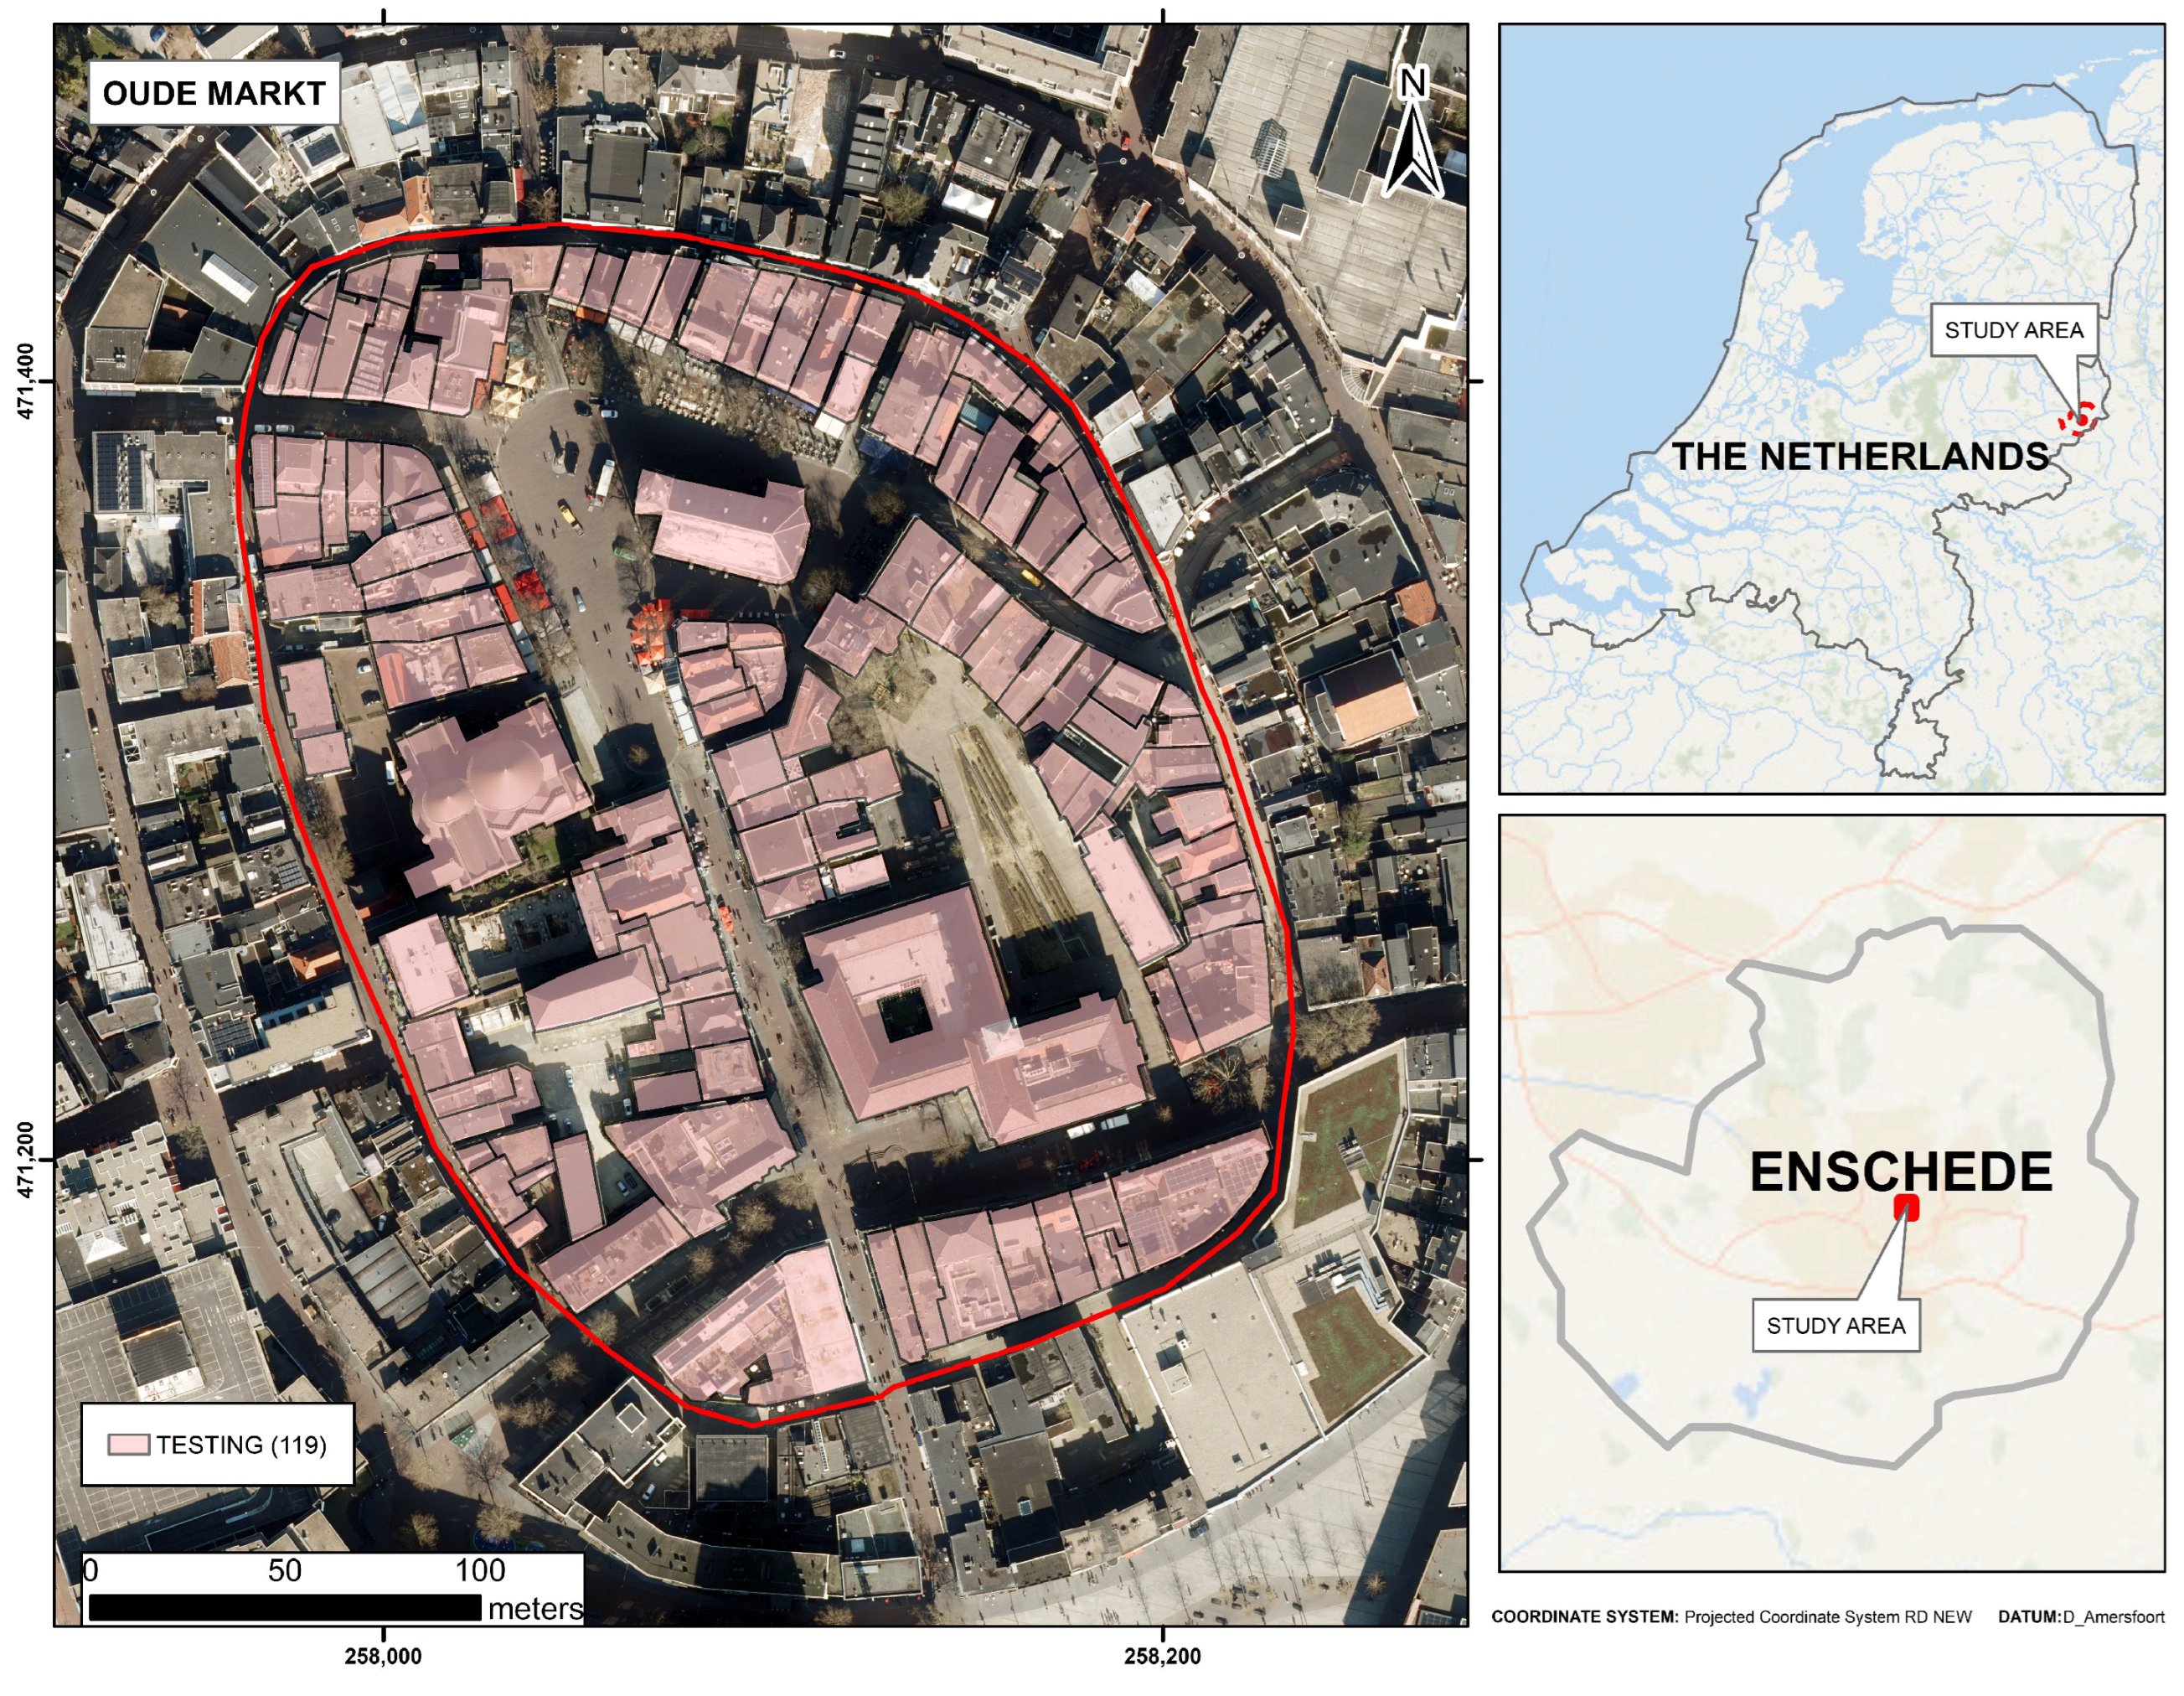
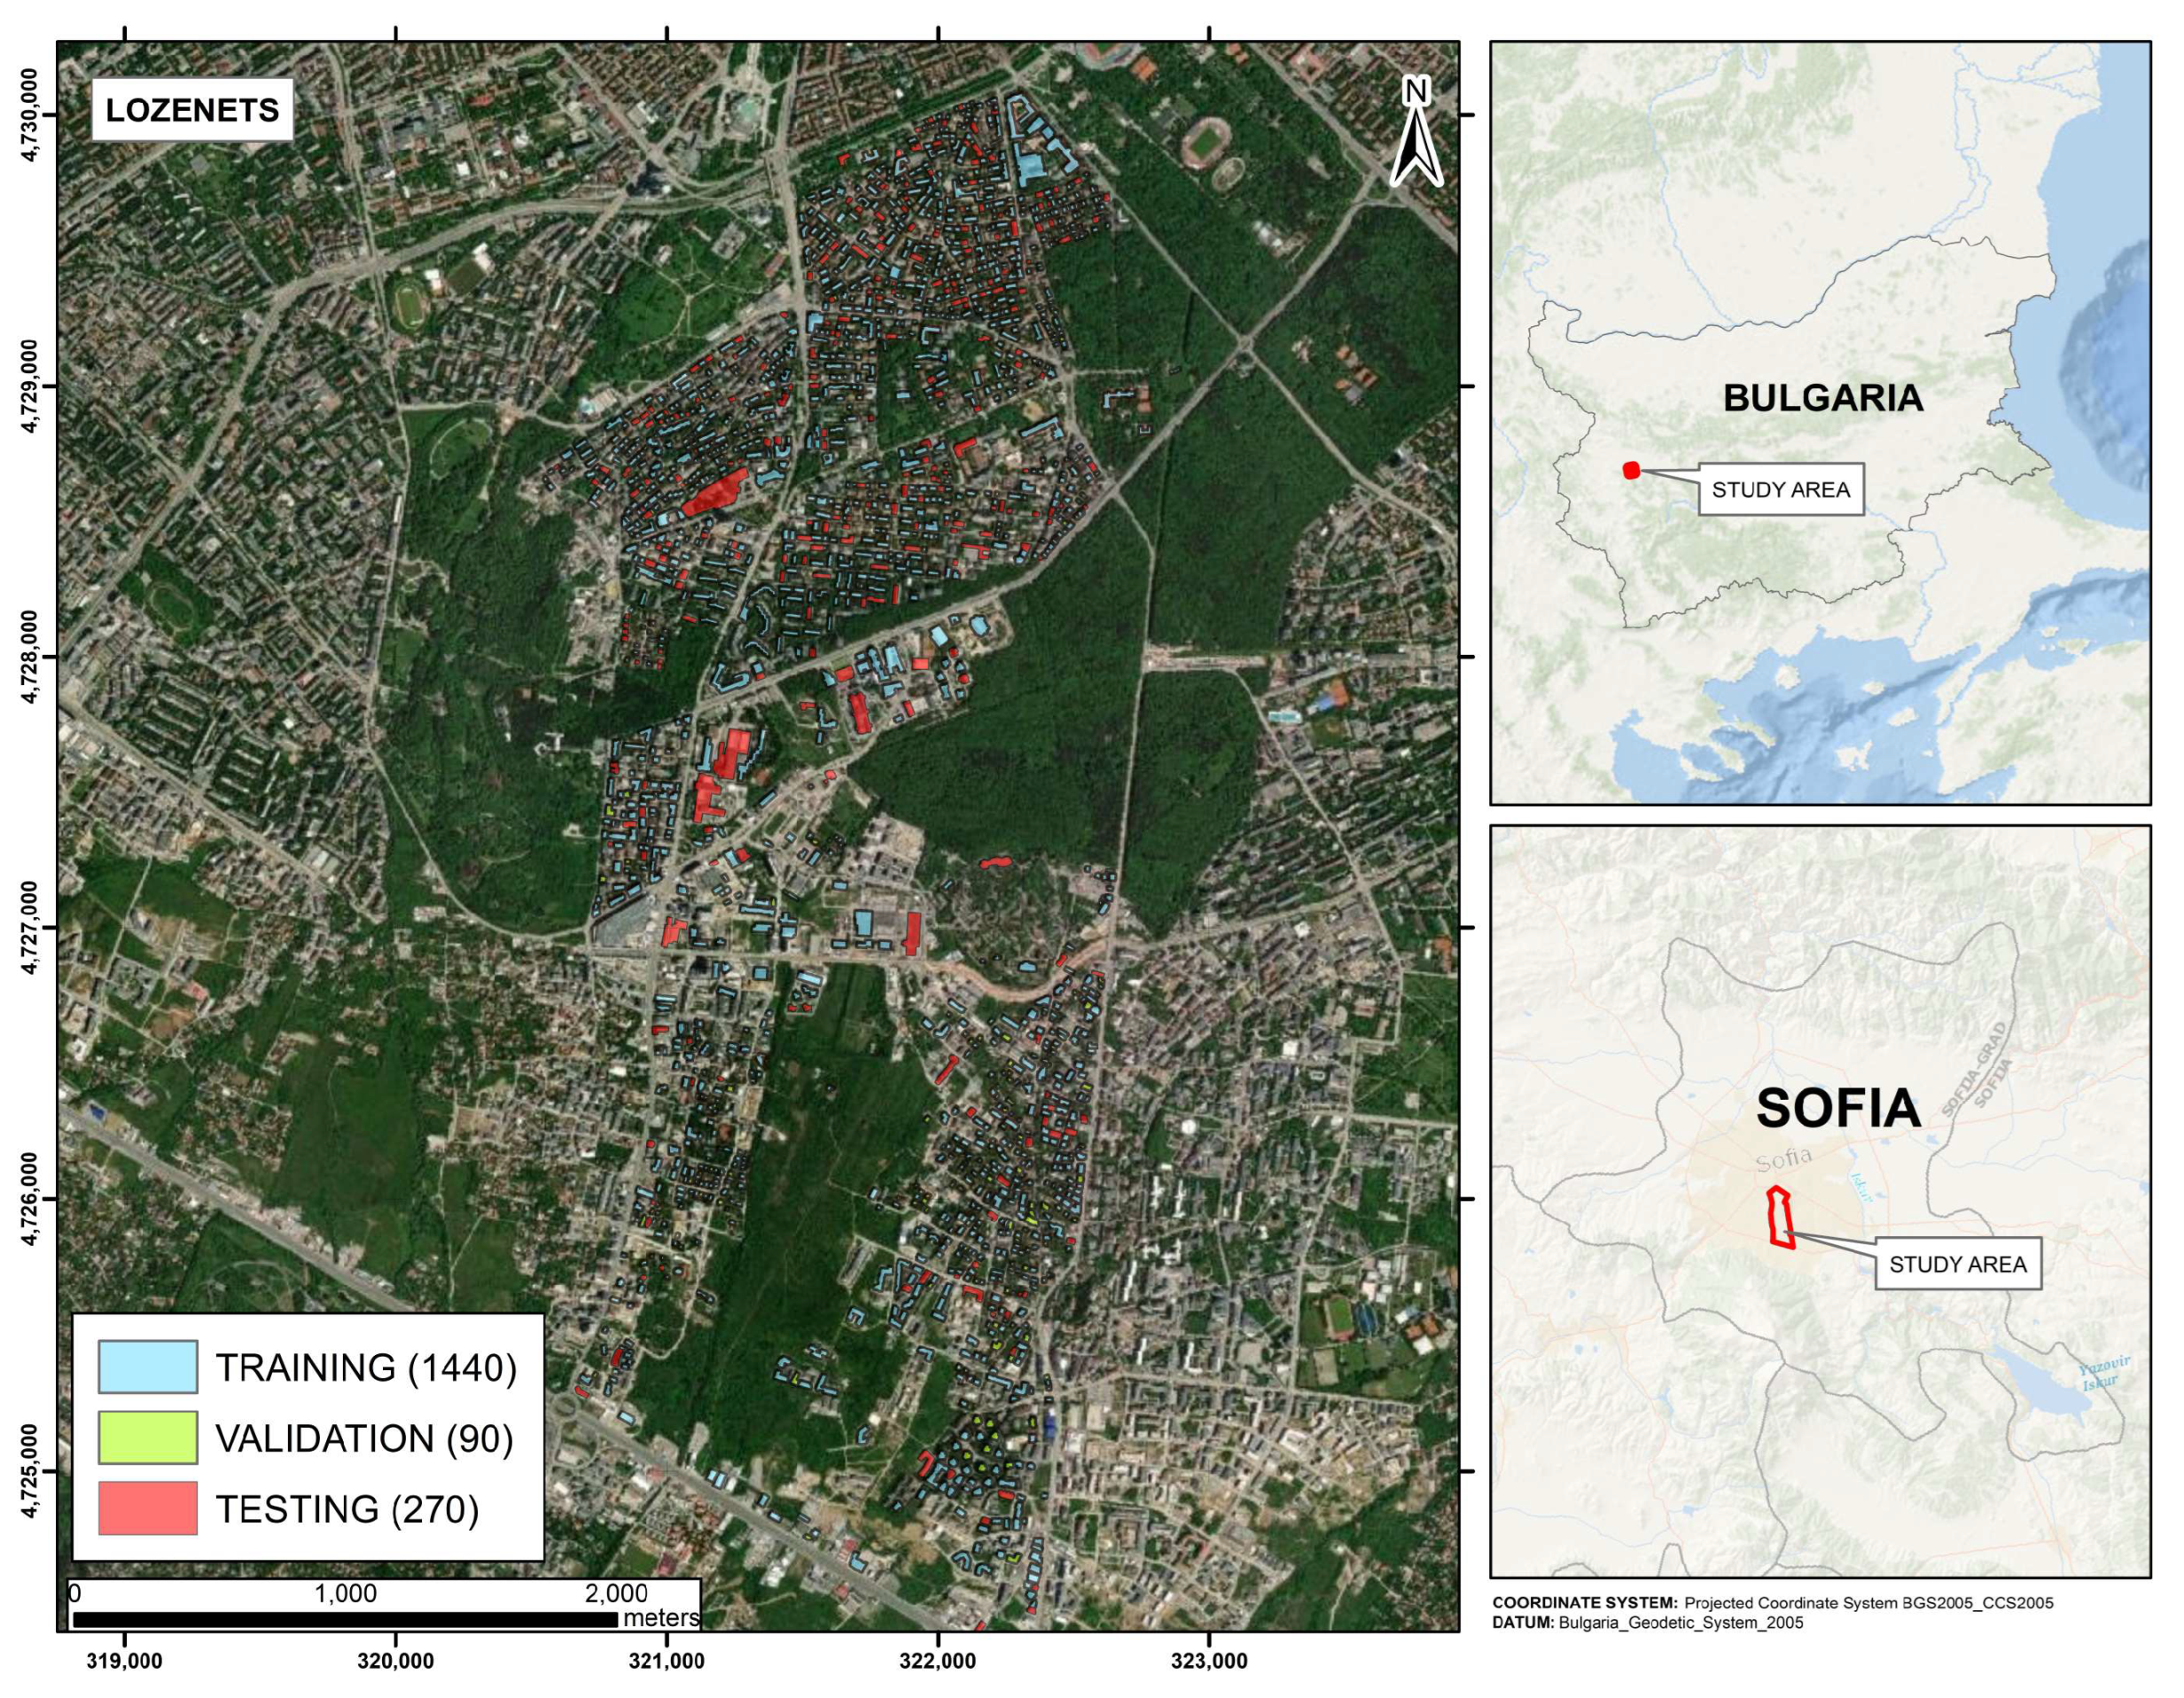
This section outlines the resources and methodology used in our study, offering an open framework for the entire research. The proposed framework aims to extract roof planes from RGB images to convert and combine those 2D outputs for the LOD2 3D modelling in two stages: (1) Roof plane extraction and (2) LOD2 3D modelling.

2.1. Study Area

The study area of Stadsveld–‘t Zwering, located in the southern urban area of Enschede, The Netherlands, covers an area of around 153 hectares. The dataset contains 1972, 123, and 370 building samples for training validation and testing, randomly split. The extent and distribution of the building’s samples are shown in Figure 1.
The study area of Oude Markt, located in the central urban area of Enschede, The Netherlands, covers an area of around 6 hectares. The dataset contains 119 building samples for testing the whole workflow. The extent and distribution of the building’s samples are shown in Figure 2.
The study area of Lozenets, located in the urban area of Sofia, Bulgaria, covers an area of around 812 hectares. The dataset contains 1440, 90, and 270 building samples for training, validation, and testing, randomly split. The extent and distribution of the building’s samples are shown in Figure 3.

2.2. Data

Experiments were performed using the datasets of Enschede, The Netherlands, and Sofia, Bulgaria. The data used for this research are presented in Table 1 and include (1) VHR aerial images, (2) the building footprints, (3) the building internal (inner) roof planes of the buildings, and (4) the LIDAR point cloud derived for AHN4.
For our experiments, aerial images define our study areas, from which all building footprints will be used to perform a 2-m buffer operation around each building. This operation will clip each building image sample according to the bounding box defined by the 2 m. buffer around each building. The inner roof planes of the buildings will be employed to generate planar graph information, serving as a reference to train/validate/test the HEAT model in the different study areas. From the LIDAR point cloud, the digital surface model (DSM) and digital terrain model (DTM) will be derived. Additionally, by subtracting the DTM from the DSM, the normalized digital surface model (nDSM) will be obtained. For these operations, ArcGIS Pro version 3.0.2 was used as the GIS software.

2.3. Roof Plane Extraction
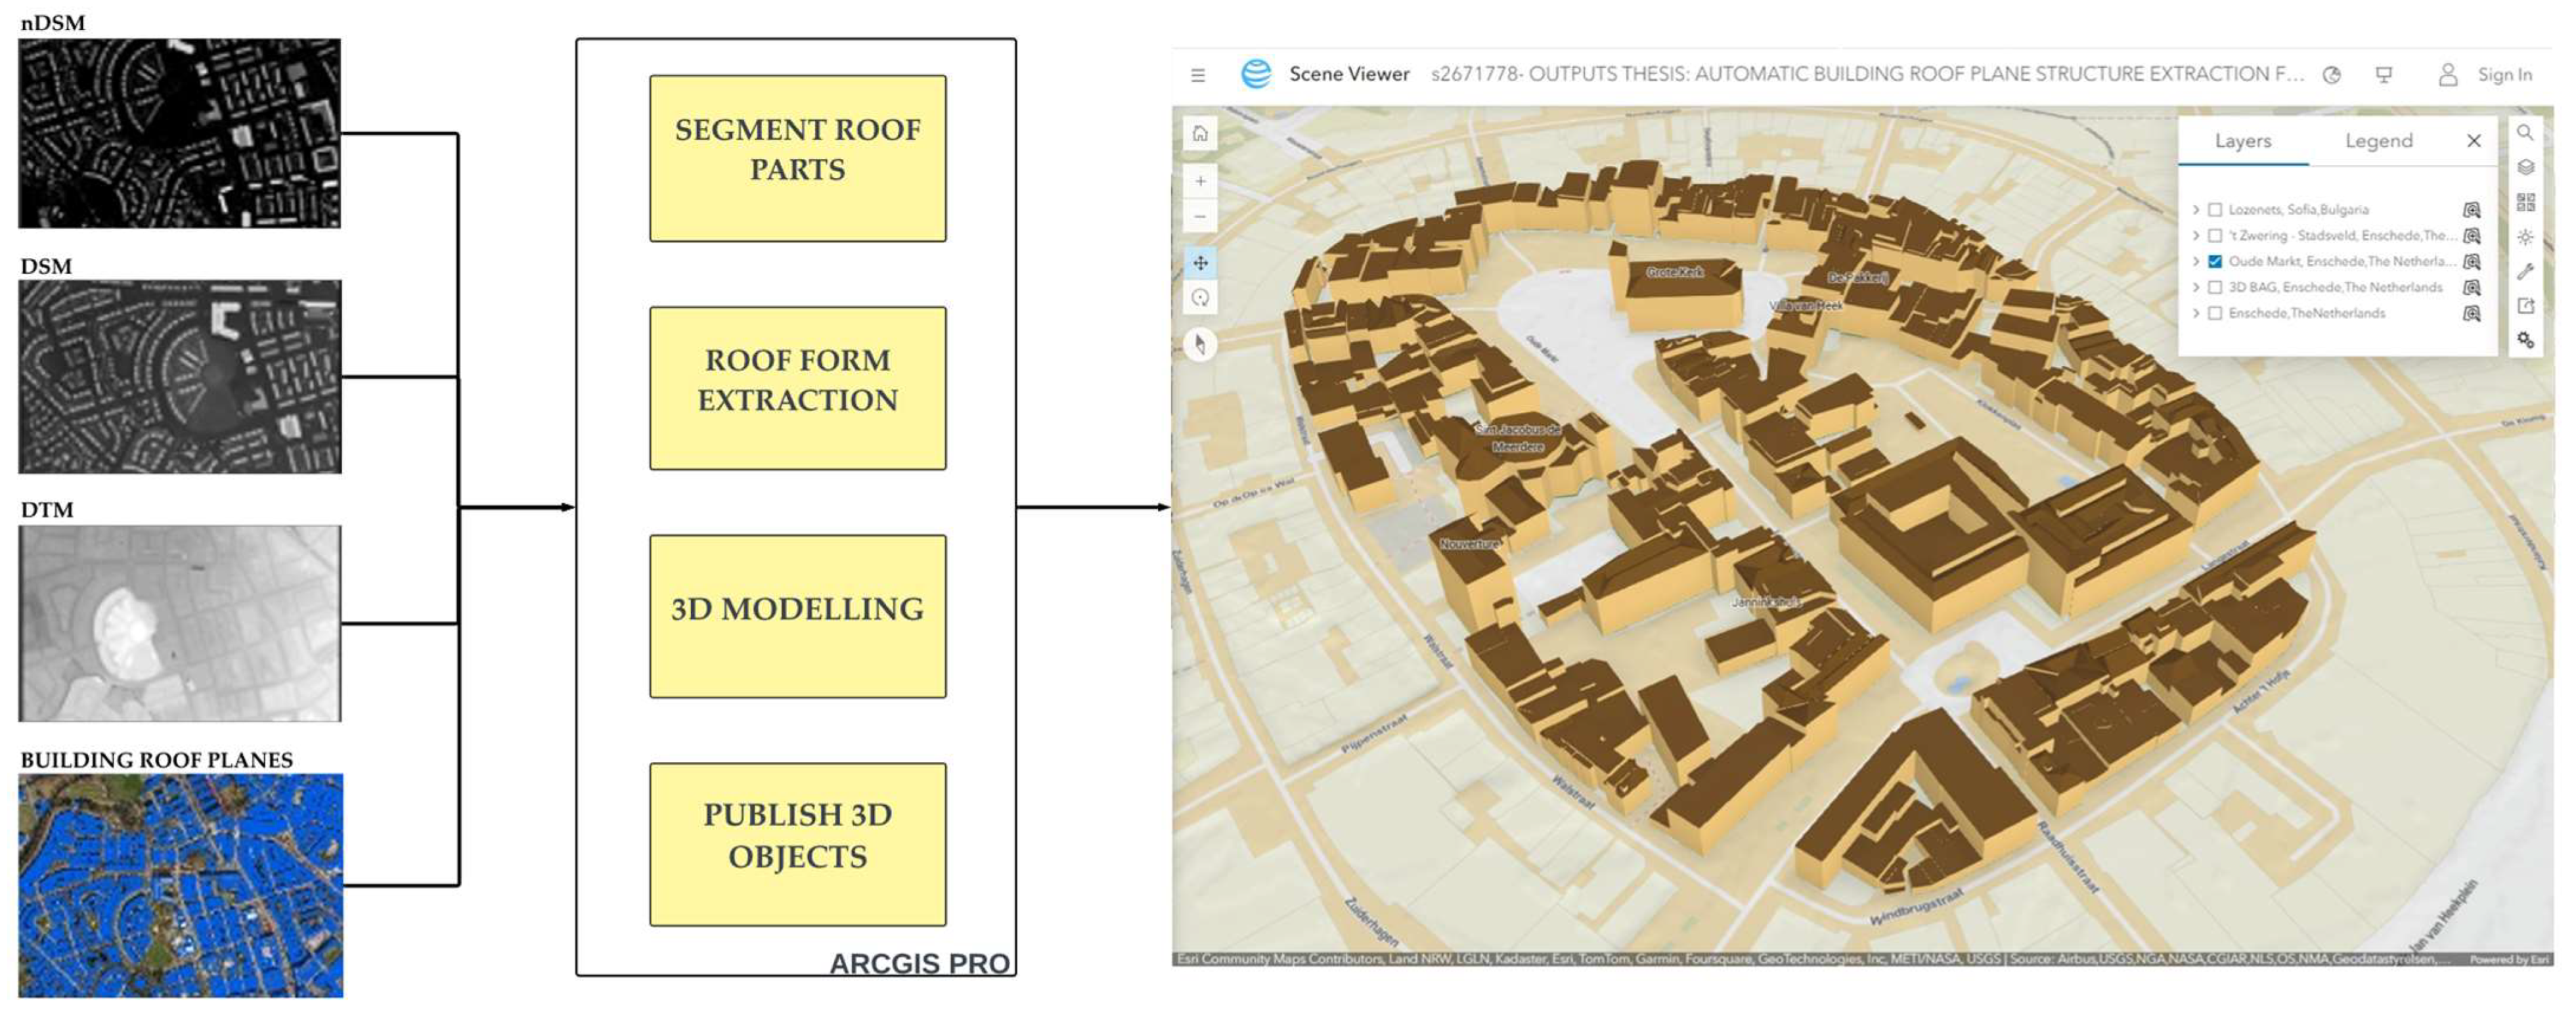
In the first stage, the proposed framework uses as a cornerstone the deep-learning approach developed by Cheng, 2022 [23], HEAT (holistic edge attention transformer) developed for outdoor building reconstruction from satellite images and indoor floorplan reconstruction. This model is applied to the current roof-plane delineation context in aerial images, to delineate buildings, which are inherently 3D structures but appear as 2D planes in aerial imagery. First, a data preparation process is initiated on the reference data on the study areas based on aerial images and the cadastral data of the buildings in the image. The automation of the data preparation process is to be used in different dataset sizes, and the dataset is split into training, validation, and testing subsets.
Subsequently, the HEAT models are trained using the different subsets of datasets. For the proposed framework, the availability of building footprints is assumed to be necessary for building sample creation and the requisite information for framework utilization.
For the current research, the building footprints datasets were manually edited to match with the aerial imagery. Furthermore, the trained HEAT models were applied to extract the detected roof planes in the selected study areas. Finally, the obtained planar graphs were vectorized using specialized Python libraries to convert the planar graphs representations into a shapefile file. The overall workflow of the roof plane extraction is shown in Figure 4.

2.4. 3D Modelling

The aim of this 3D modeling process is to use the extracted vector roof output from the remotely sensed data and use the building footprints to reconstruct a full 3D building model at LOD2. This process aligns with the 3D city modelling methodology shown in the 3DBasemap extension of the commercial GIS software ArcGIS. The proposed methodology involves a multistep procedure that integrates various GIS tools to combine the inner roof planes, digital surface model (DSM), digital terrain model (DTM), and normalized digital surface model (nDSM), and subsequently enables the creation of 3D building objects at LOD2.
This phase underwent testing exclusively using the Oude Markt dataset. The overall workflow of the 3D modelling stage is shown in Figure 5. The figure illustrates the sequential steps involved in the GIS software, wherein building roof planes are combined with digital elevation models to extrude them.
The accuracy of the results is evaluated using the metrics proposed in [23] for the extraction stage for detecting corners, edges, and regions. Furthermore, the vectorization stage is analyzed by using the intersection over union (IoU) metric. This additional accuracy metric captures the quality of the extracted vector format polygons, a factor not considered in the standard metrics presented by [23]. The root mean square error (RMSE) serves as a pivotal metric for quantifying the dissimilarity between the digital surface model (DSM) and the resultant LOD2 3D city model, derived from the inner roof planes of buildings. This computation encompasses the evaluation of each pixel enclosed within the inner roof planes. To ensure alignment with the DSM’s resolution, the LOD2 3D city model undergoes rasterization, attaining a uniform 0.2 m resolution.

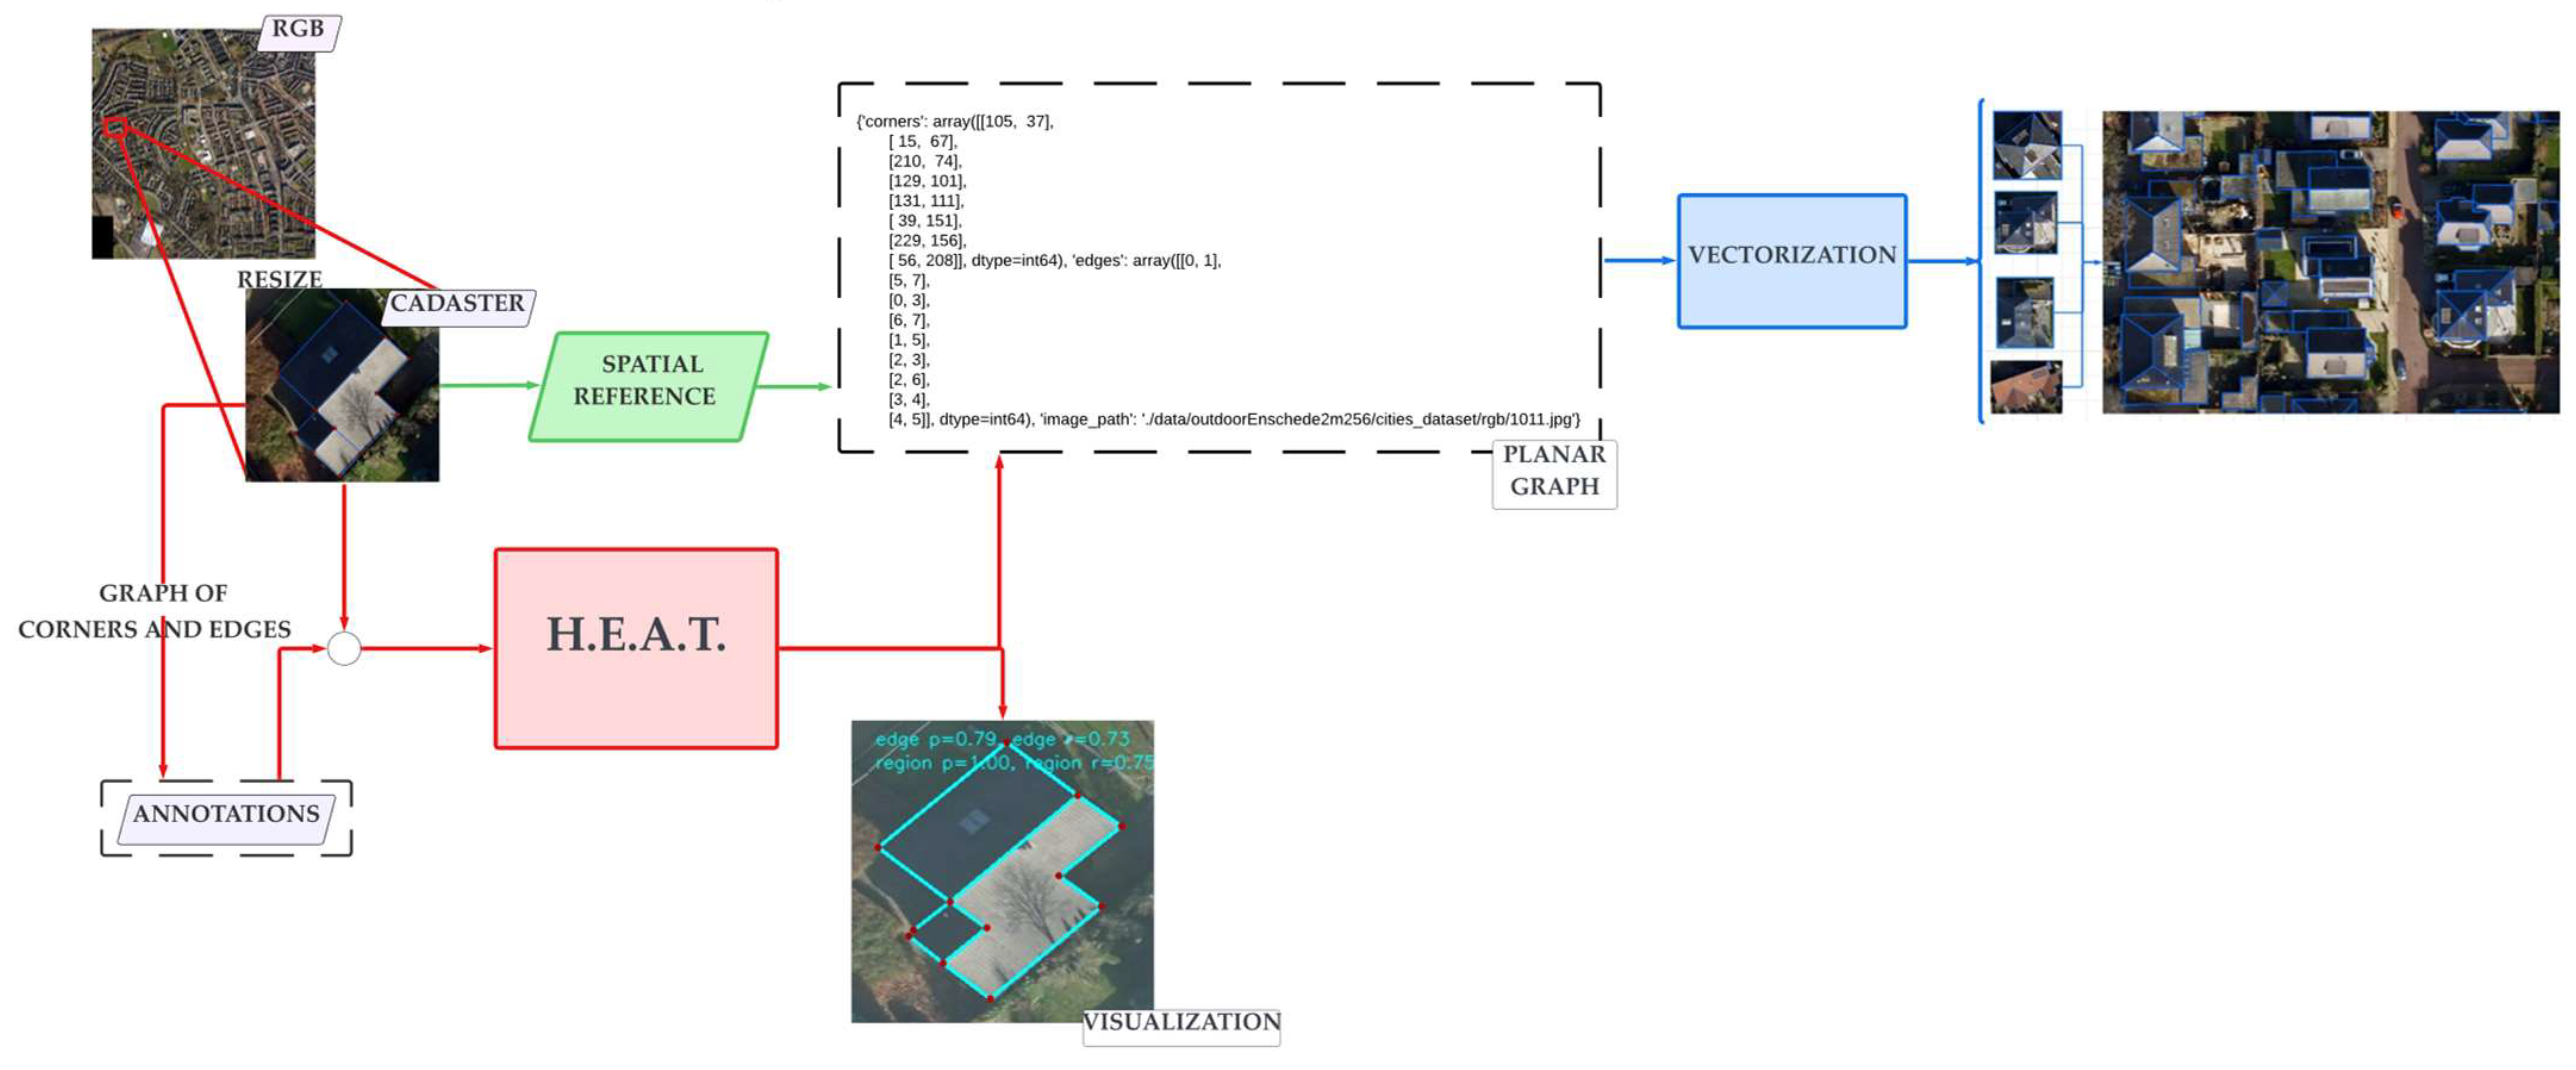
3. Proposed Framework

The proposed framework includes innovative methods for delineating and extracting building roof planes from RGB photos, addressing the complexities of the urban environment for 3D modelling. The framework includes the following steps explained in the next subsections.

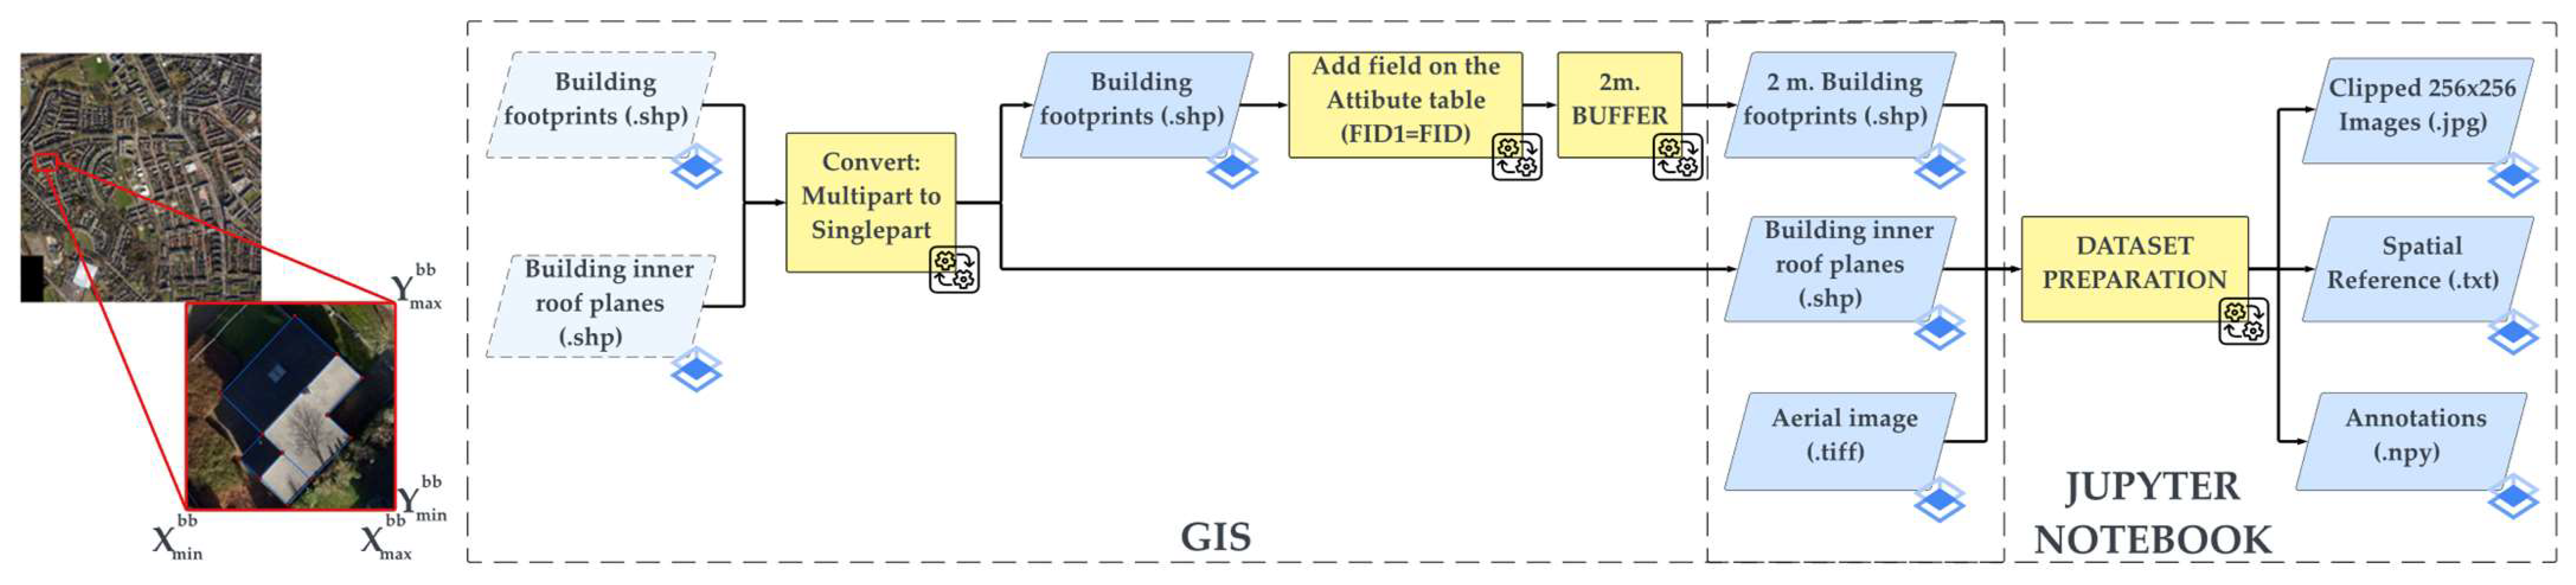
3.1. Data Preparation Implementation

The application of the HEAT approach is explored for mapping building rooftop structures. This method entails deriving a planar graph, encompassing corners, edges, and regions, from a cropped 256 × 256 image. An automated data preparation procedure is employed to extend the application of this approach across an entire area. The process takes an aerial image, the building footprints and inner roof planes as input. It commences by cropping buildings from the aerial image using a bounding box generated from a 2 m polygon buffer surrounding each building footprint. Following this, the cropped images are resized to the 256 × 256 pixel format, ensuring compatibility with HEAT.
Furthermore, reference training data are essential to generate the training data for the HEAT model, which includes cropped images of the building samples and their associated planar graph. Building image samples are generated in .jpg format alongside the planar graphs for each building sample, considering the necessary resizing from real-world coordinates to the 256 × 256 image coordinates. Figure 6 shows the overall workflow of the data preparation process.
The entire data preparation process is executed using a combination of GIS software tools and Python libraries comprised in a Jupyter Notebook with Python 3.8. The information regarding the coordinate reference system of the used bounding box for each building sample necessary for resizing from real-world coordinates to image coordinates is stored in a text file per image building sample. This information is crucial for mapping the inner roof planar graph delineated on each building image sample to real-world coordinates.

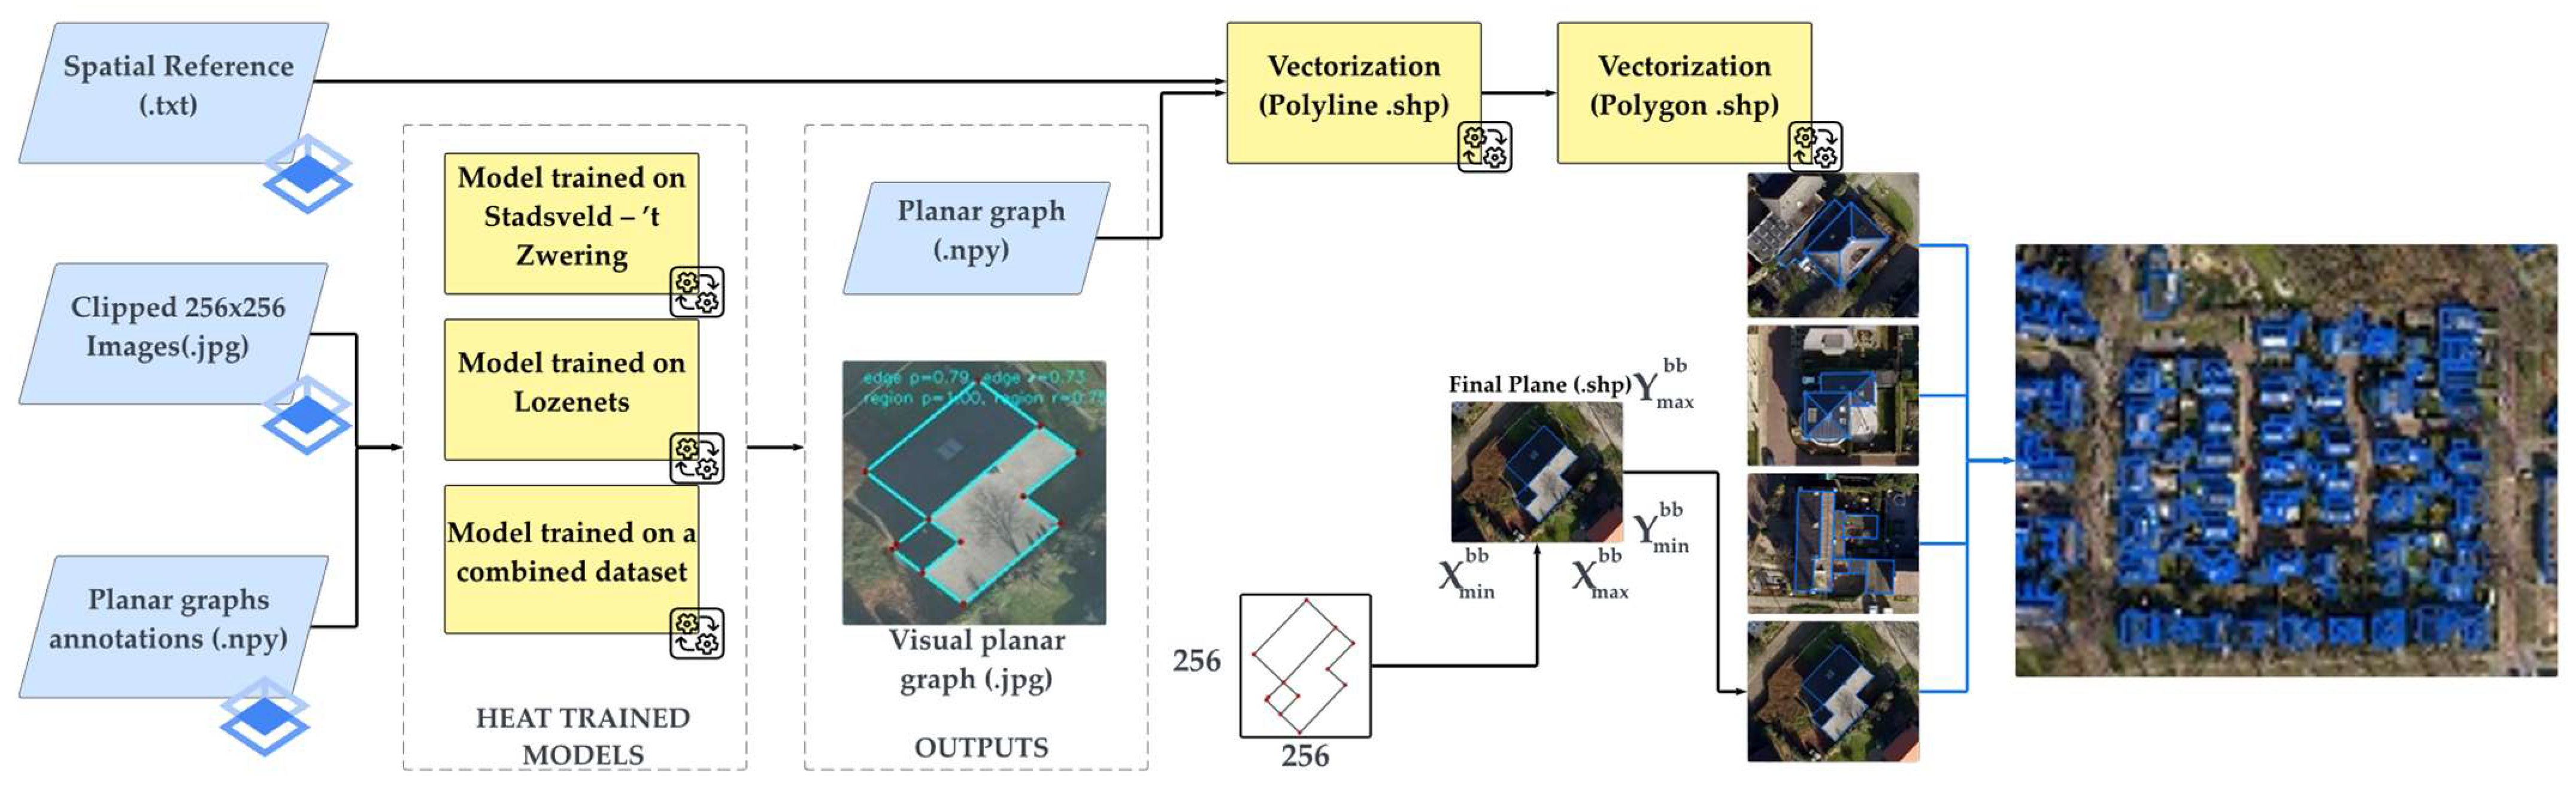
3.2. Training HEAT Model

The training process starts with the pre-trained HEAT model for outdoor architectural reconstruction, in which training parameters are outlined in [23]. Using the pre-trained HEAT model instead of training a new one is chosen to leverage the existing understanding of outdoor architectural reconstruction. Three models underwent training based on the designated dataset for each study area: the model trained with the Stadsveld–‘t Zwering dataset, the model trained with the Lozenets dataset, and the combined model which was generated by combining the same training and validation datasets considered for the individual models. This approach helps to prevent overfitting when testing the combined model on the respective areas.
Based on empirical experiments, an arbitrary number of 646 epochs is set for every training session. The training process is monitored by utilizing the validation accuracy value to find the model with the highest accuracy within the training session. The training was conducted using Python 3.8 and PyTorch 1.12.1. Table 2 shows how the input data for all three models are split into training and validation datasets, including image size, batch size, and maximum number of corners per image.
In the following sections of this research, the model trained on the Stadsveld–’t Zwering dataset will be denoted as “Model trained on Enschede dataset”, the model trained on the Lozenets dataset will be denoted as “Model trained on Sofia dataset”, and the model trained on the combined dataset will be labeled as “Model trained on the combined dataset”.

3.3. Building Roof Plane Extraction

After completing the training process, this study focuses on applying and evaluating the performance of the generated trained models in delineating the inner roof planes of buildings within our designated testing datasets. Subsequently, post-processing operations are conducted to convert the obtained planar graph text file of each building sample into vector format datasets. The planar graph output obtained from HEAT is stored in a Python dictionary with three distinct keys, which are described as follows:
-
corners’: This key corresponds to a 2D array of integers, where each row represents the x and y coordinates of an identified corner in the building image sample;
-
edges’: This key corresponds to a 2D array of integers. Each row represents a pair of corners (indicated by their indices in the ‘corners’ array) forming an edge;
-
image_path’: This key corresponds to a string specifying an image file’s path. This image aligns with the deduced corners and edges on the input-image building sample.
The following approach transforms the acquired planar graph text file into a real-world coordinate vector polygon format. The conversion process has a similar structure as in the data preparation process, as every planar graph based on the building file name is mapped to the corresponding bounding box information file used for clipping the image to its original size saved during the data preparation process. Once every sample was resized and georeferenced to its real-world location, all the generated building inner roof plane planar graphs were merged into one vector file. The overall workflow of the building roof plane extraction is shown in Figure 7.
The process described above is performed in a Jupyter Notebook using Python 3.8. The outputs of the Jupyter Notebook are provided in polyline vector format. GIS software is employed to convert the geometry of these outputs to a polygon vector format.

3.4. 3D Modelling

After acquiring all the roof plane structures, the subsequent stage of the framework concentrates on testing the application of the obtained outputs for 3D modelling. A 3D city model at LOD2 for the Oude Markt area in Enschede, The Netherlands, is generated, utilizing the 3DBasemaps extension of ArcGIS Pro, whose methodology for combining roof form structures with DEMs is detailed in [29]. This approach was applied to generate a LOD2 3D city modelling for the Oude Markt area in Enschede, The Netherlands. This area was employed to test the whole framework without being part of the training stage for the roof structure extraction step. The overall workflow of this stage is shown in Figure 5.
To display the results of the created 3D model at LOD2 of the Oude Markt, a webmap was developed to provide a user-friendly interface for assessing the qualitative outcomes obtained in this stage. Readers can access the platform following the resource: https://arcg.is/1raWvS0, accessed on 12 March 2024 [30].

3.5. Evaluation Metrics

The results are evaluated across the different stages: building inner roof plane delineation, vectorization, and 3D modelling.
Building inner roof plane delineation. To evaluate the correctness of the inner roof plane delineation results on every building sample, the trained models’ performances are assessed on detecting corners, edges, and regions using the standard formulas for precision, recall, and F1 score.
-
Corners. A corner is successfully predicted and considered a true positive if a ground-truth corner is located within an Euclidean distance of an 8-pixel radius. In cases where multiple corners are detected around a single ground-truth corner, only the closest corner will be deemed a true positive;
-
Edges. An edge is successfully predicted and considered a true positive if both end corners are detected and the pair of corners exists on the ground truth;
-
Regions. A region is successfully predicted and considered a true positive if the intersection over union (IoU) of a region defined by the different connected components of predicted corners and edges and a ground-truth region is greater than or equal to 0.7;
Vectorization. The accuracy of the final outputs is evaluated by the number of detected closed planes that resulted from edges. As certain edges may not converge into planes and are delineated as unclosed structures, the IoU metric is employed. This metric compares the obtained polygon planes with the ground-truth vector planes, providing a measure of accuracy for the final results.
3D Modelling. In the 3D modelling process, the root mean square error (RMSE) was calculated to assess the discrepancies between the generated 3D city model at LOD2 and the DSM. This involves a pixel–pixel computation, with the 3D city model at LOD2 rasterized to a 0.2 m resolution.

4. Results

The proposed framework was developed to automatically extract building inner roof planes on a study area and generate a 3D model at LOD2. This section compares the results obtained on the test dataset for the different study areas. The processing outputs from the building roof plane extraction and the 3D modelling stage are presented in the following subsections.

4.1. Quantitative Results

4.1.1. Building Roof Plane Extraction

Table 3 presents the quantitative evaluations for delineating and extracting building inner roof planes. The models customized for Stadsveld–’t Zwering and Lozenets areas showed the best results throughout the entire workflow. Upon testing the trained model on the combined dataset within the Oude Markt study area, the model trained on this integrated dataset demonstrates a superior performance, showcasing a noteworthy advantage, particularly during the final vectorization stage.
Our experiments were conducted using image samples with a resolution of 256 × 256. Our hypothesis suggests that the model trained on the combined dataset exhibits more advanced holistic geometric reasoning [23] than the other two models. Consequently, when tested in a different environment without prior context, the model trained on the combined dataset emerges as the superior performer due to its training on a more diverse dataset.
It is observed that the IoU test for the vectorization stage was only conducted on the top two models from the delineation stage.

4.1.2. 3D City Modelling

Table 4 presents the quantitative evaluations for the 3D city modeling stage, relying on the extracted inner roof planes of buildings obtained in the preceding stage, utilizing the model trained on the combined dataset specific to the Oude Markt area. The RMSE values indicate that approximately 95% of the buildings within the study area exhibit discrepancies ranging from 0 to 10 m between the generated LOD2 3D model and the DSM for this specific geographical region.
The 3D city modelling process utilized a pre-established method dictated by the software employed. Consequently, this stage offers room for improvement by exploring alternative options to enhance the 3D city model.

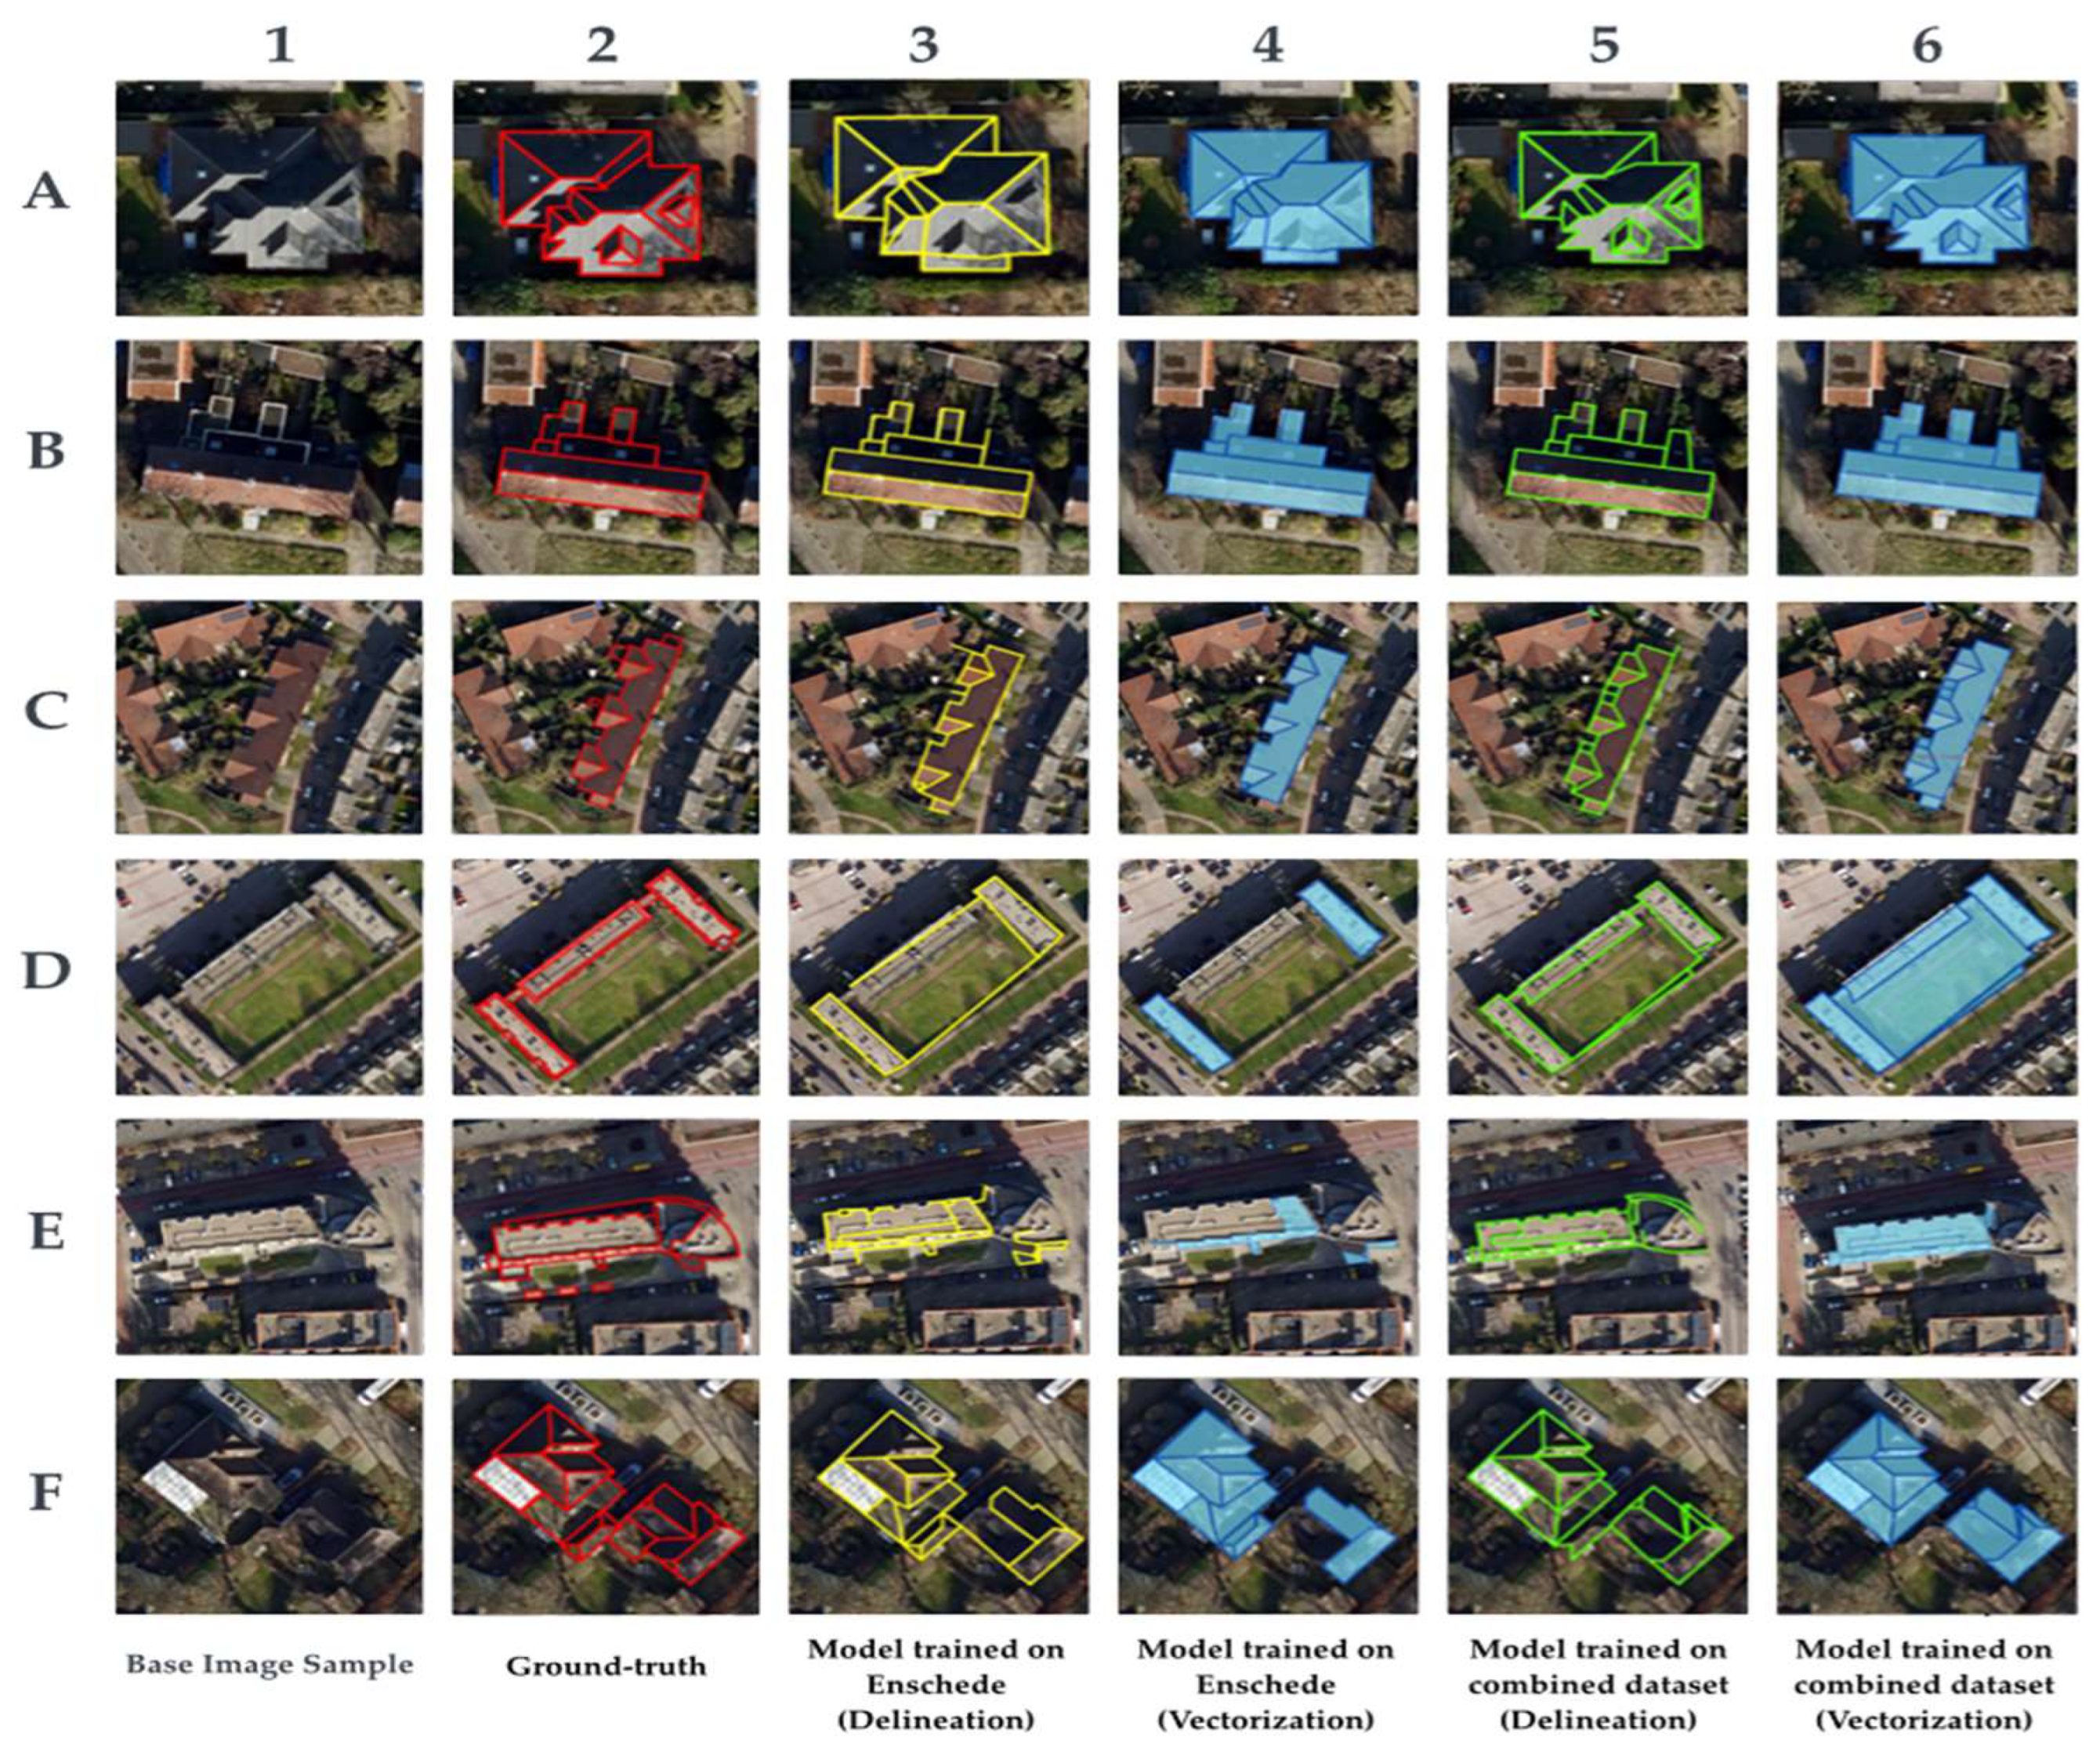
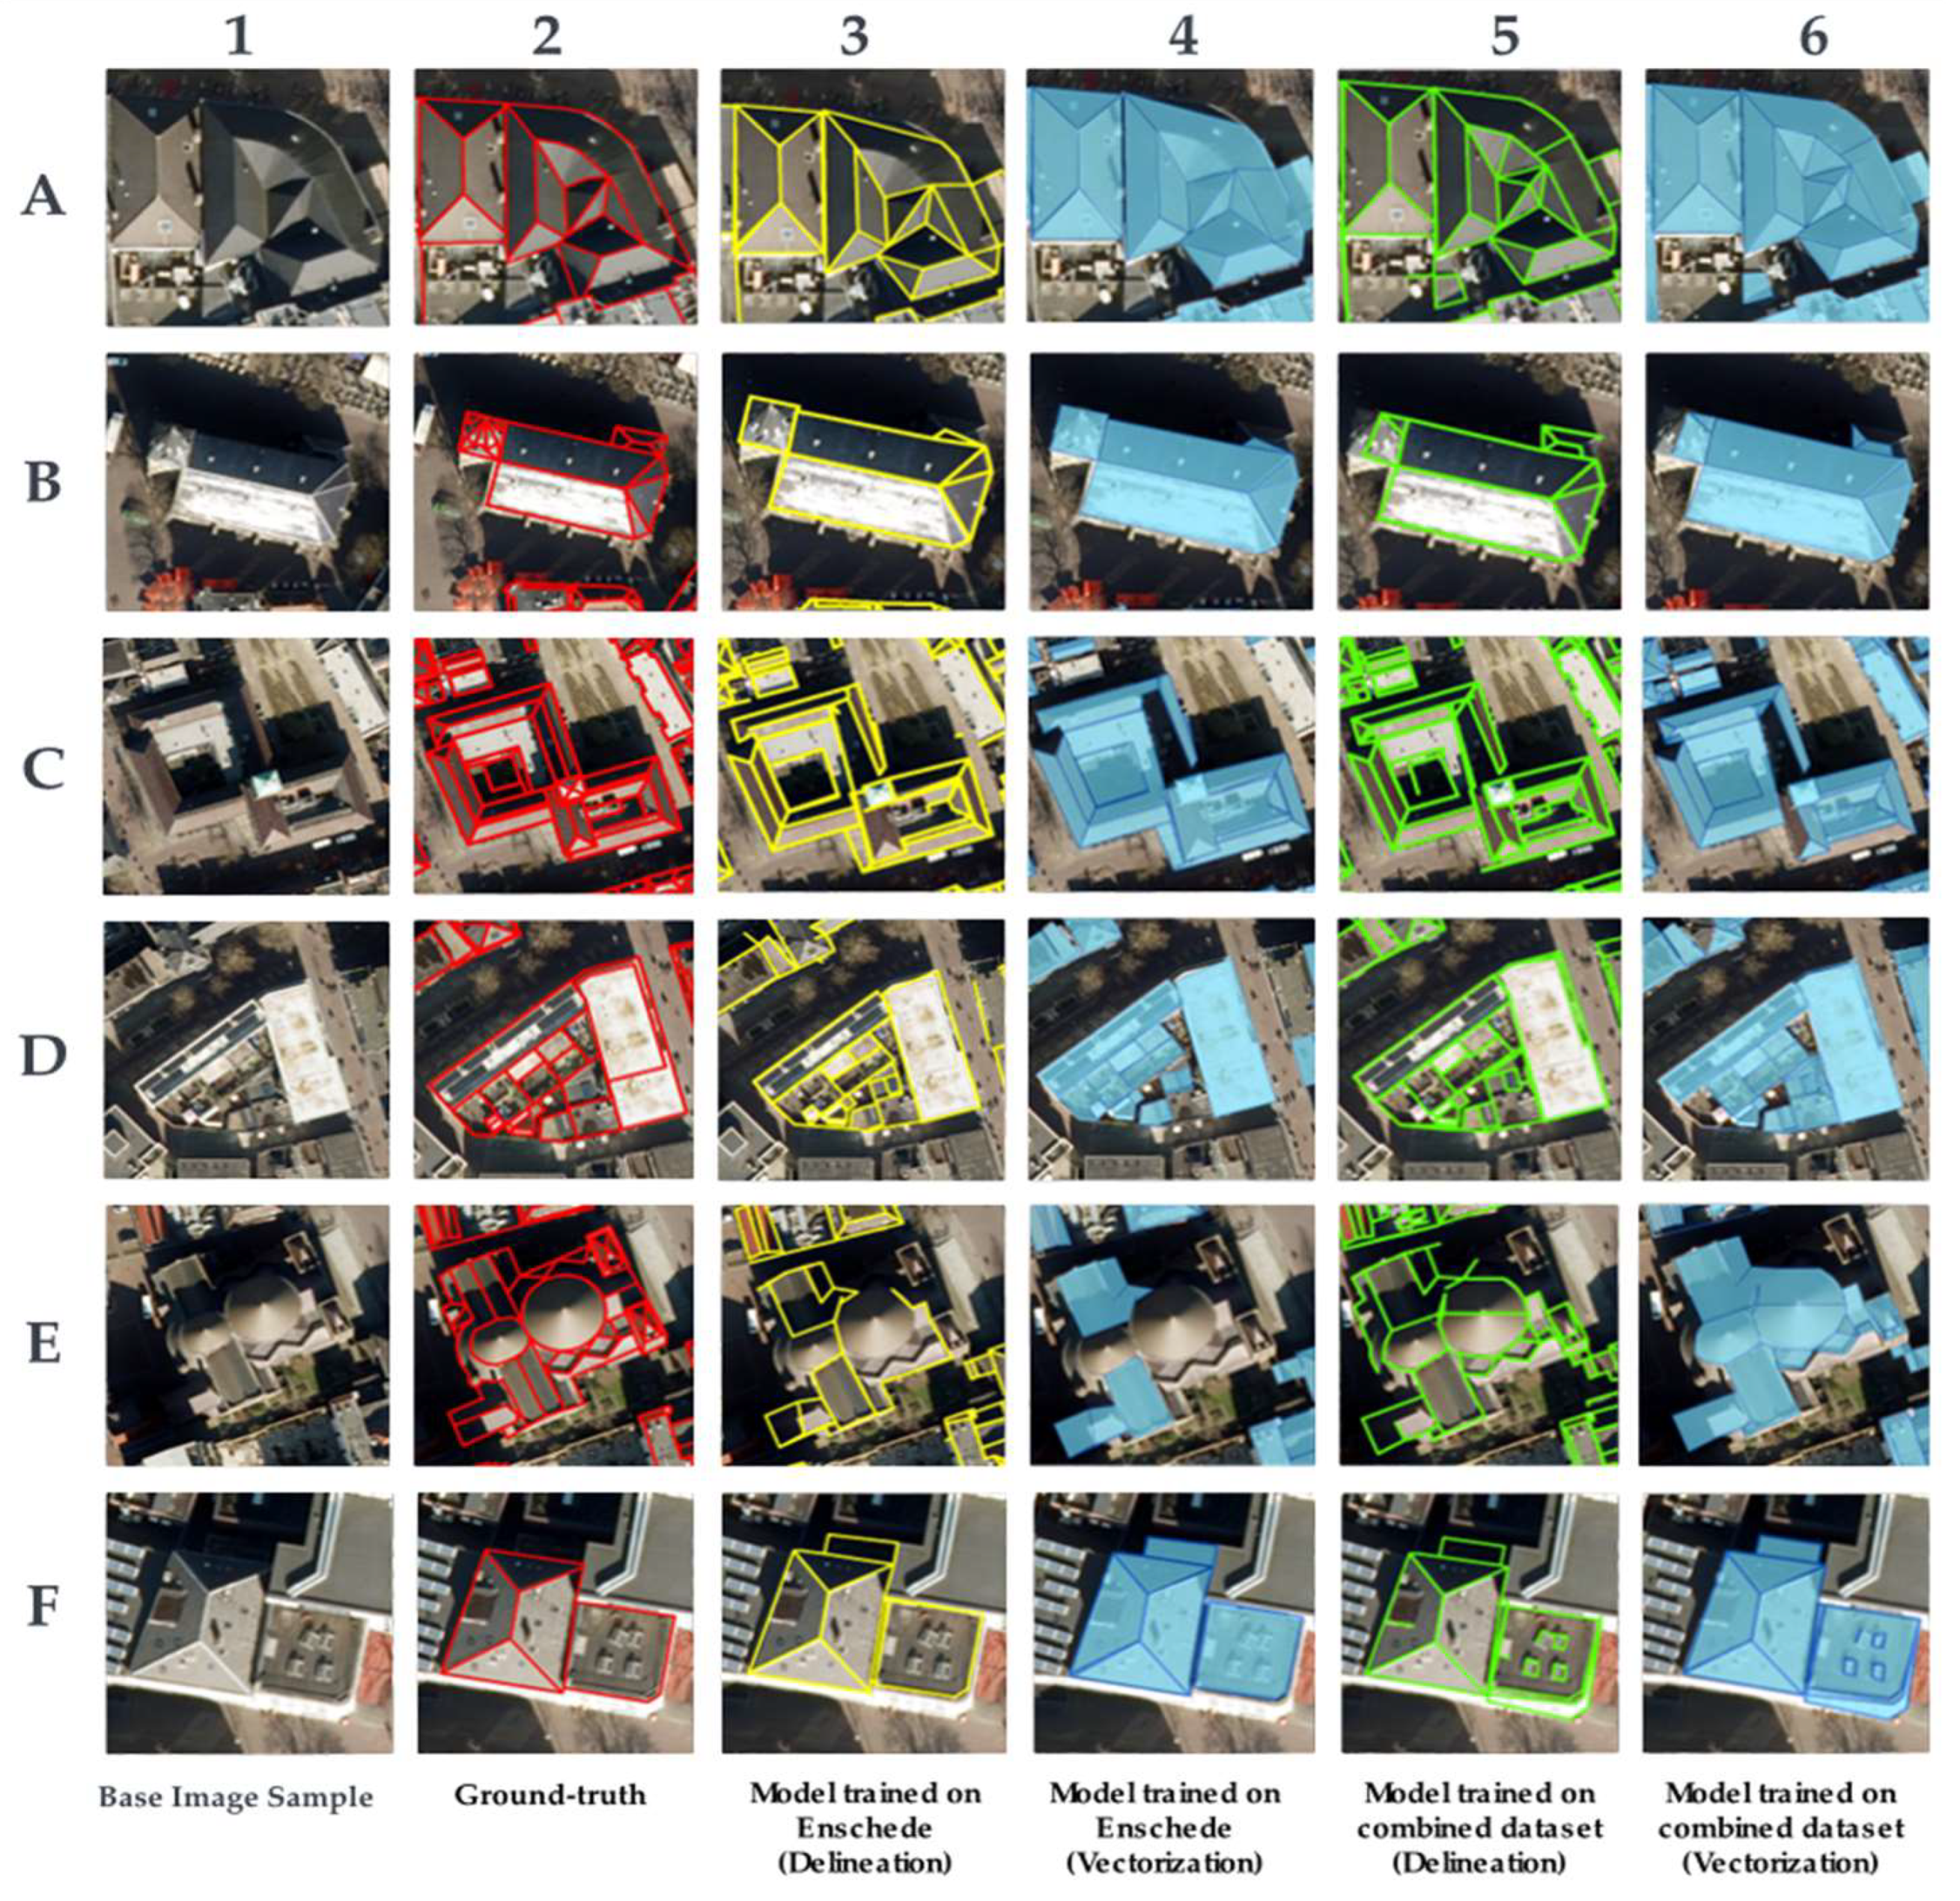
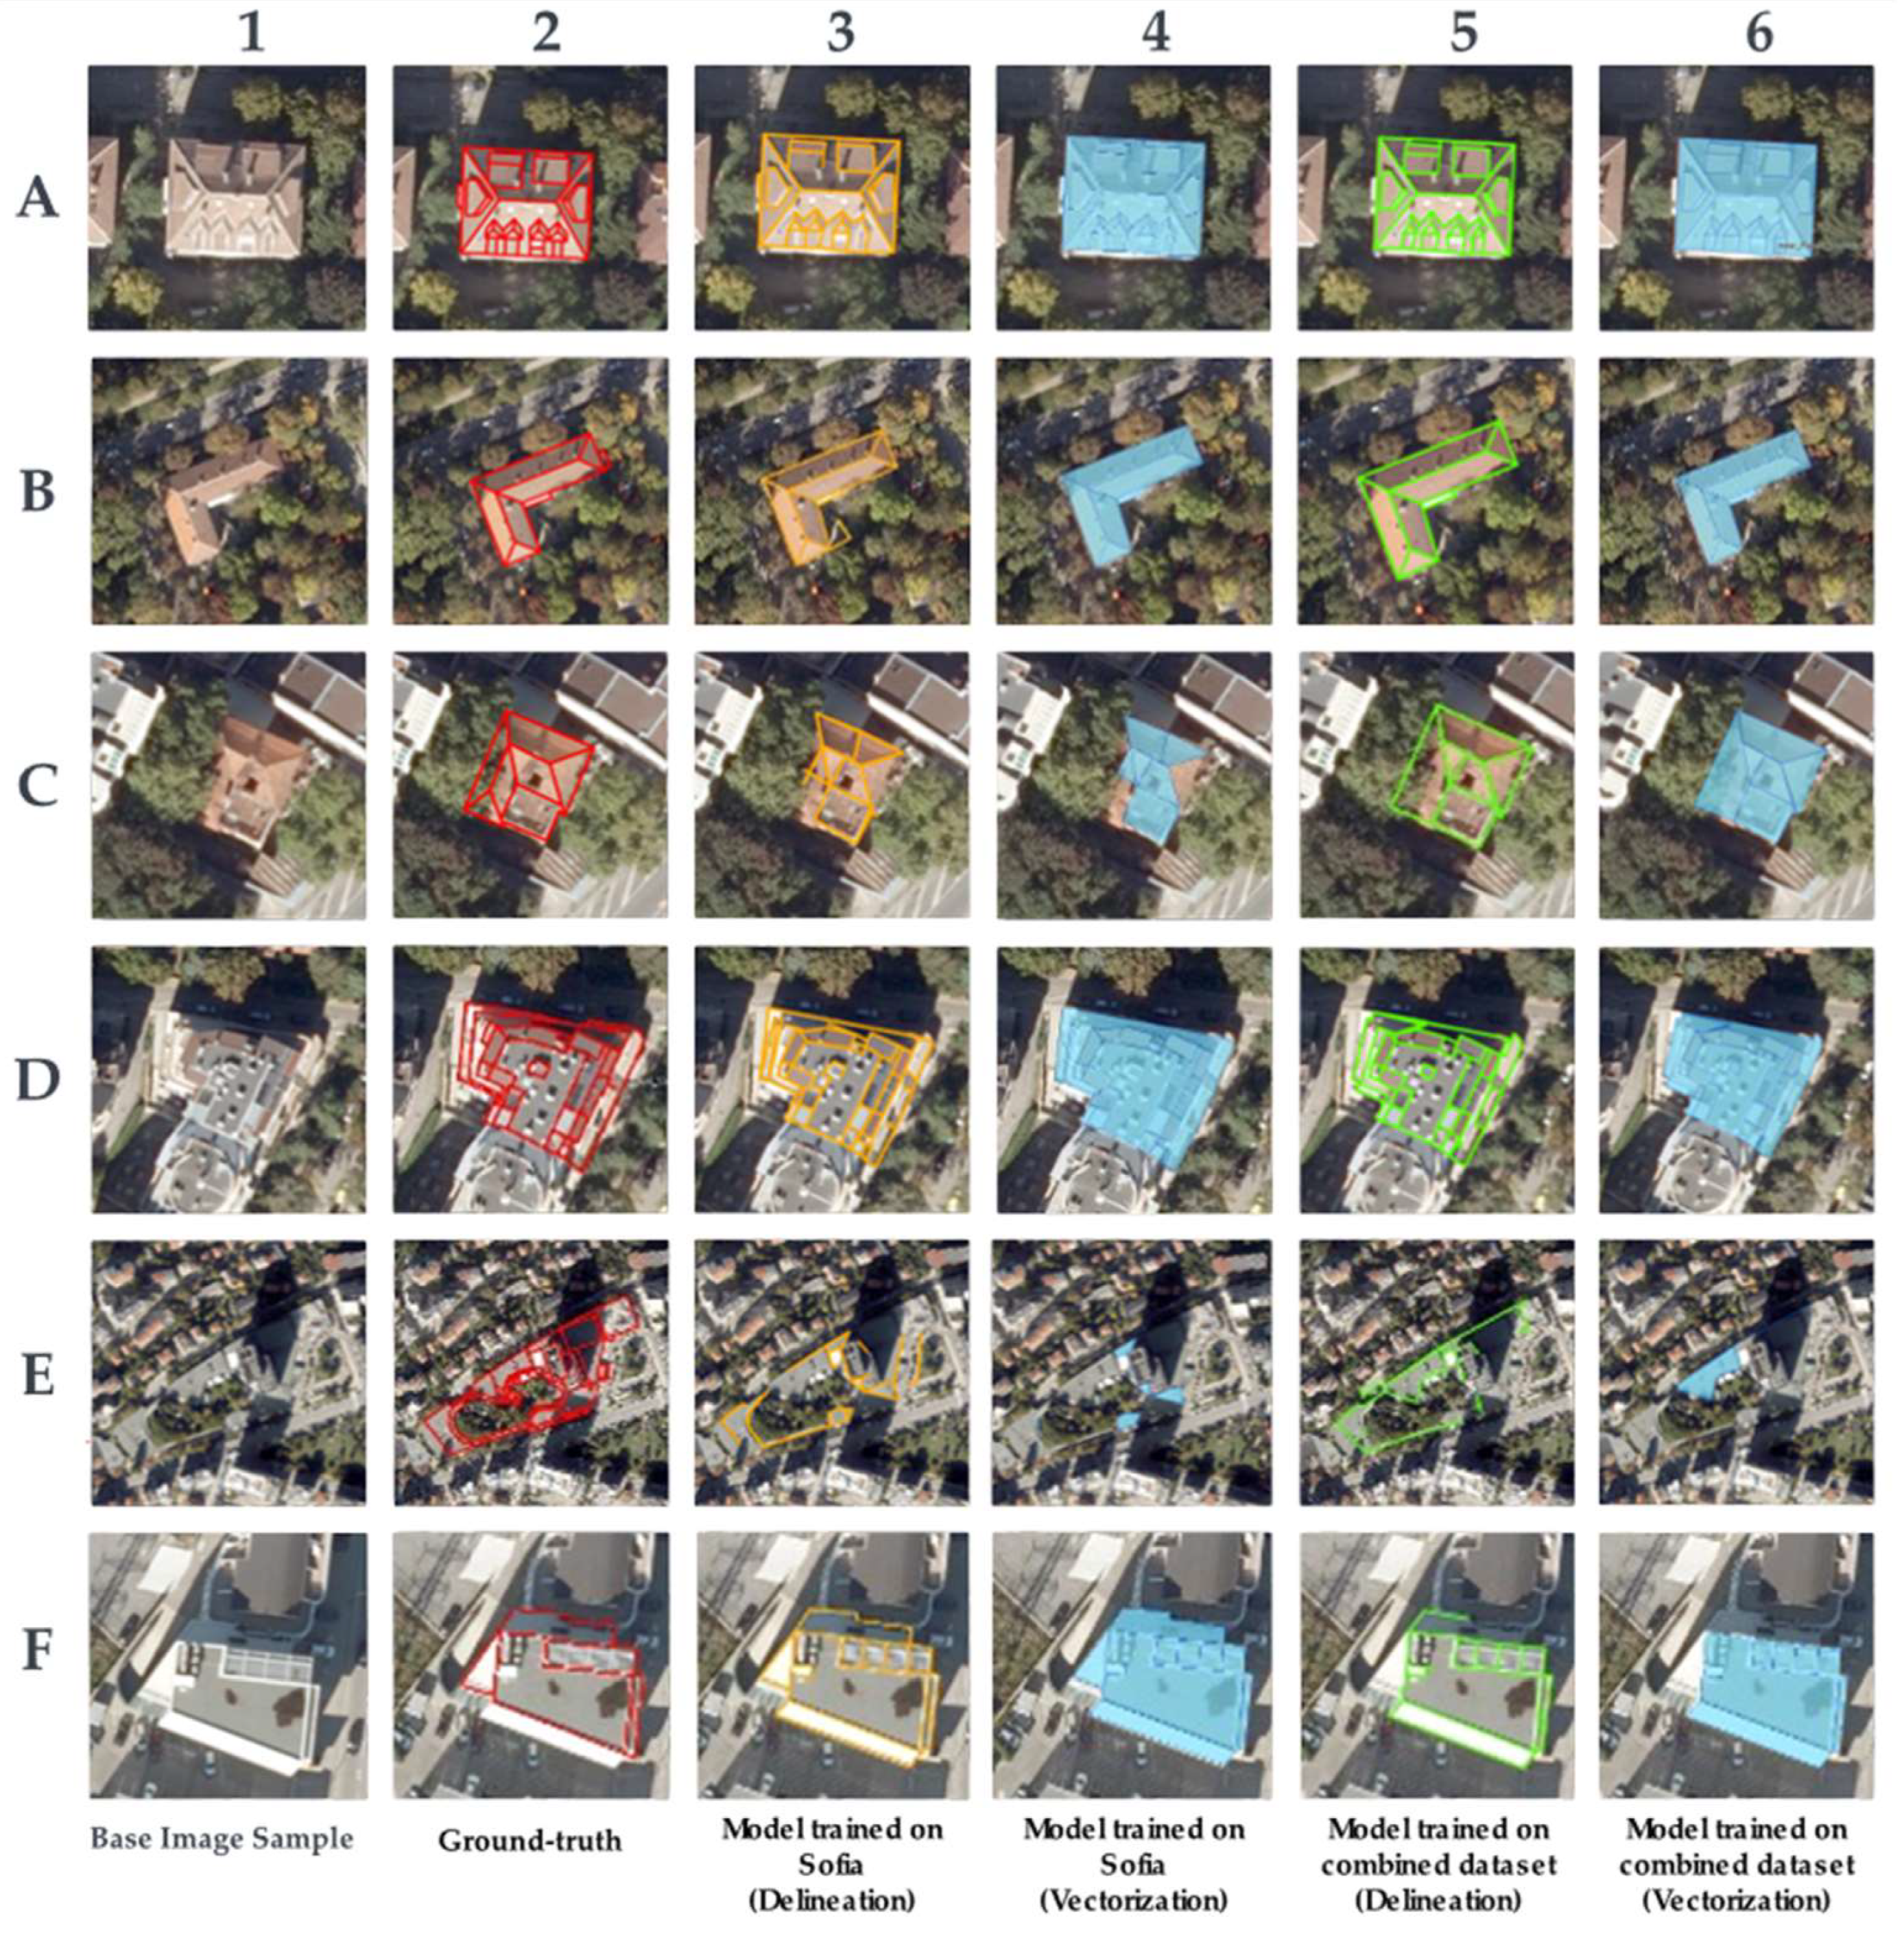
4.2. Qualitative Results

4.2.1. Building Roof Plane Extraction
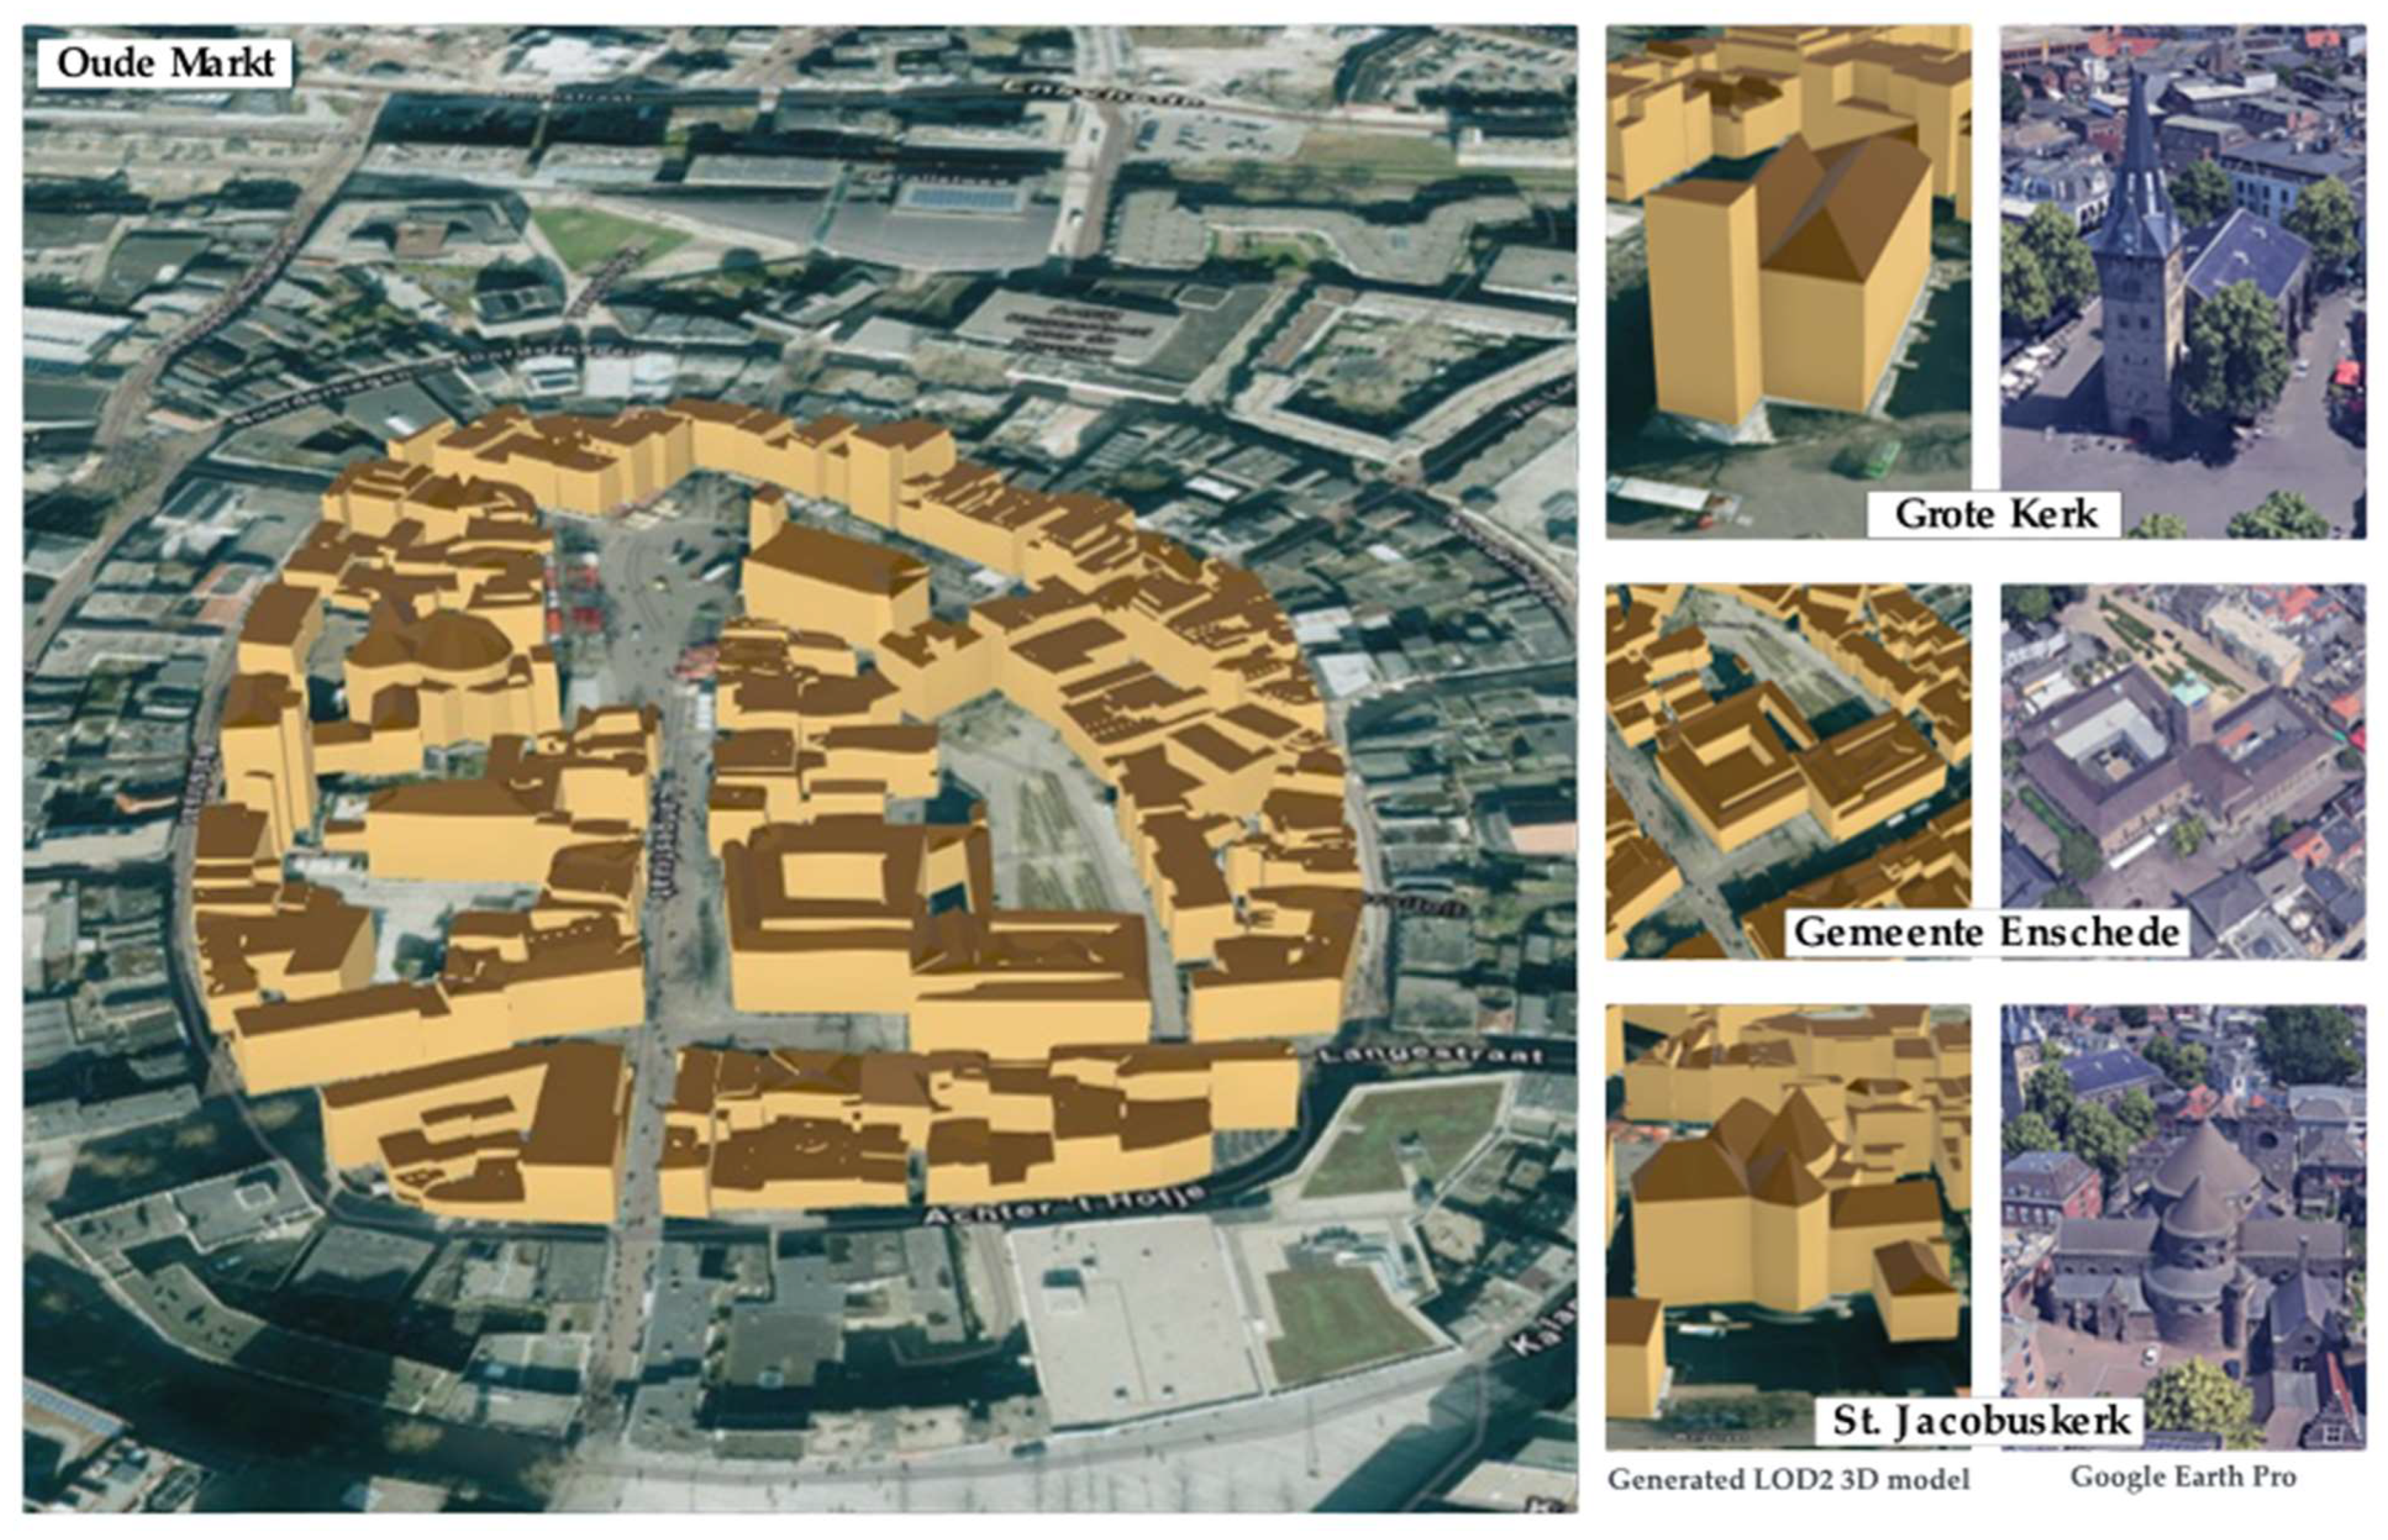
Figure 8 provides a qualitative comparison between the top two trained models that outperform in Stadsveld–‘t Zwering, Enschede, The Netherlands. As illustrated, the reconstruction quality is similar between the two models and close to the ground truth. However, the reconstruction ability of the model trained on the combined dataset is notable for detecting even more building inner roof planes than the ones detected from the model trained on the Enschede dataset only, which certainly impacts the qualitative results.
Figure 9 compares the top two trained models outperforming Oude Markt, Enschede, The Netherlands. As observed, the reconstruction quality is similar between the two models with the ground truth facing the same challenges in the reconstruction of structures that are covered by shadows and in reconstructing structures with circular shapes (row E). The model trained on the combined dataset performs better than the model trained on the Stadsveld–‘t Zwering dataset.
Figure 10 compares the top two trained models outperforming in the Lozenets, Sofia, Bulgaria, area. The reconstruction quality is similar between the two models with the ground truth. The same traits were observed in the previous experiments, in which the model trained on the combined dataset could detect even more planes than those presented on the ground truth. However, the qualitative evaluations show the ability of the model trained on the combined dataset to detect the finest details, including the inner planes of buildings that are occluded by the canopy of trees (row E).

4.2.2. 3D Modelling

Figure 11 shows the generated 3D model at LOD2 for the Oude Markt area. A comparative analysis of selected buildings considered representative within the area is conducted, contrasting the generated 3D structures with their counterparts from Google Earth Pro 3D buildings. Noteworthy are the discernible disparities in our model that require some rectification. Specific structures that were not recognized in the previous stage exhibit susceptibility to distortion in the 3D modelling phase.
The generated LOD2 3D model of Oude Markt at LOD2 and all the generated outputs on this research are published on a webmap ArcGIS online application [30].

5. Discussion

The present study introduced a novel framework to delineate building roof planes applicable across entire areas, utilizing aerial imagery and building footprint information using as a basis and upgrading the work developed by Cheng in 2022 [23]. In contrast to conventional segmentation methods for outdoor building reconstruction, which face challenges detecting straight edges [31], our proposed framework is specifically trained to identify corners and edges and establish geometric relationships between these corners. Notably, the framework achieves remarkable results, demonstrated by its ability to detect building inner roof planes, even in complex scenarios where vegetation obscures edges. This capability is facilitated by accurately identifying the end corners of the building’s inner roof planes and then, based on its holistic geometry reasoning, drawing the edges between them as demonstrated in Sample C5 and C6 (Figure 10) of the model trained on the combined dataset for Lozenets, Sofia, Bulgaria. This achievement surpasses traditional methods employed in such cases.
Despite the robust performance exhibited by our approach in delineating inner roof plane structures, specific limitations become evident in certain scenarios. A constraint arises when image samples encompass more than one building in the same image with a ground surface between, as illustrated in Sample D in Stadsveld–‘t Zwering, Sample C in Oude Markt (Figure 9), and Sample E in Lozenets (Figure 10). The trained models could predict the ground as a planar structure in such situations. This misclassification is attributed to the model’s challenge in discerning between various types of flat surfaces, particularly distinguishing between the ground, vegetation, and the roofs of buildings. This difficulty intensifies when the ground is a substantial portion of the image and assumes a shape similar to that of the building. Misinterpreting the ground as part of the building roof structure could introduce inaccuracies into the final 3D model, as exemplified in image Sample C in Oude Markt (Figure 9), representing “Gemeente Enschede”, where the 3D model appears different from the representation in Google Earth’s 3D model. Furthermore, these misinterpretations may result in significant errors that must be considered when assessing the model’s performance.
An additional complication arises when the model endeavors to infer inner planes on image samples featuring intricate roof graphs characterized by many corners intended to generate circular or highly complex roof structures with many planes, as demonstrated by the buildings depicted in sample E within Stadsveld–‘t Zwering and Oude Markt (Figure 9). The model encounters challenges in accurately interpreting and reconstructing the geometrical attributes inherent in these complex roof structures. Specifically, it frequently encounters difficulties in correctly identifying and processing planes characterized by numerous corners, resulting in the inaccurate generation of circular roof planes. As the complexity and number of corners within the roof graph increase, the model’s performance tends to diminish, indicating a potential vulnerability in handling geometric intricacies.
In instances where the image samples comprise large, densely packed, and complex buildings, as illustrated in Sample E in Stadsveld–‘t Zwering and Lozenets (Figure 10), all trained models exhibited suboptimal performance in detecting planes. This limitation can be ascribed to the model’s inherent difficulty in discerning between diverse structural elements within extensive, densely packed, and intricate building configurations within a limited pixelated image sample.
As shown by the observations in Sample F6 in Oude Markt and Row F in Lozenets (Figure 10), the output quality depends on the input data quality. In these cases, the trained model misinterpreted the building facades as part of the interior roof planes. This misconception is attributed to the building samples’ tilt of the aerial picture, which allowed some facade planes to be visible in the image samples.
Quantitative evaluations reveal susceptibility to bias in some instances, such as Samples A, B, D, E in Stadsveld–‘t Zwering, and C in Oude Markt (Figure 9), where the model trained on the combined dataset detects more planes than those presented in the ground truth, resulting in false positives that impact the quantitative assessment. However, when evaluating qualitative metrics, this discrepancy demonstrates that the trained model on the combined dataset performance is superior, detecting finer details, thus providing an advantage for the modeling stage.
Despite the advancements demonstrated in this study, certain limitations persist within the proposed framework. While this research highlights the feasibility of generating a Level of Detail 2 (LOD2) 3D model, some enhancements may involve integrating additional factors. For instance, incorporating normalized digital surface models (nDSM) as a four-band component in the building image sample is proposed to improve surface discrimination. Furthermore, future studies could benefit from experimenting with building image samples featuring a resolution of 512 × 512 pixels.
Finally, the current 3D city modelling methodology relies on pre-established tools within GIS software, and future investigations can extend and refine this presented framework by constructing a comprehensive end-to-end open-source framework.

6. Conclusions

This study introduces a multi-phase framework based on HEAT, a transformer-based deep-learning model, to automatically extract building inner roof planes and then use them to generate 3D city models at LOD2. The proposed approach extracts inner and outer rooflines applicable to different roof topologies. The inner roof planes are obtained in vector format, without additional post-processing, addressing challenges in image segmentation methods.
Further experiments in different areas demonstrated sensitivity to bias, affecting model performance. Quantitative assessments reveal that models tailored to specific study areas successfully extracted inner roof plane structures with a performance similar to a model trained on a combined dataset. However, a model trained on a combined dataset from both study areas demonstrated a superior performance when tested on a study that was not included in the training process, such as the Oude Markt, Enschede, study area. Nevertheless, topological evaluations requiring GIS post-processing of the final vector roof structures were not within the scope of this research. Qualitative assessments indicate superior performance of the model trained on the combined dataset, excelling in detecting roof boundaries even when vegetation obscures them. This achievement is significant because it allows for the prediction of invisible boundaries using the HEAT capability for structural reasoning in an integrated manner. Furthermore, the model’s ability to generate straight edges in the outputs represents a noteworthy success. Considering these accomplishments is crucial, as they address common challenges that classical deep-learning methods based on image segmentation often struggle with.
The developed framework successfully extracts inner roof planes, however, there are still inconsistencies including incomplete corner prediction in complex roof structures, requiring additional post-processing. The study demonstrates the feasibility of creating LOD2 3D city models by integrating the generated inner roof planes with DSM, DTM, and nDSM. While improvements can be added to the framework, the approach confirms the viability of combining remote sensing, GIS, and deep learning for urban mapping and 3D city modelling, making it a cornerstone for future research and growth.

Author Contributions

Conceptualization, C.C., M.K., C.P. and D.P.-A.; methodology, C.C., M.K., C.P., D.P.-A., K.M. and W.J.; formal analysis, C.C., M.K., C.P., D.P.-A., K.M. and W.J.; writing—original draft preparation, C.C., M.K. and C.P.; final version review, C.C., M.K., C.P., D.P.-A., K.M. and W.J. All authors have read and agreed to the published version of the manuscript.

Funding

This research received no external funding.

Institutional Review Board Statement

Not applicable.

Informed Consent Statement

Not applicable.

Data Availability Statement

The datasets used in this research are openly available through the References [32,33,34].

Acknowledgments

The dataset was provided by the GATE, The Big Data for Smart Society Institute, in Sofia, Bulgaria, and RMSI, an external consulting company hired to digitize vector information in the study area of Lozenets, Sofia, Bulgaria.

Conflicts of Interest

The authors declare no conflicts of interest.

References

  1. Shojaei, D.; Olfat, H.; Rajabifard, A.; Briffa, M. Design and Development of a 3D Digital Cadastre Visualization Prototype. ISPRS Int. J. Geo Inf. 2018, 7, 384. [Google Scholar] [CrossRef]
  2. Rau, J.Y.; Cheng, C.K. A Cost-Effective Strategy for Multi-Scale Photo-Realistic Building Modeling and Web-Based 3-D GIS Applications in Real Estate. Comput. Environ. Urban Syst. 2013, 38, 35–44. [Google Scholar] [CrossRef]
  3. Van Oosterom, P. Research and Development in 3D Cadastres. Comput. Environ. Urban Syst. 2013, 40, 1–6. [Google Scholar] [CrossRef]
  4. Hajji, R.; Yaagoubi, R.; Meliana, I.; Laafou, I.; Gholabzouri, A. El Development of an Integrated BIM-3D GIS Approach for 3D Cadastre in Morocco. ISPRS Int. J. Geo Inf. 2021, 10, 351. [Google Scholar] [CrossRef]
  5. Dimitrov, H.; Petrova-Antonova, D. 3D City Model as a First Step towards Digital Twin of Sofia City. Int. Arch. Photogramm. Remote Sens. Spat. Inf. Sci. ISPRS Arch. 2021, 43, 23–30. [Google Scholar] [CrossRef]
  6. Peters, R.; Dukai, B.; Vitalis, S.; van Liempt, J.; Stoter, J. Automated 3D Reconstruction of LoD2 and LoD1 Models for All 10 Million Buildings of the Netherlands. Photogramm. Eng. Remote Sens. 2022, 88, 165–170. [Google Scholar] [CrossRef]
  7. Kolbe, T.H.; Gröger, G.; Plümer, L. CityGML: Interoperable Access to 3D City Models. Proc. Int. Symp. Geo Inf. Disaster Manag. 2005, 1, 883–899. [Google Scholar] [CrossRef]
  8. Consortium, O.G. OGC City Geography Markup Language (CityGML) 3.0 Conceptual Model Users Guide. Available online: https://docs.ogc.org/guides/20-066.html#overview-section-levelsofdetail (accessed on 1 April 2024).
  9. Macay Moreia, J.M.; Nex, F.; Agugiaro, G.; Remondino, F.; Lim, N.J. From Dsm to 3D Building Models: A Quantitative Evaluation. Int. Arch. Photogramm. Remote Sens. Spat. Inf. Sci. 2013, XL-1/W1, 213–219. [Google Scholar] [CrossRef]
  10. Biljecki, F.; Ledoux, H.; Stoter, J. An Improved LOD Specification for 3D Building Models. Comput. Environ. Urban Syst. 2016, 59, 25–37. [Google Scholar] [CrossRef]
  11. Santhanavanich, J. Open-Source CityGML 3D Semantical Building Models: A Complete List of Open-Source 3D City Models. Available online: https://towardsdatascience.com/open-source-3d-semantical-building-models-in-2020-f47c91f6cd97 (accessed on 18 December 2023).
  12. Ghaffarian, S.; Ghaffarian, S.; El Merabet, Y.; Samir, Z.; Ruichek, Y. Automatic Building Roof Segmentation Based On PFICA Algorithm And Morphological Filtering From Lidar Point Clouds. In Proceedings of the 37th Asian Conference on Remote Sensing, ACRS 2016: Spatial Data Infrastructure for Sustainable Development, Colombo, Sri Lanka, 17–21 October 2016. [Google Scholar]
  13. Lee, J.; Zlatanova, S.; Gartner, G.; Meng, L.; Peterson, M.P. 3D Geo-Information Sciences. In Lecture Notes in Geoinformation and Cartography; Lee, J., Zlatanova, S., Eds.; Springer: Berlin/Heidelberg, Germany, 2009; pp. 79–96. ISBN 9783540873945. [Google Scholar]
  14. Soilán, M.; Truong-Hong, L.; Riveiro, B.; Laefer, D. Automatic Extraction of Road Features in Urban Environments Using Dense ALS Data. Int. J. Appl. Earth Obs. Geoinf. 2018, 64, 226–236. [Google Scholar] [CrossRef]
  15. Sun, X. Deep Learning-Based Building Extraction Using Aerial Images and Digital Surface Models; University of Twente: Enschede, The Netherlands, 2021; Available online: https://essay.utwente.nl/88648/ (accessed on 23 December 2023).
  16. Huang, J.; Stoter, J.; Peters, R.; Nan, L. City3D: Large-Scale Building Reconstruction from Airborne LiDAR Point Clouds. Remote Sens. 2022, 14, 2254. [Google Scholar] [CrossRef]
  17. Zhao, W.; Persello, C.; Stein, A. Extracting Planar Roof Structures from Very High Resolution Images Using Graph Neural Networks. ISPRS J. Photogramm. Remote Sens. 2022, 187, 34–45. [Google Scholar] [CrossRef]
  18. Ok, A.O. Automated Detection of Buildings from Single VHR Multispectral Images Using Shadow Information and Graph Cuts. ISPRS J. Photogramm. Remote Sens. 2013, 86, 21–40. [Google Scholar] [CrossRef]
  19. Qin, Y.; Wu, Y.; Li, B.; Gao, S.; Liu, M.; Zhan, Y. Semantic Segmentation of Building Roof in Dense Urban Environment with Deep Convolutional Neural Network: A Case Study Using GF2 VHR Imagery in China. Sensors 2019, 19, 1164. [Google Scholar] [CrossRef] [PubMed]
  20. Liu, K.; Ma, H.; Ma, H.; Cai, Z.; Zhang, L. Building Extraction from Airborne LiDAR Data Based on Min-Cut and Improved Post-Processing. Remote Sens. 2020, 12, 2849. [Google Scholar] [CrossRef]
  21. Rezaei, Z.; Vahidnia, M.H.; Aghamohammadi, H.; Azizi, Z.; Behzadi, S. Digital Twins and 3D Information Modeling in a Smart City for Traffic Controlling: A Review. J. Geogr. Cartogr. 2023, 6, 1865. [Google Scholar] [CrossRef]
  22. Zhao, W.; Persello, C.; Stein, A. Building Outline Delineation: From Aerial Images to Polygons with an Improved End-to-End Learning Framework. ISPRS J. Photogramm. Remote Sens. 2021, 175, 119–131. [Google Scholar] [CrossRef]
  23. Chen, J.; Qian, Y.; Furukawa, Y. HEAT: Holistic Edge Attention Transformer for Structured Reconstruction. Proc. IEEE Comput. Soc. Conf. Comput. Vis. Pattern Recognit. 2022, 2022, 3856–3865. [Google Scholar] [CrossRef]
  24. Golnia, M. Building Outline Delineation and Roofline Extraction: A Deep Learning Approach; University of Twente: Enschede, The Netherlands, 2021; Available online: https://essay.utwente.nl/88990/ (accessed on 23 December 2023).
  25. Girard, N.; Tarabalka, Y. End-to-end learning of polygons for remote sensing image classification. In Proceedings of the IGARSS 2018–2018 IEEE International Geoscience and Remote Sensing Symposium, Valencia, Spain, NJ, USA, 22–27 July 2018; IEEE: Piscataway, NJ, USA; pp. 2083–2086. [Google Scholar]
  26. Marcos, D.; Tuia, D.; Kellenberger, B.; Zhang, L.; Bai, M.; Liao, R.; Urtasun, R. Learning Deep Structured Active Contours End-to-End. Presented at the 31st Meeting of the IEEE/CVF Conference on Computer Vision and Pattern Recognition, CVPR 2018, Salt Lake City, UT, USA, 18–22 June 2018; pp. 8877–8885. [Google Scholar]
  27. PDOK (the Public Services On the Map). Available online: https://www.pdok.nl/ (accessed on 5 December 2022).
  28. AHN Viewer. Available online: https://ahn.arcgisonline.nl/ahnviewer/ (accessed on 29 April 2023).
  29. Use 3D Basemaps. Available online: https://doc.arcgis.com/en/arcgis-solutions/10.9.1/reference/use-3d-basemaps.htm (accessed on 22 November 2023).
  30. Automatic Building Roof Plane Structure Extraction from Remote Sensing Data. Available online: https://www.arcgis.com/home/webscene/viewer.html?webscene=b09bd9fcb9ec4d39a85f9d672776b06e&viewpoint=cam:6.89874543,52.21450794,543.283;349.682,52.253 (accessed on 27 November 2023).
  31. Hossain, M.D.; Chen, D. A Hybrid Image Segmentation Method for Building Extraction from High-Resolution RGB Images. ISPRS J. Photogramm. Remote Sens. 2022, 192, 299–314. [Google Scholar] [CrossRef]
  32. Campoverde, C. Carecamp93/Automatic_Roof_Plane_Extraction. Available online: https://github.com/carecamp93/Automatic_Roof_Plane_Extraction (accessed on 1 April 2024).
  33. Campoverde, C. 1-Roof Extraction. Available online: https://drive.google.com/drive/folders/1ZDmQDv58faQrKPdYRurABFxSAF1o398h?usp=sharing (accessed on 1 April 2024).
  34. Campoverde, C. 2-3D Modelling. Available online: https://drive.google.com/drive/folders/1C0qwlgx6gXsfIcFQd_x9gPT2yih6e-jf?usp=sharing (accessed on 1 April 2024).
Figure 1. The building distribution for the Stadsveld–‘t Zwering area, Enschede, The Netherlands.
Remotesensing 16 01386 g001
Figure 2. The building distribution for Oude Markt, Enschede, The Netherlands.
Remotesensing 16 01386 g002
Figure 3. The building distribution for Lozenets, Sofia, Bulgaria.
Remotesensing 16 01386 g003
Figure 4. The workflow of the taken HEAT method adapted for rooftop plane building delineation from cadaster information and RGB data.
Remotesensing 16 01386 g004
Figure 5. The workflow of 3D modelling using the 3DBasemap extension in ArcGIS Pro is shown from the obtained rooftop planes and different digital elevation models.
Remotesensing 16 01386 g005
Figure 6. The overall workflow of the data preparation process.
Remotesensing 16 01386 g006
Figure 7. The overall workflow of the building roof plane extraction.
Remotesensing 16 01386 g007
Figure 8. Qualitative evaluations on building roof plane extraction in the Stadsveld–‘t Zwering, Enschede, The Netherlands, dataset.
Remotesensing 16 01386 g008
Figure 9. Qualitative evaluations on building roof plane extraction in the Oude Markt, Enschede, The Netherlands, dataset.
Remotesensing 16 01386 g009
Figure 10. Qualitative evaluations on building roof plane extraction in the Lozenets, Sofia, Bulgaria, dataset.
Remotesensing 16 01386 g010
Figure 11. Qualitative evaluations of the generated LOD2 3D model of Oude Markt. The assessment involves a comparative analysis of some representative 3D structures modeled against the 3D building structures from Google Earth Pro 7.3.
Remotesensing 16 01386 g011
Table 1. Description of the dataset used in the presented research.
AreaDataSource
Stadsveld–‘t Zwering,
Enschede,
The Netherlands
RGB Orthophoto (8 cm) PDOK [27],
from aerial imagery, 2020
The buildings inner roof planes, in polygon vector format Digitalized by the author, 2023
The buildings footprints, in polygon vector format PDOK [27], edited by the author, 2023
Oude Markt
Enschede,
The Netherlands
RGB Orthophoto (8 cm) PDOK [27],
from aerial imagery, 2020
The buildings inner roof planes, in polygon vector format Digitalized by the author, 2023
The buildings footprints, in polygon vector format PDOK [27], edited by the author, 2023
LIDAR, point cloudAHN4 [28] (Point Cloud), 2020
Lozenets,
Sofia,
Bulgaria
RGB Orthophoto (10 cm) GATE,
from aerial imagery, 2020
The buildings inner roof planes, in polygon vector format Digitalized by RMSI, 2023
The buildings footprints, in polygon vector format Digitalized by RMSI, 2023
Table 2. Dataset parameters for training.
ModelDataset Size Max. Number of Corners per Image
TrainingValidationTotalImage SizeBatch Size
Model trained on the Stadsveld–‘t Zwering, Enschede, The Netherlands, dataset1972123209525616150
Model trained on the Lozenets,
Sofia, Bulgaria, dataset
1440901530
Model trained on the combined dataset from Stadsveld–‘t Zwering and Lozenets dataset34122133625
Table 3. Quantitative evaluations on building roof structure extraction. The values in bold mark the top results on our experiments.
AreaModelsCornersEdgesRegionsVectorization
PrecisionRecallF1 ScorePrecisionRecallF1 ScorePrecisionRecallF1 ScoreIoU
Stadsveld–’t Zwering, Enschede, The NetherlandsModel trained on Enschede dataset0.850.680.760.610.500.550.720.640.680.82
Model trained on Sofia dataset0.520.720.600.340.480.400.410.560.47-
Model trained on combined dataset0.850.680.760.610.510.560.730.640.680.80
Oude Markt, Enschede, The NetherlandsModel trained on Enschede dataset0.690.460.550.380.240.290.490.300.370.66
Model trained on Sofia dataset0.430.640.510.220.340.270.270.400.32-
Model trained on combined dataset0.600.550.570.310.290.300.440.430.430.82
Lozenets,
Sofia,
Bulgaria
Model trained on Enschede dataset0.840.270.410.390.120.190.450.130.21-
Model trained on Sofia dataset0.800.530.630.440.310.370.470.370.410.71
Model trained on combined dataset (Enschede + Sofia)0.810.500.620.440.300.360.470.350.410.70
Table 4. Quantitative evaluations on 3D modelling stage.
Area RMSETotal
(0–5) m.(5–10) m.(10–15) m.(15–20) m.(25–30) m.
Oude Markt, Enschede, The NetherlandsNo. of buildings’ planes4731642582672
%70.3924.403.721.190.30100.00
Disclaimer/Publisher’s Note: The statements, opinions and data contained in all publications are solely those of the individual author(s) and contributor(s) and not of MDPI and/or the editor(s). MDPI and/or the editor(s) disclaim responsibility for any injury to people or property resulting from any ideas, methods, instructions or products referred to in the content.

