1. Introduction
Snow cover is widely distributed in mid–high-latitude and high-altitude regions [
1,
2,
3], and due to its high variability and sensitivity [
4], it serves as an indicator of global climate change [
5]. Changes in snow cover have significant impacts on global surface energy balance, the water cycle, climate change, etc. [
6]. In arid and semi-arid regions, snowmelt is a critical water resource with direct implications for local agriculture and pastoralism [
7]. The Qinghai–Tibet Plateau, known as the “Third Pole” and the “Asian Water Tower” [
8], is the region with the highest altitude and largest snow cover in the mid-latitudes of the Northern Hemisphere, second only to the polar regions in the global cryosphere [
9]. Changes in snow cover on the Qinghai–Tibet Plateau, as a significant land surface process, can have thermal impacts extending to the middle troposphere [
10], exerting important influences on East Asian atmospheric circulation and weather system evolution, thereby affecting weather and climate change in China [
8].
The Qinghai–Tibet Plateau is a sensitive region to global climate change. Against the background of climate warming, the rate of warming on the plateau far exceeds the global average, leading to glacier retreat, permafrost degradation, lake expansion, etc. [
11]. These changes, in turn, influence the weather and climate not only on the plateau but also in East Asia and even the Northern Hemisphere [
12]. For instance, snow can affect the thermal conditions of the plateau through snow–plateau feedback and snowmelt [
13]. Additionally, changes in snow cover on the plateau can alter the surface properties, subsequently affecting the thermal and dynamic interactions between the plateau and the atmosphere [
14,
15], ultimately exerting significant impacts on the climate of downstream regions [
16,
17,
18]. It is also considered as a key factor for summer precipitation prediction in China [
19,
20,
21]. Therefore, it is of great scientific significance to research the spatiotemporal distribution and variation characteristics of snow cover on the Qinghai–Tibet Plateau.
The main methods for snow cover observation are station and satellite remote sensing [
6]. Station data have the advantages of long-term and high-quality records, but they suffer from poor spatial representativeness, especially in the sparsely distributed stations on the Qinghai–Tibet Plateau. Most of the snow cover on the plateau is found at higher elevations in mountainous areas, while the majority of observation stations are located in lower-elevation valleys, resulting in a lack of station observations for snow cover in mountainous regions [
22]. Therefore, it is challenging to capture the overall characteristics of snow cover on the Qinghai–Tibet Plateau solely based on station observations [
23]. Satellite data can effectively compensate for the limitations of station observations and have become the primary source of high-temporal and -spatial-resolution data [
24,
25]. However, the accuracy of satellite data is limited, it is necessary to integrate the advantages of station observations and satellite remote sensing data to obtain a high-resolution and objective dataset [
23].
The variational processing method has been widely applied in the satellite remote sensing inversion of urban heat islands, atmospheric element fields during dust storms, clear-sky cloud-top blackbody temperature data, and satellite precipitation correction on the Qinghai–Tibet Plateau [
26]. Weng et al. [
27] first introduce the variational processing method in the sparsely populated plateau region, and their numerical experiment results show that the variational processing method can improve the reliability of the initial values of TOVS (Tiros Operational Vertical Sounder) data in high-altitude regions. Xu et al. [
28] use the variational processing method to correct the temperature, humidity, and geopotential height of satellite remote sensing TOVS data through conventional sounding data, and high-resolution data are obtained. Cheng et al. [
29] use the variational processing method based on satellite remote sensing and station observation to study the spatial distribution characteristics of PM
10 and research the impact of vehicle emissions in Beijing. Cheng et al. [
30] establish a variational model and use clear-sky processes to correct automatic meteorological station temperature observations and satellite remote sensing cloud-top blackbody temperature, to solve the objective correction problem of high-resolution satellite remote sensing in urban heat island research. Sun et al. [
26] use the variational processing method to integrate station observation data on the Qinghai–Tibet Plateau and satellite precipitation products to overcome the respective deficiencies in them and obtain high-accuracy and high-resolution precipitation products. The above research results indicate that the variational processing method can effectively incorporate station observations into satellite observations, compensate for the sparseness of station observations, and obtain high-resolution and high-quality data.
Therefore, this study used the optimized variational processing method based on data from 471 meteorological observation stations (25°N–42°N, 73°E–106°E) and satellite data, integrating the advantages of them to obtain high-resolution and objective snow cover day data on the Qinghai–Tibet Plateau. And then, the spatiotemporal variations in snow cover days on the plateau were systematically researched, and the differences in the spatiotemporal distribution of snow cover days before and after the optimized variational processing method were compared. It is significant to explore how to use the optimized variational processing method based on satellite remote sensing and station observations to obtain more accurate and high-resolution snow cover day data for the Qinghai–Tibet Plateau. Additionally, the optimized variational processing method was applied to reanalyze the data for temperature and precipitation, and the effect of the variational processing method on the correlation between temperature/precipitation and snow cover days is discussed. Our results have significant implications for the study of snow cover days on the Qinghai–Tibet Plateau.
2. Data and Methods
2.1. Data Sources
The satellite snow cover data used in this study were derived from the 1 km snow cover dataset of the optical remote sensing instrument on the Qinghai–Tibet Plateau released by the National Tibetan Plateau/Third Pole Environment Data Center [
31]. This snow cover dataset is produced through a snow and cloud identification method based on optical instrument observation data, covering the daily product in the time interval from 1989 to 2020 (two periods, from January to April and from October to December) and the region of the Qinghai–Tibet Plateau (17°N–41°N, 65°E–106°E), taking equal latitude and longitude projection with a 0.01° × 0.01° spatial resolution, and characterizes whether the ground under clear sky or transparent thin cloud is covered by snow. The daily product achieves about a 95% average coincidence rate of snow and non-snow identification compared to the ground-based snow depth observation in these years. The dataset is stored in standard HDF4 files, each having two SDSs of snow cover and quality code with dimensions of 4100 columns and 2400 lines. Complete attribute descriptions are written in them.
These satellite snow cover data are represented by codes, where 0 indicates missing data, 1 indicates no decision, 11 represents night, 25 represents no snow, 37 represents lakes, 39 represents oceans, 50 represents clouds, 100 represents lake ices, 200 represents snow, 254 represents detector saturation, and 255 represents fill values. When establishing the satellite snow cover day dataset, a value of 0 is assigned to 25 (no snow), and a value of 1 is assigned to 200 (snow cover), while the rest are assigned as missing data. The satellite snow cover day dataset is only composed of 0 (no snow), 1 (snow cover day), and missing data. Due to the missing data, the snow cover days for each month were first calculated. Then, these values were multiplied by the number of days in each respective month to obtain a satellite snow cover day dataset from 1989 to 2020. The temporal scale is monthly, and the resolution is 0.1° × 0.1°.
The station snow day data were derived from the China Ground Snow Day Monthly Dataset V1.0, provided by the China Meteorological Information Center. The number of days with a snow depth of ≥1 cm is defined as the monthly snowfall days at each station. It covers the period from January 1951 to December 2021, and includes over 2400 stations. The dataset was quality-controlled and homogenized.
The temperature and precipitation reanalysis data used in this study were obtained from the ERA5 monthly averaged data on single levels from 1940 to present with a spatial resolution of 0.25° × 0.25°, and ERA5-Land monthly averaged data from 1950 to present with a spatial resolution of 0.1° × 0.1°. These two reanalysis datasets are both available from the European Centre for Medium-Range Weather Forecasts.
2.2. The Principle of the Variational Processing Method
The fundamental problem of variational methods is to find the extremum of a function, which depends on multiple independent variables:
U(
x,
y) must satisfy the Euler equation:
Assume that the monthly cumulative snow cover days in the specified region D are denoted as
R*(
), and the corresponding station snow cover days at finite points are denoted as
R(
). Then, at the station coordinates (
), the difference between these two fields is defined as the error field:
Therefore, it is necessary to construct a more generalized correction factor field function for the entire field. The original field plus this correction factor field form the corrected snow cover day field.
To obtain
, it must satisfy the following conditions:
since the grid points of the snow cover day field are limited, that is to say,
reaches the minimum value.
Therefore, this problem is transformed into calculating the extremum of the function. For the above variational problem, it can be assumed to construct the function
J,
λ is the constraint coefficient. Calculating the first-order variation of the above equation yields
The necessary condition for the function to attain the extremum is
, which corresponds to the Euler equation:
is the shape constraint function, that is, the Lagrange multiplier, which is introduced to determine the conditional extremum. The numerical solution of the above equation can be obtained through iteration, and the new variational correction factor field
can be obtained, and ultimately, the variational corrected snow cover field can be obtained.
It should be noted that due to significant variations in monthly snow cover days (ranging from a minimum of 0 to a maximum of 31), an additive systematic bias correction was required for the original monthly satellite snow cover dataset before variational processing. This correction involved calculating the deviation between the satellite data and station observations. Since snow cover days can only be positive integers and cannot exceed the total number of days in a given month, if the snow cover data at a grid point became less than 0 or exceeded the number of days in the corresponding month after variational processing, the original satellite data for that grid point were used instead. Finally, the snow cover days after variational processing were rounded to the nearest whole number.
2.3. Root-Mean-Square Error (RMSE)
To assess and verify the quality of satellite snow products, the data from station observations were compared with the grid data of adjacent satellite snow data. The RMSE was used to quantitatively evaluate the consistency between satellite snow data and station data.
and
represent the observed data from the meteorological stations and the snow day data from the corresponding grid points of the satellites, and n is the sample size. The RMSE can be used to measure the deviation between satellite snow day data and station observations, and the smaller the absolute value, the closer the satellite snow day data are to the station observation data.
2.4. Trend and Significance Calculation
The Ordinary Least Squares (OLS) method is widely used to calculate the linear trends of climate variables due to its simplicity, but it assumes that the data follow a Gaussian distribution [
32]. When the data do not follow a Gaussian distribution, OLS is not applicable. Since snow day data do not follow a Gaussian distribution, the Theil–Sen Median method [
33,
34] was used to calculate the linear trend. The Theil-Sen Median method, also known as Sen’s slope estimation, assumes a time series
, …,
, and for any
, the calculation formula for Sen’s slope estimation is as follows:
and
represent the snow cover day data,
β > 0 indicates an increasing trend of snow days, and
β < 0 indicates a decreasing trend.
A Mann–Kendall test was used to determine whether the trend in snow cover days is significant. If the trend is significant at the 95% confidence level (p < 0.05), it is considered to have statistical significance.
In addition, because satellite data are only available from January to April and October to December, we define the seven months of January, February, March, April, October, November, and December as the snow season, and winter is defined according to climatology as January, February, and December of the previous year.
3. Results
3.1. The Optimized Variational Processing Method
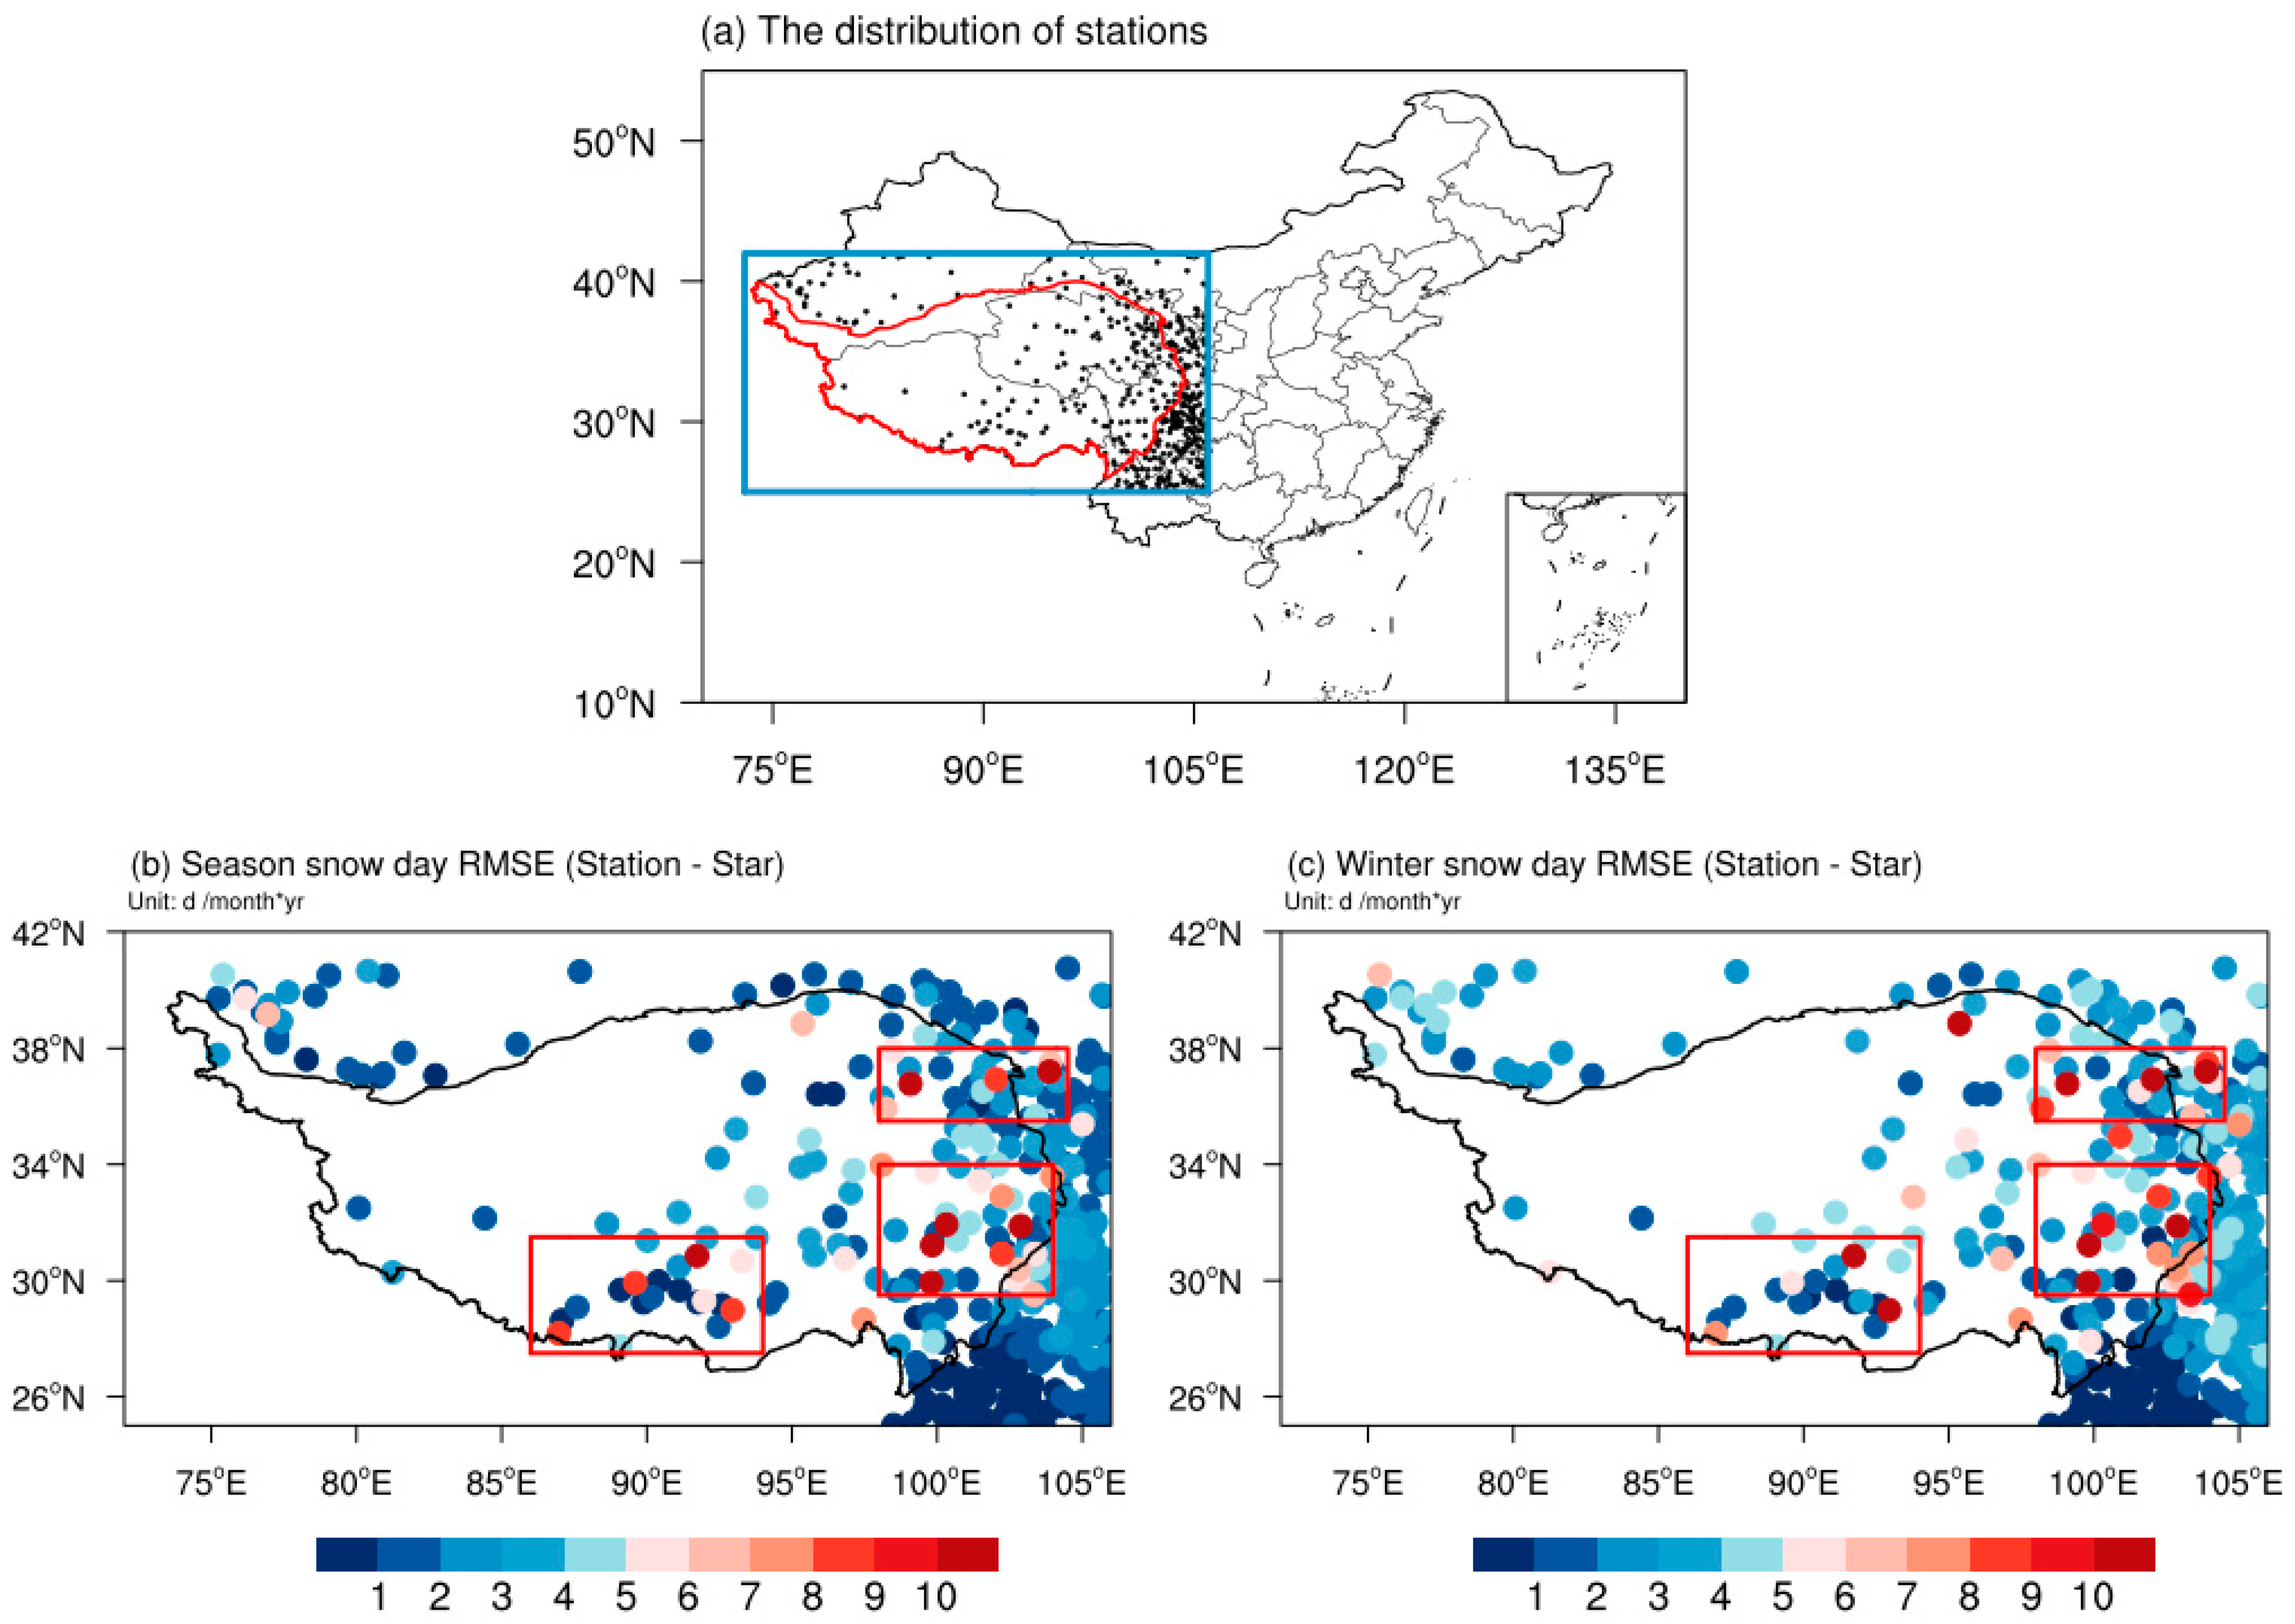
Figure 1b,c show the distribution of the RMSE for the average monthly snow cover days at the stations and the nearest grid point satellite data in the snow season and winter from 1989 to 2020 in the Qinghai–Tibet Plateau region. It can be observed that the southern and eastern parts of the Qinghai–Tibet Plateau have higher RMSE values, indicating differences between the station and satellite snow cover data. This highlights the need to merge the advantages of both data types using the variational processing method to obtain high-resolution and objective snow cover data for the Qinghai–Tibet Plateau.
Due to the influence of terrain and population distribution, meteorological observation stations are very unevenly distributed spatially. The meteorological stations on the Qinghai–Tibet Plateau are mainly located in the eastern and southern regions, while they are sparse in the central and northwestern parts of the plateau, leading to large areas of observational “blank zones” (
Figure 1a). These blank zones span approximately 10 degrees in latitude in the southern part and around 15 degrees in longitude, accounting for about one-third of the plateau’s total area. The complex terrain and surface structure characteristics of the plateau result in a highly uneven spatial distribution of snow cover. The eastern stations are more densely distributed, while there are only 1 to 2 stations in the central and western regions, making it difficult to represent the snow cover distribution characteristics of the entire central and western parts of the Qinghai–Tibet Plateau.
To solve this issue, we consider interpolating the station data, treating the interpolation results on grid points as supplementary station snow data, thereby achieving a uniform distribution of station values in the area. These data are then used for the variational processing method with satellite snow data. However, different resolutions of interpolation result in different numbers of supplementary stations, leading to differences in the variational satellite snow products. If the resolution of interpolation is low, the goal of supplementing stations may not be achieved. Conversely, if the resolution is too high, there may be an excessive number of supplementary stations, introducing inaccurate information and resulting in significant errors in the variational satellite snow products. In order to identify the optimal variational processing method, the following sets of experiments were designed (
Table 1).
Interpolation is performed at resolutions of 5, 4, 3, 2, and 1 degrees, treating the interpolation output as supplementary station data with the original station data together for the variational processing of snow cover day data. In this experiment, Ori represents the original satellite snow cover day product, corrected represents the snow cover day product that has undergone variational processing without interpolation optimization, and 5°-corrected to 1°-corrected represent the snow cover day products obtained through the variational processing method with interpolation optimization at different resolutions.
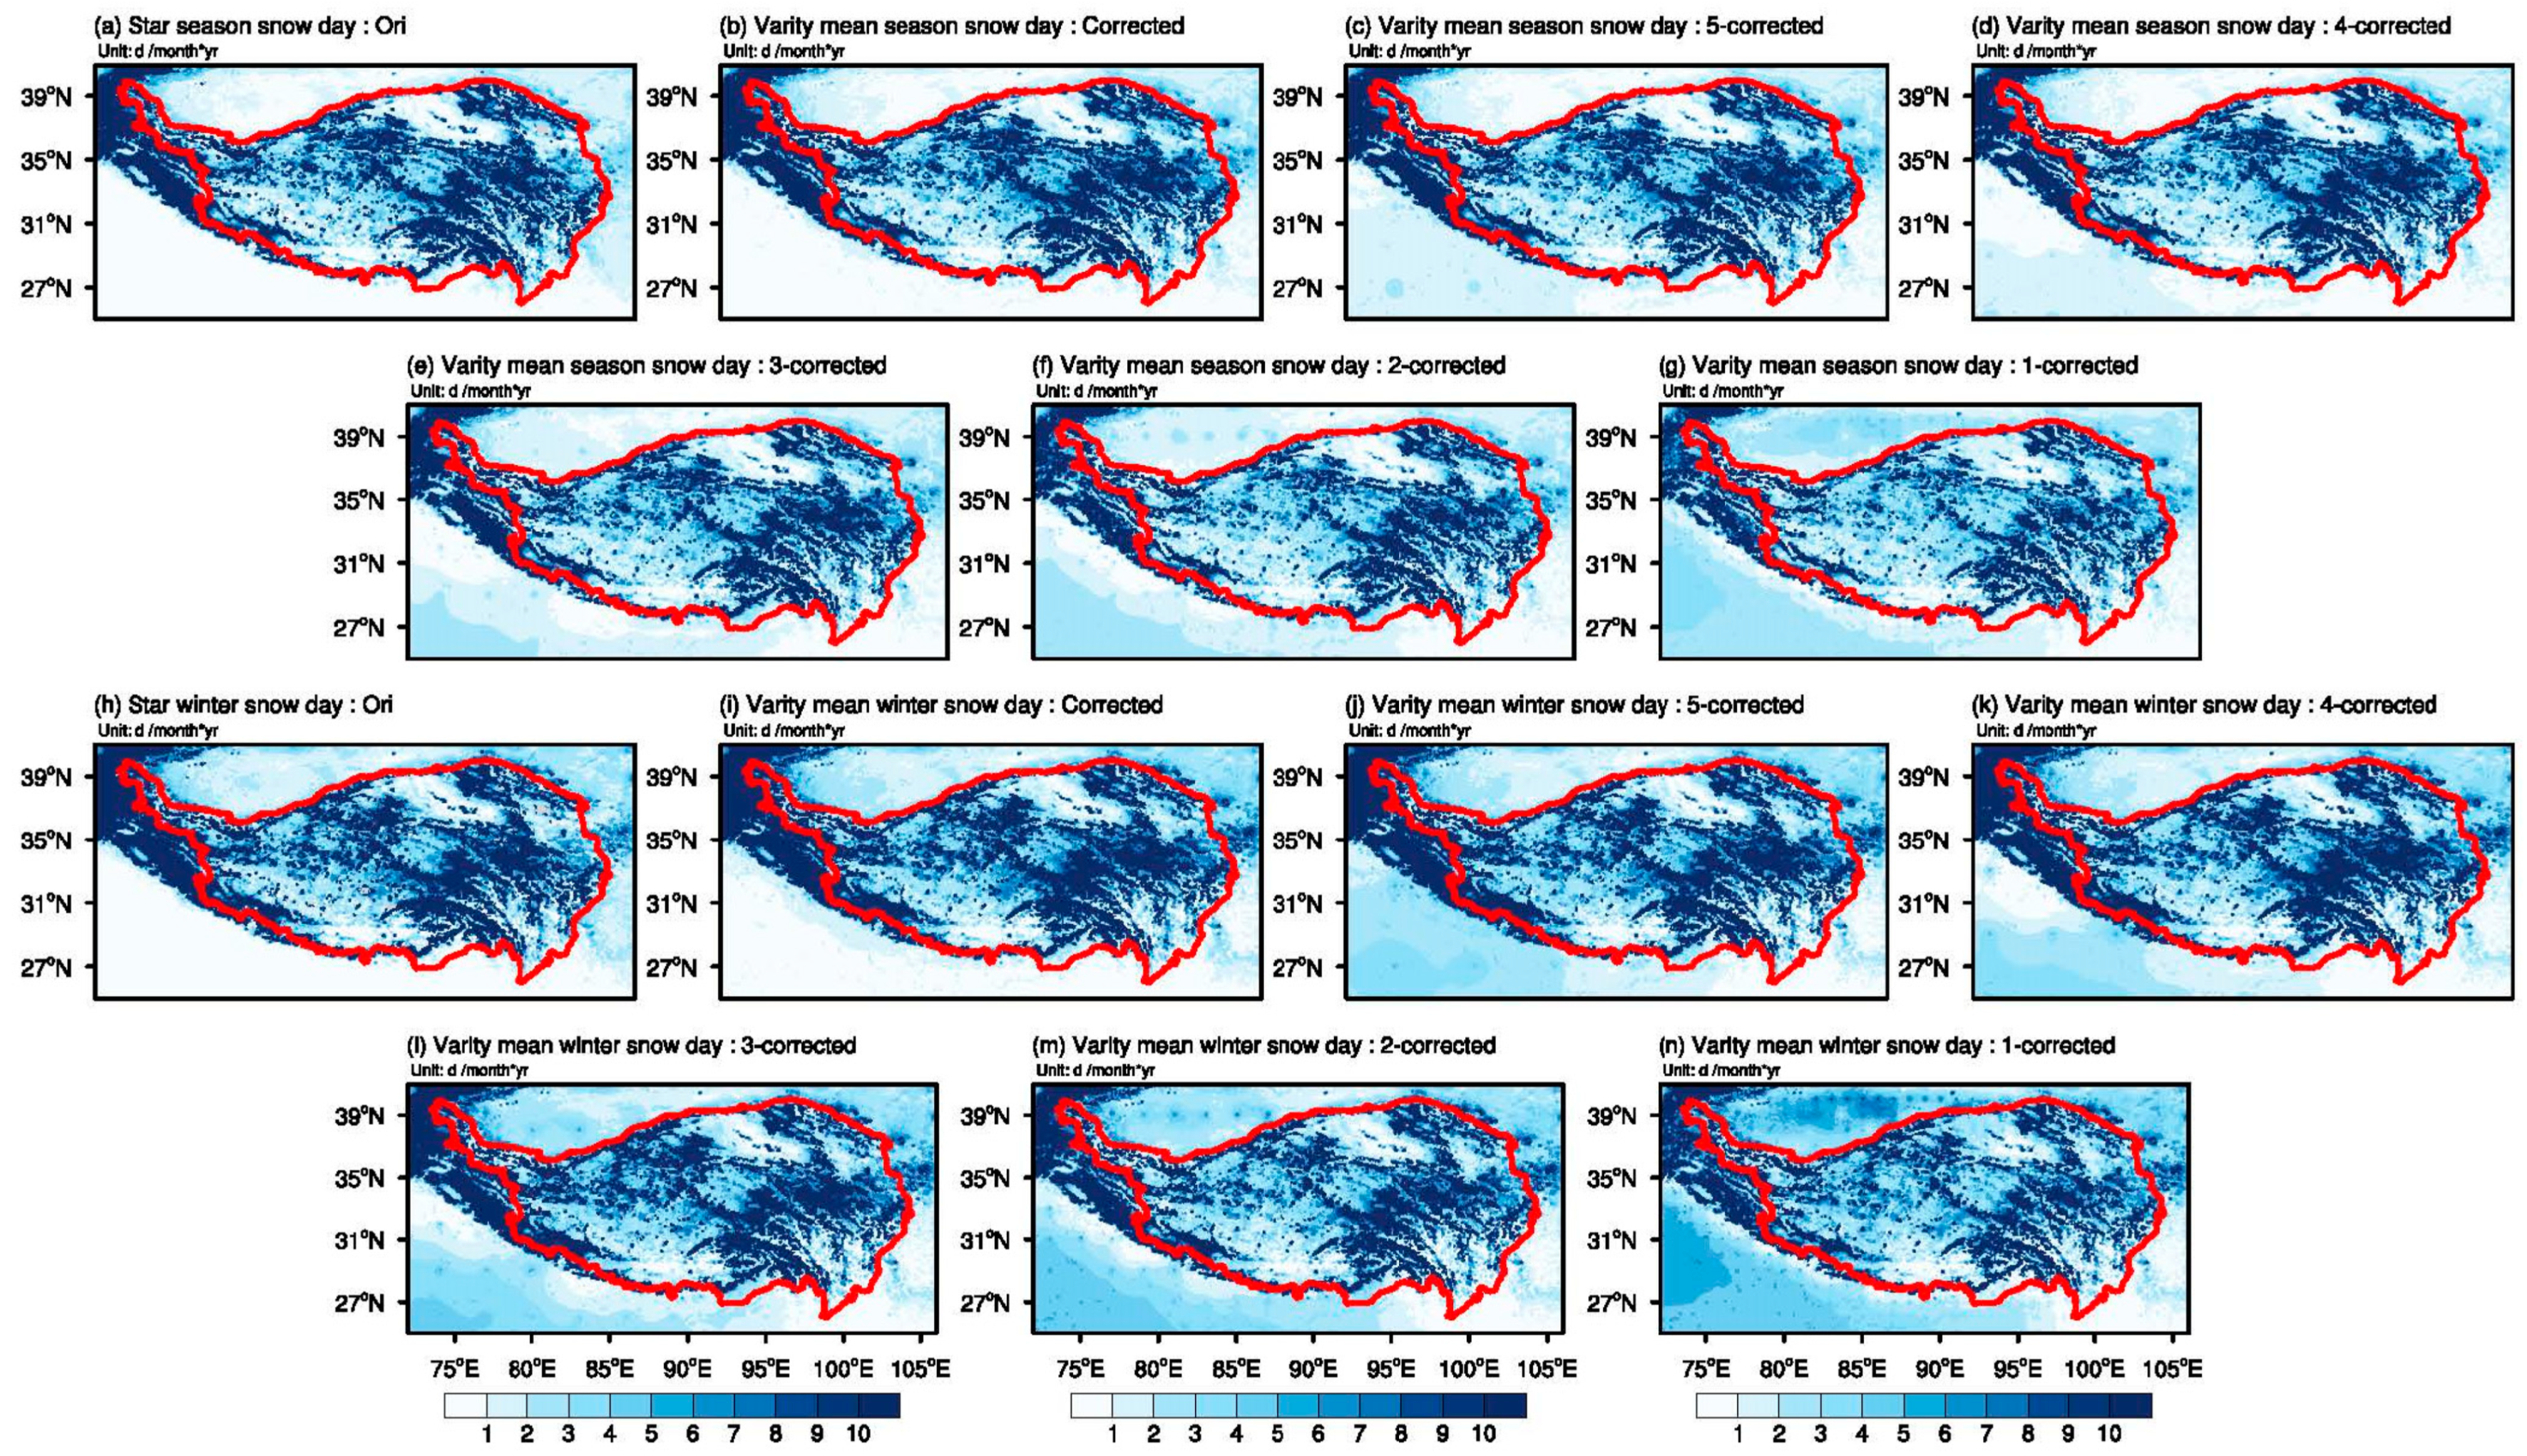
Figure 2 illustrates the distribution of average monthly snow cover days during the snow season and winter on the Qinghai–Tibet Plateau after the optimization of interpolation and the variational processing method. As the interpolation resolution increases, the high-value areas along the northeastern, eastern, southeastern, and northwestern edges of the plateau exhibit a noticeable decrease in magnitude and a reduction in extent. Moreover, as the interpolation resolution further increases, the weakening and shrinking trends become more pronounced.
Figure 2.
The distribution of the monthly snow cover days for the snow season and winter from 1989 to 2020 after the interpolation and variational processing method. (
a) represents Ori in the snow season, (
b) represents Corrected in the snow season, (
c) represents 5°-corrected in the snow season, (
d) represents 4°-corrected in the snow season, (
e) represents 3°-corrected in the snow season, (
f) represents 2°-corrected in the snow season, (
g) represents 1°-corrected in the snow season, and (
h–
n) are similar to (
a–
g), but represent winter. The areas within the red curves indicate the Qinghai–Tibet Plateau region. In order to determine the optimized variational processing method, an elimination method is employed. Firstly, the three stations with the highest RMSEs, which are 55,593 (30.85°N, 91.73°E), 56,147 (31.22°N, 99.83°E), and 52,842 (36.78°N, 99.08°E) in the three regions (denoted by red boxes), respectively, are eliminated, excluded from the interpolation and variational correction process. Their snow cover days are used as the target for comparison between the original satellite snow cover product, the variationally corrected satellite snow cover product, and the optimized satellite snow cover product obtained through variational correction after interpolation at different resolutions. The results are shown in
Figure 3.
![Remotesensing 16 01427 g002]()
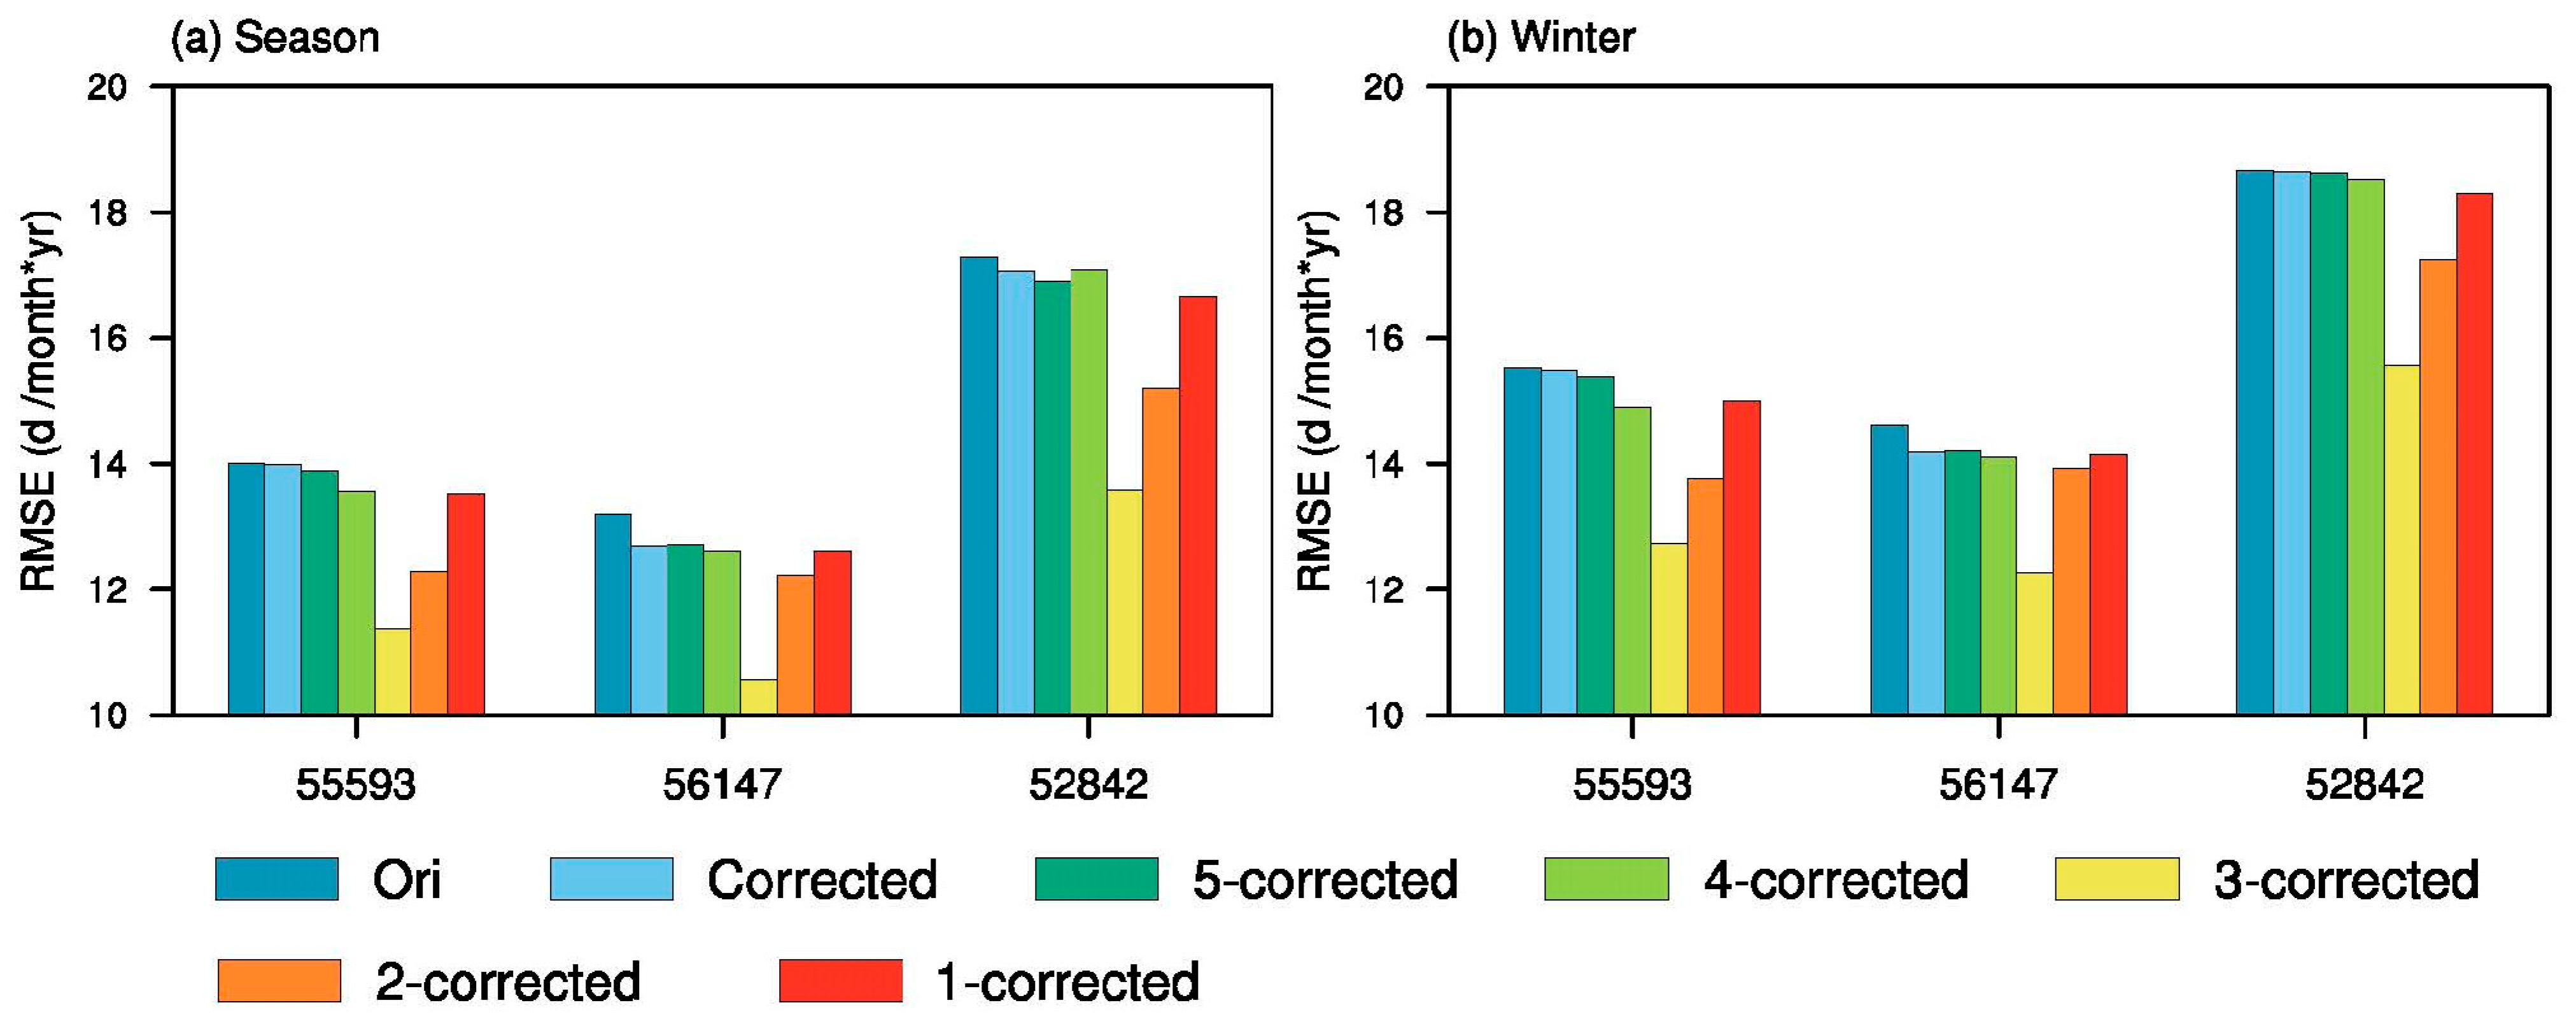
Comparing different correction methods, the variationally corrected snow cover day products all show smaller RMSEs compared to the original satellite snow product. This indicates that the variational processing method can obtain results closer to the true values. Overall, the interpolation at a 3° resolution has the smallest RMSE.
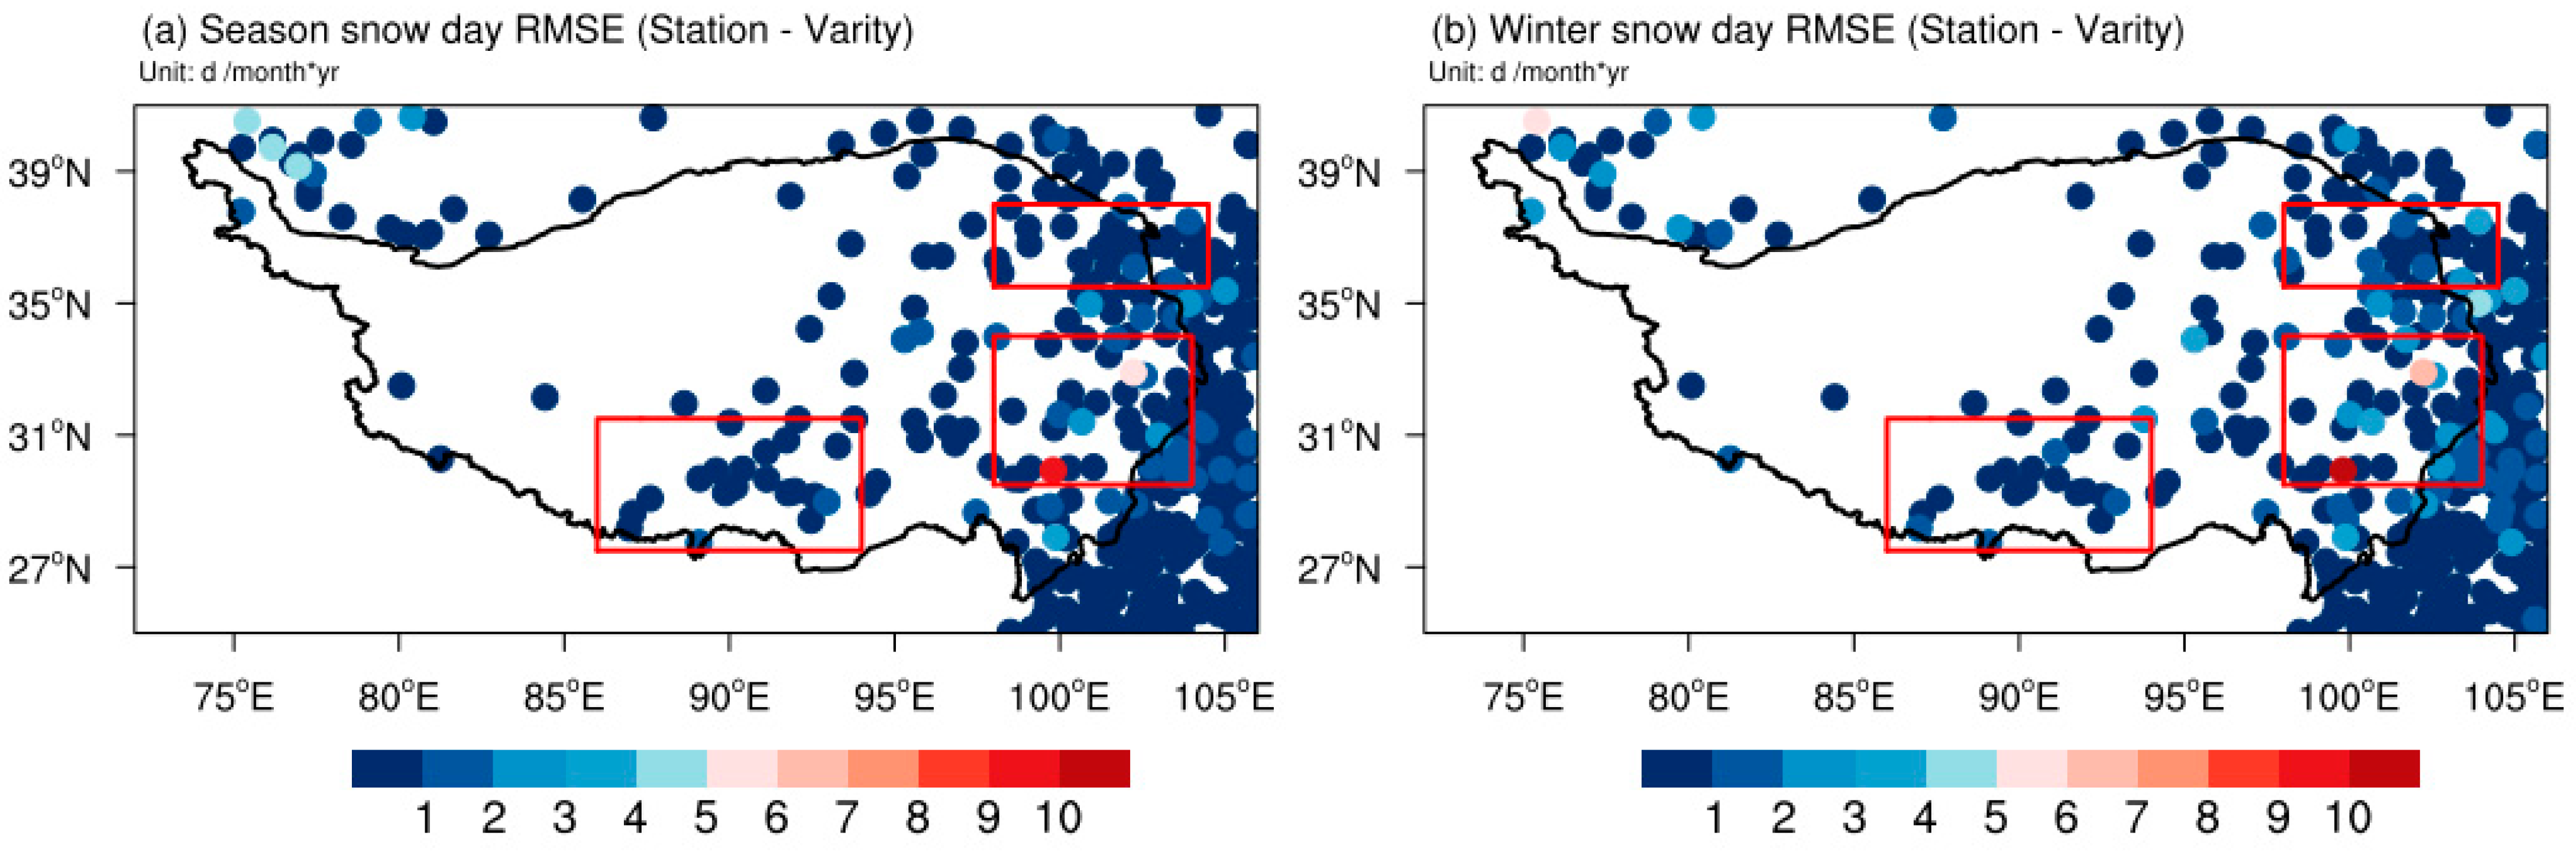
Figure 4 shows the distribution of RMSEs between the satellite snow data after the optimized variational processing method for interpolated and station data at a 3° resolution. It can be seen that for most parts of the Qinghai–Tibet Plateau, the RMSE is below 1 d/(month*yr), indicating that the satellite data after the optimized variational processing method are closer to the station data. The RMSE significantly decreases after variational processing compared to before (as shown in
Figure 1), especially in regions where the error was initially larger.
In conclusion, by combining station snow cover day data with satellite snow day products and analyzing the results of five different optimization interpolation variational calculations, it is evident that the optimized variationally corrected satellite snow day product after interpolation at a 3° resolution is closer to the true values. Therefore, the 3° interpolation variational processing method, which produced the best results, is selected as the optimized variational processing method.
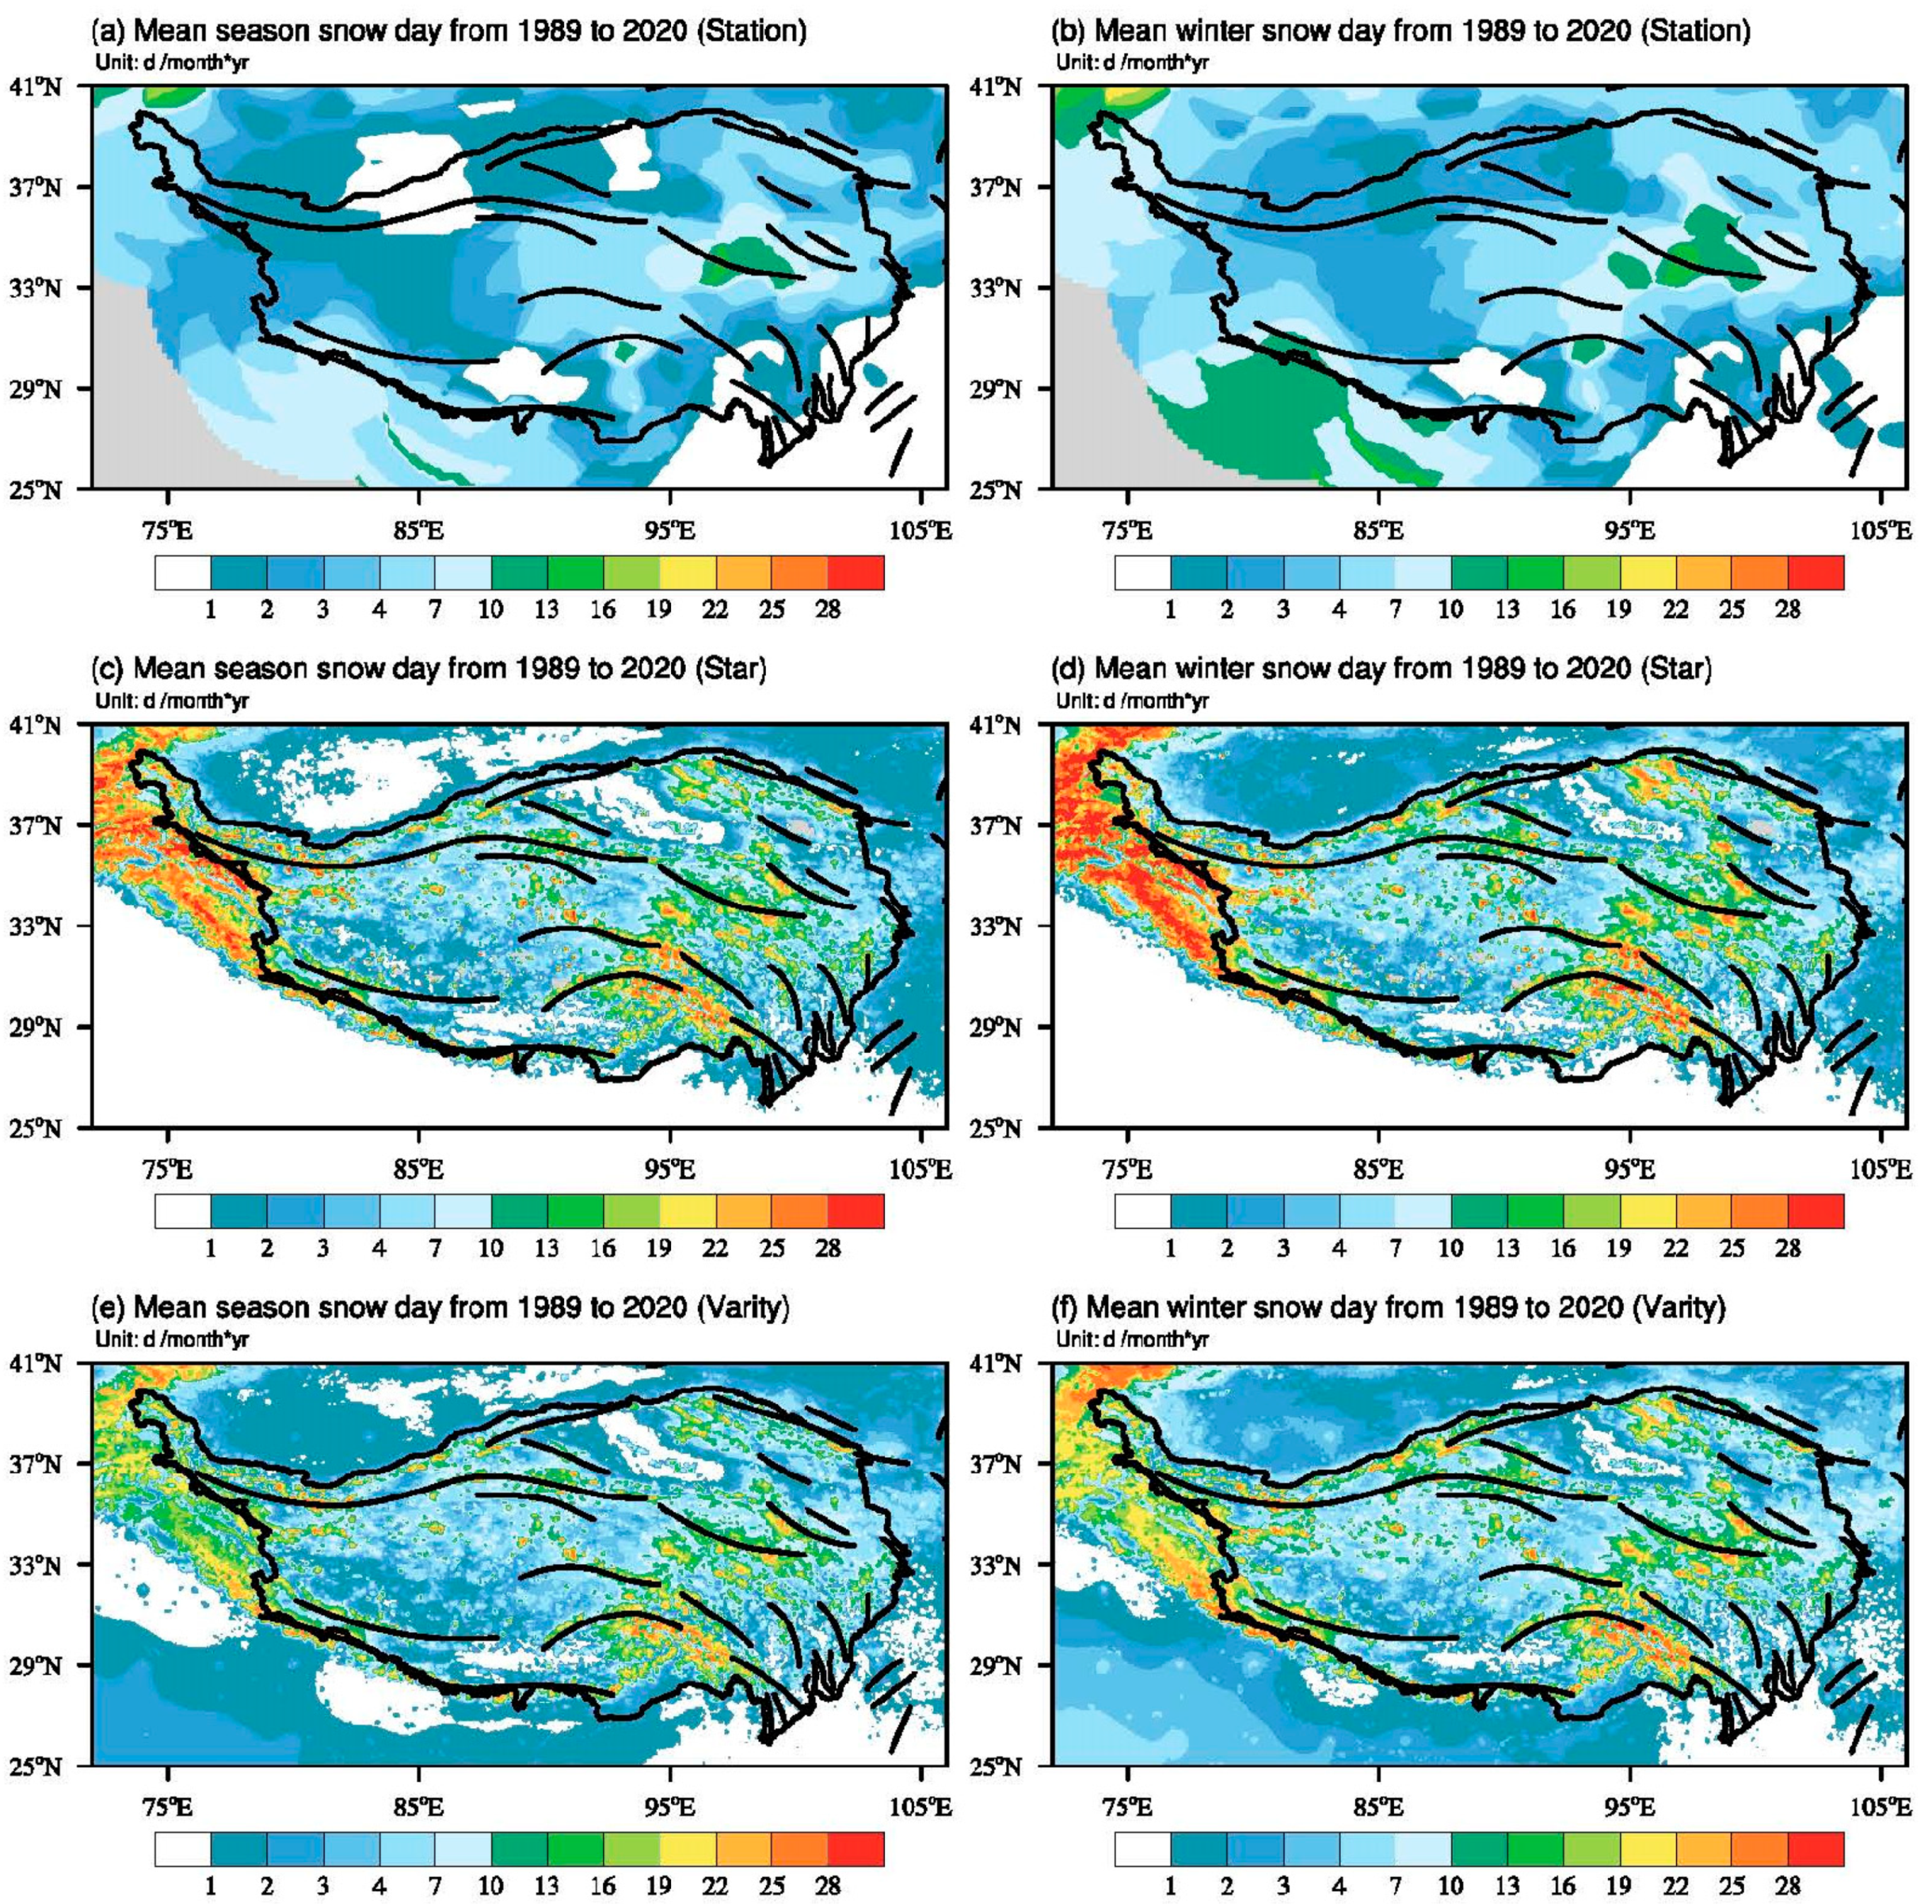
3.2. Comparative Analysis of the Spatial Distribution Characteristics of Snow Cover Days on the Qinghai–Tibet Plateau
The distribution of monthly average snow cover days during the snow season and winter on the Qinghai–Tibet Plateau from 1989 to 2020, station data, satellite data, and corrected satellite snow cover data, determined using the optimized variational processing method, is shown in
Figure 5. Overall, winter, being the season with the most concentrated snow cover, exhibits spatial distribution characteristics that are generally consistent with the snow cover days during the snow season.
The Qaidam Basin, located deep inland, has minimal moisture input, leading to extreme aridity. This area has the least snowfall on the Qinghai–Tibet Plateau and is one of the regions with the lowest snow cover days. In the hinterland of the southwestern Qinghai–Tibet Plateau, moisture from the Indian Ocean and the Bay of Bengal is blocked by high mountain ranges. And then, near the Himalayas and the Karakoram Mountains, the moisture descends, forming significant moisture convergence zones. As a result, this region receives less moisture input and experiences minimal snowfall, leading to fewer snow cover days. It is also one of the areas with low snow cover days on the Qinghai–Tibet Plateau. Similarly, downstream of the Yarlung Tsangpo River, where the Qinghai–Tibet Plateau bends southward, moisture is also obstructed by high mountains. Additionally, due to lower altitude and the influence of subsidence and the convergence of warm low-pressure systems in winter, precipitation is scarce, resulting in low snow cover days. The lower-altitude dry and warm river valleys on the southeastern edge of the plateau are controlled by the circulation of the southern branch of westerly winds. Near the surface, dry air masses brought by the southern branch of westerly winds lead to sparse precipitation, contributing to low snow cover days. These regions with low snow cover days are reflected in the distribution of snow cover days from the station data, satellite data, and data after optimized variational processing, showing relatively minor differences among them (
Figure 5).
The maintenance of snow cover is closely related to altitude. On one hand, when air currents encounter windward slopes in mountainous areas, they are forced to rise, causing the moisture in the air to condense and form snowfall. On the other hand, higher-altitude regions generally have lower temperatures, which helps slow down the melting of snow. Due to early snowfall onset and late snowmelt, or even year-round snow cover, high-altitude mountainous areas are influenced by warm–humid air currents and monsoons, resulting in relatively high snowfall. Therefore, these regions are considered areas with high snow cover days on the Qinghai–Tibet Plateau. For example, the Himalayas and the Nyainqentanglha Mountains affected by the warm and humid air currents from the Indian Ocean and the Bay of Bengal, as well as the Karakoram Mountains influenced by the updrafts of the westerly winds, experience abundant snowfall and have high snow cover days on the Qinghai–Tibet Plateau. These areas with high snow cover days are not prominently reflected in the distribution based on station data (
Figure 5a,b), but are clearly evident based on satellite data and the data obtained after optimized variational processing for the Qinghai–Tibet Plateau (
Figure 5c–f). Furthermore, the data obtained after optimized variational processing better approximate the station data (
Figure 1b,c and
Figure 4), indicating that this method provides a more accurate representation of the actual snow day characteristics on the Qinghai–Tibet Plateau.
Analyzing the high-resolution and objective snow cover day dataset obtained after optimized variational processing, it can be observed that the annual average number of snow cover days in the snow season on the Qinghai–Tibet Plateau is 45.51 d, while the annual average number of snow cover days in winter is 22.74 d. The spatial distribution of snow cover days on the plateau is extremely uneven, with significant differences in the magnitude of high- and low-value areas.
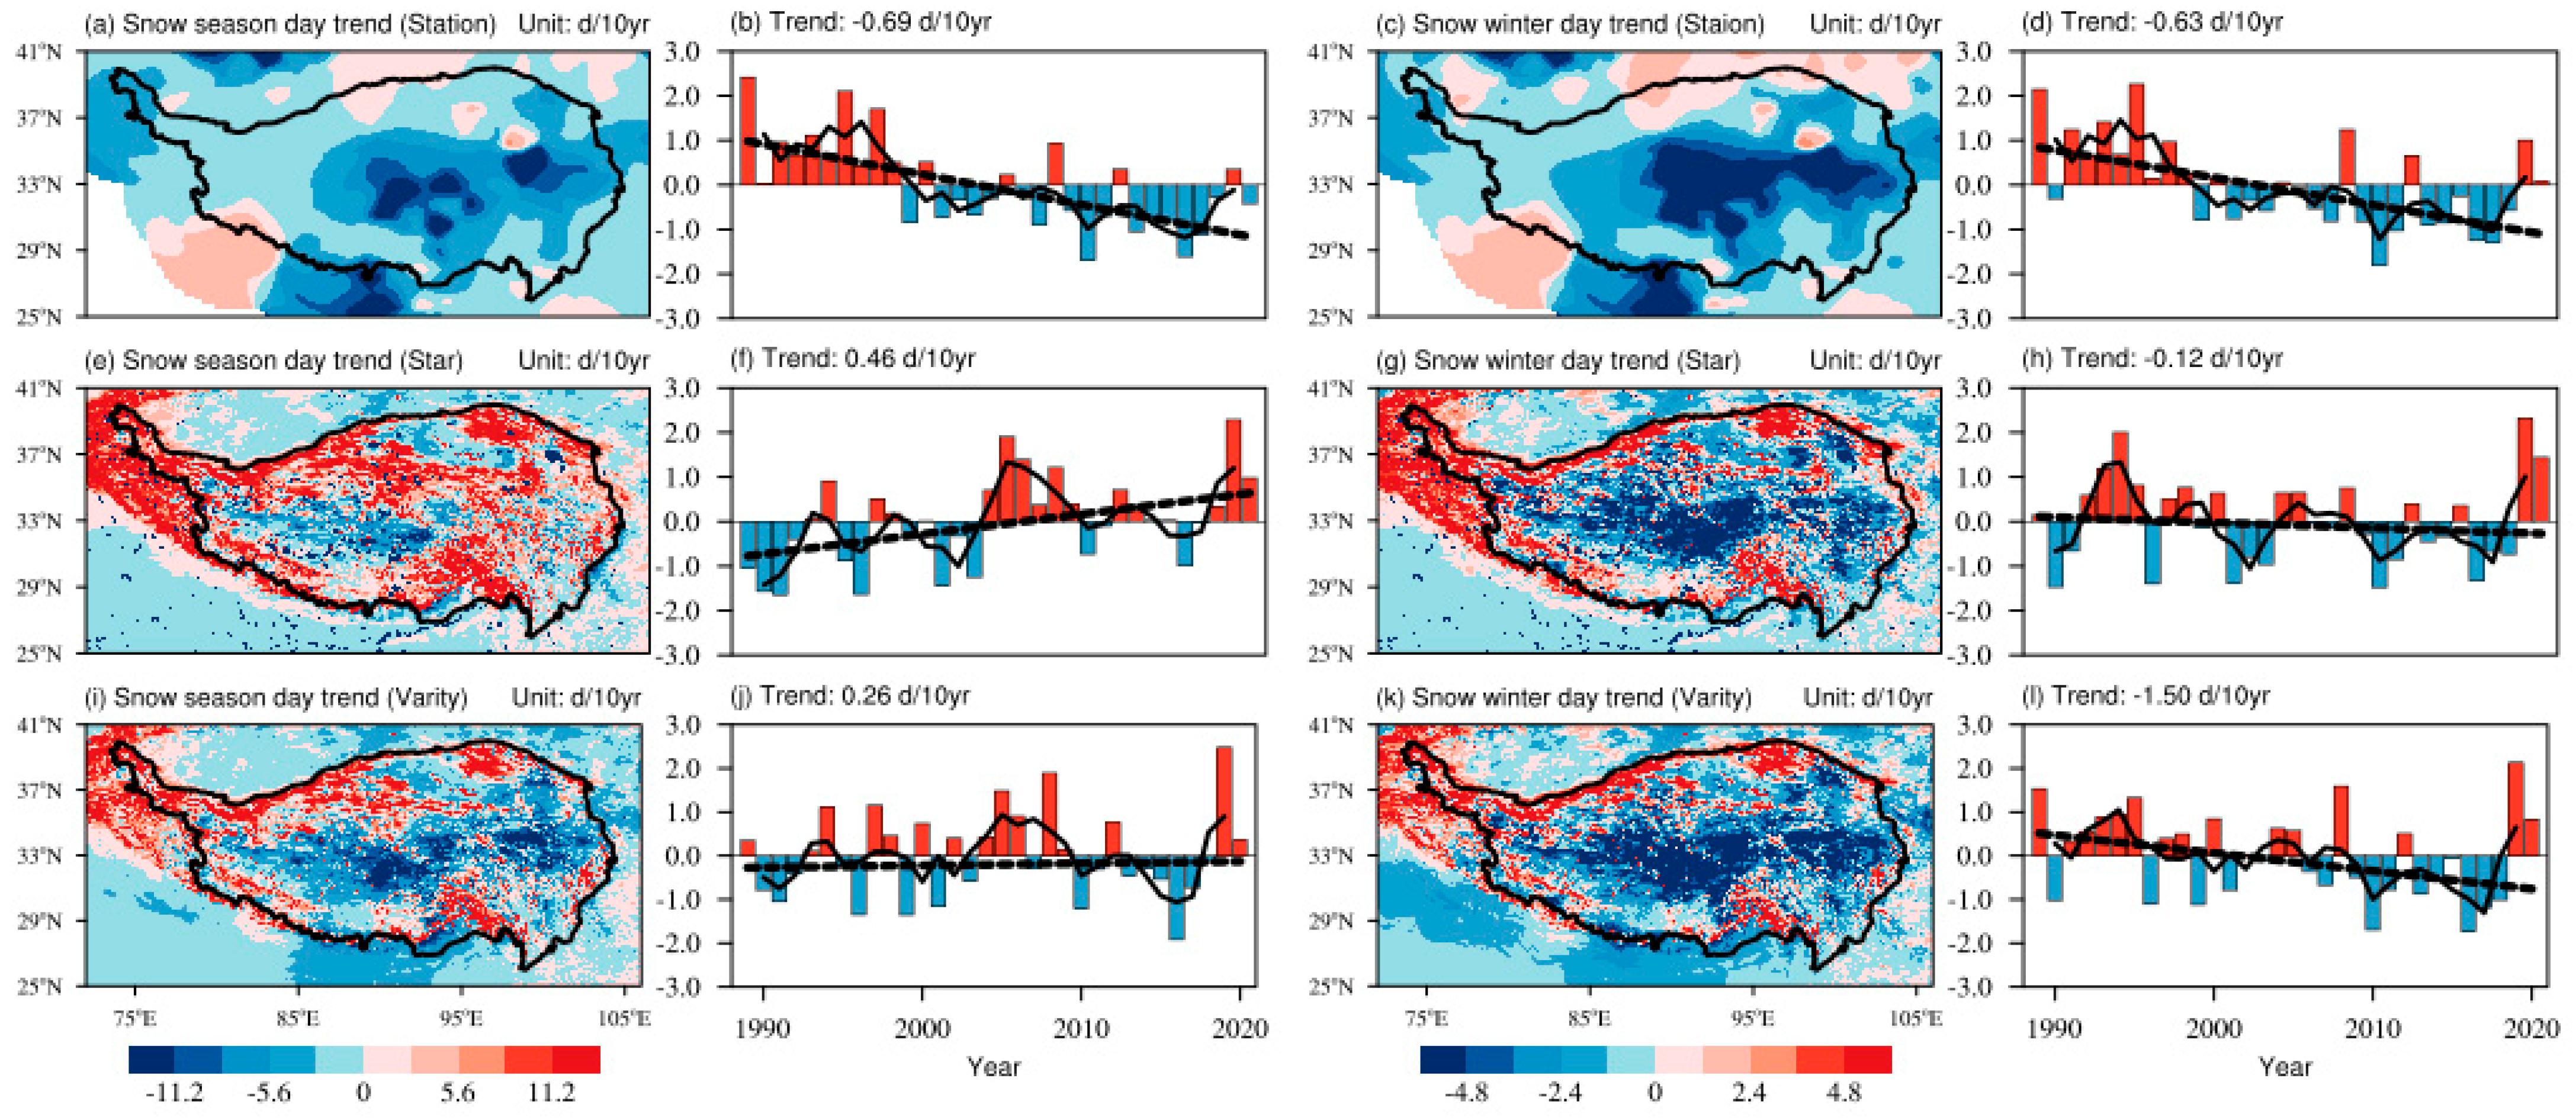
3.3. Comparative Analysis of the Trends of Snow Cover Days on the Qinghai–Tibet Plateau
The trends of snow cover days for the snow season and winter on the Qinghai–Tibet Plateau from 1989 to 2020, obtained from station observations, satellite data, and the data obtained after optimized variational processing, are shown in
Figure 6. Overall, the trends of snow cover days in snow season and winter on the Qinghai–Tibet Plateau predominantly exhibit decreases based on station data, with significant decreases in the central region and increasing trends in the northern and southwestern peripheral areas (
Figure 6a,c). The trends of snow cover days on the Qinghai–Tibet Plateau obtained from satellite data show primarily increasing trends in the snow season, while the trends in winter are split between increasing and decreasing trends, roughly equally (
Figure 6e,g). These trends are clearly inconsistent with the general background of a warming climate on the Qinghai–Tibet Plateau. A comparison with previous research conclusions on the trend of snow cover days on the Qinghai–Tibet Plateau is presented in
Table 1.
Several studies have examined the trends in snow cover days on the Qinghai–Tibet Plateau. Chu et al. [
35] found a significant decreasing trend in snow cover days over the past 30 years, with a decrease of −4.81 d/10 yr throughout the year and −2.36 d/10 yr in winter. Except for some stations in the northern Qaidam Basin and its surrounding areas, where snow cover days show an insignificant increase, 91.5% of the stations on the plateau exhibit a decreasing trend. Jiang et al. [
36] suggest a decreasing trend in snow cover days on the plateau, with a rate of −0.64 d/10 yr, but their results not pass the significance test, and there are significant differences among stations. Huang et al. [
6] indicate a significant decreasing trend in snow cover days on the Qinghai–Tibet Plateau, with a rate of −0.47 d/10 yr, and there are substantial spatial variations. Xu et al. [
37] consider that the trends in snow cover days on the Qinghai–Tibet Plateau during 1961–2020 are not significant in annually or in winter, and there are spatial differences. The majority of studies suggest decreasing trends or non-significant trends in snow cover days on the Qinghai–Tibet Plateau, which is contrary to the increasing trend observed in satellite data during the snow season (
Figure 6f). This once again highlights the uncertainty of satellite data and emphasizes the need to use the variational processing method to integrate station data and obtain high-resolution and objective data.
Figure 6i,k show the trends of snow cover days on the Qinghai–Tibet Plateau from 1989 to 2020 after optimized variational processing. It can be observed that the distribution of trends in the snow season and winter is similar to the distribution based on station data (
Figure 6a,c). Considering the continuous warming on the Qinghai–Tibet Plateau in recent decades [
38,
39], while the response of snow cover days does not show a consistent decrease, the trends in snow cover days exhibit complex patterns with significant spatial variations. The central region and low-altitude areas on the Qinghai–Tibet Plateau mainly show decreasing trends, while high-altitude mountainous regions predominantly exhibit increasing trends. Overall, from 1989 to 2020, snow cover days in the snow season on the Qinghai–Tibet Plateau exhibit a non-significant increase of 0.26 d/10 yr, while in winter, they show a significant decreasing trend of −1.50 d/10 yr. Among all grid points on the Qinghai–Tibet Plateau, 76.17% of the grid points show a decreasing trend of snow cover days during the snow season, and 77.63% show a decreasing trend in winter. The snow cover day data after optimized variational processing, which combine station observations and satellite data, not only preserve the characteristics of snow variability at the station, but also provide a more accurate and objective representation of the changes in snow cover days on the Qinghai–Tibet Plateau.
3.4. Comparative Analysis of the Impacts of Temperature and Precipitation on Snow Cover Days on the Qinghai–Tibet Plateau
Previous studies have shown that the temperature increase on the Qinghai–Tibet Plateau is one of the important factors driving early snowmelt, leading to a reduction in snow cover days [
6,
40,
41]. Additionally, black carbon particles adhering to the surface of snow reduce the snow surface’s albedo and enhance the absorption of shortwave radiation reaching the surface, thus promoting snowmelt. This is also an important factor contributing to the decrease in snow cover on the Qinghai–Tibet Plateau [
42]. The different variations in snow cover days in various regions of the Qinghai–Tibet Plateau may be influenced by the regional heterogeneity of temperature and precipitation [
43]. Wang et al. [
44] found significant differences in the impact of temperature and precipitation on different ecological zones of the plateau, with distinct spatial distribution patterns and trends regarding the start and end dates of snow cover. Some studies have indicated that although climate warming can lead to a decrease in snow cover days in most areas of the Qinghai–Tibet Plateau, the increase in snow cover days in the Karakoram and Himalayas regions is due to increased precipitation in the snowmelt period and annually, causing a delay in the end date of snow cover [
45]. The changes in snow cover days on the Qinghai–Tibet Plateau are significantly influenced by temperature and precipitation.
However, due to the limited number of stations on the Qinghai–Tibet Plateau and the relatively short time span of satellite-derived temperature and precipitation data, as well as the poor quality of reanalysis data in the plateau region. It has been proven that ERA5 reanalysis data have better applicability on the Qinghai–Tibet Plateau compared to other climate reanalysis data [
46,
47,
48]. This study integrates station temperature and precipitation data with two reanalysis datasets (ERA5 monthly averaged data on single levels and ERA5-Land monthly averaged data) using the variational processing method to obtain high-resolution and high-quality temperature and precipitation data for the Qinghai–Tibet Plateau from 1989 to 2020. Based on these data, this study explores the impact of temperature and precipitation on snow cover days on the Qinghai–Tibet Plateau.
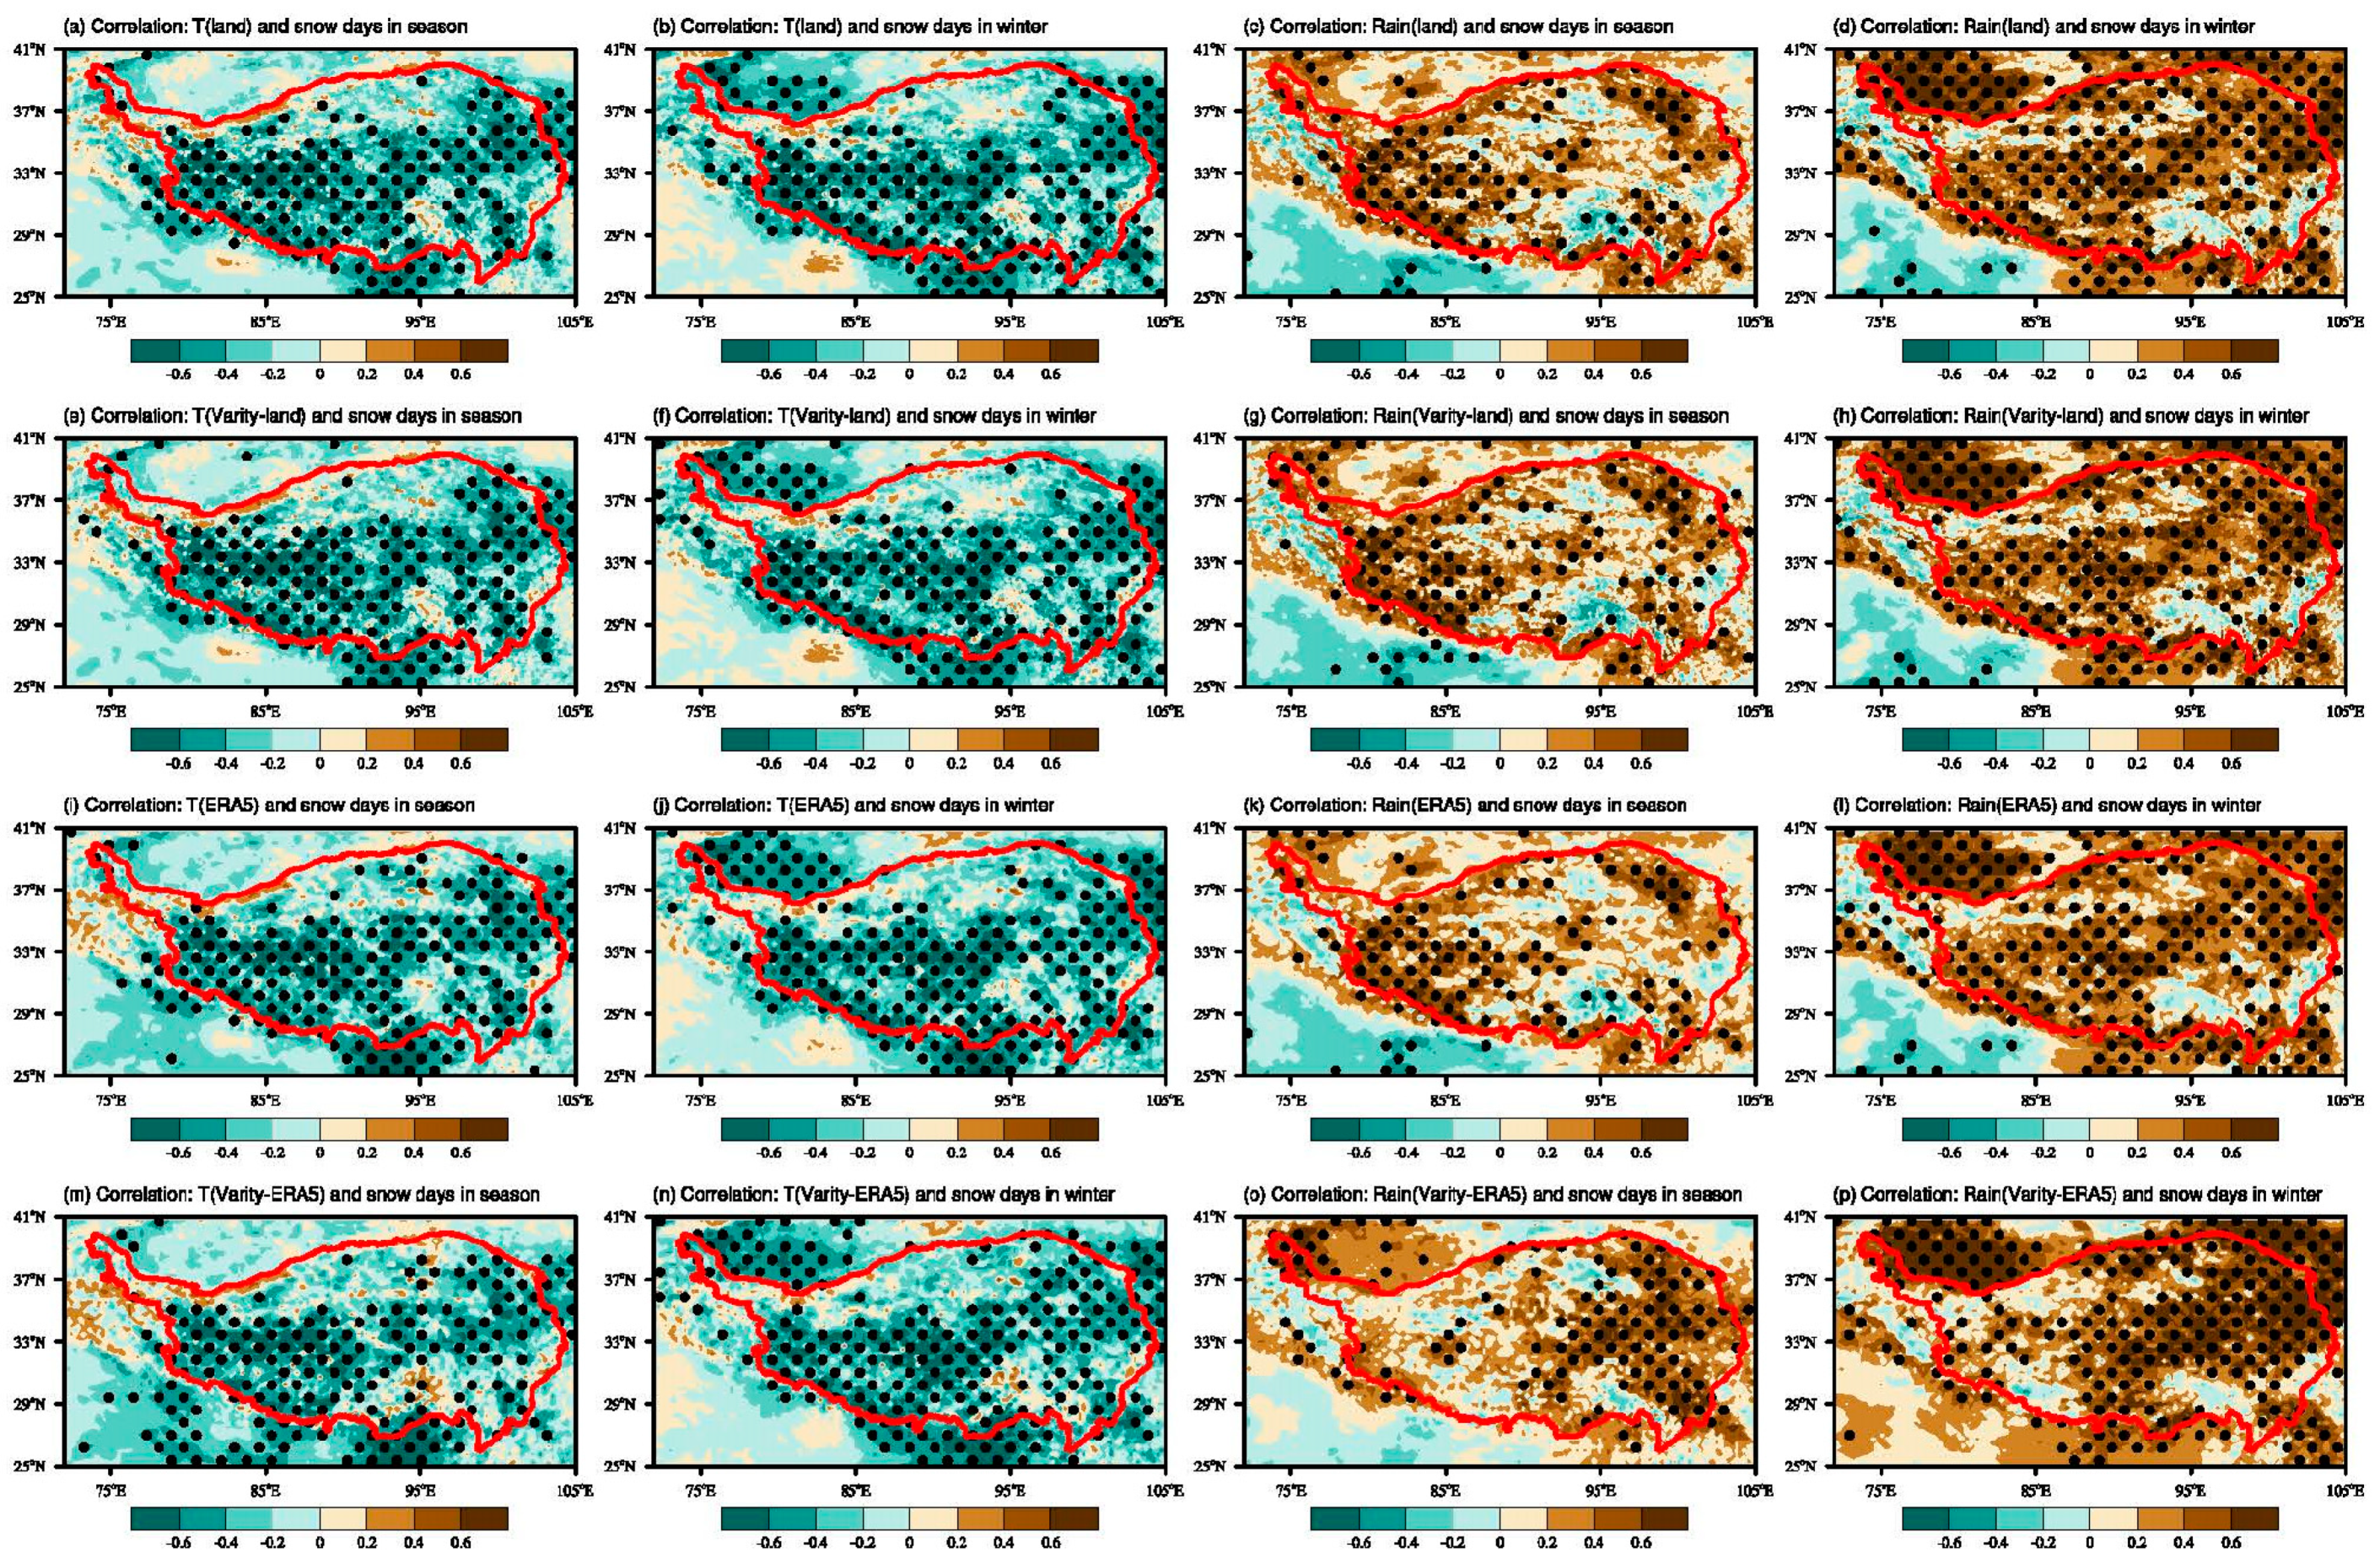
Figure 7 shows the correlation distribution between snow cover days and temperature/precipitation during the snow season and winter from 1989 to 2020. Overall, regardless of the snow season or winter, there is a significant negative correlation between snow cover days and temperature on the Qinghai–Tibet Plateau before and after variational processing, and the correlation is better in the western part of the plateau than in the eastern part. While a clear positive correlation is observed between snow cover days and precipitation, the negative correlation is more significant in winter than in the snow season. The difference in the correlation of the ERA5-Land temperature and precipitation reanalysis data with snow cover days before and after variational processing is not significant (
Figure 7a–h), while the difference in the correlation of the ERA5 precipitation reanalysis data with snow cover days before and after variational processing is significant (
Figure 7k,l,o,p). After variational processing, the correlation between ERA5 precipitation reanalysis data and snow cover days strengthens in the east and weakens in the west of the Qinghai–Tibet Plateau.
For both ERA5-Land or ERA5 temperature reanalysis data, the correlations with snow cover days in the snow season and winter are similar before and after variational processing, proving that the ERA5 reanalysis data have better applicability to the Qinghai–Tibet Plateau compared to other climate reanalysis data [
46,
47,
48]. The correlations between the ERA5-land precipitation reanalysis data and snow cover days in the snow season and winter are similar before and after variational processing, while they are significantly different for the ERA5 precipitation reanalysis data. This may be because ERA5-Land is a reanalysis dataset providing a consistent view of the evolution of land variables over several decades at an enhanced resolution compared to ERA5. ERA5-Land has been produced by replaying the land component of the ECMWF ERA5 climate reanalysis. Reanalysis combines model data with observations from across the world into a globally complete and consistent dataset using the laws of physics. Reanalysis produces data that go several decades back in time, providing an accurate description of the climate of the past. The ERA5-land reanalysis dataset combines observation data, so it is similar before and after variational processing. Liu et al. [
49] point out that the snow cover in the west of the Qinghai–Tibet Plateau is primarily attributed to rising temperature and in the east is closely linked to enhanced precipitation, which conforms to the result of the ERA5 reanalysis data after variational processing. The aim of this study is not to compare which is better between theERA5-Land and ERA5 reanalysis data after variational processing, but this is worth researching in the future.
In the western region, especially the southwestern region, of the Qinghai–Tibet Plateau, there is a strong correlation between snow cover days and temperature both in the snow season and winter, while in the eastern region, especially northeastern region, the correlation is stronger with precipitation. This further illustrates that the inconsistency in the variation in snow cover days on the Qinghai–Tibet Plateau is the result of the synergistic effects of temperature and precipitation. Moreover, snow cover days in the western region are both influenced by temperature and precipitation in winter, and in the eastern region, they are primarily affected by precipitation.
4. Discussion
Using the optimized variational processing method, satellite data and station observation data are effectively integrated to obtain corrected high-resolution and objective snow cover day data for the Qinghai–Tibet Plateau from 1989 to 2020. Based on this, the temporal and spatial characteristics of snow cover days on the Qinghai–Tibet Plateau are analyzed and compared. It is found that regions such as the Qaidam Basin and the southwestern part of the plateau interior exhibited lower snow cover days, while high-elevation mountainous areas show higher values. This finding is consistent with the conclusions drawn by Huang et al. [
6] using cloud-free snow cover remote sensing data from 1980 to 2020, which indicated extensive snow distribution in high-elevation mountainous areas of the Amu River Basin, Indian Ocean Basin, Tarim Basin, Ganges River Basin, Nu River Basin, and Yarlung Zangbo River Basin, while the plateau interior and lower-elevation mountainous areas have lower snow cover days. Additionally, Jiang et al. [
36] uses data from 110 meteorological observation stations on the Qinghai–Tibet Plateau from 1961 to 2014 and identifies the high-value areas of snow cover days in the Bayan Har Mountains, Himalayan region, and northern Tibetan Plateau, which aligns with the findings of this study. The snow cover day data obtained using the optimized variational processing method not only present the spatial distribution characteristics of snow cover days on the Qinghai–Tibet Plateau, but are also more similar to the station observation data, which means that they are more objective than other satellite snow data.
Previous studies have shown similar distribution characteristics of snow cover days on the Qinghai–Tibet Plateau, but with some numerical differences (
Table 2). In this study, the average number of snow cover days during the snow season is 45.51 d, and in winter, is 22.74 d. These values are higher than those obtained from studies based on station data but lower than those derived solely from satellite data. The reasons for these differences are primarily related to variations in data sources, seasonal divisions, station selection, study periods, and research methods. Additionally, the different definitions of snow cover days can also have an impact. These values in this study are more similar to those of studies based on station data than satellite data, proving once again that the snow cover day data obtained using the optimized variational processing method are more objective than other satellite snow data.
The trend of snow cover days on the Qinghai–Tibet Plateau exhibits significant spatial variations, a widely acknowledged fact. However, there are considerable differences in the numerical values regarding the overall trend of snow cover days on the Qinghai–Tibet Plateau (
Table 2). These differences are also related to variations in data sources, station selection, study periods, research methods, and definitions of snow cover days. While the trends of snow cover days on the Qinghai–Tibet Plateau obtained from satellite data show primarily increasing trends in the snow season, they are clearly inconsistent with the general background of a warming climate on the Qinghai–Tibet Plateau and previous studies (
Figure 6e,f). After optimized variational processing, the trends become insignificant (
Figure 6i,j), proving once again from the trends of snow cover days on the Qinghai–Tibet Plateau that the snow cover day data obtained using the optimized variational processing method are more objective than other satellite snow data.
Despite the continued warming on the Qinghai–Tibet Plateau in recent decades [
38,
39], the response of snow cover days has not been a continuous decrease. The trend of snow cover days on the plateau is more complex, and the reasons for the increase in snow cover days in high-altitude mountain areas have not been thoroughly analyzed due to the lack of meteorological observation data in these areas. The reasons for the differences in the trend of snow cover days on the Qinghai–Tibet Plateau, as well as the potential synergistic effects of temperature and precipitation, are worthy of further in-depth research.


