

Overview and Analysis of Ground Subsidence along China’s Urban Subway Network Based on Synthetic Aperture Radar Interferometry

Abstract
:1. Introduction
2. Materials and Methods
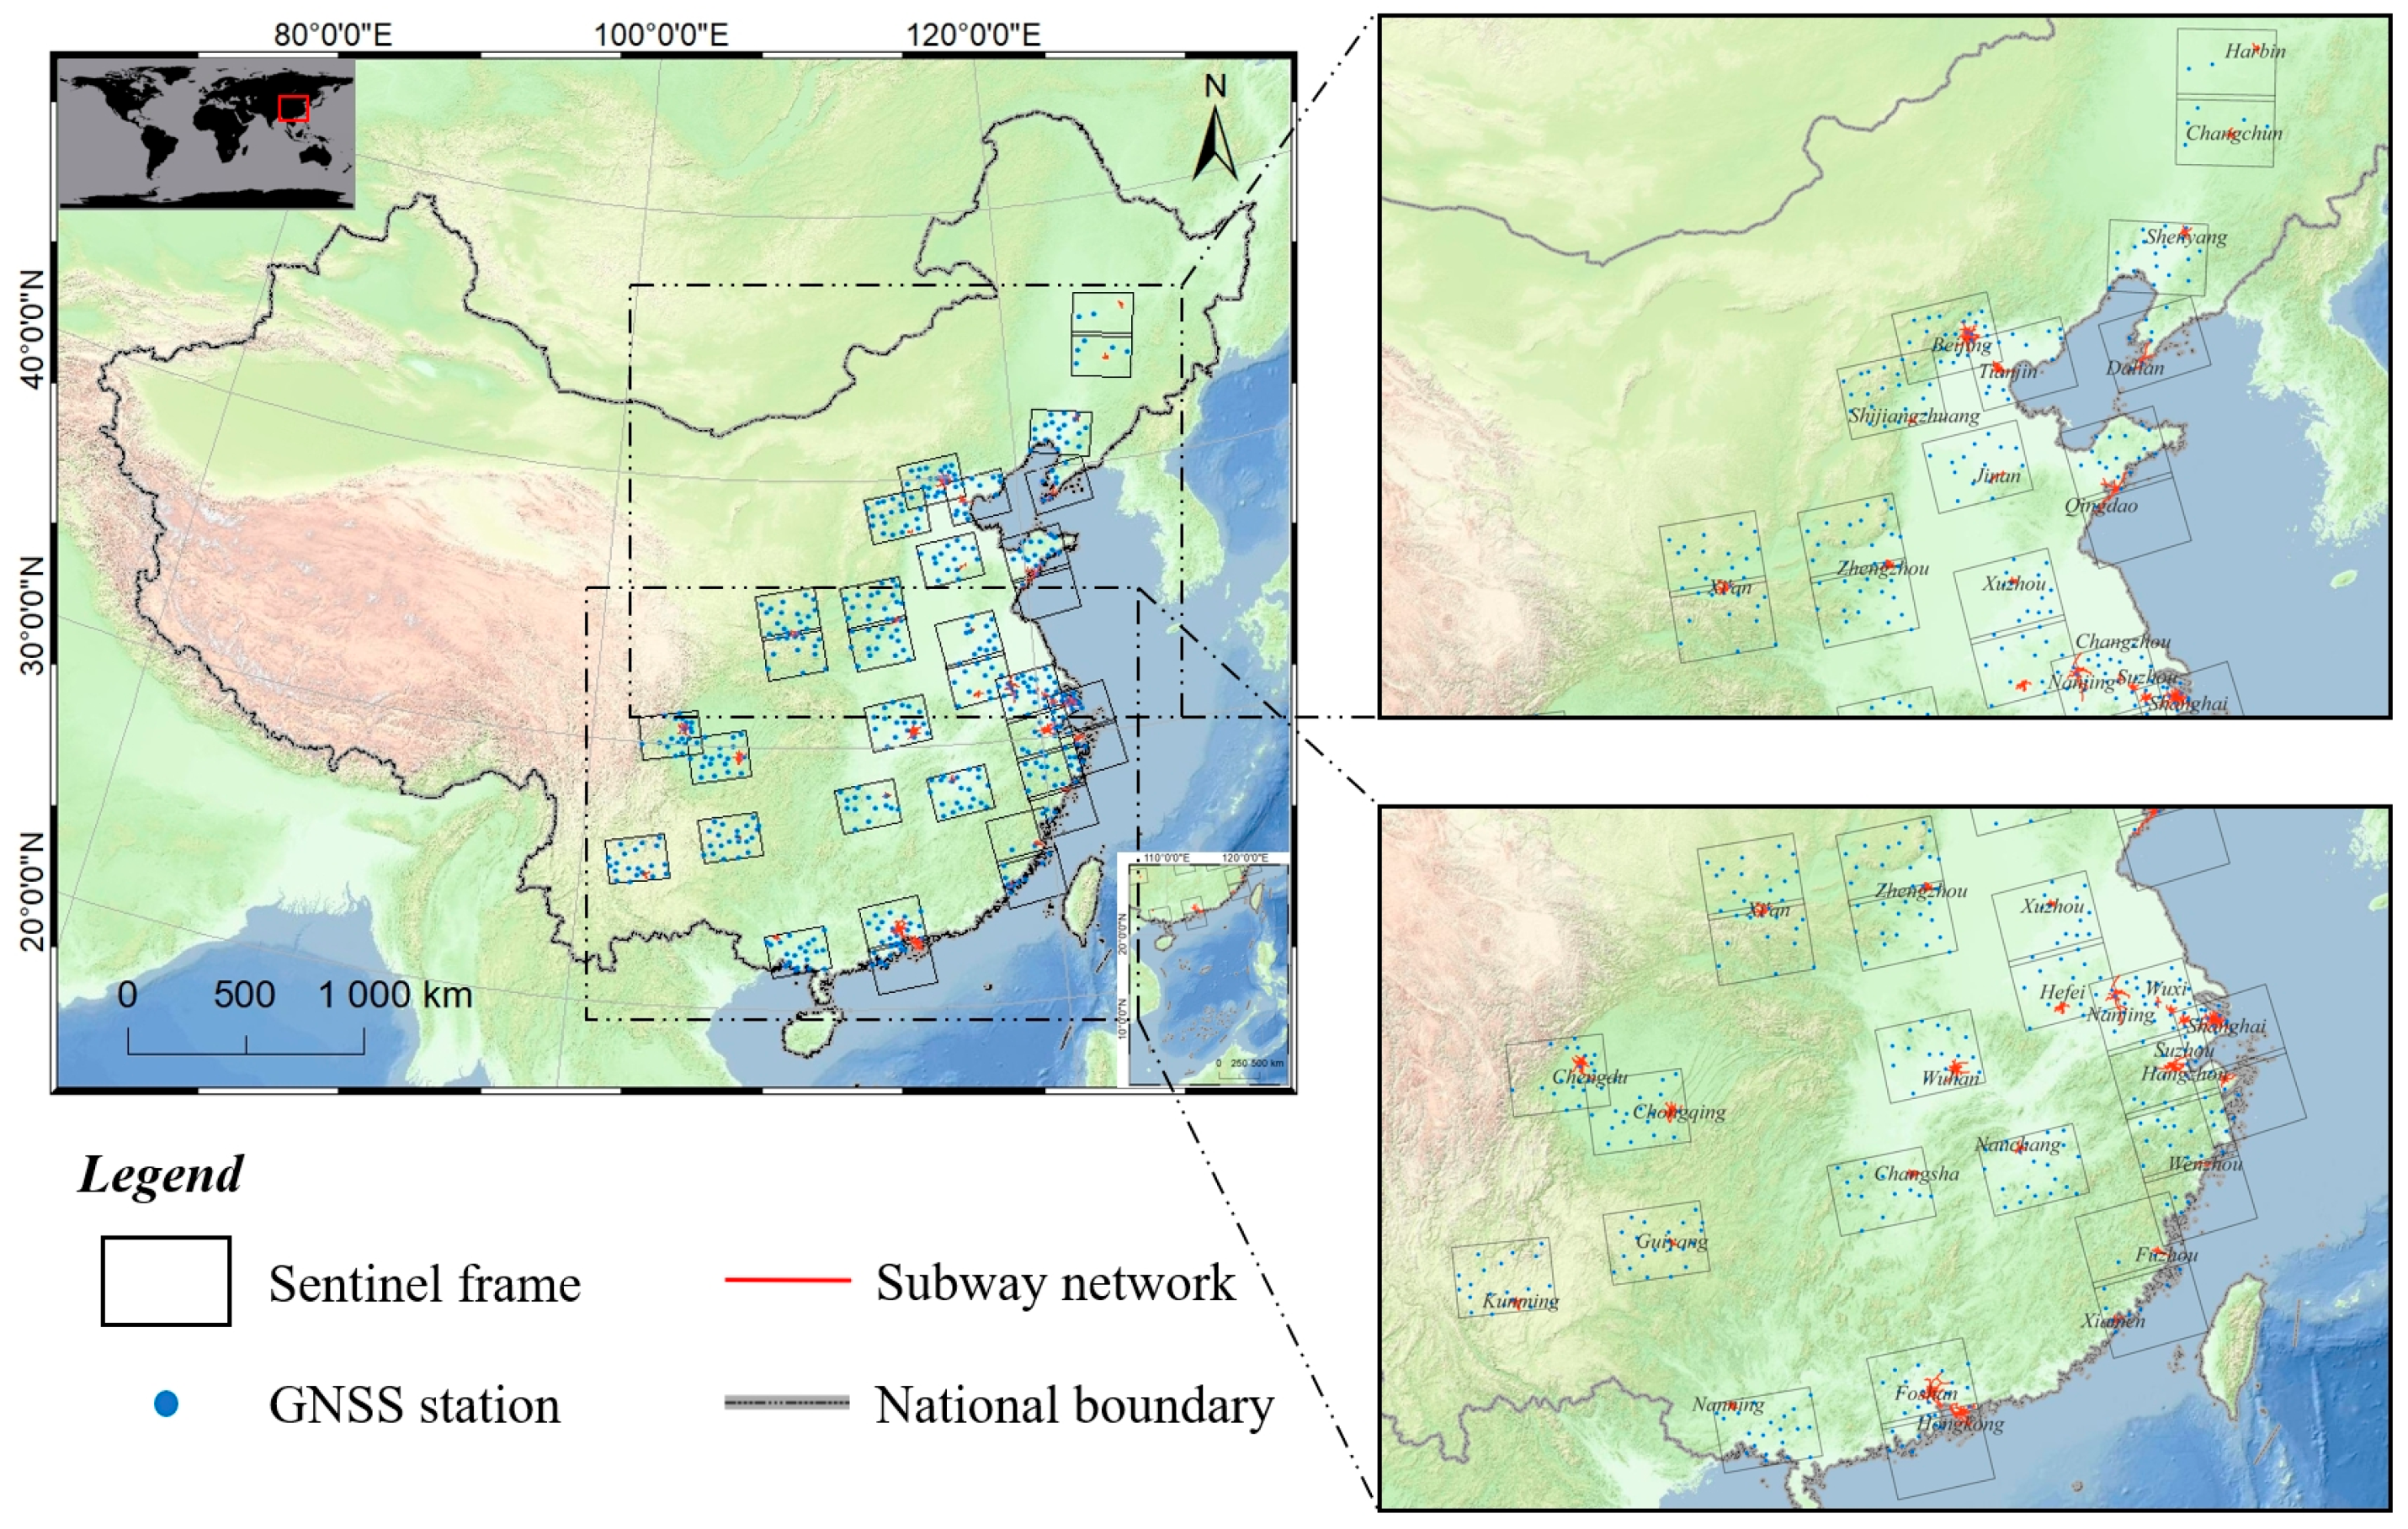
2.1. Study Area and Data
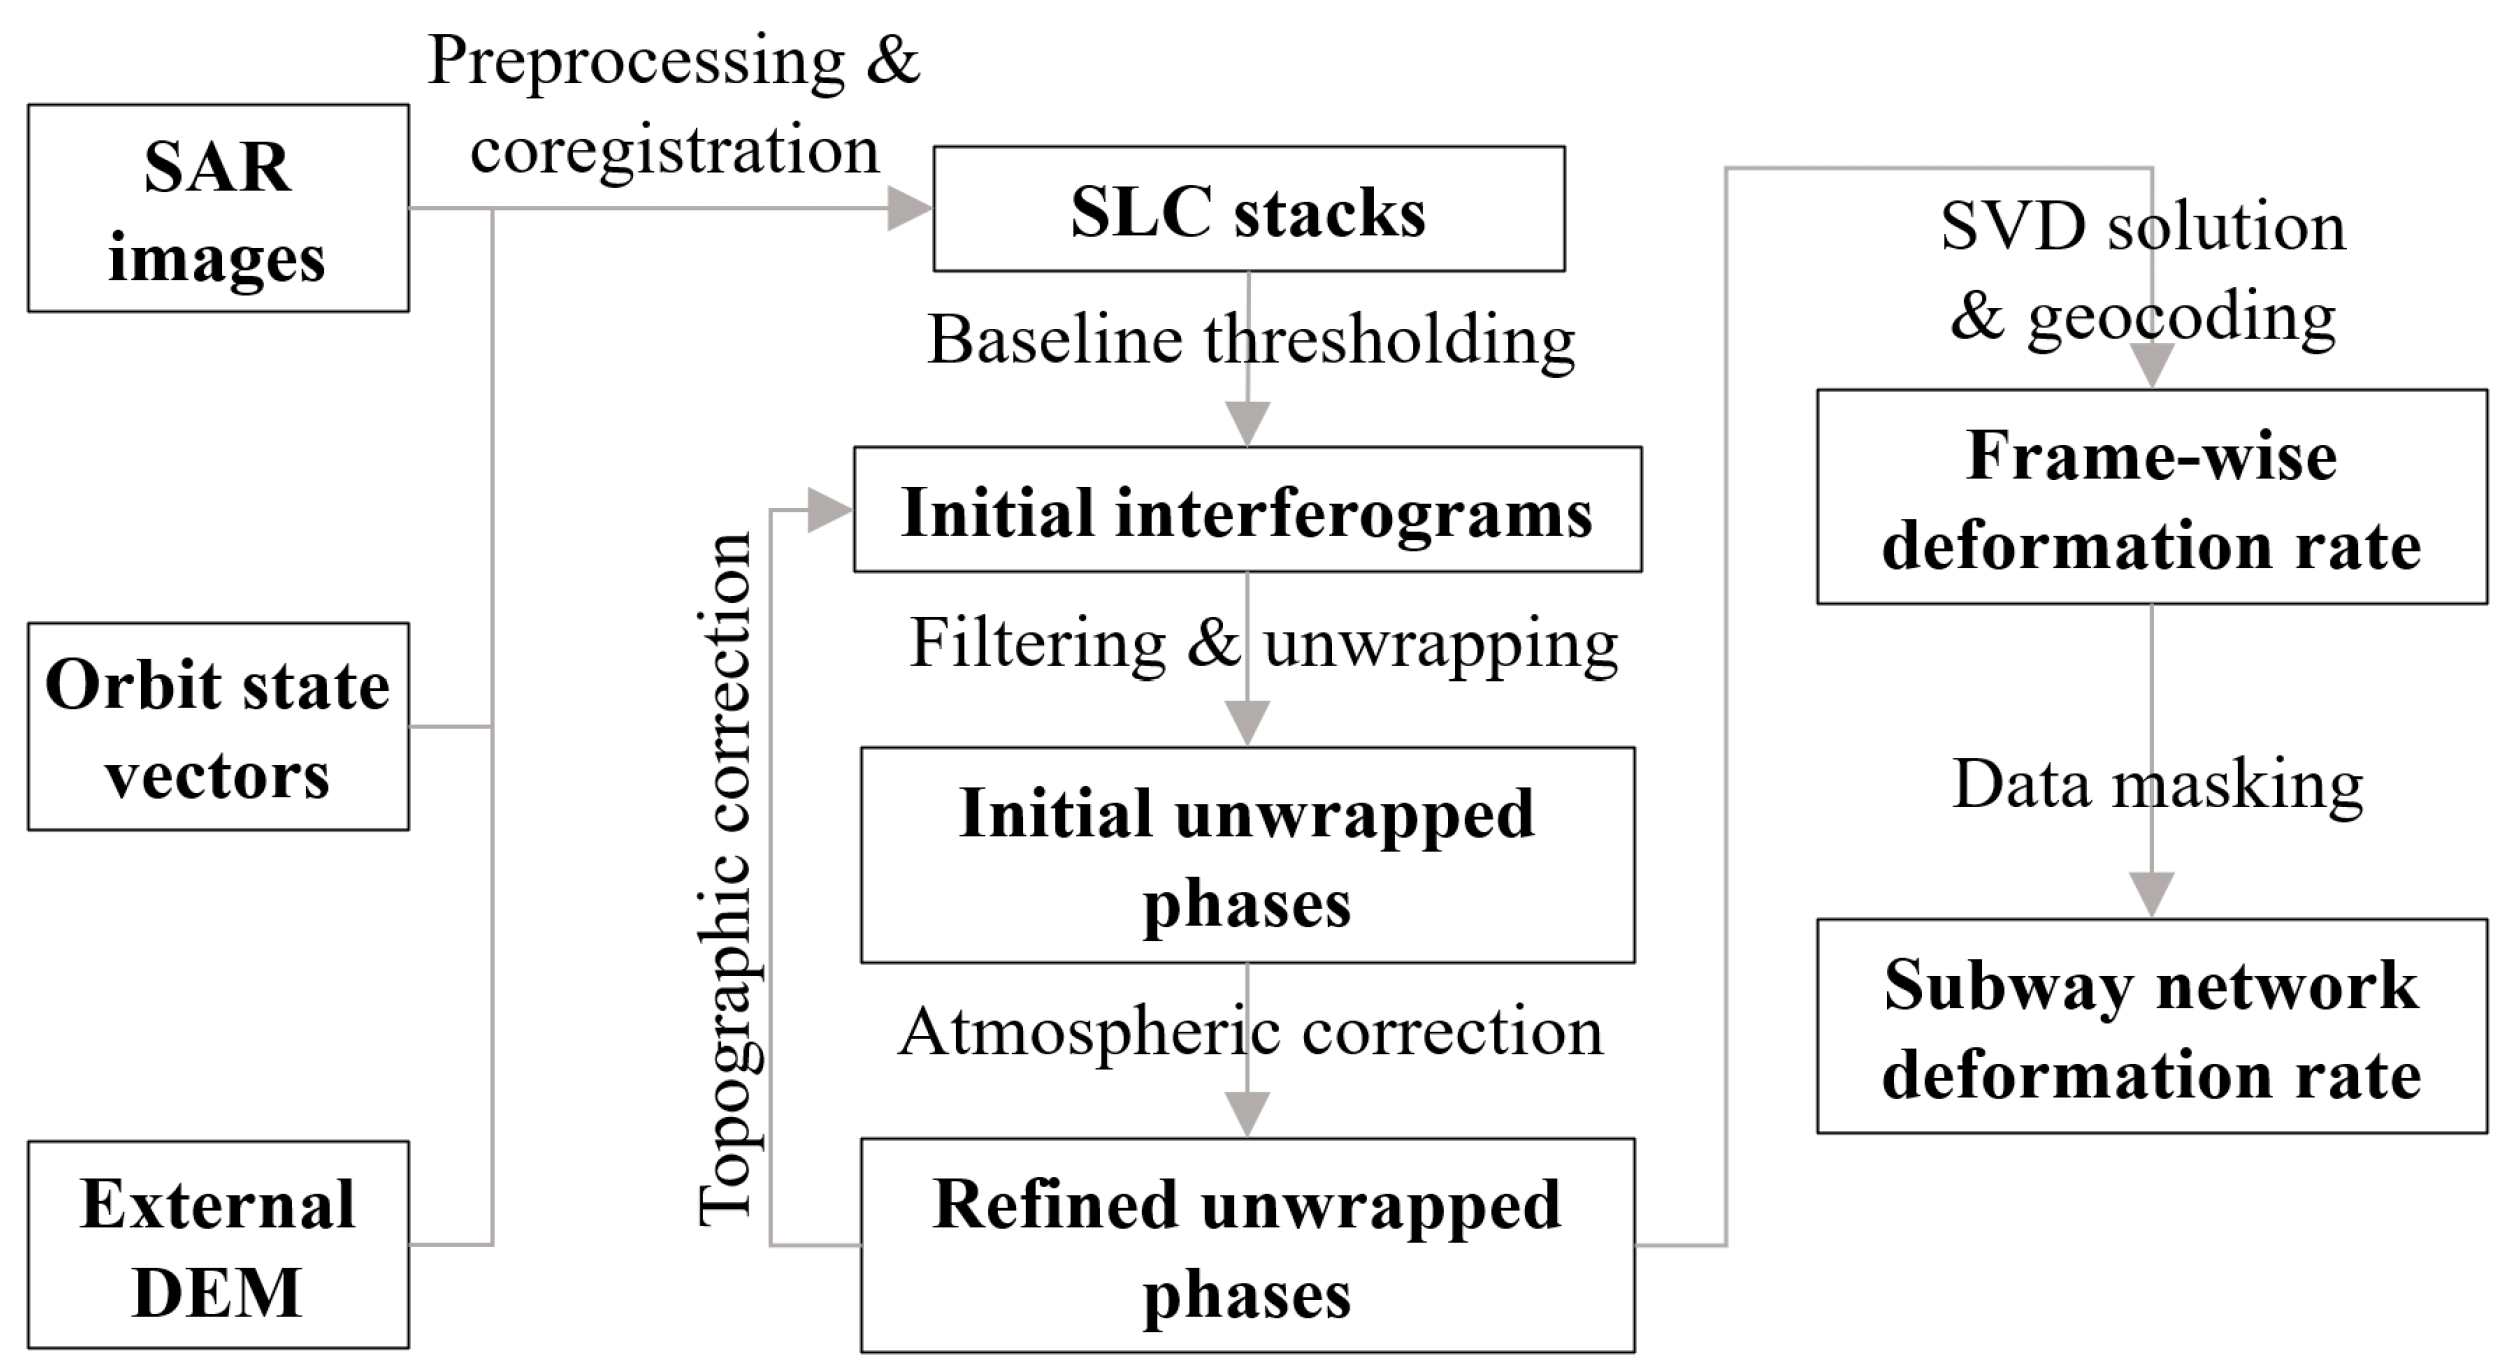
2.2. SBAS-InSAR Workflow
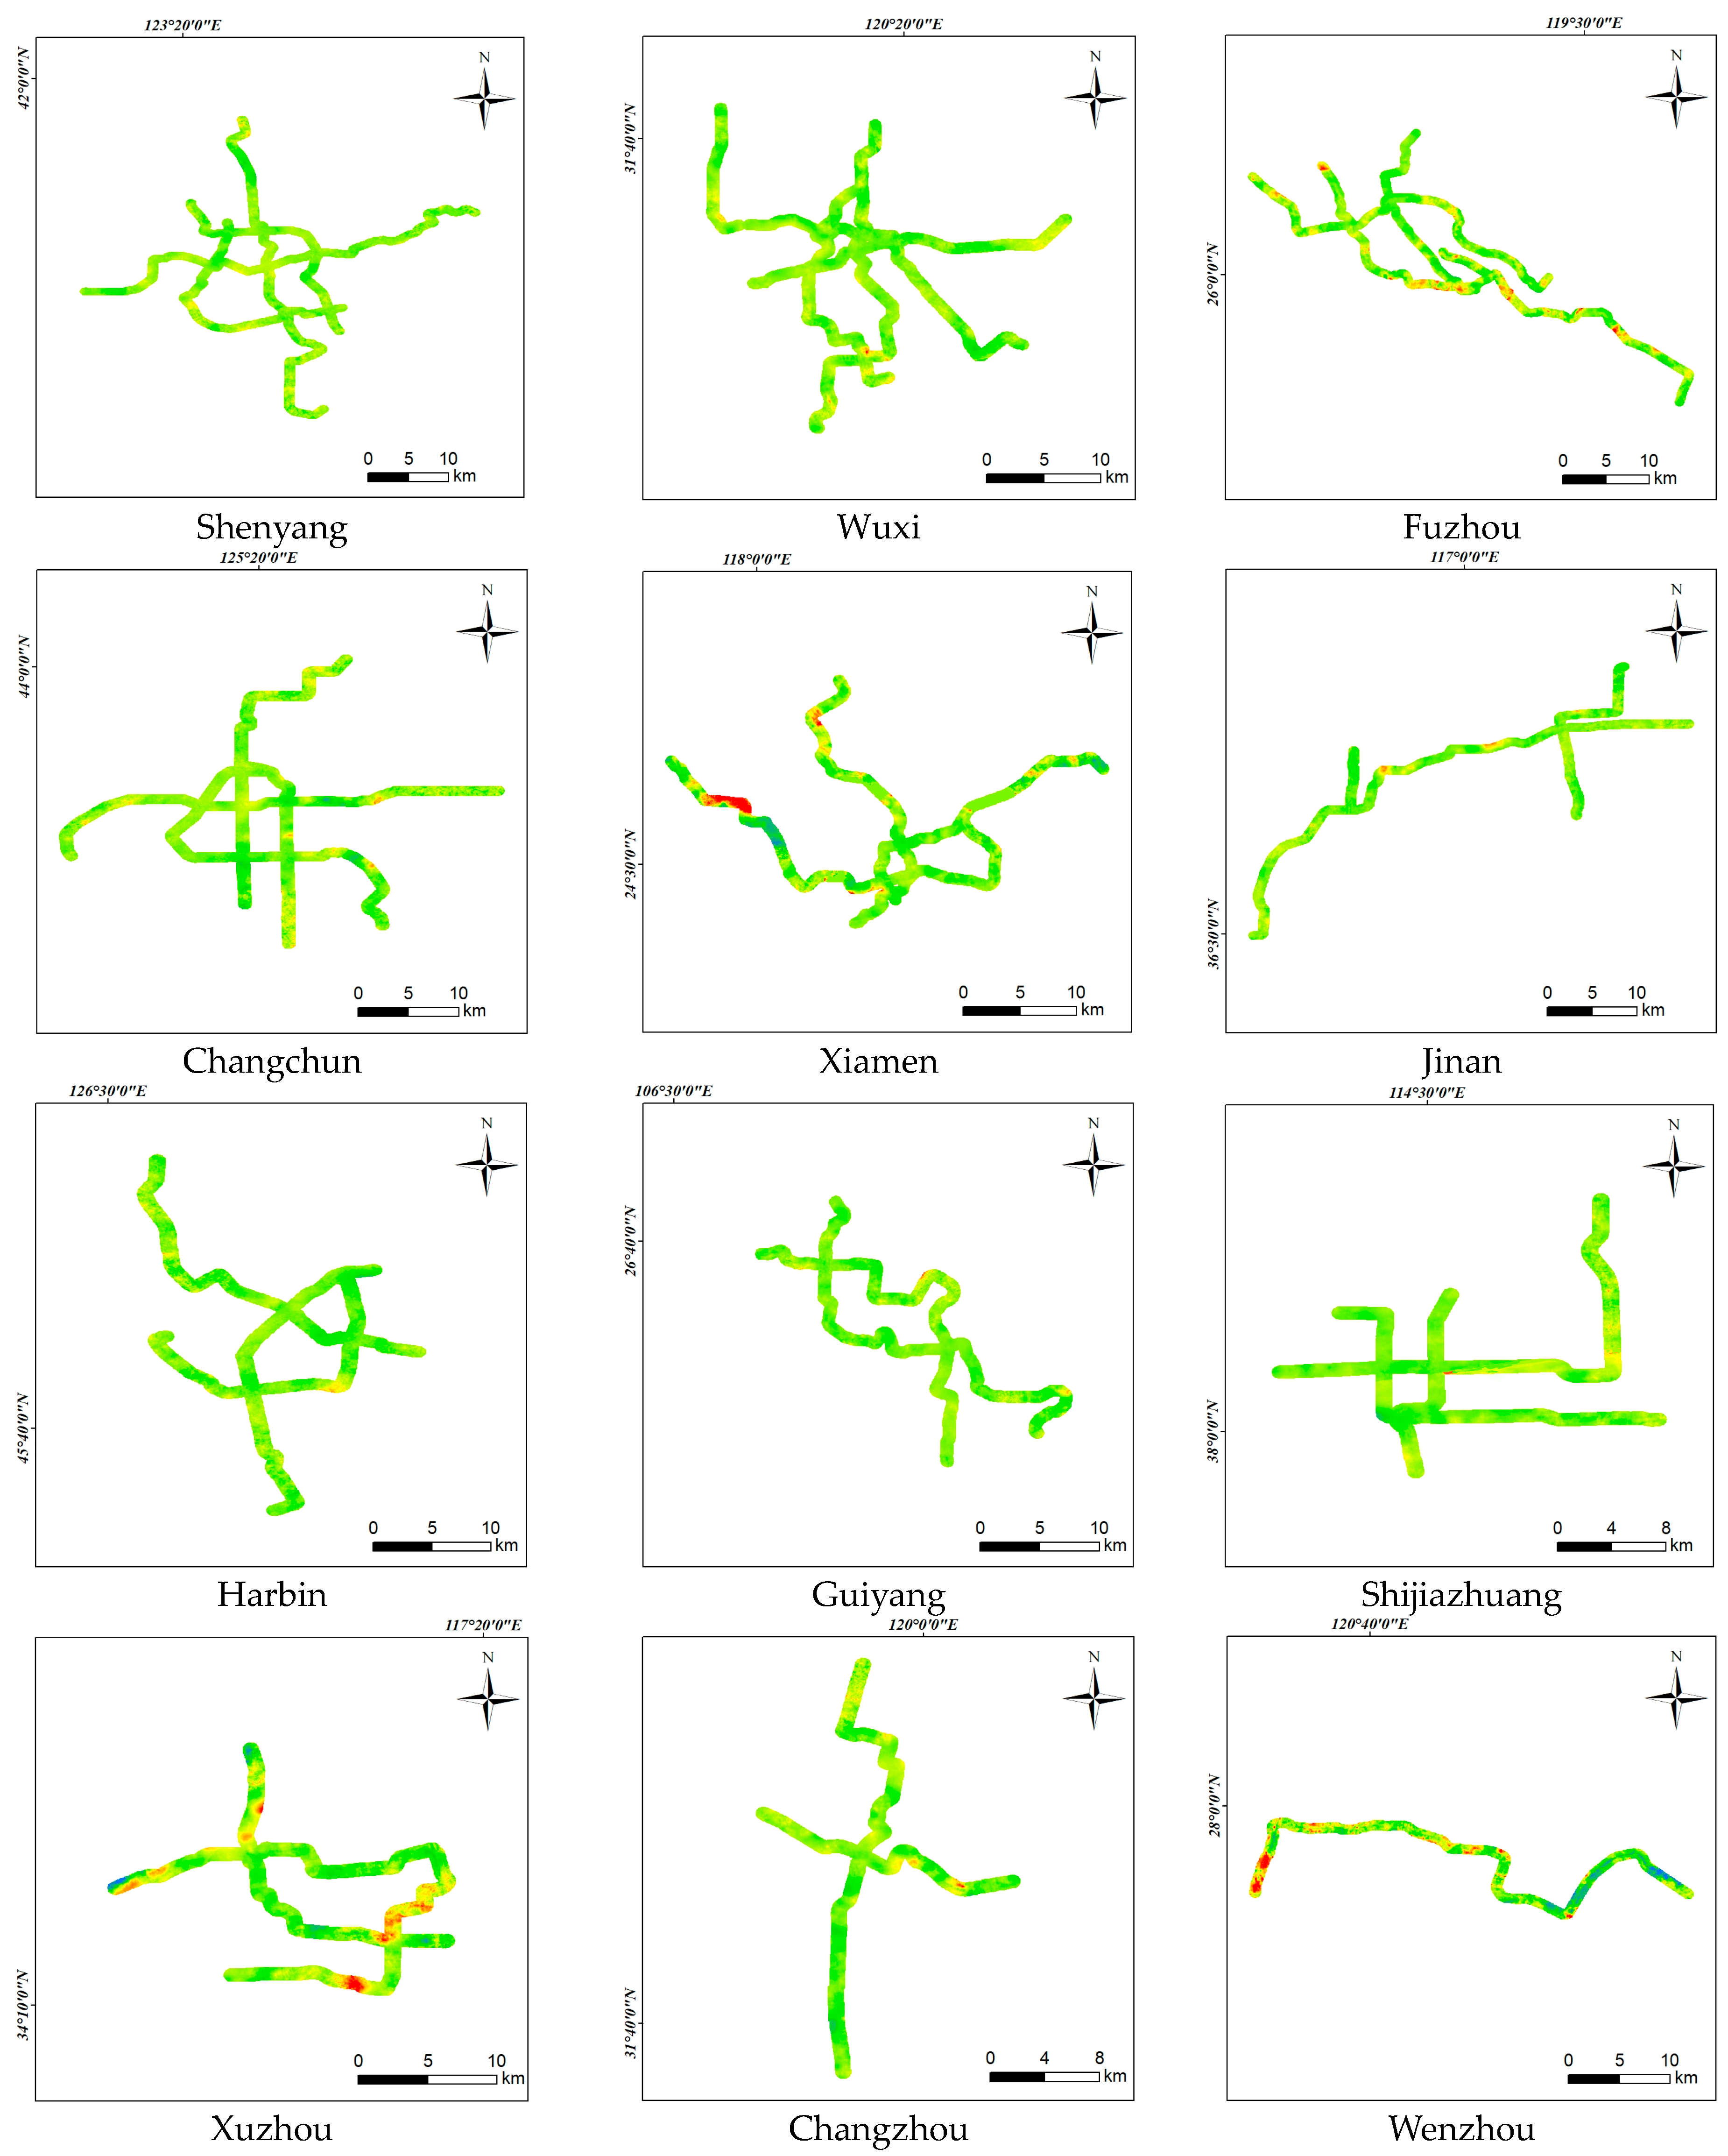
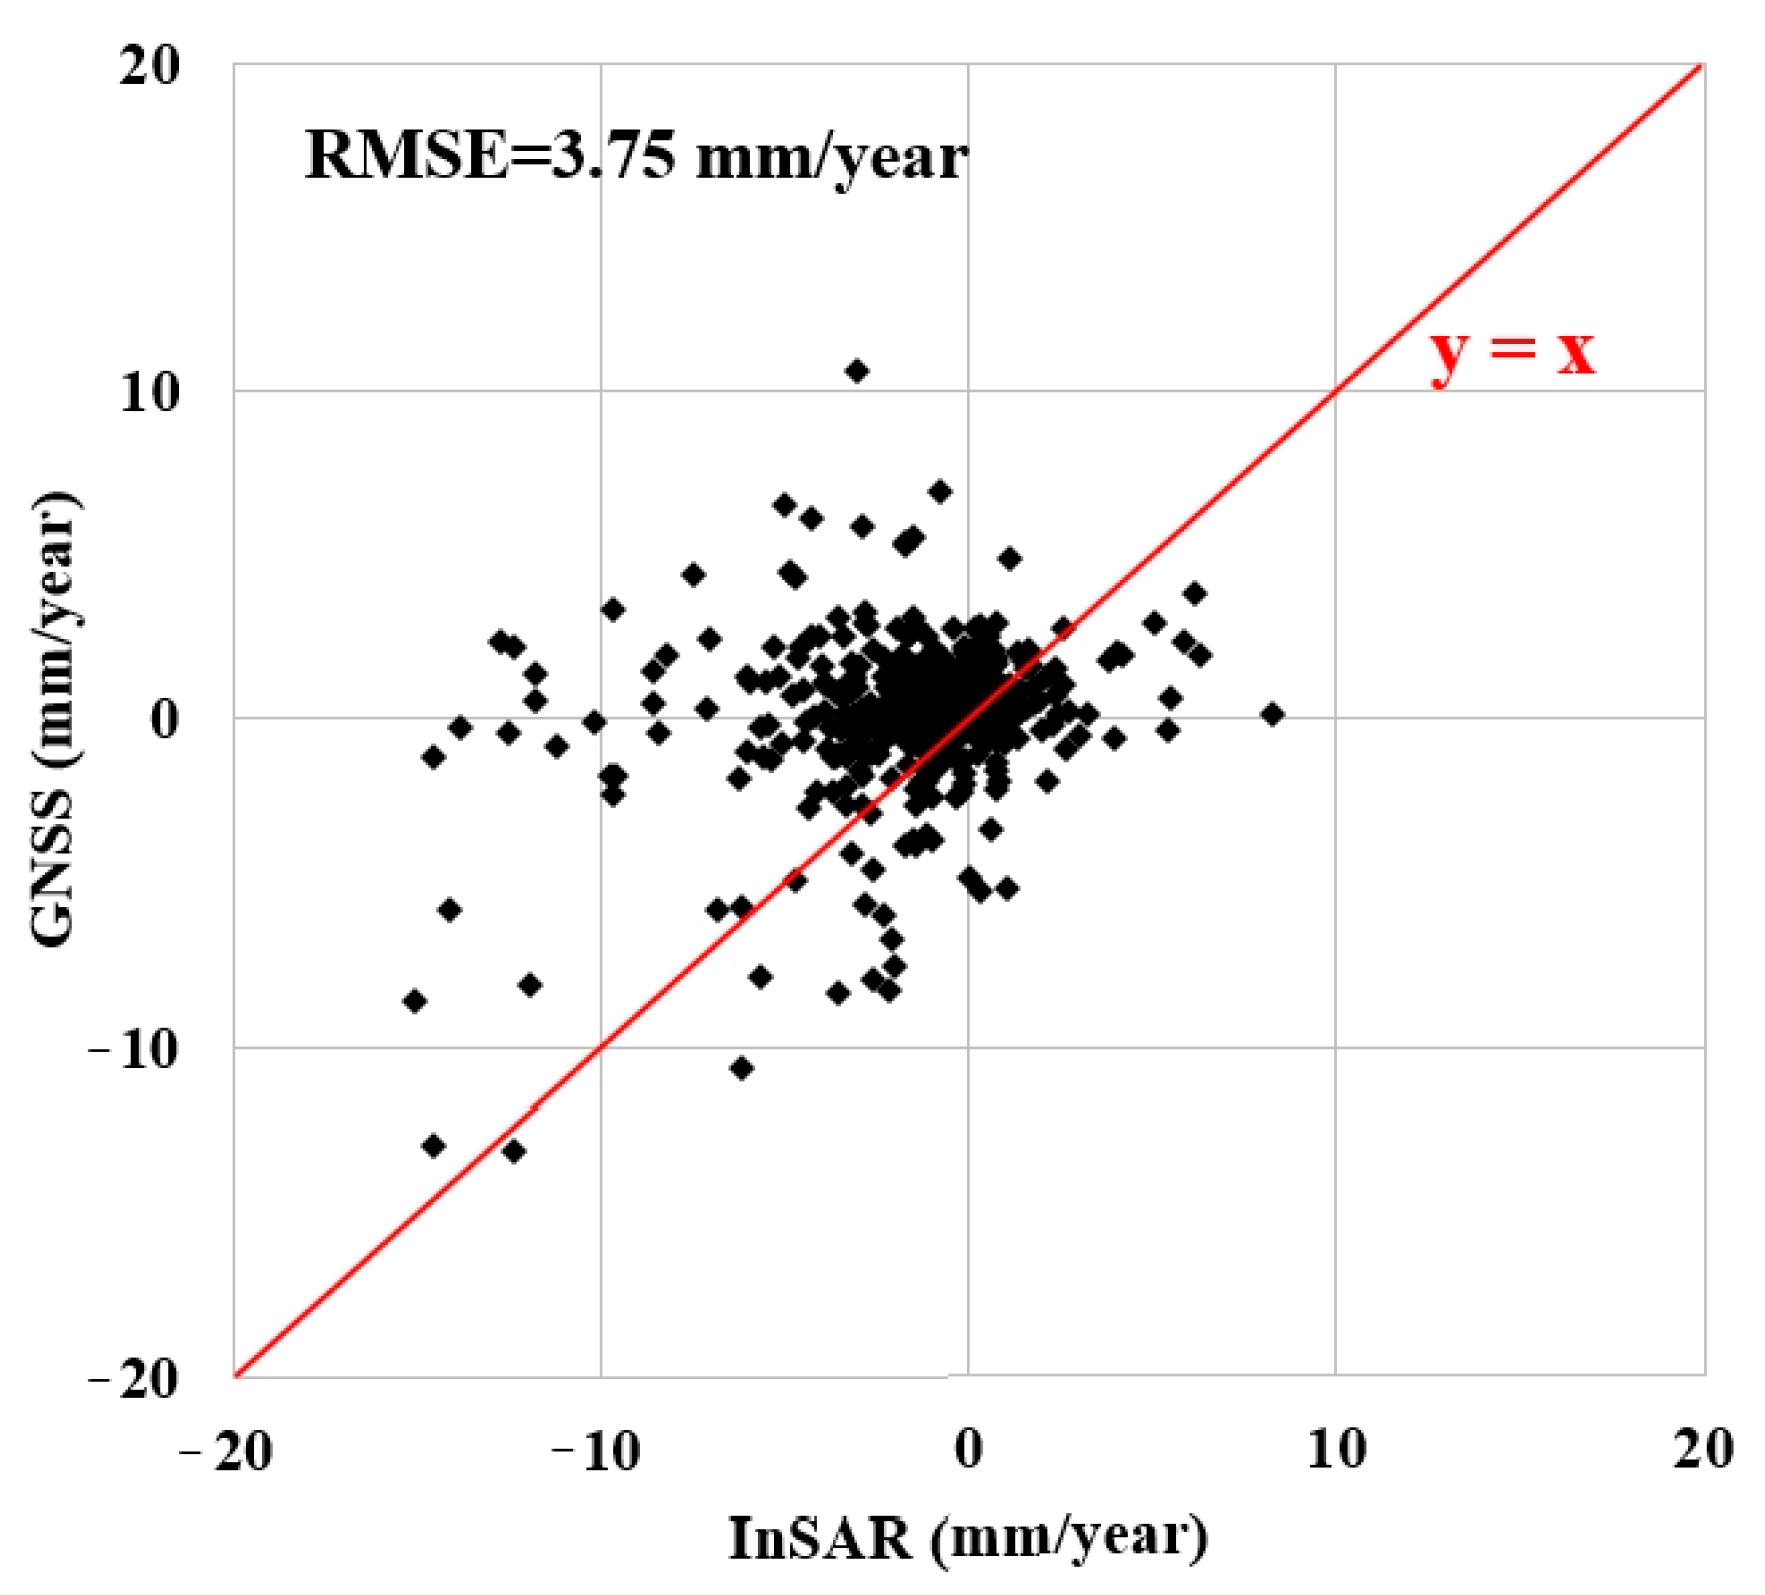
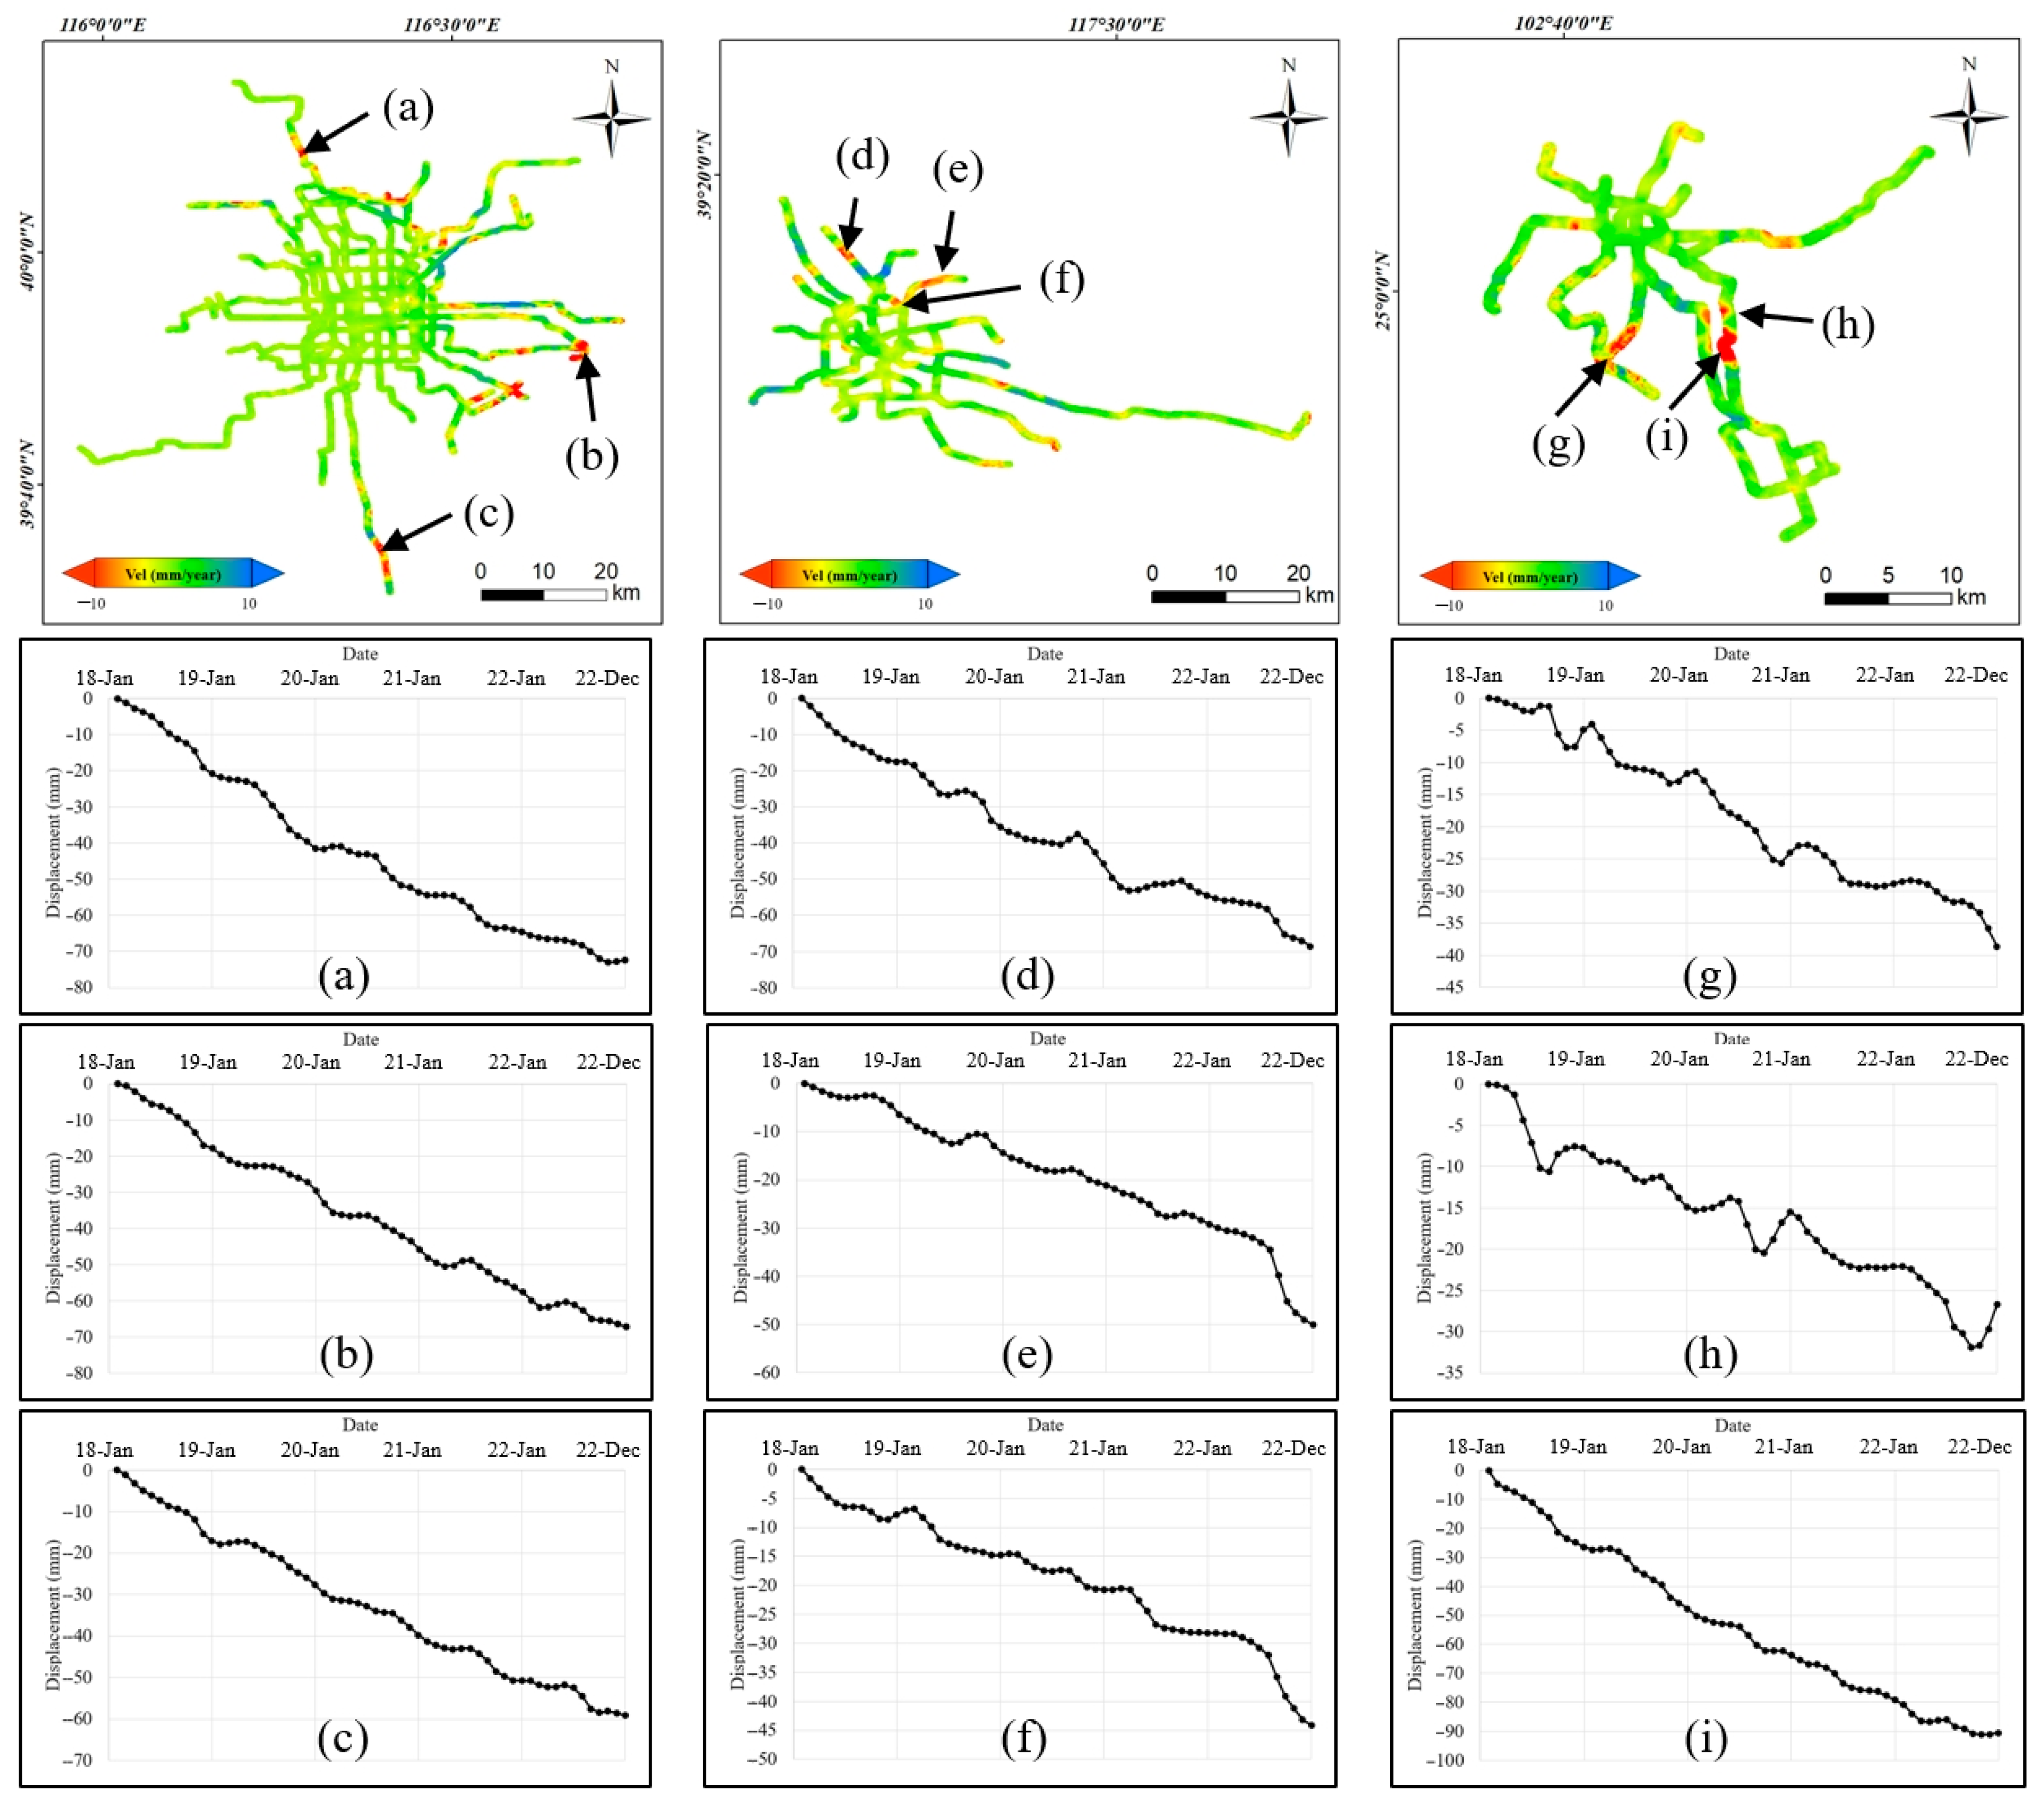
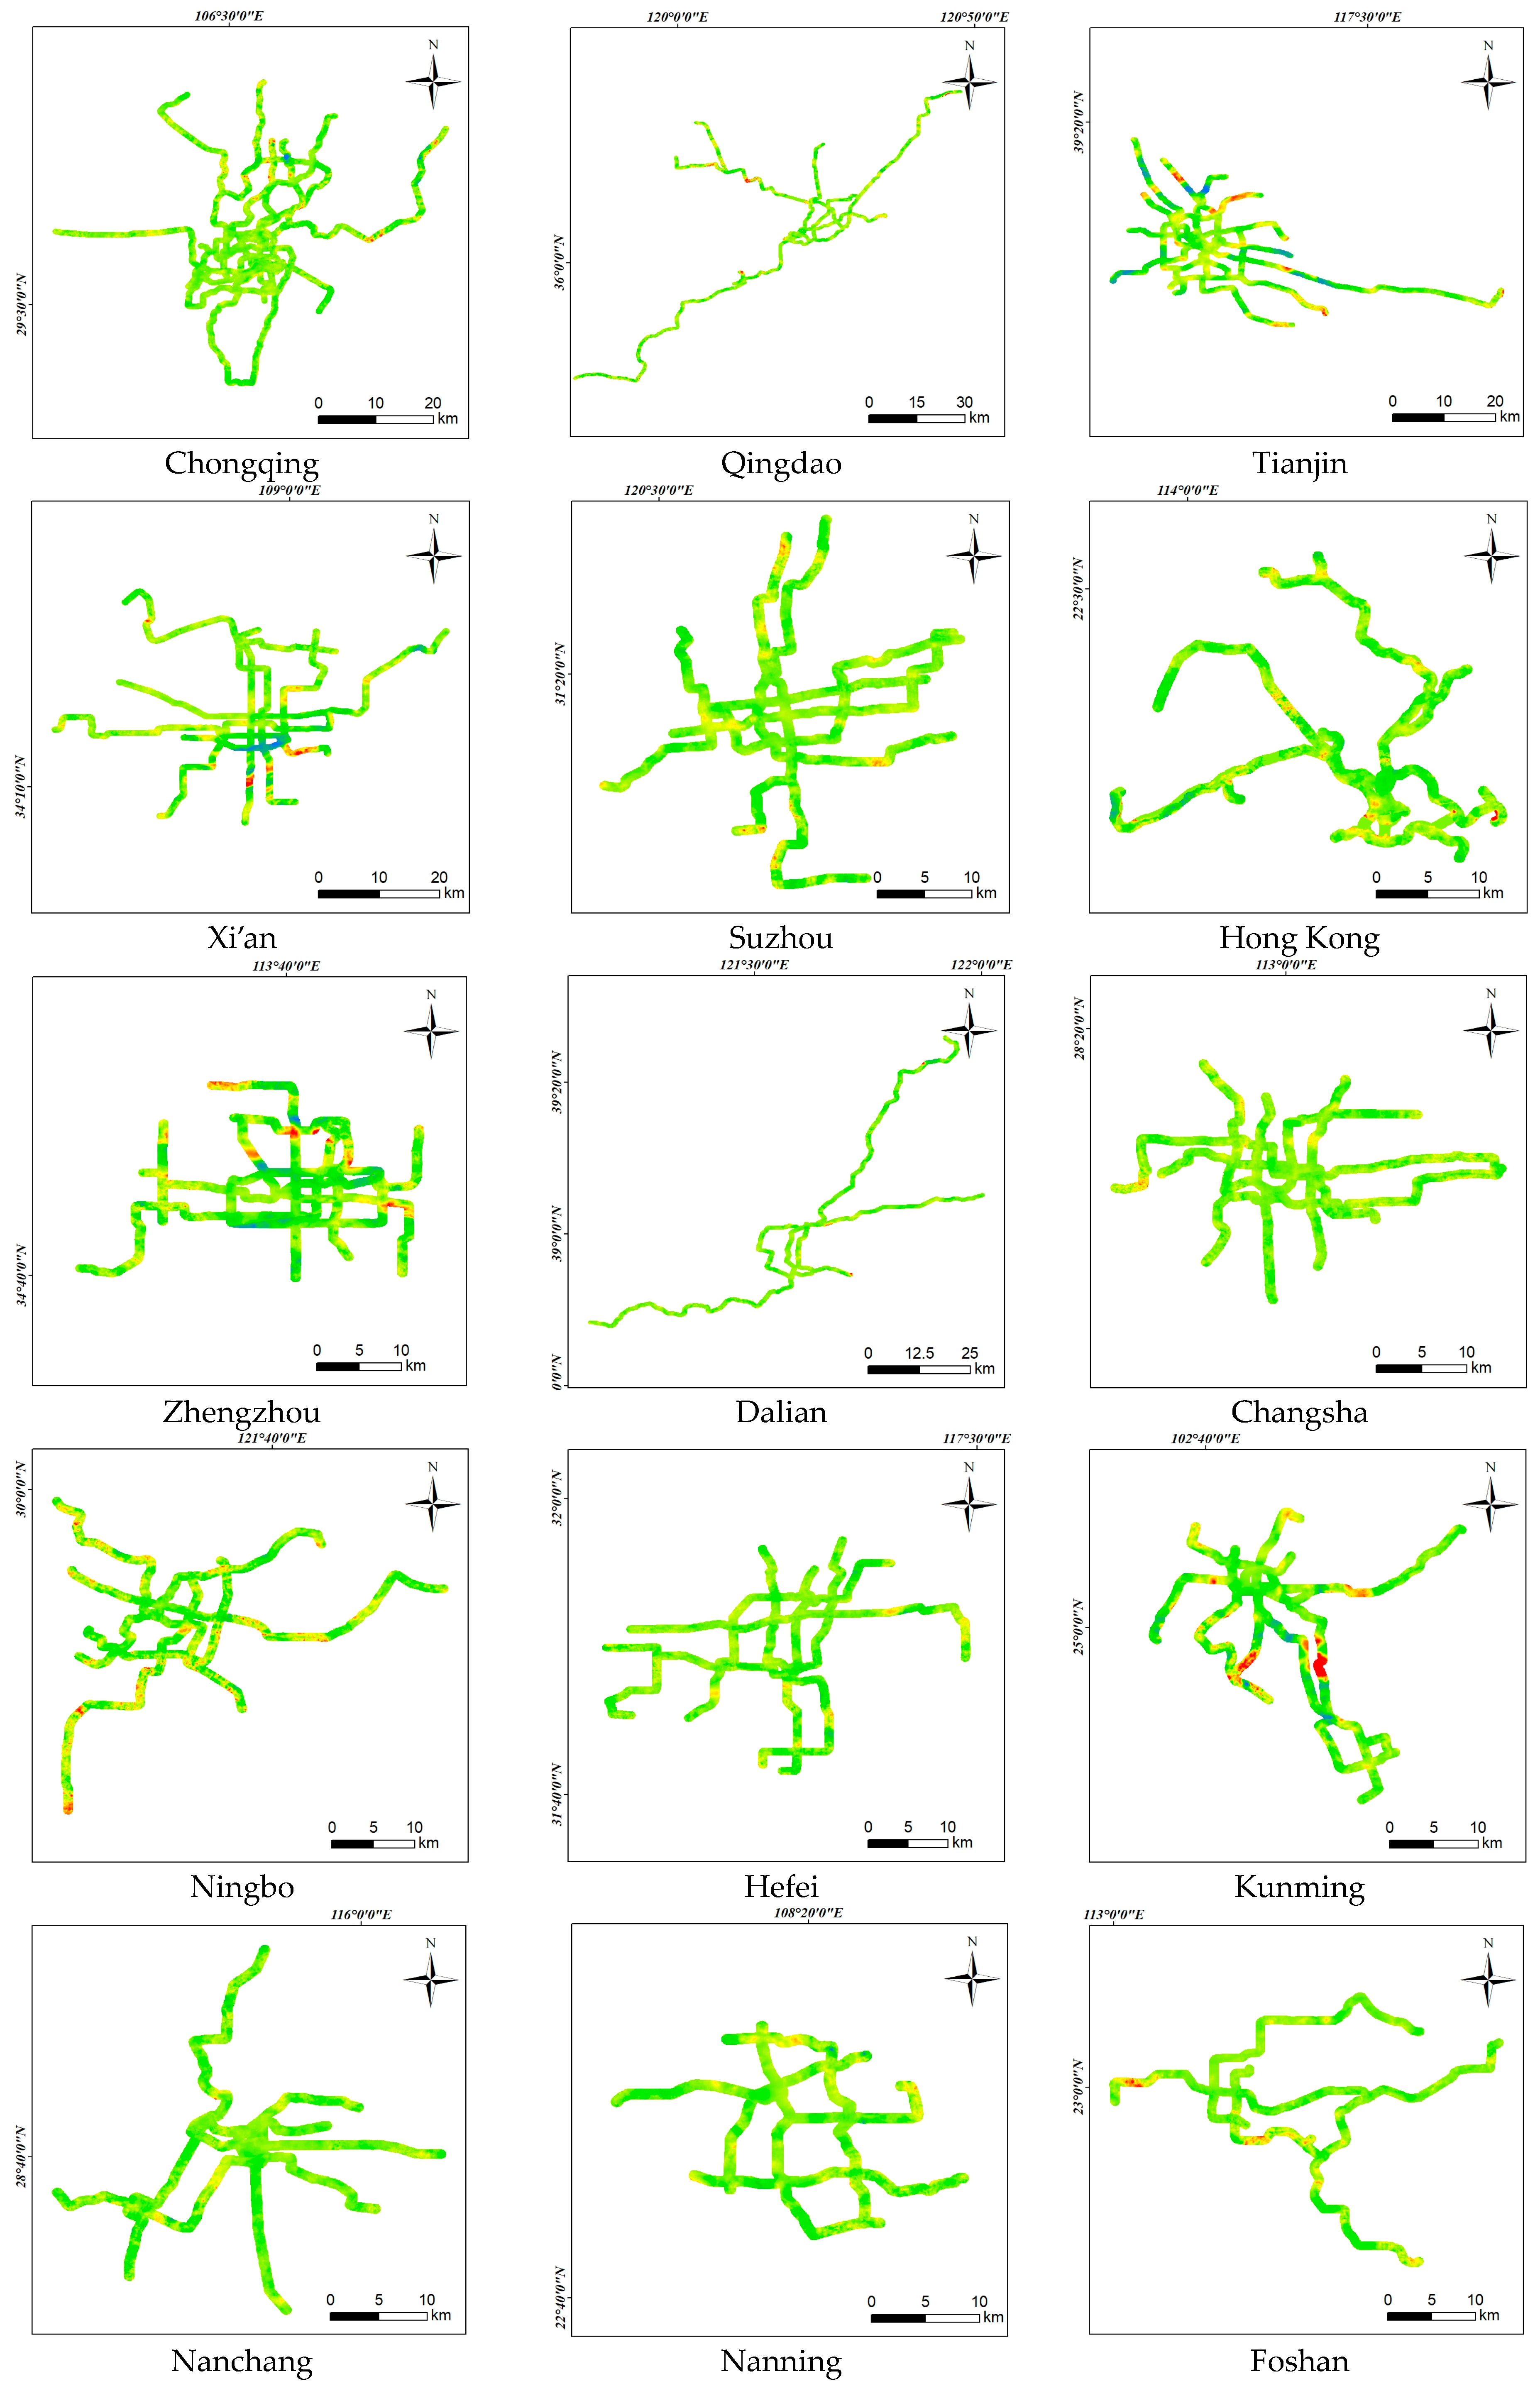
3. Results
4. Discussion
5. Conclusions
Author Contributions
Funding
Data Availability Statement
Acknowledgments
Conflicts of Interest
References
- Cai, Z.; Wang, J.; Li, T.; Yang, B.; Su, X.; Guo, L.; Ding, Z. A novel trajectory based prediction method for urban subway design. ISPRS Int. J. Geoinf. 2022, 11, 126. [Google Scholar] [CrossRef]
- Yang, J.; Chen, S.; Qin, P.; Lu, F. The Effects of Subway Expansion on Traffic Conditions: Evidence from Beijing. Environmental Development Discussion Paper Serier EfD DP. 2015, pp. 15–22. Available online: https://www.rff.org/publications/working-papers/the-effects-of-subway-expansion-on-traffic-conditions-evidence-from-beijing/ (accessed on 4 February 2023).
- Xiao, D.; Li, B.; Cheng, S. The effect of subway development on air pollution: Evidence from China. J. Clean. Prod. 2020, 275, 124149. [Google Scholar] [CrossRef]
- Hu, C.; Cai, D.; Wen, Y. Does subway mileage affect urban housing prices? An economic growth perspective. Appl. Econ. 2023, 1–13. [Google Scholar] [CrossRef]
- Ma, P.; Zhang, Y.; Zhang, Z.; Wu, Z.; Yu, C. Building risk monitoring and prediction using integrated multi-temporal InSAR and numerical modeling techniques. Int. J Appl. Earth Obs. 2022, 114, 103076. [Google Scholar] [CrossRef]
- Galloway, D.; Burbey, T. Review: Regional land subsidence accompanying groundwater extraction. Hydrogeol. J. 2011, 19, 1459–1486. [Google Scholar] [CrossRef]
- Liu, Y.; Qiu, H.; Kamp, U.; Wang, N.; Wang, J.; Huang, C.; Tang, B. Higher temperature sensitivity of retrogressive thaw slump activity in the Arctic compared to the Third Pole. Sci. Total Environ. 2024, 914, 170007. [Google Scholar] [CrossRef] [PubMed]
- Chen, W.; Gong, H.; Chen, B.; Liu, K.; Gao, M.; Zhou, C. Spatiotemporal evolution of land subsidence around a subway using InSAR time-series and the entropy method. GISci. Remote Sens. 2017, 54, 78–94. [Google Scholar] [CrossRef]
- Wang, R.; Yang, M.; Dong, J.; Liao, M. Investigating deformation along metro lines in coastal cities considering different structures with InSAR and SBM analyses. Int. J. Appl. Earth Obs. Geoinf. 2022, 115, 103099. [Google Scholar] [CrossRef]
- Wu, Z.; Ma, P.; Zheng, Y.; Gu, F.; Liu, L.; Lin, H. Automatic detection and classification of land subsidence in deltaic metropolitan areas using distributed scatterer InSAR and oriented R-CNN. Remote Sens. Environ. 2023, 290, 113545. [Google Scholar] [CrossRef]
- Richard, B.; Philipp, H. Synthetic aperture radar interferometry. Inverse Probl. 1998, 14, R1. [Google Scholar] [CrossRef]
- Wright, T.J.; Parsons, B.E.; Lu, Z. Toward mapping surface deformation in three dimensions using InSAR. Geophys. Res. Lett. 2004, 31, 169–178. [Google Scholar] [CrossRef]
- Chen, F.; Xu, H.; Zhou, W.; Zheng, W.; Deng, Y.; Parcharidis, I. Three-dimensional deformation monitoring and simulations for the preventive conservation of architectural heritage: A case study of the Angkor Wat Temple, Cambodia. GISci. Remote Sens. 2021, 58, 217–234. [Google Scholar] [CrossRef]
- Hooper, A.; Zebker, H.; Segall, P.; Kampes, B. A New Method for Measuring Deformation on Volcanoes and Other Natural Terrains Using Insar Persistent Scatterers. Geophys. Res. Lett. 2004, 31, 96–106. [Google Scholar] [CrossRef]
- Ye, B.; Qiu, H.; Tang, B.; Liu, Y.; Liu, Z.; Jiang, X.; Yang, D.; Ullah, M.; Zhu, Y.; Kamp, U. Creep deformation monitoring of landslides in a reservoir area. J. Hydrol. 2024, 632, 130905. [Google Scholar] [CrossRef]
- Wasowski, J.; Bovenga, F. Investigating landslides and unstable slopes with satellite Multi Temporal Interferometry: Current issues and future perspectives. Eng. Geol. 2014, 174, 103–138. [Google Scholar] [CrossRef]
- Dong, J.; Lai, S.; Wang, N.; Wang, Y.; Zhang, L.; Liao, M. Multi-scale deformation monitoring with Sentinel-1 InSAR analyses along the Middle Route of the South-North Water Diversion Project in China. Int. J. Appl. Earth Obs. Geoinf. 2021, 100, 102324. [Google Scholar] [CrossRef]
- Li, Z.; Zhu, W.; Yu, C.; Zhang, Q.; Zhang, C.; Liu, Z.; Zhang, X.; Chen, B.; Du, J.; Song, C.; et al. Interferometric synthetic aperture radar for deformation mapping: Opportunities, challenges and the outlook. Acta Geod. Cartogr. Sin. 2022, 51, 1485–1519. [Google Scholar]
- Barra, A.; Solari, L.; Béjar-Pizarro, M.; Monserrat, O.; Bianchini, S.; Herrera, G.; Crosetto, M.; Sarro, R.; González-Alonso, E.; Mateos, R.M.; et al. A Methodology to Detect and Update Active Deformation Areas Based on Sentinel-1 SAR Images. Remote Sens. 2017, 9, 1002. [Google Scholar] [CrossRef]
- Hamling, I.J.; Hreinsdóttir, S.; Clark, K.; Elliott, J.; Liang, C.; Fielding, E.; Litchfield, N.; Villamor, P.; Wallace, L.; Wright, T.J. Complex multifault rupture during the 2016 M w 7.8 Kaikōura earthquake, New Zealand. Science 2017, 356, eaam7194. [Google Scholar] [CrossRef]
- Fadhillah, F.; Chmad, A.R.; Lee, C.W. Integration of InSAR timeseries data and GIS to assess land subsidence along subway lines in the Seoul metropolitan area South Korea. Remote Sens. 2020, 12, 3505. [Google Scholar] [CrossRef]
- Espiritu, K.W.; Reyes, C.J.; Benitez, T.M.; Tokita, R.C.; Galvez, L.J.; Ramirez, R. Sentinel-1 interferometric synthetic aperture radar (InSAR) reveals continued ground deformation in and around Metro Manila, Philippines, associated with groundwater exploitation. Nat. Hazards 2022, 114, 3139–3161. [Google Scholar] [CrossRef]
- Gheorghe, M.; Armaș, I.; Dumitru, P.; Călin, A.; Bădescu, O.; Necsoiu, M. Monitoring subway construction using Sentinel-1 data: A case study in Bucharest, Romania. Int. J. Remote Sens. 2020, 41, 2644–2663. [Google Scholar] [CrossRef]
- Duan, L.; Gong, H.; Chen, B.; Zhou, C.; Lei, K.; Gao, M.; Yu, H.; Cao, Q.; Cao, J. An improved multi-sensor MTI time-series fusion method to monitor the subsidence of Beijing subway network during the past 15 years. Remote Sens. 2020, 12, 2125. [Google Scholar] [CrossRef]
- Dong, S.; Samsonov, S.; Yin, H.; Ye, S.; Cao, Y. Time-series analysis of subsidence associated with rapid urbanization in Shanghai, China measured with SBAS InSAR method. Environ. Earth Sci. 2014, 72, 677–691. [Google Scholar] [CrossRef]
- Perissin, D.; Wang, Z.; Lin, H. Shanghai subway tunnels and highways monitoring through Cosmo-SkyMed persistent scatterers. ISPRS J. Photogram. Remote Sens. 2012, 73, 58–67. [Google Scholar] [CrossRef]
- Zhang, J.; Ke, C.; Shen, X.; Lin, J.; Wang, R. Monitoring land subsidence along the subways in Shanghai on the basis of time-series InSAR. Remote Sens. 2023, 15, 908. [Google Scholar] [CrossRef]
- Yuan, Y.; Qin, Y.; Zhang, Y.; Xie, L.; Meng, X.; Guo, Z. Environmental risk source analysis and classification of zones: Subway construction. Appl. Sci. 2023, 13, 5831. [Google Scholar] [CrossRef]
- Xu, X.; Zhao, D.; Ma, C.; Lian, D. Monitoring subsidence deformation of Suzhou subway using InSAR timeseries analysis. IEEE Access 2021, 9, 3400–3416. [Google Scholar] [CrossRef]
- Tao, Q.; Guo, Z.; Wang, F.; An, Q.; Han, Y. SBAS-InSAR time series ground subsidence monitoring along Metro Line 13 in Qingdao, China. Arab. J. Geosci. 2021, 14, 2628. [Google Scholar] [CrossRef]
- Zheng, M.; Guo, Q.; Zhao, R.; Wang, L.; Han, Y. Surface subsidence disasters over Xuzhou city, China 2014–2018 revealed by InSAR and Peck model. Environ. Earth Sci. 2023, 82, 264. [Google Scholar] [CrossRef]
- Hu, B.; Li, Z. Time-series InSAR technology for ascending and descending orbital images to monitor surface deformation of the metro network in Chengdu. IEEE J. Sel. Top. Appl. Earth Obs. Remote Sens. 2021, 14, 12583–12597. [Google Scholar] [CrossRef]
- Gao, H.; Xiong, L.; Chen, J.; Lin, H.; Feng, G. Surface Subsidence of Nanchang, China 2015–2021 Retrieved via Multi-Temporal InSAR Based on Long- and Short-Time Baseline Net. Remote Sens. 2023, 15, 3253. [Google Scholar] [CrossRef]
- Zhao, S.; Li, P.; Li, H.; Zhang, T.; Wang, B. Monitoring and Comparative Analysis of Hohhot Subway Subsidence Using StaMPS-PS Based on Two DEMS. Remote Sens. 2023, 15, 4011. [Google Scholar] [CrossRef]
- Ministry of Transport of People’s Republic of China. Urban Rail Transit Operation Data Report. 2022. Available online: https://www.gov.cn/xinwen/2023-01/20/content_5738226.htm (accessed on 15 November 2023). (In Chinese)
- Berardino, P.; Fornaro, G.; Lanari, R.; Sansoti, E. A new algorithm for surface deformation monitoring based on small baseline differential SAR interferograms. IEEE Trans. Geosci. Remote Sens. 2002, 40, 2375–2383. [Google Scholar] [CrossRef]
- Wang, S.; Zhang, G.; Chen, Z.; Cui, H.; Zheng, Y.; Xu, Z.; Li, Q. Surface deformation extraction from small baseline subset synthetic aperture radar interferometry (SBAS-InSAR) using coherence-optimized baseline combinations. GISci. Remote Sens. 2022, 59, 295–309. [Google Scholar] [CrossRef]
- Buchhorn, M.; Lesiv, M.; Tsendbazar, N.-E.; Herold, M.; Bertels, L.; Smets, B. Copernicus Global Land Cover Layers—Collection 2. Remote Sens. 2020, 12, 1044. [Google Scholar] [CrossRef]


| No. | City | Operation | Sentinel Identifier | Number of Acquisitions | Direction | Incidence Angle (Degree) | ||
|---|---|---|---|---|---|---|---|---|
| Lines | Mileage (km) | Path | Frame | |||||
| 1 | Beijing | 27 | 797.3 | 142 | 126 | 146 | Ascending | 39.42 |
| 2 | Shanghai | 20 | 825.0 | 171 | 96 | 145 | Ascending | 39.60 |
| 3 | Guangzhou | 16 | 609.8 | 11 | 71 | 148 | Ascending | 39.67 |
| 4 | Shenzhen | 16 | 558.6 | 11 | 65 | 148 | Ascending | 39.71 |
| 11 | 71 | 148 | 39.67 | |||||
| 5 | Chengdu | 13 | 557.8 | 128 | 94 | 147 | Ascending | 39.63 |
| 6 | Hangzhou | 12 | 516.0 | 69 | 94 | 141 | Ascending | 39.63 |
| 7 | Wuhan | 11 | 504.3 | 113 | 96 | 125 | Ascending | 39.64 |
| 8 | Nanjing | 12 | 448.8 | 69 | 99 | 139 | Ascending | 39.60 |
| 9 | Chongqing | 11 | 434.6 | 55 | 92 | 134 | Ascending | 39.59 |
| 10 | Qingdao | 7 | 323.8 | 171 | 111 | 143 | Ascending | 39.52 |
| 171 | 116 | 143 | 39.48 | |||||
| 11 | Tianjin | 8 | 286.0 | 69 | 124 | 133 | Ascending | 39.20 |
| 12 | Xi’an | 8 | 272.4 | 84 | 105 | 138 | Ascending | 39.55 |
| 84 | 110 | 138 | 39.52 | |||||
| 13 | Suzhou | 5 | 254.2 | 69 | 99 | 139 | Ascending | 39.60 |
| 14 | Hongkong | 10 | 245.3 | 11 | 65 | 148 | Ascending | 39.71 |
| 15 | Zhengzhou | 8 | 233.0 | 113 | 106 | 125 | Ascending | 39.62 |
| 113 | 111 | 119 | 39.59 | |||||
| 16 | Dalian | 5 | 212.6 | 98 | 124 | 140 | Ascending | 39.45 |
| 17 | Changsha | 7 | 209.1 | 11 | 86 | 137 | Ascending | 39.60 |
| 18 | Ningbo | 5 | 186.0 | 171 | 91 | 145 | Ascending | 39.63 |
| 19 | Hefei | 5 | 168.8 | 142 | 101 | 147 | Ascending | 39.58 |
| 20 | Kunming | 6 | 165.9 | 26 | 78 | 148 | Ascending | 39.65 |
| 21 | Nanchang | 4 | 128.5 | 40 | 87 | 148 | Ascending | 39.65 |
| 22 | Nanning | 5 | 128.2 | 157 | 67 | 148 | Ascending | 39.70 |
| 23 | Foshan | 4 | 127.3 | 11 | 71 | 148 | Ascending | 39.67 |
| 24 | Shenyang | 4 | 117.1 | 3 | 455 | 90 | Descending | 39.60 |
| 25 | Wuxi | 4 | 110.8 | 69 | 99 | 139 | Ascending | 39.60 |
| 26 | Fuzhou | 4 | 110.7 | 142 | 81 | 146 | Ascending | 39.67 |
| 27 | Changchun | 5 | 106.7 | 105 | 446 | 121 | Descending | 39.60 |
| 28 | Xiamen | 3 | 98.4 | 142 | 75 | 146 | Ascending | 39.69 |
| 29 | Jinan | 3 | 84.1 | 142 | 116 | 147 | Ascending | 39.48 |
| 30 | Harbin | 3 | 78.1 | 105 | 441 | 118 | Descending | 39.58 |
| 31 | Guiyang | 2 | 74.4 | 55 | 82 | 136 | Ascending | 39.63 |
| 32 | Shijiazhuang | 3 | 74.3 | 40 | 122 | 148 | Ascending | 39.45 |
| 33 | Xuzhou | 3 | 64.1 | 142 | 106 | 147 | Ascending | 39.55 |
| 34 | Changzhou | 2 | 54.0 | 69 | 99 | 139 | Ascending | 39.60 |
| 35 | Wenzhou | 1 | 52.5 | 69 | 84 | 140 | Ascending | 39.67 |
| 69 | 89 | 141 | 39.65 | |||||
| No. | City | Min | Max | Mean | Std | No. | City | Min | Max | Mean | Std |
|---|---|---|---|---|---|---|---|---|---|---|---|
| 1 | Beijing | −17.72 | 13.50 | 0.01 | 2.32 | 19 | Hefei | −7.80 | 8.94 | 0.17 | 0.73 |
| 2 | Shanghai | −11.63 | 5.74 | 0.02 | 0.91 | 20 | Kunming | −14.66 | 5.82 | −0.20 | 1.87 |
| 3 | Guangzhou | −11.19 | 5.07 | 0.06 | 0.90 | 21 | Nanchang | −7.96 | 3.52 | 0.21 | 0.64 |
| 4 | Shenzhen | −10.25 | 9.54 | 0.04 | 0.69 | 22 | Nanning | −9.41 | 5.34 | 0.13 | 0.75 |
| 5 | Chengdu | −8.01 | 5.27 | 0.02 | 0.55 | 23 | Foshan | −13.41 | 3.30 | −0.04 | 1.16 |
| 6 | Hangzhou | −10.35 | 13.22 | −0.07 | 1.04 | 24 | Shenyang | −8.65 | 5.58 | 0.03 | 0.59 |
| 7 | Wuhan | −12.12 | 3.50 | 0.04 | 1.05 | 25 | Wuxi | −6.55 | 8.20 | 0.06 | 0.65 |
| 8 | Nanjing | −7.16 | 5.28 | 0.14 | 0.84 | 26 | Fuzhou | −12.19 | 4.14 | −0.13 | 1.64 |
| 9 | Chongqing | −7.43 | 8.35 | 0.12 | 0.82 | 27 | Changchun | −7.62 | 4.60 | 0.06 | 0.75 |
| 10 | Qingdao | −9.57 | 7.72 | −0.02 | 0.59 | 28 | Xiamen | −7.52 | 2.91 | 0.03 | 0.95 |
| 11 | Tianjin | −9.13 | 8.08 | −0.35 | 2.14 | 29 | Jinan | −5.39 | 4.42 | 0.07 | 0.71 |
| 12 | Xi’an | −14.09 | 7.79 | 0.25 | 1.83 | 30 | Harbin | −7.92 | 6.74 | 0.23 | 0.64 |
| 13 | Suzhou | −8.02 | 5.76 | 0.09 | 0.77 | 31 | Guiyang | −6.90 | 2.17 | 0.17 | 0.56 |
| 14 | Hongkong | −9.78 | 8.61 | 0.13 | 0.61 | 32 | Shijiazhuang | −9.26 | 2.78 | −0.07 | 1.19 |
| 15 | Zhengzhou | −11.75 | 5.93 | −0.28 | 1.37 | 33 | Xuzhou | −7.17 | 9.41 | −0.11 | 0.88 |
| 16 | Dalian | −10.15 | 6.71 | 0.21 | 0.62 | 34 | Changzhou | −6.73 | 4.30 | 0.10 | 0.65 |
| 17 | Changsha | −8.47 | 4.20 | 0.03 | 0.61 | 35 | Wenzhou | −13.66 | 9.78 | 0.06 | 2.16 |
| 18 | Ningbo | −8.27 | 5.84 | −0.08 | 1.21 |
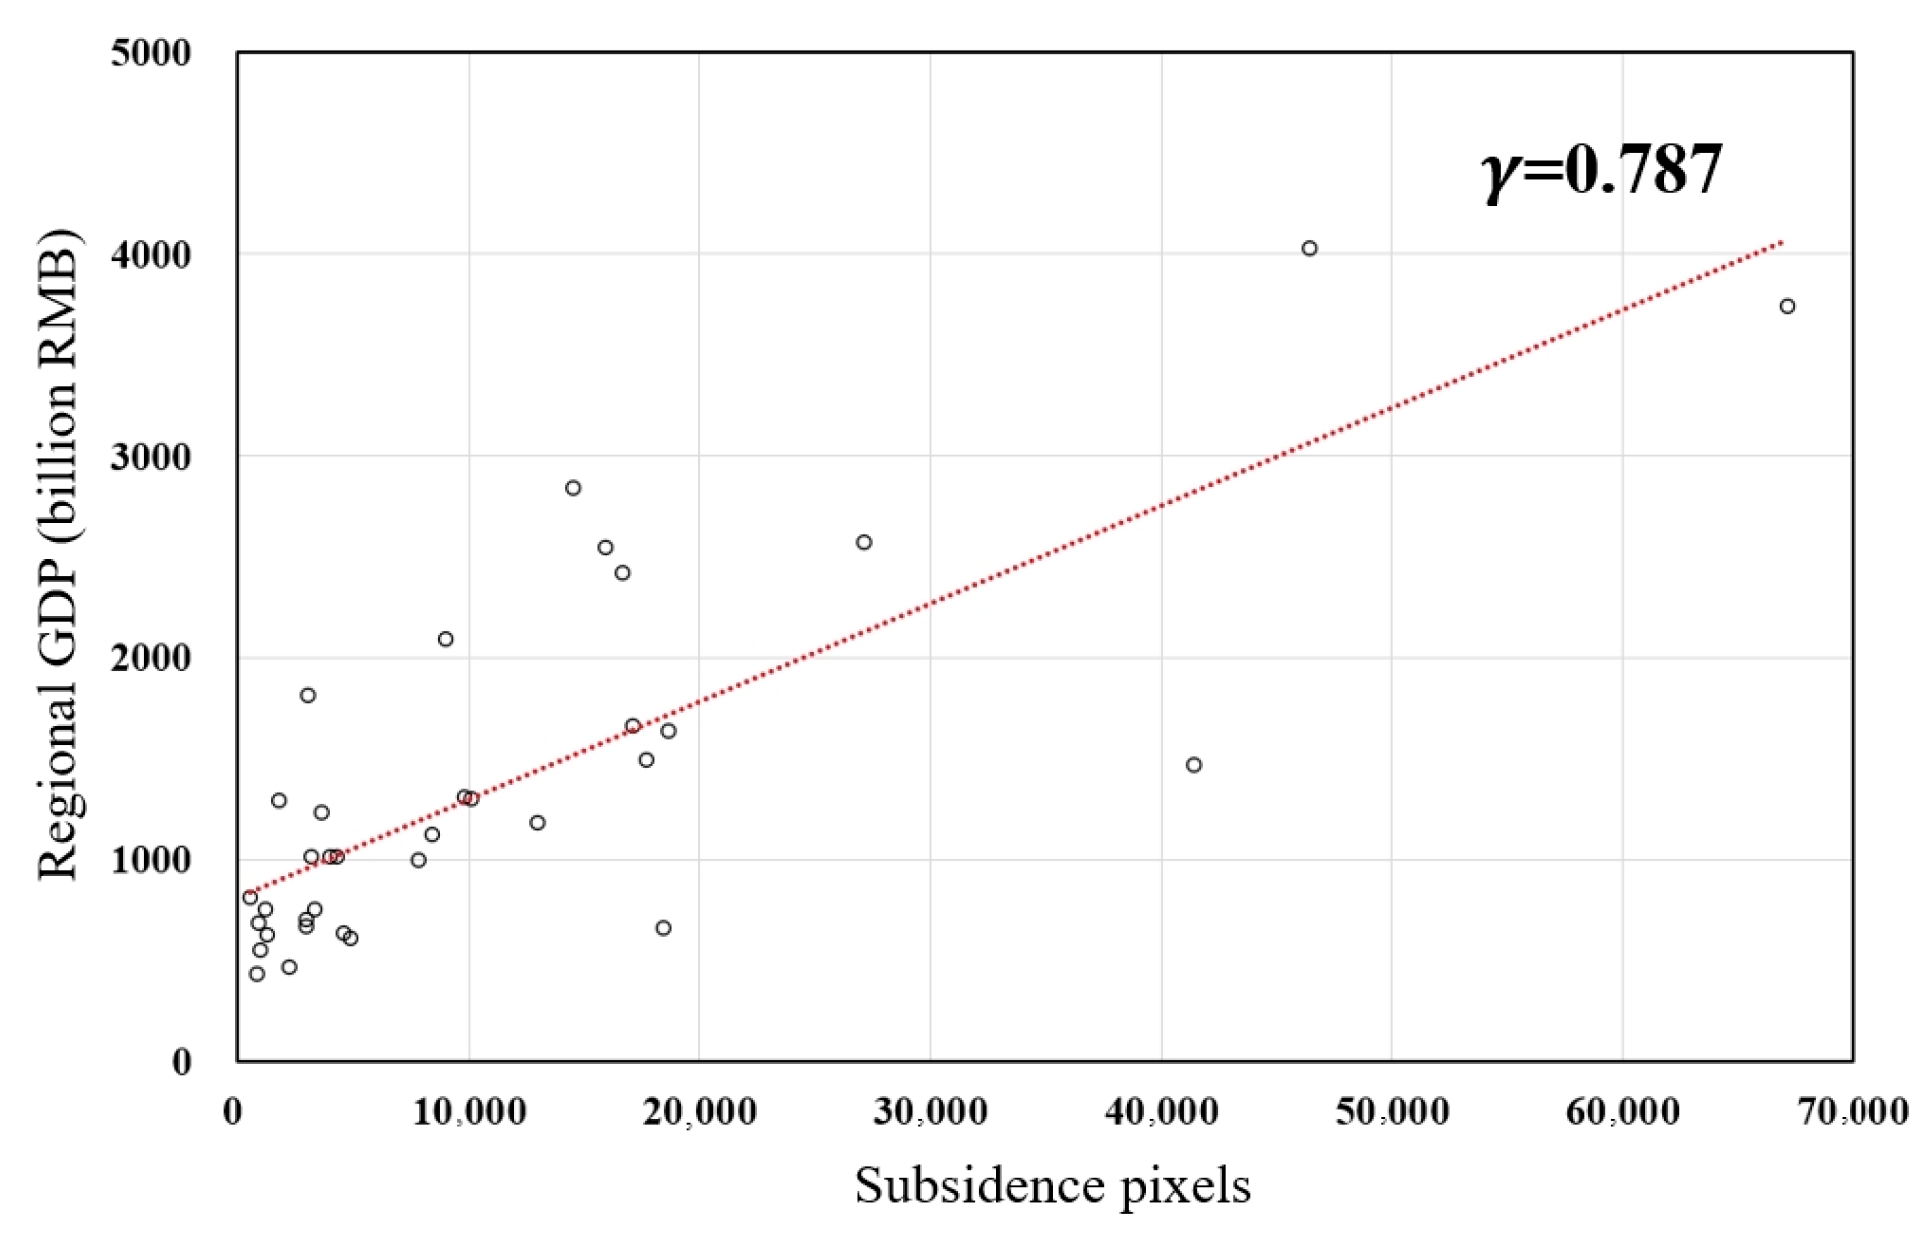
| No. | City | Subsidence Area | Regional GDP (Billion RMB) | No. | City | Subsidence Area | Regional GDP (Billion RMB) | ||
|---|---|---|---|---|---|---|---|---|---|
| Percentage | Pixel Count | Percentage | Pixel Count | ||||||
| 1 | Beijing | 3.56 | 67,186 | 3743.02 | 19 | Hefei | 0.94 | 4291 | 1014.08 |
| 2 | Shanghai | 2.84 | 46,444 | 4025.37 | 20 | Kunming | 5.09 | 18453 | 663.61 |
| 3 | Guangzhou | 2.36 | 27,160 | 2571.56 | 21 | Nanchang | 0.37 | 1276 | 629.89 |
| 4 | Shenzhen | 1.56 | 14,518 | 2837.44 | 22 | Nanning | 0.84 | 2227 | 471.98 |
| 5 | Chengdu | 0.29 | 3020 | 1816.13 | 23 | Foshan | 2.78 | 8430 | 1127.17 |
| 6 | Hangzhou | 1.52 | 18,660 | 1637.01 | 24 | Shenyang | 0.24 | 910 | 685.59 |
| 7 | Wuhan | 1.76 | 17,093 | 1665.39 | 25 | Wuxi | 0.64 | 1806 | 1290.31 |
| 8 | Nanjing | 1.76 | 17,672 | 1498.64 | 26 | Fuzhou | 1.38 | 3983 | 1018.04 |
| 9 | Chongqing | 1.77 | 15,926 | 2548.85 | 27 | Changchun | 0.94 | 2989 | 671.31 |
| 10 | Qingdao | 1.23 | 10,130 | 1304.01 | 28 | Xiamen | 2.20 | 4567 | 640.14 |
| 11 | Tianjin | 5.83 | 41,421 | 1468.46 | 29 | Jinan | 1.52 | 3160 | 1018.01 |
| 12 | Xi’an | 1.17 | 7793 | 1000.32 | 30 | Harbin | 0.43 | 942 | 551.51 |
| 13 | Suzhou | 1.84 | 8978 | 2093.61 | 31 | Guiyang | 0.48 | 807 | 435.64 |
| 14 | Hongkong | 1.48 | 16,701 | 2422.68 | 32 | Shijiazhuang | 2.63 | 4902 | 614.22 |
| 15 | Zhengzhou | 2.63 | 12,962 | 1187.24 | 33 | Xuzhou | 0.71 | 1155 | 756.03 |
| 16 | Dalian | 0.61 | 3348 | 759.15 | 34 | Changzhou | 0.44 | 557 | 812.28 |
| 17 | Changsha | 0.85 | 3649 | 1239.14 | 35 | Wenzhou | 2.41 | 2974 | 701.96 |
| 18 | Ningbo | 2.36 | 9822 | 1308.78 | |||||
Disclaimer/Publisher’s Note: The statements, opinions and data contained in all publications are solely those of the individual author(s) and contributor(s) and not of MDPI and/or the editor(s). MDPI and/or the editor(s) disclaim responsibility for any injury to people or property resulting from any ideas, methods, instructions or products referred to in the content. |
© 2024 by the authors. Licensee MDPI, Basel, Switzerland. This article is an open access article distributed under the terms and conditions of the Creative Commons Attribution (CC BY) license (https://creativecommons.org/licenses/by/4.0/).
Share and Cite
Wang, S.; Chen, Z.; Zhang, G.; Xu, Z.; Liu, Y.; Yuan, Y. Overview and Analysis of Ground Subsidence along China’s Urban Subway Network Based on Synthetic Aperture Radar Interferometry. Remote Sens. 2024, 16, 1548. https://doi.org/10.3390/rs16091548
Wang S, Chen Z, Zhang G, Xu Z, Liu Y, Yuan Y. Overview and Analysis of Ground Subsidence along China’s Urban Subway Network Based on Synthetic Aperture Radar Interferometry. Remote Sensing. 2024; 16(9):1548. https://doi.org/10.3390/rs16091548
Chicago/Turabian StyleWang, Shunyao, Zhenwei Chen, Guo Zhang, Zixing Xu, Yutao Liu, and Yuan Yuan. 2024. "Overview and Analysis of Ground Subsidence along China’s Urban Subway Network Based on Synthetic Aperture Radar Interferometry" Remote Sensing 16, no. 9: 1548. https://doi.org/10.3390/rs16091548