Article

Landcover Change Amidst Climate Change in the Lake Tana Basin (Ethiopia): Insights from 37 Years of Earth Observation on Landcover–Rainfall Interactions

by
Sullivan Tsay Fofang
1,
Erasto Benedict Mukama
1,2,
Anwar Assefa Adem
3,4 and
Stefaan Dondeyne
1,5,6,7,*
1
Department of Water and Climate, Vrije Universiteit Brussel (VUB), 1050 Brussels, Belgium
2
Department of Civil and Water Resources Engineering, Sokoine University of Agriculture, Morogoro P.O. Box 3003, Tanzania
3
Department of Natural Resources Management, Bahir Dar University, Bahir Dar P.O. Box 79, Ethiopia
4
Cooperative Agricultural Research Center, College of Agriculture and Human Sciences, Prairie View A&M University, Prairie View, TX 77446, USA
5
Department of Geography, Ghent University, 9000 Ghent, Belgium
6
Gembloux Agro-Bio Tech, Université de Liège, 5030 Gembloux, Belgium
7
Department of Soil Science and Land Resources, Universitas Padjadjaran, Bandung 45363, Indonesia
*
Author to whom correspondence should be addressed.
Remote Sens. 2025, 17(5), 747; https://doi.org/10.3390/rs17050747
Submission received: 4 November 2024 / Revised: 24 January 2025 / Accepted: 5 February 2025 / Published: 21 February 2025
(This article belongs to the Section Biogeosciences Remote Sensing)

Abstract

:
Land use/landcover (LULC) changes and climate variability impact soil erosion; however, their combined long-term effects are poorly studied. Using remote sensing data, this study investigates changes in LULC and rainfall from 1985 to 2022 and their implications for soil erosion in the Lake Tana Basin, Ethiopia. The Global Land Cover Fine Classification System (GLC_FCS30D) data were used to analyze LULC changes; Climate Hazards Group InfraRed Precipitation with Station data (CHIRPS-v2) were used to assess rainfall trends; and the RUSLE was used to estimate potential soil erosion. The GLC_FCS30D proved to have an overall accuracy of 77.3% for 2005, 80.2% for 2014, and 80.3% for 2022. The cropland area increased slightly, from 32.9% to 33.3%, while tree cover initially decreased from 31.2% to 27.8% before recovering to 29.9%. Overall, annual rainfall increased by 2.92 mm yr−1, though it exhibited strong spatial variability, and rainfall erosivity rose by 1.25 MJ mm ha−1 h−1 yr−1. Despite seemingly modest changes in landcover and rainfall, the combined effect on potential soil erosion was substantial. Potential soil loss in the Lake Tana Basin showed significant spatial and temporal variation, with a slight increase of 0.9% from 1985 to 1995, followed by a slight decrease of 0.12% from 1995 to 2005, and a more substantial decrease of 2.3% from 2005 to 2015 before a notable increase of 8.2% occurred from 2015 to 2022. By elucidating the intricate interactions between landcover changes and rainfall variability, this study enhances our understanding of landscape dynamics in the Lake Tana Basin. The findings highlight the importance of considering the interaction between rainfall and landcover changes in climate change studies, as well as when targeting soil conservation efforts and promoting sustainable land management and ecosystem resilience in the tropics.

1. Introduction

Land use/landcover (LULC) changes and climate variability are significant factors influencing environmental processes globally, with profound implications for soil erosion; they govern landscape dynamics and ecosystem functioning and can result in land degradation, threatening agricultural productivity and water quality [1,2]. Understanding the interplay between LULC changes, climate variability, and soil erosion is crucial for sustainable land management and food security in agriculture-dependent regions like the Ethiopian Highlands.
The Lake Tana Basin in North-western Ethiopia exemplifies the environmental challenges in tropical Africa. As the largest lake in Ethiopia and a UNESCO-recognized biosphere reserve, Lake Tana and its surrounding basin play a vital role in the region’s hydrology, ecology, and economy [3]. The basin features a diverse landscape, from flat plains to rugged highlands, and has undergone significant LULC changes in recent decades due to population growth, agricultural expansion, and urbanization [4]. Climate change has further compounded these challenges, leading to increased average temperatures and altered rainfall patterns that result in more frequent and severe droughts and floods [5]. Rainfall in Ethiopia is highly variable and increasingly erratic, leading to intense rainfall periods that heighten soil erosion risks, particularly in rain-fed agricultural areas. Climate change’s effects, such as delayed rainfall onset and early cessation, exacerbate these risks by leaving soil exposed to erosion during heavy rains [6,7].
Previous studies have assessed the impacts of land use and landcover (LULC) changes on soil erosion in various parts of Ethiopia. For example, the SWAT model has been used to identify erosion hotspots in the Lake Tana Basin, revealing areas where average soil erosion could reach 50–169 Mg ha−1 yr−1 [8]. Earlier research has also already pointed to the implications of population growth and LULC on runoff and soil erosion and concluded that cropland expansion into steep, erosion-prone areas has led to severe soil degradation, further exacerbated by deforestation [9].
Past research on climate change and LULC changes in the Lake Tana Basin has primarily relied on modeling approaches to assess impacts on hydrology, water quality, and groundwater resources rather than directly analyzing observed changes [10]. A consistent trend in the findings shows an increase in surface water runoff attributed to deforestation and urban expansion [11,12,13]. Additionally, LULC changes have been strongly correlated with degraded water quality [12,14], highlighting the environmental consequences of anthropogenic pressures on the basin.
The most commonly used models—SWAT, MODFLOW-NWT, and multivariate regression—simulate hydrological responses and predict future scenarios under localized land use/landcover and climate change conditions [10,12,13,14]. These studies primarily rely on landcover data derived from remote sensing products, such as Landsat imagery, often with limited or no validation of landcover classification accuracy. Climate data are typically sourced from local station records, with little transparency regarding spatial interpolation methods. For future climate projections [13,15,16], regional outputs from general circulation models (GCMs) are commonly used.
In contrast to previous research, our study focuses on the actual changes in land use/landcover (LULC) and rainfall patterns rather than modeling their potential impacts. Based on this analysis, we evaluate how interactions between LULC changes and rainfall patterns may influence the basin. A further novel aspect of our research is the use of standardized global datasets. For landcover data, we conducted a comprehensive accuracy assessment using original ground-truth data, while for rainfall data, we relied on datasets validated through multiple processes. In doing so, this research addresses the following questions: (1) How has LULC changed in the Lake Tana Basin from 1985 to 2022? (2) What are the patterns and trends of annual rainfall and rainfall erosivity from 1985 to 2022 in the Lake Tana Basin? (3) How have interactions between changes in LULC and rainfall affected potential soil erosion in the Lake Tana Basin?
By elucidating the links between human activities, as assessed through LULC changes, and variations in rainfall patterns in an erosion-prone landscape, this research provides insights relevant to studying landscape dynamics and ecosystem functioning.

2. Materials and Methods

2.1. Study Area

The Lake Tana Basin in North-western Ethiopia is the country’s largest lake and forms the source of the Blue Nile River (Figure 1). Covering 15,321 km2, landforms vary from alluvial plains around Lake Tana at about 1786 m above sea level to volcanoes exceeding 4000 m (Figure 1). The basin’s diverse topography, with volcanic soil, extensive drainage network, and tectonic influences, makes the area particularly vulnerable to soil erosion [17,18].
The area has a tropical highland climate with significant seasonal variations in temperature and precipitation. Annual rainfall ranges from 1200 mm in the lowest parts to over 1800 mm in the highlands [19]. The major rainy season lasts from June to September and accounts for most of the annual rainfall, while the dry season spans from October to February [20]. Mean annual temperatures range from 16 °C to 20 °C, depending on the altitude.
Figure 1. Location and topography of the Lake Tana Basin in North-western Ethiopian (author’s map), based on Shuttle Radar Topography Mission [21].
Remotesensing 17 00747 g001

2.2. Landcover Change

We used the Global Landcover Fine Classification System, the first global fine landcover product at 30 m resolution with continuous change detection capabilities, covering 1985 to 2022 and featuring 35 landcover categories [22]. The landcover maps for 1985, 1995, 2005, 2014, 2015, and 2022 were reclassified into eight categories: cropland, tree cover, shrubland, grassland, bare land, wetland, impervious surfaces, and water body.
The accuracy of the landcover data was assessed based on 378 ground reference points recorded in 2014 during previous fieldwork by Bahir Dar University. The landcover of the same points was also assessed for the years 2005 and 2022 based on detailed satellite images accessed through Google Earth and relying on two of the authors’ familiarity with the area. We compared the classified images with the reference images using a contingency table (confusion matrix) and calculated the overall accuracy, producer accuracy, user accuracy, and the Kappa coefficient from the error matrix for each year [23,24]. The overall accuracy measures the percentage of correctly classified points out of the total reference points. Producer accuracy evaluates how well actual landcover types are identified, while user accuracy reflects the reliability of the classification. The Kappa coefficient accounts for chance agreement, with values closer to 1 indicating strong agreement and values below 0.40 suggesting poor performance. Together, these metrics provide a comprehensive assessment of classification accuracy.
The intensity analysis [25,26] was used to quantitatively analyze landcover change dynamics by highlighting the differences and patterns of gains and losses for each landcover class. Uniform intensity refers to hypothetical change intensity if the overall change during a time interval is evenly distributed [25]. The analysis covered four intervals (1985–1995, 1995–2005, 2005–2015, and 2015–2022) as well as the entire period (1985–2022) and was conducted at three levels: the interval, category, and transition level. The “OpenLand” package [27] in the R programming environment [28] was used to perform the analysis. The three levels of the intensity analysis—the interval, category, and transition levels—provide a structured approach to understanding landcover change dynamics. The interval level assesses the overall intensity of landcover change across different periods, comparing observed changes to a uniform distribution to determine if certain intervals experience faster or slower change. At the category level, the analysis focuses on the gains and losses of individual landcover classes, identifying which categories exhibit disproportionate change. The transition level examines how landcover shifts between categories, highlighting dominant transitions and where changes are most concentrated. Together, these levels offer a comprehensive view of landcover dynamics, revealing patterns and trends that simpler methods might overlook.

2.3. Rainfall Trend

The spatio-temporal variability of precipitation was analyzed using the Climate Hazards Group InfraRed Precipitation with Station data (CHIRPS-v2). CHIRPS provides quasi-global coverage (50°S–50°N) at a spatial resolution of 0.05° (ca. 5 km) and offers data from 1981 to the near-present at daily, 5-day, 10-day, and monthly intervals [29]. This dataset has repeatedly been validated in eastern Africa and shows limited spatial biases [30,31,32]. We utilized CHIRPS data spanning 37 years (1985–2022) to analyze monthly, seasonal, and annual rainfall patterns.
The nonparametric Mann–Kendall (MK) trend test [33,34] was used to identify long-term rainfall trends in the Lake Tana Basin. To address serial autocorrelation in hydro-climate data, we applied the trend-free pre-whitening (TFPW) method [35]. We conducted a pixel-based analysis of annual rainfall trends using the “ZYP” R package [36]. The analysis was performed at a significance level of α = 0.05, with trend significance assessed by the Mann–Kendall test statistic Z. To quantify the magnitude of detected trends, we employed the Theil-Sen Slope Estimator [37,38].

2.4. Potential Soil Erosion

The most commonly used rainfall erosivity indexes are the R-factors of the Universal Soil Loss Equation [39] and the Revised Universal Soil Loss Equation [40]. However, these R-factors require data on rainfall intensity and kinetic energy, which are often unavailable. The Modified Fournier Index (MFI) [41], which relies on monthly and annual rainfall data, has been proposed to estimate the R-factor [42], and it has been shown to represent the spatial variability of erosivity in Africa accurately [43]. To account for unique climatic and geographical conditions influencing rainfall erosivity in the Lake Tana Basin, we used a regression equation tailored for Eastern Africa based on the MFI and using CHIRPS data as follows [44]:
R = 27.8   M F I 189.2
Here, R is the rainfall erosivity factor (MJ mm ha−1h−1yr−1), and MFI is the Modified Fournier Index (mm).
The MFI is calculated as follows:
M F I = i = 1 12 p i 2 P
Here, pi is the average monthly precipitation (mm), and P is the average annual precipitation (mm). Equation (1) [44] integrates station-based data with satellite rainfall estimates for East Africa, including the study area. This method was applied to rainfall data spanning 1985 to 2022.
The relative potential soil loss over different periods was assessed using the Revised Universal Soil Loss Equation (RUSLE) [40]. This model estimates annual soil loss (A) in t ha−1yr−1 caused by rill and inter-rill erosion, considering the following factors: rainfall erosivity (R), soil erodibility (K), topography (LS), cover management (C), and support practices (P). The RUSLE is expressed as follows:
A = R × K × L S × C × P  
As the analysis focused on the interaction of temporal variations in landcover (C) and rainfall erosivity (R), the factors for soil erodibility (K), topography (LS), and support practices (P) were assumed to remain constant.
C-factor values were assigned for each of the landcover classes (Table A1, in Appendix A) following syntheses reported in the literature on the Lake Tana Basin [45,46]. This approach aligns with previous studies in Ethiopia [20,44,47].
The combined effect of changes in landcover and rainfall intensity between time steps t1 and t2 on the potential soil erosion was assessed in relative terms using the following equations:
A t 2 A t 1 = R t 2 × K × L S × C t 2 × P R t 1 × K × L S × C t 1 × P
Since K, LS, and P are assumed to be constant over time, they cancel out the following:
A t 2 A t 1 = R t 2   × C t 2   R t 1 × C t 1  
The relative potential soil loss ΔA, between time steps t1 and t2, can be calculated as follows:
A   ( % ) = A t 2 A t 1 A t 1 × 100 = A t 2 A t 1 1 × 100
Substituting Equation (5) into Equation (6), the annual relative potential soil loss (ΔAt) can then be calculated as follows:
Δ A Δ t %   y e a r 1 = R t 2 × C t 2 R t 1 × C t 1 1 × 100 ( t 2 t 1 )

3. Results

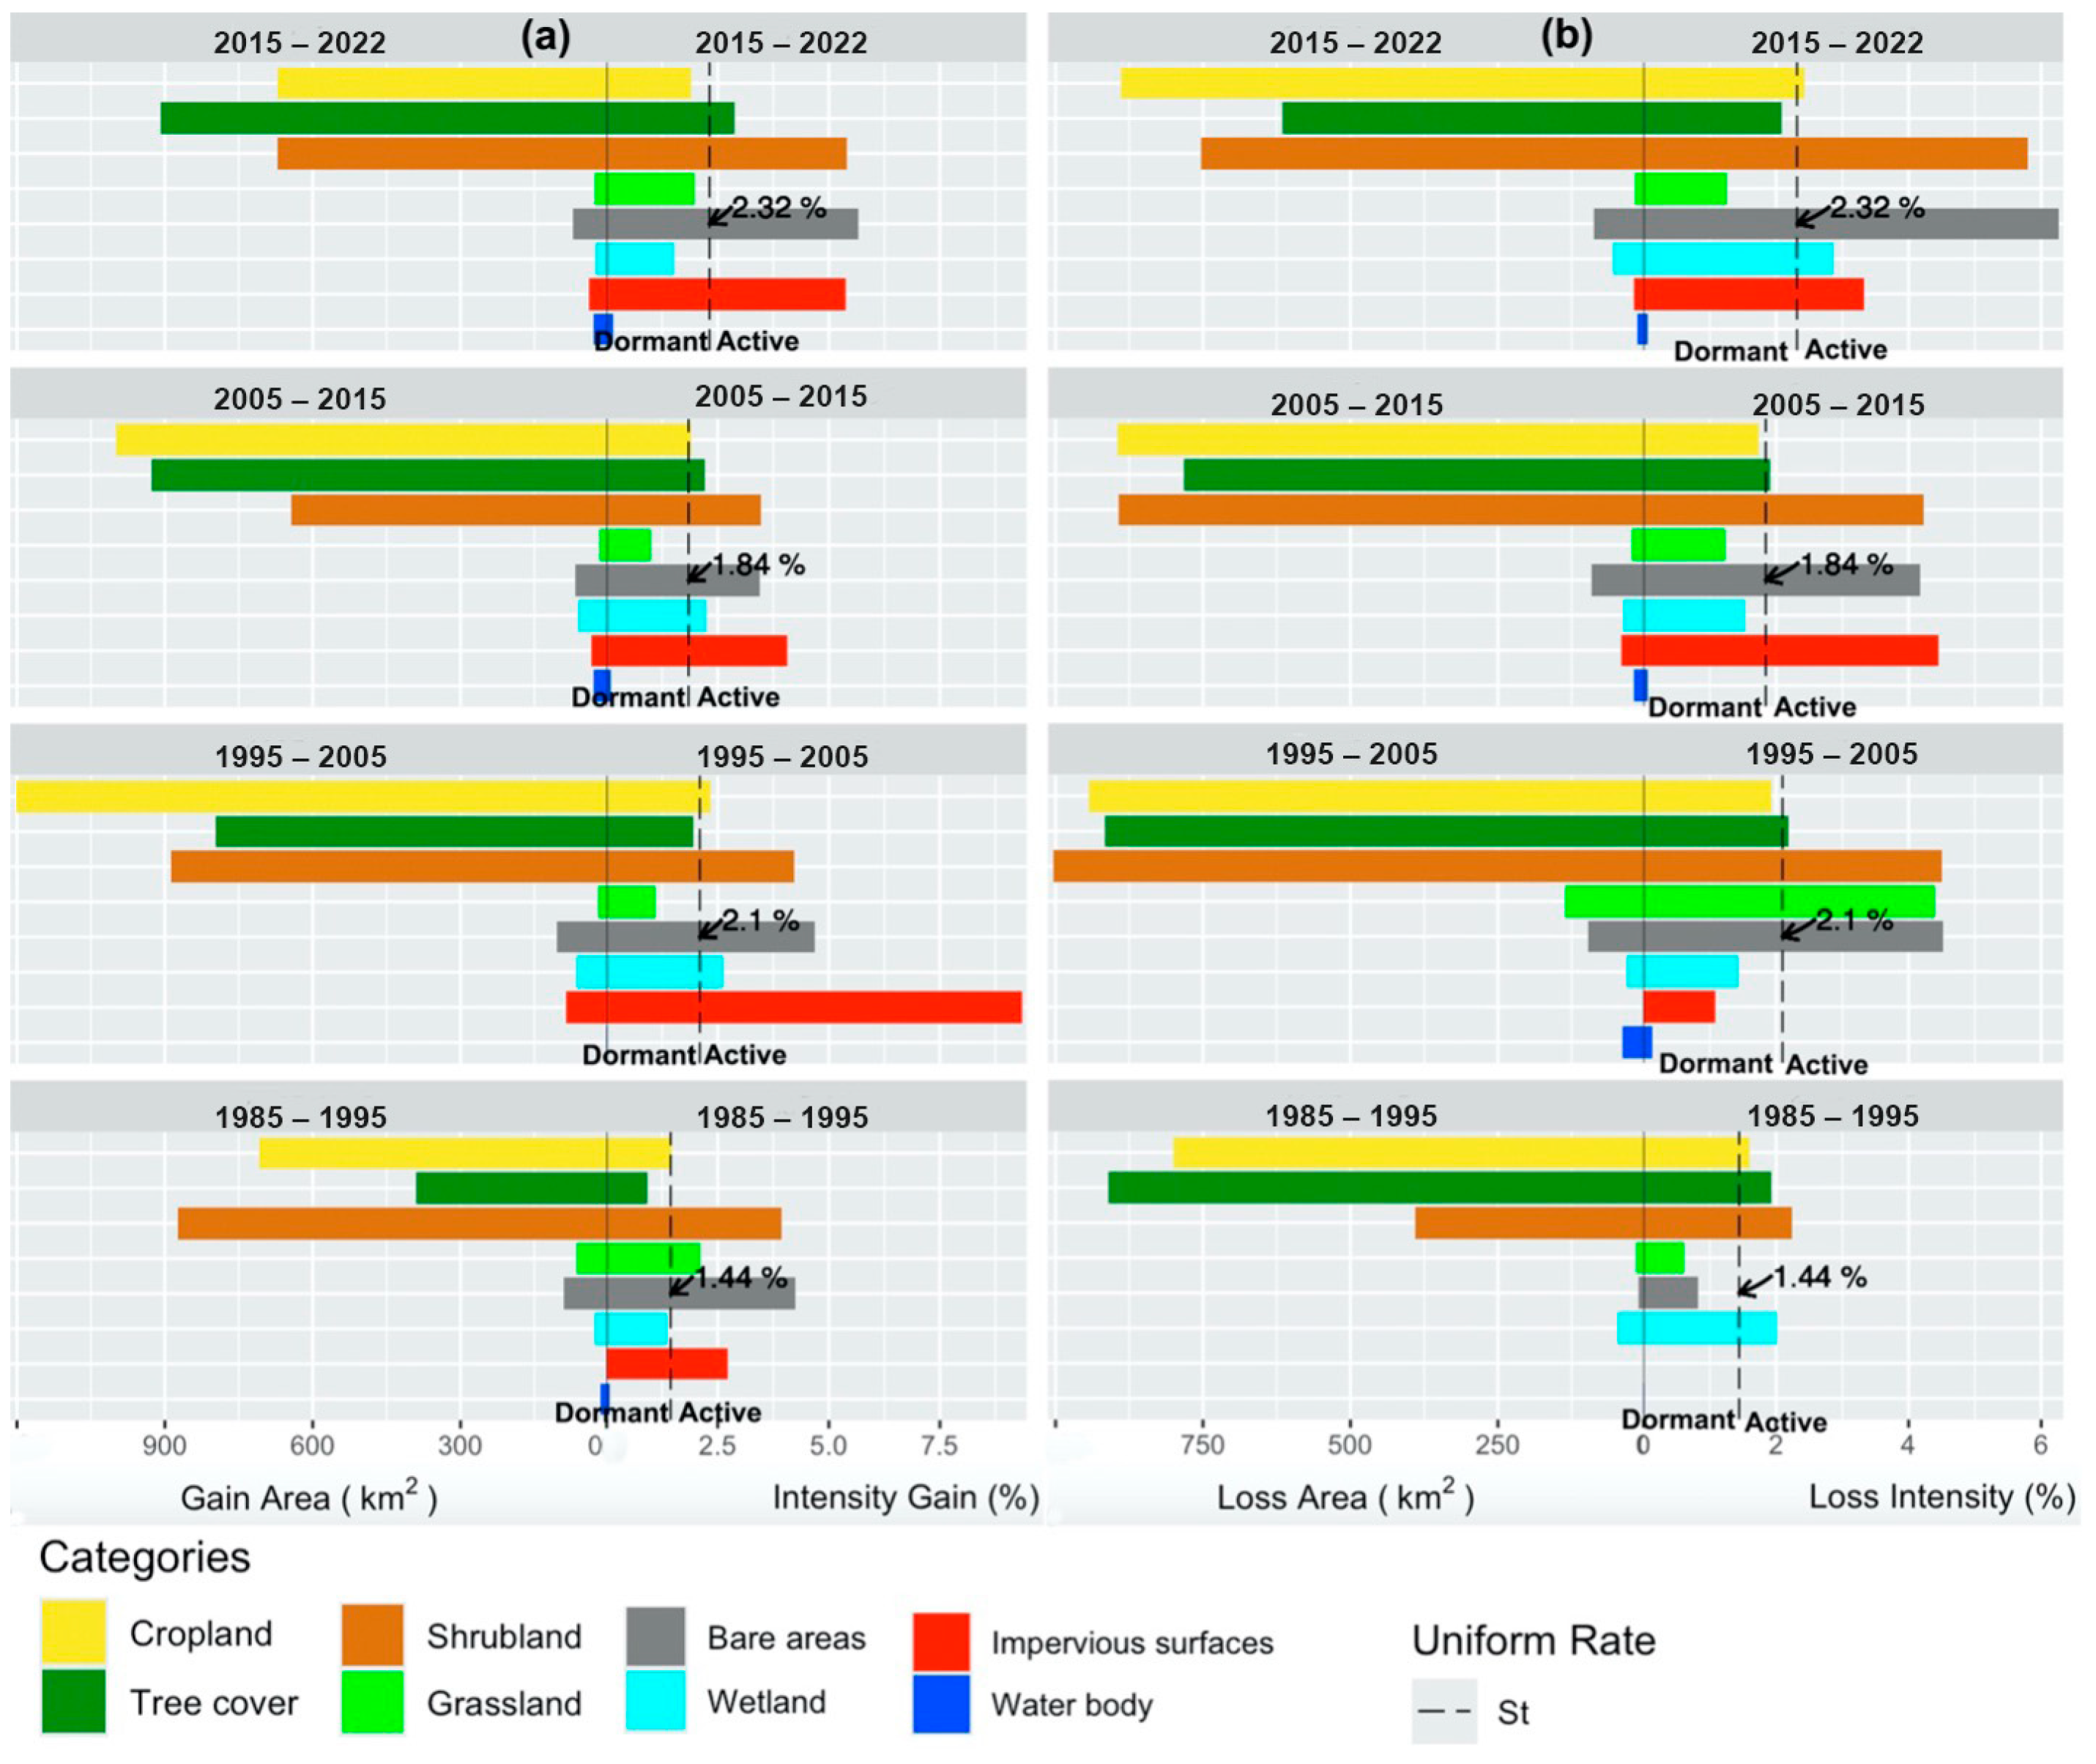
3.1. Landcover Changes

The accuracy of the Global Landcover Fine Classification System [22] for the Lake Tana Basin is presented in Table 1. The overall accuracy of the LULC classification ranged from 77.3% to 80.3%, indicating a good level of agreement between the classified images and ground truth data. The Kappa coefficients, ranging from 0.69 to 0.74, suggest substantial agreement beyond chance. The user’s and producer’s accuracies varied among LULC classes (Table A2, Appendix A). Cropland, the dominant landcover class, showed high accuracies across all years (user’s accuracy: 75.0–97.5%; producer’s accuracy: 70.8–89.7%). Tree cover also demonstrated good accuracy (user’s accuracy: 58.7–87.0%; producer’s accuracy: 83.6–90.7%). Classes such as bare areas and grasslands showed lower accuracies, likely due to spectral similarities with other classes.
The changes in landcover between 1985 and 2022 in the Lake Tana Basin are shown in Figure 2. Cropland remained the dominant landcover type throughout the study period. It increased only slightly from 32.9% in 1985 to 33.3% in 2022. However, this trend was not linear; the cropland area first decreased to 32.3% in 1995 before peaking at 34.7% in 2015.
Tree cover displayed notable fluctuations over the study period. It decreased from 31.2% in 1985 to 27.8% in 1995, followed by a gradual recovery to 29.9% by 2022. This trend suggests initial deforestation followed by reforestation or natural regeneration in later years. Shrubland areas increased significantly from 11.5% in 1985 to 14.7% in 1995 but subsequently decreased to 11.8% by 2022. Grassland showed minor fluctuations, increasing from 1.7% in 1985 to 2.04% in 1995, and then decreasing to 1.3% by 2022. Areas with bare land increased from 0.89% in 1985 to 1.4% in 1995, remained stable until 2005, and then decreased to 1.2% by 2022. Wetland areas fluctuated, decreasing slightly from 1.5% in 1985 to 1.4% in 1995, increasing to 1.6% by 2005 and then decreasing to 1.2% by 2022. The most substantial increase was observed in impervious surfaces, which grew from 0.03% in 1985 to 0.7% in 2022, indicating significant urban expansion. Water-body areas remained relatively stable throughout the study period.
The intensity analysis revealed varying rates of change across different time intervals, as illustrated in Figure 3.
Two periods stand out for their rapid landcover changes exceeding the uniform rate of 1.89% (Figure 3). The first period is between 1995 and 2005, and the second is the most recent period (2015–2022). At the category level (Figure A1, Appendix A), impervious surfaces consistently showed the highest intensity gain across all time intervals. Cropland and tree cover often showed dormant intensity despite large absolute area changes. Transition level analysis (Figure A2, Appendix A) indicated that tree cover gains primarily occurred at the expense of cropland and shrubland across all time intervals. The intensity of the transition from shrubland to tree cover showed a consistent increase over time, peaking at 3.4% in 2015–2022. Cropland loss primarily benefited shrubland, bare areas, and impervious surfaces. The transition from cropland to impervious surfaces intensified later, with rates rising from 0.1% in 1985–1995 to 3.2% in 2015–2022.

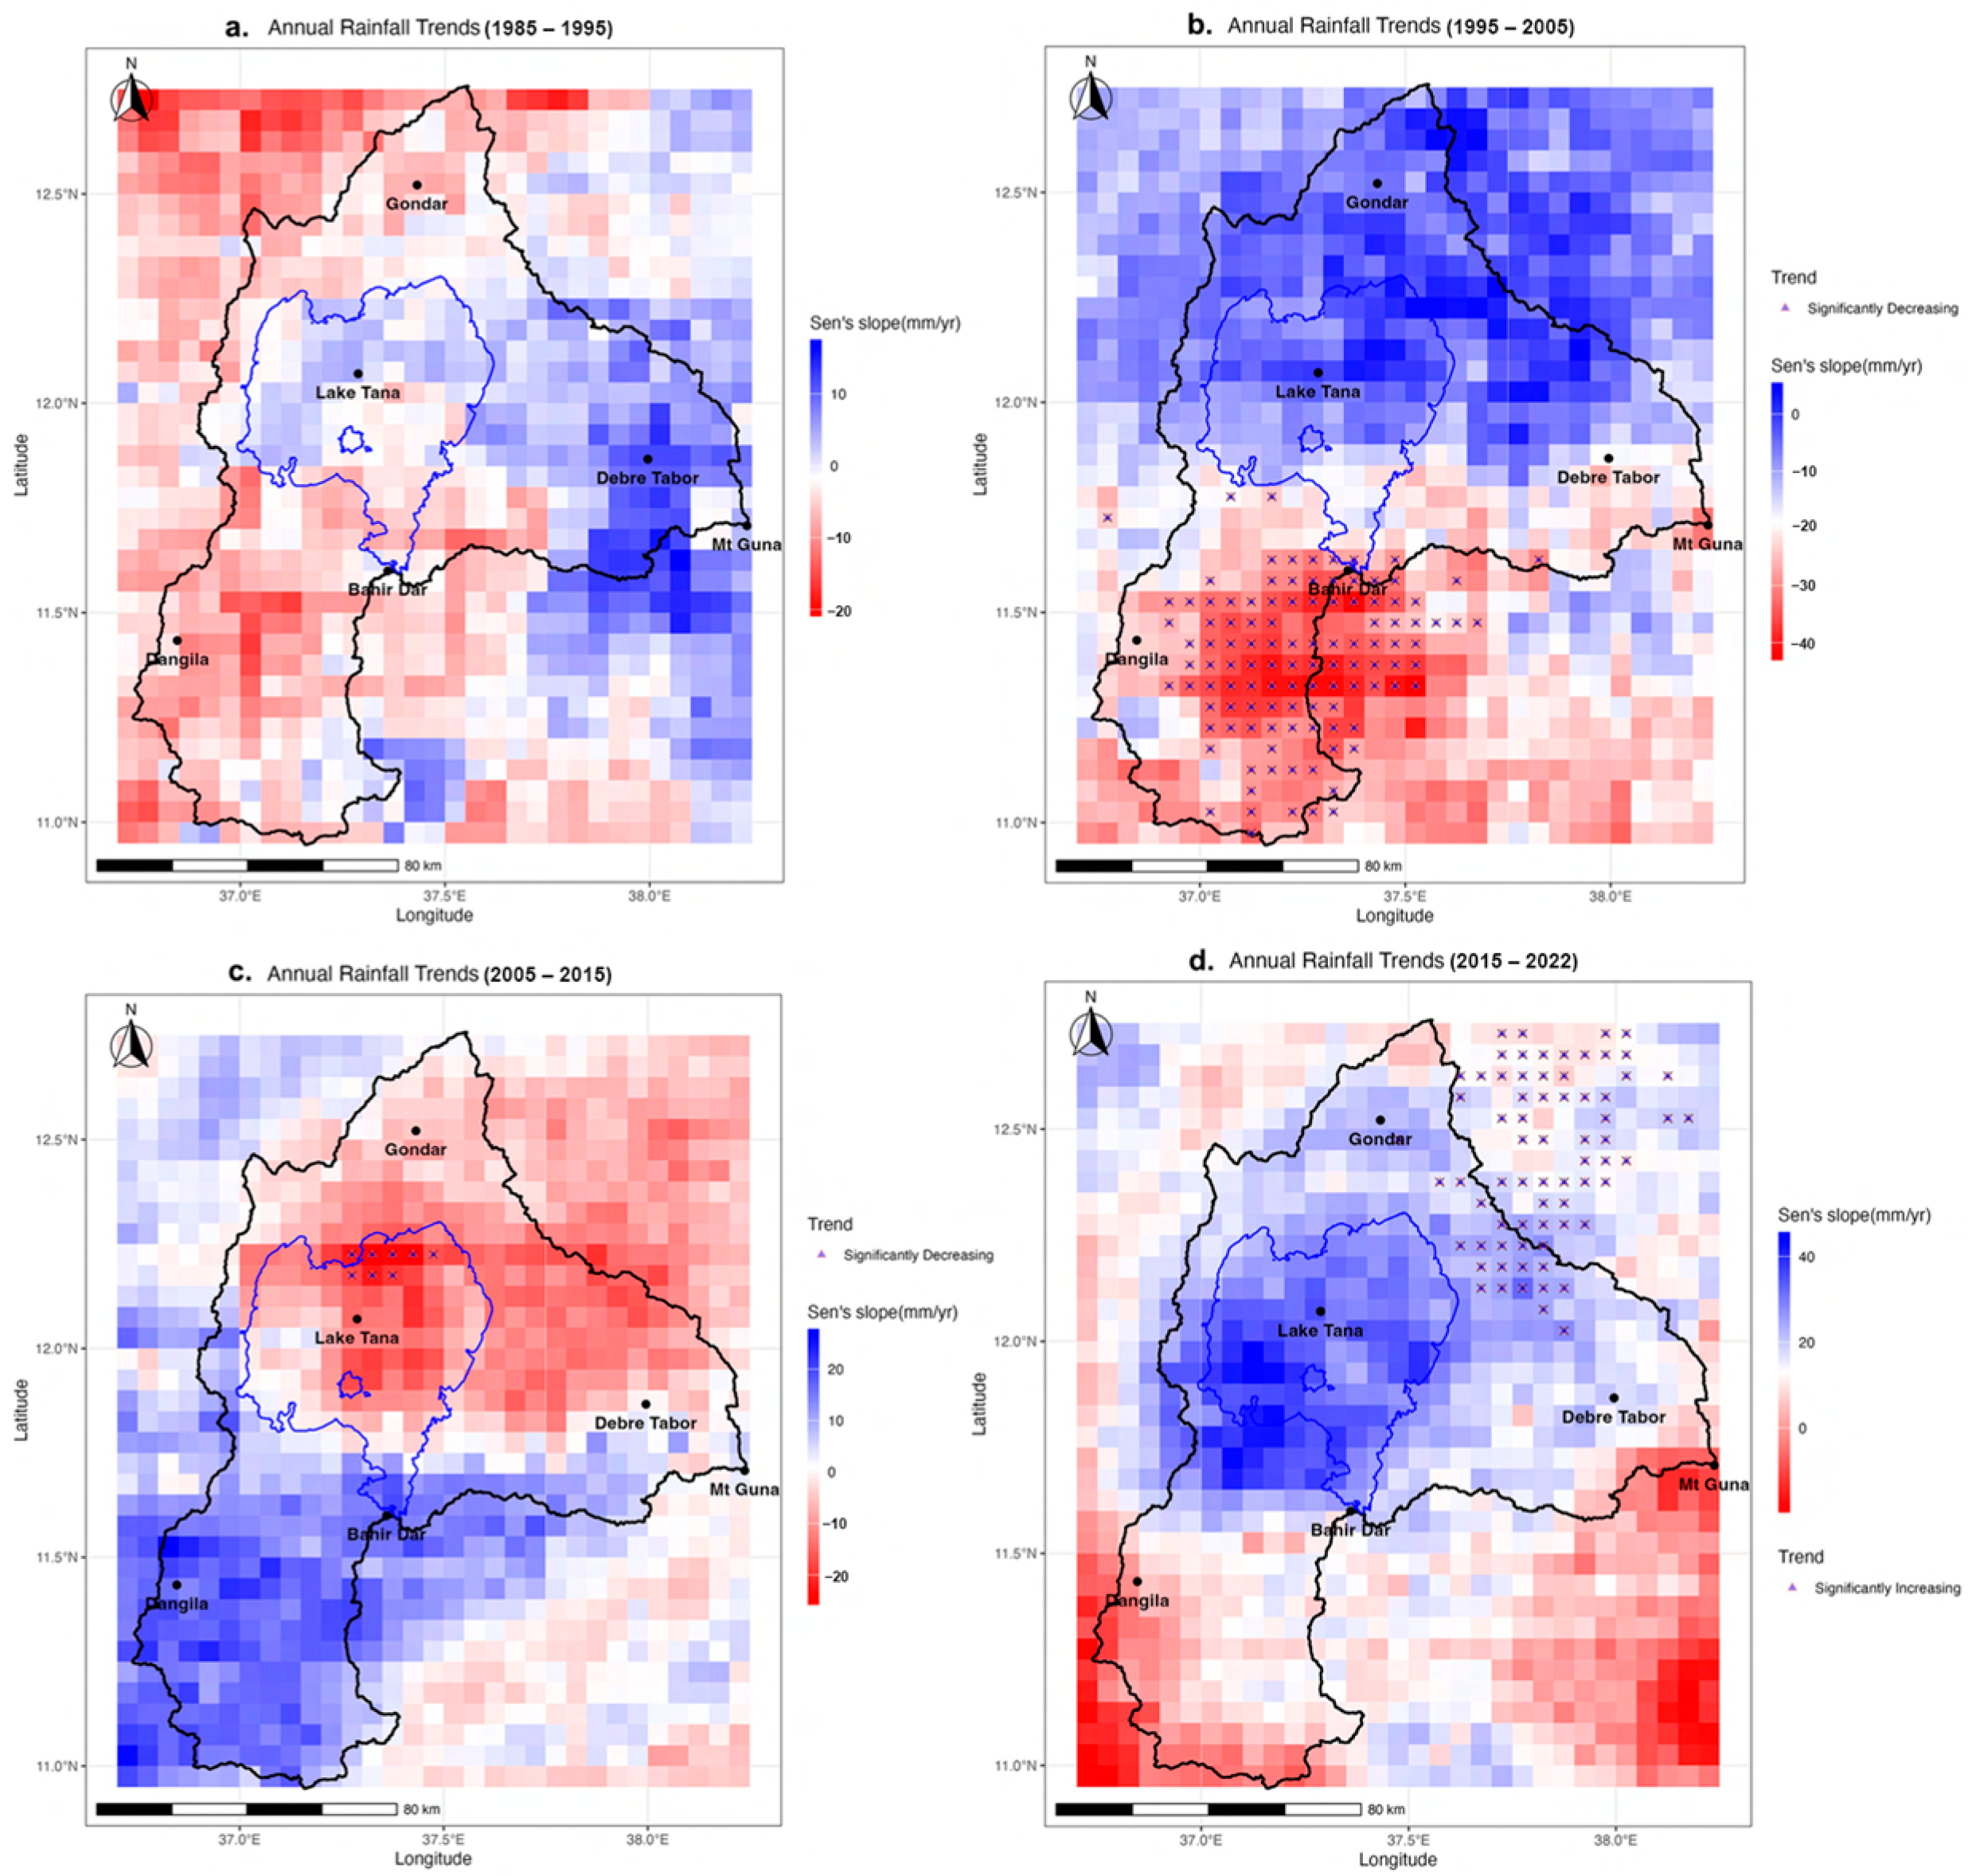
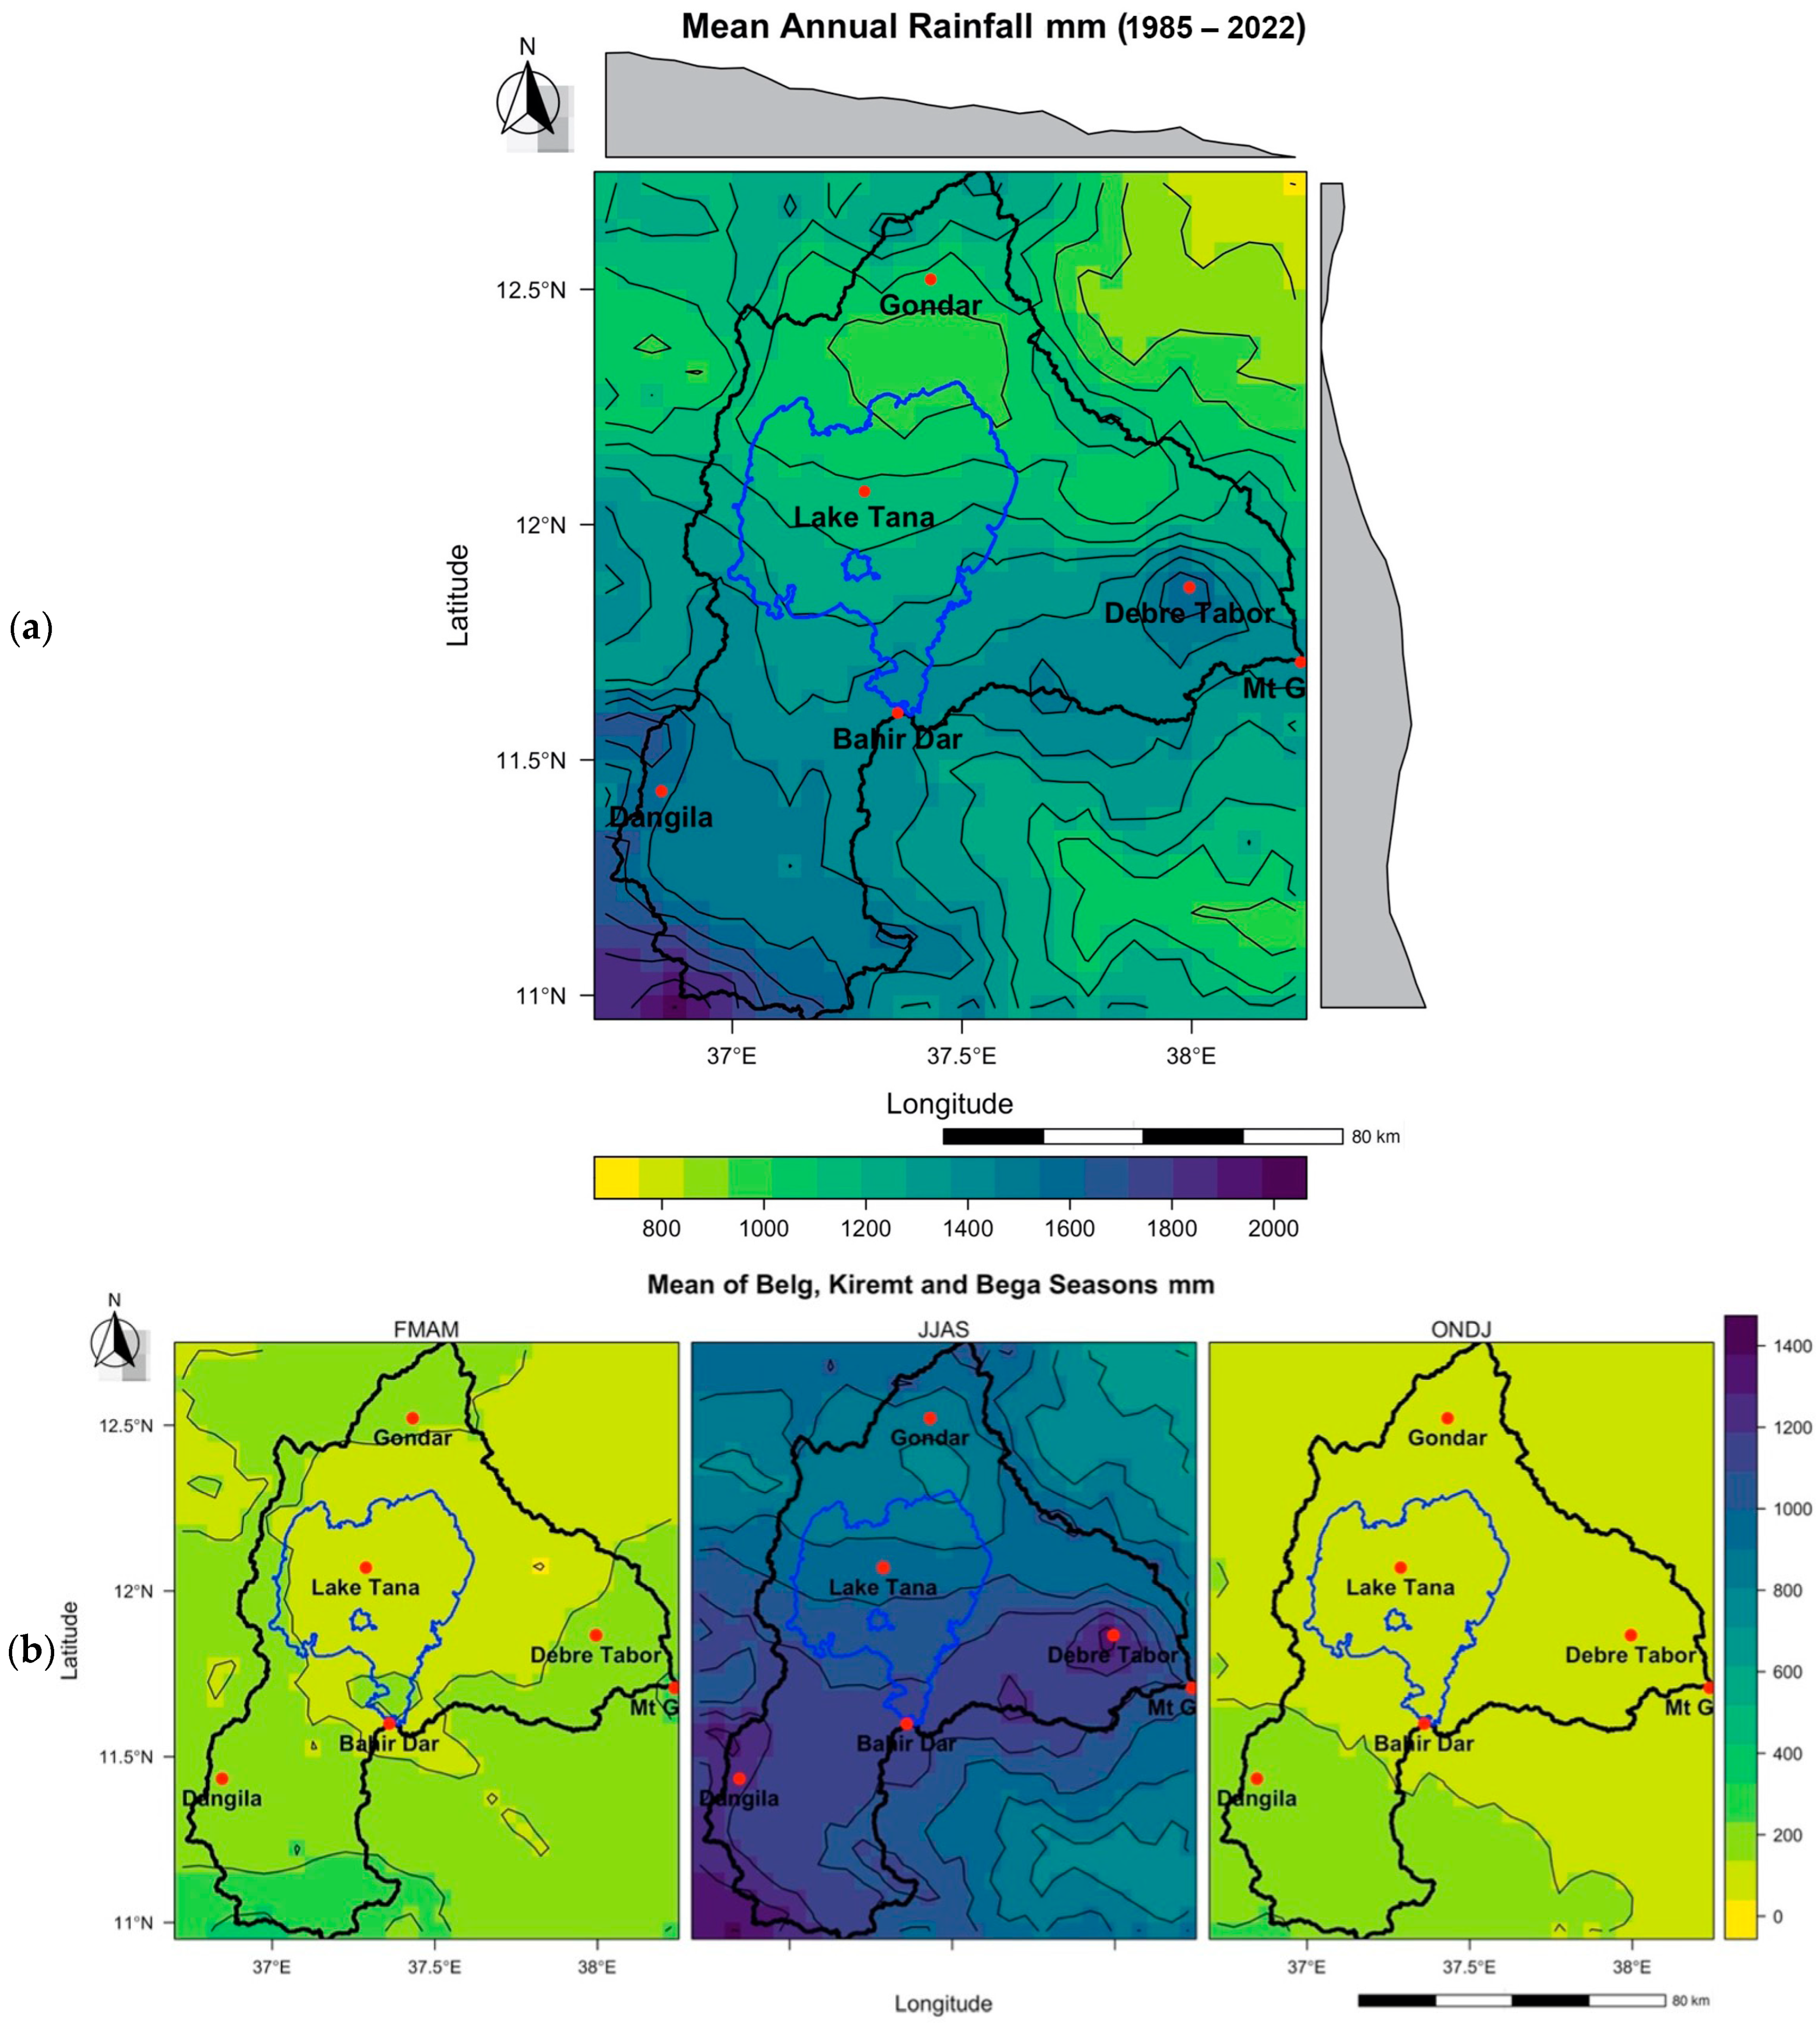
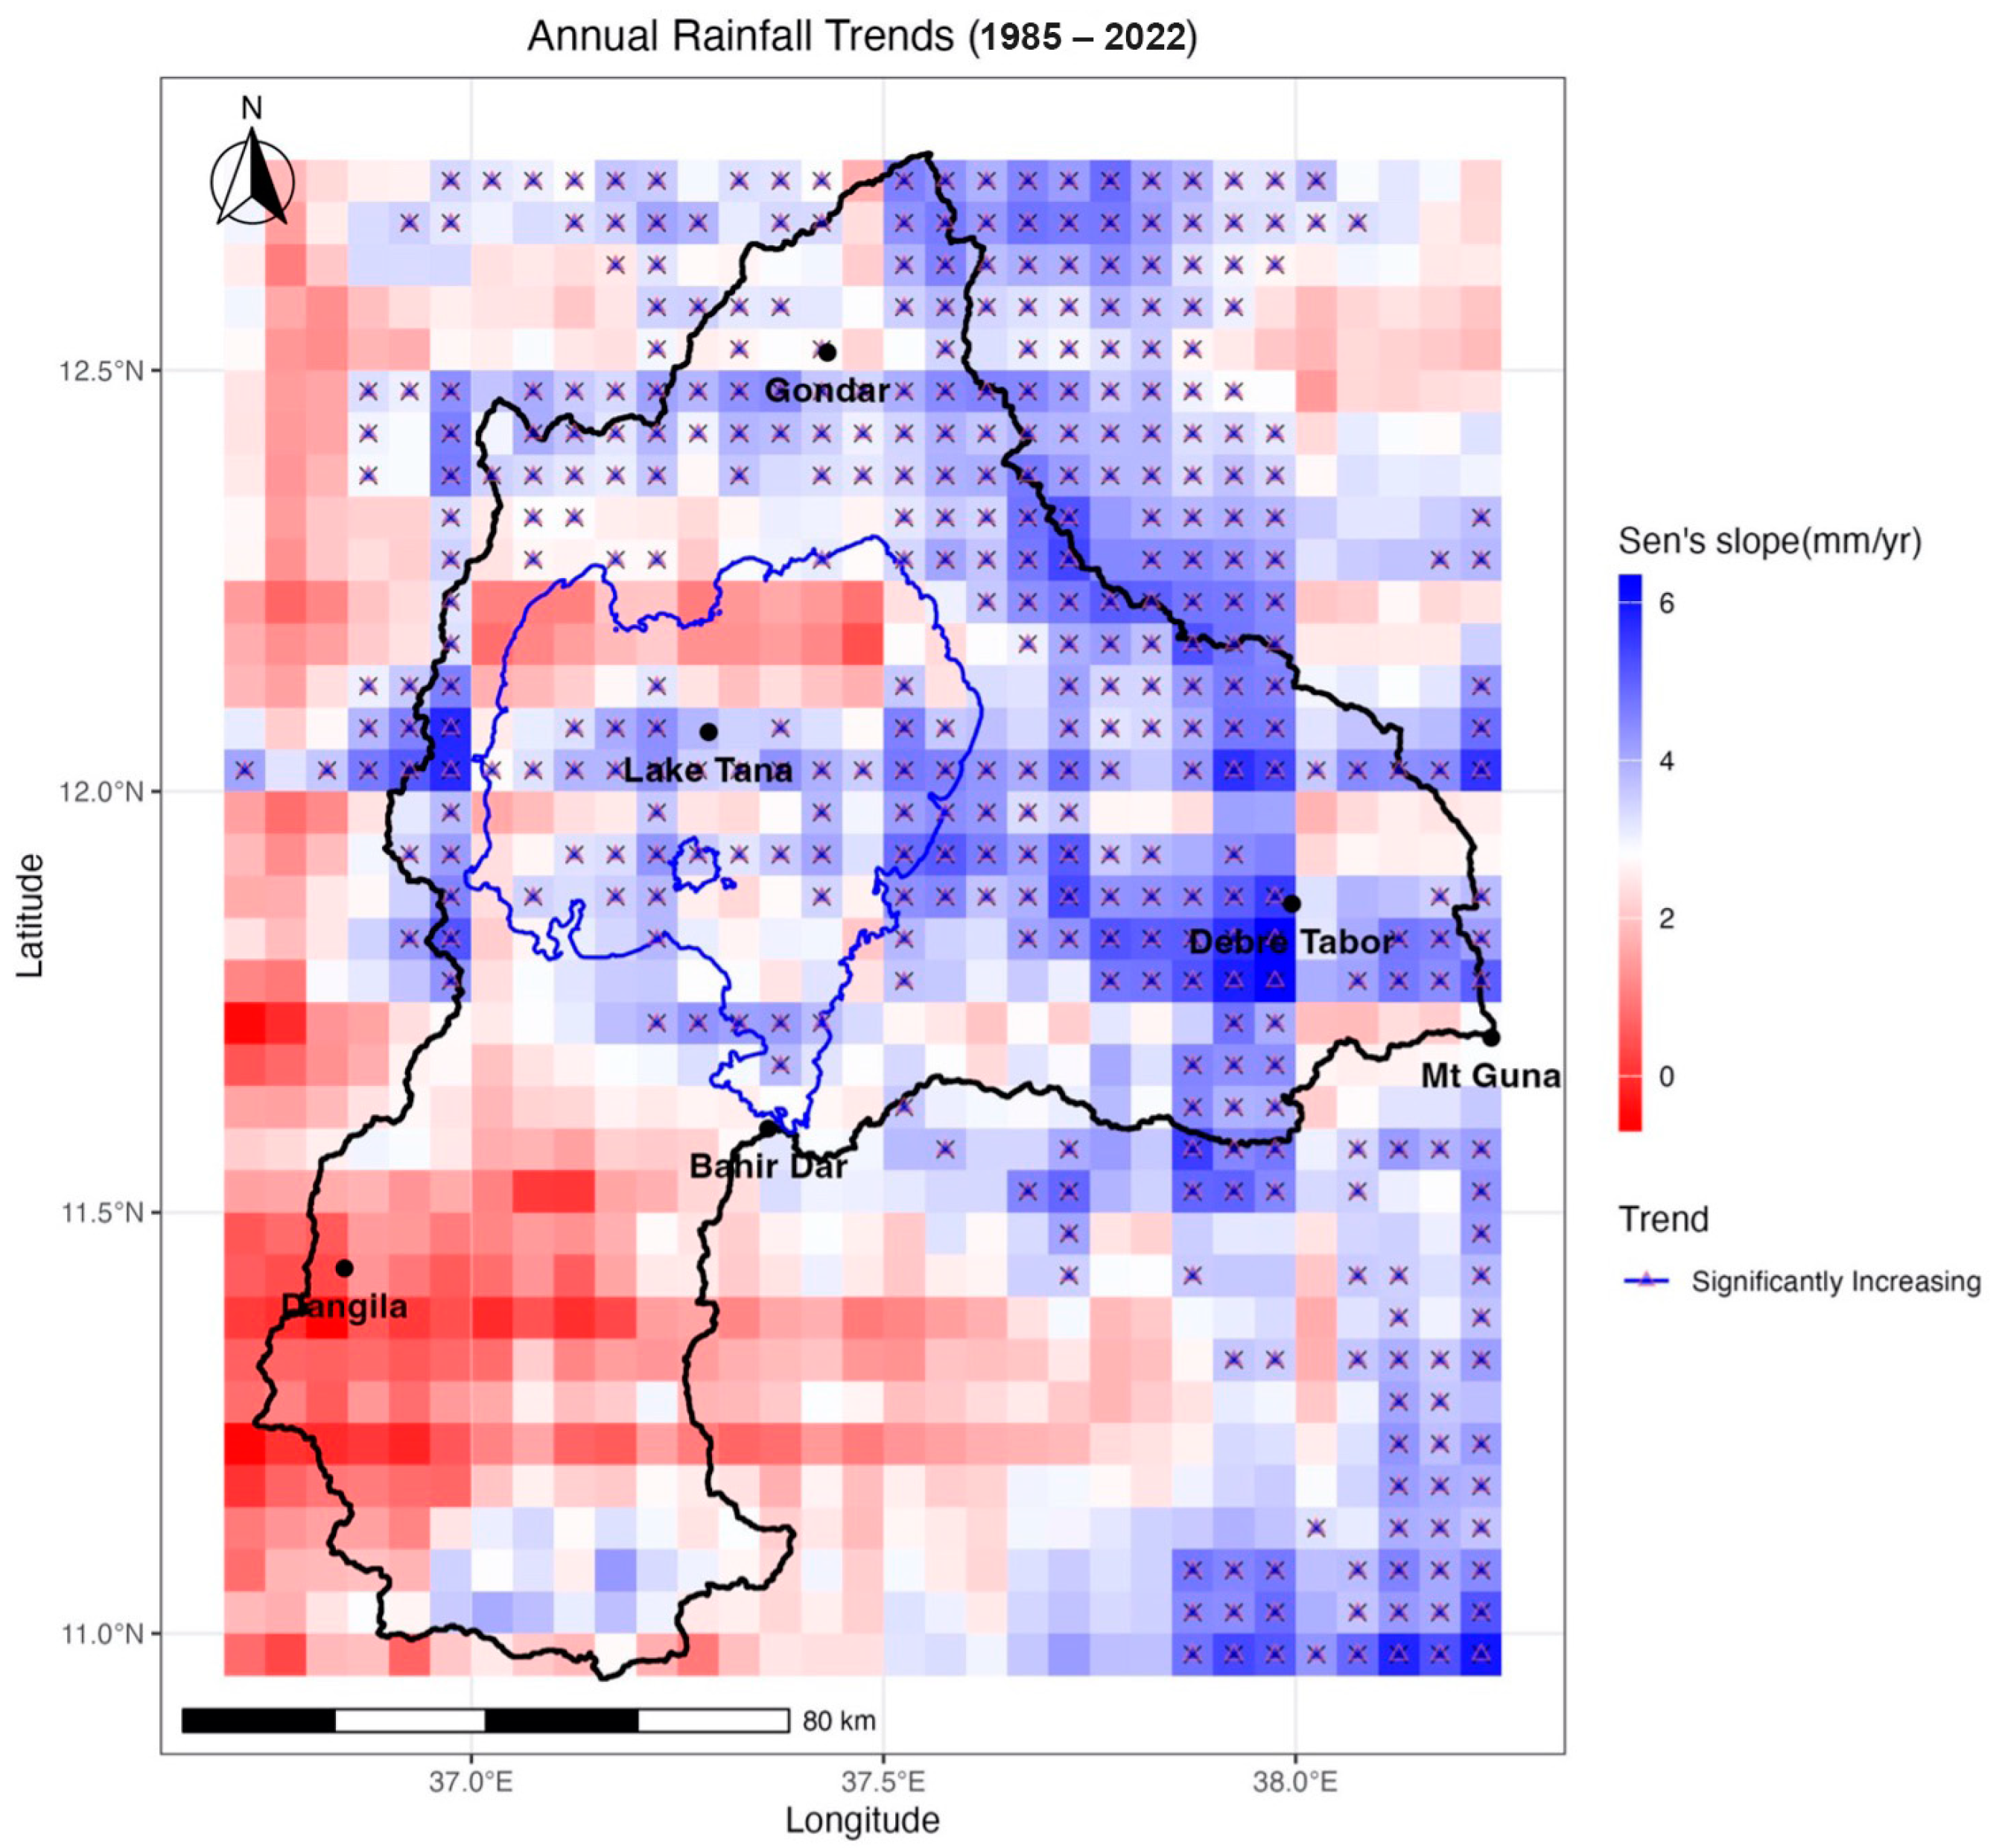
3.2. Rainfall Patterns and Trends

Rainfall patterns in the Lake Tana Basin exhibit significant spatial and temporal variability (Figure 4a). The mean annual rainfall during the period 1985–2022 was 1289 mm, with substantial variation across the basin. Lowland areas received less than 1000 mm of rainfall annually, while highland regions, particularly around Debre Tabor, recorded over 1800 mm. In terms of temporal distribution, rainfall was not uniform throughout the year. The major rainy season (June to September) in Ethiopia, known as Kiremt, accounted for about 80% of the total annual rainfall, with July as the peak month (Figure 4b). The minor rainy season (February to May), known as Belg, showed moderate rainfall, while the dry season (October to January), known as Bega, was characterized by very little to no rainfall.
The trend analysis (Figure 5) indicated an overall increase in mean annual rainfall of 2.9 mm yr−1 during the period 1985–2022. This increase was not uniform across the basin; the eastern and north-eastern parts, around Debre Tabor and Mount Guna, showed the most pronounced and statistically significant increases, with some areas experiencing increases in rainfall of up to 6 mm yr−1.
The decadal analysis revealed notable changes in rainfall patterns (Figure A3, Appendix A). The mean annual rainfall decreased from 1985 to 1995, with a decline of 2.1 mm yr−1, but with a light increase for Mount Guna. This decline intensified between 1995 and 2005, and most strongly in the southern part of the basin, when the mean annual rainfall dropped by about 15.4 mm yr−1. However, the period from 2005 to 2015 saw a slight reversal, with mean annual rainfall increasing by 1.2 mm yr−1, with a moderate increase in the southern part and a moderate decrease in the north-eastern part of the basin. Finally, the period from 2015 to 2022 was characterized by a strong increase in rainfall, with the mean annual rainfall increasing by 14.1 mm yr−1.

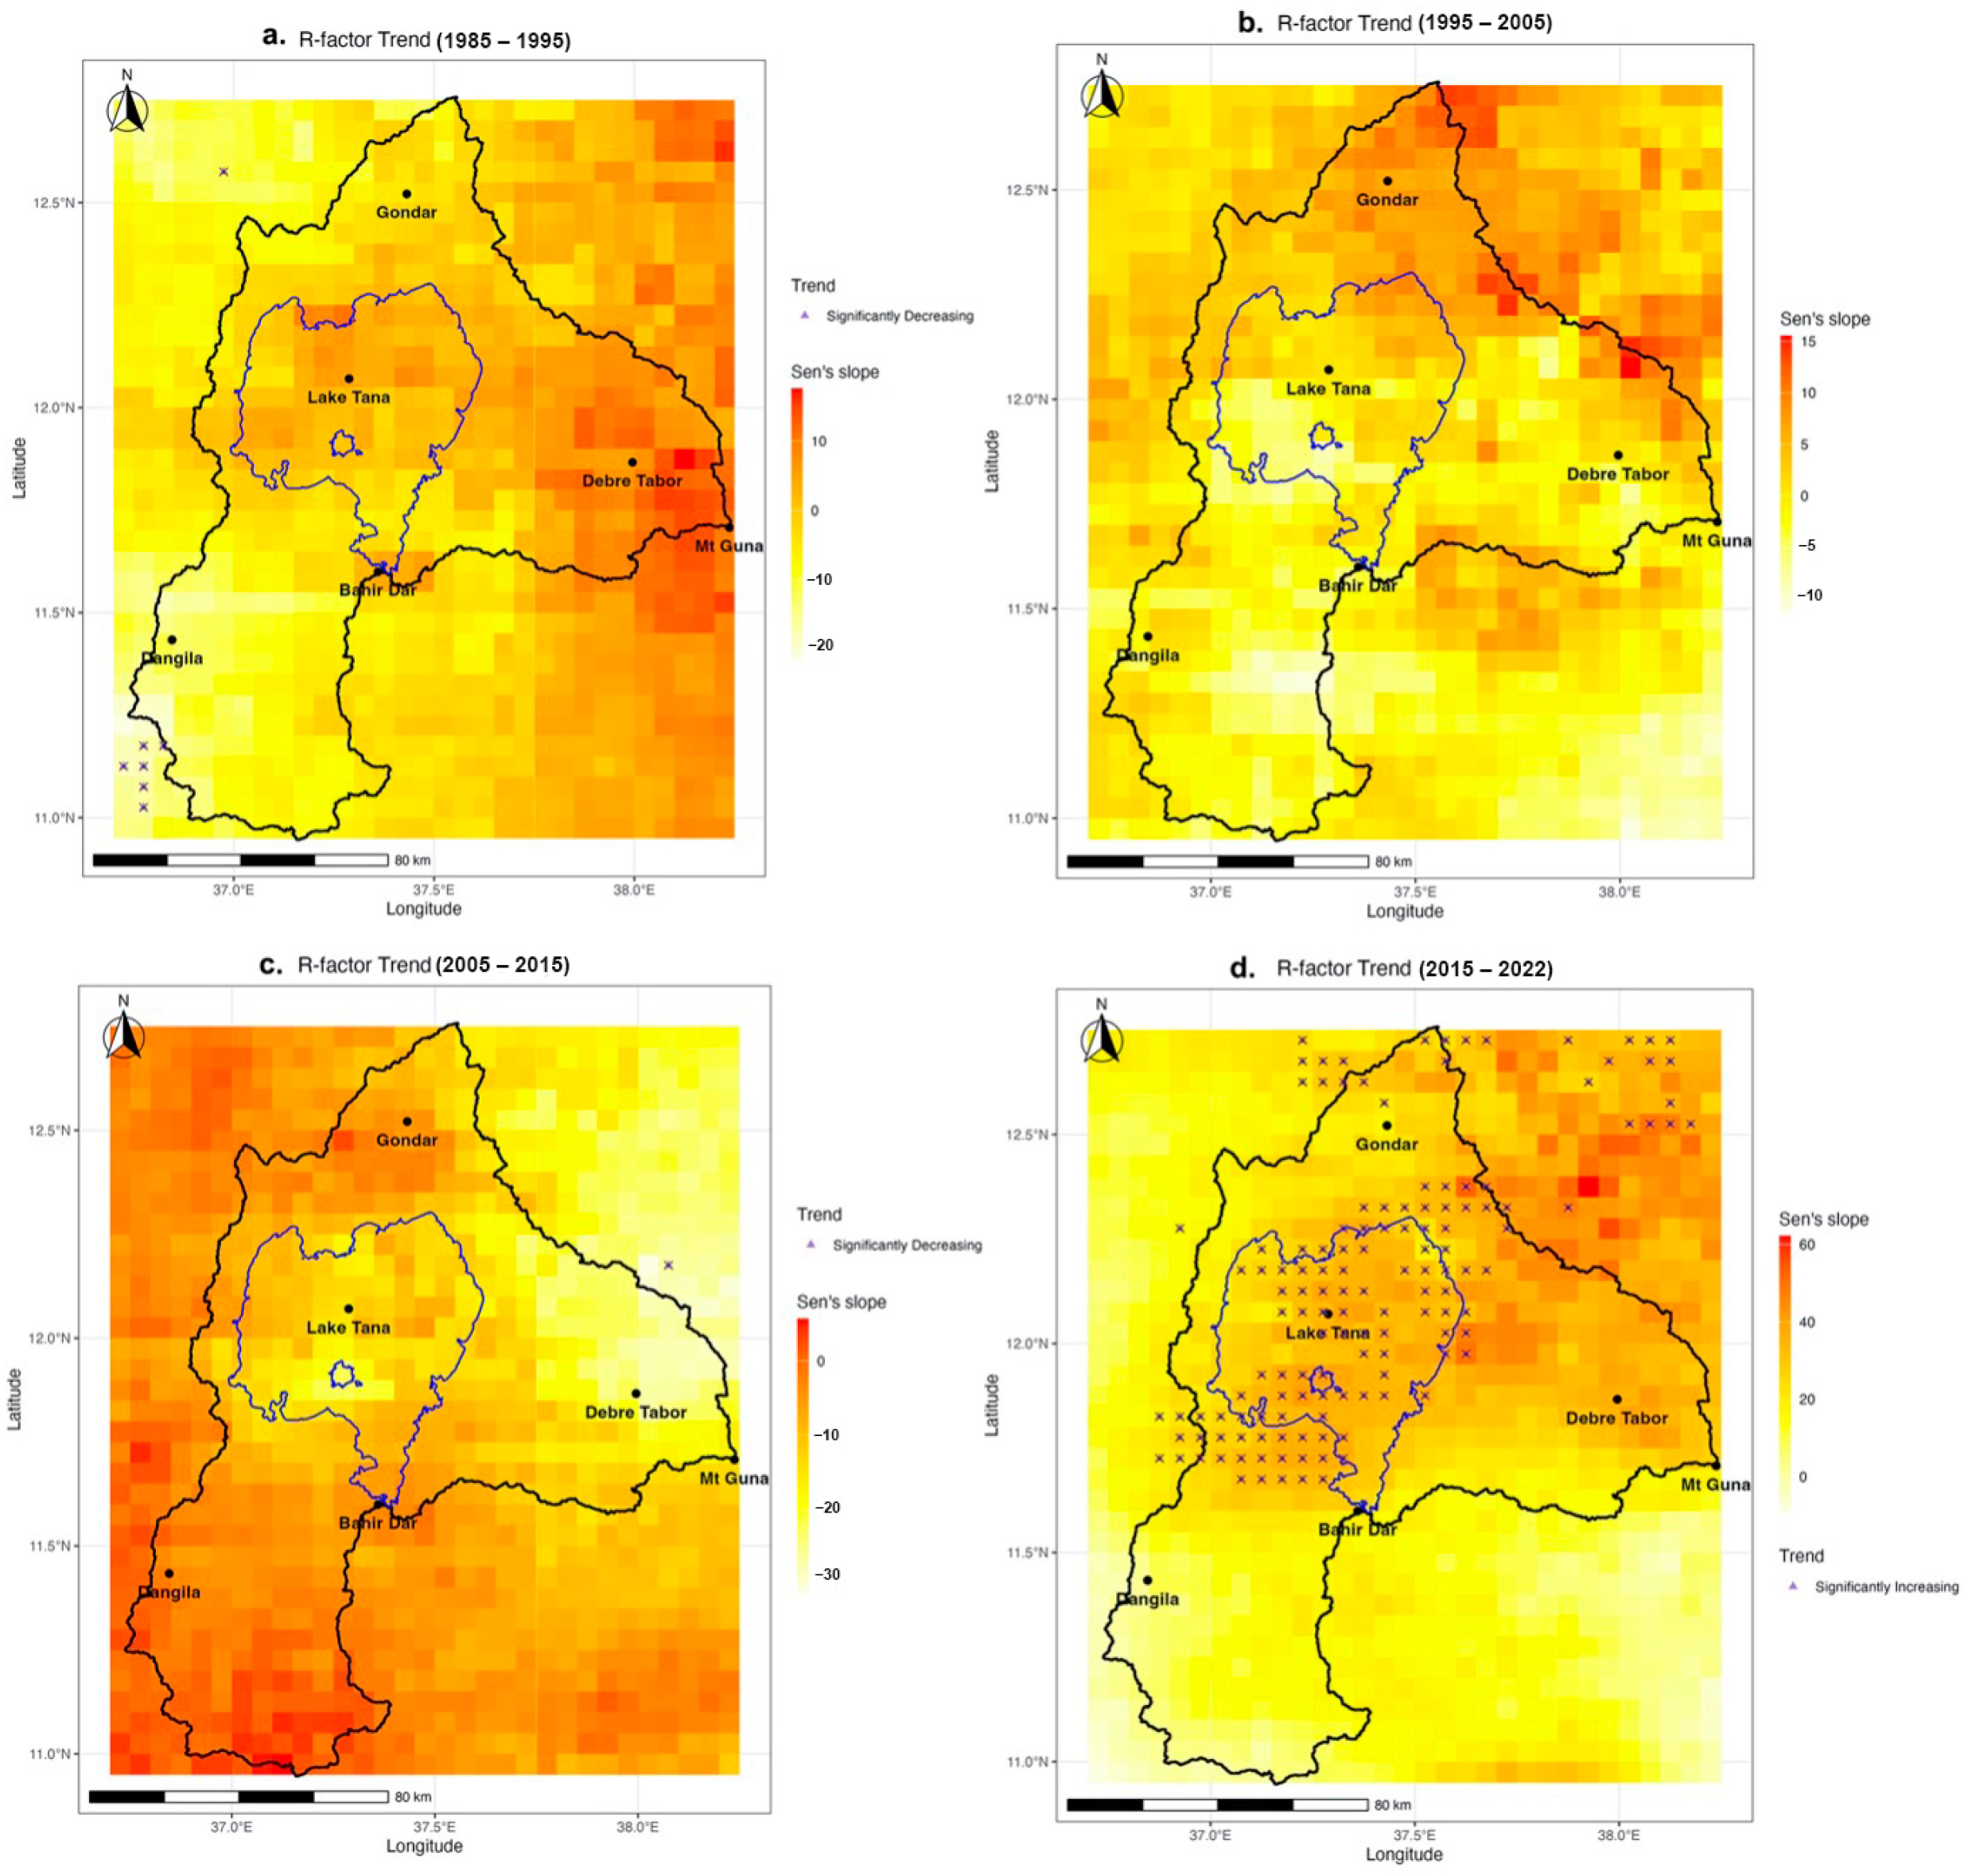
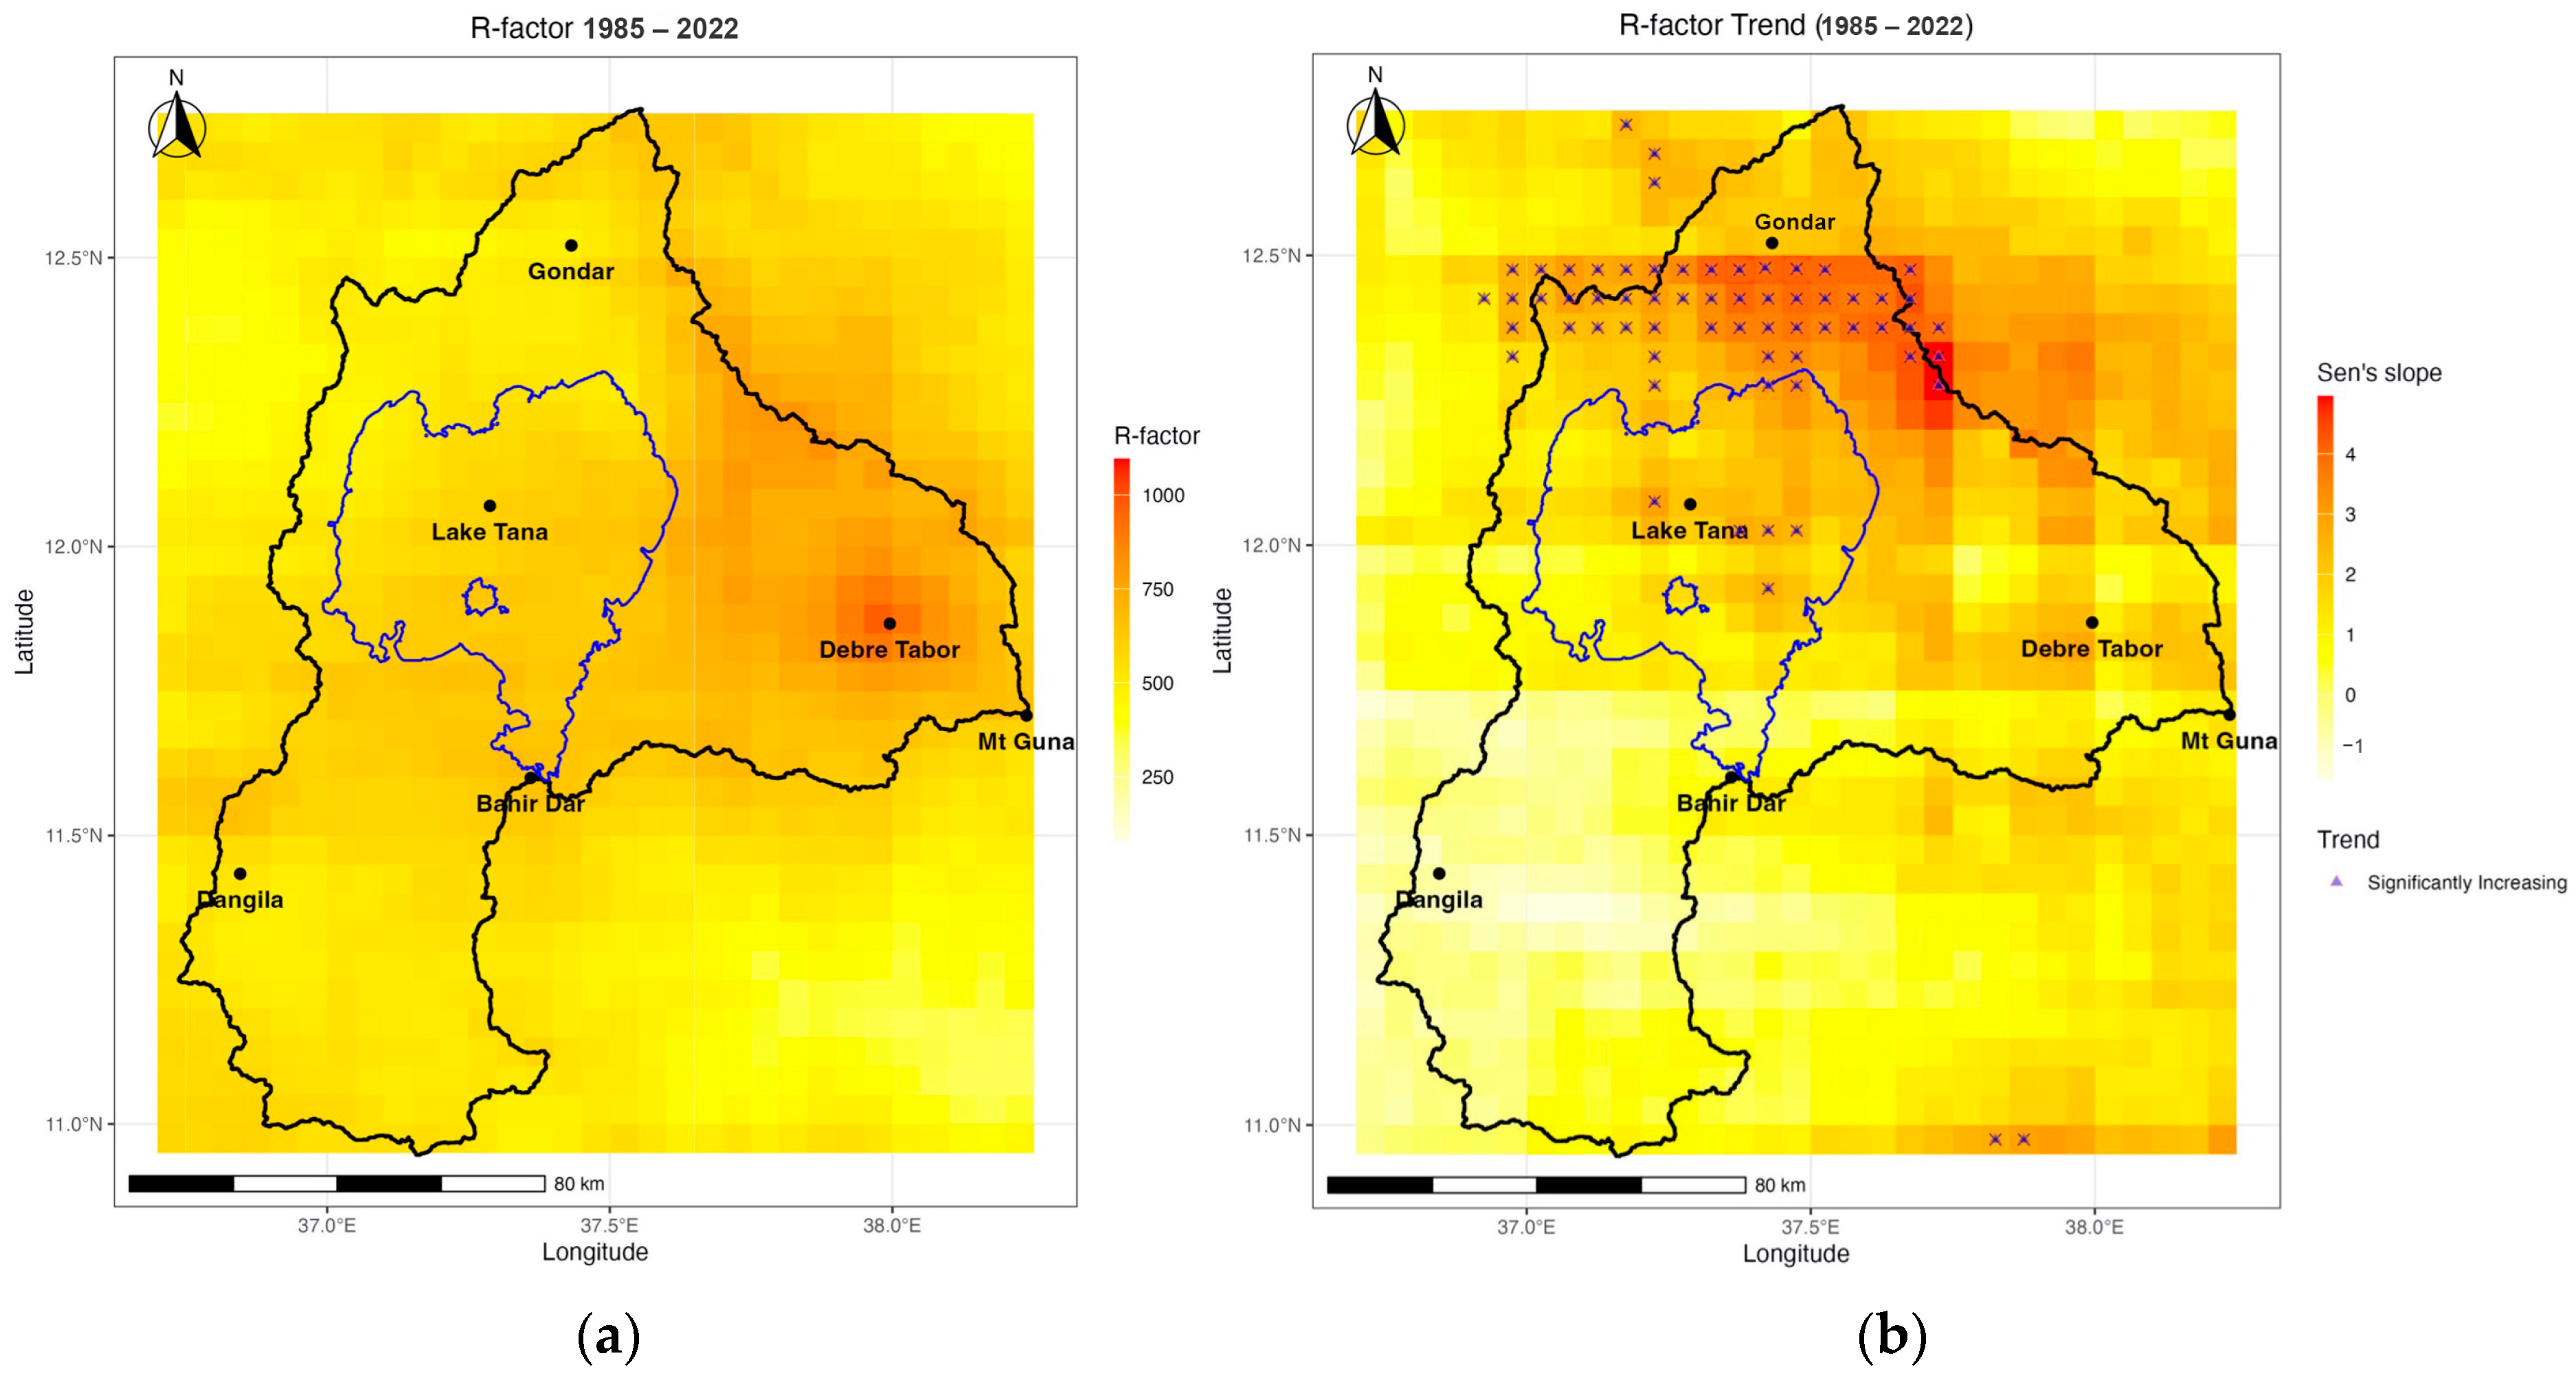
3.3. Rainfall Erosivity

The spatial distribution of rainfall erosivity (R factor) showed substantial variation across the Lake Tana Basin (Figure 6a). The mean annual R-factor was 557.6 MJ mm ha−1 h−1 yr−1, with values ranging from 325 to over 960 MJ mm ha−1 h−1 yr−1. The highest R factor values were concentrated in the north-eastern and eastern parts of the basin, particularly on the western slopes of Mount Guna, where values exceeded 700 MJ mm ha−1 h−1 yr−1. The central part of the basin, including Lake Tana and its immediate surroundings, showed moderate R-factor values between 500 and 600 MJ mm ha−1 h−1 yr−1.
Trend analysis revealed an overall increase in rainfall erosivity across the basin (Figure 6b), with a mean rate of 1.3 MJ mm ha−1 h−1 yr−1. The northern and north-eastern parts of the basin exhibited the most pronounced increase in rainfall erosivity, with values ranging from 3 to 5 MJ mm ha−1 h−1 yr−1.
The decadal analysis revealed varying trends in rainfall erosivity over time (See Appendix A, Figure A4). Between 1985 and 1995, there was a decrease in mean rainfall erosivity, with a reduction of 1.2 MJ mm ha−1 h−1 yr−1. This trend reversed from 1995 to 2005 when mean rainfall erosivity increased at a rate of 1 MJ mm ha−1 h−1 yr−1. However, from 2005 to 2015, erosivity decreased, dropping by 9.29 MJ mm ha−1 h−1 yr−1. Most notably, the period from 2015 to 2022 saw a strong upward shift, with mean rainfall erosivity increasing sharply by 21.9 MJ mm ha−1 h−1 yr−1.

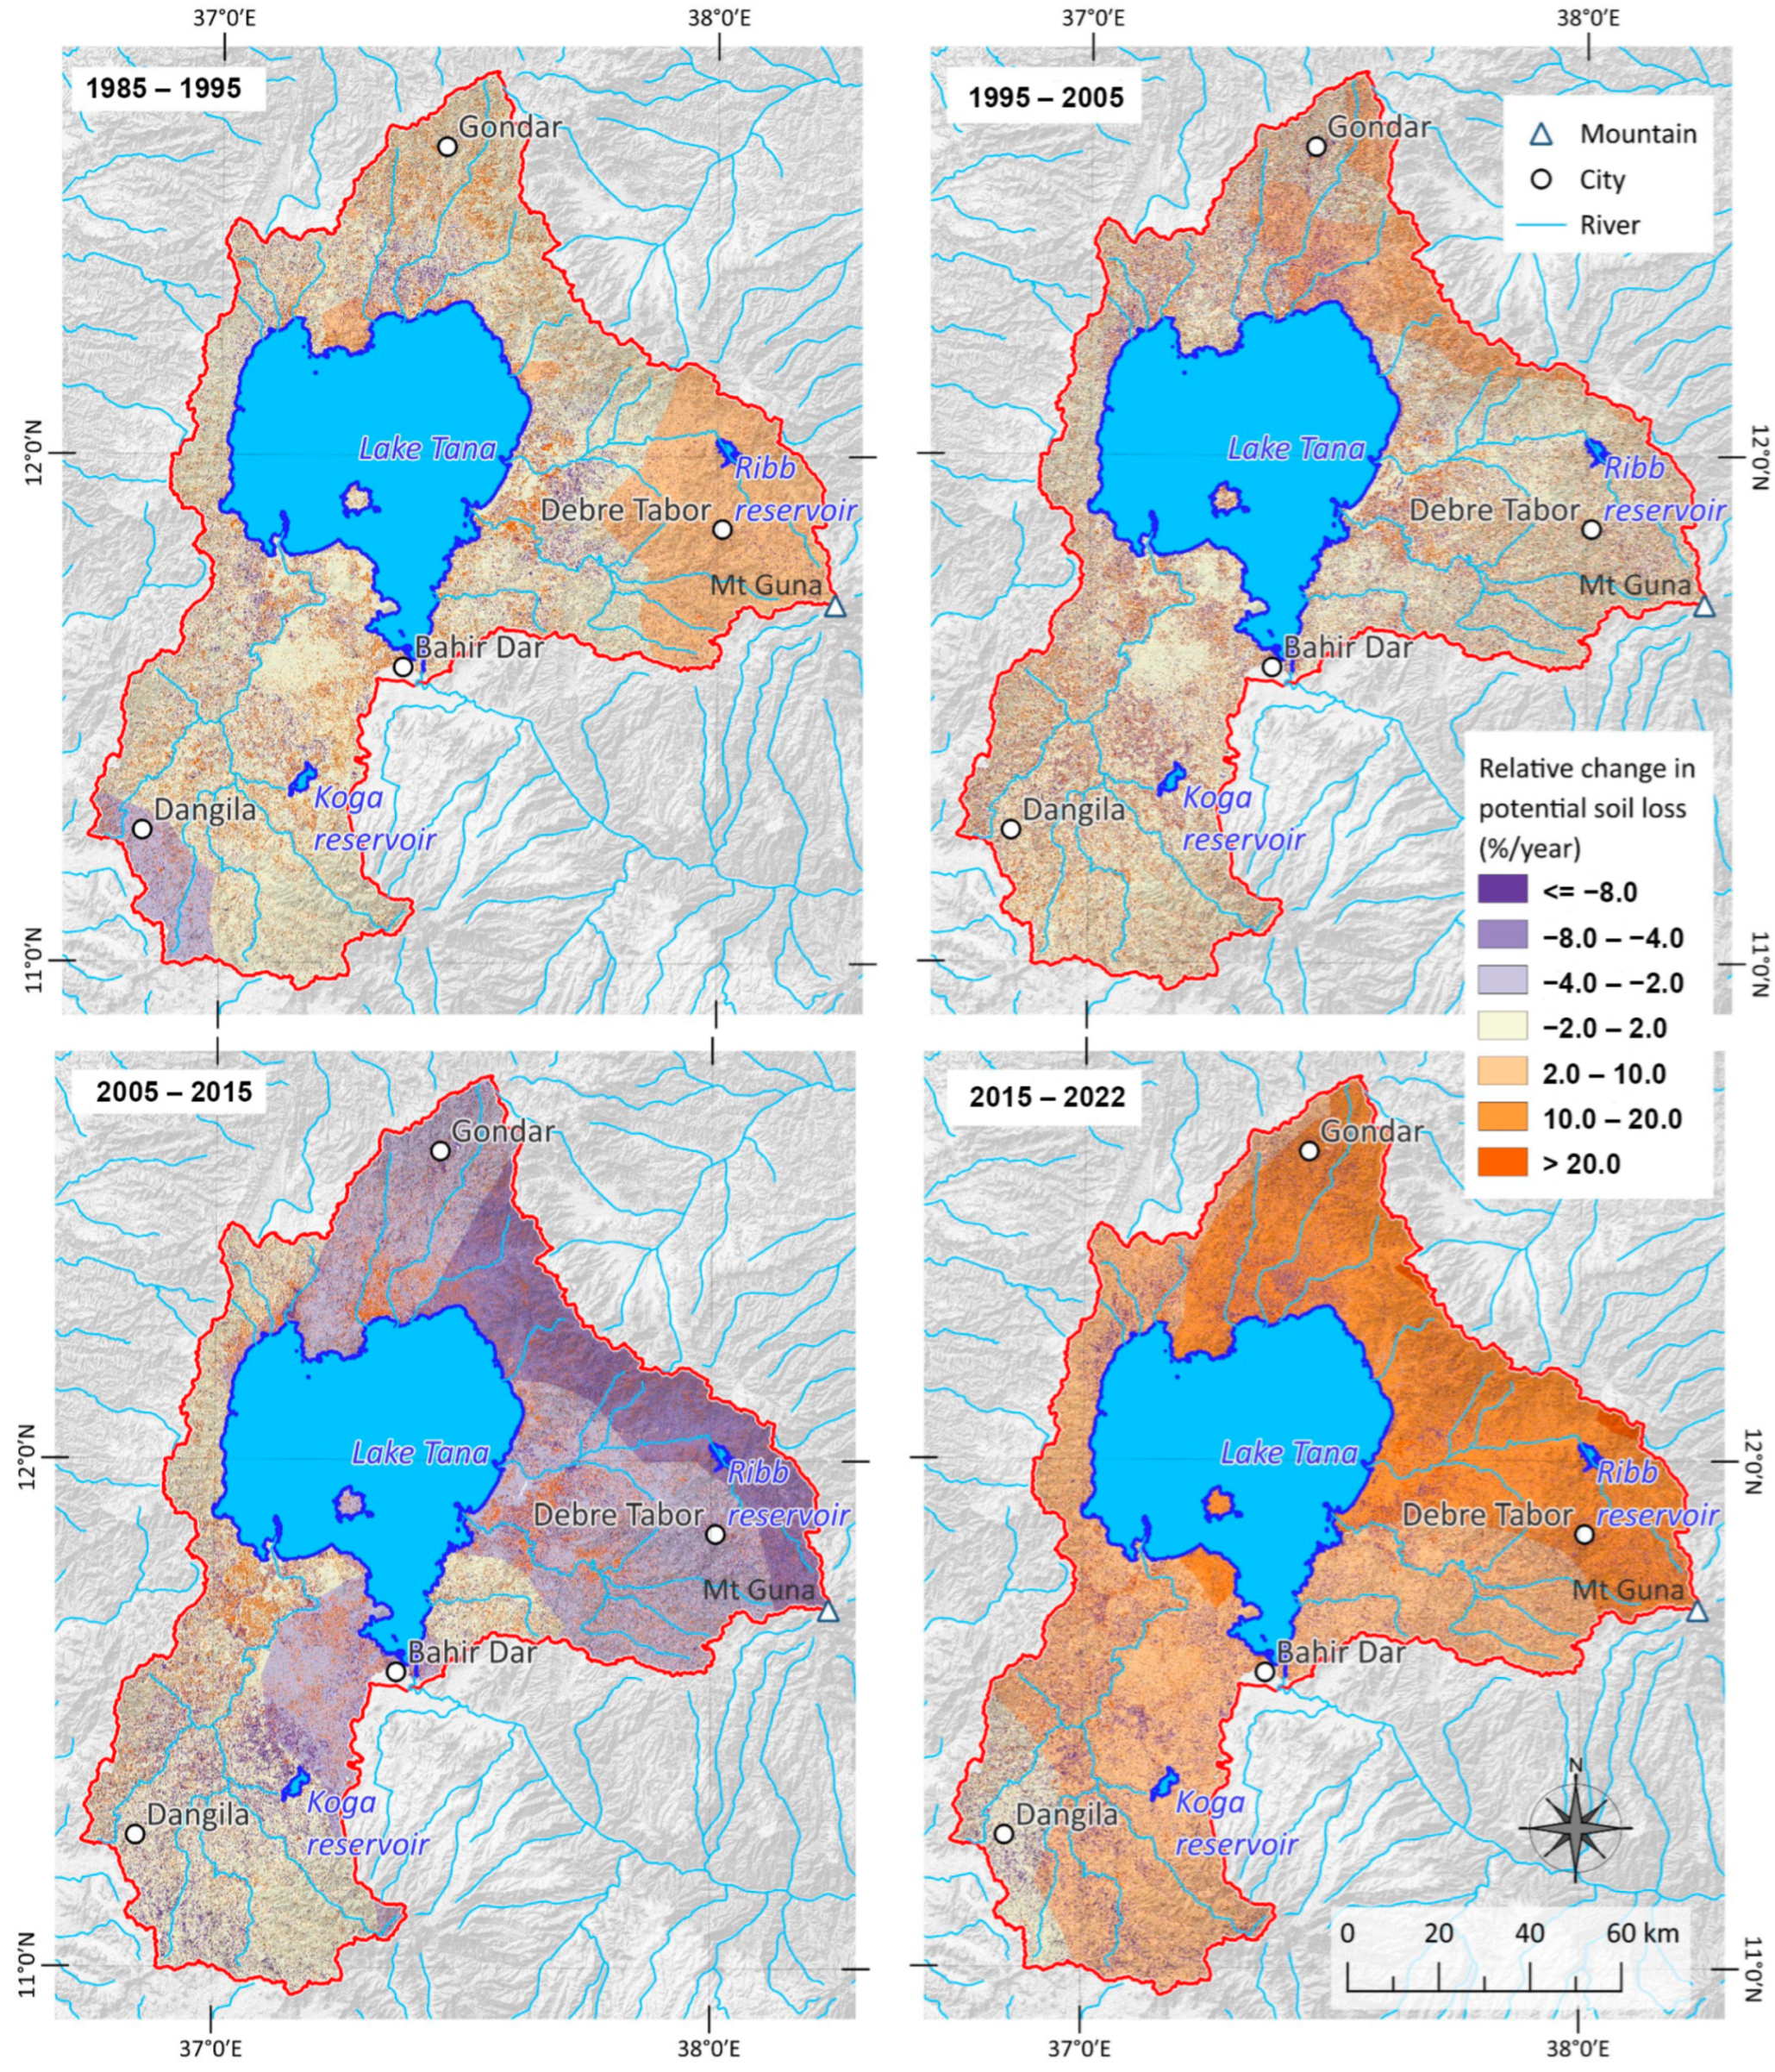
3.4. Interaction Between Changes in Landcover and Rainfall Erosivity

Considering the combined effect of landcover changes and rainfall erosivity, the relative changes in potential soil loss reveal significant spatial and temporal variations in the interaction between landcover change and rainfall erosivity across the Lake Tana Basin (Figure 7).
In the first period (1985–1995), the interaction between landcover and rainfall erosivity was limited, as the relative potential soil loss remained constant for most of the basin, with only a modest increase of 0.9% as a median value. However, the potential soil loss showed localized increases (2–10%) on the slopes of Mount Guna in the eastern part, while it declined slightly (−2 to −4%) in the southwestern part of the basin. This period saw minimal landcover change (Figure 3), while rainfall erosivity decreased (Figure A4a in Appendix A).
In the second period (1995–2005), the relative potential soil loss remained constant over an even wider area than in the previous period, with the median value decreasing slightly (−0.12%). The limited change in potential soil loss was significant, considering the substantial landcover changes during this period (Figure 3), indicating that the interaction was moderated by the lack of significant changes in rainfall erosivity (Figure A4b).
In the third period (2005–2015), the relative potential soil loss decreased over more than half of the basin, with an overall median value of −2.3%. The decrease was particularly strong in the northern and eastern parts of the basin. This suggests that the reduction in erosivity during this period had a dominant influence, outweighing the limited landcover changes (Figure 3 and Figure A4c).
In the fourth period (2015–2022), the relative potential soil loss increased strongly across the entire basin, with an overall median value of 8.2%. This increase was most pronounced in the northern and eastern parts of the basin. Here, the strong interaction between substantial landcover change and increasing rainfall erosivity is evident, contributing to the widespread increase in potential soil loss (Figure 4 and Figure A4d).

4. Discussion

4.1. Patterns, Drivers, and Implication of LULC Changes

The changes in land use and landcover (LULC) between 1985 and 2022 (Figure 2) reflect complex dynamics that are consistent with broader trends observed across Ethiopia and other parts of East Africa. The slight increase in cropland (from 32.9% to 33.3%) aligns with the general trend of agricultural expansion, driven by population growth and increasing food demand [48]. However, the non-linear nature of this change, with a decrease in the 1990s followed by an increase, suggests the influence of changing policies and shifting socio-economic factors during this period. The initial reduction in tree cover (from 31.2% in 1985 to 27.8% in 1995), followed by its recovery (29.9% in 2022), is striking and diverges from the often repeated deforestation narrative [49,50,51]. This trend, however, aligns with studies that have documented forest recovery in other parts of East Africa [52,53] as well as in Ethiopia. In Northern Ethiopia, the regrowth of forests has been attributed to community-based conservation efforts and changing land management practices [54]. In the southern part of the Lake Tana Basin, the expansion of tree cover can be attributed to the expansion of green wattle (Acacia decurrens (J.C.Wendl.) Willd.), grown for the production of charcoal, and of khat (Catha edulis (Vahl) Forssk. ex Endl.), which is a shrub grown as a cash crop for its stimulant effects [55,56].
The substantial increase in impervious surfaces (from 0.03% to 0.71%), while small in absolute terms, represents an important change reflecting urbanization trends as observed across Ethiopia [57,58]. The implications of this urban growth on soil erosion and the hydrology of the Lake Tana Basin deserve further attention, as urban expansion can alter runoff dynamics and sediment transport processes [59].
The intensity analysis reveals that the most rapid landcover changes occurred between 1995 and 2005. Although our data do not allow for establishing a causal relationship, these changes in landcover coincide with major political and socio-economic transformations in Ethiopia. In 1991, the transition from the Derg military regime to the Ethiopian People’s Revolutionary Democratic Front (EPRDF) marked a pivotal shift from a centrally planned, industry-focused model to a more market-oriented, agriculture-led approach [60]. The shift aligns with Ethiopia’s restructuring into an ethnic-based federal state, where state-managed land policies and agricultural strategies have played a critical role in shaping local productivity, land tenure, and food security [61].

4.2. Implications of Changing Rainfall Patterns and Erosivity

The overall increase in mean annual rainfall (2.9 mm yr−1) (Figure 5) is a significant finding, especially in the context of climate change concerns in Ethiopia. This increase contrasts with an earlier study that showed minor fluctuations in annual rainfall between 1981 and 2016 in North and North-western Ethiopia, with no statistically significant changes [62]. Two points may explain this discrepancy. First, our study extends to 2022, during which rainfall increased strongly between 2015 and 2022 (Figure A3d). Second, our data show that important spatial variations must be considered, even within a relatively small area such as the Lake Tana Basin, when compared to regional or continental scales.
The trends in decadal periods reveal important dynamics, with a shift from predominantly decreasing rainfall in earlier decades to a marked increase in the last decade. Decadal variability in rainfall patterns across East Africa, particularly an increase during the major rainy season, can reach up to 150 mm above and below the long-term average and has been attributed to large-scale climate phenomena such as the El Niño Southern Oscillation (ENSO) and Indian Ocean Dipole Mode Index (IOD) [63,64]. Still, over the last four decades, we found an overall increase in rainfall erosivity (mean 1.3 MJ mm ha−1 h−1 yr−1). This increase is particularly concerning as it could exacerbate soil erosion and potentially suggest a shift in climate regime in the basin. The highest erosivity values, and also the strongest increase, occurred in the north-eastern and eastern parts of the basin, which are areas of high rainfall and have the steepest topography. This combination of factors makes these regions particularly vulnerable to soil erosion.

4.3. Effect of the Interactions Between Changes in LULC and Rainfall

Our analysis of the interaction between changes in LULC and rainfall patterns translates into an increase in relative potential soil loss (Figure 7). This finding aligns with previous research reporting on rising soil erosion rates over time in the Upper Blue Nile River basin [65]. However, as in that study, rainfall erosivity was estimated for data only from 1998 to 2012, and the authors attributed the increased erosion to changes in land use and landcover. Similarly, erosion hotspots identified in the Lake Tana Basin rely only on rainfall data from 19 stations for the years 1999 to 2016 [8]. The study pointed to elevated erosivity, land use, and landcover changes such as deforestation and agricultural expansion, inadequate soil management practices, and hilly terrain as key factors driving soil erosion. It was concluded that land management practices, such as reforestation and stone and soil bunds, significantly impact soil erosion control without fully considering the importance of the dynamic nature of changing rainfall patterns. Using remote sensing-derived data, our study covers a much longer timespan than previous studies and reveals the importance of considering broader temporal fluctuations in rainfall patterns.
The wider time frame also allows for intricate spatial patterns to be noticed. While the northern and north-eastern parts of the basin generally appear to be the most susceptible to soil erosion, the decade from 2005 to 2015 saw a decrease in rainfall and rainfall erosivity, with the most pronounced reduction in erosion potential occurring in these parts of the basin (Figure 4). The findings of Lemma et al. (2019) [8], who identified the northern and north-eastern parts of the Lake Tana Basin as erosion hotspots, are confirmed by our results. Interestingly, these authors also identified some southern parts of the basin as erosion hotspots. Our data show that, at least over the last decade, as rainfall erosivity did not increase to the same extent in this part of the basin, the situation may not be as severe as could have been feared.

4.4. Limitations of Using the RUSLE

While our study provides valuable insights into the interaction between land use/landcover (LULC) changes and rainfall patterns, several limitations should be acknowledged. A primary constraint is that we did not estimate actual soil loss (t ha−1 year−1). This limitation arose partly from the absence of field data on actual soil erosion rates but more fundamentally because our focus was on assessing the interactions between LULC and rainfall changes rather than directly quantifying erosion. To assess these interactions, we employed the Revised Universal Soil Loss Equation (RUSLE), leveraging its multiplicative structure to capture the compounding effects of various factors. However, applying the RUSLE required making assumptions regarding the nature and variability of the factors, which inherently introduced uncertainty into our findings.
The R-factor in the RUSLE [40] requires rainfall kinetic energy data, which were unavailable for our study area, as in many regions. Models using daily rainfall data are more accurate than those based on monthly data, as they better capture rainfall variability and intensity [66]. However, these models necessitate site-specific calibration to reflect local spatial and temporal rainfall variability. Consequently, we used the Modified Fournier Index (MFI), which relies on monthly and annual rainfall data supported by a region-specific regression equation [44]. Given the limitations of the available data, we believe that this approach provided the most reliable estimate under current conditions.
We assessed landcover change in the Lake Tana Basin using the Global Land Cover Fine Classification System (GLC_FCS30D). Given that these data have a spatial resolution of 30 m and present consistent classification data over a long period (1985–2022), the GLC_FCS30D data offer a high potential for multitemporal landcover analysis. On a global level, this dataset has been validated with 84,526 samples from 2020 and achieved an overall accuracy of 80.9% (±0.3%) for the basic classification [67]. Additionally, the accuracy was assessed to be 79.5% (±0.5%) for the United States and 81.9% (±0.1%) for the European Union [67]. To the best of our knowledge, our study is the first to report the accuracy of the GLC_FCS30D for multiple time intervals, specifically for Africa. The overall accuracies we found (77.3–80.3%) align with the global accuracy figures. However, for landcover data before 2005, accuracy could not be confirmed due to the absence of field data or high-resolution satellite imagery. Although the trends in landcover changes we observed are consistent with the social and historical context, as previously discussed, the limitations in data availability introduced unquantifiable uncertainties regarding the accuracy of these changes.
Furthermore, we used C-factors for landcover types, even though they were originally intended to quantify the impact of specific crop types on soil erosion, reflecting how different crops and their associated management practices affect erosion rates. For instance, the C-factor varies significantly between crops, like maize (Zea mays) or teff (Eragrostis tef), and even varies depending on the crop variety and landscape context. It has been shown that the median C-factor for maize is 0.7 on the Makonde plateau, while it is 0.2 on the inland plains of South Eastern Tanzania [52]; similarly, it has been reported that the C-factor for teff is 0.07 in Northern Ethiopia, while it is 0.25 in Central Ethiopia [54]. However, the landcover data available for the Lake Tana Basin do not distinguish between different crops, and there are no data on how the C-factor may vary over time or across different landscape settings within the basin. Given these limitations, we adopted a practical approach where the C-factors were treated as average values representative of the landcover units within the Lake Tana Basin and based on values from the literature for this region. While there is variation within a landcover type (e.g., different crops within cropland), the differences between the major landcover types typically differ by one order of magnitude or more (e.g., cropland 0.15 vs. shrubland 0.014, tree-cover 0.001). Therefore, although the C-factor can vary per crop and vegetation type, it seems reasonable to assume that the variation within a landcover type is smaller than between landcover types.
Our analysis is also based on the assumption that the factors of soil erodibility (K), slope (LS), and support practices (P) remained constant. Although the K-factor likely changed in heavily eroded areas, this assumption is justified because our primary aim was to analyze the interaction between changes in landcover and rainfall. As long as soil and slopes were not drastically altered (e.g., by severe soil erosion), it was reasonable to consider the K and LS factors to be stable. That said, farmers in the Lake Tana Basin use practices to prevent soil erosion, such as crop residue management, vegetative conservation, physical erosion control structures, and maintaining soil organic matter [68]. Additionally, government programs have encouraged community investment in soil and water conservation practices, such as constructing soil bunds, drainage channels, and check dams [69]. Therefore, our results should not be interpreted as reflecting the direct impact of soil erosion; rather, they provide insights into broader landscape dynamics. Specifically, our findings highlight the varying impact of changes in landcover, rainfall, and rainfall erosivity, providing information for taking the impact of climate change into account when targeting soil conservation efforts and, more generally, enhancing ecosystem services.

5. Conclusions

This study provides a nuanced understanding of landscape dynamics in the Lake Tana Basin by capturing the intricate interactions between land use and landcover (LULC) changes, rainfall variability, and potential soil erosion over nearly four decades. Our findings reveal that shifts in LULC—including fluctuating cropland, recovering tree cover, and urban expansion—reflect broader socio-economic and policy changes, highlighting the complexity of landscape evolution in the Ethiopian highlands. Furthermore, the increase in rainfall and rainfall erosivity, particularly in the north-eastern and eastern parts of the basin, underscores the importance of closely monitoring changing rainfall patterns in light of ongoing climate change to better understand and anticipate erosion risks. By using long-term, remote sensing datasets, this analysis provides essential insights into the combined effect of changing rainfall patterns and landcover changes that we expressed as the cause of potential soil erosion. These insights are relevant for studies focusing on the impact of climate change, while they also offer a basis for targeted soil conservation efforts and improved land management strategies. Ultimately, this research advances our understanding of landscape dynamics in response to both climate change and human activity, supporting sustainable land management and ecosystem resilience in the Lake Tana Basin and similar regions in the tropics.

Author Contributions

Conceptualization, S.T.F., E.B.M., A.A.A. and S.D.; methodology, S.T.F., A.A.A. and S.D.; software, S.T.F. and E.B.M.; validation, A.A.A. and S.D.; formal analysis, S.T.F., E.B.M., A.A.A. and S.D.; investigation, S.T.F.; resources, S.T.F., A.A.A. and S.D.; data curation, S.T.F.; writing—original draft preparation, S.T.F.; writing—review and editing, S.T.F., E.B.M., A.A.A. and S.D.; visualization, S.T.F. and S.D.; supervision, A.A.A. and S.D. All authors have read and agreed to the published version of the manuscript.

Funding

This research received no external funding and was conducted as an inter-university student research project, as part of the Master’s Programme in Sustainable Land Management (SULAMA), involving Ghent University, Bahir Dar University, and Vrije Universiteit Brussel.

Data Availability Statement

All data, except for the ground truth data provided confidentially by ADSWE and Bahir Dar University, are from open-access sources.

Acknowledgments

The authors would like to thank the Amhara Design and Supervision Works Enterprise (ADSWE) for collecting the ground truth data.

Conflicts of Interest

The authors declare no conflicts of interest.

Appendix A. Additional Tables and Figures

Table A1. Values for the C-factor used for the Lake Tana Basin based on the literature.
LandcoverC-Factor
Cropland0.15
Tree cover0.001
Shrubland0.014
Grassland0.01
Wetland0.05
Bare area0.01
Impervious surface0.004
Water body0.00
Adapted from [46,70].
Table A2. Producer accuracy (PA), user accuracy (UA), and overall accuracy of the Global Landcover Fine Classification System data (GLC_FCS30D) for 2005, 2014, and 2022, with 378 ground truth data points.
Ground
Truth Data
Landcover DataTotalPA
CropTreeShrubGrassBareWet.Imp.Water (%)
Year: 2005
Cropland781162201010078.0
Tree cover1312282100014683.6
Shrubland71364200008674.4
Grassland10150000771.4
Bare areas301510001010.0
Wetland0000013011492.9
Impervious surfaces2320001101861.1
Water body000000033100.0
Total1041498216413124384
UA (%)75.081.978.031.325.0100.091.775.0
Overall accuracy: 77.3
Kappa coefficient: 0.69
Year: 2014
Cropland1571080000017589.7
Tree cover2442100004989.8
Shrubland1836200004776.6
Grassland0422600003281.3
Bare areas0422650003713.5
Wetland1300020002483.3
Impervious surfaces0200003003293.8
Water body001002091275.0
Total161755155522309408
UA (%)97.558.770.647.3100.090.9100.0100.0
Overall accuracy: 80.2
Kappa coefficient: 0.74
Year: 2022
Cropland9217162300013070.8
Tree cover614743011016290.7
Shrubland2333210004180.5
Grassland01040000580.0
Bare areas21041000812.5
Wetland1011011001478.6
Impervious surfaces1010001101384.6
Water body10000007887.5
Total1051695516512127381
UA (%)87.687.060.025.020.091.791.7100.0
Overall accuracy: 80.3
Kappa coefficient: 0.72
Figure A1. Category-level changes in land use/cover for the Lake Tana Basin: (a) gain size and annual intensity of change in each category’s gain relative to the size of the category at the interval’s end time point, and (b) loss size and annual intensity of each category’s loss in relation to the size of the category at the interval’s initial time point.
Remotesensing 17 00747 g0a1
Figure A2. Transition level changes in Land use/landcover in Lake Tana Basin: (a) gain of tree cover in the Lake Tana Basin, and (b) loss of cropland in the Lake Tana Basin.
Remotesensing 17 00747 g0a2
Figure A3. Monotonic trends for annual rainfall (mm year−1) in the Lake Tana Basin in Ethiopia for the periods (a) 1985–1995; (b) 1995–2005; (c) 2005–2015; and (d) 2015–2022. Crosses (×) indicate pixels with significant (p < 0.05) increases or decreases in rainfall. (Statistics are reported only for the basin).
Remotesensing 17 00747 g0a3
Figure A4. Monotonic trends for the annual R-factor (MJ mm ha−1 h−1 yr−1) in the Lake Tana Basin in Ethiopia for the periods (a) 1985–1995; (b) 1995–2005; (c) 2005–2015; and (d) 2015–2022. Crosses (×) indicate pixels with significant (p < 0.05) increases or decreases in R-factor. (Statistics are reported only for the basin).
Remotesensing 17 00747 g0a4

References

  1. Prăvălie, R.; Nita, I.-A.; Patriche, C.; Niculiță, M.; Birsan, M.-V.; Roșca, B.; Bandoc, G. Global Changes in Soil Organic Carbon and Implications for Land Degradation Neutrality and Climate Stability. Environ. Res. 2021, 201, 111580. [Google Scholar] [CrossRef]
  2. Vanmaercke, M.; Panagos, P.; Vanwalleghem, T.; Hayas, A.; Foerster, S.; Borrelli, P.; Rossi, M.; Torri, D.; Casalí, J.; Borselli, L.; et al. Measuring, Modelling and Managing Gully Erosion at Large Scales: A State of the Art. Earth-Sci. Rev. 2021, 218, 103637. [Google Scholar] [CrossRef]
  3. Goshu, G.; Aynalem, S. Problem Overview of the Lake Tana Basin. In Social and Ecological System Dynamics; Stave, K., Goshu, G., Aynalem, S., Eds.; AESS Interdisciplinary Environmental Studies and Sciences Series; Springer International Publishing: Cham, Switzerland, 2017; pp. 9–23. ISBN 978-3-319-45753-6. [Google Scholar]
  4. Song, C.; Nigatu, L.; Beneye, Y.; Abdulahi, A.; Zhang, L.; Wu, D. Mapping the Vegetation of the Lake Tana Basin, Ethiopia, Using Google Earth Images. Earth Syst. Sci. Data 2018, 10, 2033–2041. [Google Scholar] [CrossRef]
  5. Conway, D.; Nicholls, R.; Brown, S.; Tebboth, M.; Adger, W.; Ahmad, B.; Biemans, H.; Crick, F.; Lutz, A.; Safra de Campos, R.; et al. The Need for Bottom-up Assessments of Climate Risks and Adaptation in Climate-Sensitive Regions. Nat. Clim. Change 2019, 9, 503–511. [Google Scholar] [CrossRef]
  6. Asfaw, A.; Simane, B.; Hassen, A.; Bantider, A. Variability and Time Series Trend Analysis of Rainfall and Temperature in Northcentral Ethiopia: A Case Study in Woleka Sub-Basin. Weather Clim. Extrem. 2018, 19, 29–41. [Google Scholar] [CrossRef]
  7. Gebrechorkos, S.H.; Hülsmann, S.; Bernhofer, C. Regional Climate Projections for Impact Assessment Studies in East Africa. Environ. Res. Lett. 2019, 14, 044031. [Google Scholar] [CrossRef]
  8. Lemma, H.; Frankl, A.; Griensven, A.; Poesen, J.; Adgo, E.; Nyssen, J. Identifying Erosion Hotspots in Lake Tana Basin from a Multisite Soil and Water Assessment Tool Validation: Opportunity for Land Managers. Land Degrad. Dev. 2019, 30, 1449–1467. [Google Scholar] [CrossRef]
  9. Zeleke, G.; Hurni, H. Implications of Land Use and Land Cover Dynamics for Mountain Resource Degradation in the Northwestern Ethiopian Highlands. Mt. Res. Dev. 2001, 21, 184–191. [Google Scholar] [CrossRef]
  10. Astuti, A.J.D.; Annys, S.; Dessie, M.; Nyssen, J.; Dondeyne, S. To What Extent Is Hydrologic Connectivity Taken into Account in Catchment Studies in the Lake Tana Basin, Ethiopia? A Review. Land 2022, 11, 2165. [Google Scholar] [CrossRef]
  11. Birhanu, A.; Masih, I.; van der Zaag, P.; Nyssen, J.; Cai, X. Impacts of Land Use and Land Cover Changes on Hydrology of the Gumara Catchment, Ethiopia. Phys. Chem. Earth Parts A/B/C 2019, 112, 165–174. [Google Scholar] [CrossRef]
  12. Engdaw, F.; Fetahi, T.; Kifle, D. Land Use/Land Cover Dynamics in the Northern Watershed of Lake Tana: Implications for Water Quality. Front. Environ. Sci. 2024, 12, 1426789. [Google Scholar] [CrossRef]
  13. Tikuye, B.G.; Ray, R.L.; Gebeyehu, K.; Teshome, M. Assessing the Influence of Land Use/Land Cover Dynamics and Climate Change on Water Resources in Upper Blue Nile, Ethiopia. J. Water Clim. Change 2024, 15, 4745–4774. [Google Scholar] [CrossRef]
  14. Abegaz, N.T.; Tsidu, G.M.; Arsiso, B.K. Establishing and Modeling the Causality Relationship of Hydro-Climatic and Land Cover Change Variables with Water Quality over Lake Tana, Ethiopia. Total Environ. Adv. 2024, 10, 200100. [Google Scholar] [CrossRef]
  15. Getachew, B.; Manjunatha, B.R.; Bhat, H.G. Modeling Projected Impacts of Climate and Land Use/Land Cover Changes on Hydrological Responses in the Lake Tana Basin, Upper Blue Nile River Basin, Ethiopia. J. Hydrol. 2021, 595, 125974. [Google Scholar] [CrossRef]
  16. Nkwasa, A.; Chawanda, C.J.; Van Griensven, A. Regionalization of the SWAT+ Model for Projecting Climate Change Impacts on Sediment Yield: An Application in the Nile Basin. J. Hydrol. Reg. Stud. 2022, 42, 101152. [Google Scholar] [CrossRef]
  17. Poppe, L.; Frankl, A.; Poesen, J.; Admasu, T.; Dessie, M.; Adgo, E.; Deckers, J.; Nyssen, J. Geomorphology of the Lake Tana Basin, Ethiopia. J. Maps 2013, 9, 431–437. [Google Scholar] [CrossRef]
  18. Sisay, M.G.; Tsegaye, E.A.; Tolossa, A.R.; Nyssen, J.; Frankl, A.; Ranst, E.V.; Dondeyne, S. Soil-Forming Factors of High-Elevation Mountains along the East African Rift Valley: The Case of the Mount Guna Volcano, Ethiopia. Soil Syst. 2024, 8, 38. [Google Scholar] [CrossRef]
  19. Dessie, M.; Verhoest, N.E.C.; Pauwels, V.R.N.; Adgo, E.; Deckers, J.; Poesen, J.; Nyssen, J. Water Balance of a Lake with Floodplain Buffering: Lake Tana, Blue Nile Basin, Ethiopia. J. Hydrol. 2015, 522, 174–186. [Google Scholar] [CrossRef]
  20. Setegn, S.G.; Rayner, D.; Melesse, A.M.; Dargahi, B.; Srinivasan, R. Impact of Climate Change on the Hydroclimatology of Lake Tana Basin, Ethiopia. Water Resour. Res. 2011, 47, 2010WR009248. [Google Scholar] [CrossRef]
  21. Earth Resources Observation And Science (EROS) Center. Shuttle Radar Topography Mission (SRTM) 1 Arc-Second Global. 2017. [Google Scholar] [CrossRef]
  22. Zhang, X.; Liu, L.; Chen, X.; Gao, Y.; Xie, S.; Mi, J. GLC_FCS30: Global Land-Cover Product with Fine Classification System at 30 m Using Time-Series Landsat Imagery. Earth Syst. Sci. Data 2021, 13, 2753–2776. [Google Scholar] [CrossRef]
  23. Congalton, R.G. Thematic and Positional Accuracy Assess- Ment of Digital Remotely Sensed Data. In Proceedings of the Seventh Annual Forest Inventory and Analysis Symposium, Washington, DC, USA, 3–6 October 2005; McRoberts, R.E., Reams, G.A., McWilliams, H., Eds.; U.S. Department of Agriculture, Forest Service: Portland, ME, USA, 2007; pp. 149–154. [Google Scholar]
  24. Lillesand, T.M.; Kiefer, R.W.; Chipman, J.W. Remote Sensing and Image Interpretation, 5th ed.; Wiley: New York, NY, UYA, 2004; ISBN 978-0-471-15227-9. [Google Scholar]
  25. Aldwaik, S.Z.; Pontius, R.G. Intensity Analysis to Unify Measurements of Size and Stationarity of Land Changes by Interval, Category, and Transition. Landsc. Urban Plan. 2012, 106, 103–114. [Google Scholar] [CrossRef]
  26. Pontius, R.G.; Gao, Y.; Giner, N.M.; Kohyama, T.; Osaki, M.; Hirose, K. Design and Interpretation of Intensity Analysis Illustrated by Land Change in Central Kalimantan, Indonesia. Land 2013, 2, 365–369. [Google Scholar] [CrossRef]
  27. Exavier, R.; Zeilhofer, P. OpenLand: Software for Quantitative Analysis and Visualization of Land Use and Cover Change. R J. 2021, 12, 359–371. [Google Scholar] [CrossRef]
  28. R Core Team R: A Language and Environment for Statistical Computing. 2023. Available online: https://www.R-project.org/ (accessed on 10 October 2023).
  29. Funk, C.; Peterson, P.; Landsfeld, M.; Pedreros, D.; Verdin, J.; Shukla, S.; Husak, G.; Rowland, J.; Harrison, L.; Hoell, A.; et al. The Climate Hazards Infrared Precipitation with Stations—A New Environmental Record for Monitoring Extremes. Sci. Data 2015, 2, 150066. [Google Scholar] [CrossRef] [PubMed]
  30. Ayehu, G.T.; Tadesse, T.; Gessesse, B.; Dinku, T. Validation of New Satellite Rainfall Products over the Upper Blue Nile Basin, Ethiopia. Atmos. Meas. Tech. 2018, 11, 1921–1936. [Google Scholar] [CrossRef]
  31. Diem, J.E.; Sung, H.S.; Konecky, B.L.; Palace, M.W.; Salerno, J.; Hartter, J. Rainfall Characteristics and Trends—And the Role of Congo Westerlies—In the Western Uganda Transition Zone of Equatorial Africa From 1983 to 2017. JGR Atmos. 2019, 124, 10712–10729. [Google Scholar] [CrossRef]
  32. Dinku, T.; Funk, C.; Peterson, P.; Maidment, R.; Tadesse, T.; Gadain, H.; Ceccato, P. Validation of the CHIRPS Satellite Rainfall Estimates over Eastern of Africa: Validation of the CHIRPS Satellite Rainfall Estimates. Q. J. R. Meteorol. Soc. 2018, 144, 292–312. [Google Scholar] [CrossRef]
  33. Kendall, M.G. Rank Correlation Methods, 4th ed.; Charles Griffin: London, UK, 1975. [Google Scholar]
  34. Mann, H.B. Nonparametric Tests Against Trend. Econometrica 1945, 13, 245–259. [Google Scholar] [CrossRef]
  35. Yue, S.; Pilon, P.; Phinney, B.; Cavadias, G. The Influence of Autocorrelation on the Ability to Detect Trend in Hydrological Series. Hydrol. Process. 2002, 16, 1807–1829. [Google Scholar] [CrossRef]
  36. Bronaugh, D.A. Werner Package “Zyp” 2015. Available online: http://cran.nexr.com/web/packages/zyp/zyp.pdf (accessed on 27 October 2024).
  37. Sen, P.K. Estimates of the Regression Coefficient Based on Kendall’s Tau. J. Am. Stat. Assoc. 1968, 63, 1379–1389. [Google Scholar] [CrossRef]
  38. Theil, H. A Rank-Invariant Method of Linear and Polynomial Regression Analysis. In Henri Theil’s Contributions to Economics and Econometrics: Econometric Theory and Methodology; Raj, B., Koerts, J., Eds.; Springer: Dordrecht, The Netherlands, 1992; pp. 345–381. ISBN 978-94-011-2546-8. [Google Scholar]
  39. Wischmeier, W.H.; Smith, D.D. Predicting Rainfall Erosion Losses: A Guide to Conservation Planning; Agriculture Handbook; US Department of Agriculture: Washington, DC, USA, 1978; Volume 537.
  40. Renard, K.G. Predicting Soil Erosion by Water: A Guide to Conservation Planning with the Revised Universal Soil Loss Equation (RUSLE); U.S. Department of Agriculture, Agricultural Research Service: Washington, DC, USA, 1997; ISBN 978-0-16-048938-9.
  41. Arnoldus, H. Methodology Used to Determine the Maximum Potential Average Annual Soil Loss Due to Sheet and Rill Erosion in Morocco. FAO Soils Bull. 1977, 34, 39–48. [Google Scholar]
  42. Renard, K.G.; Freimund, J.R. Using Monthly Precipitation Data to Estimate the R-Factor in the Revised USLE. J. Hydrol. 1994, 157, 287–306. [Google Scholar] [CrossRef]
  43. Vrieling, A.; Sterk, G.; de Jong, S.M. Satellite-Based Estimation of Rainfall Erosivity for Africa. J. Hydrol. 2010, 395, 235–241. [Google Scholar] [CrossRef]
  44. Fenta, A.A.; Yasuda, H.; Shimizu, K.; Haregeweyn, N.; Kawai, T.; Sultan, D.; Ebabu, K.; Belay, A.S. Spatial Distribution and Temporal Trends of Rainfall and Erosivity in the Eastern Africa Region. Hydrol. Process. 2017, 31, 4555–4567. [Google Scholar] [CrossRef]
  45. Gashaw, T.; Tulu, T.; Argaw, M.; Worqlul, A.W. Modeling the Hydrological Impacts of Land Use/Land Cover Changes in the Andassa Watershed, Blue Nile Basin, Ethiopia. Sci. Total Environ. 2018, 619–620, 1394–1408. [Google Scholar] [CrossRef]
  46. Astuti, A.J.D.; Dondeyne, S.; Lemma, H.; Nyssen, J.; Annys, S.; Frankl, A. Recent Dynamics in Sediment Connectivity in the Ethiopian Highlands. Reg. Environ. Change 2024, 24, 109. [Google Scholar] [CrossRef]
  47. Zerihun, M.; Mohammedyasin, M.S.; Sewnet, D.; Adem, A.A.; Lakew, M. Assessment of Soil Erosion Using RUSLE, GIS and Remote Sensing in NW Ethiopia. Geoderma Reg. 2018, 12, 83–90. [Google Scholar] [CrossRef]
  48. Gebrehiwot, S.; Gärdenäs, A.; Bewket, W.; Seibert, J.; Ilstedt, U.; Bishop, K. The Long-Term Hydrology of East Africa’s Water Tower: Statistical Change Detection in the Watersheds of the Abbay Basin. Reg. Environ. Change 2014, 14, 321–331. [Google Scholar] [CrossRef]
  49. Solomon, N.; Birhane, E.; Tilahun, M.; Schauer, M.; Gebremedhin, M.A.; Gebremariam, F.T.; Gidey, T.; Newete, S.W. Revitalizing Ethiopia’s Highland Soil Degradation: A Comprehensive Review on Land Degradation and Effective Management Interventions. Discov. Sustain. 2024, 5, 106. [Google Scholar] [CrossRef]
  50. Taddese, G. Land Degradation: A Challenge to Ethiopia. Environ. Manag. 2001, 27, 815–824. [Google Scholar] [CrossRef]
  51. Zegeye, M. An Opinion Note on Population Growth and Land Degradation in Ethiopia. Reg. Environ. Change 2024, 21, 111. [Google Scholar] [CrossRef]
  52. Kabanza, A.K.; Dondeyne, S.; Kimaro, D.N.; Kafiriti, E.; Poesen, J.; Deckers, J.A. Effectiveness of Soil Conservation Measures in Two Contrasting Landscape Units of South Eastern Tanzania. Z. Geomorphol. 2013, 57, 269–288. [Google Scholar] [CrossRef] [PubMed]
  53. Mortimore, M.; Tiffen, M. Population Growth and a Sustainable Environment. The Machakos Story. Environment 1994, 10–20, 28–32. [Google Scholar] [CrossRef] [PubMed]
  54. Nyssen, J.; Poesen, J.; Haile, M.; Moeyersons, J.; Deckers, J.; Hurni, H. Effects of Land Use and Land Cover on Sheet and Rill Erosion Rates in the Tigray Highlands, Ethiopia. Z. Geomorphol. 2009, 53, 171–197. [Google Scholar] [CrossRef]
  55. Nigussie, Z.; Tsunekawa, A.; Haregeweyn, N.; Adgo, E.; Nohmi, M.; Tsubo, M.; Aklog, D.; Meshesha, D.T.; Abele, S. Factors Affecting Small-Scale Farmers’ Land Allocation and Tree Density Decisions in an Acacia Decurrens-Based Taungya System in Fagita Lekoma District, North-Western Ethiopia. Small-Scale For. 2017, 16, 219–233. [Google Scholar] [CrossRef]
  56. Teshager Abeje, M.; Tsunekawa, A.; Adgo, E.; Haregeweyn, N.; Nigussie, Z.; Ayalew, Z.; Elias, A.; Molla, D.; Berihun, D. Exploring Drivers of Livelihood Diversification and Its Effect on Adoption of Sustainable Land Management Practices in the Upper Blue Nile Basin, Ethiopia. Sustainability 2019, 11, 2991. [Google Scholar] [CrossRef]
  57. Bulti, D.T.; Abebe, B.G. Analyzing the Impacts of Urbanization on Runoff Characteristics in Adama City, Ethiopia. SN Appl. Sci. 2020, 2, 1–13. [Google Scholar] [CrossRef]
  58. Moisa, M.B.; Dejene, I.N.; Gemeda, D.O. Integration of Geospatial Technologies with Multiple Regression Model for Urban Land Use Land Cover Change Analysis and Its Impact on Land Surface Temperature in Jimma City, Southwestern Ethiopia. Appl. Geomat. 2022, 14, 653–667. [Google Scholar] [CrossRef]
  59. Ssewankambo, G.; Kabenge, I.; Nakawuka, P.; Wanyama, J.; Zziwa, A.; Bamutaze, Y.; Gwapedza, D.; Palmer, C.T.; Tanner, J.; Mantel, S.; et al. Assessing Soil Erosion Risk in a Peri-Urban Catchment of the Lake Victoria Basin. Model. Earth Syst. Environ. 2023, 9, 1633–1649. [Google Scholar] [CrossRef]
  60. OECD; Policy Studies Institute (Eds.) Rural Development Strategy Review of Ethiopia: Reaping the Benefits of Urbanisation; OECD Development Pathways; OECD Publishing: Paris, France, 2020; ISBN 978-92-64-52648-8. [Google Scholar]
  61. Lenaerts, L.; Breusers, M.; Dondeyne, S.; Bauer, H.; Haile, M.; Deckers, J. ‘This Pasture Is Ours since Ancient Times’: An Ethnographic Analysis of the Reduction in Conflicts along the Post-1991 Afar-Tigray Regional Boundary. J. Mod. Afr. Stud. 2014, 52, 25–44. [Google Scholar] [CrossRef]
  62. Gebrechorkos, S.H.; Hülsmann, S.; Bernhofer, C. Long-Term Trends in Rainfall and Temperature Using High-Resolution Climate Datasets in East Africa. Sci. Rep. 2019, 9, 11376. [Google Scholar] [CrossRef] [PubMed]
  63. Gudoshava, M.; Wainwright, C.; Hirons, L.; Endris, H.S.; Segele, Z.T.; Woolnough, S.; Atheru, Z.; Artan, G. Atmospheric and Oceanic Conditions Associated with Early and Late Onset for Eastern Africa Short Rains. Int. J. Climatol. 2022, 42, 6562–6578. [Google Scholar] [CrossRef]
  64. Demissie, T.; Gebrechorkos, S.; Radeny, M.; Solomon, D. Climate Risk Profile for East Africa; International Livestock Research Institute (ILRI): Nairobi, Kenya, 2024; p. 11. [Google Scholar]
  65. Haregeweyn, N.; Tsunekawa, A.; Poesen, J.; Tsubo, M.; Meshesha, D.T.; Fenta, A.A.; Nyssen, J.; Adgo, E. Comprehensive Assessment of Soil Erosion Risk for Better Land Use Planning in River Basins: Case Study of the Upper Blue Nile River. Sci. Total Environ. 2017, 574, 95–108. [Google Scholar] [CrossRef] [PubMed]
  66. Rutebuka, J.; De Taeye, S.; Kagabo, D.; Verdoodt, A. Calibration and Validation of Rainfall Erosivity Estimators for Application in Rwanda. CATENA 2020, 190, 104538. [Google Scholar] [CrossRef]
  67. Zhang, X.; Zhao, T.; Xu, H.; Liu, W.; Wang, J.; Chen, X.; Liu, L. GLC_FCS30D: The First Global 30 m Land-Cover Dynamics Monitoring Product with a Fine Classification System for the Period from 1985 to 2022 Generated Using Dense-Time-Series Landsat Imagery and the Continuous Change-Detection Method. Earth Syst. Sci. Data 2024, 16, 1353–1381. [Google Scholar] [CrossRef]
  68. Assaye, H.; Nyssen, J.; Poesen, J.; Lemma, H.; Meshesha, D.T.; Wassie, A.; Adgo, E.; Fentie, D.; Frankl, A. Event-based Run-off and Sediment Yield Dynamics and Controls in the Subhumid Headwaters of the Blue Nile, Ethiopia. Land Degrad. Dev. 2022, 33, 565–580. [Google Scholar] [CrossRef]
  69. Demissie, S.; Meshesha, D.T.; Adgo, E.; Haregeweyn, N.; Tsunekawa, A.; Ayana, M.; Mulualem, T.; Wubet, A. Effects of Soil Bund Spacing on Runoff, Soil Loss, and Soil Water Content in the Lake Tana Basin of Ethiopia. Agric. Water Manag. 2022, 274, 107926. [Google Scholar] [CrossRef]
  70. Gashaw, T.; Tulu, T.; Argaw, M. Erosion Risk Assessment for Prioritization of Conservation Measures in Geleda Watershed, Blue Nile Basin, Ethiopia. Environ. Syst. Res. 2017, 6, 1. [Google Scholar] [CrossRef]
Figure 2. Evolution of land use/landcover (LUC) in the Lake Tana Basin between 1985 and 2022 based on the Global Landcover Fine Classification.
Remotesensing 17 00747 g002
Figure 3. Interval level changes in LULC in the Lake Tana Basin. The left side of the plot shows the total percentage change in landcover for each time interval, while the right side displays the annual percentage change, with changes categorized as either “Fast” (red) or “Slow” (green). (The annual change is expressed as a percentage of the total area).
Remotesensing 17 00747 g003
Figure 4. Spatial distribution over the Lake Tana Basin (Ethiopia) of (a) mean annual rainfall (mm yr−1), with grey shaded areas indicating mean latitudinal and longitudinal gradients. (b) Mean seasonal rainfall (mm season−1) with FMAM (February to May), the minor rainy season or Belg; JJAS (June to September), the major rainy season or Kiremt; and ONDJ (October to January), the dry season, or Bega, based on CHIRPS data from 1985 to 2022. (Statistics in the text refer only to the basin).
Remotesensing 17 00747 g004
Figure 5. Monotonic trends for the annual rainfall (mm yr−1) in the Lake Tana Basin, Ethiopia, over the period 1985 to 2022 based on CHIRPS data. Crosses (×) indicate pixels with significant (p < 0.05) increases or decreases in rainfall. (Statistics in the text are only for the basin).
Remotesensing 17 00747 g005
Figure 6. The spatial distribution of (a) the mean annual R-factor (MJ mm ha−1 h−1 yr−1) and (b) monotonic trends for the R-factor (MJ mm ha−1 h−1 yr−1) in the Lake Tana Basin (Ethiopia) based on CHIRPS data from 1985 to 2022. Crosses (×) indicate pixels with significant (p < 0.05) increases or decreases in rainfall trends. (Statistics in the text are only for the basin).
Remotesensing 17 00747 g006
Figure 7. Spatial distribution of the relative change in potential soil loss due to the combined effect of changes in landcover and rainfall erosivity for the periods 1985–1995, 1995–2005, 2005–2015, and 2015–2022 in Lake Tana Basin.
Remotesensing 17 00747 g007
Table 1. Accuracy of the Global Landcover Fine Classification System (GLC_FCS30D) for Lake Tana Basin (Ethiopia) based on 378 ground truth points.
LandcoverProducers’ Accuracy (%)Users’ Accuracy (%)
200520142022200520142022
Cropland78.089.770.875.097.587.6
Tree cover83.689.890.781.958.787.0
Shrubland74.476.680.578.170.660.0
Grassland71.481.380.031.347.325.0
Bare areas10.013.512.525.0100.020.0
Wetland92.983.378.6100.090.991.7
Impervious surfaces61.193.884.691.7100.091.8
Water body100.075.087.575.0100.0100.0
Disclaimer/Publisher’s Note: The statements, opinions and data contained in all publications are solely those of the individual author(s) and contributor(s) and not of MDPI and/or the editor(s). MDPI and/or the editor(s) disclaim responsibility for any injury to people or property resulting from any ideas, methods, instructions or products referred to in the content.

