Article

From Browning to Greening: Climate-Driven Vegetation Change in the Irtysh River Basin After the Global Warming Hiatus

1
State Key Laboratory of Ecological Safety and Sustainable Development in Arid Lands, Xinjiang Institute of Ecology and Geography, Chinese Academy of Sciences, Urumqi 830011, China
2
Research Center for Ecology and Environment of Central Asia, Chinese Academy of Sciences, Urumqi 830011, China
3
University of Chinese Academy of Sciences, Beijing 100049, China
4
Sino-Kazakhstan Joint Laboratory for Remote Sensing Technology and Applications, Almaty 050040, Kazakhstan
5
Faculty of Geography and Environment, Al-Farabi Kazakh National University, Almaty 050040, Kazakhstan
6
Kazakh Research Institute of Soil Science and Agrochemistry Named After U. U. Uspanov, Almaty 050060, Kazakhstan
*
Author to whom correspondence should be addressed.
Remote Sens. 2025, 17(7), 1135; https://doi.org/10.3390/rs17071135
Submission received: 24 January 2025 / Revised: 19 March 2025 / Accepted: 20 March 2025 / Published: 22 March 2025
(This article belongs to the Section Remote Sensing in Agriculture and Vegetation)

Abstract

:
The Irtysh River Basin (IRB), a transboundary river basin spanning China, Kazakhstan, and Russia, has experienced significant vegetation changes driven by climate change and human activities. This study investigated the spatiotemporal dynamics of different types of vegetation in the IRB from 2001 to 2020 using the normalized difference vegetation index (NDVI) and quantified the contributions of driving forces to the evolution of vegetation. The results revealed that the end of the global warming hiatus in 2013 aggravated climate changes, leading to an abrupt shift in NDVI dynamics. This spatial shift was mainly reflected in grassland and farmland in the arid regions of northern Kazakhstan, where overall vegetation cover has improved in recent years. Precipitation and temperature were identified as the main drivers of spatial vegetation differentiation in the basin, with precipitation being more limiting in arid regions, while temperature affected non-arid regions at higher latitudes more strongly, and climate change had a greater positive effect on vegetation in non-arid regions than in arid regions. The relative contribution of climatic factors to vegetation changes decreased from 45.93% before the abrupt change to 42.65% after the abrupt change, while the contribution of other drivers, including human activities, increased from 54.07% to 57.35%. The combined effect of climate change and human activities was more significant than that of individual drivers, with human interventions such as environmental policies and ecological restoration projects having strongly contributed to the greening trend in recent years. This study highlights the need for zonal management strategies in the IRB, prioritizing sustainable forest management in non-arid zones and sustaining environmental protection projects in arid regions to support vegetation restoration and sustainable ecosystem management.

1. Introduction

Vegetation, as a basic part of terrestrial ecosystems, is the key link in water–soil–biology–atmosphere interactions and plays a pivotal role in moderating the dynamic equilibrium in the global carbon balance, alleviating climate change, and preserving biodiversity [1,2,3]. The modification of vegetation cover resulting from anthropogenic activities and climate change, such as deforestation and desertification, poses a serious challenge to the achievement of the Sustainable Development Goals (SDGs) initiated by the United Nations. With continuous advancements in remote sensing technology and updates in public data products, conducting large-scale and long-term research on vegetation has become more convenient. The normalized difference vegetation index (NDVI) has been recognized as a robust measure for assessing greening levels and vegetation dynamics, and as a result, it has been extensively employed in monitoring environmental feedback associated with vegetation dynamics [4,5,6].
In recent decades, climate change has driven global landscape restructuring, which has had far-reaching impacts on global vegetation patterns [7,8]. Temperature is the main factor controlling vegetation growth in some mid-latitude areas of the Northern Hemisphere [9,10]. Over the past few decades, warming temperatures have accelerated the shrubification of high-latitude tundra, increased plant productivity within tundra biomes, and contributed to Arctic greening [11,12]. In parallel, the warming climate has also significantly affected vegetation phenology, considerably advancing the onset of the growing season in mid-to-high-latitude regions in the Northern Hemisphere [13,14], whereas this trend toward earlier spring phenology has waned in more than 60% of boreal forests, especially in Siberia and northwestern North America, since the end of the 1990s [15]. Precipitation modifies vegetation water status by regulating soil moisture, which in turn controls vegetation development [16]. It has been noted that vegetation in desert and sandy ecosystems in semi-arid and arid regions with annual precipitation of less than 400 mm is particularly sensitive to climate change [17] and may amplify the effects of climate fluctuations in response to changes in factors such as land cover [18]. In general, vegetation growth is affected by and interacts with multiple natural factors, including temperature, precipitation, and radiation, together with long-term natural climatic oscillations [19,20,21]. For example, vegetation growth in the Mu Us Desert benefited mainly from increased precipitation, but wind speed and sunshine inhibited potential positive effects [22], while in the Romanian mountains, vegetation greening was promoted by warming temperatures but was suppressed in lowland areas due to increased evapotranspiration [23]. Clarification of the driving factors influencing vegetation dynamics and the quantitative identification of the impacts of climatic factors can provide effective information for responding to global change and realizing the sustainable development of ecosystems.
At present, many advances have been made in quantitative research on the relationship between vegetation and drivers, and methods such as the geographic detector model (GeoDetector), residual trend analysis, structural equation modeling, and partial derivative analysis have been widely used. Among these, the geographic detector model has the advantage of eliminating the need for linear assumptions and being able to obtain the interaction between factors in a more objective way compared to presetting the action paths of the factors, while the residual trend method can intuitively isolate the contributing roles of climate and other factors in a multidimensional way. For example, Zhang et al. [24], in the Loess Plateau, based on the GeoDetector model, found that the explanatory power of precipitation for both the maximum and average values of the vegetation index was significantly higher than that of other factors. In the Ferghana Basin, Zhang et al. [25] quantified the climatic and anthropogenic contributions using the residual trend method and showed that temperature and precipitation have synergistic or antagonistic effects on vegetation growth in different seasons, while Guo et al. [26] combined the residual trend and partial correlation analyses to characterize the vegetation cover on the Tibetan Plateau and found that the vegetation cover was negatively correlated with temperature and positively correlated with precipitation in the northeastern and southwestern regions, while the vegetation cover in the southeastern region displayed a completely opposite relationship with climatic factors. Numerous studies have shown that there is significant spatial variability in the response of vegetation to climate change and other factors due to the different hydrothermal conditions and vegetation types in different regions and at different scales.
In this context, the Irtysh River Basin (IRB), as a typical ecologically fragile area in the mid-to-high-latitude region of the Northern Hemisphere, provides a unique vehicle for exploring the response mechanisms of climate change and vegetation dynamics. The IRB is highly sensitive to global climate change, and as a transboundary river basin, its unique geographic location, topography, and climatic conditions give it the important responsibility of providing diverse ecosystem services to many countries along its course., and the growth and development of vegetation play an important role in water conservation, soil preservation, wind and sand control, biodiversity maintenance, and carbon sequestration [27]. Currently, due to the uniqueness and complexity of the regional location of the IRB, most studies on this basin have focused on water resources [28,29,30,31]. With the aggravation of climate change and other impacts, ecological problems, including vegetation and grassland degradation in the basin, have become increasingly prominent [29]. Although published studies have suggested that precipitation acts as a dominant driver of vegetation changes in arid and semiarid regions on a global scale [32,33], it is unclear whether the driving factors are similar at high spatial resolution scales, especially in ecologically fragile and data-scarce high-latitude regions. However, over the past 20 years, there have been significant changes in the global climate, particularly during the global warming hiatus. A growing number of studies have highlighted the sensitive responses of natural factors to the global warming hiatus, and these studies have reported changes in hydrological processes and altered atmospheric flow patterns [34,35,36], which have also led to a more multifaceted and complex understanding of regional-to-global natural variability caused by the impacts of climate change [37,38]. Vegetation serves as an important indicator of climate change and as an ecological barrier in the basin. Therefore, investigating whether the global warming hiatus has had an impact on vegetation changes in this region can provide a unique perspective and valuable insights for gaining a deeper understanding of the mechanisms through which climate change affects global greening.
To gain a deeper understanding of the response of vegetation dynamics to climate change across multiple dimensions in time and space and to provide decision-making support for global change, in this study, the Irtysh River Basin, located at mid-to-high latitudes and spanning several temperature zones, was selected as the research object. The objectives of this study were (1) to determine the spatial change pattern and its influencing factors at a 1 km grid scale using a geographic detector model, (2) to explore the dynamic responses of different vegetation types before and after the global warming hiatus, that is, over the past 20 years, using the Bayesian estimation algorithm of abrupt changes in seasons and trends (BEAST), and (3) to quantitatively assess the contribution of climate (temperature and precipitation) to the dynamic changes in vegetation using the residual trend model.

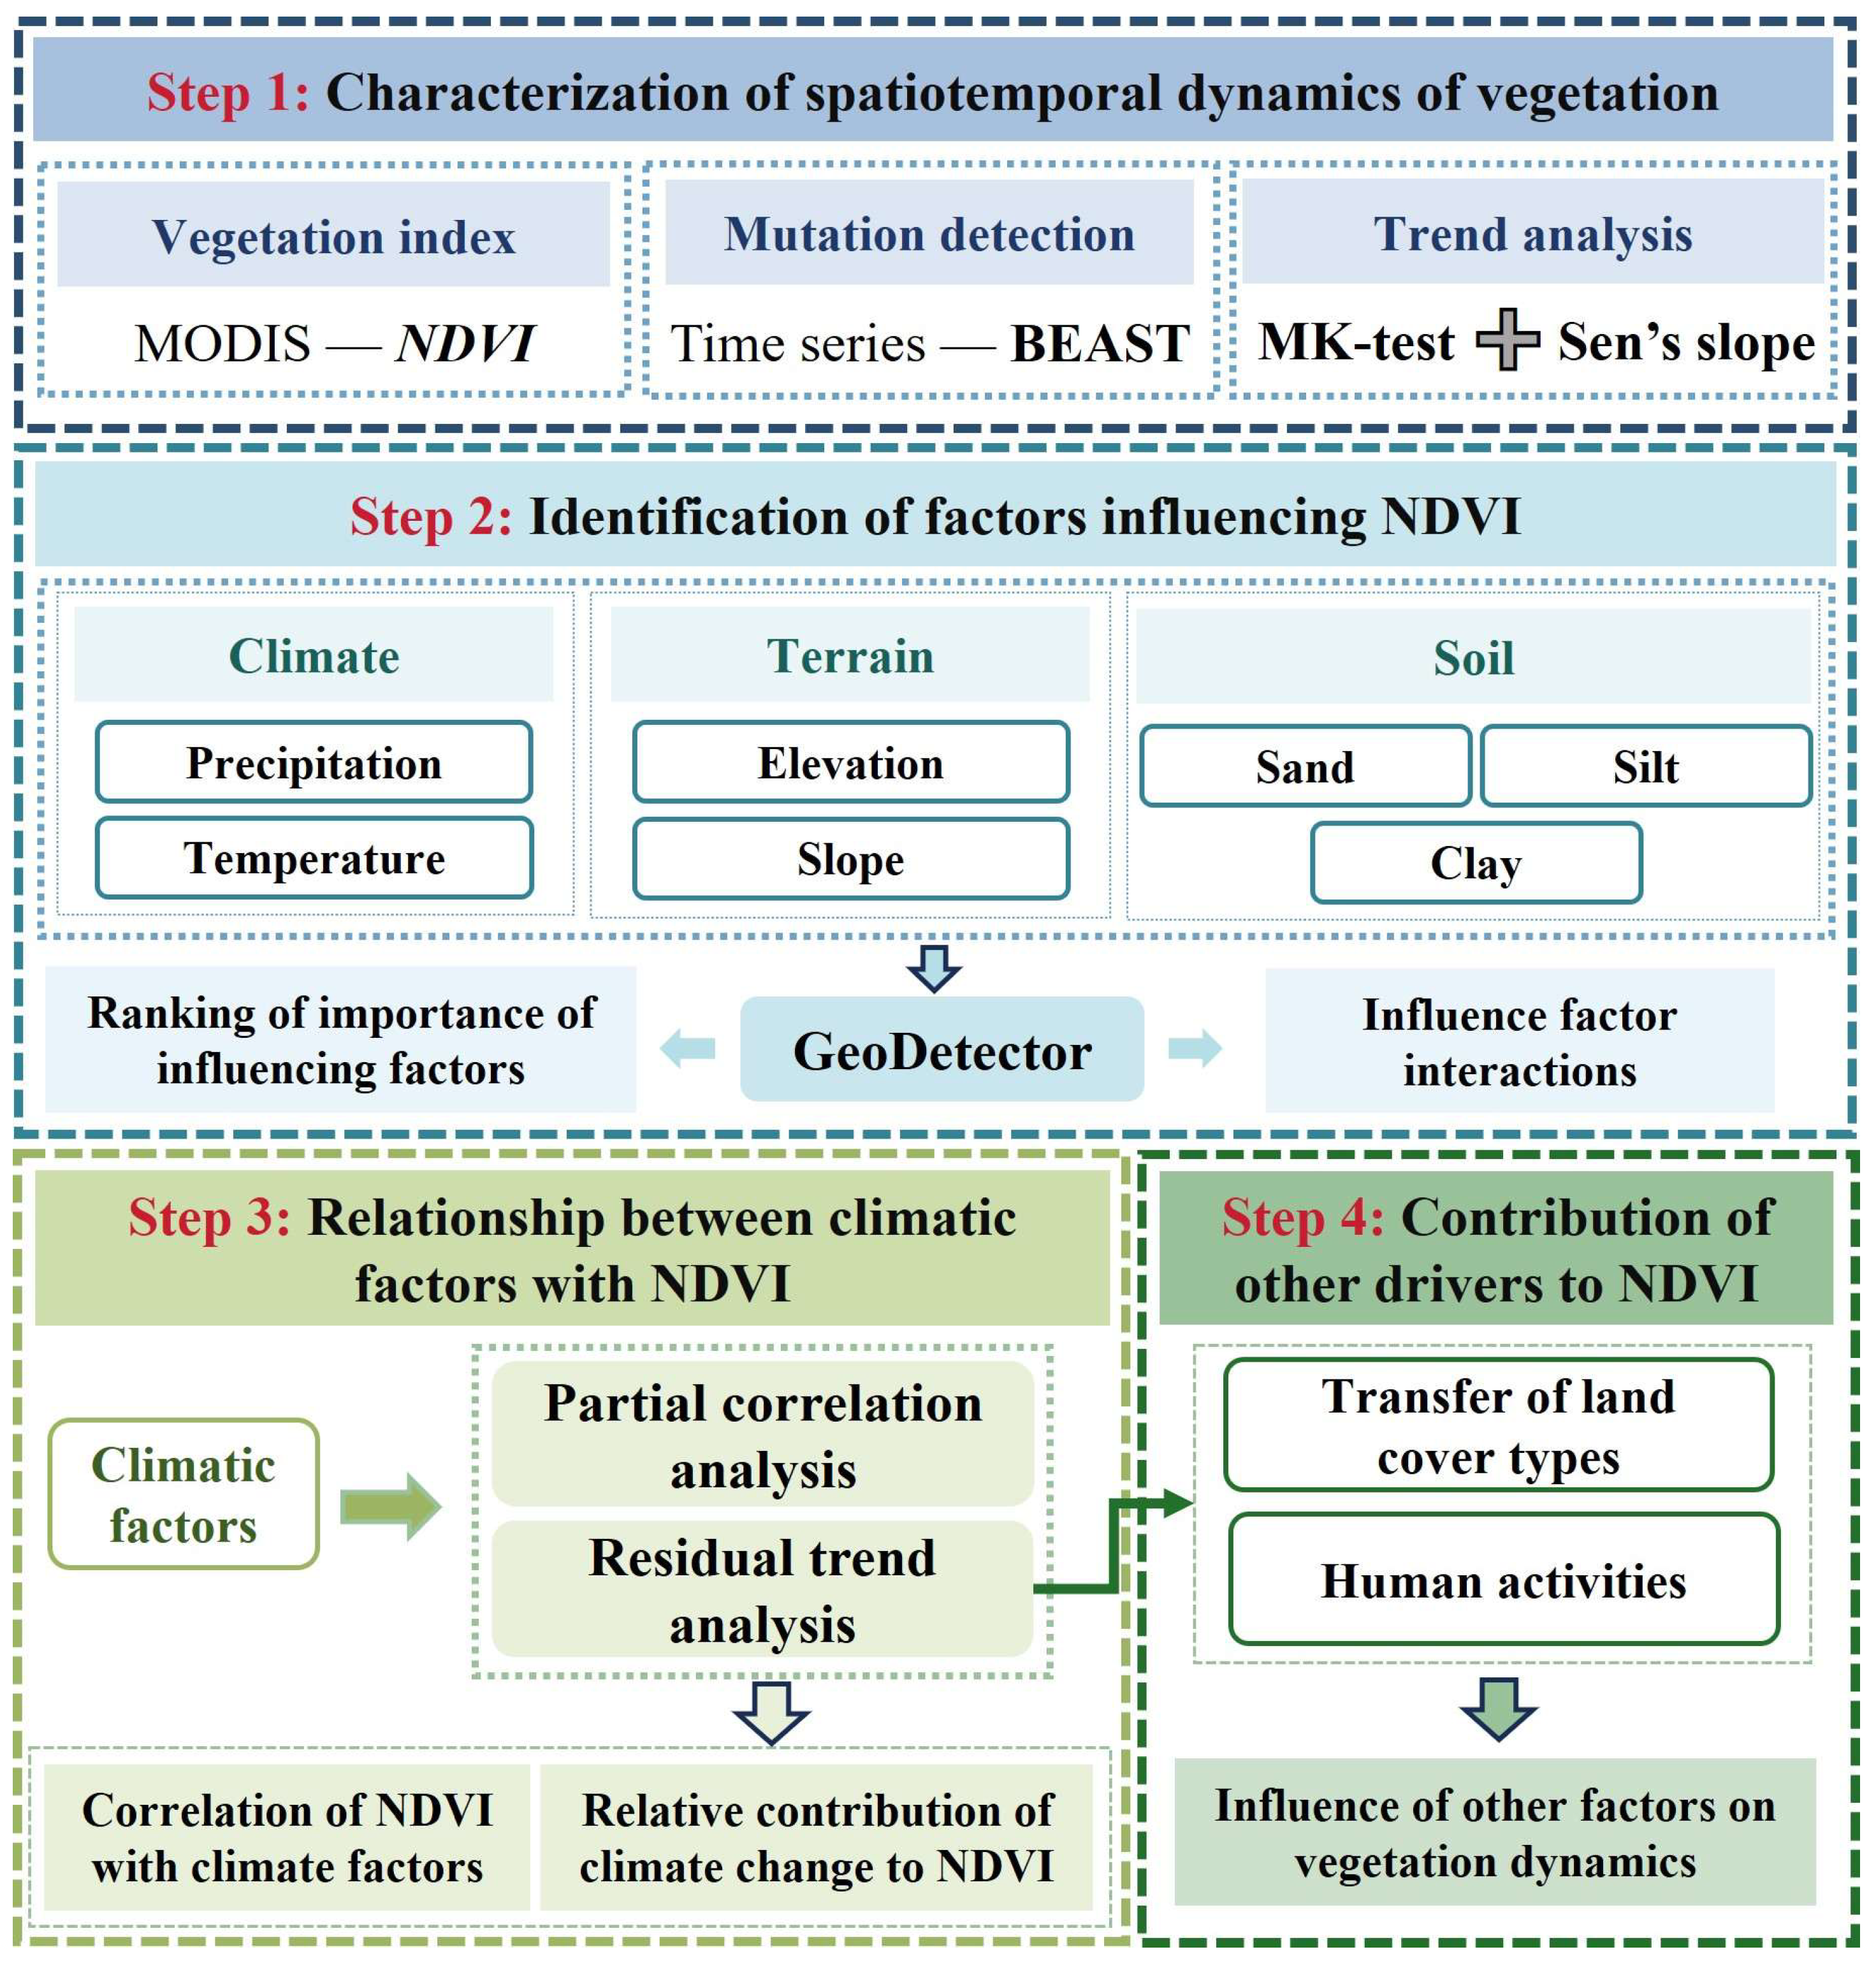
2. Materials and Methods
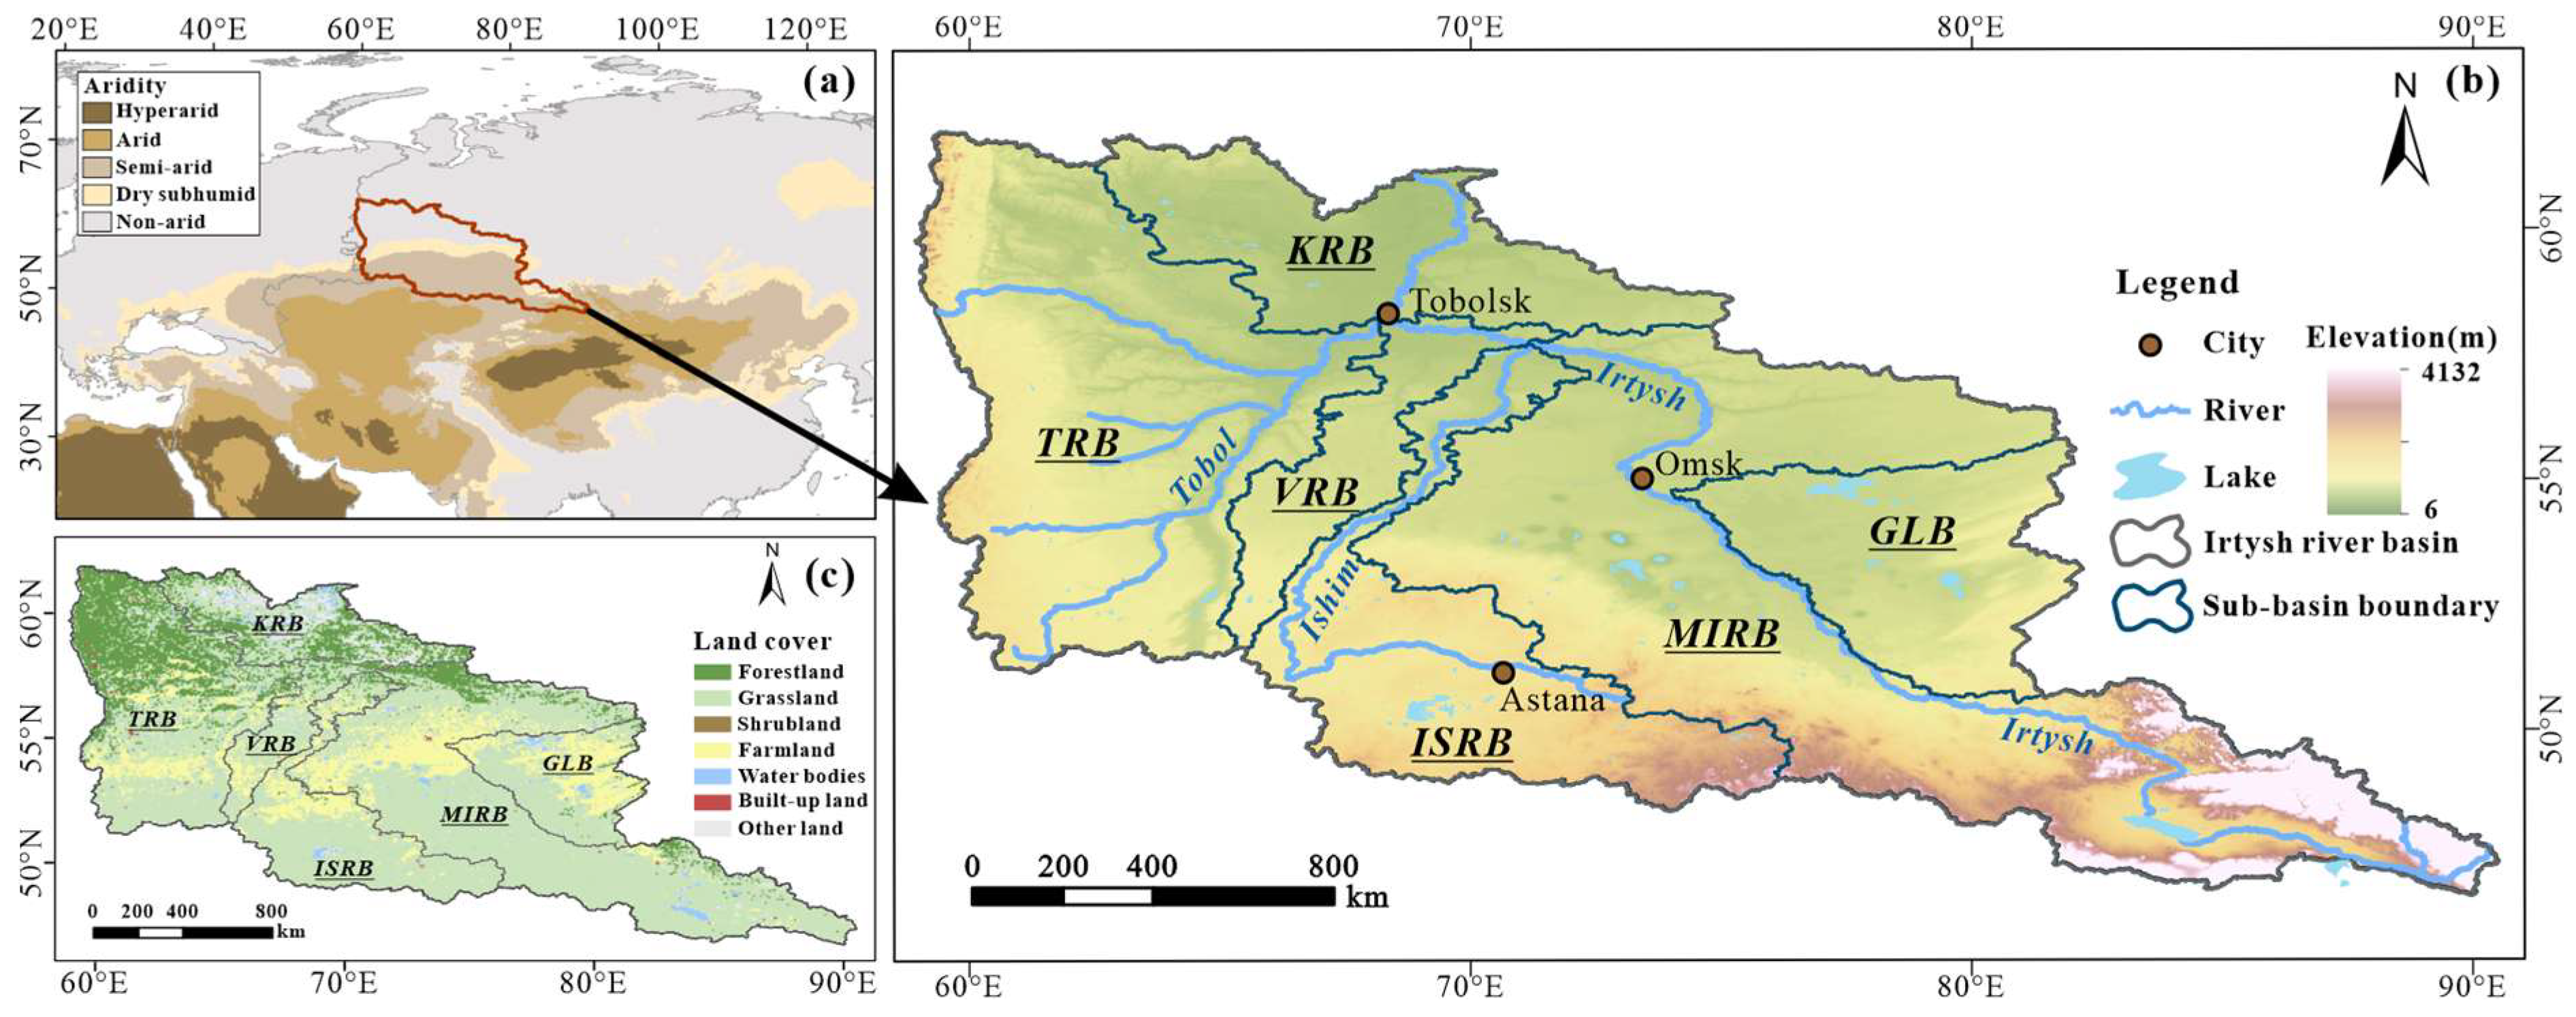
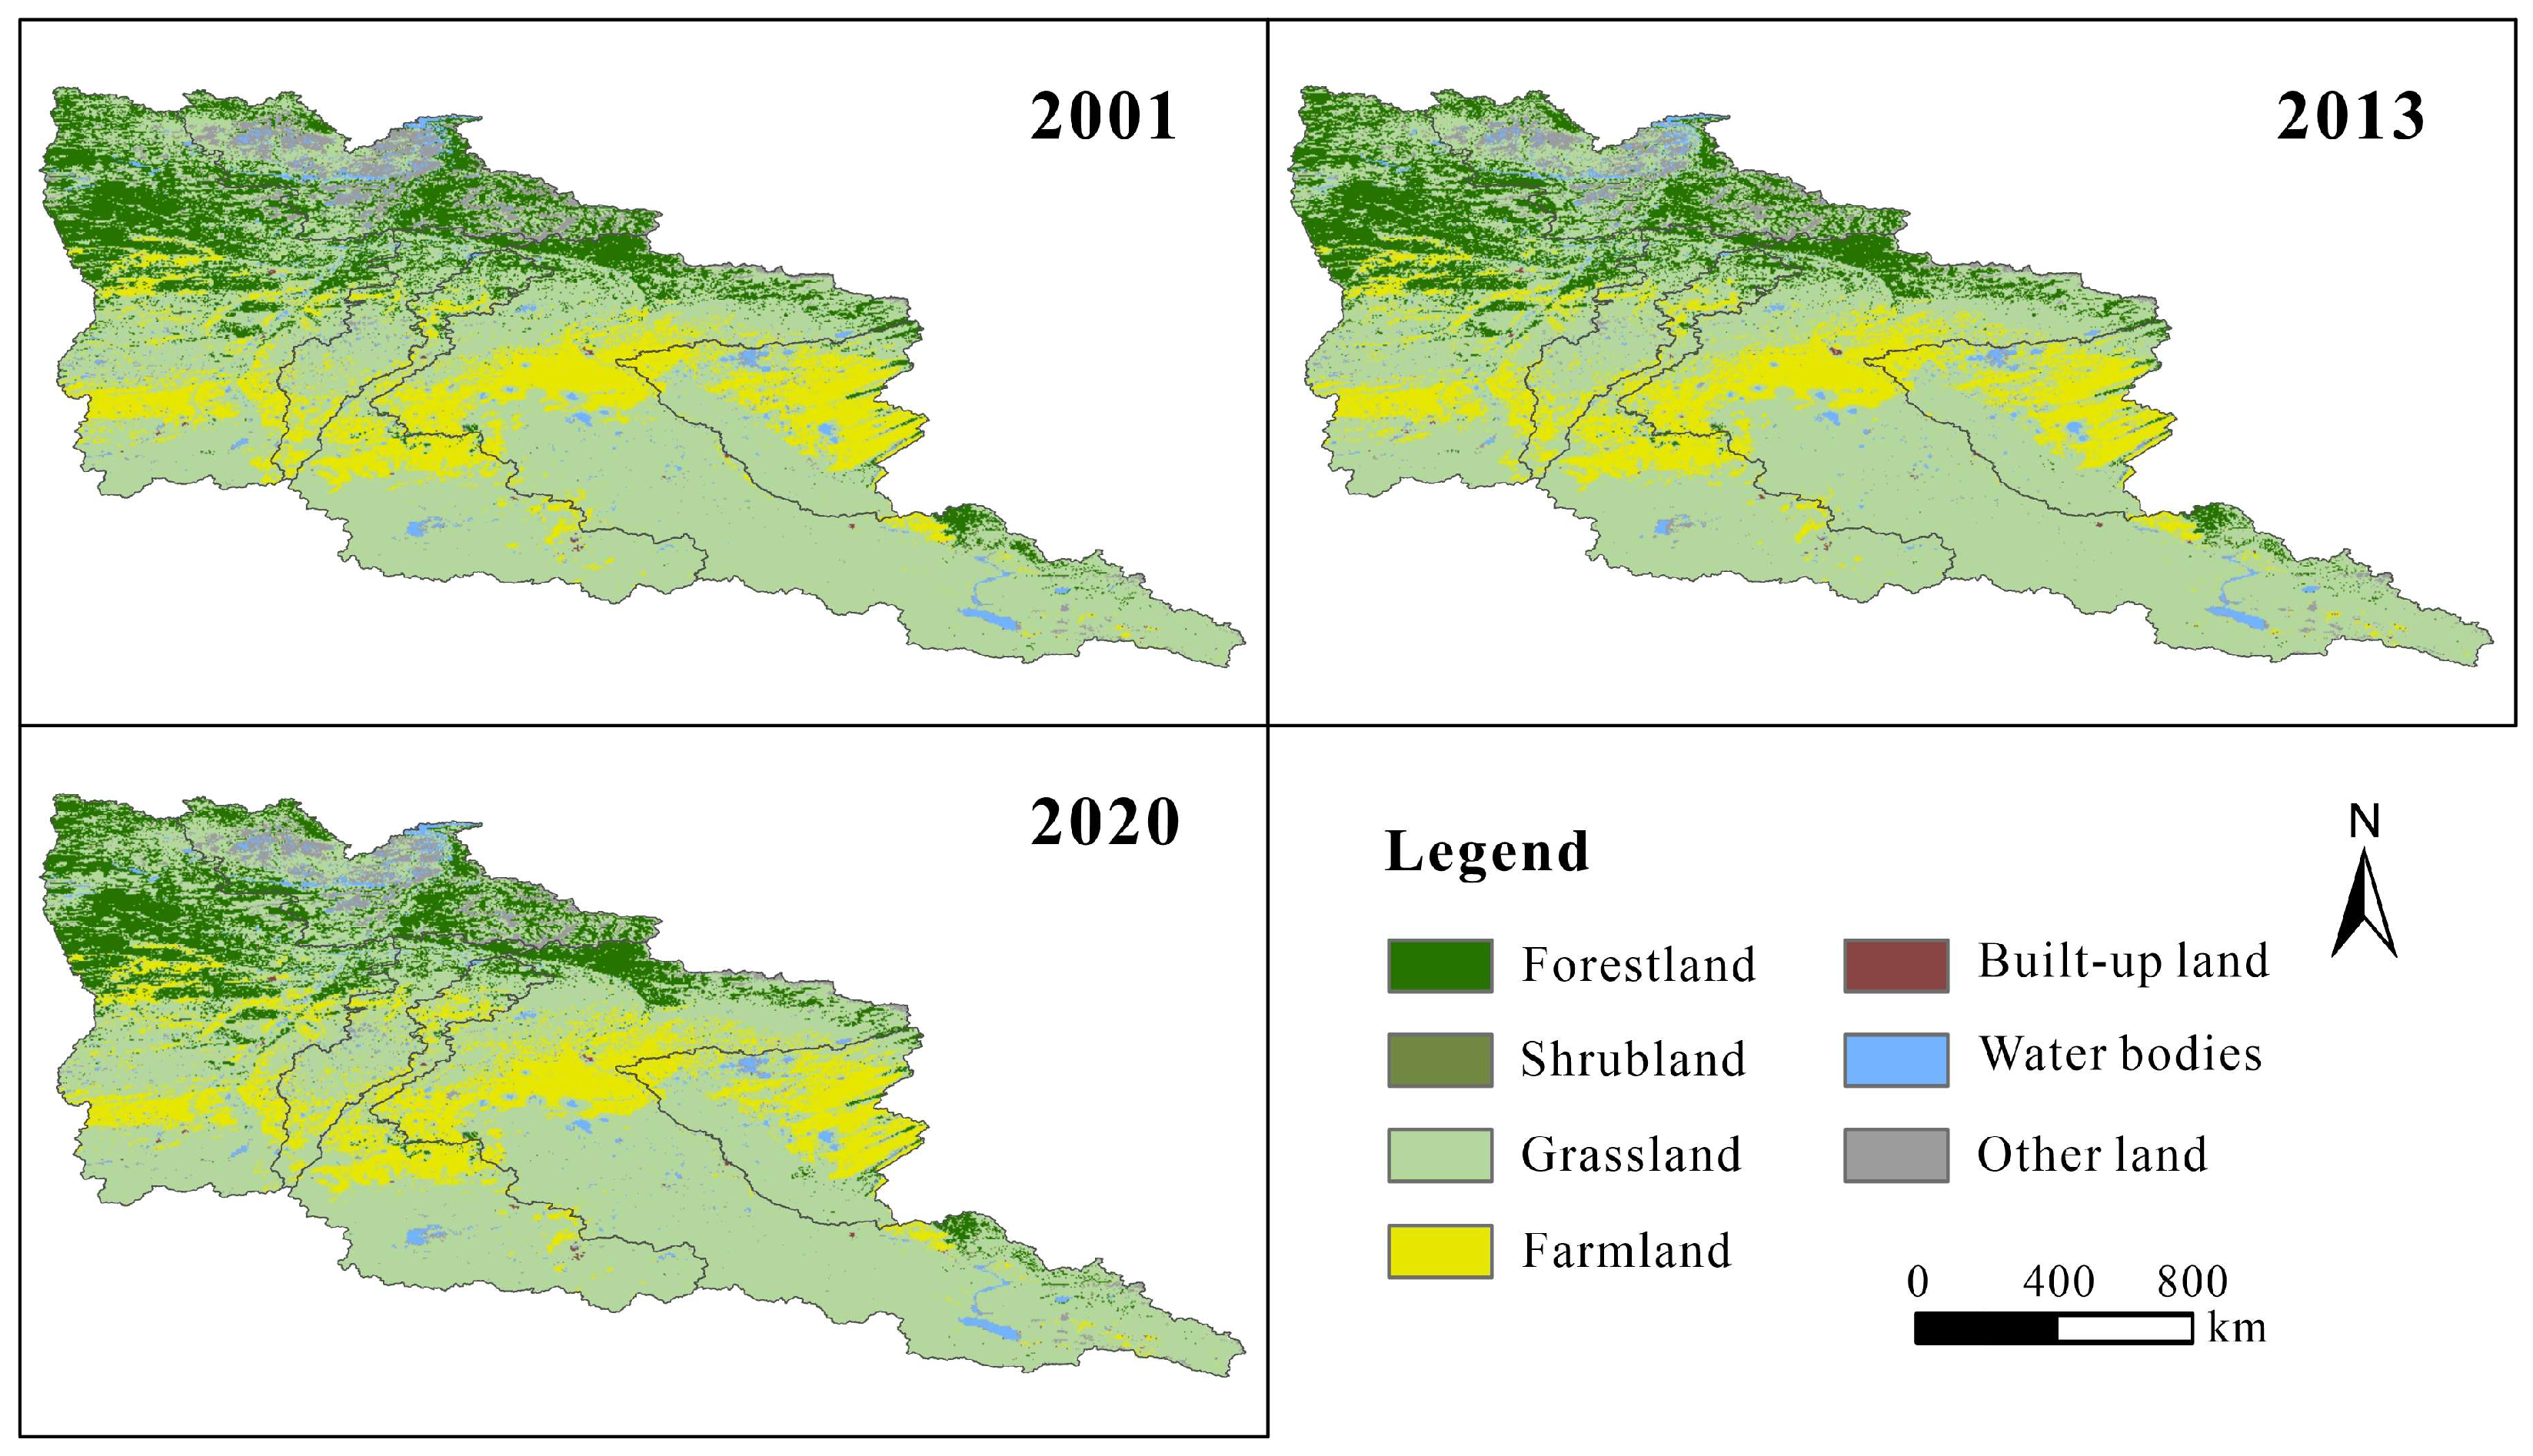
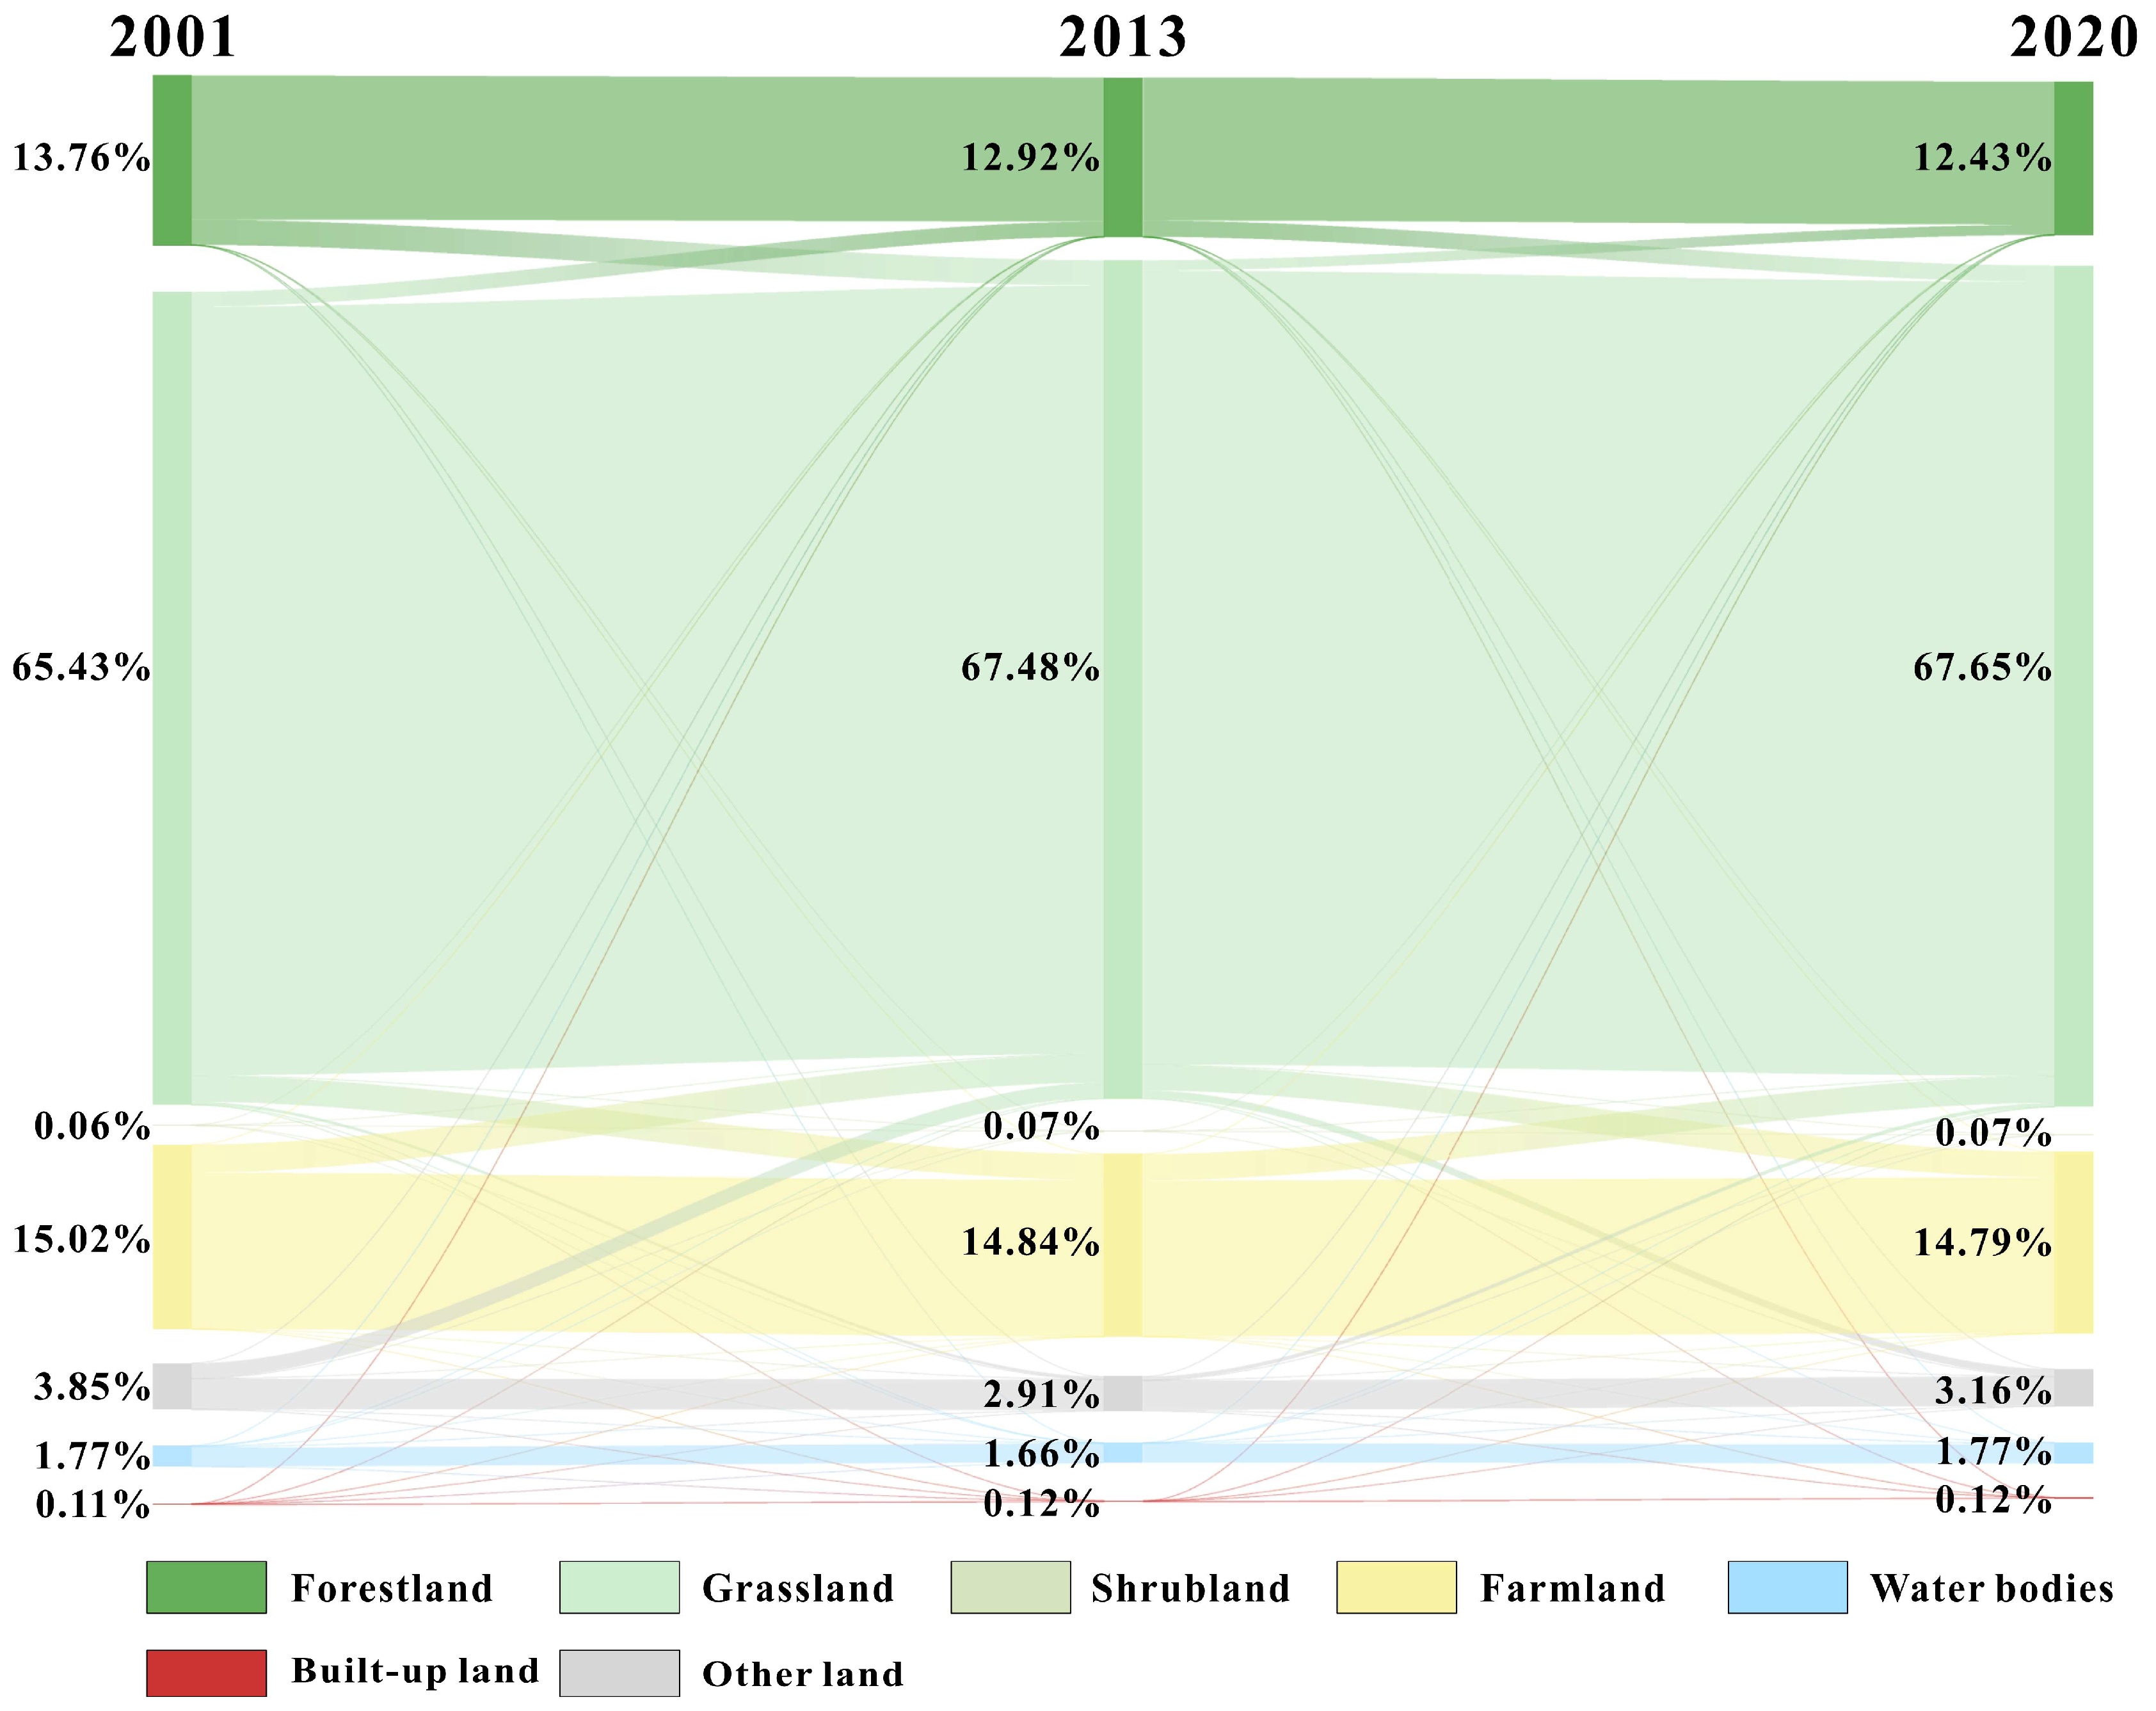
2.1. Study Area

The Irtysh River, which has a length of 4248 km and a basin area of 1.6 × 10⁶ km2 [39], is the largest branch of the Ob River and is an international river that flows through China, Kazakhstan, and Russia (Figure 1). The Irtysh River originates from the southern slope of the Altai Mountains in Fuyun County, Xinjiang Uygur Autonomous Region, China; enters Kazakhstan to the west of Habahe County; and eventually joins the Ob River near Khanty-Mansiysk. The upper reaches of the Irtysh River are located in China and cover an area of 4.53 × 10⁴ km2; the middle reaches are located in Kazakhstan and cover an area of 49.87 × 10⁴ km2; and the lower reaches are located in Russia and cover an area of 109.90 × 10⁴ km2 [39].
The Irtysh River has two major tributaries, the Ishim River and the Tobol River, which can be divided as follows: (1) The Konda River Basin (KRB), located in the southern West Siberian Plain, has a cool, wet climate and a sparse population. (2) The Tobol River Basin (TRB), covering northern Kazakhstan and the West Siberian Plain, is characterized by warm summers and dry winters and contains both arid and non-arid zones. (3) The Vagay River Basin (VRB), a small basin in the West Siberian Plain, primarily supports agriculture and livestock. (4) The Ishim River Basin (ISRB), spanning north-central Kazakhstan and parts of Russia, has a semi-arid climate and is a key water source for Kazakhstan. (5) The Middle Irtysh River Basin (MIRB), a transitional zone between semi-arid and humid climates, is densely populated and has well-developed agriculture and industry. (6) The Gor’koye Lake Basin (GLB), consisting mainly of lakes and wetlands, relies on fishing as the main economic activity and has a low population density [30,40]. The IRB contains numerous hydroelectric power stations, reservoirs, and canals, which provide most of the water for northeastern and eastern Kazakhstan and northwestern Xinjiang, China [29].
Over the past few decades, with significant climatic changes and different patterns of socio-economic development [41,42], the changes in land cover and the degree of vegetation greening have varied from northwestern Xinjiang of China (upper reaches) to northeastern Kazakhstan (middle reaches) to the West Siberian Plain in Russia (lower reaches) [42,43].

2.2. Data Sources and Processing

NDVI, climate, soil characteristics, and land cover type data were used in this study (Table 1). The time series of the NDVI and land cover change data were structured on the Google Earth Engine (GEE) cloud platform, and the time period was selected as 2001–2020. The NDVI product had a spatial resolution of 1 km and was preprocessed via geometric correction, radiometric correction, and atmospheric correction. The synthesis method of the monthly maximum was adopted to generate the annual vegetation index data. This series of datasets has been widely used to assess vegetation change characteristics [20,44].
The MCD12Q1 product was selected to obtain the land cover characteristics of the IRB, and for the sake of data resolution consistency, the land cover data were resampled to 1 km. Based on the 17 cover types in the International Geosphere-Biosphere Program (IGBP) land cover classification system, the land cover in the IRB was reclassified into seven categories: (1) forestland, including evergreen coniferous forests, evergreen broadleaf forests, deciduous coniferous forests, deciduous broadleaf forests, and mixed forests; (2) grassland, including grasslands, woody savannas, and savannas; (3) shrubland, including depressional scrublands and sparse scrublands; (4) farmland, including cropland and cropland/natural vegetation mosaics; (5) built-up land; (6) waterbodies; and (7) other utilization types, including permanent wetlands, permanent snow and ice, and bare land. Considering the actual vegetation distribution of the IRB, we focused on analyzing the NDVI characteristics of forestland, grassland, shrubland, and farmland.
Precipitation and temperature data were downscaled in the study area based on the CRU time series dataset (1901–2021) and the WorldClim historical climate dataset (1970–2000), in combination with a four-step-delta scheme [51]. Data from meteorological stations covered by the basin were selected to validate and evaluate the processed data, and the downscaled data showed better integrity (Table S1, Figure S1). Soil characteristics were selected from sand, silt, and clay, and the dataset was acquired from the Harmonized World Soil Database (HWSD). Topographic feature indicators, including elevation and slope, were obtained from the EarthEnv Project. In order to facilitate calculations for spatial analysis, all datasets were standardized to a resolution of 1 km after harmonizing the coordinate system.

2.3. Methodology

The complete technical flowchart of the study is shown in Figure 2.

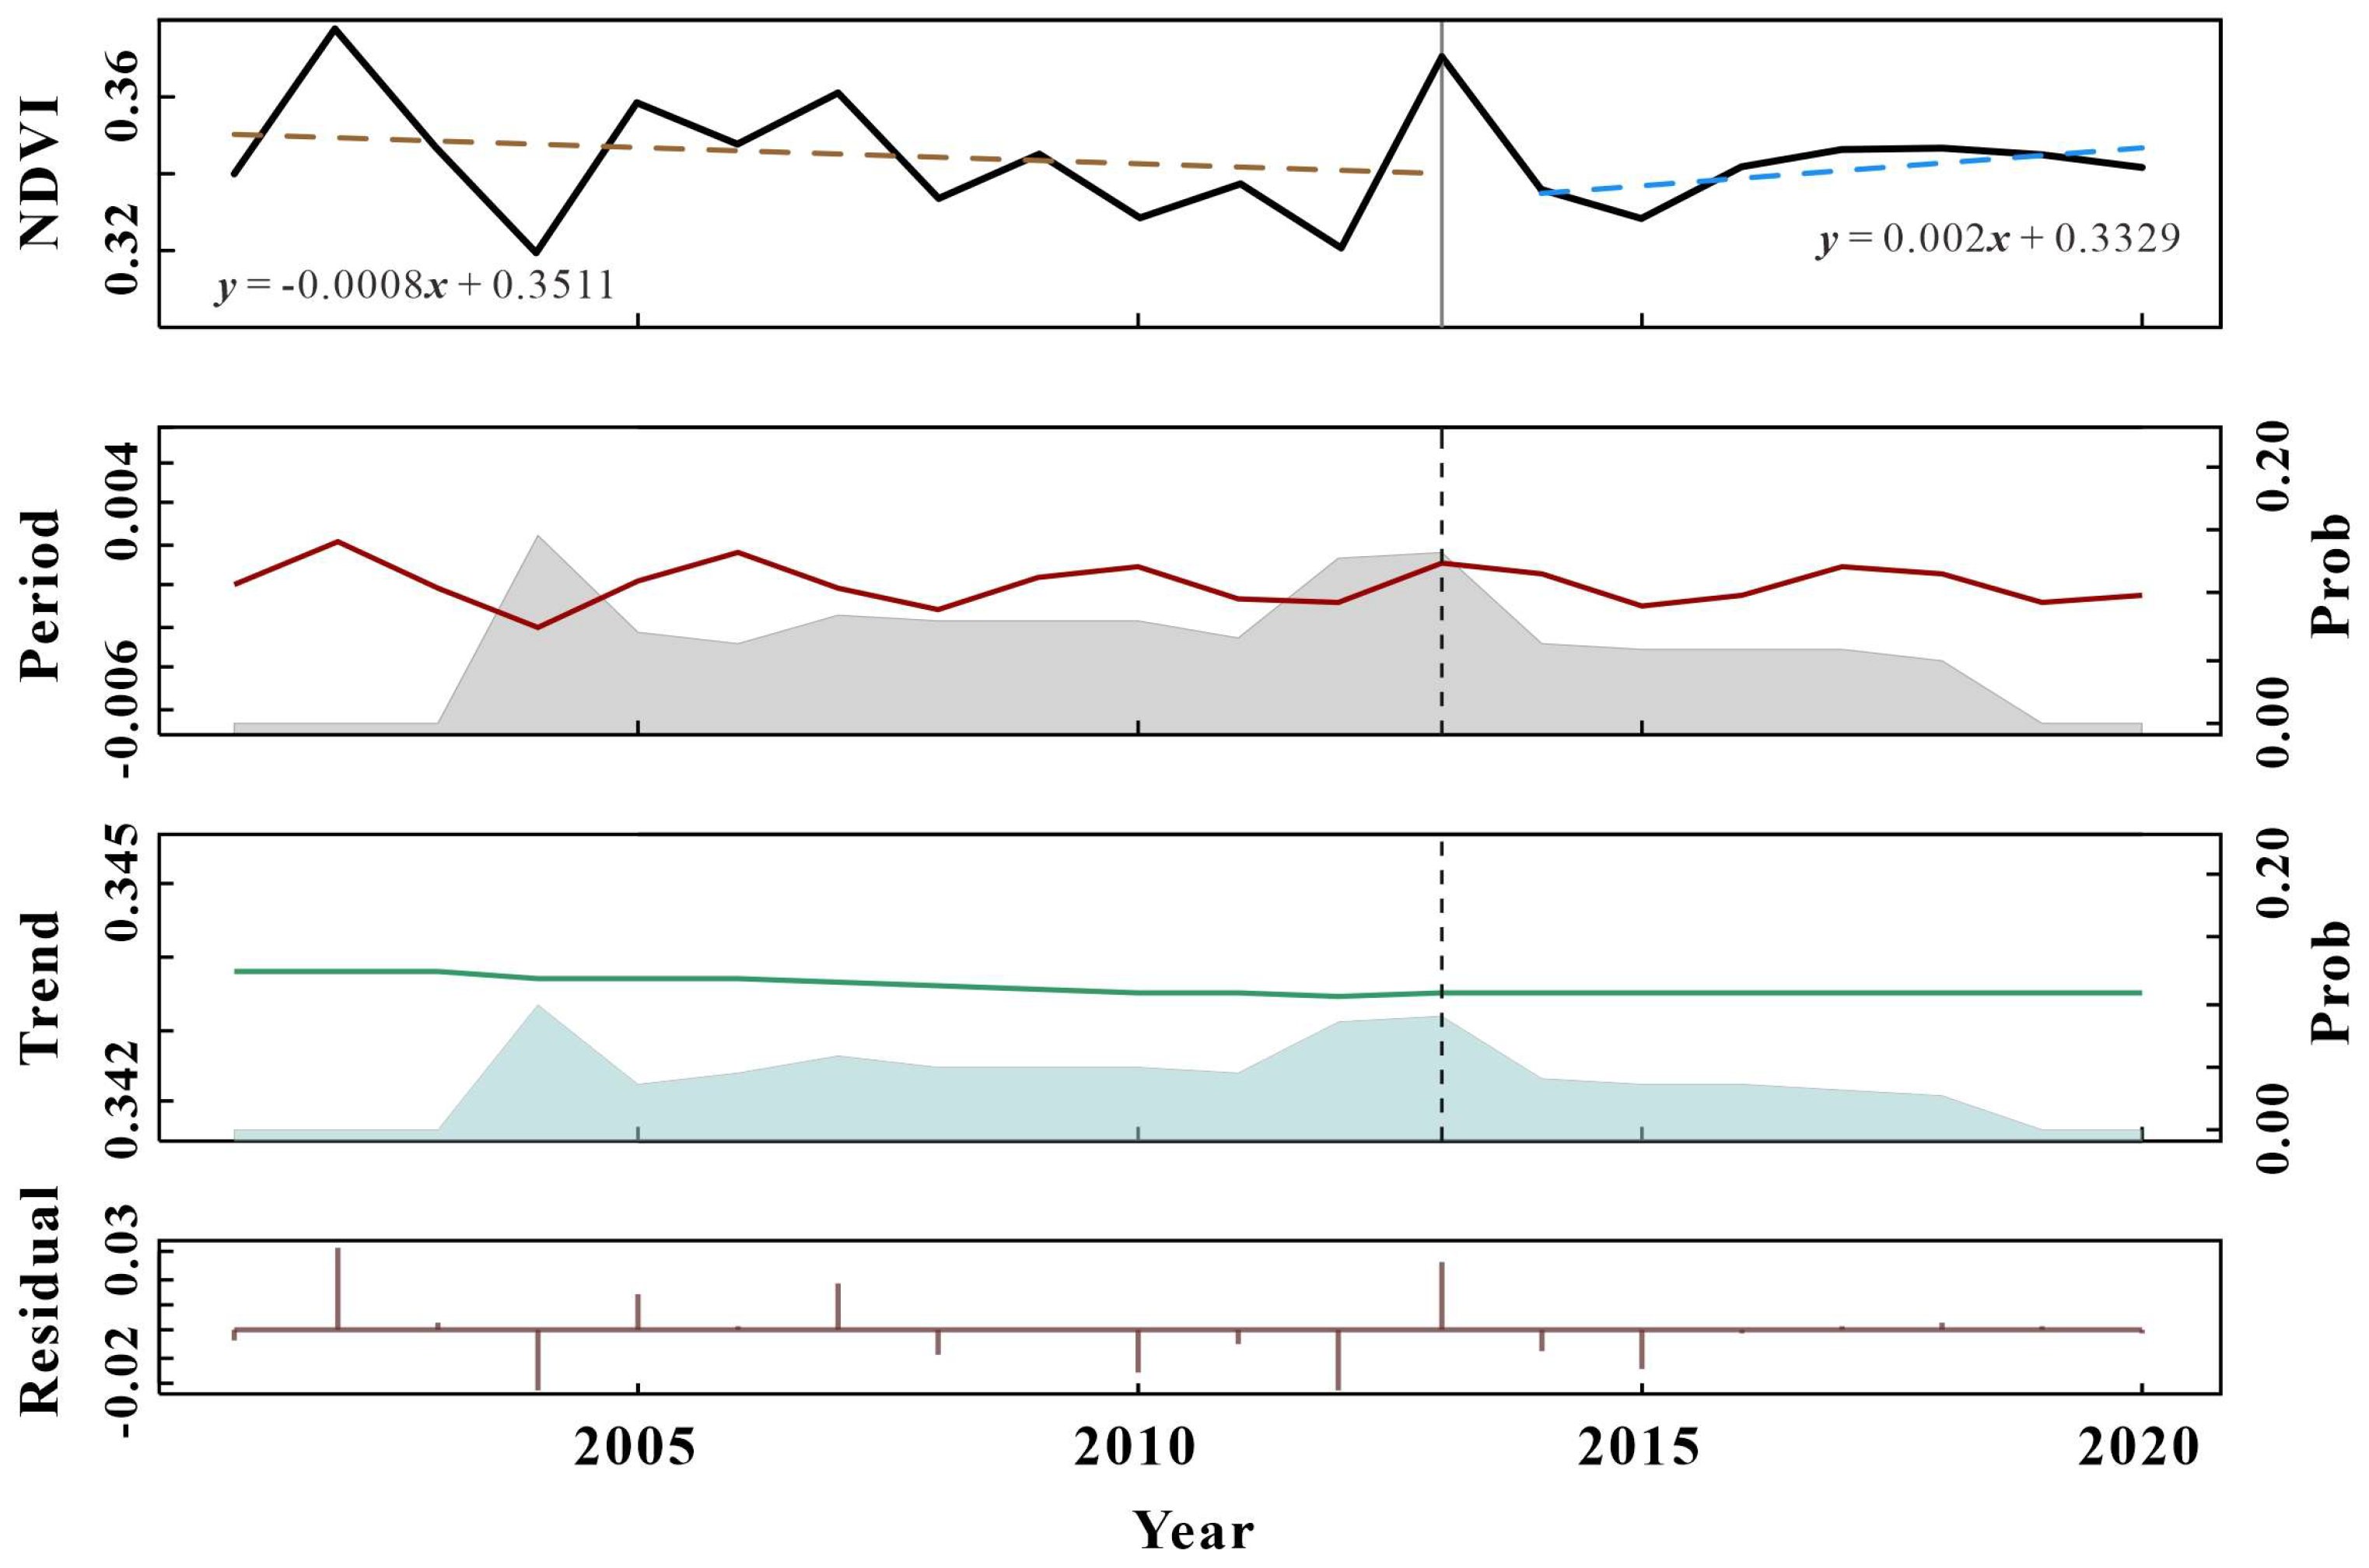
2.3.1. Decomposition Model of BEAST

BEAST is a Bayesian integration algorithm widely used for time-series analysis and mutation point detection. It provides probabilistic information about mutation points and can improve the accuracy of identifying time-series variations compared to deterministic estimation methods [52,53]. In this study, we decomposed the NDVI time series and identified its mutation characteristics, as well as the period and trend signals, using the BEAST algorithm. It decomposes the time series y i into three parts:
y i = S t i ; Θ S + T t i ; Θ T + ε i , i = 1 , , n
S t = l = 1 L k a k , l sin 2 π l t P + b k , l cos 2 π l t P , ξ k t < ξ k + 1 , k = 0 , , p
T t = a j + b j t ,   τ j t < τ j + 1 , j = 0 , , m
where S ( · ) is the seasonal signal, T ( · ) is the trend signal, i is the index of the time dimension, Θ S and Θ T represent the parameters related to seasonal signal and trend signal, respectively, and ε i is the noise. For S t , p knots divide the NDVI time series into (p + 1) intervals, with knots ξ k   representing potential abrupt changes at the seasonal scale. L k is a variable harmonic order for the k th segment, and P determines the period of the seasonal signal; a k , l and b k , l specify the parameters for sines and cosines, respectively. For T t , m knots divide the NDVI time series into (m + 1) intervals, where a and b are the coefficients of the piecewise linear function. The specific calculation processes were explained in detail by Zhao et al. [52].

2.3.2. Mann–Kendall (MK) and Sen’s Slope Tests

The Mann–Kendall test was combined with Sen’s slope trend analysis to determine the trends and magnitudes of vegetation cover changes [53]. This combination eliminates the requirement that the samples fit a particular distribution, is not affected by a few outliers, requires only that the samples be independent, and has been extensively used to identify whether the evolution of natural elements is undergoing natural fluctuations or exhibiting a clear tendency to change [54]. The calculations were as follows:
S = i = 1 n 1 j = i + 1 n s g n N D V I j N D V I i i < j n
s g n x j x i = 1 , N D V I j N D V I i   >   0 0 , N D V I j N D V I i = 0 1 , N D V I j N D V I i   <   0
Z = S 1 V S , S   >   0 0 , S = 0 S + 1 V S , S   <   0
V S = n n 1 2 n + 5 18
where n is the study period length and N D V I i and N D V I j are the sample time-series data. When Z ≥ 1.96, the time series showed a significant trend, with a reliability of 95%. Based on the MK test, Sen’s slope trend analysis was used to determine the direction and degree of change in vegetation trends. The calculations were as follows:
S l o p e = M e d i a n N D V I j N D V I i j i j > i
The positive value of the slope indicates an upward trend in vegetation cover, and the opposite represents a downward trend in vegetation cover.

2.3.3. GeoDetector

Geodetectors, as an emerging statistical modeling approach, are commonly used to assess spatial variability in indicators and uncover their driving mechanisms. They are widely applied across various domains, including socio-environmental studies [55,56]. In this study, we used the three modules of factor detection, interaction detection, and ecological detection in Geodetector to determine the extent to which each factor influences vegetation spatial differentiation. Factor detection is performed as follows:
q = 1 h = 1 L N h σ h 2 N σ 2
where L refers to the stratification of the influence factors of the NDVI, N h   and  N are the respective number of cells in the h stratum and the entire region, σ h 2 and σ 2 are the respective variances of the NDVI values of the h stratum and the area, and the q -value is a measure of the contribution of the influence forces to the spatial variability of the NDVI or its explanatory capacity.
Interaction detection was applied to determine the interactions of various influences on NDVI and to assess the synergistic effects of the two factors. Ecological detection, expressed as an F-statistic, determines whether there is a statistically significant difference between the two influences in driving the spatial distribution of NDVI.

2.3.4. Partial Correlation Analysis

Partial correlation analysis can be used to assess the relationship between NDVI and climatic factors while eliminating the confounding effects of other variables [57]. This equation is defined as follows:
r x y = i = 1 n x i x ¯ y i y ¯ i = 1 n x i x ¯ 2 i = 1 n y i y ¯ 2
r x y . z = r x y r x z r y z 1 r x z 2 1 r y z 2
where r x y   is the correlation coefficient between the NDVI and climate factors, and r x y . z is the correlation coefficient of x with y after removing the effects of additional climate factor z.

2.3.5. Residual Trend Analysis

The RESTREND (residual trend) methodology was used to quantify the impact of climate change on changes in vegetation cover [58,59]. The main steps involved are as follows: (1) Using NDVI as the dependent variable and precipitation and temperature as independent variables, a binary linear regression model was established to calculate the parameters of the model. (2) The predicted value of NDVI ( N D V I C C ) was calculated and used to reflect the effect of climatic factors on NDVI. (3) The difference ( N D V I O D ) between the NDVI observation value ( N D V I o b s ) and the N D V I C C , the NDVI residual, is used to represent the effect of other drivers on NDVI. The specific formula is as follows:
N D V I C C = a × P R E + b × T M P + σ
N D V I O D = N D V I o b s N D V I C C
where N D V I C C and N D V I o b s denote the NDVI predicted values based on the regression model and NDVI observation values from MODIS products, respectively. P R E is the mean annual precipitation (mm), and T M P is the mean annual temperature (°C), with a, b and σ being the regression model parameters. The N D V I O D is the residual value.
The slope of the linear regression equation is used to construct the NDVI trend [19,24]. The formula is performed as follows:
S l o p e = n × i = 1 n i × N D V I i i = 1 n i i = 1 n N D V I i n × i = 1 n i 2 i = 1 n i 2
where S l o p e denotes the slope of the NDVI regression equation, n is the length of the year series, i is the time series, and N D V I i is the NDVI value at time i .
The residual contributions in some areas could also be due to climatic factors, in addition to precipitation and temperature (e.g., solar radiation, wind, and atmospheric circulation), natural hazards, and topography [60,61,62]. Considering that the study area is large and the natural features are complex, in this study, we mainly focused on the contribution of climate change (CC), while the residuals were considered as the effect of the sum of the other drivers (OD) and were further explored. Based on the results of the regressions, six scenarios were obtained. For the above scenarios, the contribution of climate change and other drivers to vegetation change is calculated, as shown in Table 2.

3. Results

3.1. Characterization of Spatiotemporal Dynamics of Vegetation

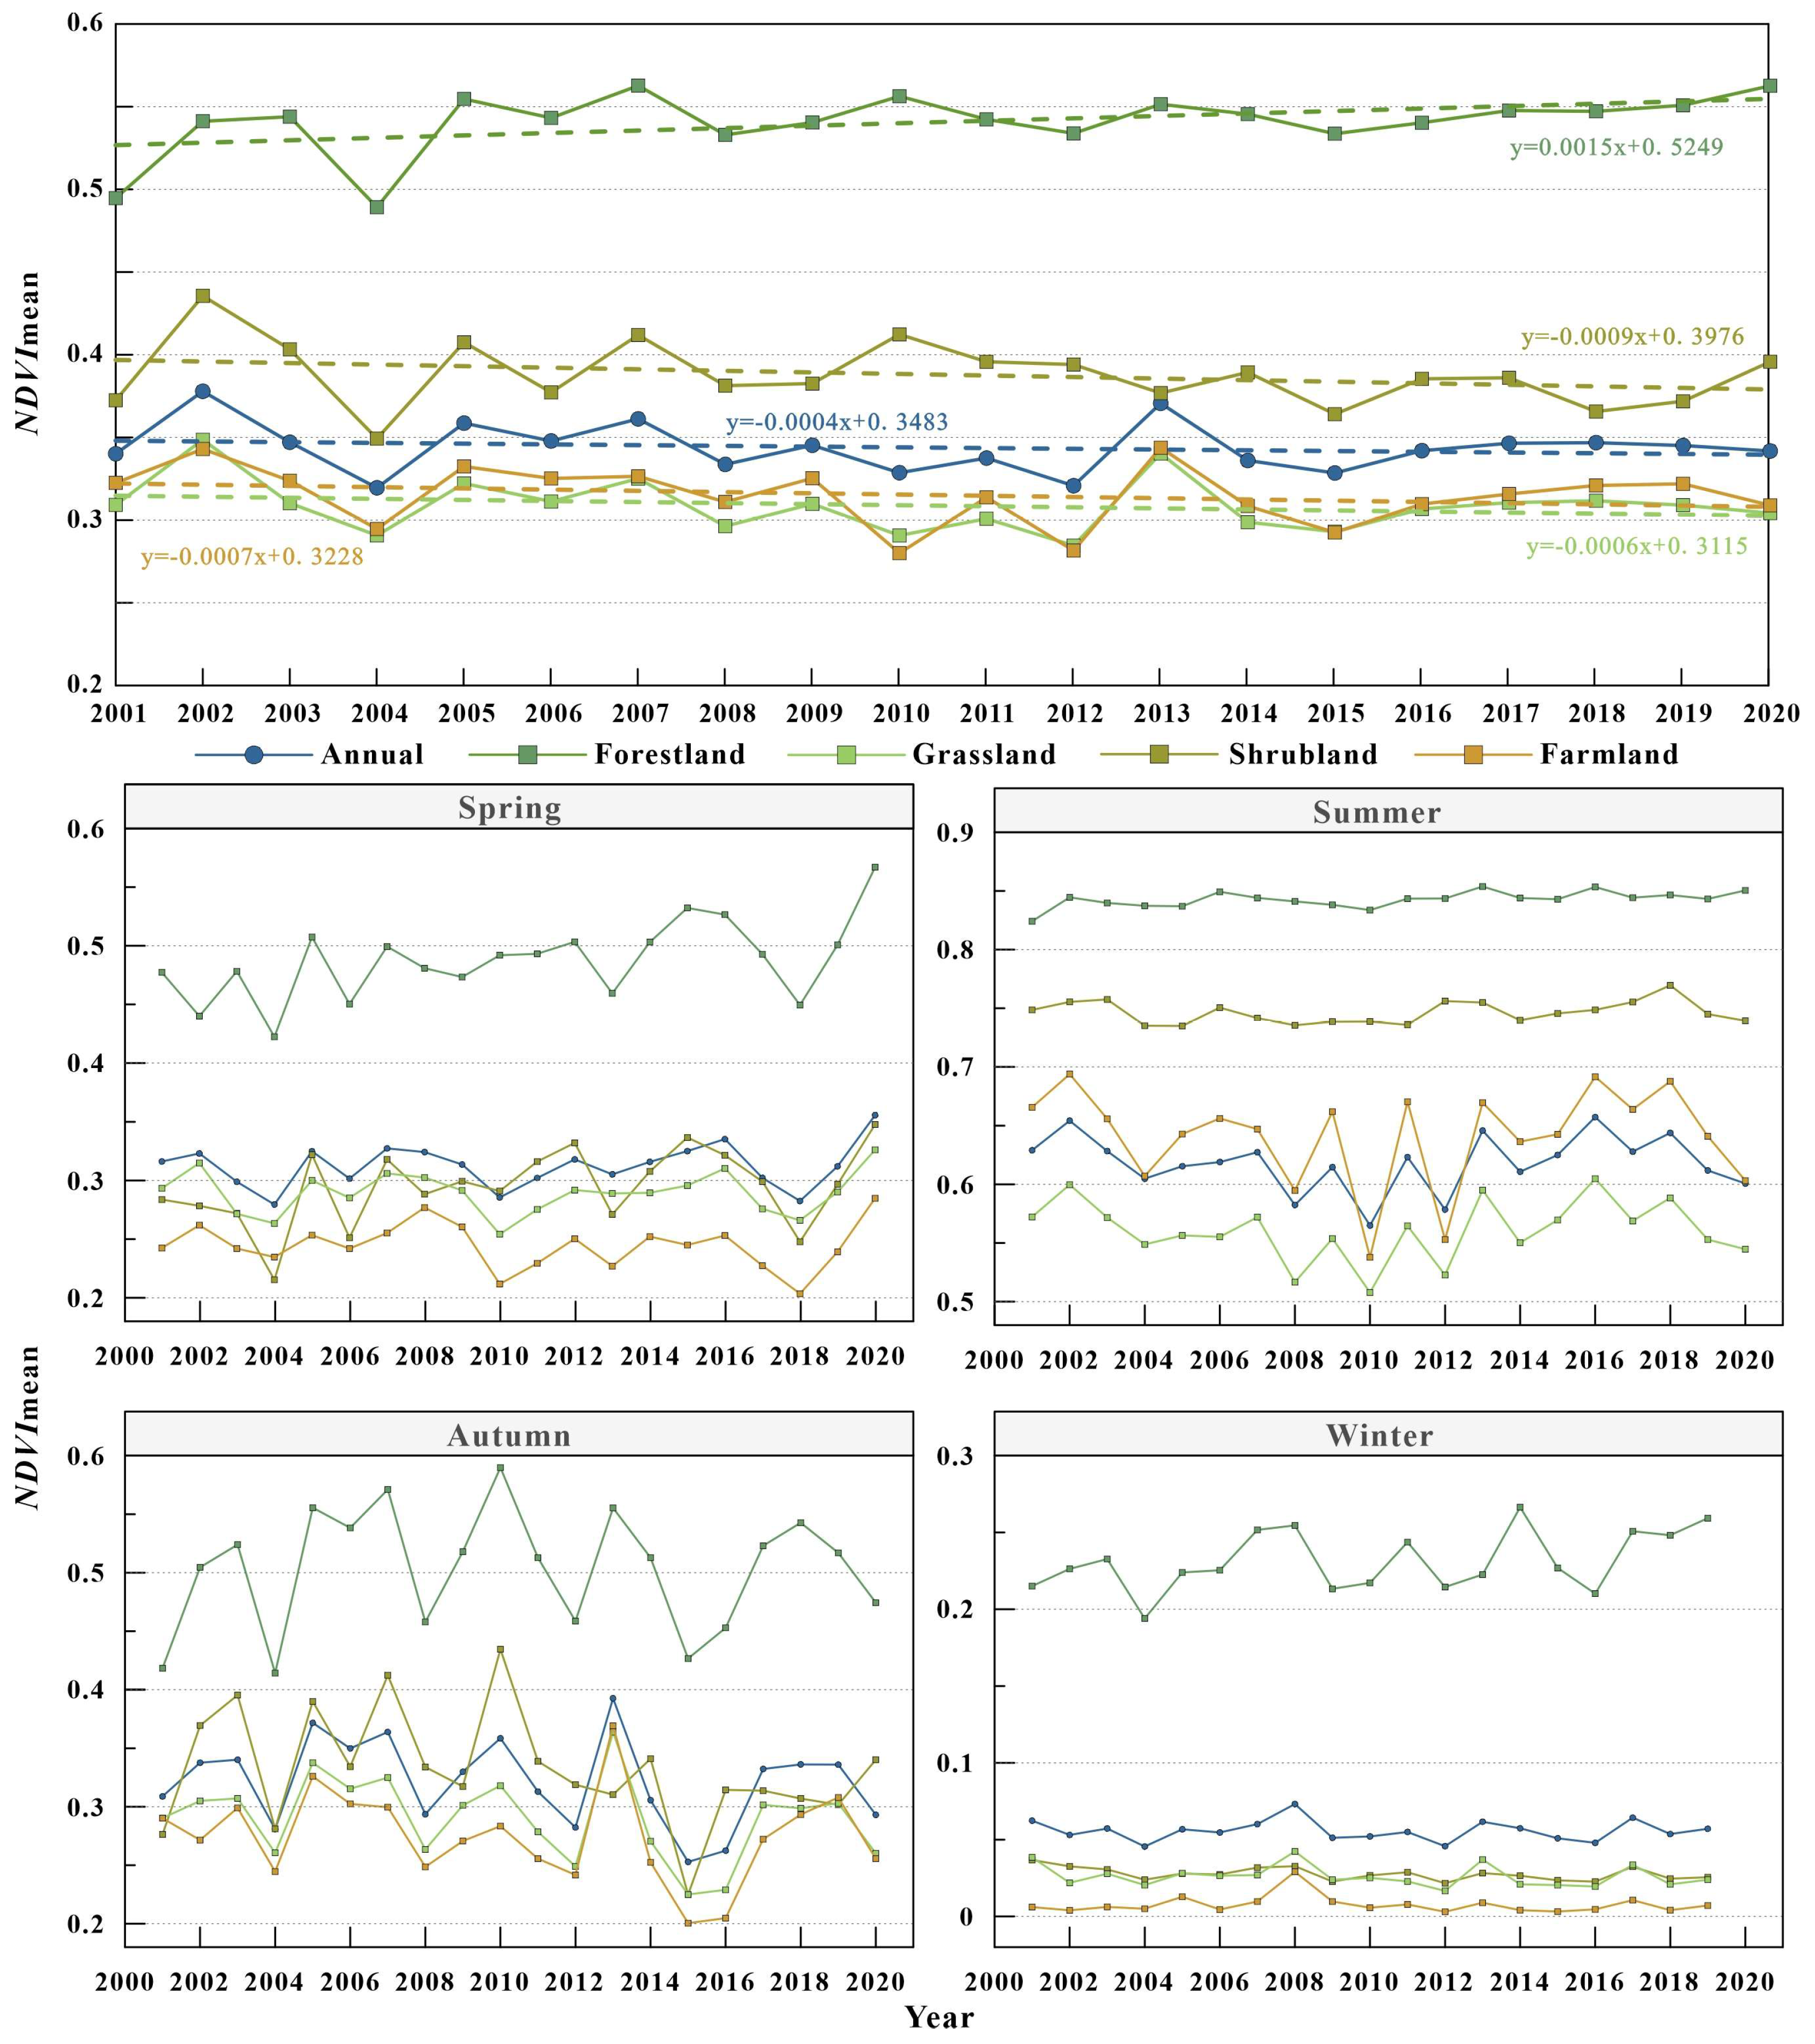
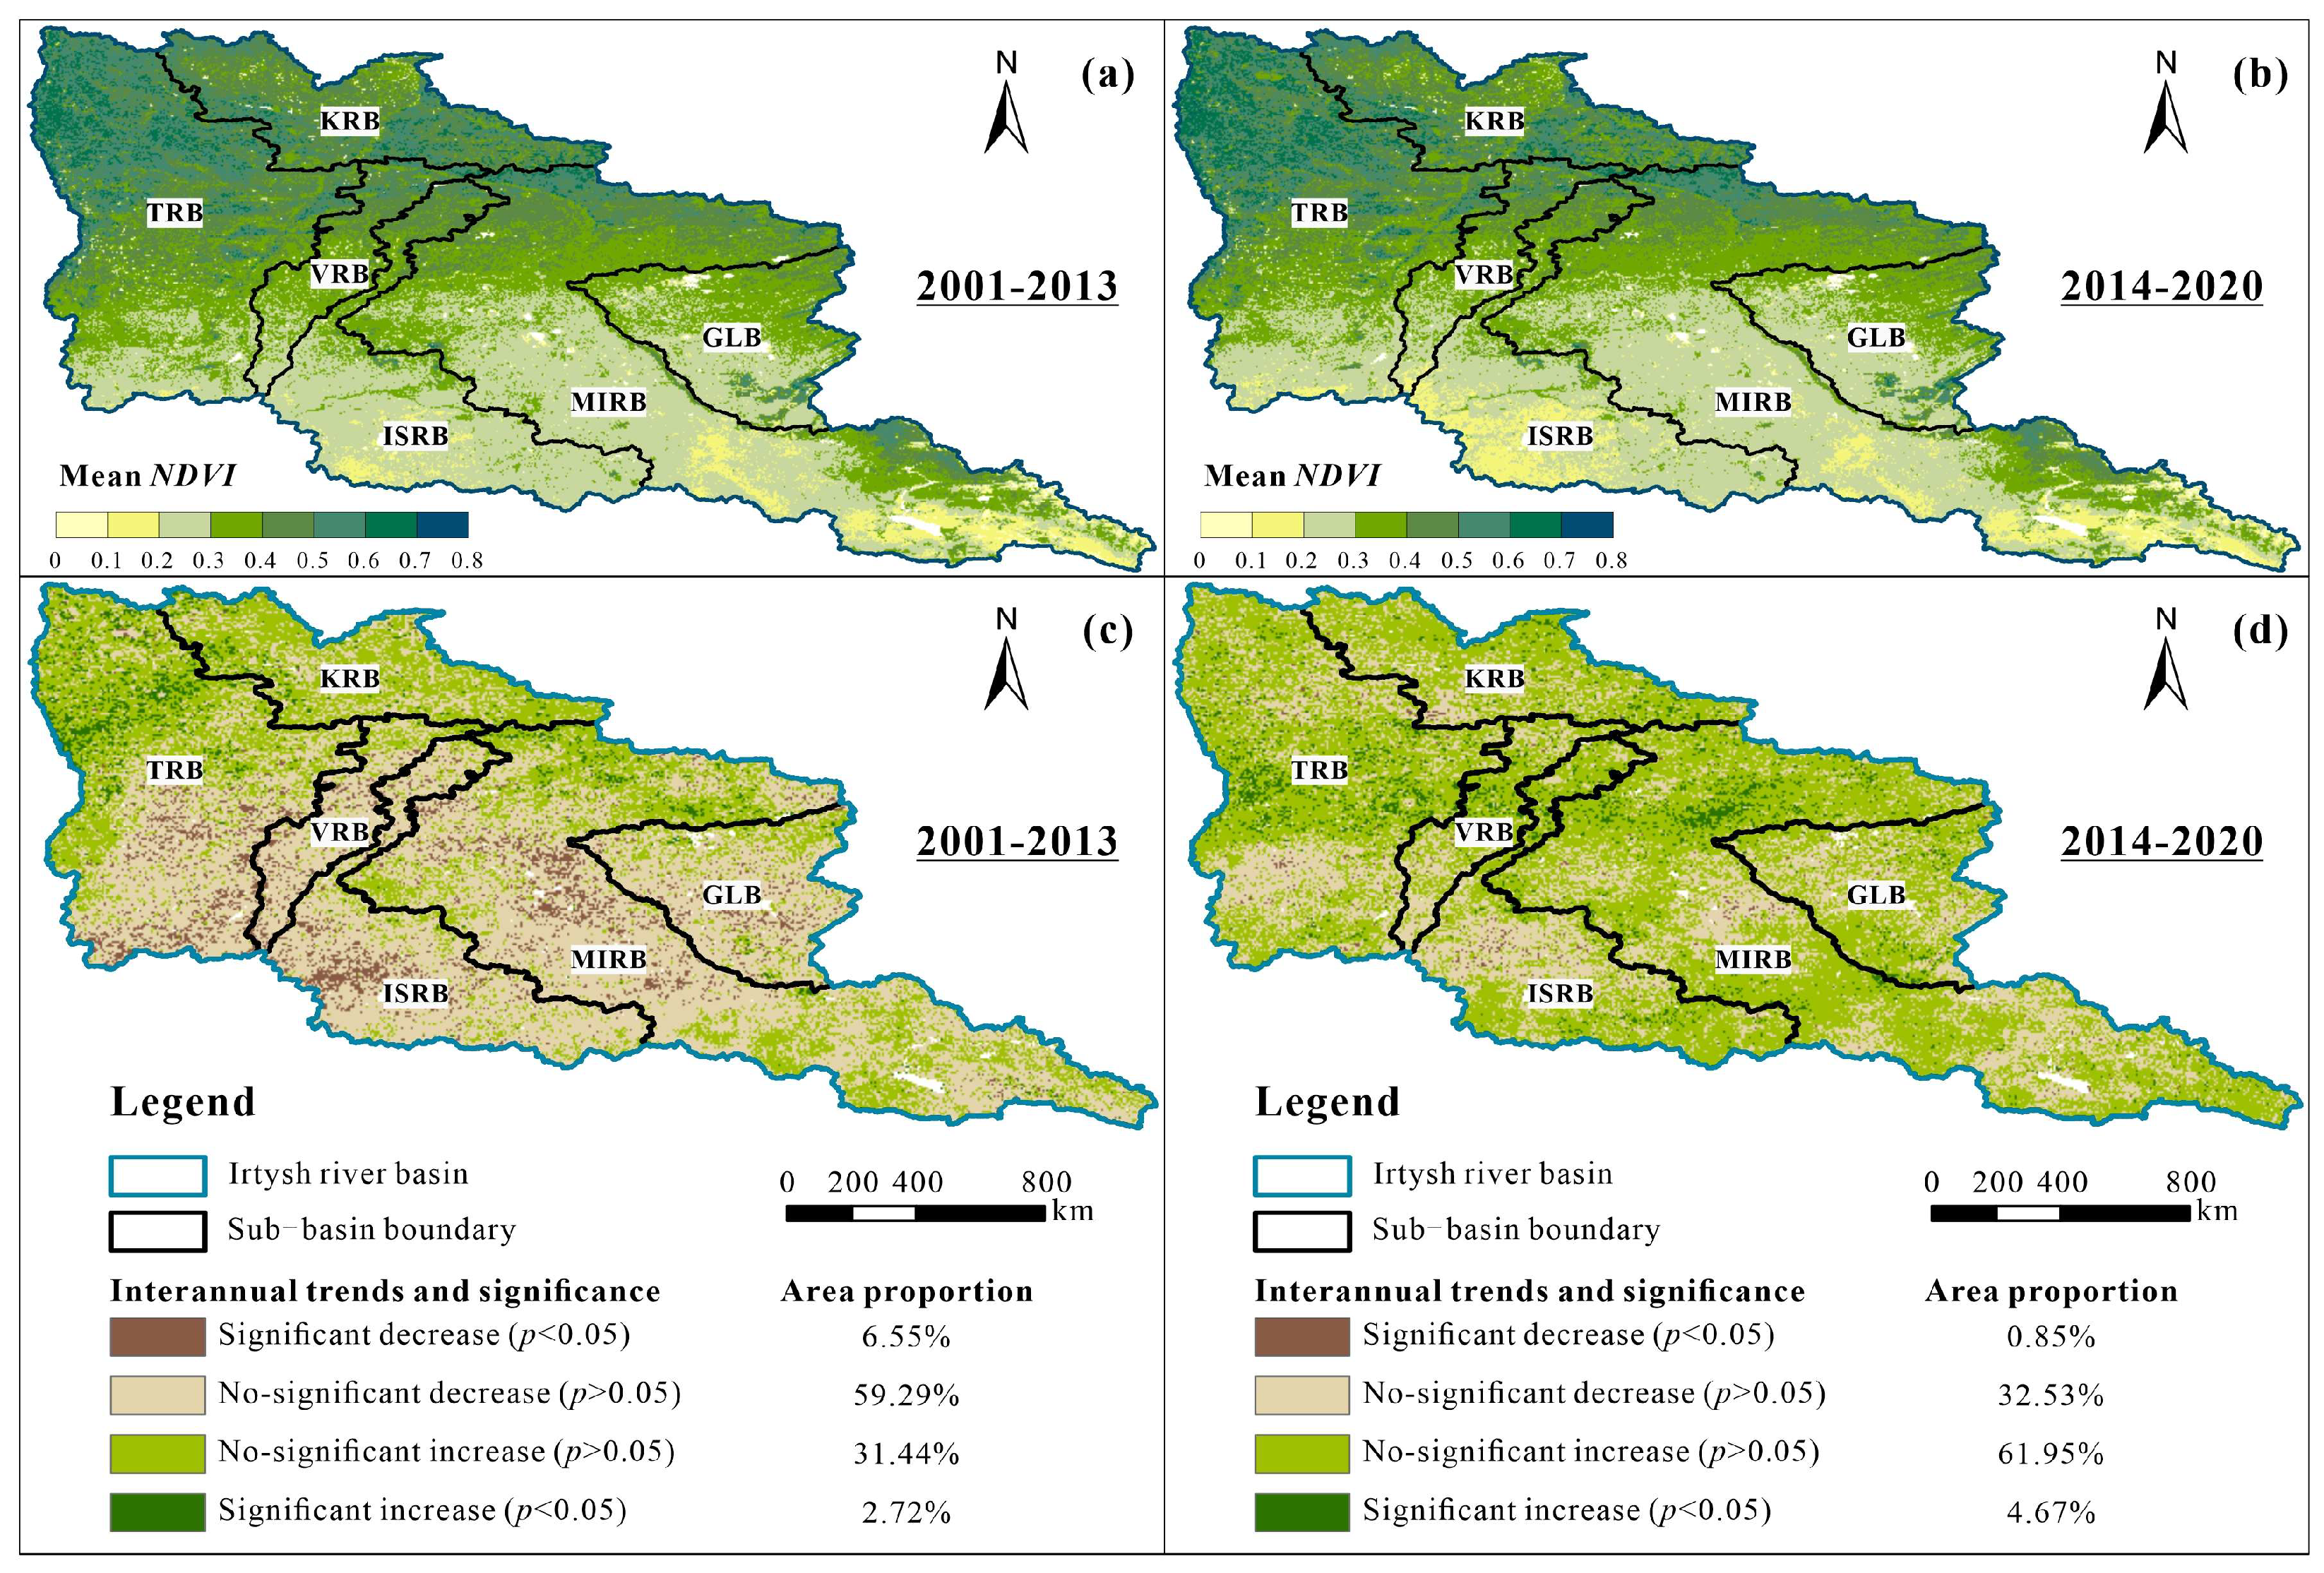
3.1.1. Temporal Variations in the NDVI Trend

The average NDVI trend during the period of 2001–2020 (Figure 3) showed that the IRB and the four different vegetation types changed differently. The NDVI of the forestland exhibited an increasing trend, while those of the IRB, grassland, scrub, and cropland exhibited decreasing trends. The ranking of the magnitudes of the changes in the four vegetation types was forestland > shrubland > cropland > grassland. The overall average greenness in the IRB was 0.344, and it decreased at an average rate of 0.004 per decade during the 20-year study period, whereas the NDVI of the forestland increased by about 0.015 per decade, and the NDVIs of the grassland, shrubland, and farmland decreased at rates of 0.006, 0.009, and 0.007 per decade, respectively.
The seasonal characteristics of the NDVI showed that the greenness of the IRB and the various vegetation types were relatively high in summer and autumn (Figure 3). The mean value of the greenness in summer in the IRB was 0.618, while that of the forestland was 0.618. In addition, the temporal trend exhibited a significant increase in the greenness in the IRB and the vegetation types in 2002 and 2013, and there was a significant low-value period in 2004, suggesting that there may have been a specific period of abrupt change during the study period.
The BEAST mutation detection results indicate (Figure 4) that, in the IRB, a breakpoint occurred during the study period, and this mutation most likely occurred in 2013. The long-term trend of the NDVI in the watershed can be divided into seasonal short-term trends, and only one mutation point occurred in the cycle component (in 2013), with a probability of occurrence of 0.27. The basin experienced changes in 4-year cycles during the 2001–2020 period. In terms of the trend component of the NDVI time series, there was also a mutation point in 2013, with a mutation probability of 0.17, and the trend component changed from decreasing to increasing throughout the study period; that is, it continuously decreased from 2001 to 2013 and increased from 2014 to 2020, with the rate of change being significantly higher in the latter period.

3.1.2. Spatial Dynamics of the NDVI

Figure 5 shows the characteristics of the distribution of the NDVI values. The study period was divided into two periods, namely 2001–2013 and 2014–2020, according to the NDVI change characteristics and mutation detection results. By dividing the pixel values into 0–0.8 at 0.1 intervals, it was found that the spatial distribution of the NDVI in the IRB was more similar during the two periods. The northern parts of the KRB, TRB, and VRB exhibited higher NDVI values (Figure 5a,b) due to their locations in the West Siberian Plain in Russia, where the vegetation cover was high and dominated by large areas of forestland and small patches of shrubland. The NDVI values and greenness were lower in the southern part of the TRB, the central part of the MIRB, and most of the VRB, ISRB, and GLB, mainly in the northern part of Kazakhstan, where cropland and grassland occurred. The southern part of the ISRB and the southeastern part of the MIRB had relatively low NDVI values, and grassland was the dominant vegetation cover. The southeastern part of the MIRB (which mainly consists of the Zaysan Lake region and the Altay region in Xinjiang, China) covered a smaller area but had significant elevation fluctuations and variations in greenness, with low NDVI values around Zaysan Lake and relatively high NDVI in the alpine areas. The overall mean NDVI value of the basin was 0.345 in 2001–2013 and 0.341 in 2014–2020. Compared with the other sub-basins, the KRB had the highest mean NDVI value in both periods, while the ISRB had the lowest values. There was clear latitudinal zonation in the spatial distribution of vegetation greenness in the IRB, i.e., it decreased significantly from north to south.
The results of the MK test and Sen’s slope test revealed that the NDVI trends in the IRB differed significantly between the two periods (Figure 5c,d). In 2001–2013, the NDVI exhibited a non-significant decreasing trend (59.29%) in most of the IRB, of which 86.39% of the ISRB exhibited a decreasing trend. The sub-basins with decreasing NDVI trends were ranked as follows: ISRB > VRB > GLB > MIRB > TRB > KRB. Unlike the other sub-basins, the KRB was dominated by an increasing NDVI trend during this period. The areas in which the NDVI increased accounted for 68.11% of its total area, and this was driven by forest greening (Figure 6a). In 2014–2020, the NDVI in the IRB exhibited a general, non-significant increasing trend (61.95%), with 70.26% of the MIRB area greening, primarily in grassland areas (Figure 6b). In order of the percentages of the areas that exhibited increasing NDVI trends, the sub-basins were ranked as follows: MIRB > KRB > TRB > VRB > GLB > ISRB. In summary, in recent years, the KRB has experienced strong greening, while the ISRB has experienced vegetation degradation.
The statistics of the NDVI changes for the four vegetation types revealed that both the forestland and shrubland exhibited increasing NDVI trends throughout the study period (Figure 6). The forestland had the highest percentage of greening, with 70.63% and 67.18% of the area exhibiting increasing trends during the first and second periods (sum of the SI and NI), while the areas of shrubland that exhibited greening were 57.62% and 66.16%, respectively. In both grassland and farmland, the NDVI trend shifted from decreasing to increasing. That is, in 2001–2013, 72.54% and 78.48% (sum of SD and ND) of the areas of grassland and farmland exhibited decreasing trends, respectively (Figure 6a), while in 2014–2020, 68.09% and 57.75% of the grassland and farmland areas exhibited increasing trends, respectively (Figure 6b).

3.2. Detection of Factors Influencing the Spatial Differentiation of the NDVI

The driving characteristics of each factor for the NDVI spatial differentiation in the IRB were determined using a factor detector and ecological detection. Table 3 shows the extent of the effects of the different factors on the spatial variability of the NDVI in 2001, 2013, and 2020. In 2001, the ranking of the impacts of factors was Pre > Tmp > Elev > Clay > Silt > Sand > Slope. The main drivers of the NDVI were precipitation and temperature, which had explanatory powers as high as 67.2% and 58.1%, respectively, followed by elevation and clay, both of which had explanatory powers of greater than 25%. The explanatory power of the slope was relatively low, with a q-value of less than 0.1, so it may have had little effect on the NDVI distribution in the basin. The year 2013 was the node of significant abrupt changes in the NDVI. Precipitation and temperature remained the primary drivers of spatial variations in the NDVI, but their explanatory powers were lower compared with 2001, decreasing to 47.9% and 54.8%, respectively. Similarly, elevation and clay made some contributions, and the q-value of most factors decreased in 2013. In 2020, precipitation was the dominant driver influencing the spatial variations in the NDVI, with a q-value of 0.609. Temperature also had a high explanatory power of 40.8%, while clay, elevation, and silt soils were ranked as secondary drivers with explanatory powers of 36.3%, 28.6%, and 25.0%, respectively.
In all three years, both precipitation and temperature were the main contributors to the spatial distribution of the NDVI, while elevation and clay soil also explained the spatial variations in the NDVI to a certain extent. The ecological detection revealed that there were significant differences in each factor (Table S2). The above results indicate that the spatial variations in the NDVI in the IRB depended on multiple drivers and varied over time. However, the driving forces of precipitation and temperature were always more significant.
The interaction detector not only explores the interactions between various factors but also identifies the synergistic effects of the factors on the spatial variations in the NDVI. The results (Tables S3–S5) show that there were significant synergistic effects between the dominant factors during the three years, and the interaction types were enhancement and nonlinear enhancement. The synergistic effects of precipitation and temperature, as well as their superposition with the dual factors of elevation and soil type, greatly enhanced the impact on the distribution of the NDVI. The interactive contribution of precipitation and elevation was as high as 0.749 in 2020, whereas the interactions of precipitation and temperature with other factors greatly enhanced the role of the single factor in all three years. The interactions between the natural elements significantly affected the distribution of the spatial changes in the NDVI in the IRB.

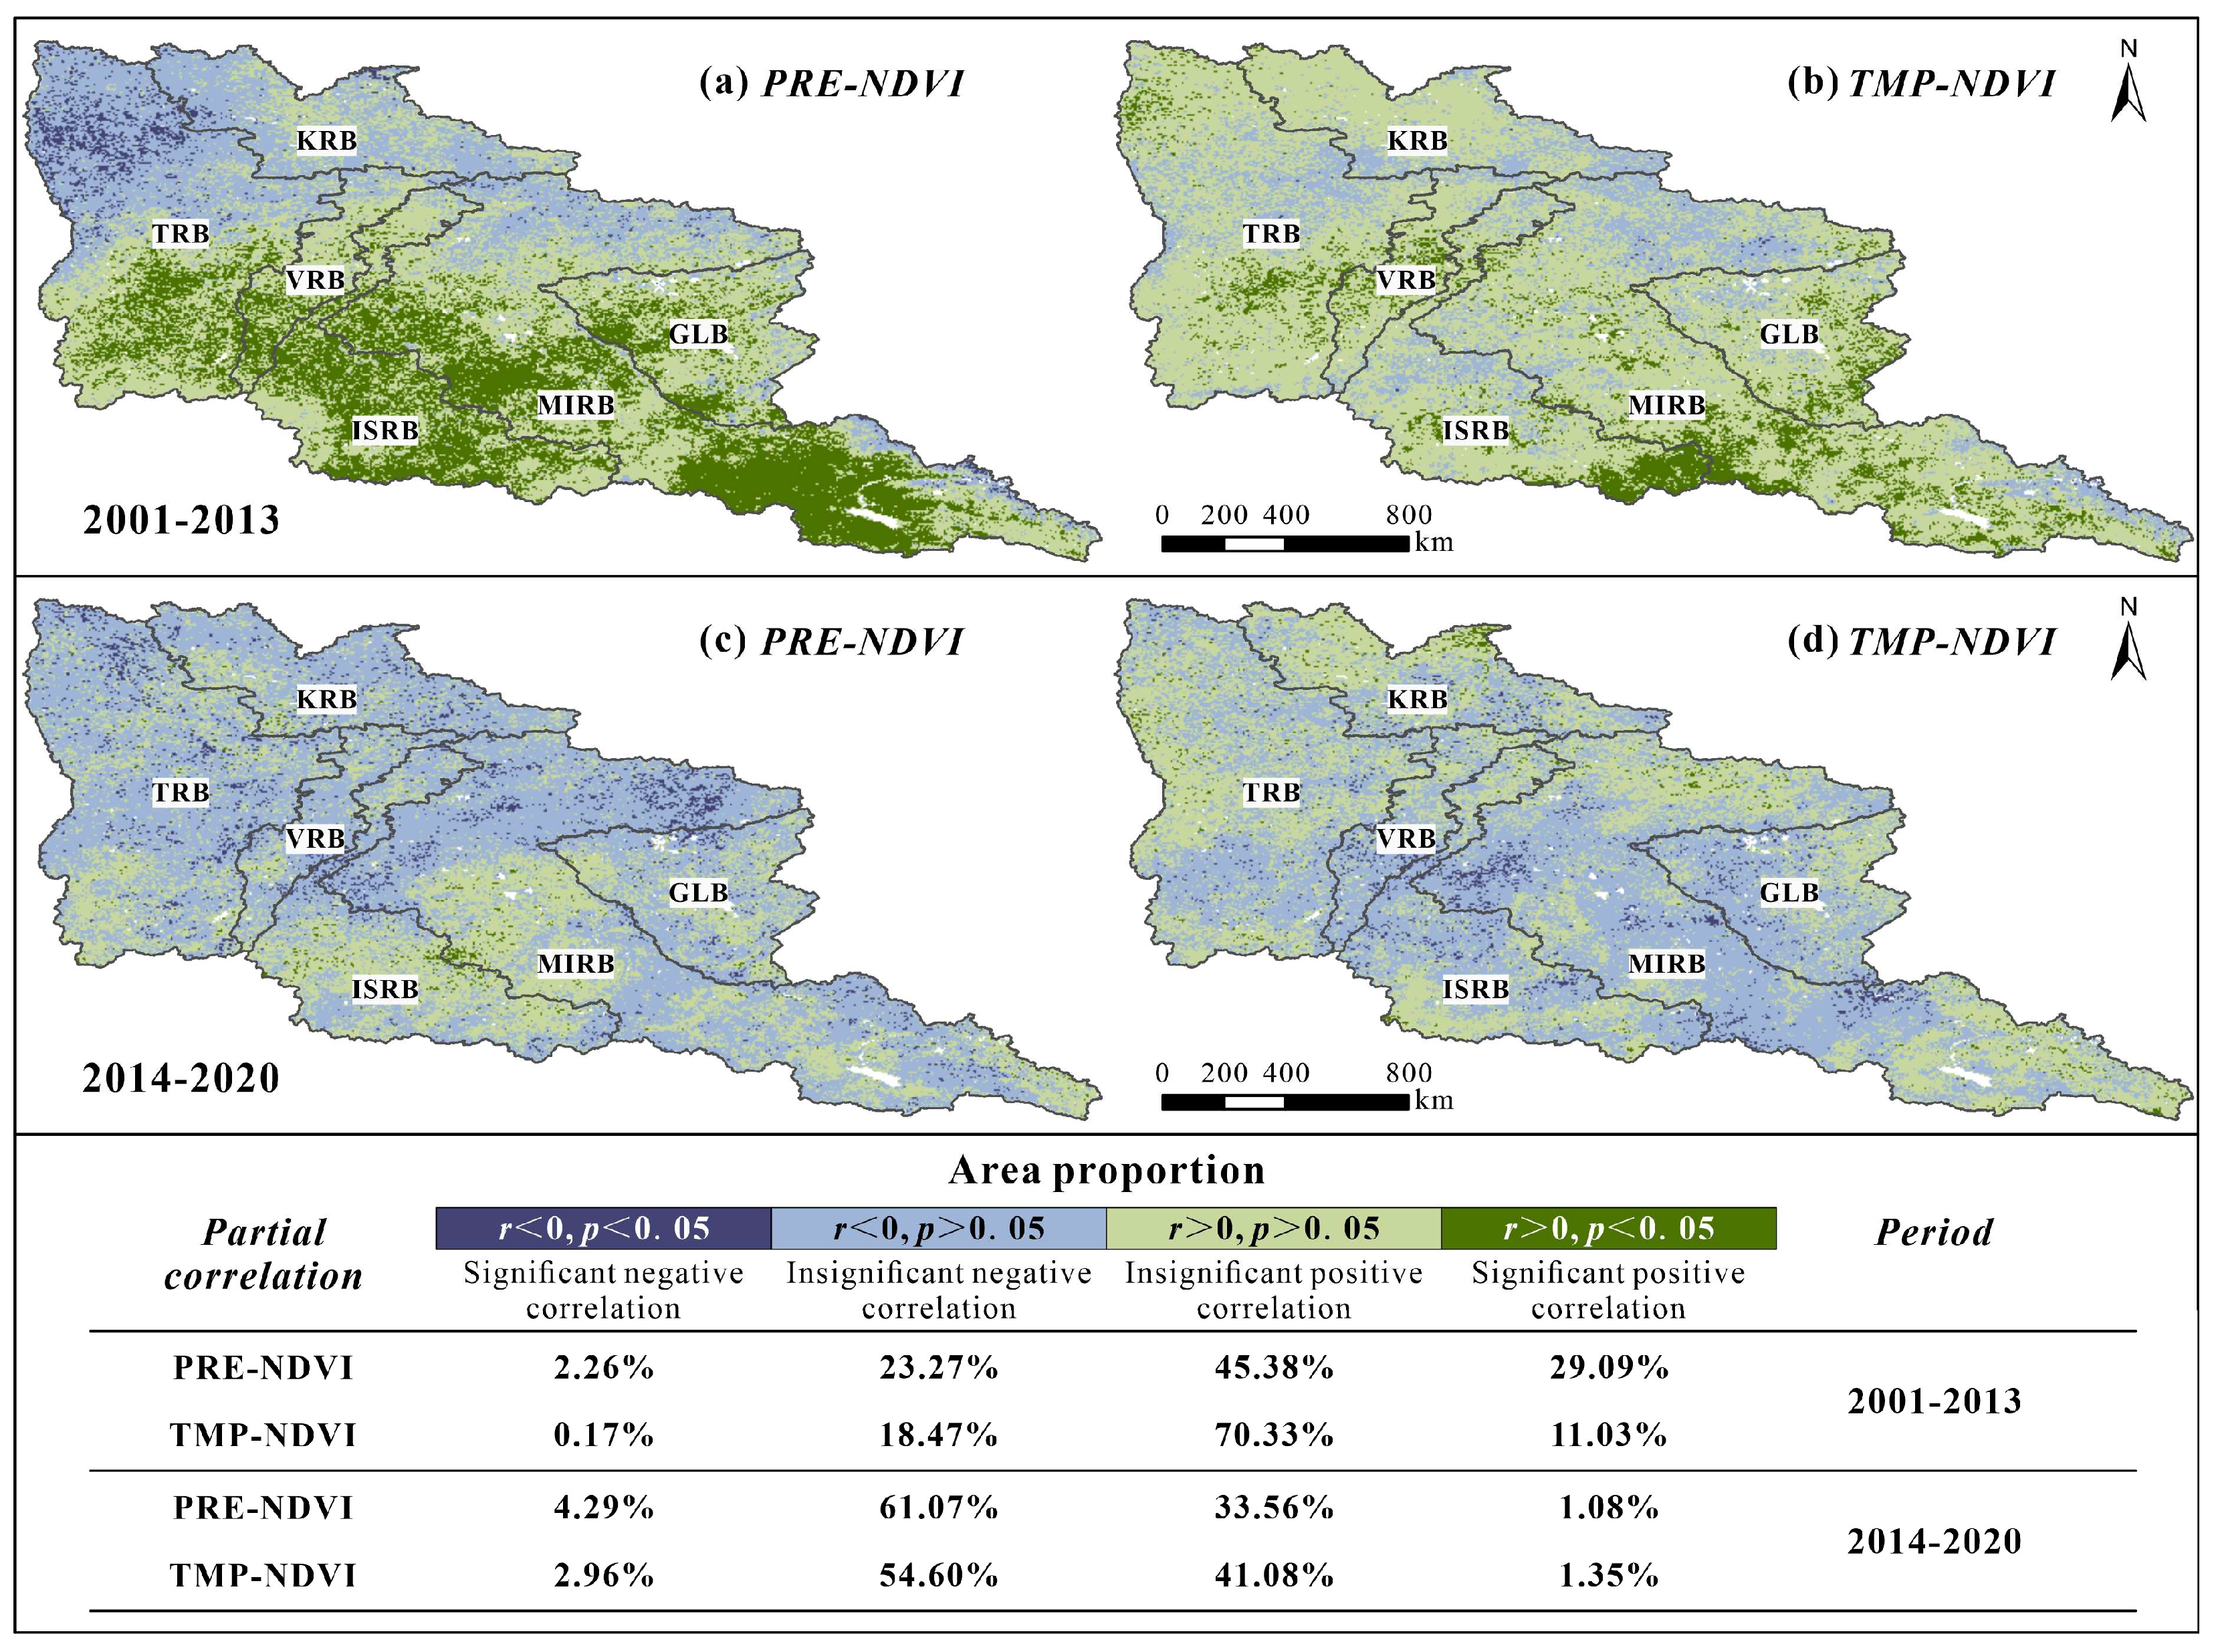
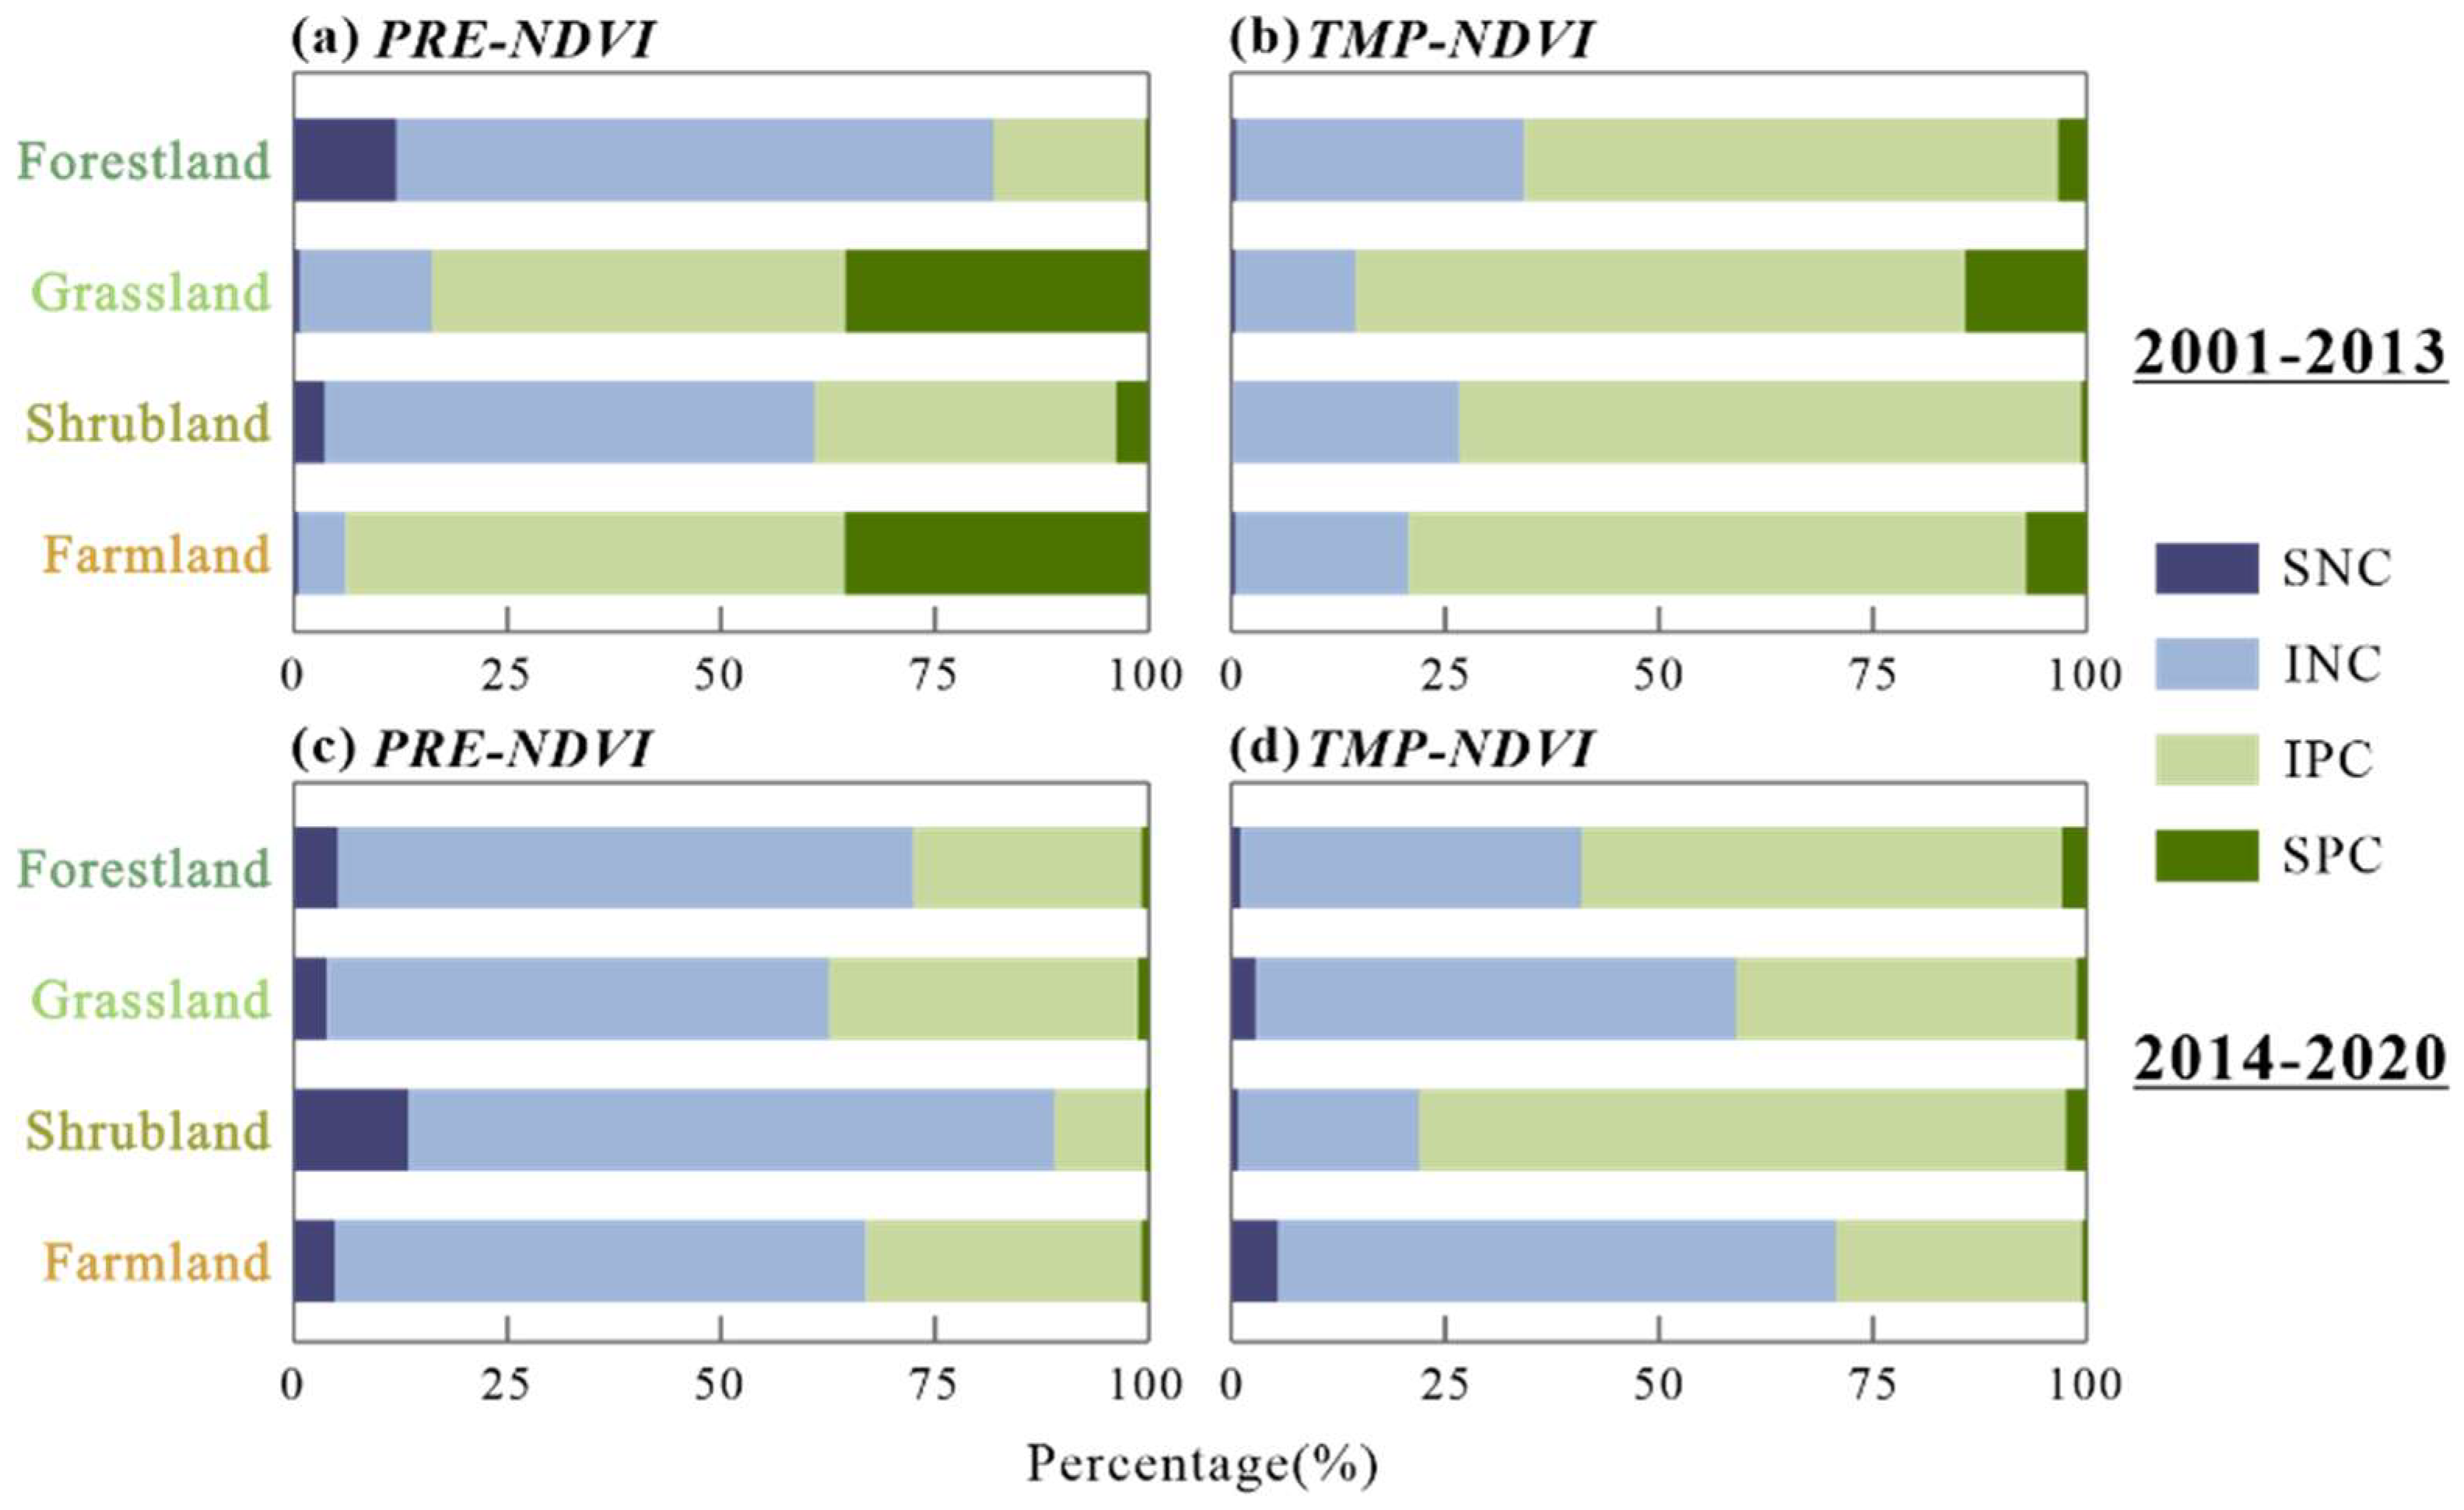
3.3. Correlations Between the NDVI Dynamics and the Climate Factors

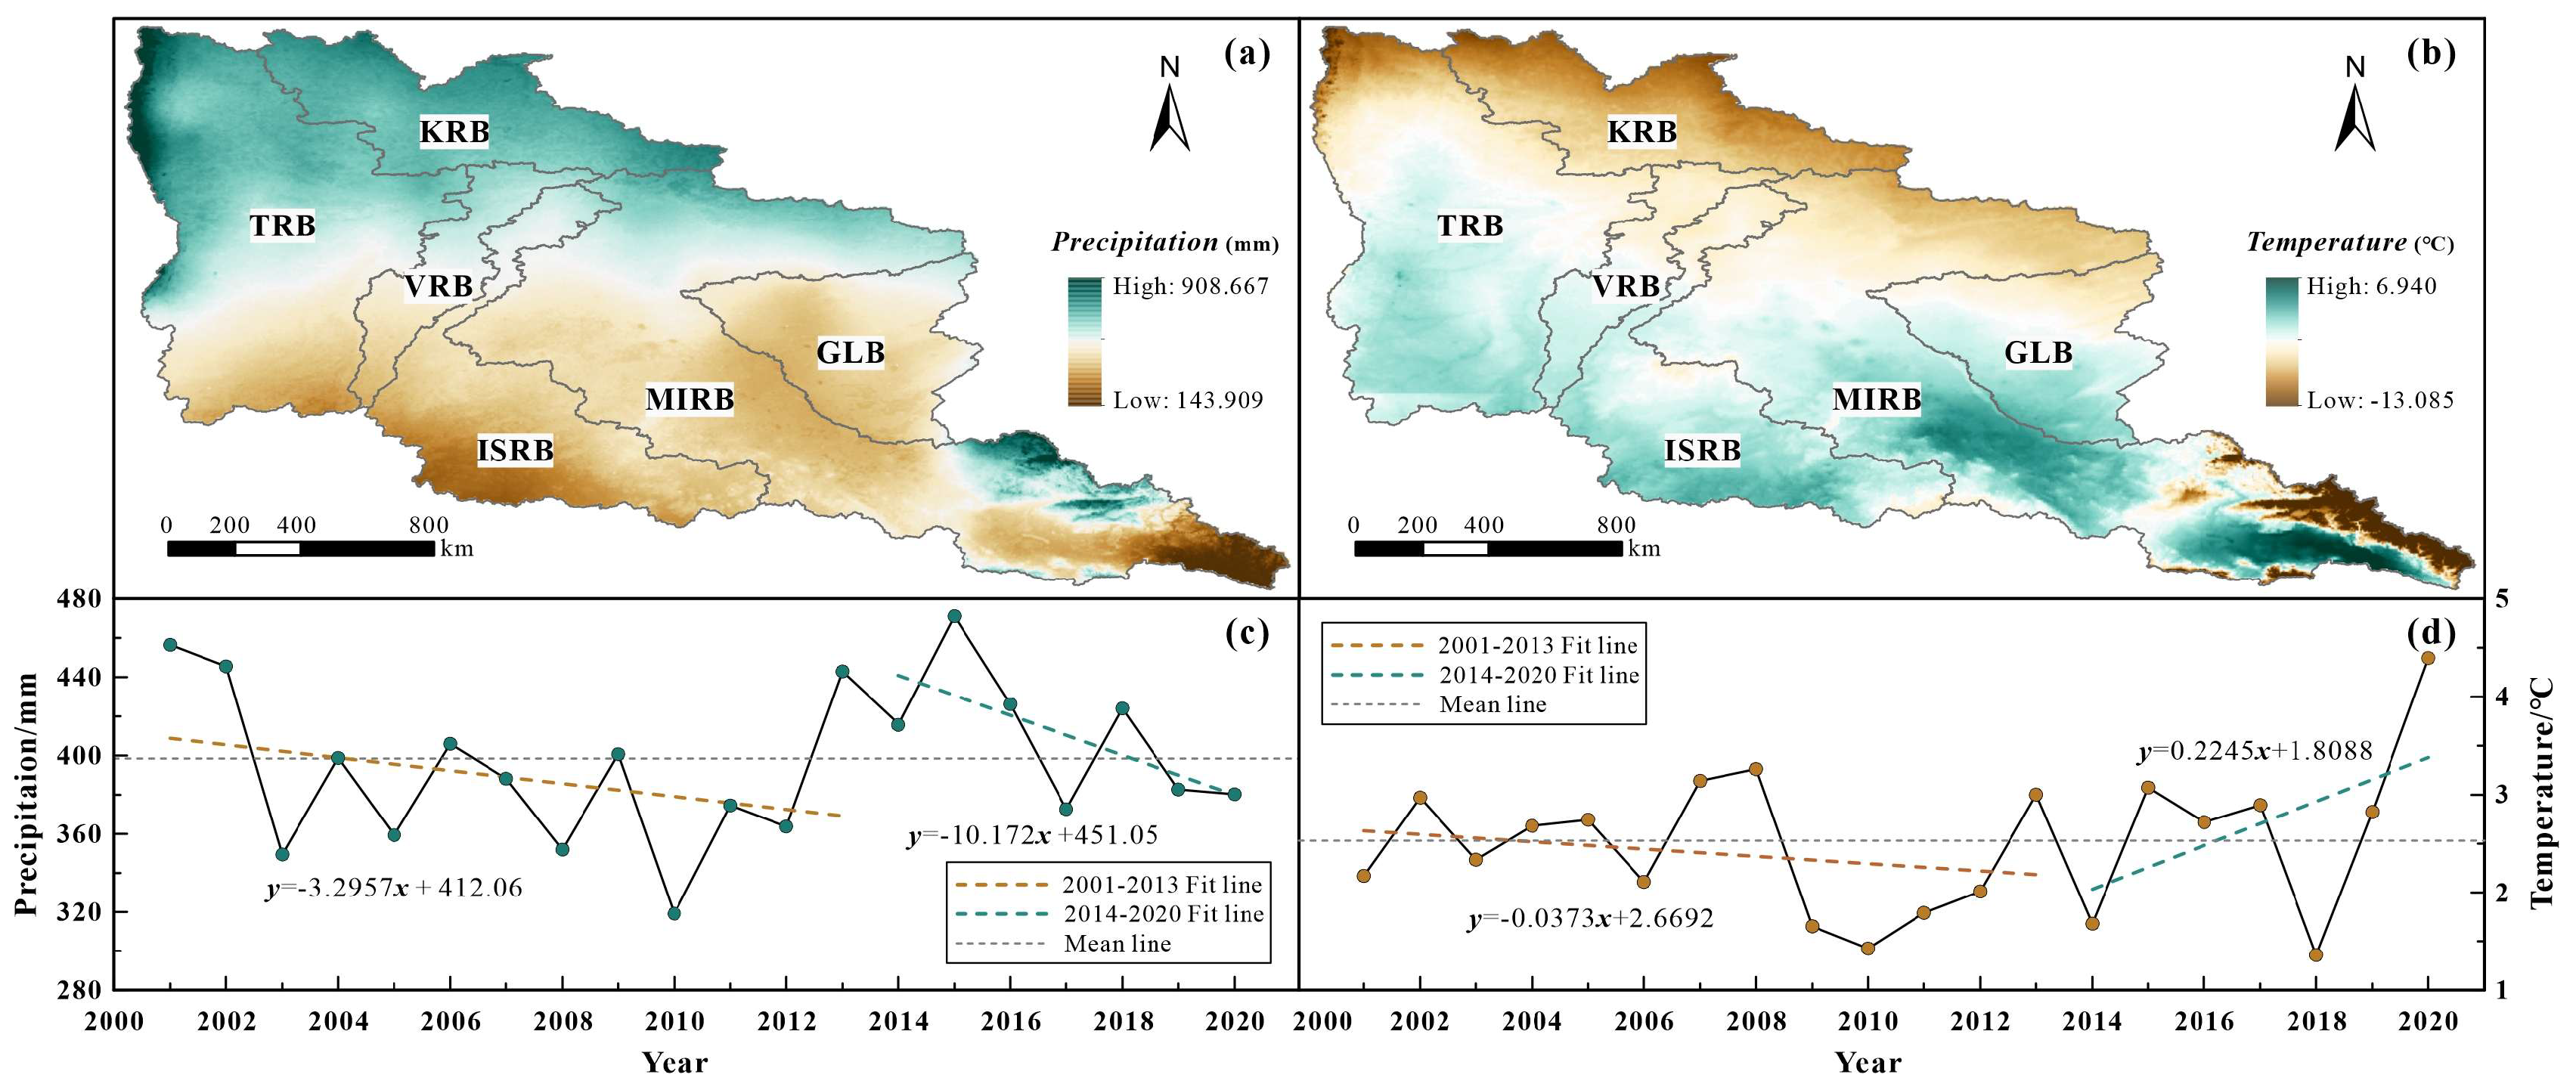
3.3.1. Climate Change Characteristics

The climate distribution in the IRB throughout the 21st century is clearly characterized in Figure 7. The precipitation decreases significantly from north to south (Figure 7a), aligning with the NDVI distribution. The temperature pattern is opposite to the precipitation pattern and increases from north to south (Figure 7b). Most areas of the IRB had average temperatures greater than 0 °C, and the high- and low-temperature zones were mainly concentrated in the southeastern part of the MIRB. From 2001 to 2013, the precipitation and temperature decreased at rates of 3.2957 mm a–1 (Figure 7c) and 0.0373 °C a–1 (Figure 7d), respectively. The NDVI also decreased, indicating the browning of the vegetation. By contrast, from 2014 to 2020, the precipitation continued to decrease more rapidly at a rate of 10.172 mm a–1, while the temperature trend reversed to an increasing trend at a rate of 0.2245 °C a–1. The NDVI exhibited an increasing trend, reflecting the greening of the vegetation in the IRB. The magnitudes of the changes in the climate elements were significantly greater in the second period than in the first period.

3.3.2. Impact of Climatic Factors on the NDVI Distribution

The correlations between the NDVI and precipitation and temperature in the IRB were investigated based on the pixel scale using partial correlation analysis (Figure 8). It was found that they exhibited distinct patterns in the two periods. In 2001–2013, all of the climatic variables were positively correlated with the NDVI. The area where precipitation and NDVI were positively correlated accounted for 74.47% of the total area of the IRB, of which the positive correlation was significant in 29.09%, mainly in the southern TRB, VRB, ISRB, MIRB, and most of the GLB, that is, concentrated in northern Kazakhstan (Figure 8a). The areas with negative correlations were mostly distributed in the northern KRB, TRB, and MIRB, that is, in the West Siberian Plain region, with significant negative correlations in northern TRB. The correlation between temperature and the NDVI was positive in 81.36% of the area (Figure 8b), with a significantly positive correlation area in 11.03%, primarily in the southern ISRB and MIRB, while only 0.17% of the IRB exhibited a significant negative correlation. In addition, the relationship between the NDVI and precipitation varied according to the vegetation type (Figure 9a). Of the area in which the NDVI and precipitation were negatively correlated, 81.77% was forestland and 60.94% was shrubland, while the vast majority of the area in which the NDVI was positively correlated with precipitation was covered by grassland (83.84%) and cropland (93.92%). By contrast, the correlation between the NDVI and temperature was similar across the vegetation types (Figure 9b), with grassland having the highest proportion of area in which the NDVI was positively correlated with temperature (85.51%), followed by cropland (79.33%), shrubland (73.34%), and forestland (65.76%).
In 2014–2020, precipitation, temperature, and NDVI were generally negatively correlated, i.e., both climate variables primarily inhibited the NDVI. The area of negative correlation between precipitation and NDVI was negative in 65.36% of the basin, and these areas were concentrated in the central parts of the ISRB, MIRB, and GLB (Figure 8c). The areas in which the correlation between the NDVI and temperature was negative were predominantly located in most of the VRB, ISRB, and MIRB (Figure 8d), occupying 57.56% of the basin, while the regions in which they were positively correlated were mainly concentrated in the West Siberian Plain, Altai, and Zaysan regions of the basin. During this period, the proportions of the areas of the vegetation types in which the correlation between the NDVI and precipitation was negative were as follows: shrubland (89.02%), forestland (72.48%), cropland (66.93%), and grassland (62.68%) (Figure 9c). In addition, the proportions of forestland and shrubland in which the correlation between the NDVI and temperature was positive were 59.04% and 78.03%, respectively (Figure 9d), but the positive correlations were only significant in 2.83% and 2.36%, respectively. Meanwhile, the proportions of grassland and cropland in which the NDVI was negatively correlated with temperature were greater, at 59.00% and 70.76%, respectively.
The relationships between the precipitation, temperature, and NDVI shifted significantly in both periods with some spatial variability. By comparing the absolute correlation coefficients, it was found that the absolute correlation coefficients between the NDVI and precipitation were greater than those between the NDVI and temperature during both periods, and the areas where the absolute correlation coefficient with precipitation was larger than that with temperature accounted for 67.19% of the basin area in 2001–2013, while it only accounted for 53.33% in 2014–2020. Taken together, this suggests that during the study period, the response of vegetation in the IRB to precipitation was greater than its response to temperature and that the extent of the response has decreased in recent years.

3.4. Contributions of Climatic Factors to Vegetation Dynamics

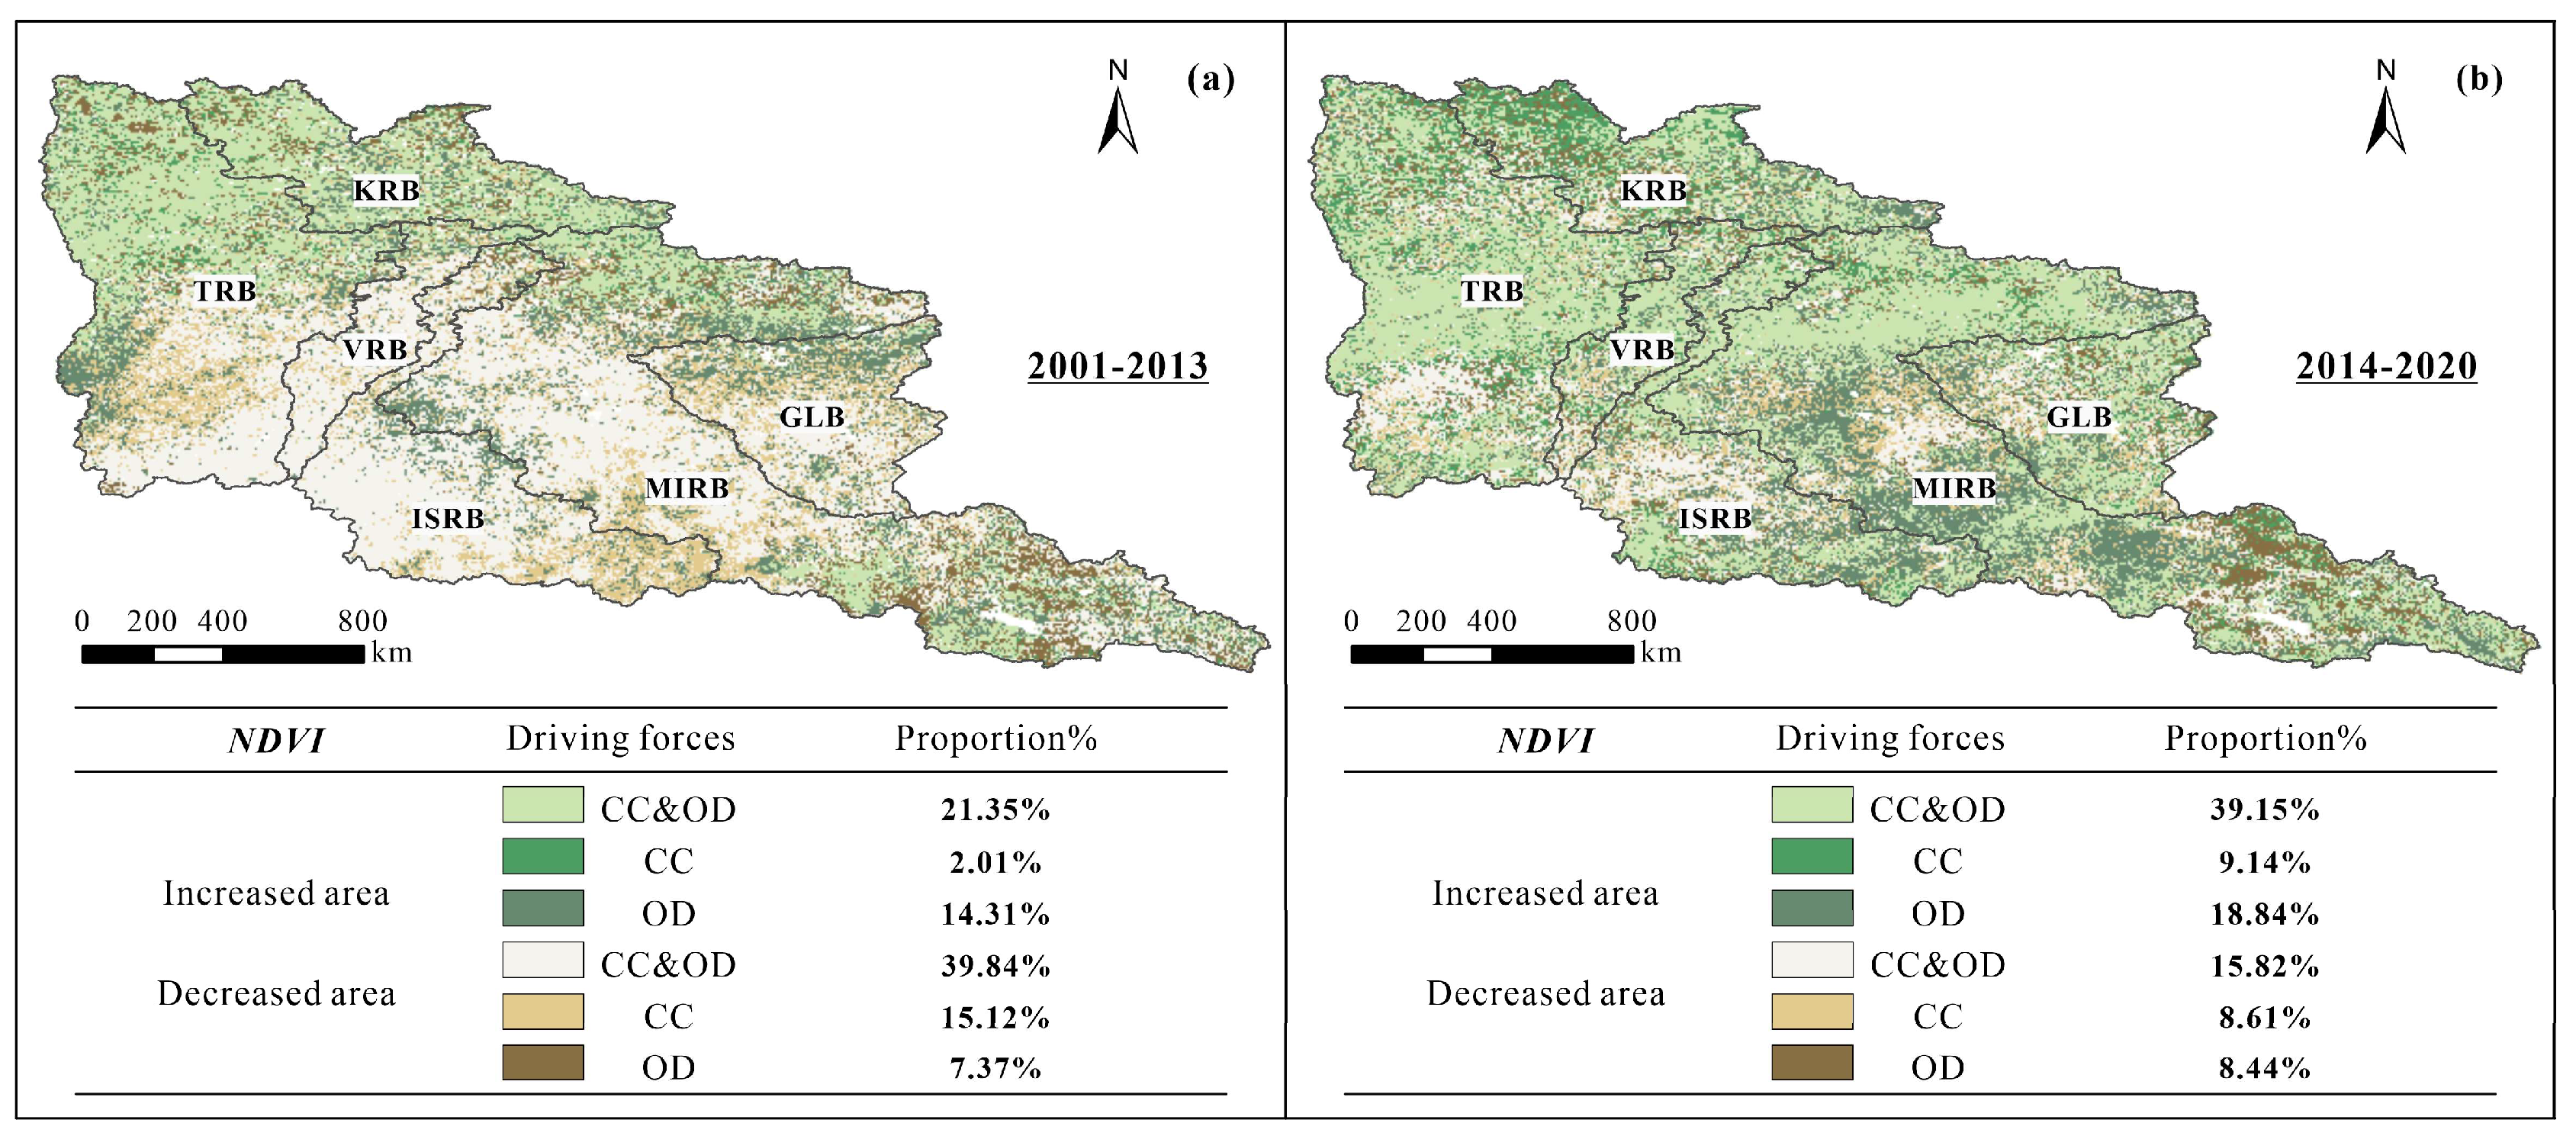
3.4.1. Drivers of NDVI Changes

Figure 10 shows the characteristics of the spatial distributions of the drivers of NDVI changes in the IRB during the two periods. During the first period (Figure 10a), climate change and other drivers combined to produce an increase in the NDVI in 21.35% of the total area of the basin, but these areas were mostly located in the northern parts of the KRB and TRB and the northern and southeastern parts of the MIRB, that is, the West Siberian Plain, Zaysan region, and Altay region. The area in which climate change drove an increase in the NDVI was small, accounting for only 2.01% of the total area of the IRB. By contrast, the areas where other drivers contributed to vegetation improvement accounted for 14.31% of the IRB, and these areas were more dispersed within the watershed. The combination of climate change and other factors resulted in a decrease in the NDVI in more than 39.84% of the IRB, including the northern part of the TRB and most of the VRB, ISRB, MIRB, and GLB, with a general concentration in northern Kazakhstan. The areas that experienced vegetation cover degradation due to climate change accounted for 15.12% of the entire area, and these areas were mostly centered in the western and southern parts of the IRB.
During the second period (Figure 10b), climate change and other drivers contributed to an improvement in vegetation in 39.15% of the IRB, and these areas were more broadly distributed within the watershed. The areas in which the increase in vegetation cover was mainly caused by climate change accounted for 9.14% of the area, while the areas in which the NDVI increase was promoted by other drivers accounted for 18.84% of the IRB, and these areas were concentrated in the central part of the MIRB. The combined contribution of climate change and other factors accounted for 15.82% of the degradation of vegetation in the basin, and while climate-induced vegetation degradation accounted for 8.61%, primarily in the central region of the MIRB, similar to that of the previous period, the area of decline in the NDVI due to other factors was still concentrated in the southeastern part of the MIRB, mainly near the Zaysan region, accounting for 8.44% of the basin area.
From an overall perspective, the changes in vegetation in the IRB were caused primarily by a combination of climate change and multiple factors, and the combined impacts of the drivers mainly contributed to the vegetation degradation in 2001–2013, and then the drivers shifted to driving vegetation increases in 2014–2020. In summary, the combined effect of all of the drivers was more significant, and the individual drivers had more limited effects on the NDVI.

3.4.2. Relative Contribution of Climate Change to the Impact on NDVI

The impacts of climate change on the NDVI in the IRB were quantitatively analyzed based on the pixel metric scale using multiple linear regression and residual trend analysis. In 2001–2013, the relative contribution of climatic factors to the change in the NDVI was 45.93%, while in 2014–2020, it was 42.65%, i.e., the contribution from climate change decreased compared with that in the preceding period.
The NDVI trend was used to classify areas with improved and degraded vegetation (Figure 11). During the first period, vegetation improved in 37.67% of the total watershed area (Figure 11a), and the areas in which the impact of climate change was greater than 60% accounted for 18.50% of the improved area. These areas were concentrated in the northern TRB and within the KRB. During the second period, the areas with improved vegetation accounted for 67.13% of the total area of the IRB (Figure 11b), which was significantly larger than in the previous period. Climate change had an explanatory power greater than 60% for the NDVI changes in 29.96% of the improved areas, and these areas were mainly distributed within the KRB and TRB.
In 2001–2013, areas with degraded vegetation accounted for 62.33% of the IRB. Areas significantly affected by climate change (relative contribution of greater than 60%) accounted for 51.83% of the IRB and were distributed in the TRB, VRB, ISRB, and MIRB, as well as in most parts of the GLB (Figure 11c). In 2014–2020, compared with the previous period, vegetation degradation occurred in fewer areas of the basin, and degraded areas accounted for 32.87% of the basin. Areas in which the contribution from climate change was greater than 60% accounted for 44.55% of the total area. These areas were distributed as strips in the southern portions of the TRB and VRB and in the central portions of the ISRB, MIRB, and the GLB (Figure 11d).

4. Discussion

4.1. Trends in NDVI

The IRB covers a broad area across several degrees of latitude and longitude and contains areas with different aridity classes, i.e., semiarid to arid and subhumid to humid (Figure 1), which makes the vegetation changes in this area more complex. During the 2001–2020 period, the overall trend of the NDVI in the IRB changed from decreasing to increasing, with a shift occurring in approximately 2013. This shift was spatially reflected in the drylands of northern Kazakhstan (Figure 4), where the vegetation characteristics changed from browning to greening. A significant abrupt change in the NDVI also occurred in the Kherlen River Basin within the same latitude range during 2013–2017 [63]. In the latter, the NDVI decreased significantly during this abrupt change period, after which it increased. The Altay region covers the upstream basin of Irtysh River. In this area, the vegetation in the high-elevation mountains and other areas has changed in recent years, with a trend similar to that in the IRB as a whole, which has gradually increased in recent years [64]. It has been shown that NDVI changes across Central Asia tended to decline from 2001 to 2010 and recovered after 2011, a feature that is also consistent with the trend of vegetation changes in the IRB [65].
Vegetation growth in the IRB has improved in recent years, and this greening trend identified in this study is quite consistent with the results of previous studies on vegetation characteristics in the mid-to-high latitudes of the Northern Hemisphere conducted using different data and methods [10,66]. The long time series NDVI dataset that we utilized can better indicate vegetation dynamics in the basin, which can further reflect the trend of environmental evolution. Results of this study can also serve as a comparative reference for future environmental characterization studies conducted on longer timescales and larger spatial scales.

4.2. Response of NDVI to Climate Change

RESTREND revealed a high relative contribution of climate change to vegetation cover changes in the IRB, and the factor detection analysis revealed that precipitation and temperature also had high explanatory power for the spatial variations in the NDVI during the study period, indicating that climate change also played an essential role in vegetation dynamics in the IRB. Climatic conditions determine the regional distribution of hydrothermal conditions [67], and they can provide conditions that either promote or limit the vigorous growth and development of vegetation [19]. Precipitation promotes water uptake by plants by increasing the soil moisture content, which facilitates plant growth and leaf area expansion, further increasing the NDVI [68]. Similarly, rising temperatures boost vegetation photosynthesis and accelerate the decomposition of soil organic matter, creating favorable conditions for vegetation growth and development [69,70,71]. However, these benefits are subject to environmental variability. Excessive precipitation can increase the frequency and intensity of surface water erosion and alter soil properties [72], while prolonged warming intensifies surface evapotranspiration, leading to soil moisture depletion [73], which significantly inhibits vegetation growth. Figure 8 illustrates that precipitation and temperature exhibit both positive and negative correlations with NDVI, depending on the regional environmental conditions. For example, in the high altitude of the Three-River headwater region, temperature is more important than precipitation for vegetation growth [74], while in Central Asia, precipitation is the most important factor limiting vegetation development due to the typical arid characteristics [75]. Within the Indian northwestern region, the relative importance of temperature and precipitation on vegetation dynamics changes significantly with altitude [76], and in the Loess Plateau region, the degree of influence of temperature, precipitation, and other environmental factors on the mean and maximum states of vegetation is not exactly the same [24].
In the period before the abrupt change (2001–2013), the precipitation and temperature in the basin exhibited decreasing trends with relatively small variations. This period also coincided with the global warming hiatus, and the climate trend was relatively moderate. The NDVI in the IRB exhibited positive correlations with climate factors but with notable spatial variability. The northern part of Kazakhstan is a semi-arid region (Figure 1), and vegetation browning mainly occurred in this area (Figure 5c). Figure 8 shows that the NDVI was positively correlated with precipitation and temperature in this area, while climatic factors exhibited decreasing trends with the NDVI. This region contained extensive areas of grassland and farmland, and Figure 11 shows that climate contributed more to vegetation degradation in this area. The results reveal that during this period, both precipitation and temperature conditions were unfavorable for the development of arid region vegetation, but the effect of precipitation was greater. This finding aligns with the results of previous studies; that is, precipitation is a key variable influencing the development of vegetation in arid and semi-arid zones [32,77]. In the high-latitude region of the IRB, namely, the West Siberian Plain, forestland dominated, as well as a small amount of shrubland. Unlike grassland and cropland, the NDVI values of forestland and shrubland increased during this period, and the NDVI was negatively correlated with precipitation and positively with temperature. This is in agreement with the results of a previous study [78] and is a result of the fact that temperature has a greater influence on vegetation than precipitation in cold high-latitude environments. Typically, grassland and cropland respond more strongly to changes in precipitation than forestland [19]. Thus, vegetation dynamics in the high-latitude region of the IRB differed from those of dryland vegetation.
By contrast, in the period following the abrupt change (2014–2020), the relationships between the NDVI and both temperature and precipitation for the basin as a whole shifted in the negative direction, and the significance of the proportions of areas with positive spatial relationships decreased notably. Similarly to the sudden change in the NDVI, there was a significant shift in climate in 2013. Precipitation in the basin decreased significantly in the period after the abrupt change, while the temperature trend shifted from decreasing to increasing, and climate of the IRB became warmer and drier overall. This shift may have been related to the fact that the global warming hiatus ended in 2012 [37], mid-to-high-latitude regions in the Northern Hemisphere were the most warmed in recent decades, and the warming hiatus had a significant impact on this region, so the end of the hiatus resulted in significant changes in the regional climate. Concurrently, various types of vegetation in the basin have exhibited a greening trend in the last few years, though significant spatial variations persist. The observed warming of temperature leads to earlier snowmelt and a lengthier growing season for the high-latitude cold zone, while also promoting vegetation photosynthesis, which in turn increases NDVI. The northern part of the IRB is dominated by forest, and although the residual trend results (Figure 11) show a decrease in the contribution of the role of climate, the temperature changes have been relatively favorable for vegetation recovery in the region. The shift in the trend of arid region vegetation in the IRB is particularly striking (Figure 5), which is not favored by the changing climatic conditions in the arid region [79] (Figure 11), and the relative contribution of climate change has decreased, suggesting that arid regions within the basin may have been more impacted by the heightened influence of alternative drivers in recent years. The findings suggest that climate change has led to an abrupt shift in NDVI trends, while the increasing influences of other driving factors like human activities in recent years have further accelerated the transition of the NDVI from decreasing to increasing. Under the combined effect of various factors, the vegetation in the basin gradually improved, shifting from browning to greening.

4.3. Impacts of Human Activities and Other Factors on the NDVI

4.3.1. Relative Contributions of Other Drivers to the NDVI

The RESTREND results revealed that other drivers also played an extremely crucial role in vegetational development. The relative contribution of other factors including human activities increased from 54.07% to 57.35% during the study period. In the region of improved NDVI, areas where the contribution of other drivers to the increased NDVI exceeded 60% accounted for 75.39% of the area in 2001–2013. Unlike the concentrated effects of climate change, the influences of other drivers were more dispersed (Figure 12). In 2014–2020, other drivers with an explanatory power of more than 60% accounted for 56.26% of the increase in the NDVI, mainly in the MIRB. Within the region where the NDVI decreased, the areas in which the other drivers had a high explanatory power (>60%) in 2001–2013 were mainly concentrated in the southwestern part of the IRB, as well as in the Zaysan and Altay regions. From 2014 to 2020, the area in which vegetation degradation occurred in the basin decreased. The areas in which other drivers had a high explanatory power (>60%) accounted for 43.93% of the area, and their distribution remained similar to that during the previous period.
In recent years, the significant positive impacts from other drivers were primarily located in the semi-arid region of the IRB, where the environmental conditions are more complex than in the higher-latitude regions, which, in addition, to the influence of natural factors, including hydrothermal differences, are more obviously disturbed by anthropogenic activities, such as population growth and social development.

4.3.2. Anthropogenic Impacts on the NDVI

Anthropogenic effects, such as afforestation and deforestation, urbanization development, and ecological restoration projects, have multifaceted effects on vegetation growth and development, causing significant changes to the land surface over a short period of time [58,80]. Land cover change is a visual representation of the modification of nature by human activities [81], and it is directly related to the development of vegetation. The forestland was mainly distributed in the northern part of the IRB (Figure 13), farmland and grassland dominated the central part, and grassland was continuously distributed in the southern part. The land cover changed during the last 20 years, exemplified by the transformation of forestland, grassland, and cropland (Figure 14).
From 2001 to 2013, the area covered by forestland, farmland, water bodies, and other land-use types decreased, while the area covered by shrubland, grassland, and built-up land increased, and most of the lost areas were converted to grassland (Figure 14), which was widely distributed across the basin. The NDVI decreased during this period, primarily in the grassland and farmland areas. There are several reasons for this change. First, with economic development and population growth, the expansion of construction land in the IRB has been facilitated [82,83], accompanied by the development of irrigated agriculture, which has visually altered the land cover characteristics. Second, a substantial portion of the IRB, particularly within the Kazakhstan segment, is characterized by geochemical anomalies, with a prevalence of metal mines. The middle region of the IRB is home to hundreds of industrial enterprises responsible for the extraction and processing of ore materials, and the exploitation of mineral resources frequently results in substantial land destruction, which directly impacts the vegetation cover on the surface [83,84]. Furthermore, Central Asia, particularly Kazakhstan, has a well-developed livestock industry, and overgrazing was also an important cause of land degradation [70,85], which damages grassland vegetation and reduces its cover. In addition, water resources played a key role in limiting the growth of land cover types such as grassland and cropland [86], and due to the proliferation of industrial activities in Kazakhstan, such as water for mining processing and agricultural irrigation, there was irrationality in the distribution and utilization of water resources [87]. This lack of sufficient water, especially in arid regions, hindered vegetation growth. Moreover, the discharge of domestic sewage and wastewater from mining operations constitutes a significant source of water contamination [88,89], thereby impeding the proliferation and well-being of riverine and riparian vegetation within middle and lower watersheds. During this period, the interconversion between farmland and grassland was obvious (Figure 14). This was related to the abandonment and subsequent reclamation of farmland after the collapse of the Soviet Union. Following abandonment, herbaceous plants grew, but reclamation disrupted the original vegetation. The reclaimed farmland area remained far below pre-abandonment levels [90]. This process also affected the soil structure, vegetation root systems, and even the ecosystems [91], making it difficult for vegetation to recover to the original growth level. The complex environmental conditions contributed to the conversion of forestland and shrubland to grassland during this period. Concurrently, the NDVI exhibited a downward trend under unfavorable climatic conditions, particularly in the drylands of the northern part of the basin.
In recent years, the vegetation in the IRB has obviously improved. From 2013 to 2020, the areas of all of the vegetation cover types expanded, except for those of forestland and farmland, which decreased. The transformations between vegetation types still mainly involved conversion into grassland (Figure 14). The expansion of wetlands and water bodies could regulate soil moisture and influence the growth, development, and spatial pattern of the vegetation in the basin [92,93]. Figure 12 shows that driving forces other than temperature and precipitation clearly promoted the increase in the NDVI, and this was greatly predominated in the relatively dry areas of the IRB. In terms of anthropogenic interventions, the implementation of many environmental countermeasures in recent years has effectively facilitated vegetation recovery, and the ecological quality of the IRB has improved significantly [94]. During this period, Chinese President Xi Jinping proposed the “Silk Road Economic Belt” initiative in Kazakhstan in 2013, which has greatly promoted the economic development of the countries along the Belt and Road in recent years. In 2015, the Chinese government proposed “the Green Silk Road” to foster the pursuit of environmentally conscious behavior in the countries along this route, thus achieving integration of the ecological environment and the Sustainable Development Goals [95,96]. The implementation of this international cooperative strategy, together with the promotion of many new energy and sustainable environmental protection projects [97,98], has been complemented by direct environmental policies. For example, the implementation of the National Environmental Action Plan (NEAP) 2020 in Kazakhstan, since 2013, has been effective in reducing air pollutant emissions. In the same year, the Concept of the Transformation of the Republic of Kazakhstan to a Green Economy was published, outlining a series of practical measures and tasks to improve the environment [99], and the recovery of different types of vegetation, such as forests, was evident during this period [100]. The ban on landfill disposal of a wide range of wastes containing chemicals was introduced in 2016 [101], which benefited the protection of soils and the restoration of vegetation productivity in the basin. Meanwhile, the establishment of nature reserves has limited industrial development and overgrazing activities in the IRB, thereby increasing watershed protection and improving the environment for vegetation growth [102]. Furthermore, the Government of the Russian Federation has enacted several environmental programs and decrees relevant to the environment north of the IRB, leading to an increase in forest restoration in Western Siberia [103]. In the Xinjiang section of the IRB in China, the implementation of ecological protection and restoration projects in recent years has yielded positive results, with the area of ecological land, such as forests, grasslands, wetlands, and water bodies, being restored [104]. Consequently, a combination of various environmental protection methods and approaches has significantly improved the ecological and environmental situation in China, Kazakhstan, and Russia in the IRB. In summary, the important role that these human activities have played in the effects of natural components has contributed to a greening trend of vegetation in the IRB in recent years.
In summary, changes in the vegetation cover of the IRB are driven by a combination of climatic fluctuations and anthropogenic disturbances. Prior to the abrupt shift, climatic conditions within the basin were not conducive to optimal vegetation growth. The degradation of vegetation, particularly in arid regions, was exacerbated by a predominant focus on economic development, which led to a neglect of the ecological environment. The cessation of the quiescent period of global warming engendered a marked alteration in the climate conditions of the basin, the effects of which on disparate regions are not uniform. For high-latitude regions within the IRB, the positive effects of climate change remained evident, and the West Siberian Plain has been less disturbed by human activity compared to other industrial and agricultural areas, which has been conducive to vegetation growth. In contrast, the mid-latitude arid regions of the IRB have seen a notable recovery of vegetation, largely attributable to recent multinational environmental policy interventions that have gradually offset some of the deleterious effects of climatic conditions.

4.4. Limitations and Future Directions

This study builds on previous studies by identifying drivers such as precipitation, temperature, elevation, and soil characteristics to analyze the spatial variability of the NDVI and to quantitatively analyze and explore the influences of climatic and other factors on the NDVI, which is still not comprehensive enough. First, because the study area is located in the mid-to-high-latitude region, the thick snow cover in winter and the prolonged greening-up period in spring limit the observation of the growth trend of vegetation in different seasons. Second, the growth, development, and dynamics of vegetation are extremely complex, involving multiple information transfer processes, such as biochemical cycling, and are influenced and constrained by multiple factors during their development, such as extreme weather events, atmospheric circulation, soil moisture, CO2 concentration, and nitrogen deposition, which are also critical to vegetation growth. Therefore, in future research, the comprehensive effects of other anthropogenic and environmental factors on vegetation dynamics should be fully considered, and effective physical–mathematical models should be developed to disaggregate and quantify the impacts of the different dimensions of human activities.

5. Conclusions

In this study, we determined the spatial and temporal patterns of vegetation changes in the Irtysh River Basin from 2001 to 2020 and quantified the contributions of multiple factors to the evolution of different vegetation types. The main conclusions are as follows:
(1)
Around 2013, there was an abrupt change in the NDVI trend due to the end of the global warming hiatus, with the most significant response observed especially in grasslands and farmlands of the arid regions in northern Kazakhstan.
(2)
Precipitation and temperature were the main driving forces of spatial vegetation differentiation in the basin, with precipitation showing a greater influence on vegetation in arid regions, while temperature was more positive in non-arid regions at high latitudes. After the abrupt change, the contribution of climatic factors decreased from 45.93% to 42.65%, and the relative contribution of other drivers, including human activities, increased from 54.07% to 57.35%.
(3)
In recent years, the overall vegetation cover in the basin has improved significantly owing to the combined effects of anthropogenic interventions and climate change. For different regions, sustainable management of forests needs to be strengthened in non-arid zones, while the allocation of water resources should be further optimized in arid zones. The findings provide valuable insights for the sustainable management of transboundary river basins in response to global change.

Supplementary Materials

The following supporting information can be downloaded at: https://www.mdpi.com/article/10.3390/rs17071135/s1, Figure S1: Scatterplot of monthly mean precipitation versus temperature for observations and downscaling. Table S1: Comparison of results before and after the downscaling. Table S2: Ecological detection of factors (95% confidence level). Table S3: Interaction of detection factors in 2001. Table S4: Interaction of detection factors in 2013. Table S5: Interaction of detection factors in 2020.

Author Contributions

Conceptualization, S.F. and L.M.; methodology, S.F. and L.M.; software, S.F.; validation, S.F., G.I. and G.S.; formal analysis, S.F.; investigation, J.A., G.I. and G.S.; resources, J.A.; data curation, S.F.; writing—original draft preparation, S.F.; writing—review and editing, J.A. and L.M.; visualization, S.F.; supervision, J.A. and L.M.; project administration, J.A.; funding acquisition, J.A. and L.M. All authors have read and agreed to the published version of the manuscript.

Funding

This research was funded by the Third Xinjiang Scientific Expedition Project (Grant No. 2022xjkk0702) and the National Natural Science Foundation of China (Grant No. 42171014).

Data Availability Statement

The data are contained within this article.

Conflicts of Interest

The authors declare no conflicts of interest.

References

  1. Duveiller, G.; Hooker, J.; Cescatti, A. The mark of vegetation change on Earth’s surface energy balance. Nat. Commun. 2018, 9, 679. [Google Scholar] [CrossRef]
  2. Lewis, S.L.; Brando, P.M.; Phillips, O.L.; Heijden, G.M.F.v.d.; Nepstad, D. The 2010 Amazon Drought. Science 2011, 331, 554. [Google Scholar] [CrossRef]
  3. Zeng, Z.; Piao, S.; Li, L.Z.X.; Zhou, L.; Ciais, P.; Wang, T.; Li, Y.; Lian, X.; Wood, E.F.; Friedlingstein, P. Climate mitigation from vegetation biophysical feedbacks during the past three decades. Nat. Clim. Change 2017, 7, 432–436. [Google Scholar] [CrossRef]
  4. He, L.; Guo, J.; Yang, W.; Jiang, Q.; Chen, L.; Tang, K. Multifaceted responses of vegetation to average and extreme climate change over global drylands. Sci. Total Environ. 2022, 858, 159942. [Google Scholar] [CrossRef]
  5. Smith, T.; Traxl, D.; Boers, N. Empirical evidence for recent global shifts in vegetation resilience. Nat. Clim. Change 2022, 12, 477–484. [Google Scholar] [CrossRef]
  6. Yang, L.; Shen, F.; Zhang, L.; Cai, Y.; Yi, F.; Zhou, C. Quantifying influences of natural and anthropogenic factors on vegetation changes using structural equation modeling: A case study in Jiangsu Province, China. J. Clean. Prod. 2021, 280, 124330. [Google Scholar] [CrossRef]
  7. Higgins, S.I.; Conradi, T.; Muhoko, E. Shifts in vegetation activity of terrestrial ecosystems attributable to climate trends. Nat. Geosci. 2023, 16, 147–153. [Google Scholar] [CrossRef]
  8. Jackson, S.T. Transformational ecology and climate change. Science 2021, 373, 1085–1086. [Google Scholar] [CrossRef]
  9. Gu, Y.; Pang, B.; Qiao, X.; Xu, D.; Li, W.; Yan, Y.; Dou, H.; Ao, W.; Wang, W.; Zou, C.; et al. Vegetation dynamics in response to climate change and human activities in the Hulun Lake basin from 1981 to 2019. Ecol. Indic. 2022, 136, 108700. [Google Scholar] [CrossRef]
  10. Guo, J.; Wang, K.; Wang, T.; Bai, N.; Zhang, H.; Cao, Y.; Liu, H. Spatiotemporal Variation of Vegetation NDVI and Its Climatic Driving Forces in Global Land Surface. Pol. J. Environ. Stud. 2022, 31, 3541–3549. [Google Scholar] [CrossRef]
  11. Berner, L.T.; Massey, R.; Jantz, P.; Forbes, B.C.; Macias-Fauria, M.; Myers-Smith, I.; Kumpula, T.; Gauthier, G.; Andreu-Hayles, L.; Gaglioti, B.V. Summer warming explains widespread but not uniform greening in the Arctic tundra biome. Nat. Commun. 2020, 11, 4621. [Google Scholar] [CrossRef]
  12. Elmendorf, S.C.; Henry, G.H.R.; Hollister, R.D.; Björk, R.G.; Boulanger-Lapointe, N.; Cooper, E.J.; Cornelissen, J.H.C.; Day, T.A.; Dorrepaal, E.; Elumeeva, T.G.; et al. Plot-scale evidence of tundra vegetation change and links to recent summer warming. Nat. Clim. Change 2012, 2, 453–457. [Google Scholar] [CrossRef]
  13. Garonna, I.; De Jong, R.; Schaepman, M.E. Variability and evolution of global land surface phenology over the past three decades (1982–2012). Glob. Change Biol. 2016, 22, 1456–1468. [Google Scholar] [CrossRef]
  14. Huang, Y.; Jiang, N.; Shen, M.; Guo, L. Effect of preseason diurnal temperature range on the start of vegetation growing season in the Northern Hemisphere. Ecol. Indic. 2020, 112, 106161. [Google Scholar] [CrossRef]
  15. Park, H.; Jeong, S.; Ho, C.; Park, C.; Kim, J. Slowdown of spring green-up advancements in boreal forests. Remote Sens. Environ. 2018, 217, 191–202. [Google Scholar] [CrossRef]
  16. Peng, S.; Chen, A.; Xu, L.; Cao, C.; Fang, J.; Myneni, R.B.; Pinzon, J.E.; Tucker, C.J.; Piao, S. Recent change of vegetation growth trend in China. Environ. Res. Lett. 2011, 6, 044027. [Google Scholar] [CrossRef]
  17. Yang, X.; Liu, S.; Yang, T.; Xu, X.; Kang, C.; Tang, J.; Wei, H.; Ghebrezgabher, M.G.; Li, Z. Spatial-temporal dynamics of desert vegetation and its responses to climatic variations over the last three decades: A case study of Hexi region in Northwest China. J. Arid Land 2016, 8, 556–568. [Google Scholar] [CrossRef]
  18. Burrell, A.L.; Evans, J.P.; De Kauwe, M.G. Anthropogenic climate change has driven over 5 million km2 of drylands towards desertification. Nat. Commun. 2020, 11, 3853. [Google Scholar] [CrossRef]
  19. Ren, Y.; Zhang, F.; Zhao, C.; Cheng, Z. Attribution of climate change and human activities to vegetation NDVI in Jilin Province, China during 1998–2020. Ecol. Indic. 2023, 153, 110415. [Google Scholar] [CrossRef]
  20. Yang, S.; Song, S.; Li, F.; Yu, M.; Yu, G.; Zhang, Q.; Cui, H.; Wang, R.; Wu, Y. Vegetation coverage changes driven by a combination of climate change and human activities in Ethiopia, 2003–2018. Ecol. Inform. 2022, 71, 101776. [Google Scholar] [CrossRef]
  21. Yang, J.; Yang, K.; Zhang, F.; Wang, C. Contributions of natural and anthropogenic factors to historical changes in vegetation cover and its future projections in the Yellow River basin, China. Int. J. Climatol. 2023, 43, 6434–6449. [Google Scholar] [CrossRef]
  22. Sun, Z.; Mao, Z.; Yang, L.; Liu, Z.; Han, J.; Wanag, H.; He, W. Impacts of climate change and afforestation on vegetation dynamic in the Mu Us Desert, China. Ecol. Indic. 2021, 129, 108020. [Google Scholar] [CrossRef]
  23. Prăvălie, R.; Sirodoev, I.; Nita, I.-A.; Patriche, C.; Dumitraşcu, M.; Roşca, B.; Tişcovschi, A.; Bandoc, G.; Săvulescu, I.; Mănoiu, V. NDVI-based ecological dynamics of forest vegetation and its relationship to climate change in Romania during 1987–2018. Ecol. Indic. 2022, 136, 108629. [Google Scholar] [CrossRef]
  24. Zhang, Y.; Jiang, X.; Lei, Y.; Gao, S. The contributions of natural and anthropogenic factors to NDVI variations on the Loess Plateau in China during 2000–2020. Ecol. Indic. 2022, 143, 109342. [Google Scholar] [CrossRef]
  25. Zhang, H.; Li, L.; Zhao, X.; Chen, F.; Wei, J.; Feng, Z.; Hou, T.; Chen, Y.; Yue, W.; Shang, H. Changes in vegetation NDVI and its response to climate change and human activities in the Ferghana Basin from 1982 to 2015. Remote Sens. 2024, 16, 1296. [Google Scholar] [CrossRef]
  26. Guo, J.; Zhai, L.; Sang, H.; Cheng, S.; Li, H. Effects of hydrothermal factors and human activities on the vegetation coverage of the Qinghai-Tibet Plateau. Sci. Rep. 2023, 13, 12488. [Google Scholar] [CrossRef]
  27. Zhang, X.; Zhang, D.; Zhang, W. Impact of human activities on carbon stocks in the Irtysh River Basin. Arid Zone Res. 2023, 40, 1333–1345. [Google Scholar] [CrossRef]
  28. Wang, D.; Zhang, S.; Wang, G.; Gu, J.; Wang, H.; Chen, X. Ecohydrological Variation and Multi-Objective Ecological Water Demand of the Irtysh River Basin. Water 2022, 14, 2876. [Google Scholar] [CrossRef]
  29. Deng, M.; Huang, Q.; Zhang, Y.; Zhang, L. Study on ecological scheduling of multi-scale coupling of reservoir group. J. Hydraul. Eng. 2017, 48, 1387–1398. [Google Scholar] [CrossRef]
  30. Huang, W.; Duan, W.; Nover, D.; Sahu, N.; Chen, Y. An integrated assessment of surface water dynamics in the Irtysh River Basin during 1990–2019 and exploratory factor analyses. J. Hydrol. 2021, 593, 125905. [Google Scholar] [CrossRef]
  31. Ivan, R.; Linus, Z.; Daulet, A.; Gulira, M.; Kamshat, T. A state-of-the-art and future perspectives of transboundary rivers in the cold climate—A systematic review of Irtysh River. J. Hydrol. Reg. Stud. 2022, 42, 101173. [Google Scholar] [CrossRef]
  32. Ren, H.; Zhao, Y.; Xiao, W.; Li, J.; Yang, X. Influence of management on vegetation restoration in coal waste dump after reclamation in semi-arid mining areas: Examining ShengLi coalfield in Inner Mongolia, China. Environ. Sci. Pollut. Res. 2021, 28, 68460–68474. [Google Scholar] [CrossRef]
  33. Wang, L.; Jiao, W.; MacBean, N.; Rulli, M.C.; Manzoni, S.; Vico, G.; D’Odorico, P. Dryland productivity under a changing climate. Nat. Clim. Change 2022, 12, 981–994. [Google Scholar] [CrossRef]
  34. Chen, F.; Chen, Y.; Bakhtiyorov, Z.; Zhang, H.; Man, W.; Chen, F. Central Asian river streamflows have not continued to increase during the recent warming hiatus. Atmos. Res. 2020, 246, 105124. [Google Scholar] [CrossRef]
  35. Zhao, K.; Zhao, H.; Raga, G.B.; Yoshida, R.; Wang, W.; Klotzbach, P.J. Changes in extended boreal summer tropical cyclogenesis associated with large-scale flow patterns over the western North Pacific in response to the global warming hiatus. Clim. Dyn. 2021, 56, 515–535. [Google Scholar] [CrossRef]
  36. Kong, L.; Ma, L.; Li, Y.; Abuduwaili, J.; Zhang, J. Assessing the intensity of the water cycle utilizing a Bayesian estimator algorithm and wavelet coherence analysis in the Issyk-Kul Basin of Central Asia. J. Hydrol. Reg. Stud. 2024, 52, 101680. [Google Scholar] [CrossRef]
  37. Medhaug, I.; Tolpe, M.B.S.; Fischer, E.M.; Knutti, R. Reconciling controversies about the ‘global warming hiatus’. Nature 2017, 545, 41–47. [Google Scholar] [CrossRef]
  38. Sun, H.; Bai, Y.; Yang, Y.; Lu, M.; Yan, D.; Tuo, Y.; Zhang, W. The altered drivers of evapotranspiration trends around the recent warming hiatus in China. Int. J. Climatol. 2022, 42, 8405–8422. [Google Scholar] [CrossRef]
  39. Lei, Y.; Long, A.; Deng, M.; Li, X.; Zhang, Y. Analyses of the Climate Change and Its lmpact on Water Resourcesin the Middle Reaches of Irtysh River during 1926–2009. J. Glaciol. Geocryol. 2012, 34, 912–919. [Google Scholar] [CrossRef]
  40. Huang, F.; Xia, Z.; Li, F.; Guo, L.; Yang, F. Hydrological Changes of the Irtysh River and the Possible Causes. Water Resour. Manag. 2012, 26, 3195–3208. [Google Scholar] [CrossRef]
  41. Qian, K.; Ma, X.; Wang, Y.; Yuan, X.; Yan, W.; Liu, Y.; Yang, X.; Li, J. Effects of Vegetation Change on Soil Erosion by Water in Major Basins, Central Asia. Remote Sens. 2022, 14, 5507. [Google Scholar] [CrossRef]
  42. Venkatesh, K.; John, R.; Chen, J.; Jarchow, M.; Amirkhiz, R.G.; Giannico, V.; Saraf, S.; Jain, K.; Kussainova, M.; Yuan, J. Untangling the impacts of socioeconomic and climatic changes on vegetation greenness and productivity in Kazakhstan. Environ. Res. Lett. 2022, 17, 095007. [Google Scholar] [CrossRef]
  43. Gusarov, A.V.; Golosov, V.N.; Sharifullin, A.G. Contribution of climate and land cover changes to reduction in soil erosion rates within small cultivated catchments in the eastern part of the Russian Plain during the last 60 years. Environ. Res. 2018, 167, 21–33. [Google Scholar] [CrossRef]
  44. Ren, Z.; Tian, Z.; Wei, H.; Liu, Y.; Yu, Y. Spatiotemporal evolution and driving mechanisms of vegetation in the Yellow River Basin, China during 2000–2020. Ecol. Indic. 2022, 138, 108832. [Google Scholar] [CrossRef]
  45. NASA LP DAAC. MOD13A2 v006: MODIS/Terra Vegetation Indices 16-Day L3 Global 1 km SIN Grid. 2024. Available online: https://lpdaac.usgs.gov/products/mod13a2v006/ (accessed on 1 March 2022).
  46. Fick, S.E.; Hijmans, R.J. WorldClim 2: New 1-km spatial resolution climate surfaces for global land areas. Int. J. Climatol. 2017, 37, 4302–4315. [Google Scholar] [CrossRef]
  47. University of East Anglia Climatic Research Unit; Harris, I.; Osborn, T.J.; Jones, P.; Lister, D. Version 4 of the CRU TS monthly high-resolution gridded multivariate climate dataset. Sci. Data 2020, 7, 109. [Google Scholar] [CrossRef]
  48. Food and Agriculture Organization (FAO). Soil Maps and Databases. 2024. Available online: https://www.fao.org/soils-portal/soil-survey/soil-maps-and-databases/ (accessed on 1 March 2022).
  49. Amatulli, G.; Domisch, S.; Tuanmu, M.-N.; Parmentier, B.; Ranipeta, A.; Malczyk, J.; Jetz, W. A suite of global, cross-scale topographic variables for environmental and biodiversity modeling. Sci. Data 2018, 5, 180040. [Google Scholar] [CrossRef]
  50. NASA LP DAAC. MCD12Q1 v006: MODIS/Terra+Aqua Land Cover Type Yearly L3 Global 500 m SIN Grid. 2024. Available online: https://lpdaac.usgs.gov/products/mcd12q1v006/ (accessed on 1 March 2022).
  51. Peng, S.; Ding, Y.; Liu, W.; Zhi, L.I. 1 km monthly temperature and precipitation dataset for China from 1901 to 2017. Earth Syst. Sci. Data 2019, 11, 1931–1946. [Google Scholar] [CrossRef]
  52. Zhao, K.; Wulder, M.A.; Hu, T.; Bright, R.; Wu, Q.; Qin, H.; Li, Y.; Toman, E.; Mallick, B.; Zhang, X. Detecting change-point, trend, and seasonality in satellite time series data to track abrupt changes and nonlinear dynamics: A Bayesian ensemble algorithm. Remote Sens. Environ. 2019, 232, 111181. [Google Scholar] [CrossRef]
  53. Liu, Y.; Li, Z.; Chen, Y.; Li, Y.; Li, H.; Xia, Q.; Kayumba, P.M. Evaluation of consistency among three NDVI products applied to High Mountain Asia in 2000–2015. Remote Sens. Environ. 2022, 269, 112821. [Google Scholar] [CrossRef]
  54. Xu, M. Spatial Heterogeneity of Vegetation Response to Mining Activities in Resource Regions of Northwestern China. Remote Sens. 2020, 12, 3247. [Google Scholar] [CrossRef]
  55. Guo, Y.; Zhang, X.; Wang, Q.; Chen, H.; Du, X.; Ma, Y. Temporal changes in vegetation around a shale gas development area in a subtropical karst region in southwestern China. Sci. Total Environ. 2020, 701, 134769. [Google Scholar] [CrossRef] [PubMed]
  56. He, Q.; Yan, M.; Zheng, L.; Wang, B. Spatial stratified heterogeneity and driving mechanism of urban development level in China under different urban growth patterns with optimal parameter-based geographic detector model mining. Comput. Environ. Urban Syst. 2023, 105, 102023. [Google Scholar] [CrossRef]
  57. Yuan, J.; Xu, Y.; Xiang, J.; Wu, L.; Wang, D. Spatiotemporal variation of vegetation coverage and its associated influence factor analysis in the Yangtze River Delta, eastern China. Environ. Sci. Pollut. Res. Int. 2019, 26, 32866–32879. [Google Scholar] [CrossRef]
  58. He, L.; Guo, J.; Jiang, Q.; Zhang, Z.; Yu, S. How did the Chinese Loess Plateau turn green from 2001 to 2020? An explanation using satellite data. CATENA 2022, 214, 106246. [Google Scholar] [CrossRef]
  59. Xu, Y.; Dai, Q.-Y.; Lu, Y.-G.; Zhao, C.; Huang, W.-T.; Xu, M.; Feng, Y.-X. Identification of ecologically sensitive zones affected by climate change and anthropogenic activities in Southwest China through a NDVI-based spatial-temporal model. Ecol. Indic. 2024, 158, 111482. [Google Scholar] [CrossRef]
  60. He, C.; Tian, J.; Gao, B.; Zhao, Y. Differentiating climate- and human-induced drivers of grassland degradation in the Liao River Basin, China. Environ. Monit. Assess. 2014, 187, 4199. [Google Scholar] [CrossRef]
  61. Tong, X.; Wang, K.; Yue, Y.; Brandt, M.; Liu, B.; Zhang, C.; Liao, C.; Fensholt, R. Quantifying the effectiveness of ecological restoration projects on long-term vegetation dynamics in the karst regions of Southwest China. Int. J. Appl. Earth Obs. Geoinf. 2017, 54, 105–113. [Google Scholar] [CrossRef]
  62. Jiang, Y.; Guo, J.; Peng, Q.; Guan, Y.; Zhang, Y.; Zhang, R. The effects of climate factors and human activities on net primary productivity in Xinjiang. Int. J. Biometeorol. 2020, 64, 765–777. [Google Scholar] [CrossRef]
  63. Yu, S.; Du, W.; Zhang, X.; Hong, Y.; Liu, Y.; Hong, M.; Chen, S. Spatiotemporal Changes in NDVI and Its Driving Factors in the Kherlen River Basin. Chin. Geogr. Sci. 2023, 33, 377–392. [Google Scholar] [CrossRef]
  64. Yan, Y.; Cheng, J.; Li, Y.; Fan, J.; Wu, H. Characteristics of NDVI Changes in the Altay Region from 1981 to 2018 and Their Relationship to Climatic Factors. Land 2023, 12, 564. [Google Scholar] [CrossRef]
  65. Gao, C.; Ren, X.; Fan, L.; He, H.; Zhang, L.; Zhang, X.; Li, Y.; Zeng, N.; Chen, X. Assessing the vegetation dynamics and its influencing factors in Central Asia from 2001 to 2020. Remote Sens. 2023, 15, 4670. [Google Scholar] [CrossRef]
  66. Yankovich, E.P.; Yankovich, K.S.; Baranovskiy, N.V. Dynamics of Forest Vegetation in an Urban Agglomeration Based on Landsat Remote Sensing Data for the Period 1990–2022: A Case Study. Remote Sens. 2023, 15, 1935. [Google Scholar] [CrossRef]
  67. Nemani, R.R.; Keeling, C.D.; Hashimoto, H.; Jolly, W.M.; Piper, S.C.; Tucker, C.J.; Myneni, R.B.; Running, S.W. Climate-Driven Increases in Global Terrestrial Net Primary Production from 1982 to 1999. Science 2003, 300, 1560–1563. [Google Scholar] [CrossRef]
  68. Zhao, W.; Yu, X.; Xu, C.; Li, S.; Wu, G.; Yuan, W. Dynamic traceability effects of soil moisture on the precipitation–vegetation association in drylands. J. Hydrol. 2022, 615, 128645. [Google Scholar] [CrossRef]
  69. Kuzyakov, Y.; Horwath, W.R.; Dorodnikov, M.; Blagodatskaya, E. Review and synthesis of the effects of elevated atmospheric CO2 on soil processes: No changes in pools, but increased fluxes and accelerated cycles. Soil Biol. Biochem. 2019, 128, 66–78. [Google Scholar] [CrossRef]
  70. Chen, T.; Tang, G.; Yuan, Y.; Guo, H.; Xu, Z.; Jiang, G.; Chen, X. Unraveling the relative impacts of climate change and human activities on grassland productivity in Central Asia over last three decades. Sci. Total Environ. 2020, 743, 140649. [Google Scholar] [CrossRef]
  71. Chen, Y.; Zhang, Y.; Zhang, H.; Wang, J. Extreme temperatures affect NDVI in Karst ecological fragile area. Theor. Appl. Climatol. 2024, 155, 2017–2029. [Google Scholar] [CrossRef]
  72. Zhang, Y.; Piao, S.; Sun, Y.; Rogers, B.M.; Li, X.; Lian, X.; Liu, Z.; Chen, A.; Peñuelas, J. Future reversal of warming-enhanced vegetation productivity in the Northern Hemisphere. Nat. Clim. Change 2022, 12, 581–586. [Google Scholar] [CrossRef]
  73. Chen, Q.; Niu, B.; Hu, Y.; Luo, T.; Zhang, G. Warming and increased precipitation indirectly affect the composition and turnover of labile-fraction soil organic matter by directly affecting vegetation and microorganisms. Sci. Total Environ. 2020, 714, 136787. [Google Scholar] [CrossRef]
  74. Gao, S.; Dong, G.; Jiang, X.; Nie, T.; Yin, H.; Guo, X. Quantification of natural and anthropogenic driving forces of vegetation changes in the Three-River Headwater Region during 1982–2015 based on geographical detector model. Remote Sens. 2021, 13, 4175. [Google Scholar] [CrossRef]
  75. Jiang, L.; Bao, A.; Guo, H.; Ndayisaba, F. Vegetation dynamics and responses to climate change and human activities in Central Asia. Sci. Total Environ. 2017, 599, 967–980. [Google Scholar] [CrossRef] [PubMed]
  76. Banerjee, A.; Kang, S.; Meadows, M.E.; Xia, Z.; Sengupta, D.; Kumar, V. Quantifying climate variability and regional anthropogenic influence on vegetation dynamics in northwest India. Environ. Res. 2023, 234, 116541. [Google Scholar] [CrossRef]
  77. Ostad-Ali-Askari, K.; Kharazi, H.G.; Shayannejad, M.; Zareian, M.J. Effect of Climate Change on Precipitation Patterns in an Arid Region Using GCM Models: Case Study of Isfahan-Borkhar Plain. Nat. Hazards Rev. 2021, 21, 04020006. [Google Scholar] [CrossRef]
  78. Wei, H.; Zhao, X.; Liang, S.; Zhou, T.; Wu, D.; Tang, B. Effects of Warming Hiatuses on Vegetation Growth in the Northern Hemisphere. Remote Sens. 2018, 10, 683. [Google Scholar] [CrossRef]
  79. Hossain, M.L.; Li, J. NDVI-based vegetation dynamics and its resistance and resilience to different intensities of climatic events. Glob. Ecol. Conserv. 2021, 30, e01768. [Google Scholar] [CrossRef]
  80. Pande, C.B.; Moharir, K.N.; Varade, A.M.; Abdo, H.G.; Mulla, S.; Yaseen, Z.M. Intertwined impacts of urbanization and land cover change on urban climate and agriculture in Aurangabad city (MS), India using google earth engine platform. J. Clean. Prod. 2023, 422, 138541. [Google Scholar] [CrossRef]
  81. Cai, X.; Li, Z.; Liang, Y. Tempo-spatial changes of ecological vulnerability in the arid area based on ordered weighted average model. Ecol. Indic. 2021, 133, 108398. [Google Scholar] [CrossRef]
  82. Bugubaeva, A.; Chashkov, V.; Mamikhin, S.; Kuprijanov, A.; Kuanyshbaev, S.; Nugmanov, A.; Bulaev, A.; Shcheglov, A.; Manakhov, D.; Zharlygasov, Z. Assessment of the state of vegetation cover of recultivated dumps of uranium deposits in Northern Kazakhstan. Braz. J. Biol. 2023, 83, e279616. [Google Scholar] [CrossRef]
  83. Simanchuk, Y.; Sultangazina, G. Natural vegetation communities on the iron ore dumpsites in Northern Kazakhstan. Biodiversitas J. Biol. Divers. 2023, 24, 3414–3423. [Google Scholar] [CrossRef]
  84. Krupa, E.; Romanova, S.; Serikova, A.; Shakhvorostova, L. A Comprehensive Assessment of the Ecological State of the Transboundary Irtysh River (Kazakhstan, Central Asia). Water 2024, 16, 973. [Google Scholar] [CrossRef]
  85. Kolluru, V.; John, R.; Chen, J.; Xiao, J.; Amirkhiz, R.G.; Giannico, V.; Kussainova, M. Optimal ranges of socio-environmental drivers and their impacts on vegetation dynamics in Kazakhstan. Sci. Total Environ. 2022, 847, 157562. [Google Scholar] [CrossRef] [PubMed]
  86. Huang, J.; Li, Y.; Fu, C.; Chen, F.; Fu, Q.; Dai, A.; Shinoda, M.; Ma, Z.; Guo, W.; Li, Z. Dryland climate change: Recent progress and challenges. Rev. Geophys. 2017, 55, 719–778. [Google Scholar] [CrossRef]
  87. Wang, X.; Chen, Y.; Fang, G.; Li, Z.; Liu, Y. The growing water crisis in Central Asia and the driving forces behind it. J. Clean. Prod. 2022, 378, 134574. [Google Scholar] [CrossRef]
  88. Burlibayeva, D.M.; Burlibayev, M.Z.; Opp, C.; Bao, A. Regime dynamics of hydrochemical and toxicological parameters of the Irtysh River in Kazakhstan. J. Arid Land 2016, 8, 521–532. [Google Scholar] [CrossRef]
  89. Aidarkhanova, A.; Larionova, N.; Tashekova, A.; Dyussembayeva, M.; Mamyrbayeva, A.; Timonova, L.; Shakenov, Y.; Mulikova, A.; Aidarkhanov, A. Assessment of the radionuclide and chemical composition of the Irtysh River water at the Republic of Kazakhstan territory. RSC Adv. 2024, 14, 26208–26218. [Google Scholar] [CrossRef]
  90. Dara, A.; Baumann, M.; Kuemmerle, T.; Pflugmacher, D.; Rabe, A.; Griffiths, P.; Hölzel, N.; Kamp, J.; Freitag, M.; Hostert, P. Mapping the timing of cropland abandonment and recultivation in northern Kazakhstan using annual Landsat time series. Remote Sens. Environ. 2018, 213, 49–60. [Google Scholar] [CrossRef]
  91. Ukhurebor, K.E.; Aigbe, U.O.; Onyancha, R.B.; Ndunagu, J.N.; Osibote, O.A.; Emegha, J.O.; Balogun, V.A.; Kusuma, H.S.; Darmokoesoemo, H. An overview of the emergence and challenges of land reclamation: Issues and prospect. Appl. Environ. Soil Sci. 2022, 2022, 5889823. [Google Scholar] [CrossRef]
  92. Li, S.; He, S. The variation of net primary productivity and underlying mechanisms vary under different drought stress in Central Asia from 1990 to 2020. Agric. For. Meteorol. 2022, 314, 108767. [Google Scholar] [CrossRef]
  93. Silvertown, J.; Dodd, M.E.; Gowing, D.J.G.; Mountford, J.O. Hydrologically defined niches reveal a basis for species richness in plant communities. Nature 1999, 400, 61–63. [Google Scholar] [CrossRef]
  94. Li, W.; Samat, A.; Abuduwaili, J.; Wang, W. Spatiotemporal pattern, evolutionary trend, and driving forces analysis of ecological quality in the Irtysh River Basin (2000–2020). Land 2024, 13, 222. [Google Scholar] [CrossRef]
  95. Du, X.; Qin, Y.; Huang, C. Status and Prospect of Ecological Environment in the Belt and Road Initiative Regions. Int. J. Environ. Res. Public Health 2022, 19, 17091. [Google Scholar] [CrossRef] [PubMed]
  96. Liu, X.; Bennett, M.M. The geopolitics of knowledge communities: Situating Chinese and foreign studies of the Green Belt and Road Initiative. Geoforum 2022, 128, 168–180. [Google Scholar] [CrossRef]
  97. Bespalyy, S. Kazakhstan: Assessment of Renewable Energy Support and a Green Economy. J. Environ. Manag. Tour. 2021, 3, 631–641. [Google Scholar] [CrossRef]
  98. Bilgaev, A.; Sadykova, E.; Mikheeva, A.; Bardakhanova, T.; Ayusheeva, S.; Li, F.; Dong, S. Green Economy Development Progress in the Republic of Buryatia (Russia). Int. J. Environ. Res. Public Health 2022, 19, 7928. [Google Scholar] [CrossRef]
  99. Imangali, Z.; Bekturganova, M. Sustainable growth in Kazakhstan: Green economy, decarbonization and energy transition. Technoecon. Int. J. 2024, 3, 14–25. [Google Scholar] [CrossRef]
  100. Abayeva, K.T.; Rakhimzhanova, G.M.; Myrzabayeva, G.; Zhilkibayeva, E.; Beisekeyeva, A. The Relevance of Sustainable Development of Forest Resource Reproduction in Kazakhstan. Evergreen 2024, 11, 46–55. [Google Scholar] [CrossRef]
  101. Zhamiyeva, R.; Sultanbekova, G.; Balgimbekova, G.; Mussin, K.; Abzalbekova, M.; Kozhanov, M. Problems of the effectiveness of the implementation of international agreements in the field of waste management: The study of the experience of Kazakhstan in the context of the applicability of European legal practices. Int. Environ. Agreem. Politics Law Econ. 2022, 22, 177–199. [Google Scholar] [CrossRef]
  102. Koroleva, E.; Dikareva, T. Mapping the Biodiversity of the Arid Regions of Kazakhstan with an Evaluation of the Efficiency of its Territorial Protection. Arid Ecosyst. 2023, 13, 473–481. [Google Scholar] [CrossRef]
  103. Babkina, L.; Skotarenko, O.; Kozin, M. Main implementation criteria of the Ecology National Project in Russian regions. Proc. IOP Conf. Ser. Earth Environ. Sci. 2021, 723, 042060. [Google Scholar] [CrossRef]
  104. Cheng, Y.; Cui, Y.; Lin, T.; Shao, X.-s.; Bai, Z.-l.; Wang, Y.; Qian, X.-l. Ecological protection and restoration performance evaluation of the Mountains-Waters-Forests-Fields-Lakes-Grasslands project in the Irtysh River Basin. J. Nat. Resour. 2024, 39, 2798–2818. [Google Scholar] [CrossRef]
Figure 1. The location of the Irtysh River Basin. (a) Global drought ranking subregions; (b) basin and sub-basin delineations; (c) basin land cover types in 2020.
Remotesensing 17 01135 g001
Figure 2. The technical flowchart of this study.
Remotesensing 17 01135 g002
Figure 3. Mean NDVI changes in the entire IRB and for the four vegetation types during the 2001–2020 period.
Remotesensing 17 01135 g003
Figure 4. NDVI time series mutation detection for 2001–2020. The NDVI exhibited a decreasing trend at a rate of 0.0008/a during 2001–2013 and an increasing trend at a rate of 0.002/a during 2014–2020.
Remotesensing 17 01135 g004
Figure 5. Spatial distribution and variations in the NDVI in the Irtysh River basin during the 2001–2020 period. (a,b) The spatial distribution of the mean NDVI for 2001–2013 and 2014–2020, respectively; (c,d) the trends in the NDVI for 2001–2013 and 2014–2020, respectively.
Remotesensing 17 01135 g005
Figure 6. Statistics of the NDVI changes for the four vegetation types in the IRB (Percentages of SD, ND, NI, and SI for four vegetation types, where SD denotes a significant decrease, ND denotes a non-significant decrease, NI denotes a non-significant increase, and SI denotes a significant increase).
Remotesensing 17 01135 g006
Figure 7. Characteristics of climate change in the IRB region during the 2001–2020 period. (a,b) Average precipitation and temperature distributions, respectively; (c,d) trends of precipitation and temperature, respectively.
Remotesensing 17 01135 g007
Figure 8. Spatial relationships between climate factors and the NDVI in the IRB from 2001 to 2020. (a,b) The spatial distribution of precipitation and temperature partial correlation with NDVI for 2001–2013, respectively; (c,d) The spatial distribution of precipitation and temperature partial correlation with NDVI for 2014–2020, respectively.
Remotesensing 17 01135 g008
Figure 9. Statistical characteristics of the relationships between the NDVI and climate factors for four vegetation types in the Irtysh River Basin. (a,b) The proportion of partial correlations between precipitation and temperature with NDVI of different vegetation types for 2001–2013; (c,d) The proportion of partial correlations between precipitation and temperature with NDVI of different vegetation types for 2014–2020 (percentages of SNC, INC, IPC, and SPC for the four vegetation types, where SNC denotes a significant negative correlation, INC denotes a non-significant negative correlation, IPC denotes a non-significant positive correlation, and SPC denotes a significant positive correlation).
Remotesensing 17 01135 g009
Figure 10. Spatial distributions of the driving factors of NDVI changes in the IRB during the 2001–2020 period.
Remotesensing 17 01135 g010
Figure 11. Relative contribution of climate change to NDVI changes in the IRB. (a,b) Relative contributions from areas with improved vegetation; (c,d) relative contributions from areas with degraded vegetation.
Remotesensing 17 01135 g011
Figure 12. The relative impacts of other drivers on the NDVI changes in the IRB. (a,b) relative impacts in areas with improved vegetation; (c,d) relative impacts in areas with degraded vegetation.
Remotesensing 17 01135 g012
Figure 13. Land cover characteristics in the IRB in 2001, 2013, and 2020.
Remotesensing 17 01135 g013
Figure 14. Sankey diagram of land-use type shifts in the IRB, 2001–2020 (percentages indicate the value of the total area of the basin occupied by each land-use type).
Remotesensing 17 01135 g014
Table 1. Original dataset resources for this study.
FactorsPeriodDatasetResolutionResources
NDVI2001–2020MODIS/MOD13A21 kmNASA LP DAAC (USGS) [45]
Precipitation (Pre)2001–2020CRU TS4.06~55 km CRU, University of East Anglia (UEA) [46]
1970–2000Worldclim v2.11 kmWorldClim Project, University of California, Berkeley [46]
Temperature (Tmp)2001–2020CRU TS4.06~55 kmCRU, University of East Anglia (UEA) [47]
1970–2000Worldclim v2.11 kmWorldClim Project, University of California, Berkeley [46]
Sand-Harmonized World Soil Database1 kmFAO Soils Portal, Food and Agriculture Organization [48]
Silt-1 km
Clay-1 km
Elevation (Elev)-EarthEnv Project Global Topography1 kmEarthEnv Topography, Yale University and Collaborators [49]
Slope-1 km
Land cover type2001–2020MODIS/MCD12Q10.5 kmNASA LP DAAC (USGS) [50]
Table 2. The methods for calculating the relative contribution of climate change (CC) and other drivers (OD) to NDVI change.
ScenarioSlope (NDVIobs) aSlope (NDVICC) bSlope (NDVIOD) cDriving ForcesRelative Contribution
CC%OD%
1>0>0>0CC and OD S l o p e ( N D V I C C ) S l o p e ( N D V I o b s ) S l o p e ( N D V I O D ) S l o p e ( N D V I o b s )
2>0>0<0CC1000
3>0<0>0OD0100
4<0<0<0CC and OD S l o p e ( N D V I C C ) S l o p e ( N D V I o b s ) S l o p e ( N D V I O D ) S l o p e ( N D V I o b s )
5<0<0>0CC1000
6<0>0<0OD0100
Note: a, b and c refer to the trend rate of the observed NDVI value (NDVIobs), trend rate of the predicted NDVI value based on regression analysis (NDVICC), and trend rate of the residual value (NDVIOD), respectively. b denotes the trend of NDVI change under the influence of climate change, and c denotes the trend of NDVI change under the influence of other drivers.
Table 3. Results of driver detectors for 2001, 2013, and 2020.
Factor200120132020Trend
q ValueRankq ValueRankq ValueRank
Pre0.67210.47920.6091Remotesensing 17 01135 i001
Tmp0.58120.54810.4082Remotesensing 17 01135 i002
Elev0.32030.26340.2864Remotesensing 17 01135 i003
Slope0.04870.05070.0307Remotesensing 17 01135 i004
Sand0.14560.10760.1556Remotesensing 17 01135 i005
Silt0.24950.23450.2505Remotesensing 17 01135 i006
Clay0.28440.29030.3633Remotesensing 17 01135 i007
Disclaimer/Publisher’s Note: The statements, opinions and data contained in all publications are solely those of the individual author(s) and contributor(s) and not of MDPI and/or the editor(s). MDPI and/or the editor(s) disclaim responsibility for any injury to people or property resulting from any ideas, methods, instructions or products referred to in the content.

