Article

Performance Evaluation of IMERG and GSMaP Hourly Precipitation Products for Landfalling Typhoon Rainfall in China


1
Key Laboratory of Meteorological Disaster, Ministry of Education (KLME), School of Atmospheric Science, Nanjing University of Information Science & Technology, Nanjing 210044, China
2
Zhejiang Meteorological Observatory, Hangzhou 310051, China
3
Zhejiang Institute of Meteorological Sciences, Hangzhou 310051, China
4
Zhejiang Meteorological Data Center, Hangzhou 310051, China
*
Author to whom correspondence should be addressed.
Remote Sens. 2026, 18(16), 2735; https://doi.org/10.3390/rs18162735
Submission received: 6 July 2026 / Revised: 7 August 2026 / Accepted: 11 August 2026 / Published: 14 August 2026
(This article belongs to the Special Issue Advances in Multi-Source Remote Sensing Data Fusion and Analysis)

Highlights

What are the main findings?
  • Both GPM_IMERG and GSMaP_Gauge systematically underestimate typhoon rainfall, with GSMaP_Gauge showing more severe negative bias that nonlinearly intensifies as rainfall increases; extreme precipitation detection is particularly poor, with over 60% of extreme events missed across all distance ranges.
  • Error distributions exhibit significant spatiotemporal non-stationarity characterized by distance-dependent attenuation within 100 km of typhoon centers, seasonal variations (higher correlation yet larger RMSE in June and September versus lower correlation but smaller errors in August), and a “three-peak–two-valley” diurnal pattern in the inner-core region.
What are the implications of the main findings?
  • The poor performance of both products in capturing extreme typhoon precipitation limits their direct applicability for hydrometeorological modeling, disaster investigation, and climate research, necessitating the urgent development of dynamic bias correction frameworks prior to use.
  • A three-dimensional error modeling approach stratified by distance from typhoon center, season, and diurnal phase is recommended to improve satellite-based typhoon rainfall estimation and enhance the reliability of quantitative precipitation products in data assimilation and hydrological modeling.

Abstract

This study systematically evaluates the performance of GPM_IMERG and GSMaP_Gauge hourly precipitation products in typhoon rainfall over Mainland China. Using hourly gauge observations from the China Meteorological Administration (CMA)’s national basic meteorological stations as reference, 32 landfalling typhoons during 2021–2025 are analyzed. A multi-layered evaluation framework is established based on 50 km annular stratification from 0 to 500 km relative to typhoon centers, multiple statistical metrics, and dual thresholds for light rain and extreme precipitation. Results indicate systematic underestimation of typhoon rainfall by both products, with GSMaP_Gauge exhibiting more severe negative bias that intensifies nonlinearly with increasing rainfall intensity. Spatially, widespread overestimation occurs in North China, while underestimation dominates elsewhere, with large negative biases concentrated in high-observation regions. Monthly variations show predominantly negative deviations across most months, with GSMaP_Gauge demonstrating persistent negative anomalies except for sporadic positive outliers. Regarding precipitation detection capability, both products perform adequately for light rain, but their capability to capture extreme precipitation remains rather limited, as evidenced by sharply declining Critical Success Index (CSI) across all distance ranges and omission of over 60% extreme precipitation events. GPM_IMERG shows only sporadic high CSI values in the inner-core region during June and October. Error distributions exhibit significant spatiotemporal non-stationarity: errors attenuate markedly within 0–100 km of typhoon centers; seasonally, June and September show higher correlation coefficients but larger RMSE, whereas August presents lower correlation yet smaller errors; diurnally, the 0–50 km zone displays a “three-peak–two-valley” pattern with error maxima in the afternoon, early morning, and evening. In conclusion, both products estimate light typhoon precipitation with reasonable accuracy but still have considerable room for improvement in estimating heavy and extreme rainfall. Dynamic error models based on three-dimensional stratification of distance–season–diurnal phase, coupled with bias correction, are imperative before their application to hydrometeorological modeling, disaster investigation, and climate research.

1. Introduction

Typhoons represent one of the most destructive weather systems in the Northwest Pacific region, with associated heavy rainfall frequently triggering severe secondary disasters, such as flooding, landslides, and urban waterlogging, thereby posing significant threats to human life, property safety, and regional socioeconomic development [1,2]. Statistics indicate that during 2001–2020, typhoon precipitation affected an average of 2.1 million hectares of crops and 32.2 million people annually, with average daily economic losses reaching 62.9 billion RMB [3]; moreover, mountain torrents and geological disasters induced by extreme typhoon rainfall constitute one of the primary causes of casualties [4,5]. Situated along the western coast of the Northwest Pacific, China is among the countries most frequently affected by typhoons globally [6], with approximately five typhoons making landfall per year on average. Typhoon precipitation contributes 20–40% of the annual precipitation in coastal regions of South and East China, and this proportion can exceed 50% during active typhoon years [7,8]. Therefore, accurate satellite-based typhoon precipitation products serve as the sole or primary data source for hydrometeorological assessment, disaster investigation, and climate research in remote, sparsely populated areas where rain gauge networks are insufficient to support reliable observations. Under the background of global climate change, the potential intensification of typhoon intensity and precipitation efficiency [9], coupled with accelerated coastal urbanization in China, has led to a marked increase in disaster risk from typhoon rainfall [10]. Consequently, rigorous validation of satellite precipitation products for typhoon is of growing scientific significance and practical necessity, directly supporting the improvement of hydrometeorological systems and the reduction of socioeconomic losses in typhoon-prone regions.
However, the obtainment of typhoon precipitation faces numerous unique challenges. First, typhoon impact periods are often accompanied by severe conditions, such as violent winds, heavy rainfall, communication disruptions, and power failures, resulting in significantly degraded real-time transmission capabilities and station integrity of ground-based meteorological observation networks, with prominent observational gaps [11]. Second, the spatial distribution of ground rain gauges is highly uneven; particularly in island, coastal mountainous, and remote areas within the core impact zone of typhoons, stations are sparse and spatially unrepresentative, making it difficult to capture the fine-scale spatial structure of precipitation [12,13]. Third, although weather radars offer relatively high spatiotemporal resolution, their detection range is constrained by terrain blockage and beam propagation distance, creating detection blind zones in inland areas far from the coast after typhoon landfall; moreover, signal attenuation in heavy precipitation regions and ground clutter issues also limit the accuracy of radar-based quantitative precipitation estimation [14,15]. These limitations of conventional observation systems underscore the urgent need for satellite-based precipitation as a complementary and independent data source, particularly for applications in data-scarce regions and over the open ocean, where ground-based infrastructure is unavailable. Advances in satellite remote-sensing technology have provided novel pathways to address these gaps, offering global coverage, high spatiotemporal resolution, and independence from terrain and oceanic constraints, rendering satellite precipitation products particularly suitable for the marine typhoon phase and hydrometeorological applications [16,17].
Compared with radar and ground-based observations, satellite precipitation products possess unique advantages, including global coverage, high spatiotemporal resolution, and independence from terrain and oceanic constraints, rendering them particularly suitable for the marine typhoon phase and data-scarce regions [18,19,20]. Since the Tropical Rainfall Measuring Mission (TRMM) era, satellite precipitation retrieval technology has undergone substantial development from single-sensor to multi-source fusion approaches, and from empirical algorithms to physical models [21,22]. The launch of the Global Precipitation Measurement (GPM) satellite in 2014 marked a new stage in global precipitation observation; its core payload, the Dual-Frequency Precipitation Radar (DPR, Ku/Ka-band), achieved, for the first time, the direct detection of three-dimensional precipitation structures, providing unprecedented “ground truth” constraints for passive microwave retrievals [23,24]. Concurrently, the Global Satellite Mapping of Precipitation (GSMaP) series developed by the Japan Aerospace Exploration Agency (JAXA) employs advanced microwave radiative transfer models and precipitation retrieval algorithms, improving the detection capability of light precipitation through optimized relationships between cloud liquid water path and precipitation intensity, and has demonstrated favorable precipitation capture performance in regions such as the Asian monsoon zone [25]. Both IMERG and GSMaP precipitation products have been extensively applied in hydrometeorological modeling, agricultural drought monitoring, extreme weather event analysis, and climate change research, serving as important data sources for the Global Precipitation Climatology Project (GPCP) and global water cycle observation [26,27,28]. Despite their widespread use, systematic validation of these two products, specifically for typhoon precipitation over the Chinese mainland, remains insufficient, particularly regarding their discrimination capability across different rainfall intensities and their performance relative to typhoon center distance and lifecycle stages. This study therefore selects the gauge-corrected IMERG_V07_Final product (GPM_IMERG) and the GSMaP_Gauge product based on the V8 algorithm to conduct a comprehensive accuracy assessment, aiming to provide scientific guidance for their application to hydrometeorological modeling, disaster investigation, and climate research in China.
Although the accuracy of satellite precipitation products has been extensively validated in general precipitation scenarios, typhoon precipitation—as a distinct type of intense rainfall—poses more stringent challenges for satellite retrieval due to its unique microphysical characteristics and spatial structures. Existing studies have demonstrated that satellite precipitation products generally exhibit lower estimation accuracy for tropical cyclone rainfall compared with ordinary convective precipitation, accompanied by significant systematic underestimation and regional disparities [29,30,31,32,33]. Prat and Nelson [29] evaluated TRMM’s capability in capturing global tropical cyclone precipitation and found that underestimation of eyewall-region heavy rainfall could exceed 50%. This systematic underestimation persists in subsequent IMERG products; for instance, Gao et al. [30] based on an assessment of Typhoon Cempaka, indicated that IMERG tends to underestimate hourly rainfall intensities exceeding 2 mm, with significant positive–negative bias cancellation effects. Nguyen et al. [31] through analysis of Super Typhoon Yagi, further confirmed that IMERG’s detection rate for extreme precipitation was merely 8%, with intensity biases reaching −72% to −100%, identifying temporal lag as the primary limiting factor. Xiao et al. [32] found that IMERG_ER adequately captured the magnitude and variation trends of extreme precipitation peaks and troughs for Typhoons Hato, Pakhar, and Mawar in 2017, albeit with temporal and intensity deviations. Chen et al. [33], through refined assessment of IMERG_FR’s estimation capability for different precipitation magnitudes of Typhoon Nida, discovered that IMERG_FR overestimated light-rain-grade precipitation while underestimating the probability of light rain-event occurrence.
However, the aforementioned studies are predominantly based on daily-scale or event-scale analyses, lacking fine-grained examination of multi-dimensional characteristics such as hourly precipitation structures, distance-stratified layers from typhoon centers, seasonal variations, and diurnal cycles. Although Chen et al. [34] conducted quantitative and categorical statistical assessments across 11 fixed regions of China (Northeast, North China, Northwest, Huanghuai, etc.) to compare the error characteristics of IMERG and GSMaP across different regions, months, and time periods, a systematic evaluation for landfalling typhoons over Mainland China—a specific scenario of critical significance—is notably absent. Landfalling typhoons, due to terrain friction, altered moisture supply, and interactions with westerly systems, exhibit fundamentally distinct precipitation structures, impact ranges, and disaster-causing characteristics compared with maritime typhoons, posing unique challenges to satellite-retrieval algorithms. Therefore, building upon Chen et al. [34], this study employs hourly precipitation observations from China national meteorological stations during 2021–2025 to systematically evaluate the applicability of two satellite products for landfalling typhoon precipitation over Mainland China from multiple dimensions, including distance stratification, seasonal variation, diurnal cycles, and extreme precipitation detection.
The rest of this paper is organized as follows. Section 2 describes the study area; data sources, including CMA ground observations, GPM_IMERG, and GSMaP_Gauge products; and the statistical and categorical evaluation methodologies employed in this study. Section 3 presents the overall performance of GPM_IMERG and GSMaP_Gauge in estimating typhoon precipitation. Section 4 discusses the key findings, implications for hydrometeorological applications, and limitations of this study, followed by the conclusions in Section 5.

2. Materials and Methods

2.1. Satellite Precipitation Products

The IMERG and GSMaP hourly precipitation products employed in this study are the gauge-corrected IMERG_V07_Final product GPM_IMERG and the GSMaP product GSMaP_Gauge based on the V8 algorithm, respectively; relevant product information is summarized in Table 1. Among the various GPM-derived precipitation products, IMERG was selected for this study because it represents the most advanced and widely validated multi-satellite merged precipitation dataset currently available, offering global coverage at high spatial (0.1°) and temporal (0.5 h) resolutions. The IMERG product is a multi-satellite merged precipitation retrieval released by the National Aeronautics and Space Administration (NASA), utilizing the Goddard Profiling Algorithm (GPROF) for microwave precipitation retrieval [35], with microwave and infrared observations merged following the methodology proposed by Joyce et al. [36] and finally bias-calibrated using monthly-scale observational data from the Global Precipitation Climatology Centre (GPCC). The product comprises three series—Early, Late, and Final—with the Final series representing the gauge-corrected product of highest accuracy. Compared to the Early and Late series, which are designed for real-time applications with lower latency but reduced accuracy, the Final series incorporates additional gauge-based calibration and quality control, making it the most suitable choice for research-oriented validation studies that prioritize accuracy over timeliness. In July 2023, the IMERG product was updated to Version 07, incorporating significant improvements in infrared-microwave merging strategies and precipitation phase discrimination [37]. It is accessible via https://disc.gsfc.nasa.gov/ (accessed on 16 June 2026).
The GSMaP product is a high-resolution precipitation product developed by the JAXA, based on the microwave retrieval methodology proposed [38], which merges microwave and infrared observational data through a Kalman filter model and is calibrated using daily precipitation data from the Climate Prediction Center (CPC). The product series includes GSMaP_NOW, GSMaP_NRT, GSMaP_MVK, and GSMaP_Gauge—the latter being further corrected by integrating global rain gauge stations, terrain, and climatic information on the basis of GSMaP_MVK [39], with GSMaP_Gauge possessing the highest accuracy due to its gauge-correction processing. The GSMaP product algorithm was upgraded to Version 8, with further optimization in orographic precipitation simulation and snowfall estimation. This product is accessible via https://sharaku.eorc.jaxa.jp/GSMaP/ (accessed on 16 June 2026).

2.2. Precipitation Observation Data

This study employs hourly rain gauge observations from the China Meteorological Administration (CMA)’s national basic meteorological stations during 2021–2025 as the evaluation reference (OBS). This dataset, provided by the CMA National Meteorological Information Center and subjected to rigorous quality control procedures, including analysis of extremes, contiguous values, and spatial-consistency checks, is accessed through the CMA Big Data Cloud Platform. The dataset incorporates observations from more than 2400 weather stations across Mainland China, with a temporal resolution of 1 h. It should be noted that these weather stations are distributed unevenly over Mainland China, with densely populated stations in Eastern China. Owing to its high quality and comprehensive coverage, the dataset has been widely applied in precipitation evaluation research. Su et al. [40], Zhou et al. [41], and Wang et al. [42] conducted systematic assessments of error characteristics for gauge-corrected satellite precipitation products such as IMERG over Mainland China based on daily data from this dataset, demonstrating the high reliability of employing this dataset for satellite precipitation retrieval evaluation in Mainland China.

2.3. Research Object

This study focuses on typhoons making landfall in China during 2021–2025; detailed information on these landfalling typhoons is provided in Table 2. During this period, the annual numbers of landfalling typhoons were six in 2021, four in 2022, six in 2023, eight in 2024, and ten in 2025, totaling 34 landfalling typhoons. However, as GPM_IMERG data are available only until 1 October 2025, and Typhoons Matmo (2521) and Fung-Wong (2526) made landfall on 5 October and 12 November 2025, respectively (Beijing Time, hereafter the same), these two typhoons are excluded from the study to ensure consistency in the evaluation period. Consequently, a total of 32 landfalling typhoons and their induced precipitation over Mainland China constitute the research subjects of this study.
China, situated in East Asia and spanning approximately 9.6 million km2, features a complex topography that descends from west to east in three distinct steps, encompassing the Qinghai–Tibet Plateau, vast basins and plateaus, and extensive coastal plains. The climate is dominated by the East Asian monsoon system, characterized by marked seasonal variations in precipitation, with the majority of annual rainfall concentrated during the summer months (June–September) [43]. The country possesses a dense river network, including major basins such as the Yangtze River, Yellow River, and Pearl River, which are highly susceptible to flooding induced by extreme precipitation events [44]. Coastal regions of South China (e.g., Guangdong, Fujian, and Hainan) and East China (e.g., Zhejiang, Jiangsu, and Shanghai) are particularly vulnerable to typhoon landfalls due to their extensive coastlines, high population density, and rapid urbanization [45]. These regions exhibit complex land–sea interactions and heterogeneous surface conditions that pose unique challenges for satellite precipitation retrieval and validation [46].
For typhoon precipitation, Dare et al. [47] defined typhoon rainfall as precipitation occurring within a 500 km radius from the typhoon center. The adoption of a 500 km radius is consistent with a substantial body of the literature. Rodgers et al. [48,49] employed a 4° (~444 km) radius in their studies, noting that this distance encompasses the eyewall, as well as the inner and outer rainbands. Meanwhile, Larson et al. [50], Kim et al. [51], and Lee et al. [52] utilized a 5° (~555 km) radius in their investigations. Notably, Larson et al. [50] conducted sensitivity tests with radii ranging from 2.5° to 7.5° and demonstrated that radii exceeding 5° yield relatively minor differences in the recorded typhoon rainfall values. Therefore, in the present study, typhoon precipitation is defined as rainfall within a 500 km radius of the typhoon center.
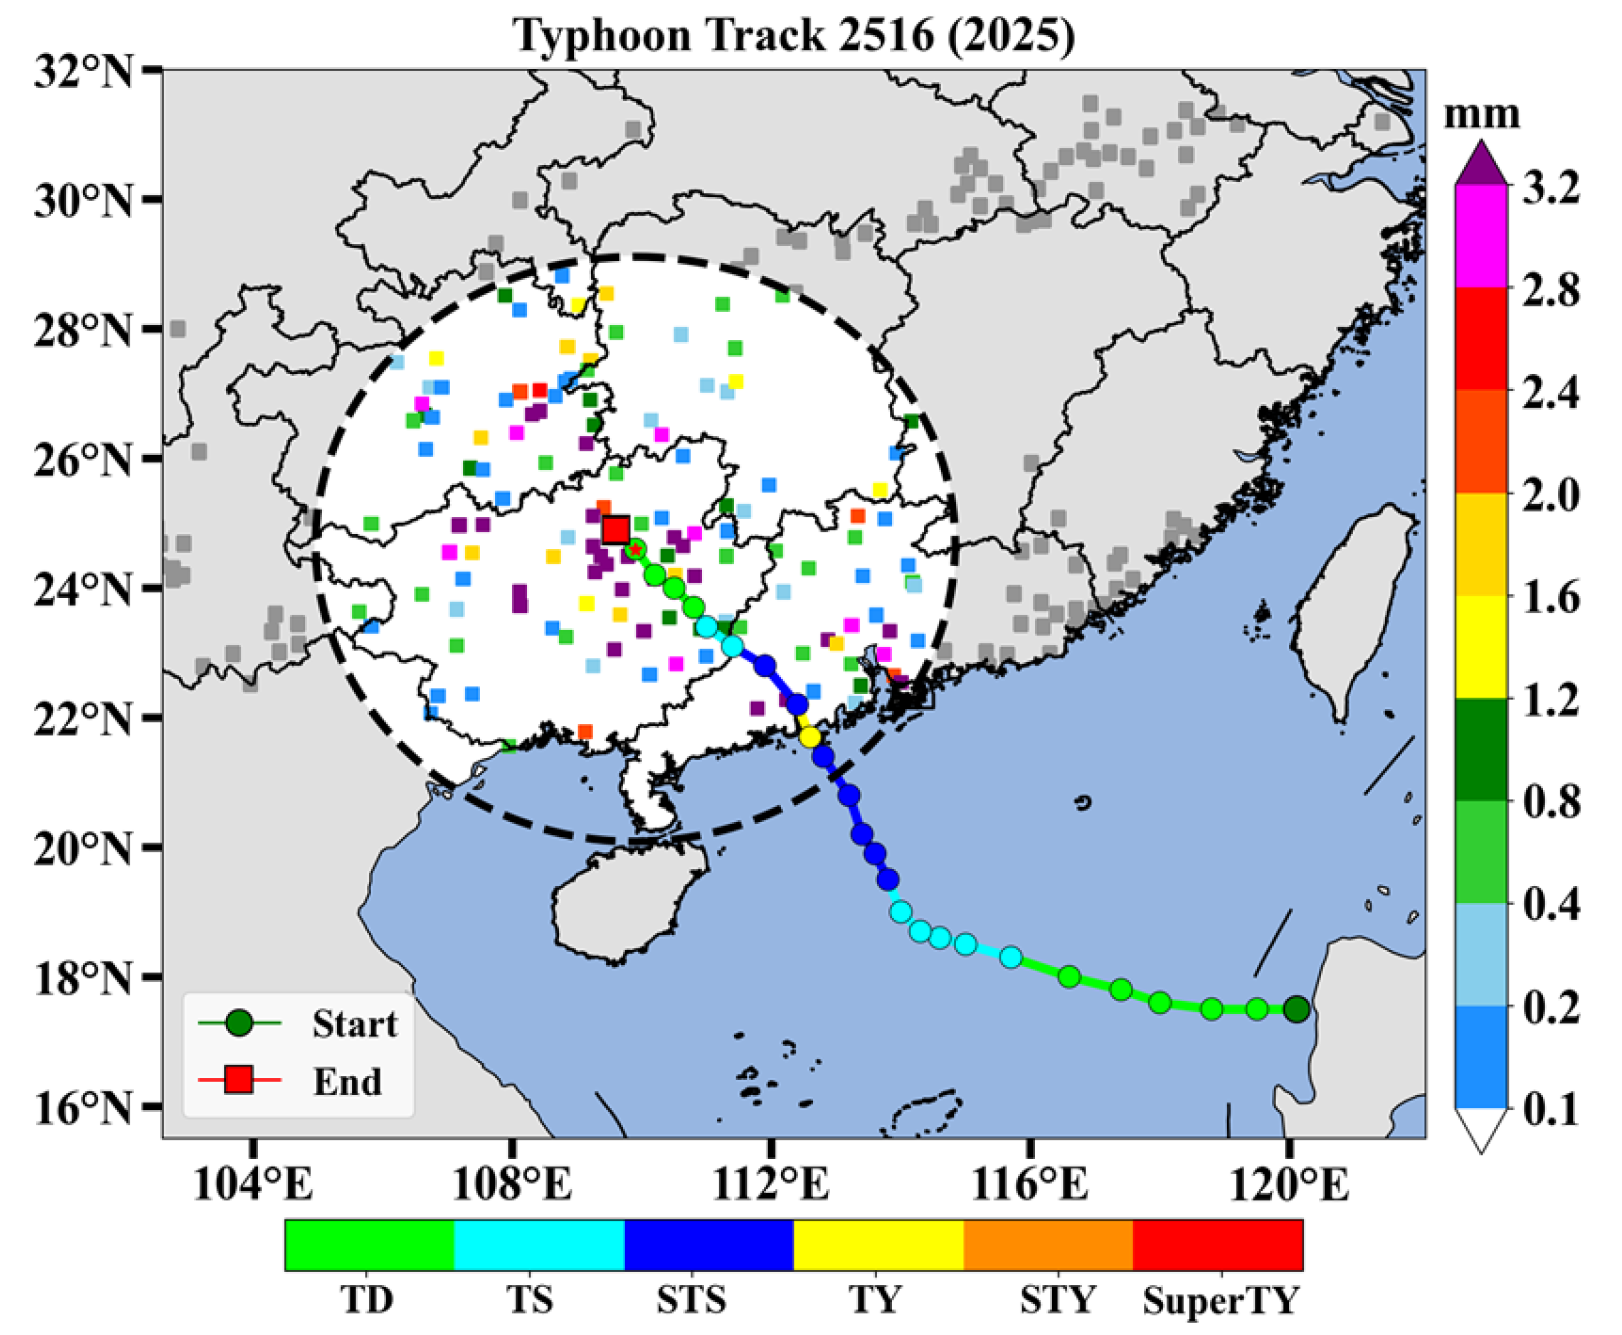
As illustrated in Figure 1, the colored dots represent the intensity and track of Typhoon 2516 (Tapah) from the CMA tropical cyclone best-track dataset. At 08:00 Beijing Time on 9 September 2025, the typhoon center was located at the red star, with the black dashed circle denoting the 500 km radius from the typhoon center. The small squares indicate hourly precipitation stations from the national meteorological network, with colored squares representing defined typhoon precipitation and gray squares representing non-typhoon precipitation; this approach is employed to screen typhoon precipitation for all 32 landfalling typhoons during 2021–2025. However, as the CMA tropical cyclone best-track dataset generally provides typhoon center positions at 3 h or 6 h intervals, whereas national station ground observations and GSMaP_Gauge and GPM_IMERG products are all processed at 1 h intervals, the following interpolation strategy is adopted during typhoon precipitation screening: when the interval between typhoon center positions is 3 h, the preceding and subsequent hourly typhoon centers are both assigned the position of this recorded center; when the interval is 6 h, the three preceding and two subsequent hourly centers are assigned this recorded position. Notably, typhoon center tracks are generally provided at 3 h intervals during imminent landfall or post-landfall phases, and typhoon movement is typically slower near landfall, rendering the interpolation error negligible. Through this procedure, hourly typhoon center positions are obtained, enabling the extraction of relatively complete typhoon precipitation records.

2.4. Statistical Analysis

Given that both OBS and GSMaP_Gauge precipitation possess a temporal resolution of 1 h, whereas GPM_IMERG precipitation has a temporal resolution of 0.5 h, with values expressed in mm/h, a temporal averaging method is applied to process GPM_IMERG precipitation into 1 h intervals by averaging two consecutive 0.5 h values, thereby maintaining consistency in temporal scales across datasets. To achieve spatial matching with ground stations, the nearest-neighbor interpolation method is employed to interpolate the gridded data of satellite precipitation products to individual ground observation station locations for subsequent consistency verification. This approach is selected to preserve the original gauge-corrected retrieval values without artificial smoothing [34,53]. It should be noted that sparse station density or complex terrain may introduce certain uncertainties into the results [54].
As GPM_IMERG and GSMaP_Gauge precipitation employ GPCC monthly-scale and Climate Prediction Center (CPC) daily-scale rain gauge data, respectively, in their correction procedures, partial overlap exists between these data and the ground observations adopted in this study, which may compromise the independence of validation results to a certain extent. In this regard, previous studies have examined the stability of evaluation results based on such data and demonstrated overall high consistency across various climatic regimes [41,55,56]. Given that this study focuses on hourly-scale data with finer temporal resolution than the daily-scale data employed in the aforementioned research, the evaluation results possess enhanced representativeness in both spatial and temporal dimensions. Therefore, the utilization of this dataset for relevant assessment is considered feasible in this study.
The quantitative metrics employed include the correlation coefficient (CC), root mean square error (RMSE), mean error (ME), and standard deviation (SD), which are utilized to measure the accuracy and error characteristics of precipitation estimation. The computational formulas for these metrics are given as follows (Equations (1)–(4)):
C C = i = 1 n ( G i G ¯ ) ( S i S ¯ ) i = 1 n ( G i G ¯ ) 2 · i = 1 n ( S i S ¯ ) 2
R M S E = 1 n i = 1 n ( S i G i ) 2
M E = 1 n i = 1 n ( S i G i )
S D = i = 1 n ( S i S ¯ ) 2 n
Here, S i denotes the satellite precipitation value, G i represents the OBS value, n is the total number of samples, and i denotes each individual sample.
To further investigate their discrimination capability for light rain and extreme precipitation events, four categorical metrics are employed: the Critical Success Index (CSI), Probability of Detection (POD), false-alarm rate (FAR), and bias score (BIAS). These metrics provide a comprehensive and complementary assessment of the performance of both satellite products in identifying light and extreme precipitation events. The definitions of these four scores are given by Equations (5)–(8):
C S I = h i t s h i t s + m i s s e s + f a l s e   a l a r m s
P O D = h i t s h i t s + m i s s e s
F A R = f a l s e   a l a r m s h i t s + f a l s e   a l a r m s
B I A S = h i t s + f a l s e   a l a r m s h i t s + m i s s e s
where hits denotes the number of stations where both satellite and OBS precipitation reach or exceed the threshold; false alarms denotes the number of stations where satellite precipitation meets or exceeds the threshold, but OBS does not; and misses denotes the number of stations where OBS meets or exceeds the threshold, but satellite precipitation does not.
The CSI is a composite score ranging from 0 to 1, with values closer to 1 indicating superior performance; it integrates information on hits, misses, and false alarms into a single metric, making it particularly useful for overall performance ranking. POD measures the hit rate of satellite precipitation at a given threshold, ranging from 0 to 1, with values closer to 1 being preferable; it is essential for assessing the sensitivity of detection, especially for extreme precipitation events where capturing all occurrences is critical for disaster warning. BIAS indicates the relative intensity of satellite precipitation compared with OBS at a given threshold; values greater than 1 denote overestimation relative to OBS, while values less than 1 indicate underestimation, with values closer to 1 representing better consistency with observed intensity. This metric is indispensable for quantifying systematic deviations in precipitation magnitude. The FAR measures the false-alarm rate at a given threshold, ranging from 0 to 1, with values closer to 0 being preferable; it directly reflects the reliability of precipitation occurrence. Together, these four metrics offer a balanced evaluation framework that captures both the accuracy of precipitation occurrence detection and the fidelity of intensity estimation, which is essential for assessing the applicability of satellite products in typhoon monitoring and flood forecasting applications.

3. Results

3.1. Overall Distribution of Typhoon Precipitation

3.1.1. Frequency Distribution of Hourly Rainfall Intensity

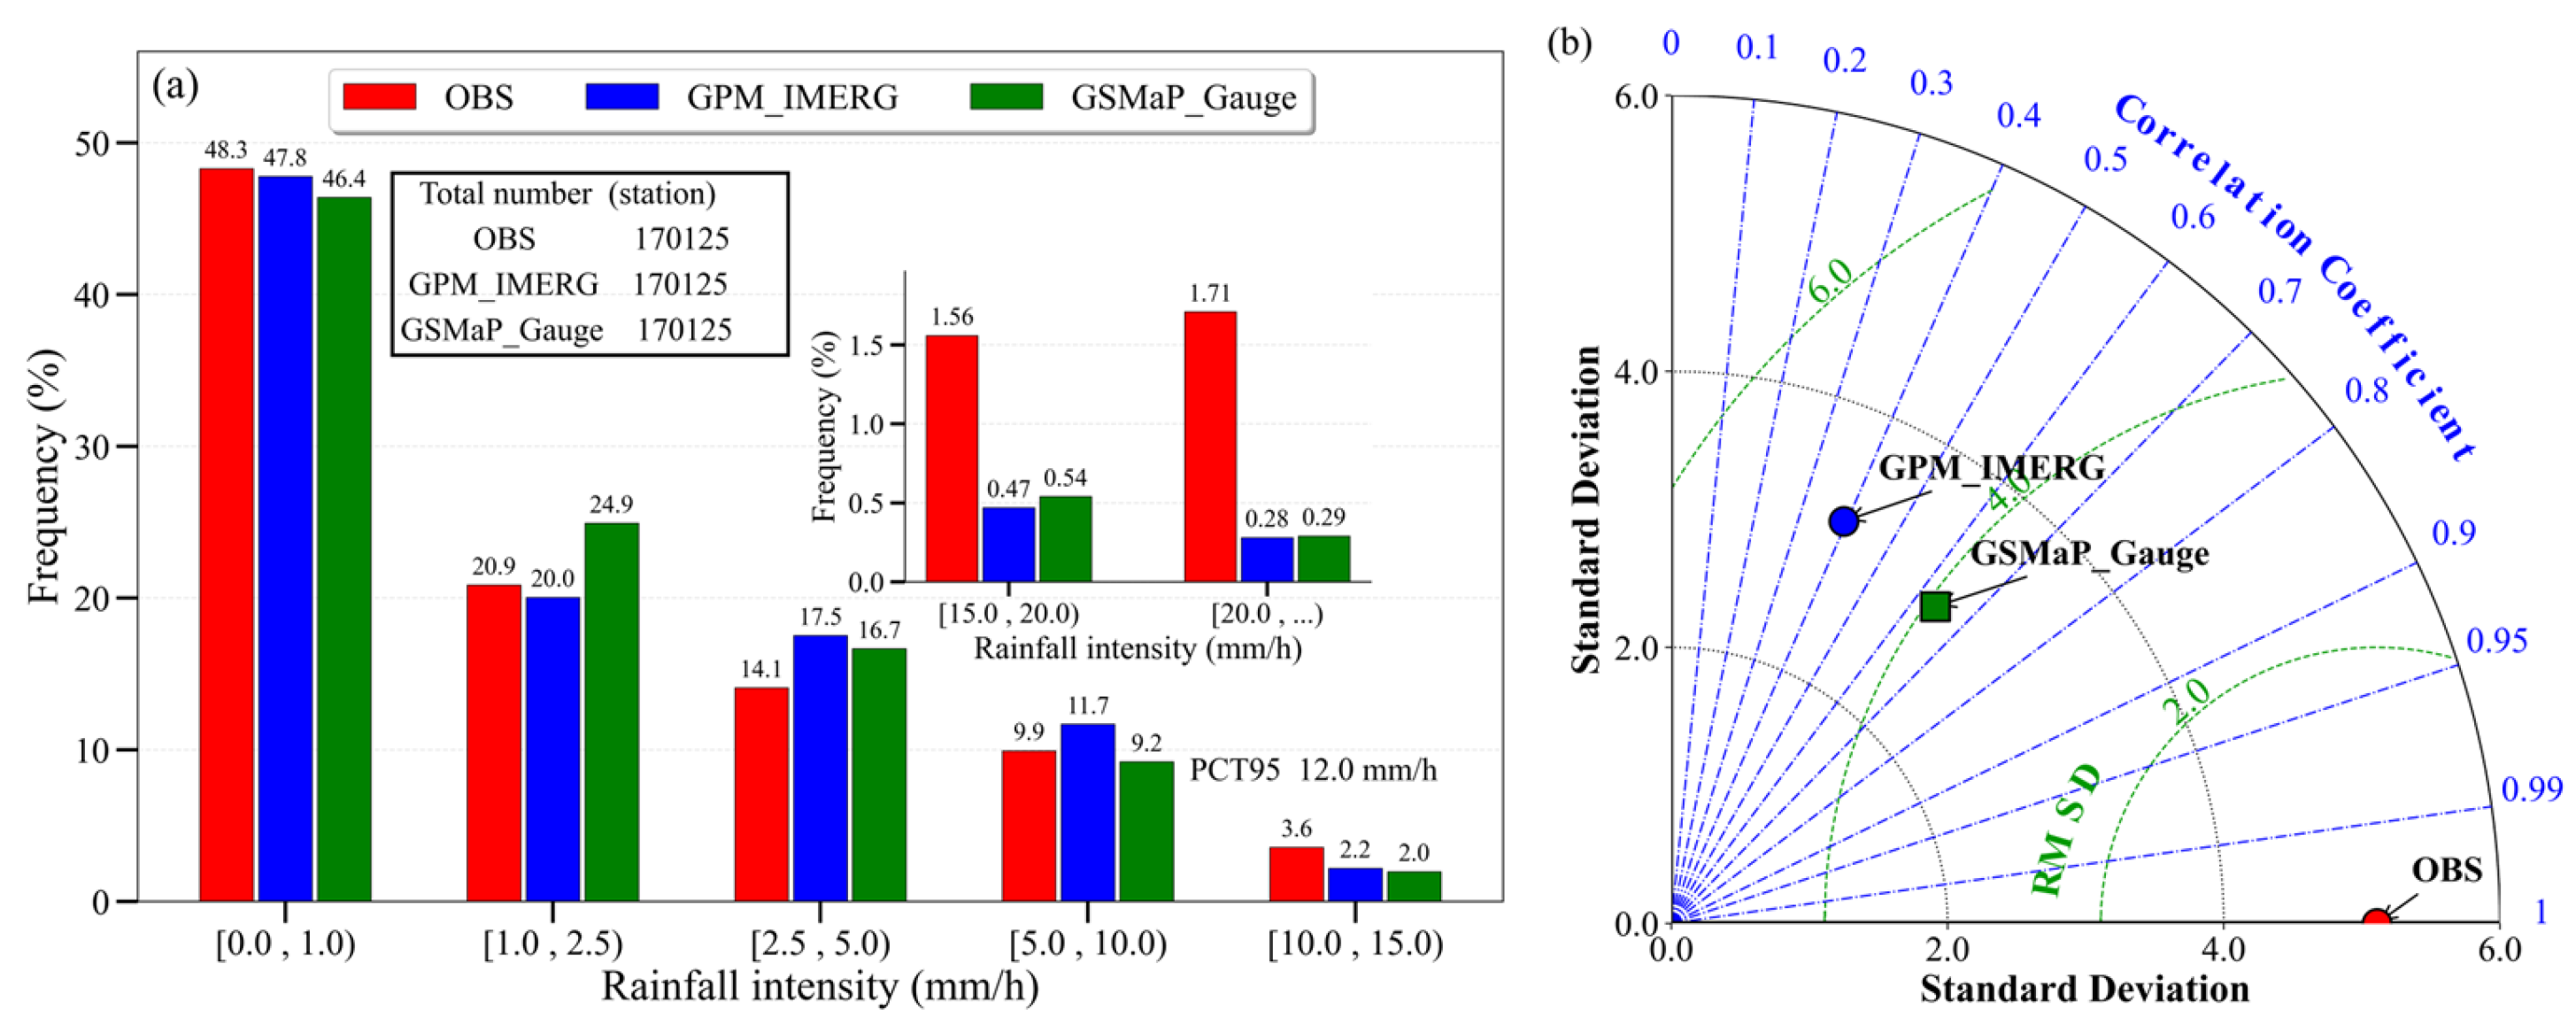
Figure 2a presents the frequency distributions of typhoon precipitation at different hourly rainfall intensities for national station 1 h OBS, GPM_IMERG, and GSMaP_Gauge during 2021–2025. All three datasets comprise an identical sample size of 170,125 station-hours. As illustrated, for weak typhoon precipitation events (<1.0 mm/h), the frequencies are relatively consistent across all three datasets, each approaching 50%, indicating that nearly half of typhoon precipitation consists of weak rainfall. For moderate typhoon precipitation events (1.0–10.0 mm/h), OBS exhibits slightly higher frequencies than GPM_IMERG only in the 1–2.5 mm/h interval, while remaining lower than both GPM_IMERG and GSMaP_Gauge in other intervals, suggesting that moderate precipitation constitutes the dominant component in GPM_IMERG and GSMaP_Gauge typhoon precipitation. For intense typhoon precipitation events (≥10 mm/h), OBS frequencies are markedly higher than those of GPM_IMERG and GSMaP_Gauge; particularly for rainfall intensities exceeding 15 mm/h, the frequency of intense typhoon precipitation in OBS is approximately three times or greater than that in GPM_IMERG and GSMaP_Gauge, demonstrating the limited capability of GPM_IMERG and GSMaP_Gauge in identifying intense typhoon precipitation events.
Figure 2b is a Taylor diagram comparing the GPM_IMERG and GSMaP_Gauge hourly rainfall intensity for typhoon precipitation against OBS. As shown in the figure, GSMaP_Gauge (green square) is positioned overall closer to the OBS (red dot) than GPM_IMERG (blue dot), indicating that GSMaP_Gauge demonstrates superior overall performance across the three dimensions of CC, SD, and RMSE for total typhoon rainfall. The SD (radial distances) of both products are notably smaller than that of OBS, indicating that the variability of both satellite products is lower than that of the observations, and both exhibit systematic compression of typhoon rainfall. This is consistent with Figure 2a, which shows a relative scarcity of precipitation events exceeding 15 mm/h.
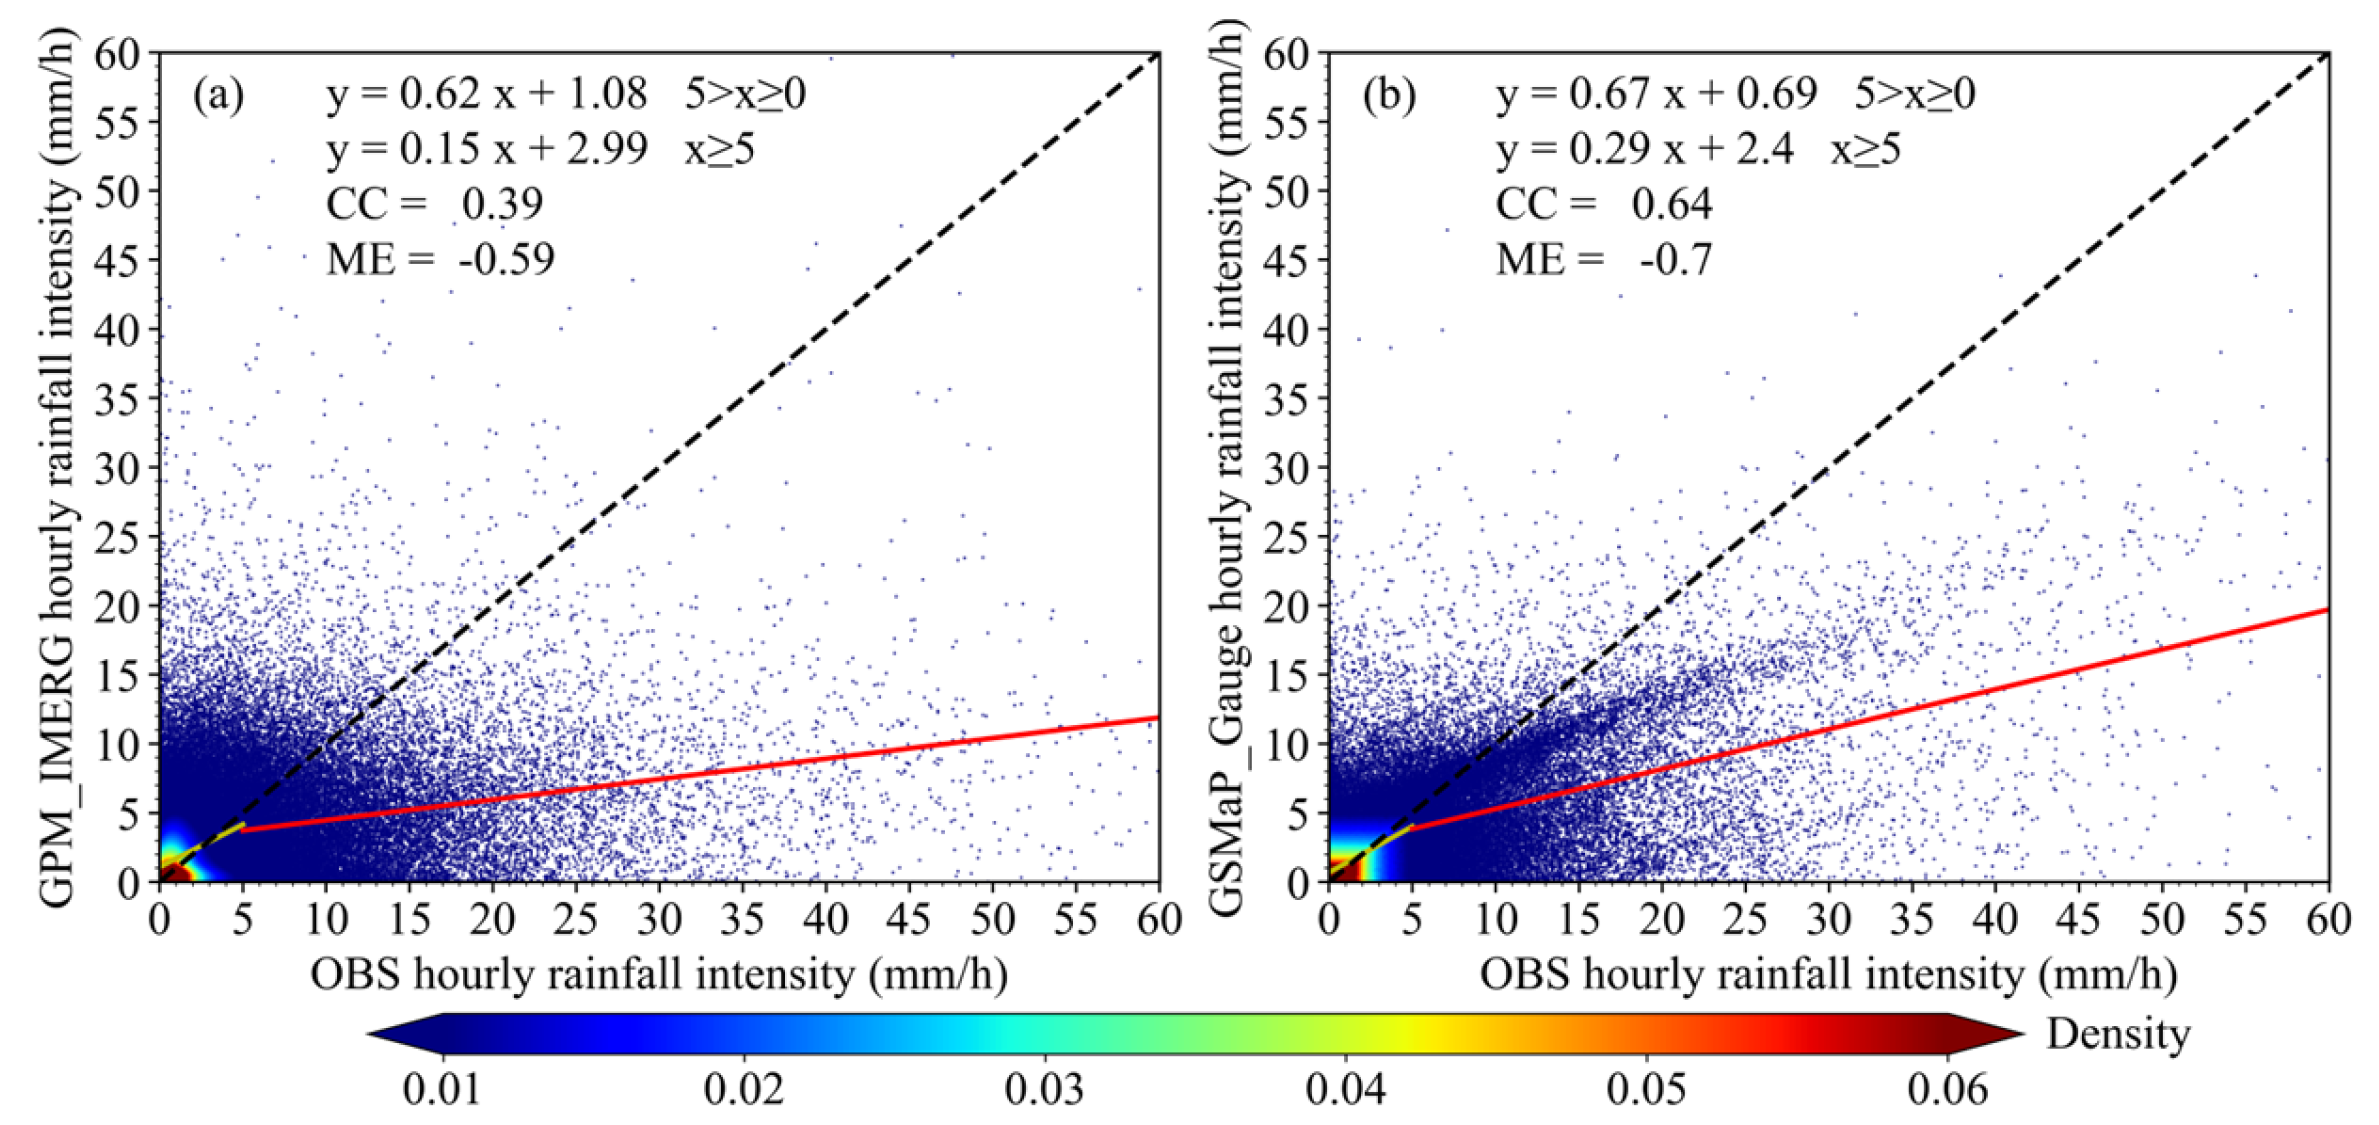
To more intuitively illustrate the typhoon precipitation distribution characteristics of GPM_IMERG and GSMaP_Gauge relative to OBS, Figure 3 presents the scatter density distributions of hourly typhoon precipitation intensity between OBS and GPM_IMERG (Figure 3a) and between OBS and GSMaP_Gauge (Figure 3b) during 2021–2025. As depicted, the scatter density for both GPM_IMERG and GSMaP_Gauge is predominantly concentrated in the low-to-moderate typhoon rainfall intensity region (0–10 mm/h), with the highest density values primarily localized within the 0–2 mm/h range. However, as OBS rainfall intensity increases, the deviation between both satellite products and OBS gradually intensifies, indicating that both satellite products exhibit systematic underestimation of high-intensity precipitation. This reveals a common limitation in the two satellite-retrieval algorithms in capturing extreme typhoon precipitation events.
Concurrently, identical characteristics are evident from the piecewise fitted lines of GPM_IMERG and GSMaP_Gauge against OBS. Both fitted segments exhibit slopes less than unity and intercepts greater than zero, with slopes decreasing and intercepts increasing as OBS rainfall intensifies. This indicates that even for typhoon precipitation below 5 mm/h, both satellite products demonstrate a certain degree of underestimation, and this underestimation bias intensifies nonlinearly with increasing rainfall intensity. Notably, the slope of GSMaP_Gauge for the >5 mm/h segment (0.29) is approximately twice that of GPM_IMERG (0.15), suggesting a relatively weaker attenuation of heavy precipitation by GSMaP_Gauge. Meanwhile, the correlation coefficient of GSMaP_Gauge (0.64) is significantly higher than that of GPM_IMERG (0.39), indicating superior overall consistency between the former and observed values. However, the absolute value of the mean error for GSMaP_Gauge (−0.70 mm/h) is slightly larger than that of GPM_IMERG (−0.59 mm/h), which primarily stems from its more concentrated systematic underestimation in the high-intensity precipitation interval. Although GPM_IMERG exhibits lower overall correlation, its error distribution is relatively more dispersed. In summary, GSMaP_Gauge demonstrates superior overall performance in estimating hourly typhoon precipitation intensity compared with GPM_IMERG, particularly with significant improvement in correlation. Nevertheless, both products exhibit systematic underestimation of precipitation ≥5 mm/h, and this bias amplifies nonlinearly with intensifying rainfall.

3.1.2. Spatial Distribution of Hourly Rainfall Intensity

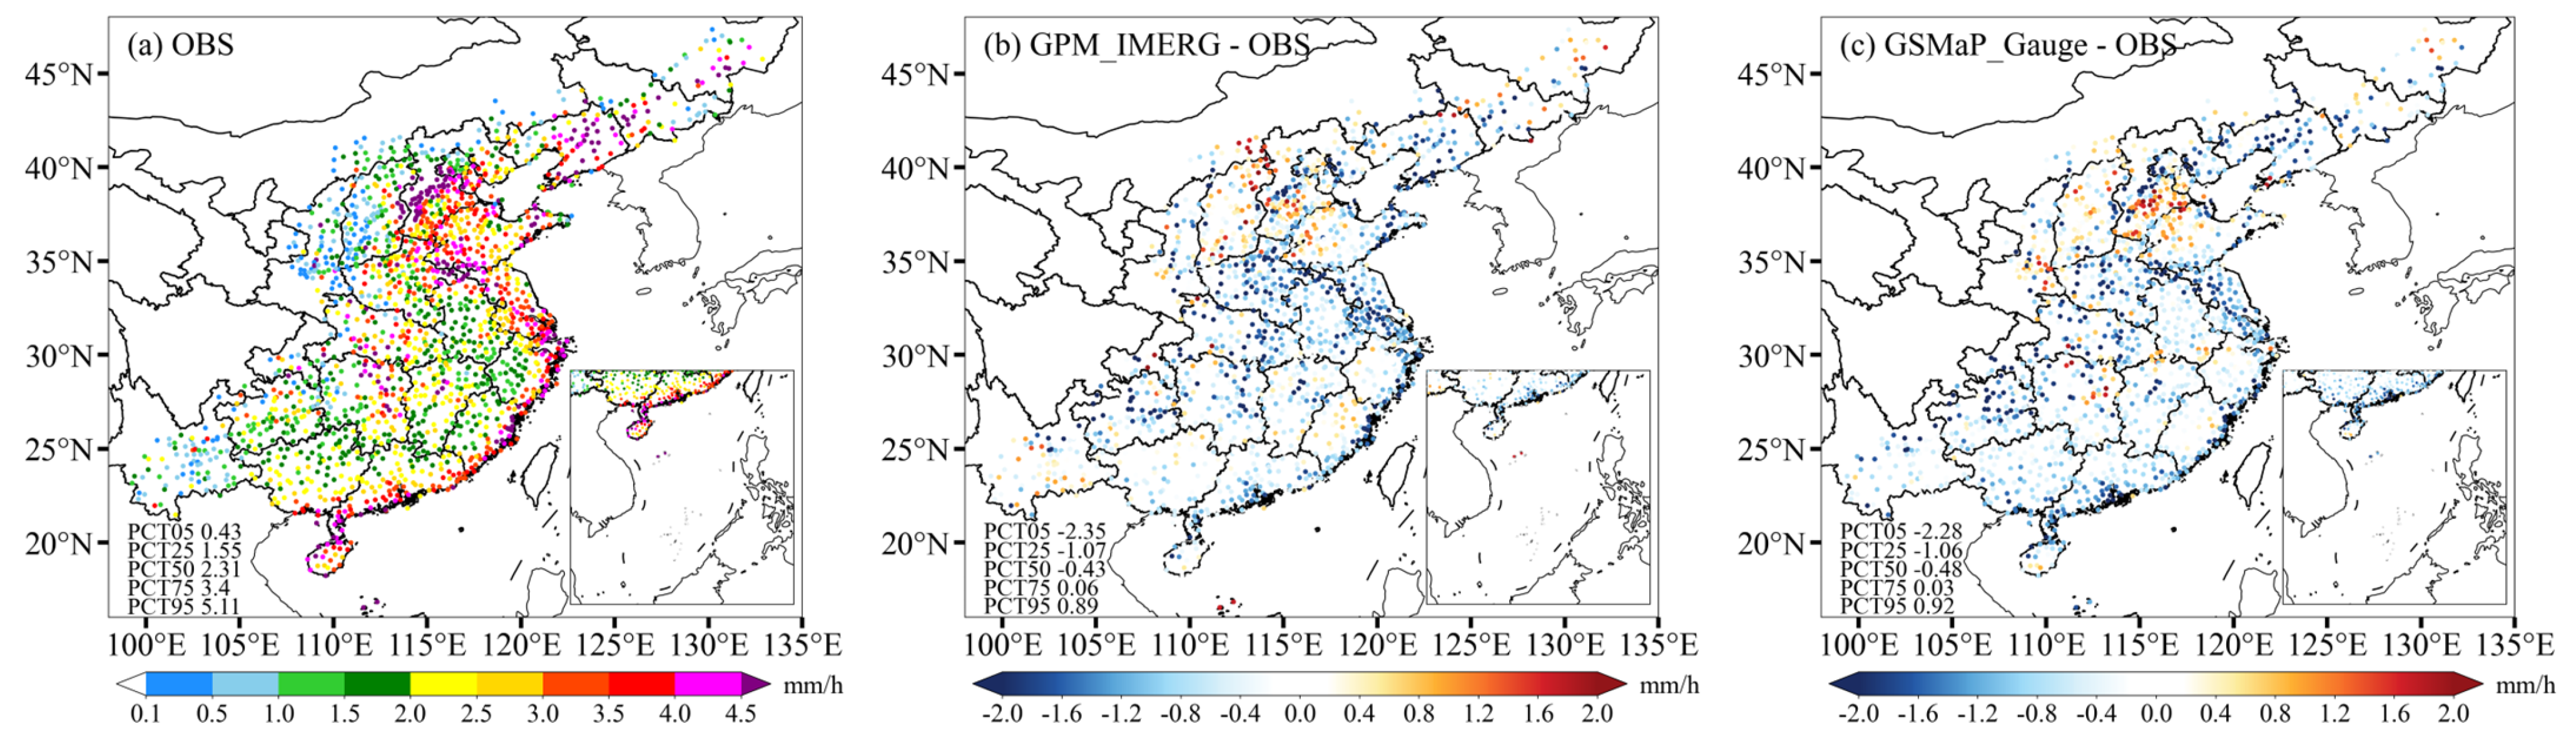
The preceding analysis reveals that both GPM_IMERG and GSMaP_Gauge precipitation products exhibit overall weaker typhoon precipitation compared with OBS, with this discrepancy becoming particularly pronounced at higher magnitudes. To investigate the spatial distribution characteristics of this underestimation, Figure 4 presents the spatial distribution of mean hourly typhoon precipitation intensity from OBS and the station-based differences between OBS and the two satellite precipitation products. From the OBS mean hourly typhoon precipitation intensity, a significant gradient in typhoon precipitation intensity is evident across eastern coastal China, characterized by an overall spatial pattern of “high in the southeast; low in the northwest.” High-value regions (≥3.0 mm/h, orange-red to purple) are predominantly concentrated in South and East China coastal areas, whereas inland regions (Northwest and Southwest China) generally exhibit intensities below 1.5 mm/h (blue-green). This distribution pattern is associated with the gradual dissipation of moisture and energy carried by typhoons as they penetrate further inland after coastal landfall. Concurrently, high-value regions are not only distributed along the coasts of South and East China but also form inland high-value centers in North China; the Huang-Huai region; and the border areas of Shandong, Jiangsu, Henan, and Anhui provinces that are comparable to or even exceed coastal values. This indicates that extratropical transition during northward typhoon movement, orographic convergence, and interactions with westerly systems can trigger extreme precipitation in inland regions.
Figure 4b,c present the spatial distributions of differences in mean hourly typhoon precipitation intensity between GPM_IMERG (GSMaP_Gauge) and OBS. As illustrated, the spatial patterns of these differences are relatively consistent between the two satellite products. Except for North China, negative values dominate across other regions, indicating that systematic underestimation is the primary characteristic of both satellite products’ mean hourly typhoon precipitation intensity. Large negative values are concentrated in the coastal areas of South and East China, as well as the border region of Shandong, Jiangsu, Henan, and Anhui Provinces—these being the high-value regions in OBS—demonstrating that underestimation is more pronounced where OBS exhibits high mean hourly typhoon precipitation intensity. However, in North China, the differences for both GPM_IMERG and GSMaP_Gauge show distinct positive values, indicating overestimation by both satellite products in this region where OBS mean hourly typhoon precipitation intensity is relatively high. Meanwhile, the PCT50 (median) values are −0.43 and −0.48 mm/h, respectively, indicating that satellite estimates at over half of the stations fall below observed values. The PCT75 values are 0.06 and 0.03 mm/h, implying that differences at 75% of stations are at or below zero, further confirming the prevalence of systematic negative bias. Nevertheless, the PCT95 values of 0.89 and 0.92 mm/h indicate that significant positive biases exist at a small number of stations, such as those in North China.

3.1.3. Monthly Distribution of Mean Hourly Rainfall Intensity

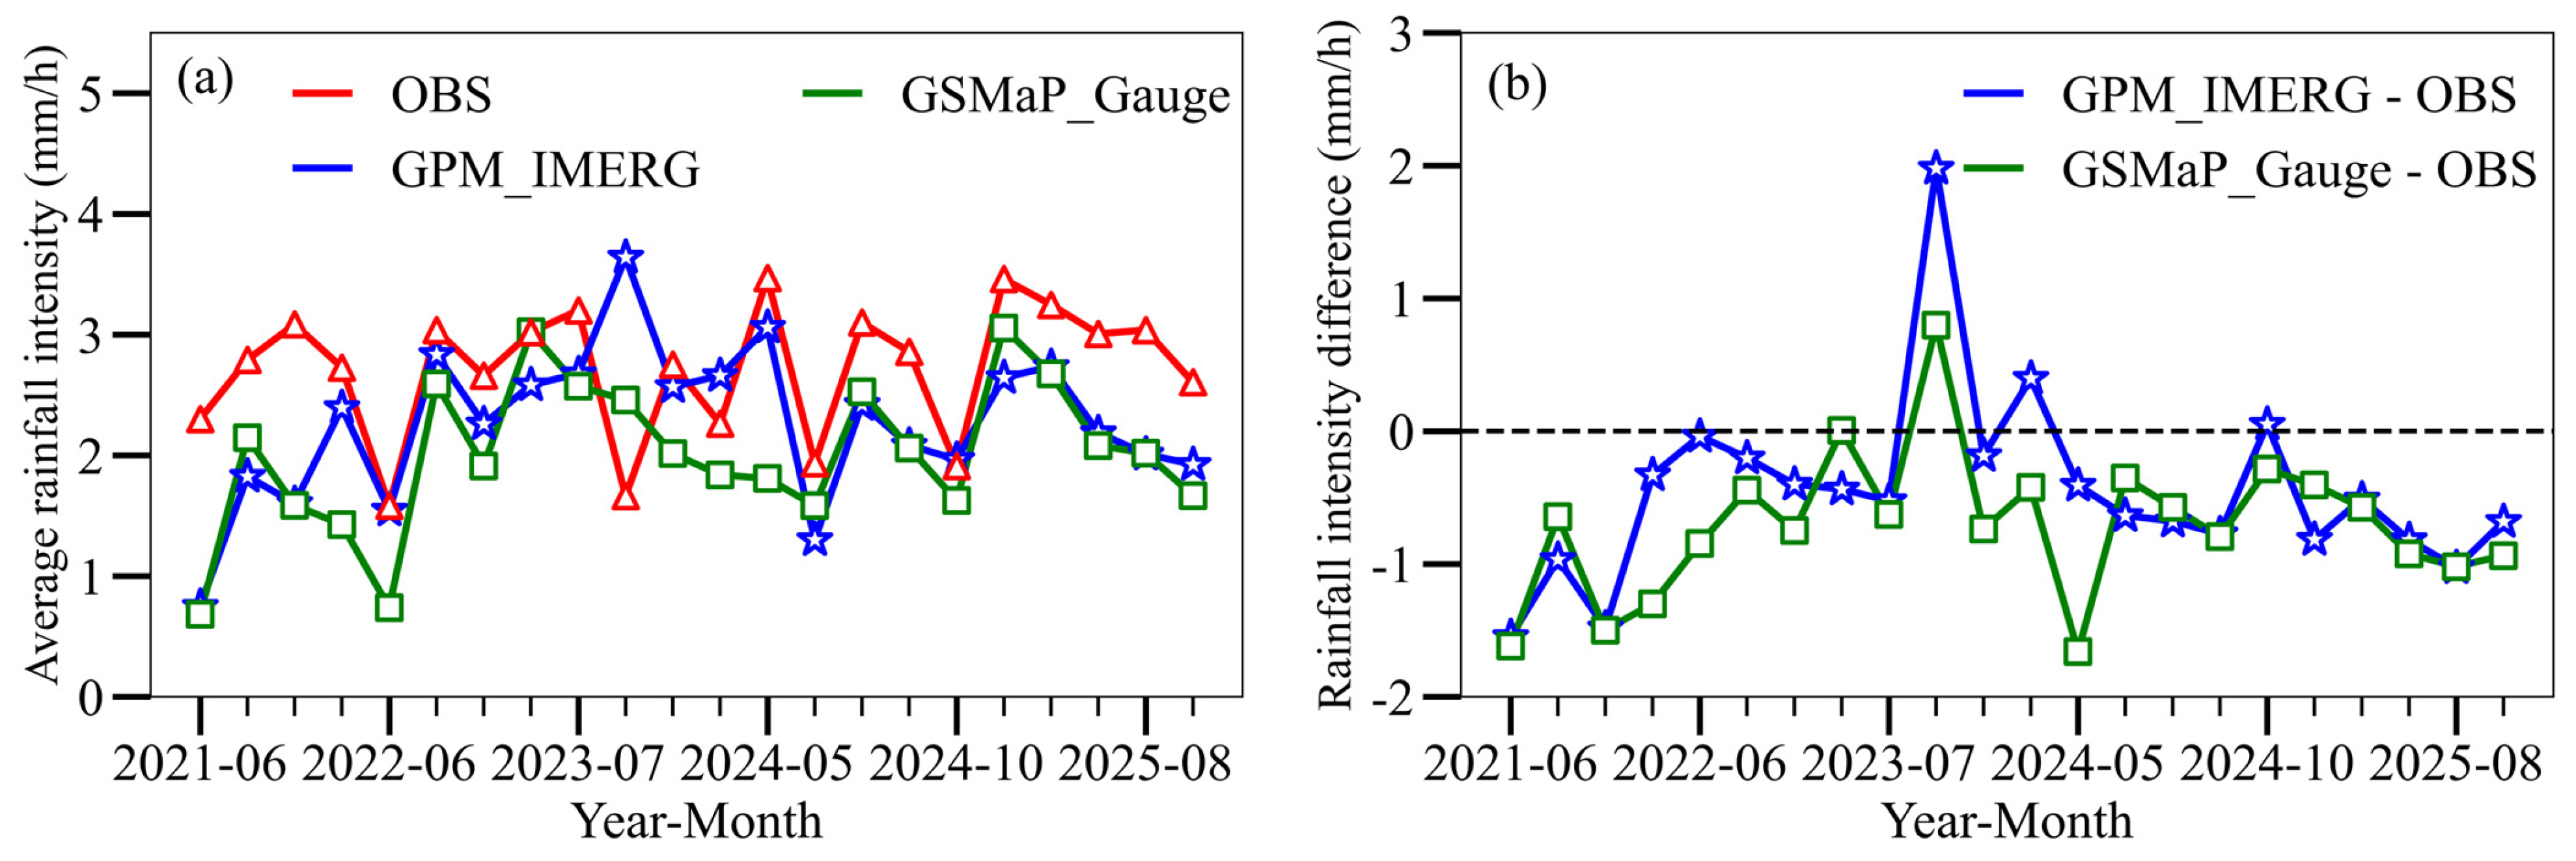
The preceding spatial analysis of mean hourly typhoon precipitation intensity revealed systematic underestimation characteristics in both satellite products. To investigate the temporal evolution features of this underestimation, Figure 5a presents the monthly mean hourly typhoon precipitation intensity time series from all three datasets, while Figure 5b shows the monthly mean biases of the two satellite products relative to OBS. In Figure 5a, OBS (red triangles) exhibits monthly mean typhoon precipitation intensities fluctuating within the range of 1.5–3.5 mm/h, demonstrating pronounced monthly variations. The intensities during July–September are generally higher than those in May–June and October; for instance, the minimum monthly mean hourly intensities in 2021, 2022, and 2024 all occurred in June. Concurrently, the temporal evolution of monthly mean typhoon precipitation intensity from GPM_IMERG (blue stars) and GSMaP_Gauge (green squares) shows relatively consistent trends with OBS, particularly from June 2024 to September 2025. However, monthly mean typhoon precipitation from OBS is generally higher than both GPM_IMERG and GSMaP_Gauge, with GPM_IMERG consistently exceeding GSMaP_Gauge.
Overall, both GPM_IMERG and GSMaP_Gauge precipitation products exhibit pronounced systematic underestimation of typhoon precipitation relative to OBS, with negative mean biases for both products. In terms of the spatial distribution of mean hourly typhoon precipitation intensity, differences relative to OBS are predominantly negative across all regions except North China. The 75th percentile of these differences approaches zero, indicating that 75% of stations exhibit negative bias. This systematic underestimation is particularly evident in heavy precipitation intervals, where the frequencies of GPM_IMERG and GSMaP_Gauge are markedly lower than OBS, and scatter density distributions are concentrated below the diagonal line toward the OBS side. Spatially, large negative biases coincide with high-value regions of OBS mean hourly precipitation intensity. However, the systematic underestimation of GPM_IMERG is somewhat less severe than that of GSMaP_Gauge. Although its overall correlation with OBS is lower than GSMaP_Gauge, its temporal correlation with OBS is superior, particularly in capturing the phasing of monthly mean hourly intensity peaks and troughs in OBS.

3.2. Detection Performance for Light Typhoon Precipitation

3.2.1. Spatial Distribution of Light Rain Event-Detection Performance

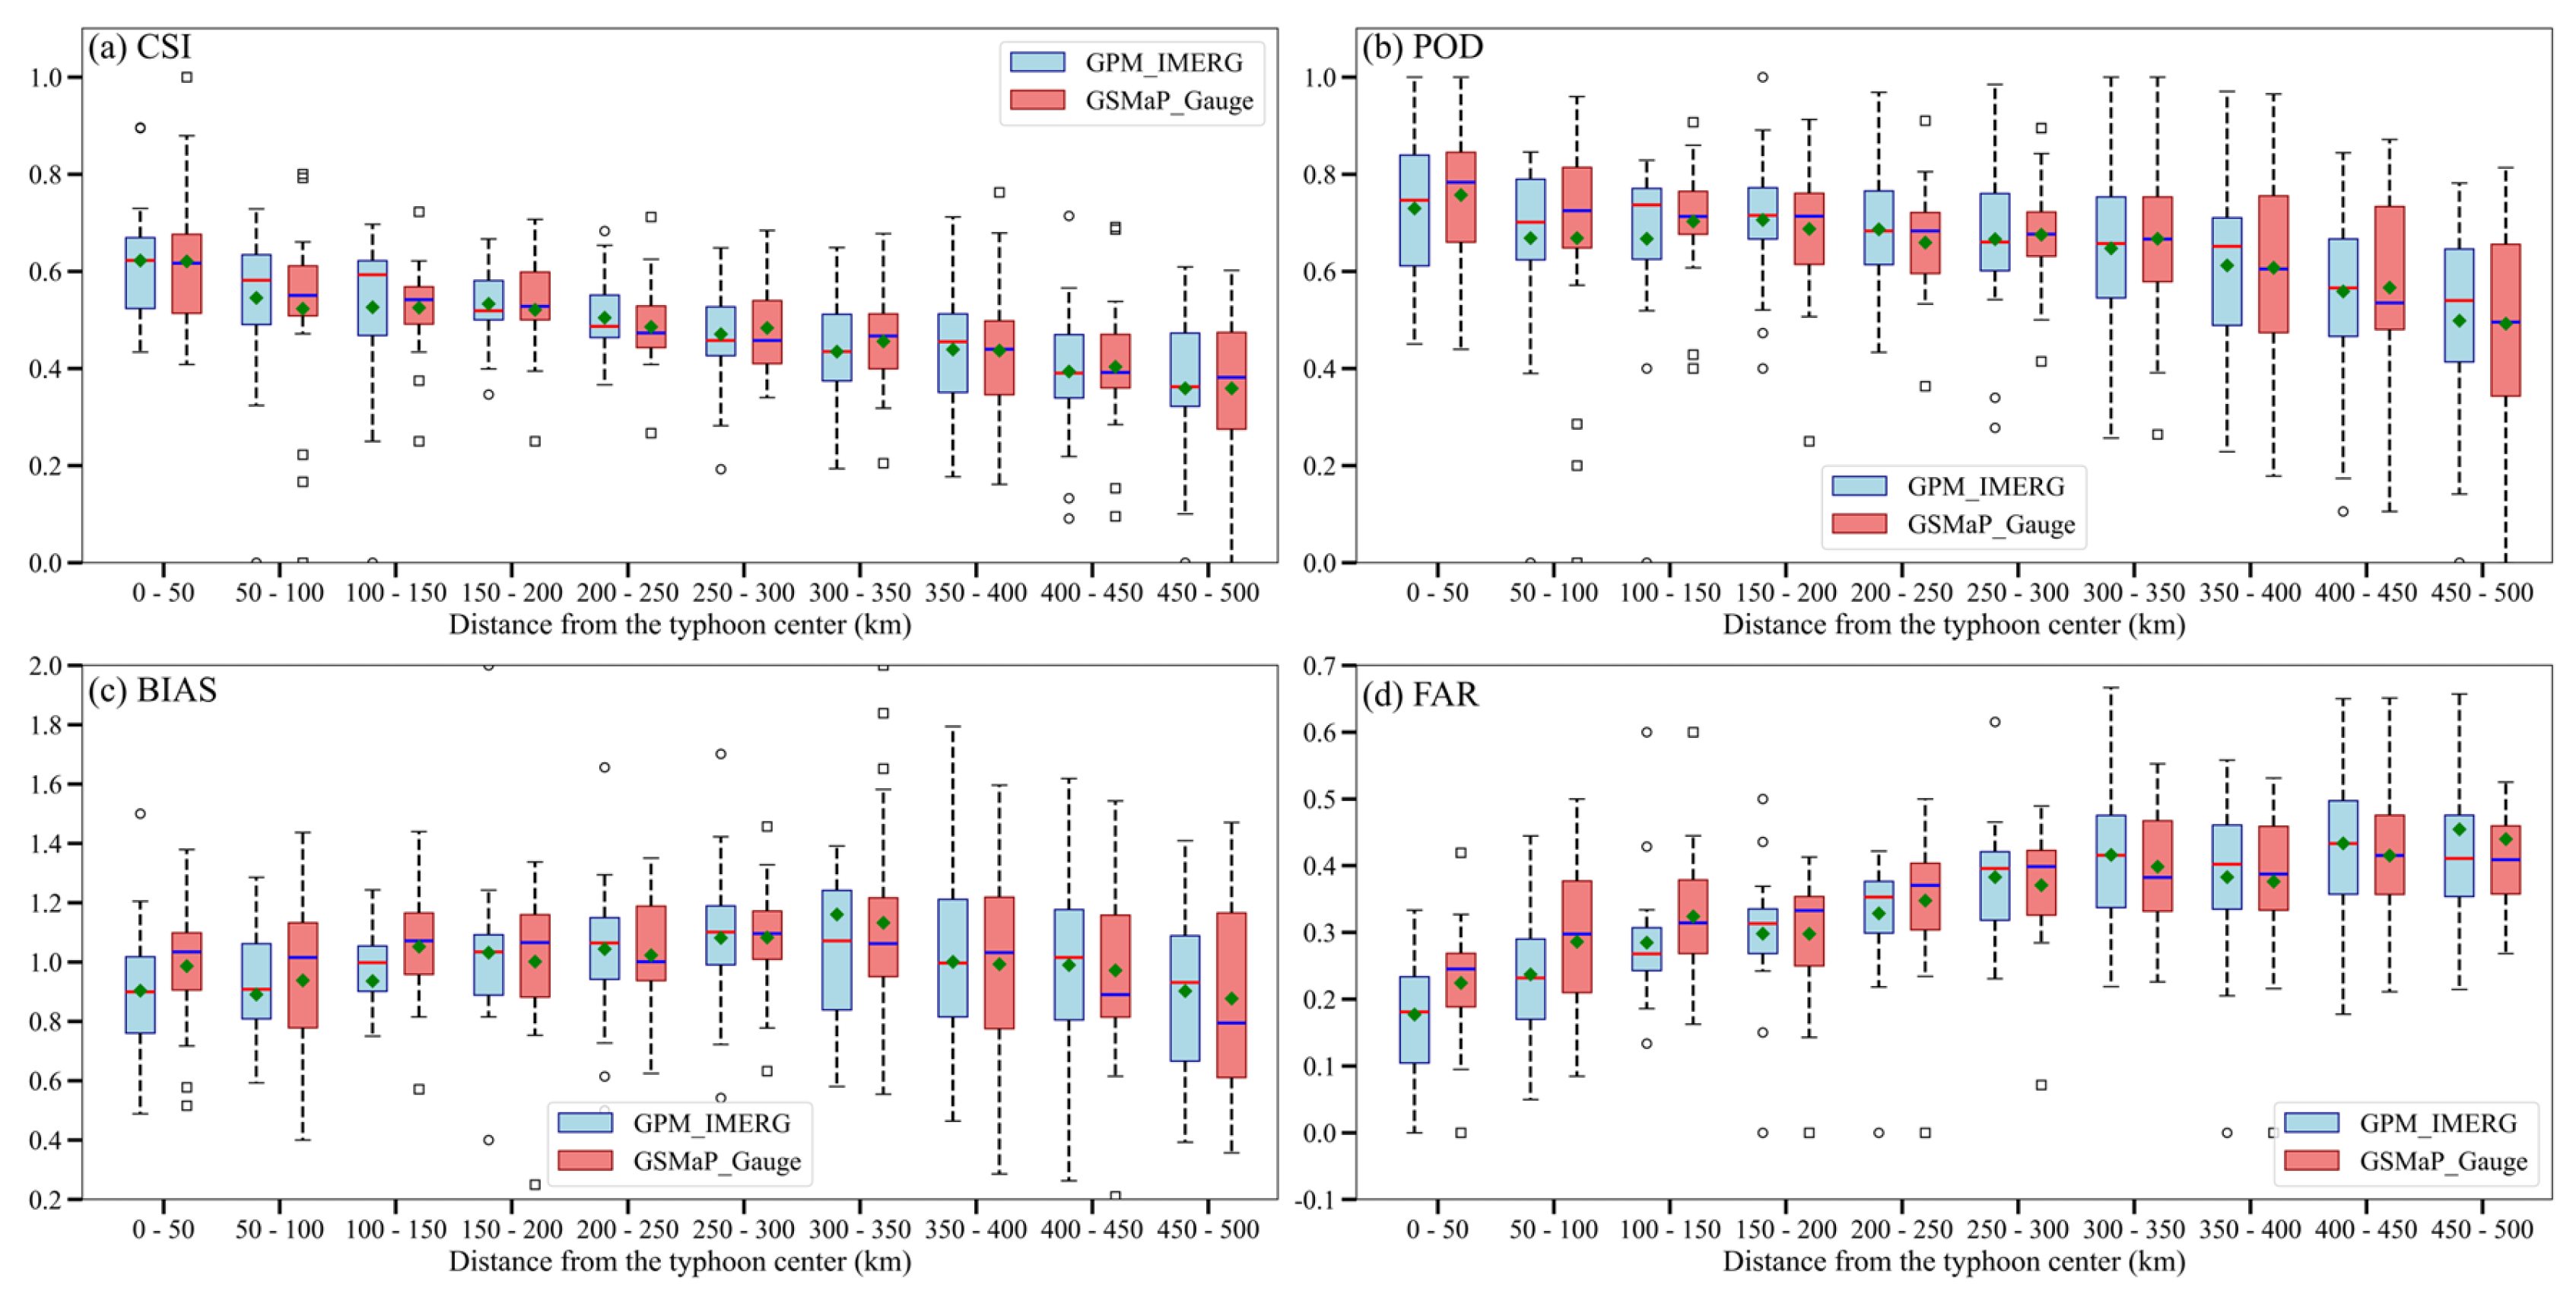
Figure 6 presents box plots of GPM_IMERG and GSMaP_Gauge satellite precipitation products for light rain detection (threshold: 1 mm/h) during typhoon precipitation periods from 2021 to 2025, stratified by 50 km annular layers from 0 to 500 km relative to typhoon centers. In Figure 6a, the CSI scores box plots show that CSI scores for both satellite products gradually decrease with increasing distance from the typhoon center; however, the overall mean CSI scores remain above 0.3, indicating reasonably favorable performance, particularly within the 0–50 km range, where both mean and median CSI scores exceed 0.6. GPM_IMERG (blue) exhibits slightly higher median CSI values than GSMaP_Gauge (red) at most distances, with this advantage being more pronounced in the 0–150 km interval. In Figure 6b, the POD scores box plots reveal that GSMaP_Gauge demonstrates higher median POD values than GPM_IMERG at most distances, particularly evident in the 0–150 km range. Both satellite products achieve very high POD scores, with medians and means exceeding 0.5 overall, and both mean and median POD scores surpassing 0.7 within the 0–50 km range, indicating exceptionally high hit rates for light rain events at the 1 mm/h threshold. Figure 6d presents the FAR scores box plots, showing that FAR scores for both products gradually increase with distance from the typhoon center, with rapid growth observed in the 0–150 km range. GPM_IMERG exhibits markedly lower median and mean FAR values than GSMaP_Gauge within the 0–150 km interval. This explains why GSMaP_Gauge achieves higher median POD but slightly lower CSI scores than GPM_IMERG in the 0–150 km range, as the elevated false-alarm rate degrades its overall CSI performance.
Regarding the bias scores (Figure 6c), within the 100–400 km range from the typhoon center, both GPM_IMERG and GSMaP_Gauge exhibit BIAS values near and slightly above 1, indicating that both products detect the frequency of light precipitation events (≥1 mm/h) with reasonable accuracy at these distances, albeit with a slight tendency toward over-forecasting. However, within 0–100 km, the mean and median BIAS values for GPM_IMERG are markedly below 1, whereas GSMaP_Gauge remains near 1, suggesting that GSMaP_Gauge more reliably captures the occurrence frequency of light precipitation events within 0–100 km of the typhoon center, while GPM_IMERG tends to under-detect such events. Conversely, in the outer region of 400–500 km, the bias score of GPM_IMERG is closer to 1, whereas GSMaP_Gauge falls distinctly below 1. Overall, bias scores across the 0–500 km range are reasonably favorable.
Comprehensive analysis of the four categorical score box plots reveals that the detection performance of satellite precipitation products for light rain events at the 1 mm/h threshold exhibits significant distance dependence. Within the inner-core region of 0–150 km from the typhoon center, both GPM_IMERG and GSMaP_Gauge demonstrate relatively reliable detection capability, characterized by median and mean values of CSI > 0.50, POD > 0.60, FAR < 0.3, and BIAS near 1 in this interval. In the mid-distance region of 150–300 km, performance begins to attenuate but remains acceptable. In the outer region of 300–500 km, the performance of both products degrades significantly, with median and mean values in this interval characterized by low BIAS, high FAR, and low CSI, where elevated false-alarm rates become the predominant issue. GPM_IMERG exhibits superior comprehensive performance to GSMaP_Gauge in both the inner-core and mid-distance regions, though its problem of high false-alarm rates in the outer region is more pronounced.

3.2.2. Monthly Variation Characteristics of Light Rain Event-Detection Performance

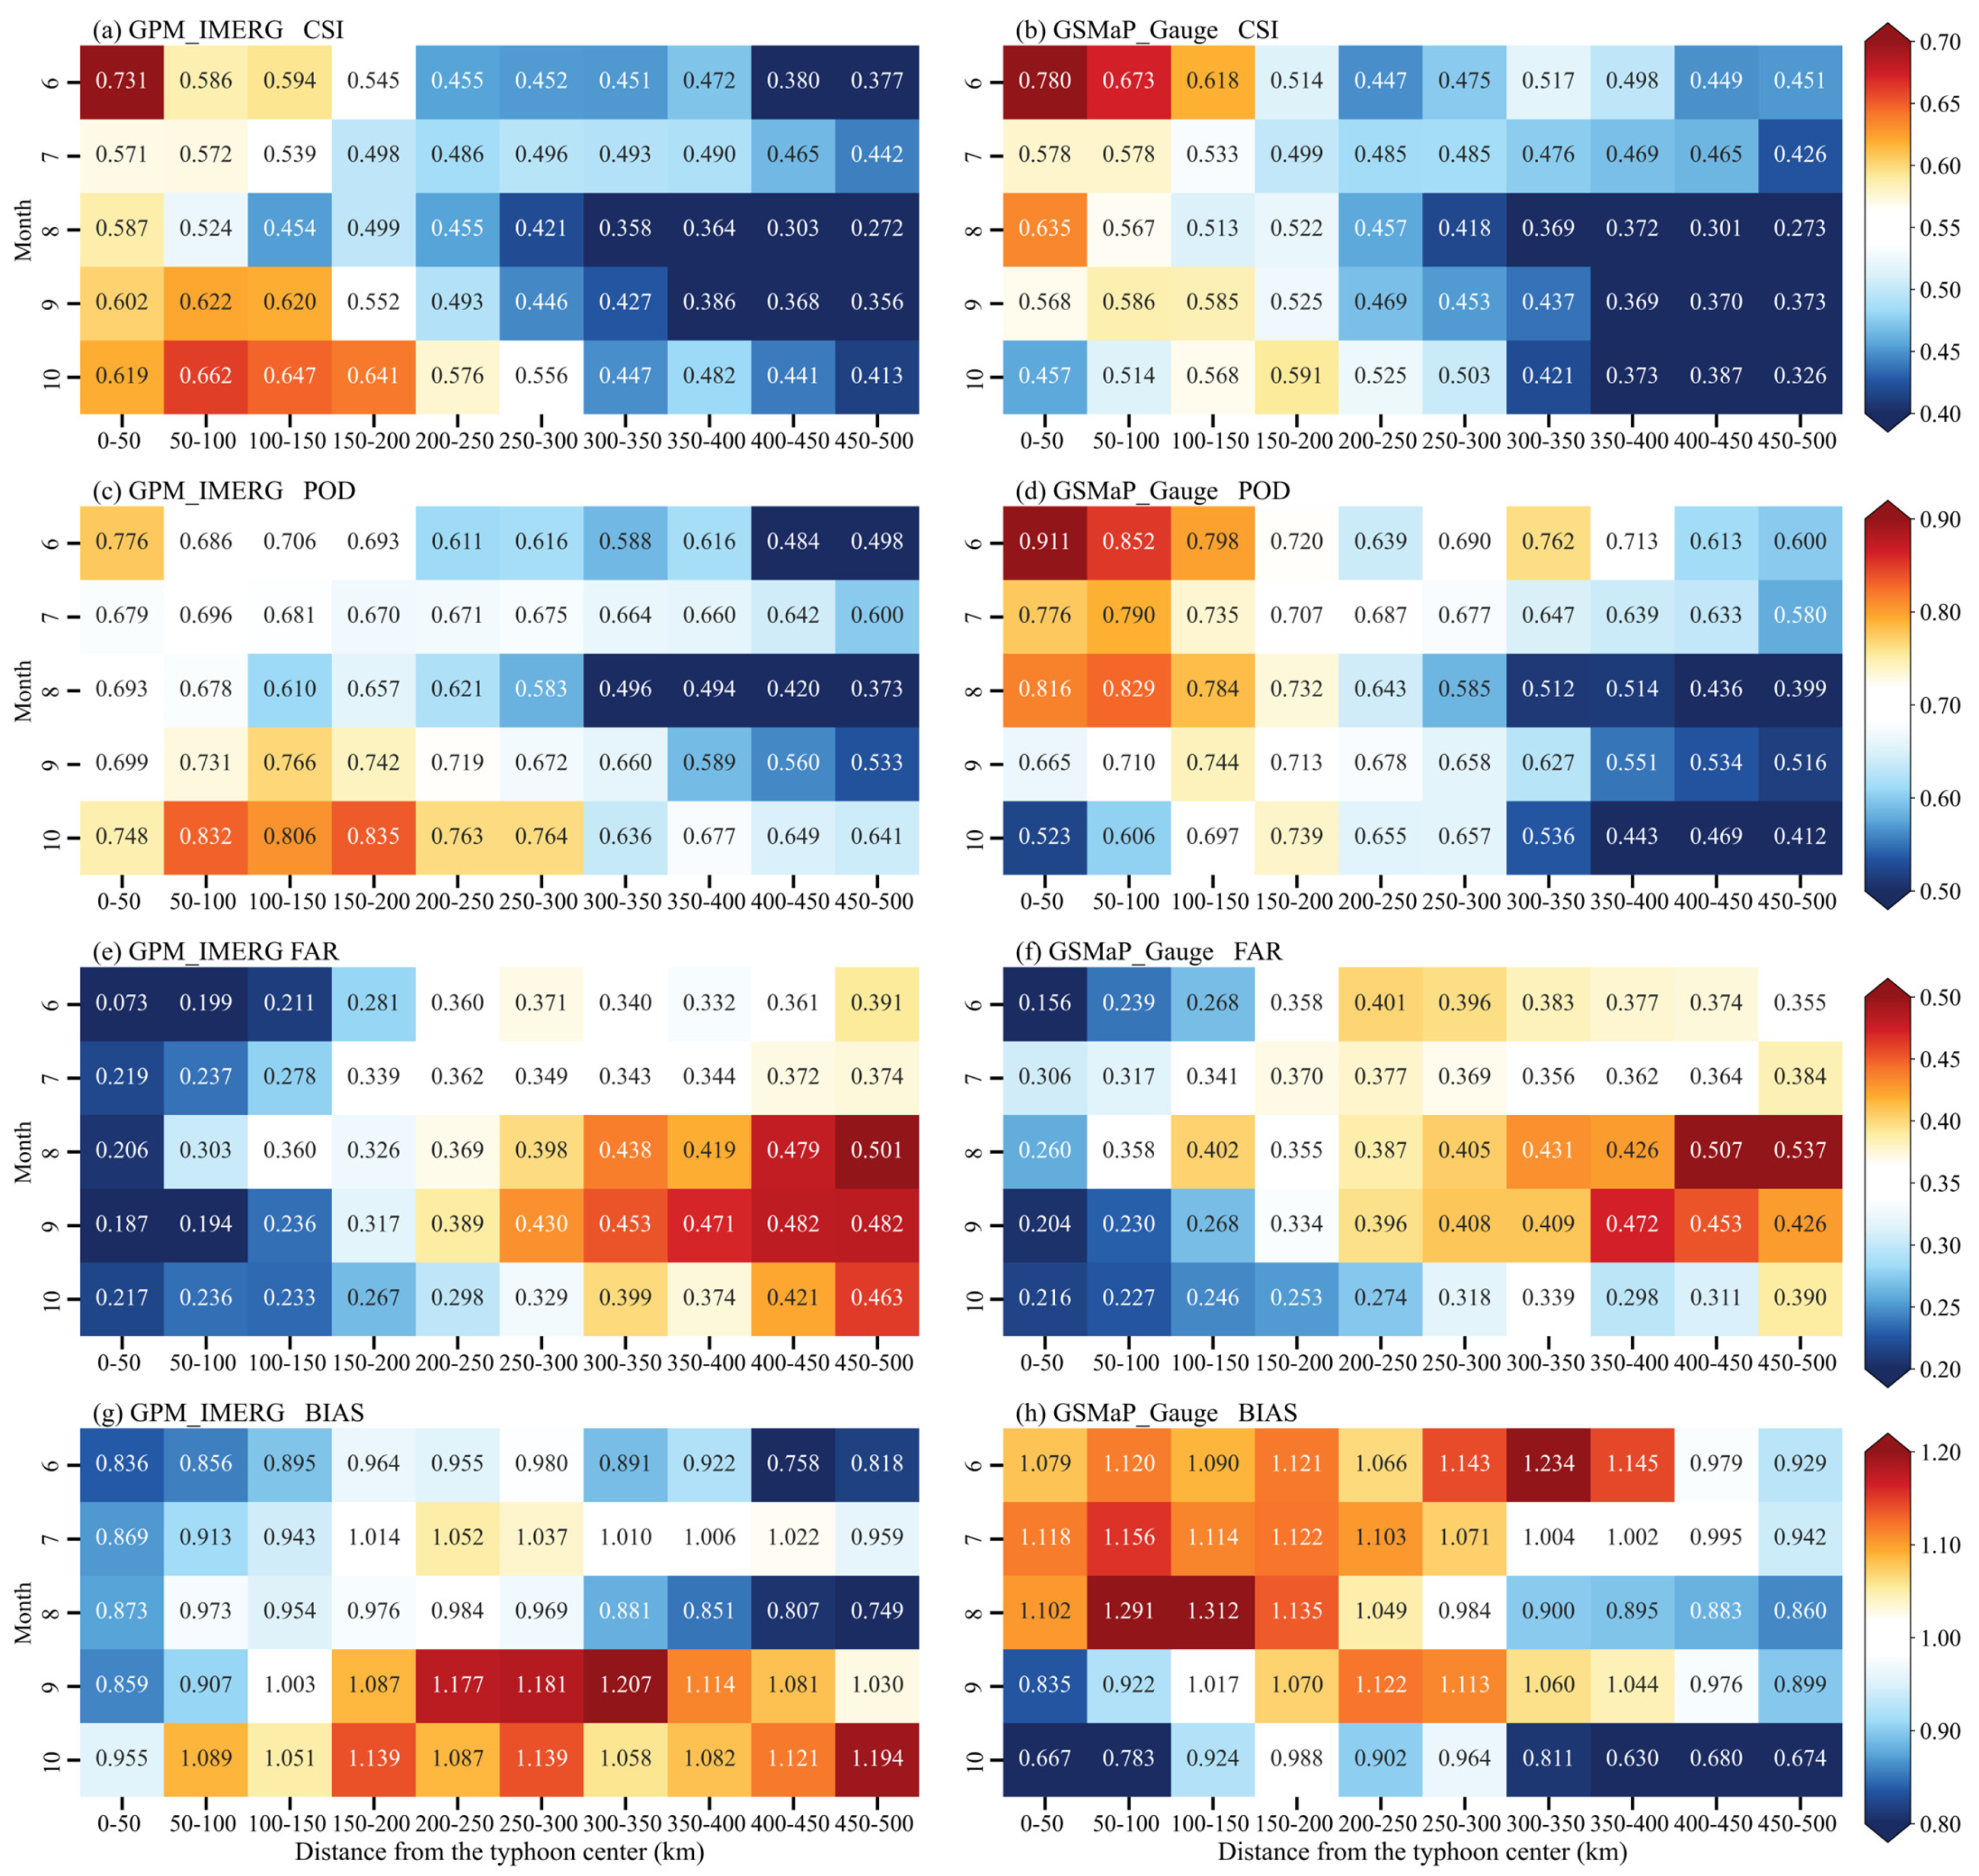
The preceding section presented a comprehensive evaluation of GPM_IMERG and GSMaP_Gauge satellite precipitation products for light rain detection at the 1 mm/h threshold across 50 km annular layers from 0 to 500 km relative to typhoon centers, with overall favorable performance. To investigate the monthly variation characteristics of this detection performance at the 1 mm/h threshold, Figure 7 presents heatmaps of GPM_IMERG (left column: a, c, e, and g) and GSMaP_Gauge (right column: b, d, f, h) during June–October from 2021 to 2025, across 50 km stratified layers from 0 to 500 km. As illustrated, GPM_IMERG and GSMaP_Gauge exhibit similar spatial patterns in mean CSI, POD, and FAR distributions. Both CSI (Figure 7a,b) and POD (Figure 7c,d) demonstrate decreasing trends with increasing distance from the typhoon center and non-monotonic variations across months. The maximum mean CSI values for both products occur within 0–50 km in June, while the minimum values occur within 450–500 km in August. However, GPM_IMERG CSI scores across the 0–500 km range generally exhibit higher values in June and October and lower values in July–August, whereas GSMaP_Gauge displays a fluctuating decreasing pattern from June to October. POD distributions share similar characteristics with CSI, though the maximum GPM_IMERG POD score appears within 150–200 km in October. FAR distributions (Figure 7e,f) exhibit inverse patterns relative to CSI, with minimum values within 0–50 km in June and maximum values within 450–500 km in August. Within the 150–200 km range, FAR values in June–July are markedly lower than those in August–October, with August prone to extreme FAR maxima. For BIAS (Figure 7g,h), the two products demonstrate distinctly opposite distributions. GPM_IMERG tends to over-forecast precipitation events at the 1 mm/h threshold within 150–500 km during September–October, whereas it tends to under-forecast during June–August. Conversely, GSMaP_Gauge exhibits over-forecasting within 0–250 km during June–August, with under-forecasting prone to occur during September–October, presenting a diagonally complementary pattern between the two products.
Overall, the heatmap analysis reveals significant season–distance-coupled effects on the detection performance of both satellite precipitation products for typhoon rainfall. Both products exhibit optimal comprehensive performance (high CSI, low FAR, and high POD) in the inner-core region during early summer (June) but demonstrate the poorest comprehensive performance (low CSI, high FAR, and low POD) in the outer region during midsummer (August). June marks the initial phase of the western North Pacific typhoon season, during which landfalling typhoons over China are predominantly relatively weak tropical storms or severe tropical storms. Their precipitation structures are characterized by stratiform precipitation and outer spiral rainbands, with relatively low degrees of convective organization. Such precipitation systems feature larger horizontal scales and more moderate vertical development, allowing passive microwave sensors to capture their precipitation signals with reasonable accuracy. In contrast, August represents the peak period of typhoon activity, during which landfalling typhoons often intensify into severe typhoons or even super typhoons, featuring more compact and intense eyewall convection, along with deeper vertical development. Under these conditions, precipitation is dominated by intense convective rainfall, with strong updrafts and complex microphysical processes (e.g., abundant supercooled water, graupel, and hail) within the precipitation core, significantly increasing the difficulty of passive microwave retrieval. Consequently, the satellite products perform better in June than in August.

3.2.3. Diurnal Variation Characteristics of Light Rain Event-Detection Performance

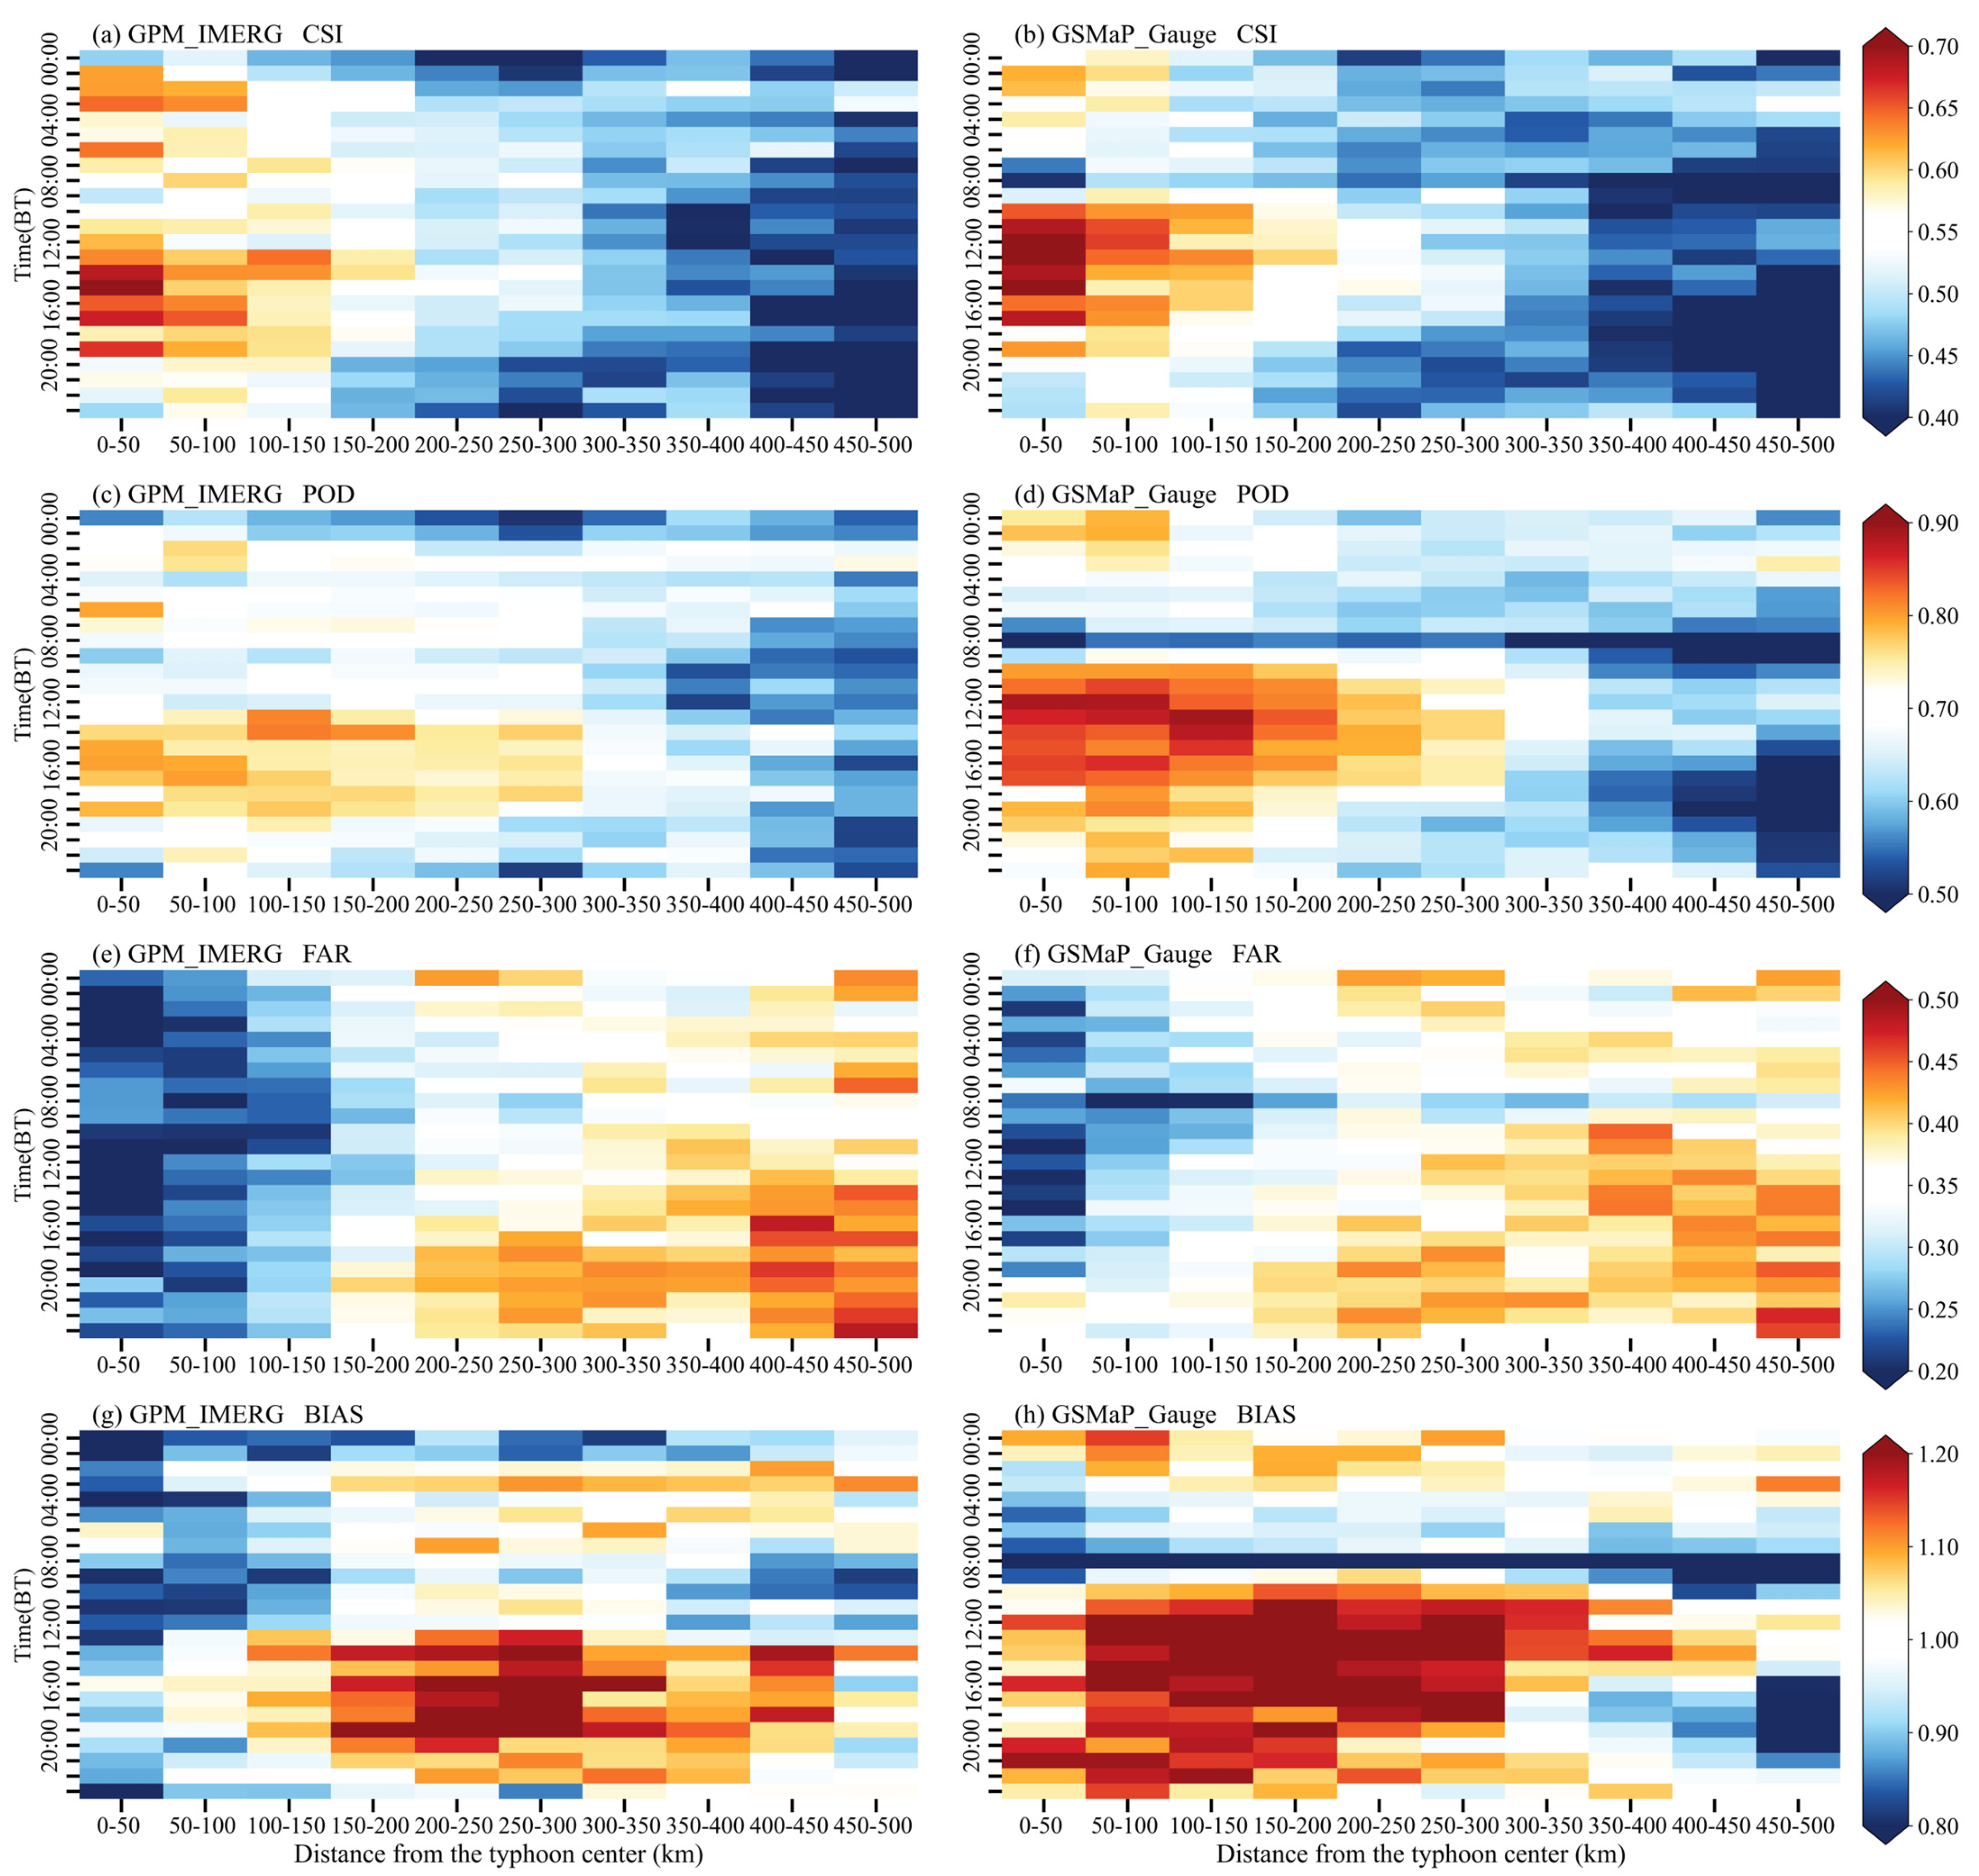
To conduct a more refined assessment of GPM_IMERG and GSMaP_Gauge satellite precipitation products for light rain detection at the 1 mm/h threshold across 50 km annular layers from 0 to 500 km relative to typhoon centers, Figure 8 presents an in-depth investigation from the diurnal variation perspective. As illustrated, GPM_IMERG and GSMaP_Gauge exhibit similar distribution patterns in mean CSI, POD, FAR, and BIAS. Both CSI (Figure 8a,b) and POD (Figure 8c,d) demonstrate decreasing trends with increasing distance from the typhoon center, accompanied by pronounced diurnal variation characteristics. Within the 0–150 km range, CSI and POD display clear diurnal patterns of enhancement from afternoon to nighttime and attenuation in the early morning. The 12:00–18:00 BT interval shows significantly higher CSI and POD values than other periods, with GSMaP_Gauge markedly exceeding GPM_IMERG; peak values occur at 14:00–16:00 BT, while minimum values are observed during 00:00–08:00 BT. This distribution is highly consistent with the diurnal cycle of typhoon convective activity, as afternoon-to-evening solar radiation heats the surface, increases boundary layer instability, and enhances convective precipitation, while satellite microwave signals are stronger and spatially more distinct during daytime. In the outer region of 200–500 km, the diurnal variation amplitude of CSI and POD weakens, with values remaining at lower levels throughout the day, indicating that the diurnal signal of outer rainband precipitation is weaker than that in the inner-core region. For FAR scores (Figure 8e,f), temporal differences in detection strategies between the two satellite products are evident. For GPM_IMERG, FAR exhibits no pronounced diurnal variation within 0–150 km, whereas in the 200–500 km range, it demonstrates higher values during 12:00–24:00 BT and lower values during 00:00–08:00 BT. GSMaP_Gauge shares similar diurnal characteristics with GPM_IMERG in the 200–500 km range, but within 0–150 km, it presents a pattern of lower values near 12:00 BT, with increasing trends toward both 24:00 and 00:00 BT.
For BIAS (Figure 8g,h), GPM_IMERG and GSMaP_Gauge exhibit similar diurnal variation characteristics. Both products show a pronounced tendency toward over-forecasting during afternoon to nighttime (12:00–24:00 BT) within 150–350 km from the typhoon center. However, GSMaP_Gauge demonstrates more pronounced over-forecasting across broader temporal and spatial ranges, with bias scores markedly exceeding 1 from 10:00 to 24:00 BT within 0–350 km. In contrast, GPM_IMERG shows notable over-forecasting only within 150–350 km during 12:00–24:00 BT, with insignificant overestimation in the inner-core region of 0–150 km; particularly during 00:00–12:00 BT, distinct under-forecasting occurs in this inner-core zone. GSMaP_Gauge, however, exhibits less pronounced under-forecasting than GPM_IMERG in the 0–150 km inner-core region during 00:00–12:00 BT.
Overall, the hourly diurnal heatmap analysis reveals significant diurnal–distance-coupled characteristics in the detection performance of both GPM_IMERG and GSMaP_Gauge for typhoon precipitation. The afternoon-to-evening period (12:00–18:00 BT) represents the optimal detection window for both products, particularly within the 0–150 km inner-core region, where CSI reaches 0.65–0.72 and POD reaches 0.76–0.89. During nighttime to early morning (00:00–10:00 BT), performance degrades comprehensively: GPM_IMERG is dominated by underestimation in the inner-core region, while GSMaP_Gauge exhibits an anomalous trough across all metrics around 08:00 BT, accompanied by severe BIAS over-forecasting (>1.3) in the inner-core region during afternoon hours despite its POD advantage. These findings suggest potential for future research on differentiated strategies according to diurnal phases of typhoon precipitation: GSMaP_Gauge shows relatively higher hit rates during afternoon to evening, though downward correction of precipitation rates may be needed; GPM_IMERG demonstrates lower missed detection and underestimation risks during nighttime to early morning. For outer regions beyond 350 km from the typhoon center, caution is warranted when employing satellite precipitation products throughout the day.

3.3. Detection Performance for Extreme Typhoon Precipitation

The preceding analysis examined the discrimination capability of GPM_IMERG and GSMaP_Gauge for light rain events, revealing favorable detection performance at the 1 mm/h threshold. To further investigate their capability for extreme precipitation detection, the extreme precipitation threshold is defined as the 95th percentile of typhoon precipitation during 2021–2025, corresponding to 12.0 mm/h, as shown in Figure 2 (PCT95). This threshold is selected to balance statistical representativeness with operational relevance, capturing the upper tail of typhoon precipitation distribution while maintaining sufficient sample size for robust categorical validation. Lower thresholds (e.g., 90th percentile, 7.7 mm/h) would include more moderate events, diluting the distinction between extreme and heavy precipitation, while higher thresholds (e.g., 99th percentile, 24.5 mm/h) would yield insufficient samples for meaningful categorical validation.

3.3.1. Spatial Distribution of Extreme Rain Event-Detection Performance

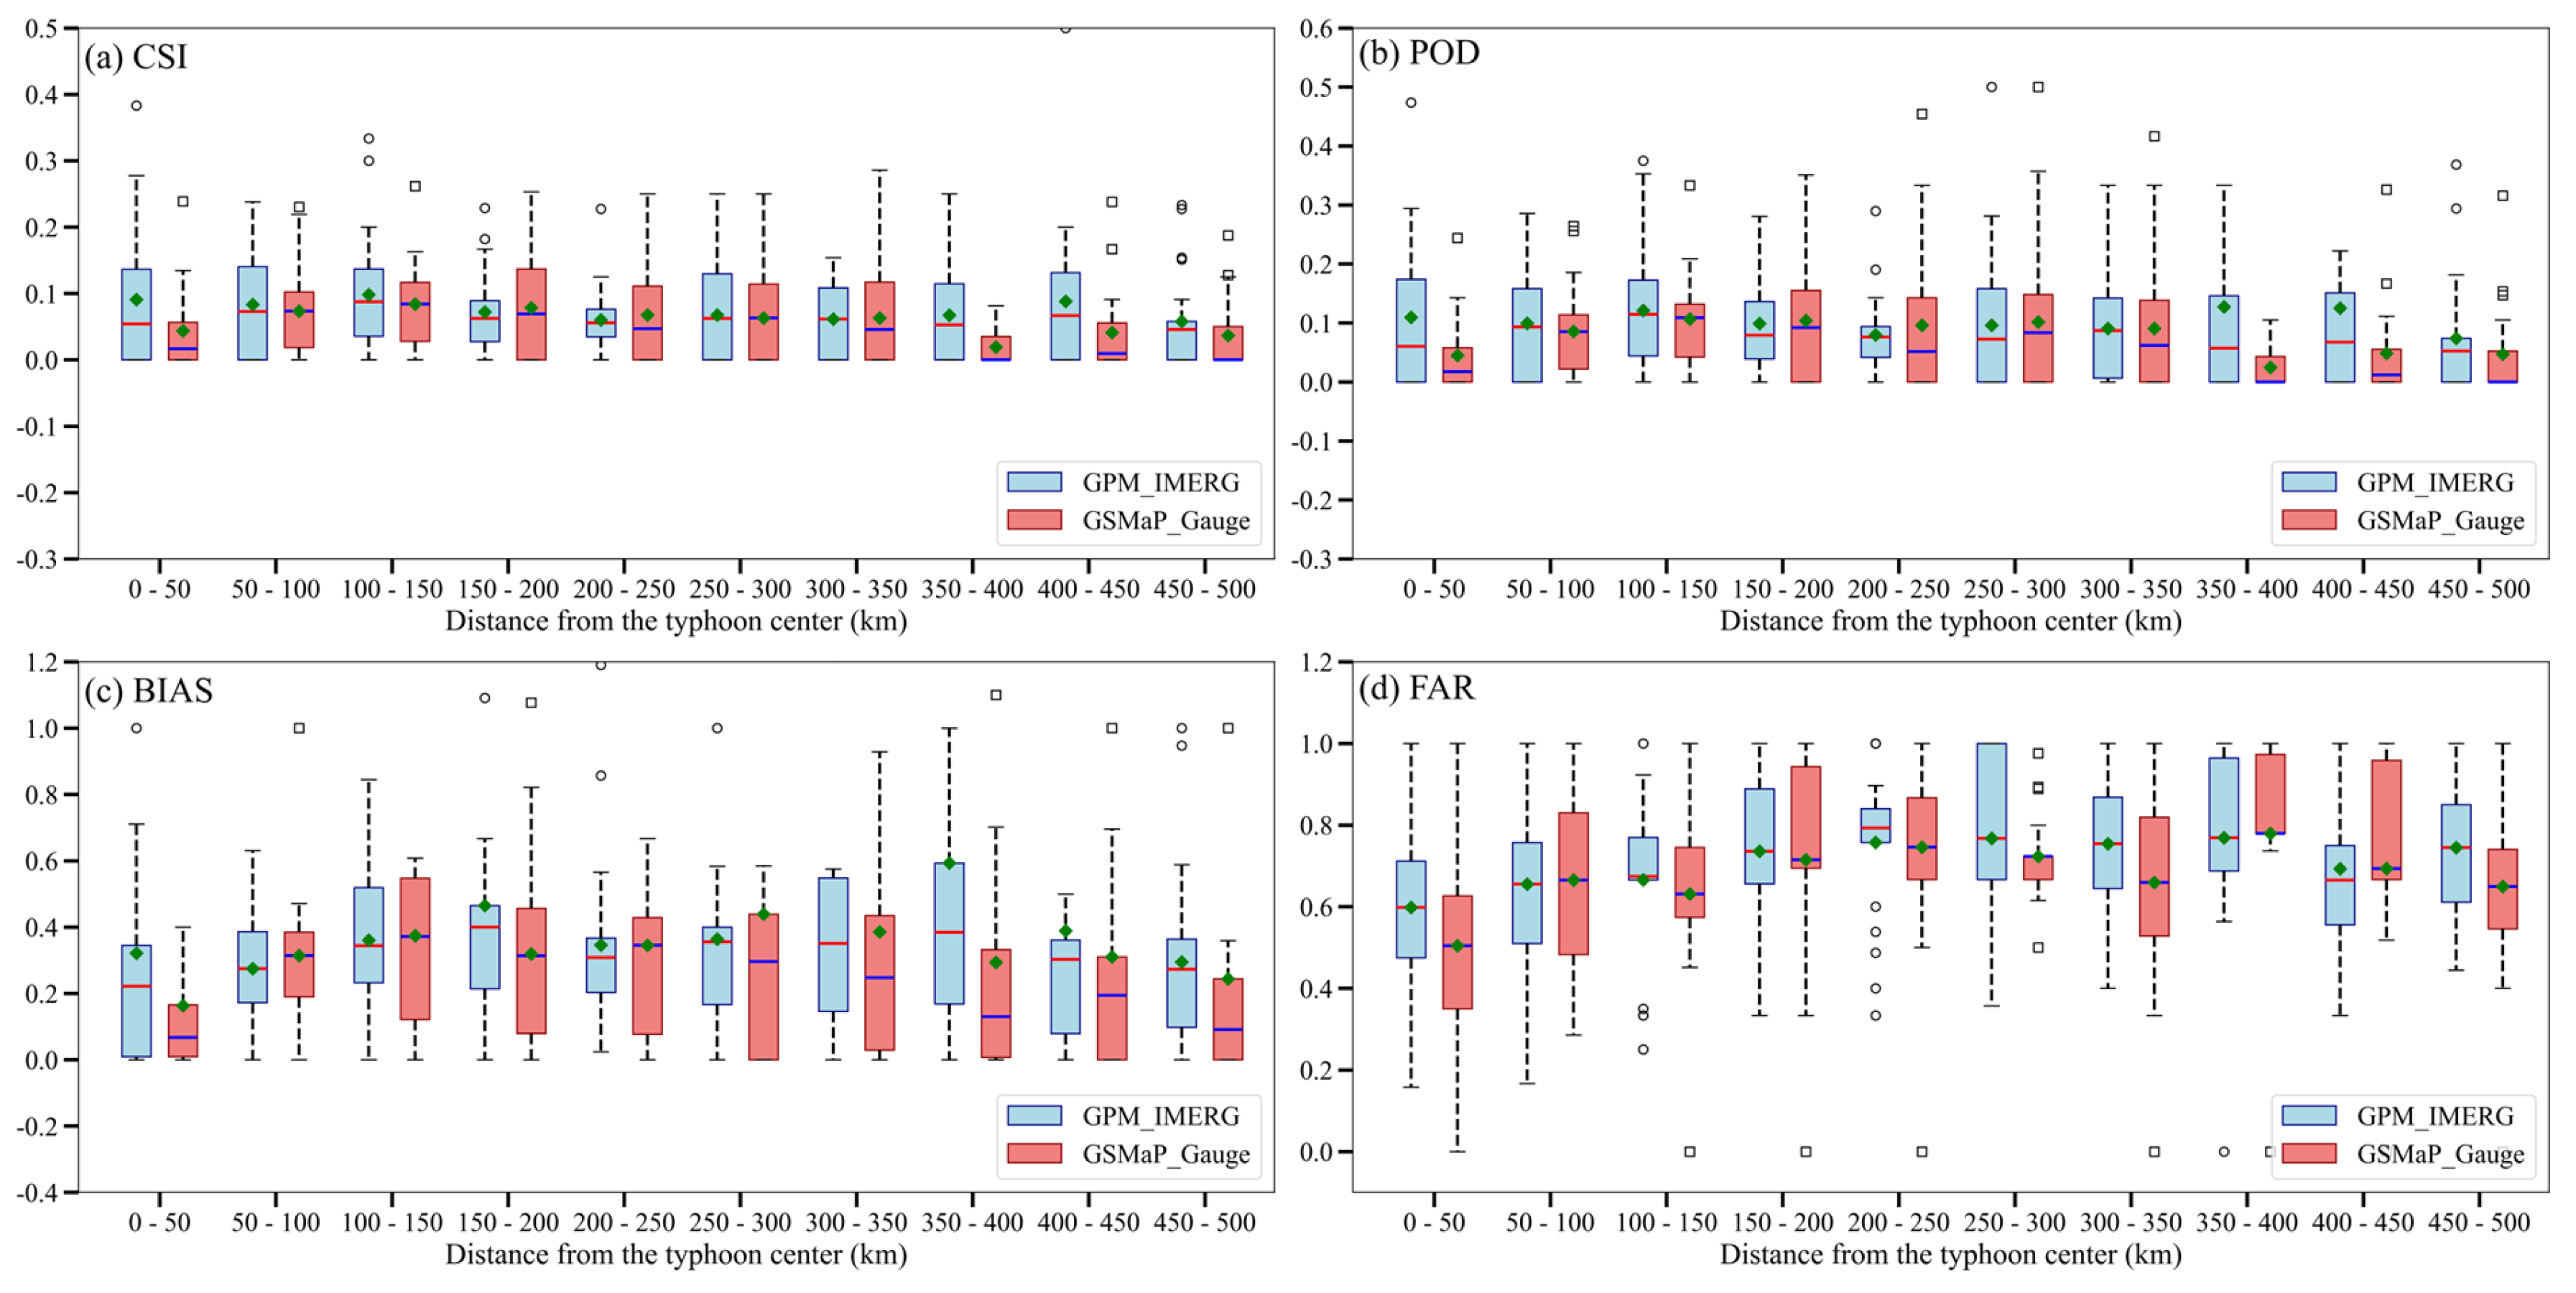
Figure 9 presents box plots of extreme precipitation detection performance for GPM_IMERG and GSMaP_Gauge across 50 km annular layers from 0 to 500 km relative to typhoon centers during typhoon precipitation periods from 2021 to 2025. Compared with the 1.0 mm/h threshold (Figure 6), all metrics for both products exhibit significant degradation when the threshold is elevated to 12.0 mm/h. As shown in Figure 9a, mean and median CSI values across the full distance range are generally below 0.1; within the 0–50 km interval, mean CSI values approximate 0.06–0.10, declining to 0.02–0.04 at 450–500 km, representing an approximate 80% decrease from the maximum score of ~0.6 at the 1.0 mm/h threshold. GPM_IMERG exhibits slightly higher median CSI values than GSMaP_Gauge within the 50–150 km interval, though the difference is marginal; however, within 0–50 km, both the mean and median CSI values of GPM_IMERG are markedly higher than those of GSMaP_Gauge.
The POD score distribution pattern is generally consistent with CSI. Full-distance POD means and medians range approximately from 0.01 to 0.13, representing an approximate 85% decrease from the maximum of 0.7 at the 1.0 mm/h threshold. Within the 0–50 km interval, both mean and median POD values for GPM_IMERG exceed those of GSMaP_Gauge, with GPM_IMERG median POD 0.05 versus 0.03 for GSMaP_Gauge. A relative peak for GPM_IMERG occurs within the 100–150 km interval (0.10–0.13), though overall POD values remain low, indicating that substantial extreme precipitation events escape detection. This result is highly consistent with the extremely low fitted slopes in the heavy precipitation segment (x ≥ 5 mm/h) of the scatter plots in Figure 2 (GPM_IMERG 0.15, GSMaP_Gauge 0.29).
Regarding FAR scores (Figure 9d), within the 0–50 km interval, GPM_IMERG exhibits mean and median FAR values of approximately 0.6, higher than GSMaP_Gauge’s 0.5, indicating that GPM_IMERG’s relatively elevated POD is accompanied by higher FAR scores; however, the overall POD remains low, resulting in both products demonstrating high missed detection coupled with high false-alarm characteristics for extreme typhoon precipitation in the inner-core region within 0–50 km. From 0 to 250 km, mean and median FAR values for extreme typhoon precipitation from both satellites increase with distance; within 250–500 km, a fluctuating decreasing trend is observed, though median FAR remains as high as 0.7. Combined with extremely low POD values, this reflects that satellite extreme typhoon precipitation detection in outer regions similarly exhibits high missed detection accompanied by high false-alarm characteristics.
For bias scores, both satellite products demonstrate severe under-forecasting of extreme typhoon precipitation. Across the 0–500 km range, BIAS means and variances are markedly below 1, with only a very small number of outliers exceeding 1; mean and median BIAS values at most distances fall below 0.4, indicating substantial under-detection of extreme precipitation events. This is particularly pronounced in the inner-core region within 0–50 km, where GPM_IMERG exhibits median BIAS around 0.2 and GSMaP_Gauge below 0.1, reflecting severe compression of extreme precipitation into weak precipitation intervals by both products. This finding may be consistent with the hypothesized physical limitation of microwave retrieval algorithms, whereby high-frequency microwave signals may approach saturation when precipitation rates exceed approximately 15–20 mm/h, potentially precluding discrimination of stronger precipitation intensities [41,57].

3.3.2. Monthly Variation Characteristics of Extreme Rain Event-Detection Performance

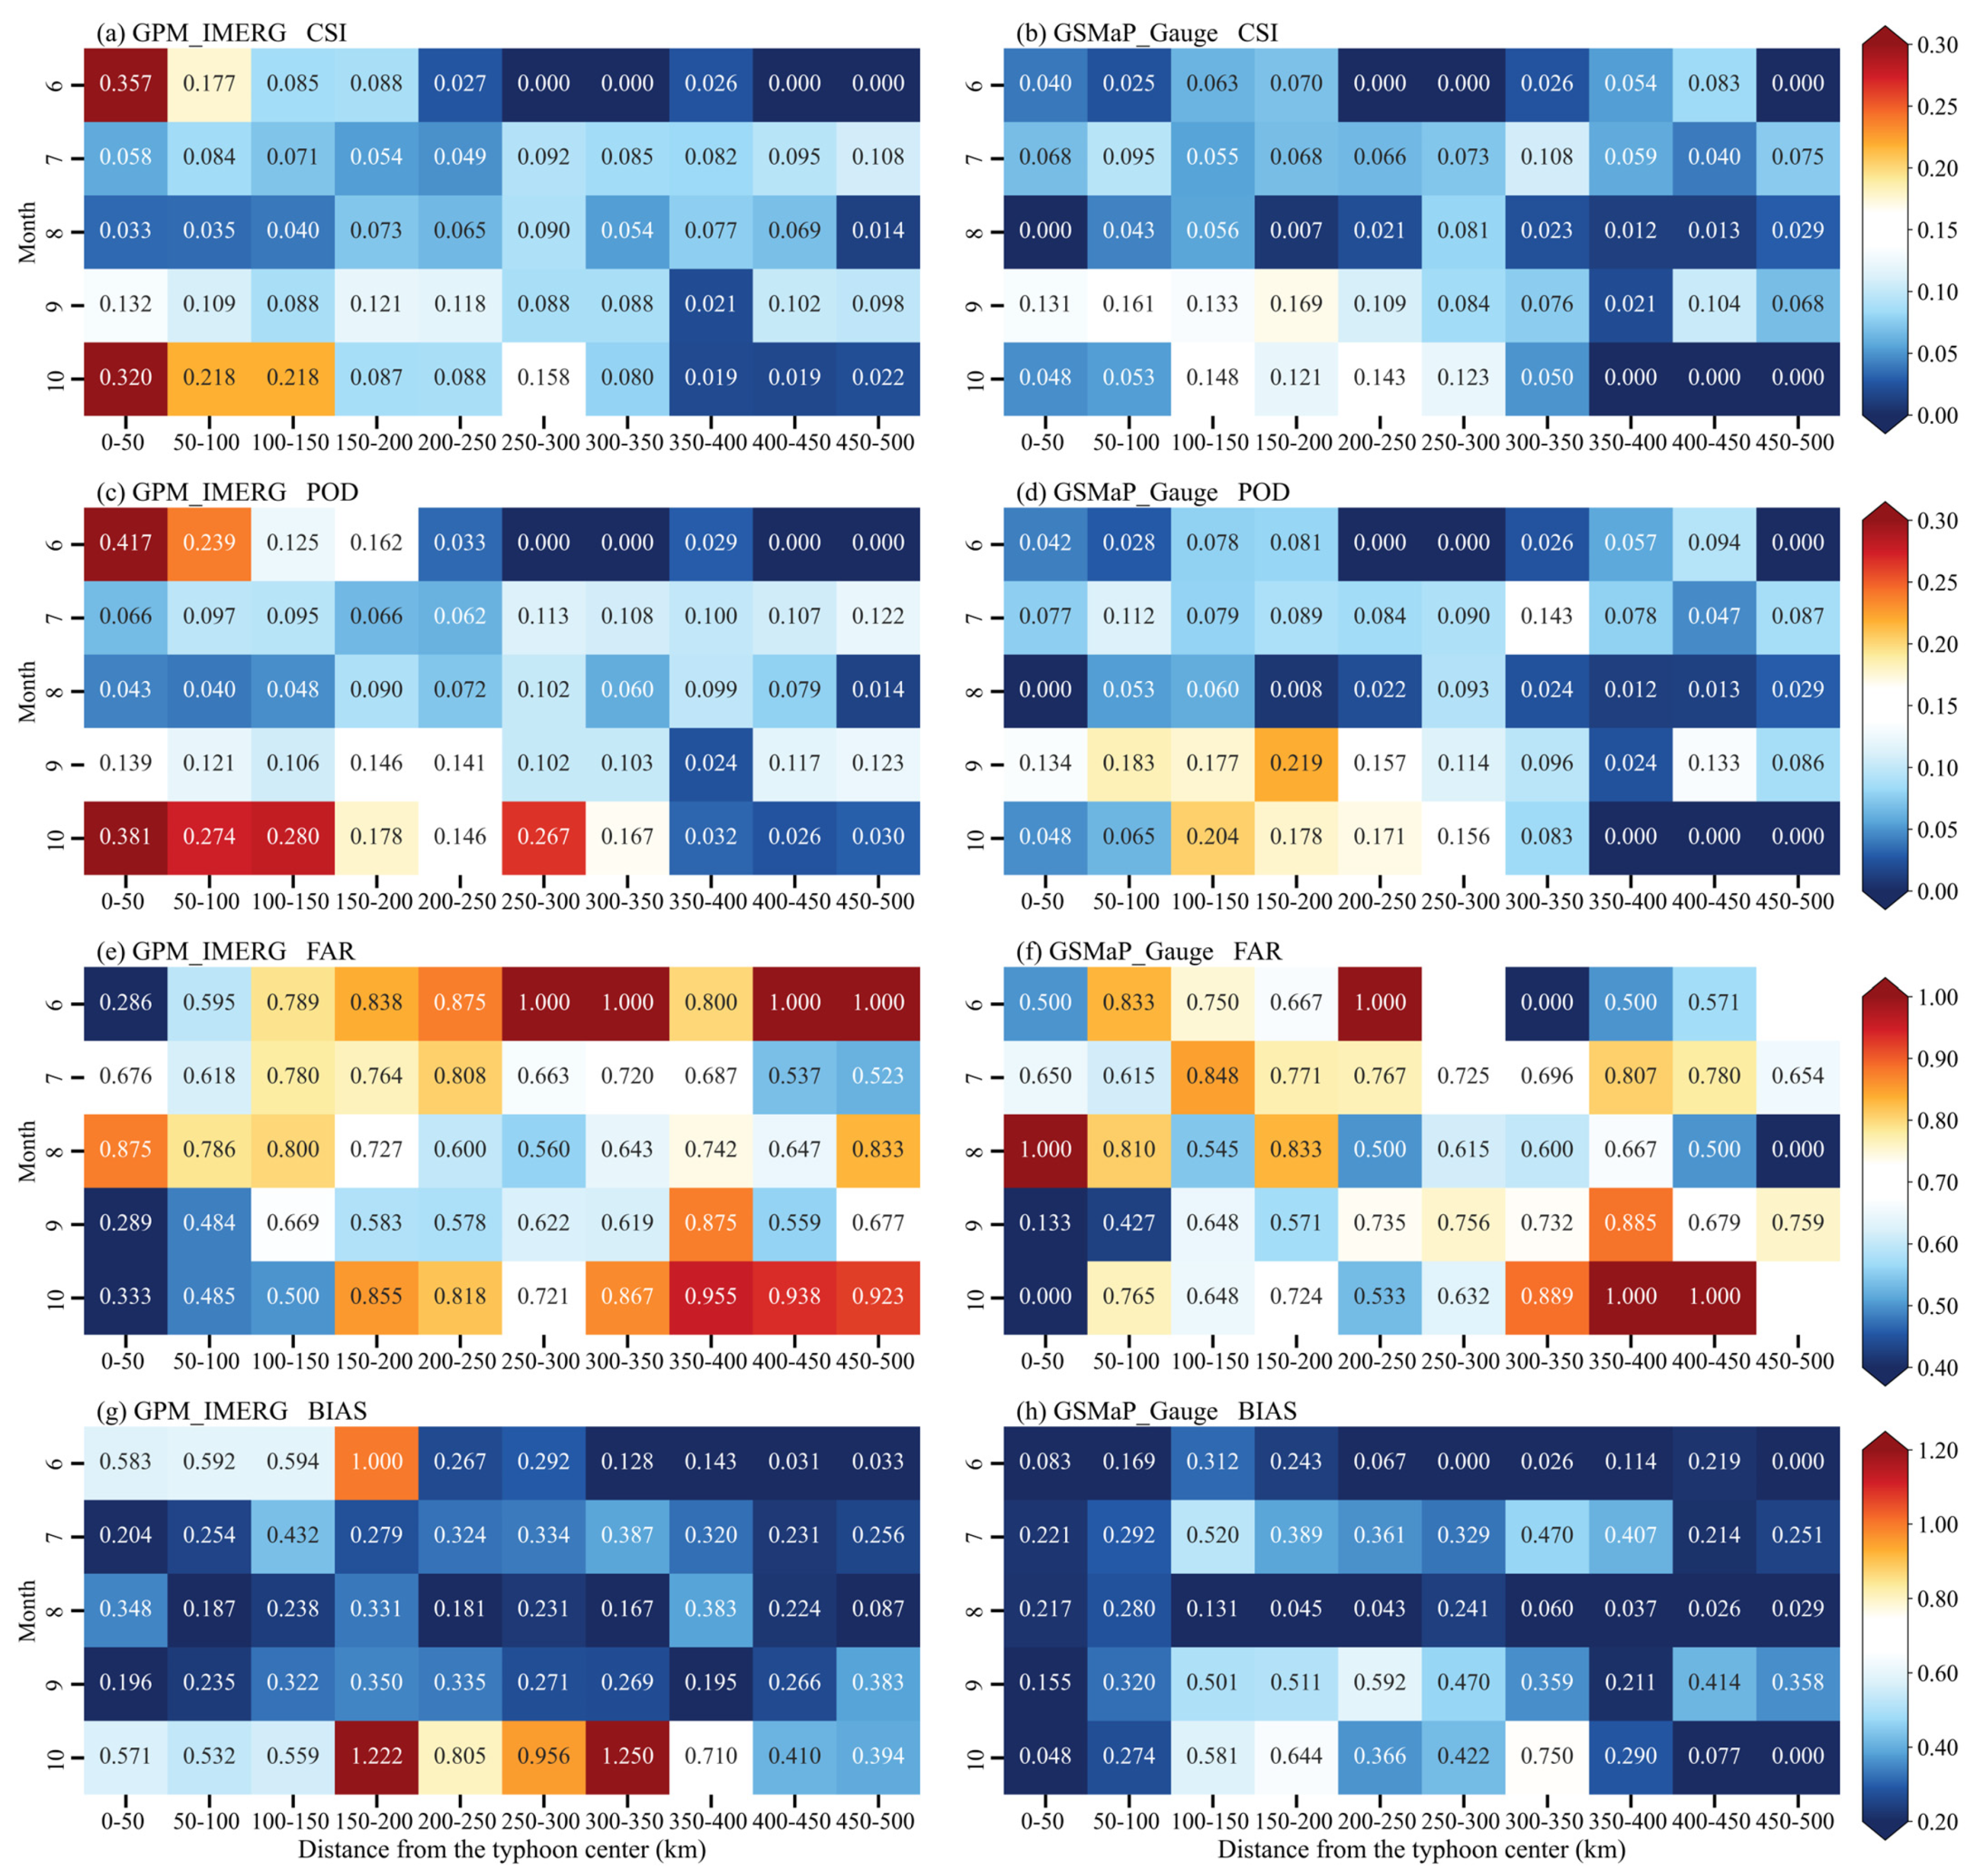
Similarly, the monthly variation characteristics of extreme precipitation discrimination capability for GPM_IMERG and GSMaP_Gauge are also investigated. Figure 10 presents heatmaps of extreme typhoon precipitation detection performance for GPM_IMERG (left column: a, c, e, and g) and GSMaP_Gauge (right column: b, d, f, and h) during June–October from 2021 to 2025, across 50 km stratified layers from 0 to 500 km relative to typhoon centers. For GPM_IMERG CSI (Figure 10a) and POD (Figure 10c) scores, the distribution patterns are generally consistent with those at the 1 mm/h threshold, exhibiting pronounced season–distance-coupled effects within the typhoon inner-core region of 0–100 km. Maximum CSI and POD scores occur in early summer (June), minimum values in midsummer (August), with subsequent recovery in autumn (October). Within the 0–100 km inner-core region, GPM_IMERG CSI and POD scores are markedly higher than those of GSMaP_Gauge, whereas GSMaP_Gauge exhibits consistently low CSI and POD scores without distinct seasonal or distance variation characteristics, reflecting its generally inadequate retrieval capability for extreme precipitation across all months and distances. In the 150–500 km region, FAR values for both GPM_IMERG and GSMaP_Gauge are very small in June and October, with most values approaching zero. Consequently, aside from slightly more accurate extreme precipitation detection by GPM_IMERG in the inner-core region during June and October, overall accuracy remains low across other conditions.
For FAR scores, GPM_IMERG and GSMaP_Gauge exhibit relatively similar distributions, both demonstrating pronounced seasonal characteristics within the typhoon inner-core region of 0–50 km. FAR values peak in August, with lower values in June and October, presenting an inverse pattern to GPM_IMERG’s POD and CSI distributions. This indicates that GPM_IMERG achieves relatively higher hit rates coupled with lower false-alarm rates for extreme precipitation in the inner-core region during June and October, contrasting with the pattern observed at the 1 mm/h threshold, where high hit rates coincided with high false-alarm rates. However, in the 150–500 km region, GPM_IMERG FAR values approach 1 in June and October, reflecting not only low hit rates but also extremely high false-alarm rates, thereby indicating low data reliability. Similarly, GPM_IMERG bias scores exhibit seasonal characteristics, with values closer to 1 during June and October within 0–200 km compared with July–September, indicating relatively more accurate event detection frequencies during these months, and exceeding 1 at 150–200 km and 300–350 km in October, suggesting a tendency toward over-forecasting. Although GSMaP_Gauge also shows relatively higher values at 150–200 km and 300–350 km in October compared with other months, these remain substantially below 1, and BIAS values are below 1 across all months and distances from 0 to 500 km, indicating persistent under-forecasting.
In summary, GPM_IMERG demonstrates relatively superior discrimination capability for extreme precipitation within 0–100 km of the typhoon center during June and October compared with other months, and markedly outperforms GSMaP_Gauge, with CSI exceeding 0.3, POD around 0.4, and FAR relatively low at approximately 0.3; however, BIAS remains below 0.6, indicating persistent severe underestimation. For both products, extreme precipitation detection falls to very low levels in the 150–500 km region (CSI and POD mostly below 0.05, even approaching 0; FAR predominantly exceeding 0.80 and approaching 1; BIAS < 0.30), where satellite signals are predominantly spurious.

3.4. Error Analysis of Typhoon Precipitation

3.4.1. Spatial Distribution of Error

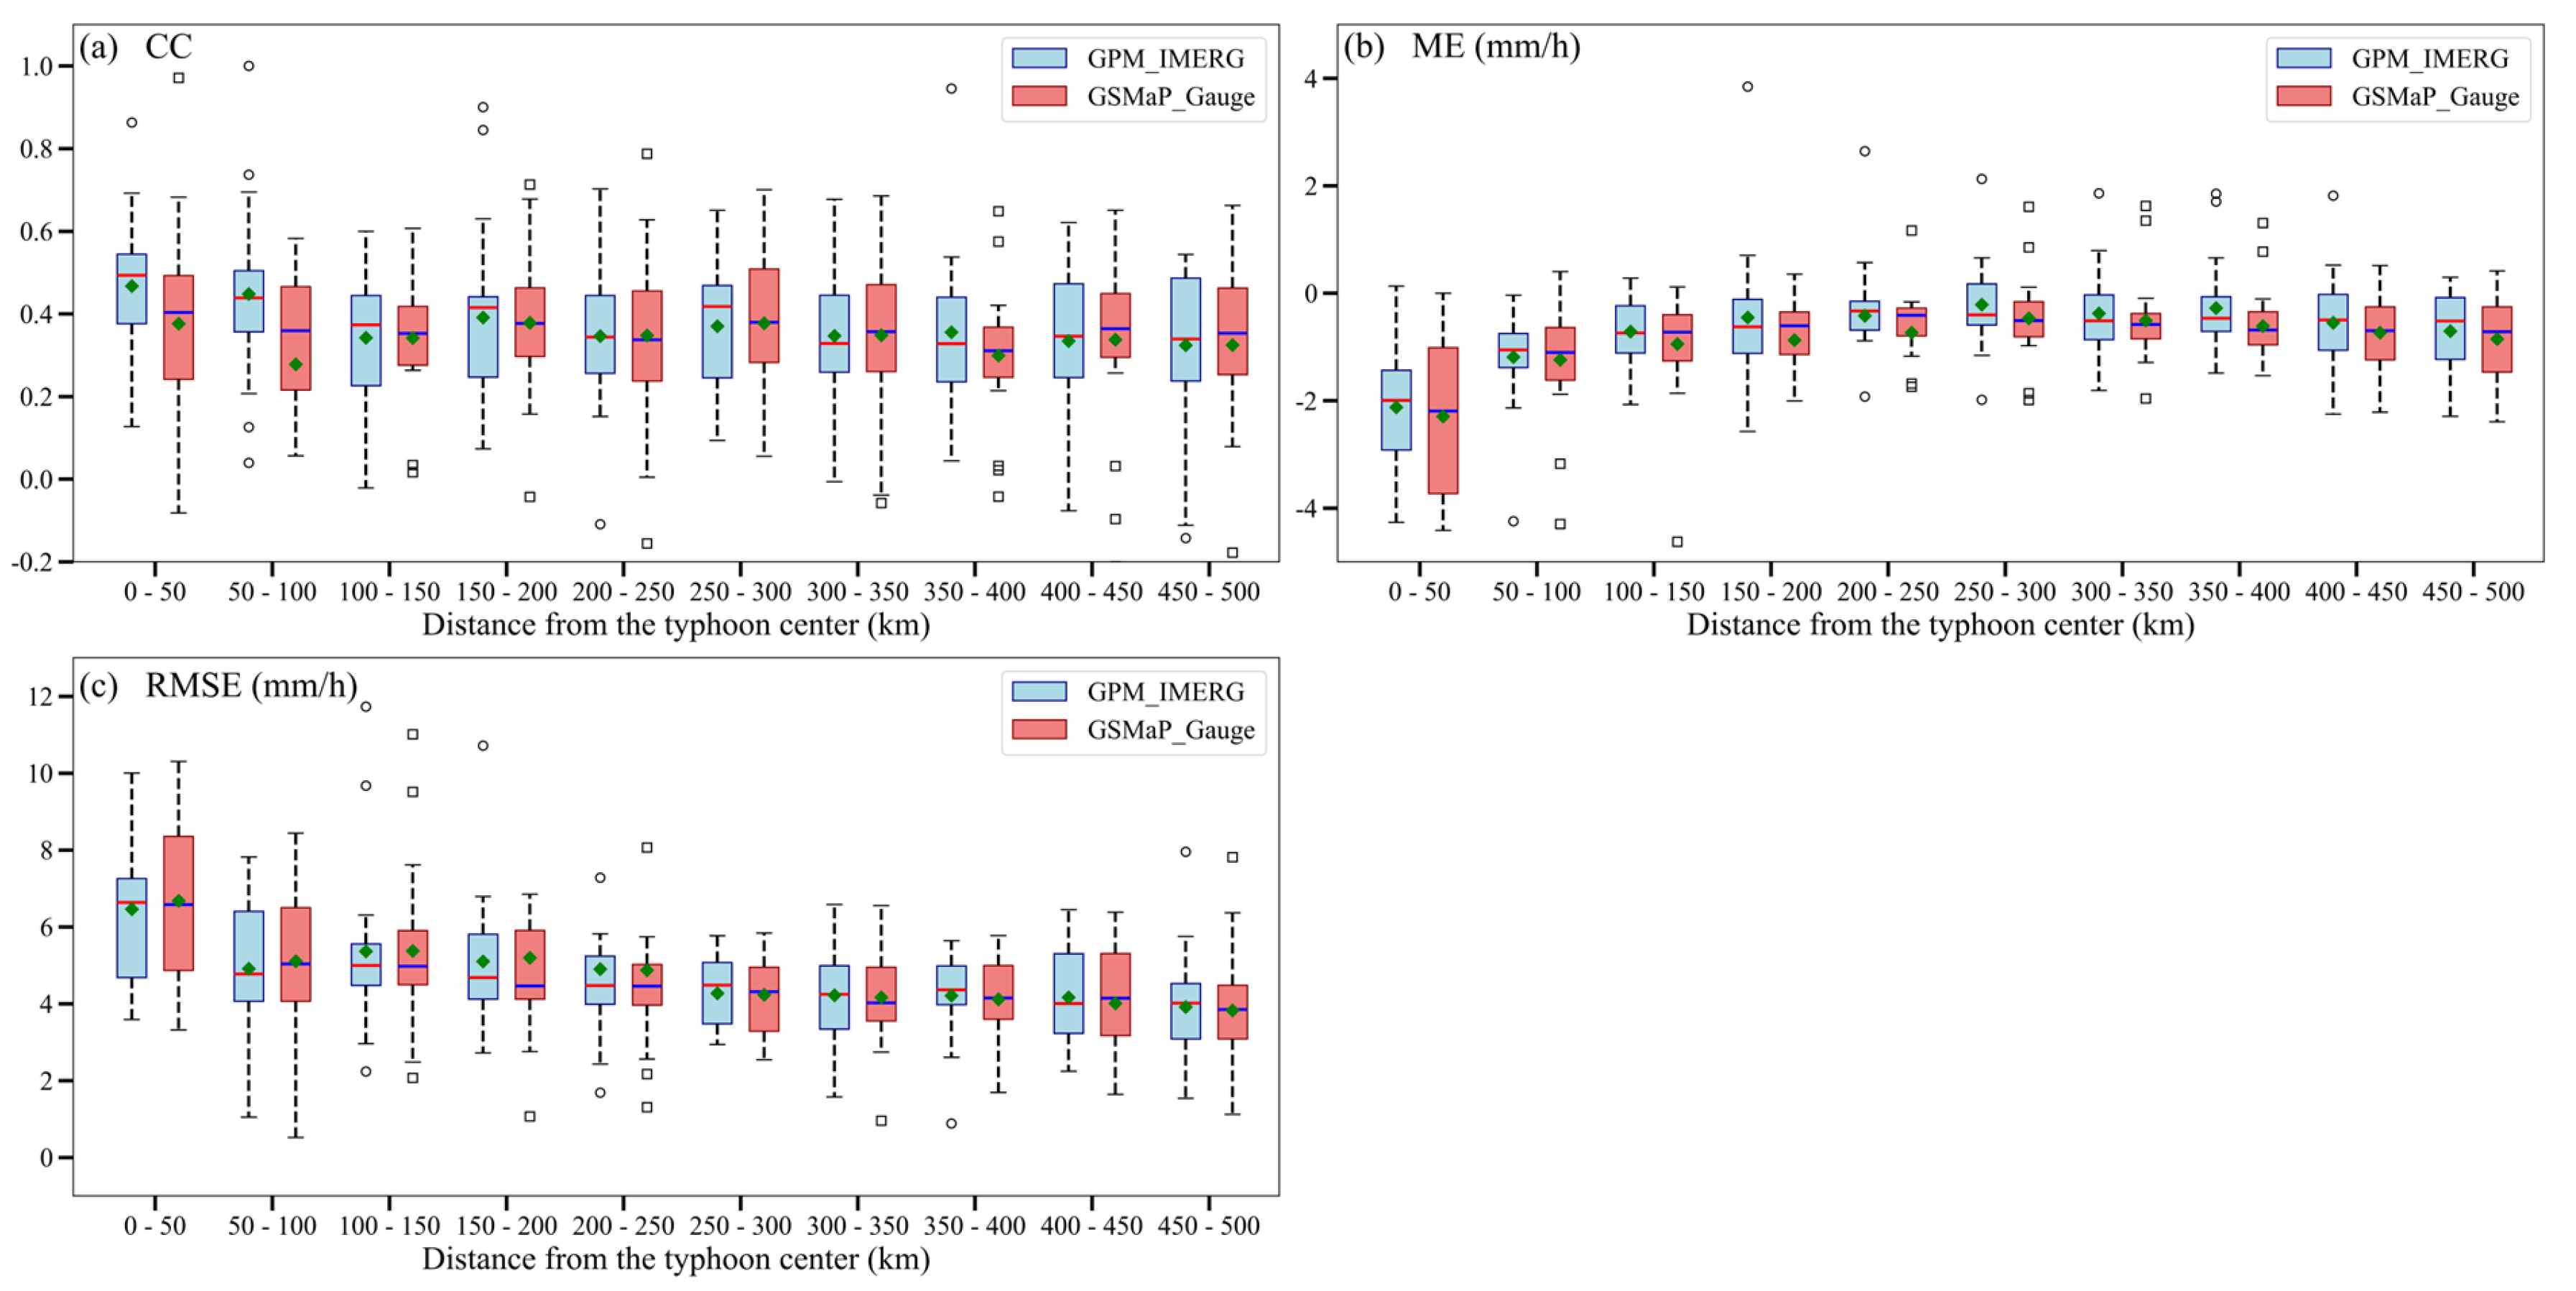
To further investigate the spatial distribution of errors for GPM_IMERG and GSMaP_Gauge, Figure 11 presents the CC (Figure 11a), ME (Figure 11b), and RMSE (Figure 11c) between the two satellite precipitation products and OBS across 50 km annular layers from 0 to 500 km relative to typhoon centers during typhoon precipitation periods from 2021 to 2025. As shown by the CC, both GPM_IMERG and GSMaP_Gauge exhibit predominantly positive correlations with OBS across the 0–500 km range, with means and medians showing relatively small variation with increasing distance from the typhoon center, generally remaining around 0.4, indicating favorable correlation between both satellite products and OBS. GPM_IMERG (blue) exhibits slightly higher median CC values than GSMaP_Gauge (red) within the 0–100 km interval; however, this gap rapidly narrows beyond 100 km, with GSMaP_Gauge marginally surpassing GPM_IMERG in the 250–350 km interval. This characteristic contrasts with the scatter plot results in Figure 3 where GPM_IMERG overall CC (0.39) was lower than GSMaP_Gauge (0.64), indicating that GPM_IMERG’s CC advantage after distance stratification is primarily concentrated in the inner-core region, while correlation with OBS is comparable between the two products at mid-to-long distances.
From the ME perspective, both GPM_IMERG and GSMaP_Gauge exhibit negative means and medians across the 0–500 km range, consistent with the previously identified overall underestimation characteristic. Spatially, both products demonstrate larger negative biases within 0–50 km, with relatively smaller negative biases in the 50–500 km range, indicating that predominant biases occur in the typhoon inner-core region where underestimation is more severe. From mean and median values, GSMaP_Gauge shows smaller values with lower box plot limits, reflecting more severe underestimation by this product. The 0–50 km inner-core region coincides with the zone of larger typhoon precipitation magnitudes, consistent with the earlier finding that underestimation is more pronounced at higher precipitation intensities. Meanwhile, mean and median biases for both products approach zero in the 200–300 km range, with box plots exhibiting an arch-shaped distribution characteristic.
RMSE comprehensively reflects both random and systematic errors of satellite products, serving as an integrated metric for assessing precipitation estimation accuracy. From the RMSEs distribution of both satellite precipitation products relative to OBS across the 0–500 km range, RMSEs exhibit a decreasing trend with increasing distance from the typhoon center, with maximum values occurring within 0–50 km. GSMaP_Gauge demonstrates slightly larger mean and median RMSE values than GPM_IMERG, though its upper box plot limits are markedly higher, indicating overall larger errors for GSMaP_Gauge. The most pronounced RMSE decrease occurs between 0 and 50 km and between 50 and 100 km, where mean and median RMSE values for both products drop from approximately 7 mm/h to around 5 mm/h; subsequently, from 100 to 500 km, mean and median RMSE values gradually decline to approximately 4 mm/h. This trend is directly associated with the attenuation of precipitation intensity with increasing distance: the inner-core region exhibits large precipitation variability and numerous extreme values, naturally resulting in higher RMSE; the outer region features weaker and more stable precipitation, with correspondingly lower RMSE.

3.4.2. Monthly Variation Characteristics of Spatial Error Distributions

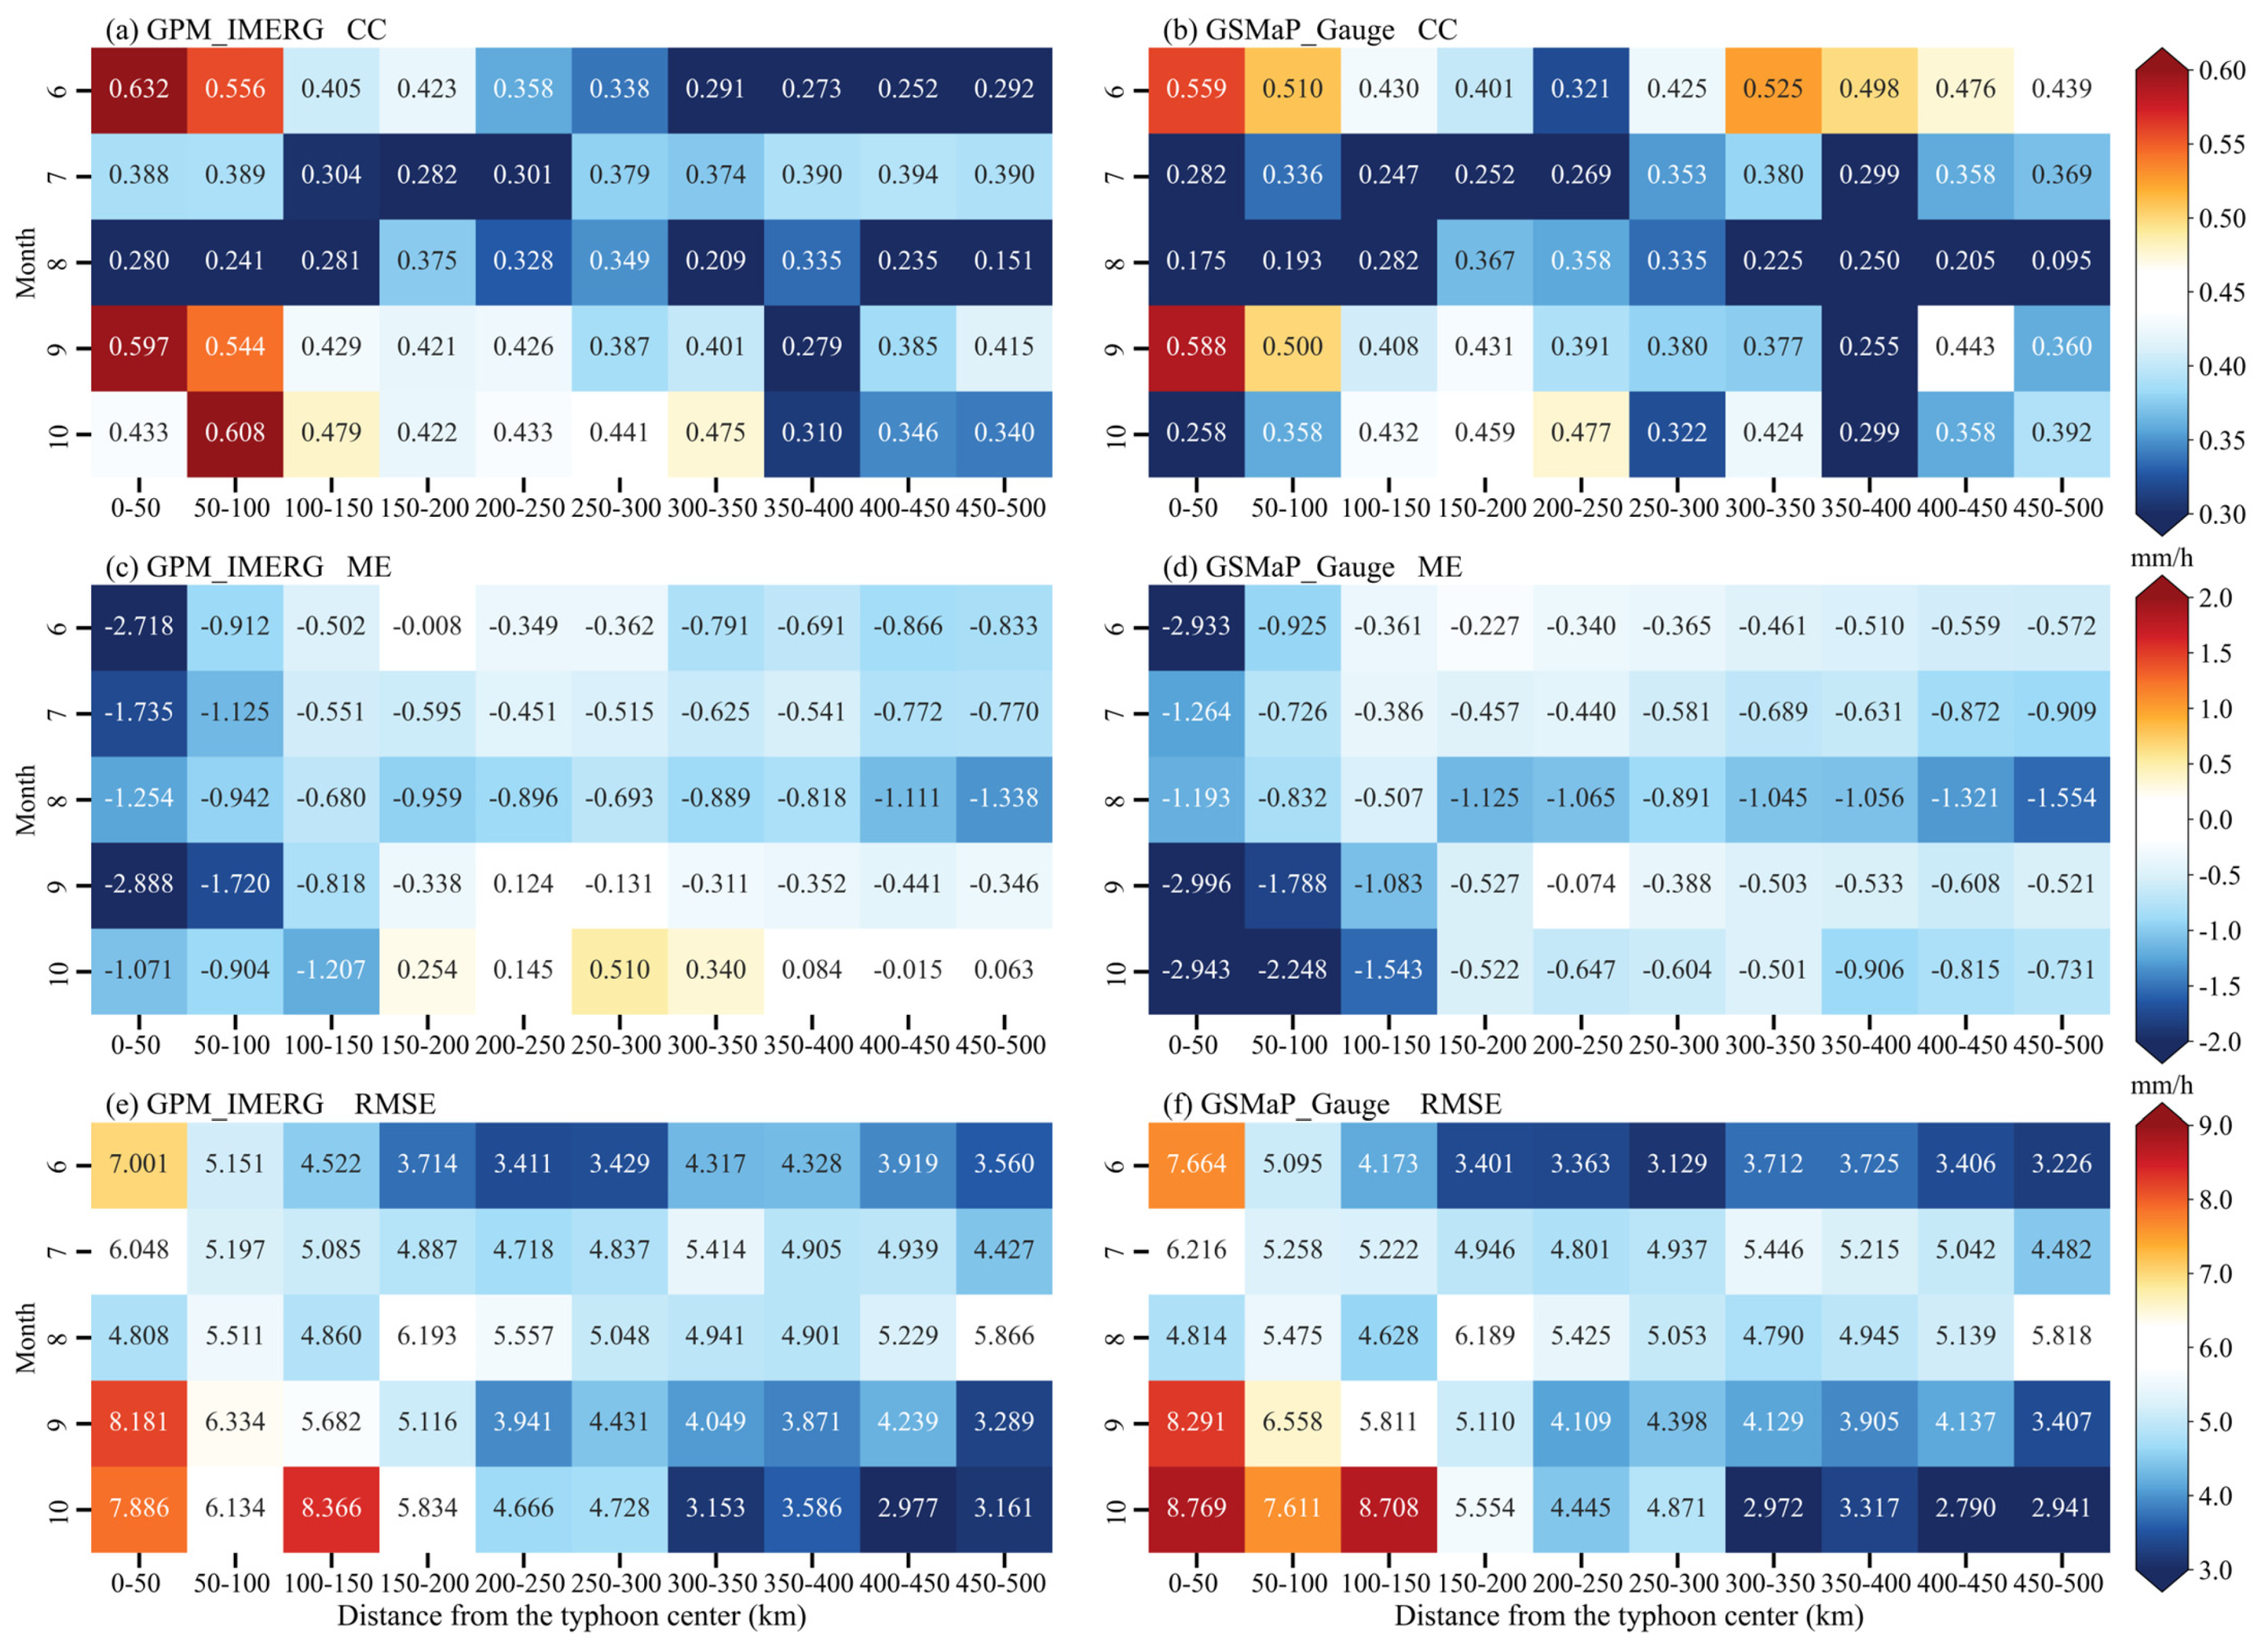
To further investigate the monthly variation characteristics of spatial error distributions for GPM_IMERG and GSMaP_Gauge, Figure 12a,b present heatmaps of correlation coefficients between the two satellite precipitation products and OBS across 50 km stratified layers from 0 to 500 km relative to typhoon centers during June–October. As illustrated, both products exhibit similar correlation coefficient distribution patterns, with smaller values in July–August and larger values in June and September within the 0–100 km region. However, GPM_IMERG also demonstrates larger correlation coefficients in October, whereas GSMaP_Gauge shows smaller values in this month. For mean bias (Figure 12c,d), except for positive GPM_IMERG values within 150–400 km in October, both products exhibit negative values across all months and distances. Notably, mean bias and correlation coefficient distributions within 0–100 km display inverse characteristics for both products: smaller negative bias values in July–August correspond to smaller correlation coefficients, while larger negative bias values in June and September correspond to larger correlation coefficients. For RMSE (Figure 12e,f), similar distribution patterns are observed, primarily exhibiting a spatial pattern of high values in the inner core and low values in the outer region. However, RMSE variation with distance is relatively small in July and August. A seasonal peak in autumn is also evident: within 0–150 km, maximum RMSE values for both GPM_IMERG and GSMaP_Gauge occur in September and October, indicating larger errors in the typhoon inner-core region during autumn.
In summary, the heatmap analysis reveals significant seasonal effects on the continuous statistical performance of satellite precipitation products for typhoon rainfall. Both GPM_IMERG and GSMaP_Gauge maintain relatively high spatial correlation in the inner-core region during June and September (CC > 0.55), but this is accompanied by severe underestimation of heavy precipitation (ME < −2.7 mm/h) and extremely high errors (RMSE > 7.0 mm/h). GSMaP_Gauge consistently exhibits larger negative ME magnitudes than GPM_IMERG in the inner-core region, with discrepancies reaching 1.5–2.0 mm/h. August represents a common performance trough for both products, reflecting the retrieval difficulty of extremely complex precipitation structures during midsummer typhoons. The most severe performance collapse occurs in October, indicating that GSMaP_Gauge’s gauge calibration exhibits significantly weaker seasonal adaptability to typhoon precipitation than GPM_IMERG’s multi-satellite merging algorithm. Notably, GPM_IMERG exhibits a rare positive ME reversal (0.1–0.5 mm/h) in the mid-distance region during October, whereas GSMaP_Gauge maintains systematic negative bias across all distances, suggesting directional drift in gauge calibration for autumn typhoons. For operational applications, dynamic correction based on convective intensity is recommended for heavy precipitation in the typhoon inner-core region during June and September, to ensure that retrieved precipitation more accurately reflects actual precipitation intensity.

3.4.3. Diurnal Variation Characteristics of Spatial Error Distributions

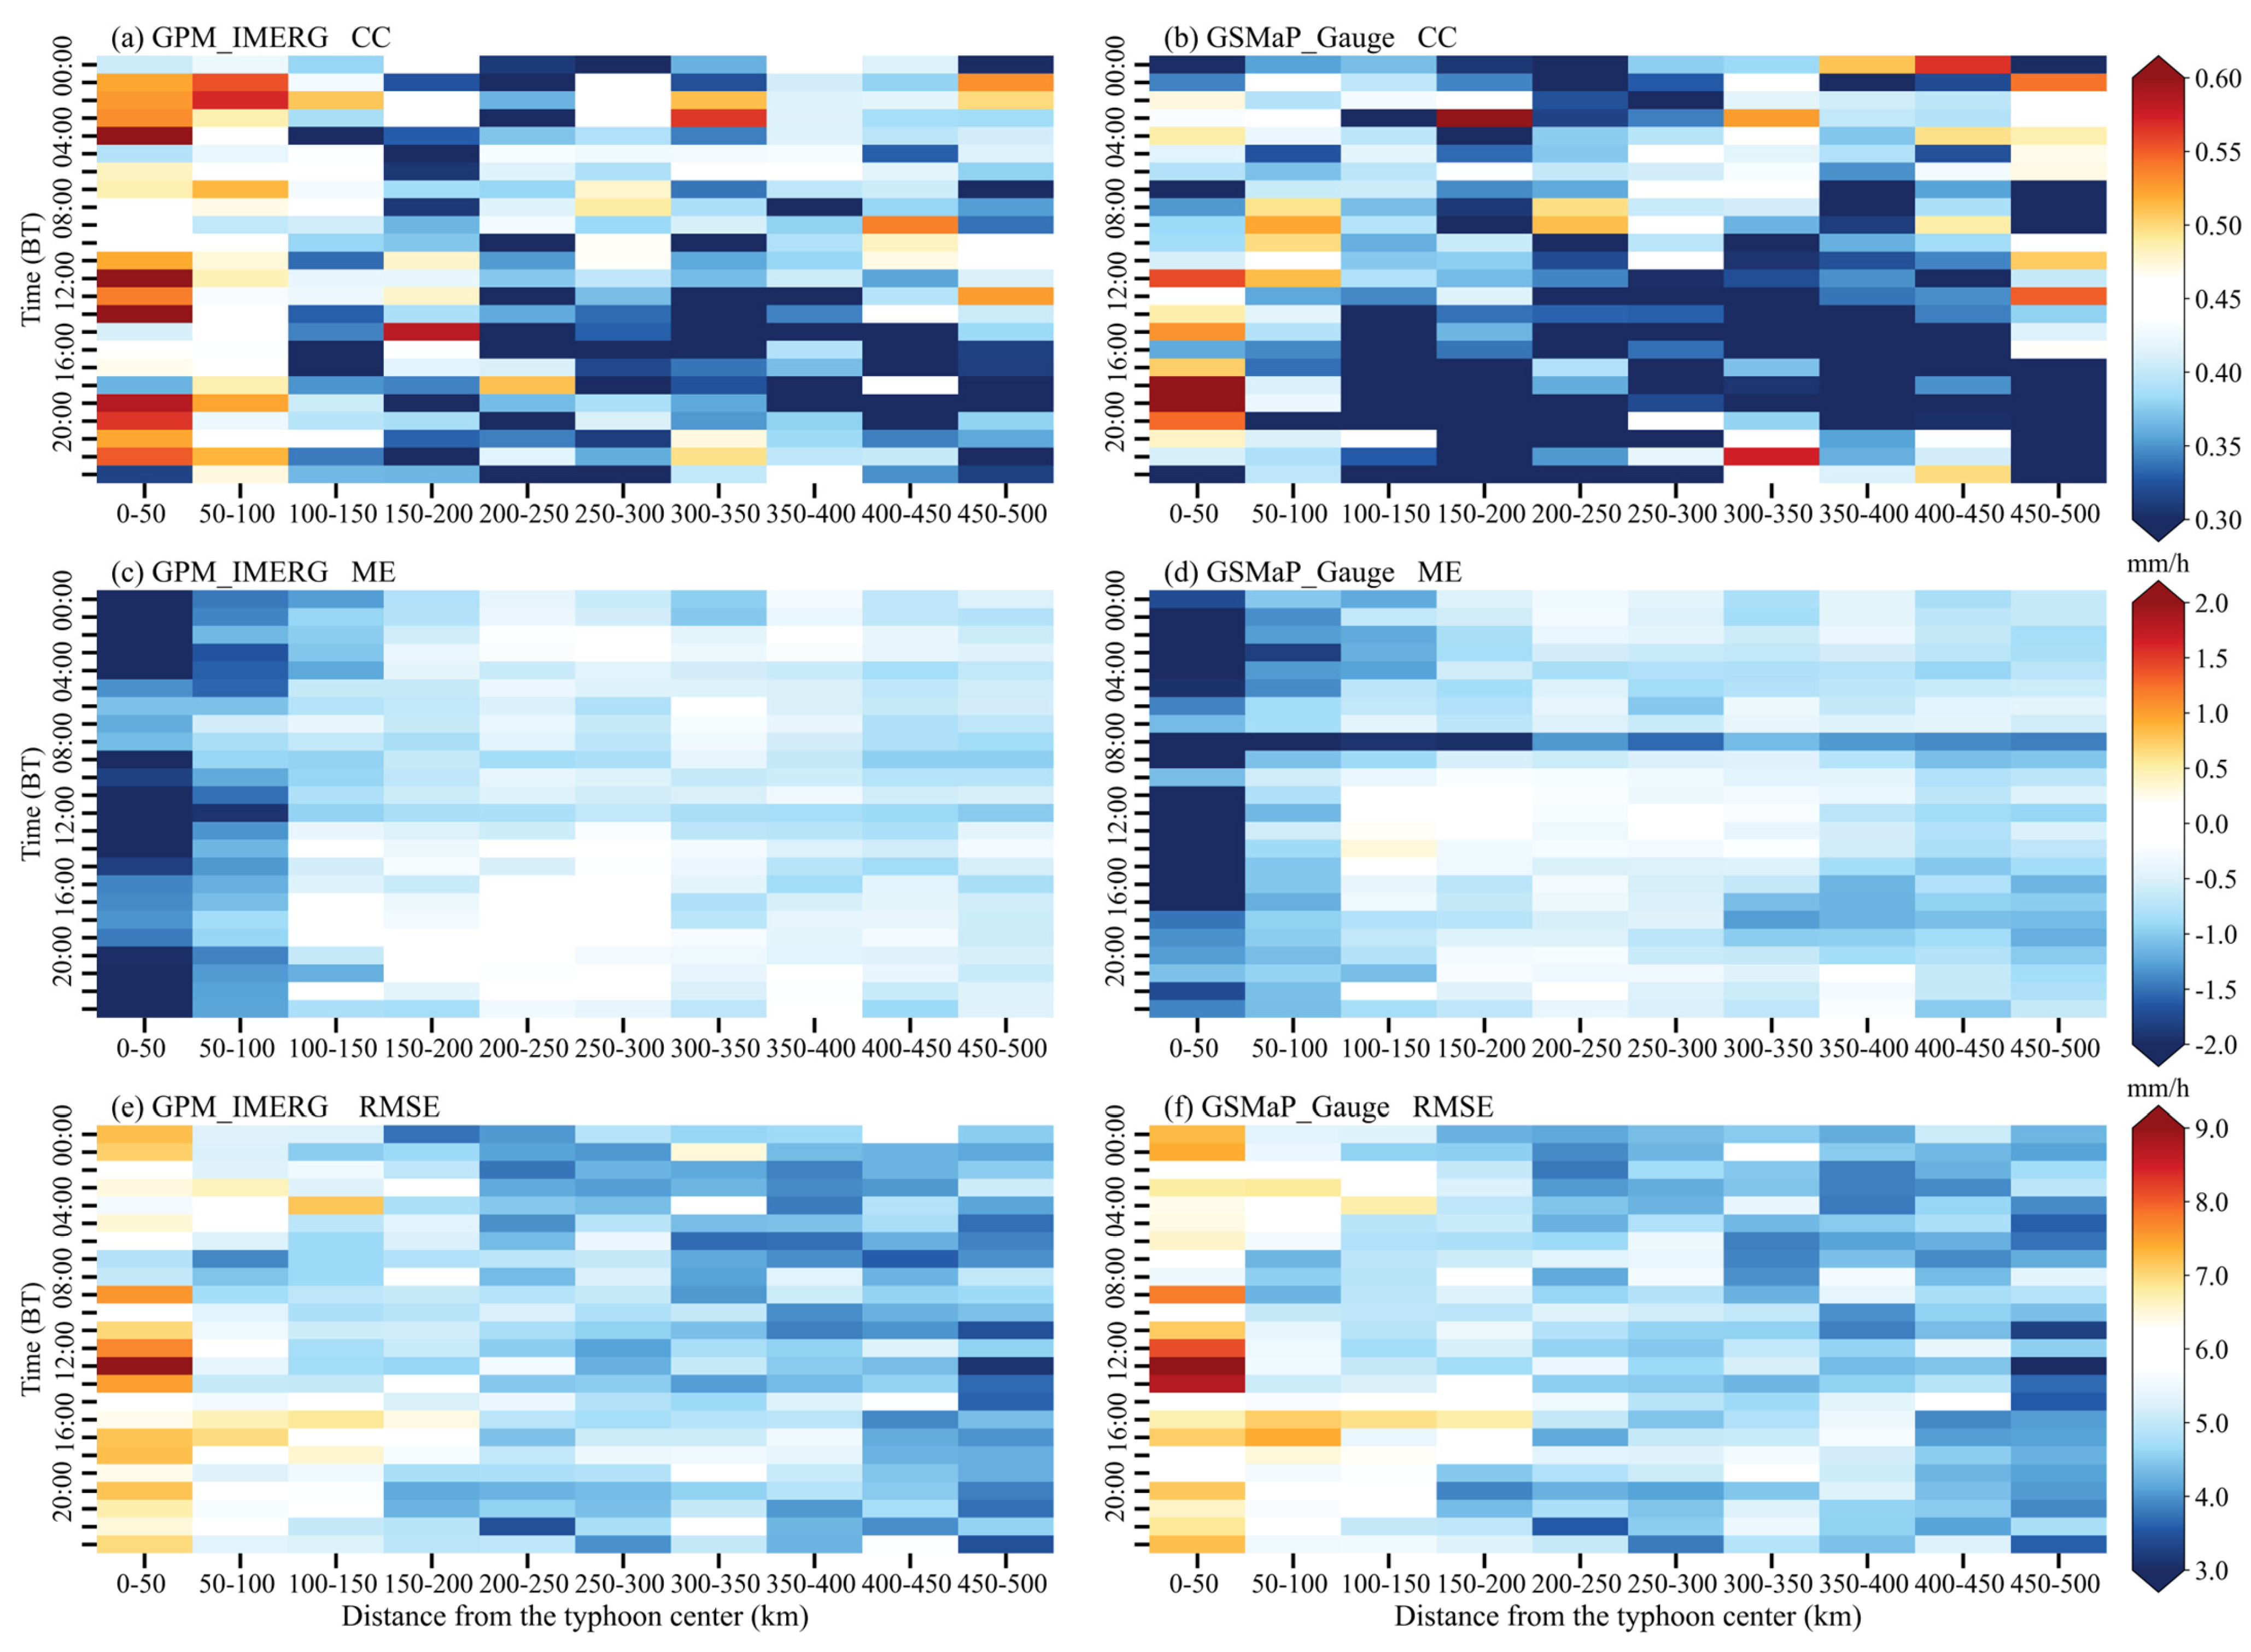
Figure 13 presents hourly diurnal heatmaps of CC (Figure 13a,b), ME (Figure 13c,d), and RMSE (Figure 13e,f) for GPM_IMERG and GSMaP_Gauge across 50 km stratified layers from 0 to 500 km relative to typhoon centers during typhoon precipitation periods from 2021 to 2025. From the CC heatmaps, GPM_IMERG and GSMaP_Gauge exhibit relatively consistent diurnal variation characteristics within 100–500 km, with smaller CCs from afternoon (12:00) to midnight (00:00). However, in the typhoon inner-core region within 0–50 km, their diurnal patterns diverge. GSMaP_Gauge shows high correlation value zones primarily from afternoon (12:00) to evening (20:00), with smaller CCs from midnight (00:00) to noon (12:00). In contrast, GPM_IMERG displays a “three-peak–two-valley” distribution, with peak correlation around noon (12:00) and valleys during early morning (04:00–10:00) and afternoon (14:00–18:00).
For ME (Figure 13c,d), both products show relatively similar distributions. GPM_IMERG exhibits systematic negative bias across all time periods and distances from the typhoon center. GSMaP_Gauge also shows predominantly negative values, except for positive values at 13:00–14:00 within 100–150 km, indicating that systematic underestimation is manifested not only in monthly characteristics but at every hourly time step. The mean bias distributions are generally consistent between the two products, with large values concentrated in the high correlation zones within 0–50 km of the typhoon center. Larger negative bias values occur within 0–100 km, while values from 100 to 500 km are comparable, indicating that large systematic negative deviations are primarily concentrated in the typhoon inner-core region of heavy precipitation.
For RMSE (Figure 13e,f), both products exhibit relatively consistent distributions, showing markedly higher values in the 0–50 km inner-core region, followed by increasing trends with distance in the 100–500 km mid-to-outer region, reflecting distance-dependent variation characteristics in the outer region. In the 0–50 km inner-core region, pronounced diurnal variation is also evident, displaying the same “three-peak–two-valley” pattern as GPM_IMERG’s CC, with peak values primarily occurring during afternoon (12:00–14:00).
In summary, the hourly diurnal heatmap analysis reveals significant diurnal–distance asymmetric characteristics in the continuous statistical performance of satellite precipitation products for typhoon rainfall. Both products exhibit high CCs in the typhoon inner-core region, yet with concurrently large errors. In the outer region beyond 300 km, although RMSE values are relatively small, CC remains below 0.40 throughout the day with negative ME, indicating poor overall reliability. For operational applications, it is recommended to prioritize GPM_IMERG data during afternoon-to-evening hours for typhoon inner-core region analysis, while exercising conservative use of nighttime-to-early morning data. For GSMaP_Gauge, the “calibration vacuum period” around 08:00 BT should be avoided, and upward correction of precipitation intensity during afternoon hours is necessary to eliminate the conservative bias introduced by gauge calibration. Finally, to ensure the reliability of our statistical results, we computed the bootstrap 95% confidence intervals for the performance metrics (see Table S1 in the Supplementary Materials).

4. Discussion

The systematic underestimation of typhoon rainfall identified in this study may be consistent with the known limitations of passive microwave retrieval algorithms, particularly under extreme convective conditions, where brightness temperatures of high-frequency channels approach saturation and ice-phase scattering signatures become ambiguous, leading to more severe underestimation of typhoon rainfall [29,30,31]. A particularly noteworthy finding is that both products exhibit near-complete failure in detecting extreme precipitation (threshold ≥ 12.0 mm/h, 95th percentile), with over 60% of extreme events entirely missed (POD < 0.40; BIAS < 0.40). This has critical implications for hydrological modeling. Satellite precipitation products are increasingly employed as forcing data for distributed hydrological models, particularly in regions where gauge networks are sparse or data are scarce. The severe compression of heavy precipitation signals documented herein indicates that direct use of uncorrected GPM_IMERG or GSMaP_Gauge data in hydrological models may compromise the accuracy and reliability of the results. This underscores the necessity of establishing dynamic bias correction frameworks that account for storm intensity, distance from the typhoon center, and seasonal atmospheric circulation backgrounds. Future research will explore the development of dynamic error models based on three-dimensional stratification of “distance–season–diurnal phase.”
However, several limitations of this study warrant acknowledgment. Limitations related to validation design: First, the reliance on gauge observations as ground truth introduces gauge undercatch, particularly in coastal and mountainous regions where gauge undercatch during high-wind conditions can reach 20–50% [12], potentially masking the true magnitude of satellite underestimation, and station density is uneven across the study domain, with sparse networks in Western and Northern China and denser coverage in the east and south. Consequently, the validation is spatially biased toward regions with more gauges, and the reported statistics may not fully represent satellite performance in data-sparse areas. Second, the 50 km annular stratification, while physically motivated, may oversimplify the asymmetric precipitation structure of landfalling typhoons influenced by terrain and environmental wind shear; future studies should employ storm-relative quadrants to distinguish upslope/downslope and upshear/downshear sectors [27]. Third, the exclusion of two late-2025 typhoons due to IMERG data availability constraints, though necessary for temporal consistency, may slightly bias the sample toward earlier-season storms. Fourth, this study employs post-processed, gauge-corrected products (GPM_IMERG and GSMaP_Gauge) rather than real-time precipitation products, which typically become available only several months after observation. While these products offer higher accuracy due to additional calibration and quality control procedures, their delayed availability limits direct applicability to operational typhoon monitoring and real-time flood forecasting. The performance of real-time products (e.g., IMERG Early and GSMaP_NOW) may differ substantially from the results presented herein, particularly regarding extreme precipitation detection where temporal lag has been identified as a primary limiting factor. Future work should validate real-time products against the findings of this study to assess their operational utility for disaster warning systems. Fifth, the relatively short study period (2021–2025, encompassing 32 landfalling typhoons) may not fully capture long-term interannual variability in typhoon rainfall characteristics. Sixth, the assignment of typhoon-center positions to hourly intervals using the nearest 3 h best-track position introduces potential positional uncertainty, particularly for fast-moving storms. Although linear interpolation between consecutive positions would provide more accurate intermediate locations, the present study does not account for this positional uncertainty, given the relatively slow translation speeds of landfalling typhoons (typically <20 km/h) and the 50 km width of our annular stratification bins. Future studies should systematically compare nearest-neighbor and linear interpolation approaches to quantify this effect and optimize the spatial-matching methodology.
Limitations related to satellite-retrieval algorithms: It should be noted that the gauge-correction procedures of GPM_IMERG and GSMaP_Gauge employ GPCC monthly-scale and CPC daily-scale rain gauge data, respectively, which partially overlap with the CMA hourly observations used as reference in this study. This overlap may compromise the independence of validation results to a certain extent. While the temporal scale mismatch substantially reduces direct dependence, and previous studies have demonstrated overall high consistency in such evaluations [41], rigorous quantification of this effect would require access to the proprietary gauge station lists and weighting schemes used in the correction algorithms, which are not publicly available. This potential influence of gauge data dependence remains a limitation of our validation framework. Additionally, this assessment is confined to Continental China; the performance over offshore islands and the pre-landfall marine environment—critical for early warning—remains unexamined. Future work should integrate multi-source references, including coastal radar networks and crowd-sourced observations, to reduce gauge dependency, and develop machine learning-based dynamic correction schemes that incorporate distance, season, and diurnal phase as explicit predictors to operationalize these findings for hydrological and disaster management applications.

5. Conclusions

This study performs applicability assessment of GPM_IMERG and GSMaP_Gauge hourly precipitation products for typhoon rainfall over Mainland China, utilizing hourly rain gauge observations from CMA national basic meteorological stations as the evaluation reference. Thirty-two landfalling typhoons in China during 2021–2025 were selected as research subjects, and multiple statistical metrics were applied to comprehensively evaluate the errors of GPM_IMERG and GSMaP_Gauge hourly precipitation products at varying distances from typhoon centers, as well as their monthly and diurnal variation characteristics for light rain and extreme precipitation detection. The following conclusions are drawn:
(1)
Overall accuracy assessment: Both GSMaP_Gauge and GPM_IMERG exhibit systematic underestimation of landfalling typhoon precipitation over Mainland China during 2021–2025, with GSMaP_Gauge demonstrating more severe underestimation than GPM_IMERG that intensifies nonlinearly with increasing precipitation intensity. Consistent with the known limitations of passive microwave retrieval algorithms, previous studies have similarly reported systematic underestimation of these products in typhoon and extreme precipitation events. Specifically, ME values for both products are negative (GPM_IMERG, −0.59; GSMaP_Gauge, −0.70), with GSMaP_Gauge exhibiting larger absolute negative bias; in the observed rainfall intensity interval exceeding 5 mm/h, the linear fitted slopes for both products (GPM_IMERG, 0.15; GSMaP_Gauge, 0.29) are significantly lower than those below 5 mm/h (0.62 and 0.67), and both are substantially below unity; the frequency of observed rainfall intensities exceeding 15 mm/h in GPM_IMERG and GSMaP_Gauge is less than one-third of observations, indicating severe compression of heavy precipitation signals.
(2)
Overall spatiotemporal distribution assessment: The spatial distributions of mean hourly typhoon precipitation intensity from both products exhibit significant heterogeneity: widespread systematic overestimation occurs in North China, while underestimation dominates elsewhere, with magnitude increasing with rainfall intensity, persisting across the vast majority of months. Spatial difference distributions reveal predominantly negative values, except in North China, with the 75th percentile approaching zero; large negative bias values are concentrated in high-observation regions (Huang-Huai, Jiang-Huai, and coastal East and South China). Monthly mean difference sequences show predominantly negative values across most months, with GSMaP_Gauge demonstrating more prominent persistent negative bias than GPM_IMERG, except for sporadic positive bias anomalies in individual months.
(3)
Discrimination capability for light rain and extreme precipitation: Both products demonstrate acceptable discrimination capability for light rain (threshold 1.0 mm/h); however, their discrimination capability for extreme precipitation (threshold 12.0 mm/h, corresponding to the 95th percentile of observations) is very poor, with GPM_IMERG marginally superior to GSMaP_Gauge. For light rain, within the 0–150 km inner-core region, CSI reaches 0.60–0.65, POD reaches 0.72–0.78, and FAR is controlled within 0.18–0.25, indicating acceptable hit capability and reliability. For extreme precipitation, CSI plummets to 0.00–0.36 across all distances, POD drops to 0.00–0.42, FAR surges to 0.29–1.00, and BIAS is generally below 0.40, with over 60% of extreme precipitation events completely missed. Although GPM_IMERG exhibits sporadic relatively high values in the 0–50 km inner-core region during June and October (CSI 0.32–0.36, POD 0.38–0.42), it still outperforms GSMaP_Gauge, whose CSI and POD values are markedly lower throughout June–October.
(4)
Spatiotemporal error distribution characteristics: Errors in both products exhibit significant distance dependence and spatiotemporal non-stationarity. Distance: The characteristic of error attenuation with increasing distance is pronounced within the 0–100 km inner-core region, while this feature weakens in the 100–500 km mid-to-long distance range, with CC and RMSE displaying a “high correlation–high error, low correlation–low error” pattern. Season: In the 0–100 km inner-core region, June and September exhibit higher CC (0.56–0.63) but extremely large RMSE (7.0–8.3 mm/h), while August shows CC collapse (0.15–0.38) with relatively reduced RMSE, presenting an asymmetric seasonal pattern of “high correlation accompanied by high error; low correlation accompanied by low error.” Diurnal: In the 0–50 km inner-core region, errors display a “three-peak–two-valley” distribution, with peak error periods in the afternoon (12:00–14:00 BT), early morning (00:00–04:00 BT), and evening (20:00–00:00 BT); therefore, data during afternoon convective active periods and nighttime require cautious application.
This study conducted error verification and assessment of GSMaP_Gauge and GPM_IMERG for typhoon precipitation over Mainland China during landfalling typhoon impact periods, finding that both satellite precipitation datasets perform well in estimating light-intensity typhoon precipitation but poorly when typhoon precipitation intensity is strong, suggesting that relevant algorithms may require further refinement. Future research should explore the development of dynamic error models based on three-dimensional stratification of “distance–season–diurnal phase,” including machine learning-based approaches (e.g., random forest and spatiotemporal bias correction) that leverage auxiliary environmental variables to predict biases in a context-specific manner. Nevertheless, the effectiveness of such corrections for typhoon extreme precipitation remains fundamentally constrained by the physical limitations of satellite remote sensing. Therefore, although bias correction can improve the overall statistical performance of these products, caution is still required when applying corrected data to hydrological modeling.

Supplementary Materials

The following supporting information can be downloaded at: https://www.mdpi.com/article/10.3390/rs18162735/s1, Table S1: Bootstrap 95% confidence intervals (10,000 resamples) for categorical and statistical performance metrics of GPM_IMERG and GSMaP_Gauge at precipitation thresholds of 1.0 mm/h and 12.0 mm/h (0–500 km radial range).

Author Contributions

Conceptualization, Z.Y.; methodology, Z.Y. and Y.C.; validation, Y.C. and G.Y.; formal analysis, Y.C. and G.Y.; resources, Z.Y. and S.H.; data curation, Z.Y. and G.Y.; writing—original draft preparation, Z.Y. and Y.C.; writing—review and editing, Z.Y. and Y.C.; visualization, Z.Y. and Y.C.; project administration, Z.Y. and S.H.; funding acquisition, Z.Y. All authors have read and agreed to the published version of the manuscript.

Funding

This work was supported in part by the National Natural Science Foundation of China under Grant U2342202; in part by Meteorological Science and Technology Planning Program of Zhejiang under Grants 2023ZD14 and 2024ZDZL07; and in part by “Pioneer” and “Leading Goose” R&D Program of Zhejiang under Grant 2024C03255.

Data Availability Statement

The URLs for downloading the satellite precipitation data are contained within this article. The gauge data in this study are available upon request from the corresponding author.

Acknowledgments

We acknowledge the High-Performance Computing Center of Nanjing University of Information Science and Technology for their support of this work. Special thanks go to the China Meteorological Administration for providing the ground-based precipitation data, the NASA science team for their efforts in providing accessibility to GPM_IMERG precipitation data, and the JAXA science team for their efforts in providing accessibility to GSMaP_Gauge precipitation data.

Conflicts of Interest

The authors declare no conflicts of interest.

References

  1. Yang, C.; Shi, B.; Min, J. The Combination Application of FY-4 Satellite Products on Typhoon Saola Forecast on the Sea. Remote Sens. 2024, 16, 4105. [Google Scholar] [CrossRef] [Scilit]
  2. Yu, H.; Chen, L. Impact assessment of landfalling tropical cyclones: Introduction to the special issue. Front. Earth Sci. 2019, 13, 669–671. [Google Scholar] [CrossRef] [Scilit]
  3. Li, Y.; Zhao, S.; Zhao, D.; Gao, G.; Xu, H.; Jiang, Y. Changes in tropical cyclone disasters over China during 2001–2020. Earth Space Sci. 2023, 10, e2022EA002795. [Google Scholar] [CrossRef] [Scilit]
  4. Xie, C.; Huang, Y.; Xu, C.; Dai, K.; Xu, X. Over 100,000 landslides triggered by typhoon-induced rainfall in North China in July 2023. Landslides 2026, 23, 1389–1408. [Google Scholar] [CrossRef] [Scilit]
  5. Li, Y.; Zhao, S.; Wang, G. Spatiotemporal Variations in Meteorological Disasters and Vulnerability in China During 2001–2020. Front. Earth Sci. 2021, 9, 789523. [Google Scholar] [CrossRef] [Scilit]
  6. Which Countries Have Had the Most Tropical Cyclones Hits? Frequently Asked Questions NOAA AOML. Available online: http://www.aoml.noaa.gov/hrd-faq/#most-hit-countries (accessed on 14 June 2026).
  7. Ren, F.; Wu, G.; Dong, W.; Wang, X.; Wang, Y.; Ai, W.; Li, W. Changes in tropical cyclone precipitation over China. Geophys. Res. Lett. 2006, 33, L20702. [Google Scholar] [CrossRef] [Scilit]
  8. Jiang, H.; Zipser, E.J. Contribution of Tropical Cyclones to the Global Precipitation from Eight Seasons of TRMM Data: Regional, Seasonal, and Interannual Variations. J. Clim. 2010, 23, 1526–1543. [Google Scholar] [CrossRef] [Scilit]
  9. Knutson, T.; Camargo, S.J.; Chan, J.C.L.; Emanuel, K.; Ho, C.; Kossin, J.; Mohapatra, M.; Satoh, M.; Sugi, M.; Walsh, K.; et al. Tropical Cyclones and Climate Change Assessment: Part II: Projected Response to Anthropogenic Warming. Bull. Am. Meteor. Soc. 2020, 101, E303–E322. [Google Scholar] [CrossRef] [Scilit]
  10. Emanuel, K. Increasing destructiveness of tropical cyclones over the past 30 years. Nature 2005, 436, 686–688. [Google Scholar] [CrossRef] [Scilit] [PubMed]
  11. Wang, Z.; Yang, J.; Chen, F.; Liu, Y.; Shi, L. Characterizing the Macro and Micro Properties of Precipitation during the Landfall of Typhoon Lekima by Using GPM Observations. Remote Sens. 2024, 16, 2765. [Google Scholar] [CrossRef] [Scilit]
  12. Xu, M.; Tan, Y.; Shi, C.; Xing, Y.; Shang, M.; Wu, J.; Yang, Y.; Du, J.; Bai, L. Spatiotemporal Patterns of Typhoon-Induced Extreme Precipitation in Hainan Island, China, 2000–2020, Using Satellite-Derived Precipitation Data. Atmosphere 2024, 15, 891. [Google Scholar] [CrossRef] [Scilit]
  13. Zhang, E.; Su, H.; Chan, P.W.; Zhai, C.; Zhou, W.; Xu, W.; Hu, M.; Li, X.; Jia, Y.; Song, Y. Deep learning-based multisource satellite data fusion and downscaling for tropical cyclone wind fields. J. Geophys. Res. Mach. Learn. Comput. 2025, 2, e2025JH000792. [Google Scholar] [CrossRef] [Scilit]
  14. He, L.; Min, J.; Yang, G.; Cao, Y. Contrasting the Effects of X-Band Phased Array Radar and S-Band Doppler Radar Data Assimilation on Rainstorm Forecasting in the Pearl River Delta. Remote Sens. 2024, 16, 2655. [Google Scholar] [CrossRef] [Scilit]
  15. Xu, D.; Yang, G.; Wu, Z.; Shen, F.; Li, H.; Zhai, D. Evaluate Radar Data Assimilation in Two Momentum Control Variables and the Effect on the Forecast of Southwest China Vortex Precipitation. Remote Sens. 2022, 14, 3460. [Google Scholar] [CrossRef] [Scilit]
  16. Kim, D.; Choi, Y.; Seo, M.; Shin, S.; Jeong, H.-J. Short-term Forecasting of Typhoon Rainfall with a Deep-Learning-Based Disaster Monitoring Model. Environ. Data Sci. 2023, 2, e28. [Google Scholar] [CrossRef] [Scilit]
  17. Chen, F.; Li, X. Evaluation of IMERG and TRMM 3B43 Monthly Precipitation Products over Mainland China. Remote Sens. 2016, 8, 472. [Google Scholar] [CrossRef] [Scilit]
  18. Shi, B.; Yang, C.; Min, J.; Sha, L. Impact of a new bias correction predictor for FY-4A AGRI all-sky data assimilation on typhoon forecast. J. Geophys. Res. Atmos. 2023, 128, e2023JD039063. [Google Scholar] [CrossRef] [Scilit]
  19. Shi, B.; Yang, C.; Min, J.Z. Modified observation error inflation scheme for all-sky infrared radiance assimilation based on the model–observation agreement. Adv. Atmos. Sci. 2025, 42, 2333−2351. [Google Scholar] [CrossRef] [Scilit]
  20. Zhong, T.; Yang, C.; Min, J.; Shi, B.; Sun, Q. Added Value of Assimilating FY-4B AGRI Water Vapor Radiances on Analyses and Forecasts for “23 · 7” Heavy Rainfall. Remote Sens. 2025, 17, 3808. [Google Scholar] [CrossRef] [Scilit]
  21. Kummerow, C.; Simpson, J.; Thiele, O.; Barnes, W.; Chang, A.T.C.; Stocker, E.; Adler, R.F.; Hou, A.; Kakar, R.; Wentz, F.; et al. The Status of the Tropical Rainfall Measuring Mission (TRMM) after Two Years in Orbit. J. Appl. Meteor. Climatol. 2000, 39, 1965–1982. [Google Scholar] [CrossRef] [Scilit]
  22. Huffman, G.J.; Bolvin, D.T.; Nelkin, E.J.; Wolff, D.B.; Adler, R.F.; Gu, G.; Hong, Y.; Bowman, K.P.; Stocker, E.F. The TRMM Multisatellite Precipitation Analysis (TMPA): Quasi-Global, Multiyear, Combined-Sensor Precipitation Estimates at Fine Scales. J. Hydrometeor. 2007, 8, 38–55. [Google Scholar] [CrossRef] [Scilit]
  23. Hou, A.Y.; Kakar, R.K.; Neeck, S.; Azarbarzin, A.A.; Kummerow, C.D.; Kojima, M.; Oki, R.; Nakamura, K.; Iguchi, T. The Global Precipitation Measurement Mission. Bull. Am. Meteor. Soc. 2014, 95, 701–722. [Google Scholar] [CrossRef] [Scilit]
  24. Skofronick-Jackson, G.; Petersen, W.A.; Berg, W.; Kidd, C.; Stocker, E.F.; Kirschbaum, D.B.; Kakar, R.; Braun, S.A.; Huffman, G.J.; Iguchi, T.; et al. The Global Precipitation Measurement (GPM) Mission for Science and Society. Bull. Am. Meteor. Soc. 2017, 98, 1679–1695. [Google Scholar] [CrossRef] [Scilit] [PubMed]
  25. Kubota, T.; Aonashi, K.; Ushio, T.; Shige, S.; Takayabu, Y.N.; Kachi, M.; Arai, Y.; Tashima, T.; Masaki, T.; Kawamoto, N.; et al. Global Satellite Mapping of Precipitation (GSMaP) Products in the GPM Era. In Satellite Precipitation Measurement; Levizzani, V., Kidd, C., Kirschbaum, D.B., Kummerow, C.D., Nakamura, K., Turk, F.J., Eds.; Advances in Global Change Research; Springer: Cham, Switzerland, 2020; Volume 67. [Google Scholar] [CrossRef] [Scilit]
  26. Qi, W.; Yong, B.; Gourley, J.J. Monitoring the Super Typhoon Lekima by GPM-Based Near-Real-Time Satellite Precipitation Estimates. J. Hydrol. 2021, 603, 126968. [Google Scholar] [CrossRef] [Scilit]
  27. Jiang, Q.; Li, W.; Fan, Z.; He, X.; Sun, W.; Chen, S.; Wen, J.; Gao, J.; Wang, J. Evaluation of the ERA5 Reanalysis Precipitation Dataset over Chinese Mainland. J. Hydrol. 2021, 595, 125660. [Google Scholar] [CrossRef] [Scilit]
  28. Chen, H.; Wen, D.; Du, Y.; Xiong, L.; Wang, L. Errors of Five Satellite Precipitation Products for Different Rainfall Intensities. Atmos. Res. 2023, 285, 106622. [Google Scholar] [CrossRef] [Scilit]
  29. Prat, O.P.; Nelson, B.R. Mapping the world’s tropical cyclone rainfall contribution over land using the TRMM Multi-satellite Precipitation Analysis. Water Resour. Res. 2013, 49, 7236–7254. [Google Scholar] [CrossRef] [Scilit]
  30. Yang, G.; Xian, Z.; Fu, G. Inspection of IMERG precipitation estimates during Typhoon Cempaka using a new methodology for quantifying and evaluating bias. J. Hydrol. 2023, 620, 129554. [Google Scholar] [CrossRef] [Scilit]
  31. Nguyen, V.D.; Rouzegari, N.; Dao, V.; Almutlaq, F.; Nguyen, P.; Sorooshian, S. Comparative Analysis of Satellite-Based Precipitation Products During Extreme Rainfall from Super Typhoon Yagi in Hanoi, Vietnam (September 2024). Remote Sens. 2025, 17, 1598. [Google Scholar] [CrossRef] [Scilit]
  32. Xiao, L.; Zhang, A.; Min, C.; Chen, S. Evaluation of GPM Satellite-based Precipitation Estimates during Three Tropical-related Extreme Rainfall Events. Plateau Meteorol. 2019, 38, 993–1003. [Google Scholar] [CrossRef]
  33. Chen, A.; Wu, X.; Chu, Z. Refined evaluation of the accuracy of GPM/IMERG in the precipitation process of typhoon Nida. J. Meteorol. Sci. 2021, 41, 678–686. [Google Scholar] [CrossRef]
  34. Chen, S.; Chen, T.; Cao, Y.; Yang, S.; Xie, J. Performance assessment of hourly precipitation products from IMERG and GSMaP over mainland China. Torrential Rain Disasters 2026, 45, 263–276. [Google Scholar] [CrossRef]
  35. Randel, D.L.; Kummerow, C.D.; Ringerud, S. The Goddard Profiling (GPROF) Precipitation Retrieval Algorithm. In Satellite Precipitation Measurement; Levizzani, V., Kidd, C., Kirschbaum, D.B., Kummerow, C.D., Nakamura, K., Turk, F.J., Eds.; Advances in Global Change Research; Springer: Cham, Switzerland, 2020; Volume 67. [Google Scholar] [CrossRef] [Scilit]
  36. Joyce, R.J.; Janowiak, J.E.; Arkin, P.A.; Xie, P. CMORPH: A Method that Produces Global Precipitation Estimates from Passive Microwave and Infrared Data at High Spatial and Temporal Resolution. J. Hydrometeor. 2004, 5, 487–503. [Google Scholar] [CrossRef]
  37. Huffman, G.J.; Bolvin, D.T.; Braun, S.A.; Hsu, K.-L.; Joyce, R.J.; Xie, P. GPM IMERG Final Precipitation L3 Half Hourly 0.1 Degree × 0.1 Degree V07 (GPM_3IMERGHH). NASA Goddard Earth Sci. Data Inf. Serv. Cent. (GES DISC) 2023. [Google Scholar] [CrossRef]
  38. Aonashi, K.; Awaka, J.; Hirose, M.; Kouz, T.; Kubota, T.; Liu, G.; Shige, S.; Kida, S.; Seto, S.; Takahashi, N.; et al. GSMaP passive microwave precipitation retrieval algorithm: Algorithm description and validation. J. Meteorol. Soc. Jpn. 2009, 87A, 119–136. [Google Scholar] [CrossRef] [Scilit]
  39. Shige, S.; Yamamoto, T.; Tsukiyama, T.; Kida, S.; Ashiwake, H.; Kubota, T.; Seto, S.; Aonashi, K.; Okamoto, K. The GSMaP precipitation retrieval algorithm for microwave sounders—Part I: Over-ocean algorithm. IEEE Trans. Geosci. Remote Sens. 2009, 47, 3084−3097. [Google Scholar] [CrossRef]
  40. Su, J.; Lü, H.; Ryu, D.; Zhu, Y. The assessment and comparison of TMPA and IMERG products over the major basins of Mainland China. Earth Space Sci. 2019, 6, 2461–2479. [Google Scholar] [CrossRef] [Scilit]
  41. Zhou, Z.; Guo, B.; Xing, W.; Zhou, J.; Xu, F.; Xu, Y. Comprehensive evaluation of latest GPM era IMERG and GSMaP precipitation products over mainland China. Atmos. Res. 2020, 246, 105132. [Google Scholar] [CrossRef] [Scilit]
  42. Wang, Y.; Li, Z.; Gao, L.; Zhong, Y.; Peng, X. Comparison of GPM IMERG Version 06 Final Run Products and Its Latest Version 07 Precipitation Products across Scales: Similarities, Differences and Improvements. Remote Sens. 2023, 15, 5622. [Google Scholar] [CrossRef] [Scilit]
  43. Sheng, K.; Li, R.; Chen, T.; Wang, L. Temporal and Spatial Variation Characteristics of Seasonal Differences in Extreme Precipitation in China Monsoon Region in the Last 40 Years. Water 2025, 17, 1672. [Google Scholar] [CrossRef] [Scilit]
  44. Qi, W.; Huang, R.; Cai, Y.; Tan, Q. Extreme Flood Intensification in the Pearl River Basin in the Future under 1.5°C, 2.0°C, and Higher Global Warming Levels. Front. Water 2025, 7, 1624694. [Google Scholar] [CrossRef] [Scilit]
  45. Wang, Y.; Liu, W.; Chen, C.; Li, X.; Liu, B.; Du, P.; Sheng, S. GIS-Based Risk Assessment of Typhoon Disasters in Coastal Provinces of China. Front. Mar. Sci. 2025, 12, 1548763. [Google Scholar] [CrossRef] [Scilit]
  46. Bartsotas, N.S.; Anagnostou, E.N.; Nikolopoulos, E.I.; Kallos, G. Investigating Satellite Precipitation Uncertainty over Complex Terrain. J. Geophys. Res. Atmos. 2018, 123, 5346–5359. [Google Scholar] [CrossRef] [Scilit]
  47. Dare, R.A.; Davidson, N.E.; McBride, J.L. Tropical Cyclone Contribution to Rainfall over Australia. Mon. Weather Rev. 2012, 140, 3606–3619. [Google Scholar] [CrossRef] [Scilit]
  48. Rodgers, E.B.; Adler, R.F.; Pierce, H.F. Contribution of Tropical Cyclones to the North Pacific Climatological Rainfall as Observed from Satellites. J. Appl. Meteor. Climatol. 2000, 39, 1658–1678. [Google Scholar] [CrossRef] [PubMed]
  49. Rodgers, E.B.; Adler, R.F.; Pierce, H.F. Contribution of Tropical Cyclones to the North Atlantic Climatological Rainfall as Observed from Satellites. J. Appl. Meteor. Climatol. 2001, 40, 1785–1800. [Google Scholar] [CrossRef] [Scilit]
  50. Larson, J.; Zhou, Y.; Higgins, R.W. Characteristics of Landfalling Tropical Cyclones in the United States and Mexico: Climatology and Interannual Variability. J. Clim. 2005, 18, 1247–1262. [Google Scholar] [CrossRef] [Scilit]
  51. Kim, J.-H.; Ho, C.-H.; Lee, M.-H.; Jeong, J.-H.; Chen, D. Large increase in heavy rainfall associated with tropical cyclone landfalls in Korea after the late 1970s. Geophys. Res. Lett. 2006, 33, L18706. [Google Scholar] [CrossRef] [Scilit]
  52. Lee, M.; Ho, C.; Kim, J. Influence of tropical cyclone landfalls on spatiotemporal variations in typhoon season rainfall over South China. Adv. Atmos. Sci. 2010, 27, 443–454. [Google Scholar] [CrossRef] [Scilit]
  53. Abdelrazaq, A.S.; Alnuaimi, H.A.; Baig, F.; Elkollaly, M.; Sherif, M. Benchmarking MSWEP Precipitation Accuracy in Arid Zones Against Traditional and Satellite Measurements. Remote Sens. 2026, 18, 95. [Google Scholar] [CrossRef] [Scilit]
  54. Tian, F.; Hou, S.; Yang, L.; Hu, H.; Hou, A. How Does the Evaluation of the GPM IMERG Rainfall Product Depend on Gauge Density and Rainfall Intensity? J. Hydrometeor. 2018, 19, 339–349. [Google Scholar] [CrossRef] [Scilit]
  55. Lu, D.; Yong, B. Evaluation and Hydrological Utility of the Latest GPM IMERG V5 and GSMaP V7 Precipitation Products over the Tibetan Plateau. Remote Sens. 2018, 10, 2022. [Google Scholar] [CrossRef] [Scilit]
  56. Prakash, S.; Mitra, A.K.; AghaKouchak, A.; Liu, Z.; Norouzi, H.; Pai, D.S. A preliminary assessment of GPM-based multi-satellite precipitation estimates over a monsoon dominated region. J. Hydrol. 2018, 556, 865–876. [Google Scholar] [CrossRef] [Scilit]
  57. Anjum, M.N.; Ding, Y.; Shangguan, D.; Ahmad, I.; Ijaz, M.W.; Farid, H.U.; Yagoub, Y.E.; Zaman, M.; Adnan, M. Performance Evaluation of Latest Integrated Multi-Satellite Retrievals for Global Precipitation Measurement (IMERG) over the Northern Highlands of Pakistan. Atmos. Res. 2018, 205, 134–146. [Google Scholar] [CrossRef] [Scilit]
Figure 1. Intensity and track of Typhoon 2516 (Tapah) from the CMA tropical cyclone best-track dataset. Green dots denote Tropical Depression (TD), cyan dots Tropical Storm (TS), blue dots Severe Tropical Storm (STS), yellow dots Typhoon (TY), orange dots Severe Typhoon (STY), and red dots Super Typhoon (SuperTY). The green dot indicates the genesis position, and the red square indicates the dissipation position. Distribution of national meteorological station 1 h precipitation (squares) at 08:00 BT on 9 September 2025; the red star denotes the typhoon center position at this time, and the black dashed circle represents a 500 km radius centered on the typhoon center. Precipitation within the circle classified as typhoon precipitation is shown in colored squares.
Remotesensing 18 02735 g001
Figure 2. (a) Frequency distribution of hourly rainfall intensity for typhoon precipitation from OBS, GPM_IMERG, and GSMaP_Gauge products during 2021–2025. The nested bar chart in the upper right corner shows the frequency distribution for higher rainfall intensities of [15.0, 20.0) mm/h and [20.0, …) mm/h. The inset table indicates the total number of stations for each product. The PCT95 value (12.0 mm/h) represents the 95th percentile of hourly rainfall intensity. (b) Taylor diagram comparing the GPM_IMERG and GSMaP_Gauge hourly rainfall intensity for typhoon precipitation against OBS. The radial distance from the origin denotes the SD, the azimuthal angle represents the CC, and the distance from each product marker to the observation reference point (OBS, red dot) indicates the centered RMSE.
Remotesensing 18 02735 g002
Figure 3. Scatter density plots of hourly rainfall intensity for typhoon precipitation between OBS and (a) GPM_IMERG and (b) GSMaP_Gauge products during 2021–2025. (The brown line denotes the linear fit for OBS at 0–5 mm/h, and the red line denotes the linear fit for OBS > 5 mm/h.)
Remotesensing 18 02735 g003
Figure 4. Spatial distribution of (a) mean hourly rainfall intensity for typhoon precipitation from OBS, and (b,c) differences in mean rainfall intensity between GPM_IMERG (b) and GSMaP_Gauge (c) products and OBS for typhoon precipitation during 2021–2025. (Values labeled in the lower-left corner of each panel; PCT05, PCT25, PCT50, PCT75, and PCT95, represent the 5th, 25th, 50th, 75th, and 95th percentile values, respectively).
Remotesensing 18 02735 g004
Figure 5. (a) Monthly mean hourly rainfall intensity of typhoon precipitation from OBS (red line), GPM_IMERG (blue line), and GSMaP_Gauge (green line) during 2021–2025. (b) Differences in monthly mean hourly rainfall intensity between GPM_IMERG and OBS (blue line), and between GSMaP_Gauge and OBS (green line).
Remotesensing 18 02735 g005
Figure 6. Box plots of (a) CSI, (b) POD, (c) BIAS, and (d) FAR scores for typhoon precipitation from GPM_IMERG and GSMaP_Gauge hourly products at 50 km intervals from 0 to 500 km from the typhoon center during 2021–2025, with a rainfall threshold of 1 mm/h. Each box plot summarizes the distribution across all available station-hours pairs within the corresponding distance interval, pooled across all 32 typhoon events, with green diamonds indicating the mean values.
Remotesensing 18 02735 g006
Figure 7. Heatmaps of (a,b) CSI, (c,d) POD, (e,f) FAR, and (g,h) BIAS for typhoon precipitation from GPM_IMERG (a,c,e,g) and GSMaP_Gauge (b,d,f,h) hourly products at 50 km intervals from 0 to 500 km from the typhoon center during June–October 2021–2025, with a rainfall threshold of 1 mm/h.
Remotesensing 18 02735 g007
Figure 8. Hourly heatmaps of (a,b) CSI, (c,d) POD, (e,f) FAR, and (g,h) BIAS for typhoon precipitation from GPM_IMERG (a,c,e,g) and GSMaP_Gauge (b,d,f,h) products at 50 km intervals from 0 to 500 km from the typhoon center during 2021–2025, with a rainfall threshold of 1 mm/h.
Remotesensing 18 02735 g008
Figure 9. Box plots of (a) CSI, (b) POD, (c) BIAS, and (d) FAR scores for typhoon precipitation from GPM_IMERG and GSMaP_Gauge hourly products at 50 km intervals from 0 to 500 km from the typhoon center during 2021–2025, with a rainfall threshold of 12.0 mm/h. Each box plot summarizes the distribution across all available station-hours pairs within the corresponding distance interval, pooled across all 32 typhoon events, with green diamonds indicating the mean values.
Remotesensing 18 02735 g009
Figure 10. Heatmaps of (a,b) CSI, (c,d) POD, (e,f) FAR, and (g,h) BIAS for typhoon precipitation from GPM_IMERG (a,c,e,g) and GSMaP_Gauge (b,d,f,h) hourly products at 50 km intervals from 0 to 500 km from the typhoon center during June–October 2021–2025, with a rainfall threshold of 12.0 mm/h.
Remotesensing 18 02735 g010
Figure 11. Box plots of (a) CC, (b) ME (mm/h), and (c) RMSE (mm/h) for typhoon precipitation from GPM_IMERG and GSMaP_Gauge hourly products at 50 km intervals from 0 to 500 km from the typhoon center during 2021–2025. Each box plot summarizes the distribution across all available station-hours pairs within the corresponding distance interval, pooled across all 32 typhoon events, with green diamonds indicating the mean values.
Remotesensing 18 02735 g011
Figure 12. Heatmaps of (a,b) CC, (c,d) ME (mm/h), and (e,f) RMSE (mm/h), for typhoon precipitation from GPM_IMERG (a,c,e) and GSMaP_Gauge (b,d,f) hourly products at 50 km intervals from 0 to 500 km from the typhoon center during June–October 2021–2025.
Remotesensing 18 02735 g012
Figure 13. Hourly heatmaps of (a,b) CC, (c,d) ME (mm/h), and (e,f) RMSE (mm/h) for typhoon precipitation from GPM_IMERG (a,c,e) and GSMaP_Gauge (b,d,f) hourly products at 50 km intervals from 0 to 500 km from the typhoon center during 2021–2025.
Remotesensing 18 02735 g013
Table 1. Basic information of satellite precipitation products.
ProductTemporal ResolutionSpatial
Resolution
Spatial
Coverage
Temporal
Coverage
Data
Provider
GPM_IMERG 0.5 h0.1°90°S–90°N1 January 1998–
30 September 2025
NASA
GSMaP_Gauge1 h0.1°60°S–60°N1 January 1998–NowJAXA
Table 2. Typhoon landfall information: 2021 to October 2025.
Name (Number)Landfall TimeName (Number)Landfall TimeName (Number)Landfall Time
2021 2023 Bebinca (2413)09-16 07:30
Koguma (2104)06-12 09:45Talim (2304)07-17 22:20Pulasan (2414)09-19 21:10
In-Fa (2106)07-25 12:30Doksuri (2305)07-28 09:55Krathon (2418)10-03 12:40
Cempaka (2107)07-20 21:50Saola (2309)09-02 03:30Kong-Rey (2421)10-31 14:00
Lupit (2109)08-05 11:20Haikui (2311)09-03 15:30
Lionrock (2117)10-08 22:50Koinu (2314)10-05 08:202025
Kompasu (2118)10-13 15:40Sanba (2316)10-19 09:00Wutip (2501)06-13 23:00
Danas (2504)07-07 00:00
2022 2024 Wipha (2506)07-20 17:50
Chaba (2203)07-02 15:00Maliksi (2402)06-01 00:55Co-May (2508)07-30 04:30
Mulan (2207)08-10 10:50Gaemi (2403)07-25 00:00Podul (2511)08-13 13:00
Ma-On (2209)08-25 10:30Prapiroon (2404)07-22 01:30Tapah (2516)09-08 08:50
Muifa (2212)09-14 20:30Yagi (2411)09-06 16:20Mitag (2517)09-19 14:50
Ragasa (2518)09-24 17:00
Disclaimer/Publisher’s Note: The statements, opinions and data contained in all publications are solely those of the individual author(s) and contributor(s) and not of MDPI and/or the editor(s). MDPI and/or the editor(s) disclaim responsibility for any injury to people or property resulting from any ideas, methods, instructions or products referred to in the content.