Article

Kinematic Mapping and Geomorphological Analysis of Rock Glaciers in the Pirin Mountains (Bulgaria)

1
Institute for Advanced Environmental Research, West University of Timișoara, 300223 Timișoara, Romania
2
Terrasigna, 020581 Bucharest, Romania
3
Gamma Remote Sensing, 3073 Gümligen, Switzerland
4
Climate, Atmosphere and Water Research Institute, Bulgarian Academy of Sciences, 1040 Sofia, Bulgaria
5
Department of Geography, West University of Timișoara, 300223 Timișoara, Romania
*
Author to whom correspondence should be addressed.
Remote Sens. 2026, 18(16), 2754; https://doi.org/10.3390/rs18162754
Submission received: 31 May 2026 / Revised: 16 July 2026 / Accepted: 8 August 2026 / Published: 15 August 2026

Highlights

What are the main findings?
  • PSInSAR detected 89 moving areas with velocities up to 10 cm yr−1 in the Pirin Mountains.
  • Most of the faster-moving areas are located outside rock glaciers, predominantly on talus slopes.
  • Only 8 of 74 rock glaciers show transitional activity, while most are relict.
What are the implications of the main findings?
  • PSInSAR provides an effective tool for assessing the activity of slow-moving rock glaciers.
  • Previously unrecognized moving areas suggest that ground deformation extends beyond the boundaries of the currently mapped rock glaciers, highlighting the need for further investigations and monitoring to determine the underlying processes.

Abstract

Rock glaciers are critical indicators of periglacial environments and the spatial distribution of mountain permafrost. Given their complex deformation patterns and temporal variability, which may indicate progressive destabilization, a quantitative evaluation of their kinematic activity is critical from both climatological and geohazard perspectives. This study applies Persistent Scatterer Interferometric Synthetic Aperture Radar (PSInSAR) to Sentinel-1 radar imagery on both ascending and descending orbits, in order to detect and map moving areas (MA) within the Pirin Mountains (Bulgaria). The primary objective of this study is to update the existing rock glacier inventory (RoGI) by integrating high-resolution Line-of-Sight (LOS) velocity data in accordance with the latest international standards established by the Rock Glacier Inventories and Kinematics (RGIK) standing committee. A secondary objective is to investigate the spatial relationships between the identified moving areas (MAs) and other surrounding geomorphological features (e.g., talus slopes), hence providing a wider context for slope dynamics and landform evolution. The results identified MAs with PSInSAR-derived Line-of-Sight (LOS) velocities reaching up to 10 cm yr−1, which were subsequently classified according to RGIK kinematic categories. A substantial proportion of the detected moving areas occur outside mapped rock glacier boundaries and may reflect a range of geomorphological processes, including permafrost-related creep, talus creep, or other forms of slope deformation. The LOS velocity data were used to assess the activity status of 74 rock glacier units within the regional inventory, classifying 8 as transitional (velocity exceeding 1 cm yr−1) and 66 as relict. Furthermore, we analyse the spatial distribution of these moving areas in relation to primary topographic variables, such as elevation, aspect, and slope. The results highlight the influence of topographic control factors and rock glacier dynamics and provide new insights into the distribution of active periglacial landforms and terrain potentially affected by permafrost in the Balkan Peninsula under changing climatic conditions.

1. Introduction

Rock glaciers are debris–ice landforms of either talus or glacier origin [1,2]. They are widely distributed across mountain environments on all continents, representing a key component of the global mountain permafrost system and serving as valuable indicators of its current state and evolution [3,4,5,6]. Rock glaciers develop as ice-rich debris undergoes a long-term, gravity-driven creep and may originate either from coarse talus accumulations containing interstitial ice or from debris-covered glacier remnants. Regardless of their origin, they are characterized by distinctive surface morphologies, including well-defined frontal and lateral margins and a ridge-and-furrow topography produced by internal deformation [3,7]. Consequently, modern classifications generally identify rock glaciers based primarily on their morphology and kinematics rather than assuming a single genetic origin [8,9].
Beyond their geomorphic significance, the compilation of rock glacier inventories (RoGI) has found broad application in supporting the spatial assessment of discontinuous permafrost and its environmental controls [10,11,12]. Such inventories provide valuable baseline datasets for regional-scale permafrost modelling, enabling the calibration and validation of empirical and statistical models that estimate permafrost distribution based on topographic and climatic predictors [13,14]. In addition, RoGIs have been increasingly used to investigate the response of mountain permafrost to climate change, as the spatial distribution, morphology, and activity status of rock glaciers reflect long-term thermal conditions and their recent evolution [5,6,7].
Recent developments emphasize the integration of kinematic information derived from remote sensing techniques, particularly InSAR, into rock glacier inventories, thereby enhancing their capability to distinguish between active, transitional, and relict forms in a more objective and reproducible manner [15,16,17,18,19]. This shift towards kinematically informed inventories represents a significant advancement in periglacial research, allowing not only improved mapping accuracy but also a better understanding of sediment transfer processes and slope dynamics within the broader paraglacial–periglacial system [4,20]. Furthermore, the rock glacier velocity is further validated by its designation as an Essential Climate Variable (ECV) by the Global Climate Observing System (GCOS) [21].
Traditionally, the monitoring of rock glacier kinematics relied on in situ techniques such as Global Navigation Satellite Systems (GNSS) surveys, terrestrial laser scanning (TLS), and photogrammetry. While these methods offer high precision, they are often limited by the logistical challenges of high-altitude terrain, high costs, and low spatial coverage, typically restricting observations to a few individual landforms. The advent of spaceborne remote sensing has revolutionized this field, particularly through Synthetic Aperture Radar Interferometry (InSAR). InSAR techniques allow for the detection of surface displacements with millimetric to centimetric precision over vast, inaccessible areas [22]. Specifically, Persistent Scatterer Interferometry (PSInSAR) has emerged as a robust tool for mountain environments, as it identifies stable “scatterers” (such as large boulders or rock outcrops) to overcome the limitations of temporal and geometric decorrelation common in rugged topography [23,24,25,26,27]. The availability of the European Space Agency’s (ESA) Sentinel-1 constellation, with its frequent revisit times and open-access policy, has further facilitated the transition from local-scale monitoring to regional-scale kinematic mapping.
The Pirin Mountains in Bulgaria, characterized by their alpine morphology and granite-marble lithology, host numerous rock glaciers that provide vital clues regarding the periglacial history of the Balkan region [28]. Despite their significance, the kinematics of rock glaciers in the Pirin Mountains remain under-researched compared to those in the Alps or the Himalayas. Previous geomorphological inventories have identified numerous relict and potentially active landforms, yet these classifications have largely been based on qualitative visual criteria rather than quantitative displacement data [28,29].
Furthermore, the international community has recently recognized the need for standardized practices in rock glacier research. The Rock Glacier Inventories and Kinematics (RGIK) standing committee of the International Permafrost Association (IPA) has established new guidelines to harmonize the mapping and functional classification of rock glaciers globally [9]. A central tenet of these standards is the integration of kinematic data into traditional inventories, allowing for a more objective differentiation between active, transitional, and relict landforms. Mapping moving areas (MAs) using InSAR data is now considered a fundamental step in updating regional rock glacier inventories (RoGI), ensuring that they reflect the actual dynamic state of the permafrost.
Despite the increasing global application of InSAR techniques for mountain permafrost monitoring, the Balkan Peninsula remains one of the most under-researched mountainous regions in Europe. While existing inventories for the Pirin Mountains have successfully identified numerous rock glaciers, they rely predominantly on geomorphological evidence derived from visual interpretation of optical imagery and field mapping [28,29]. Consequently, these records offer only a snapshot of landform morphology without providing quantitative data on current kinematic activity.
This lack of displacement data poses a significant problem. Without velocity measurements, the distinction between active, transitional, and relict features remains largely speculative, hindering the alignment of regional records with the new international RGIK standards [9]. Furthermore, the kinematic signals of a rock glacier cannot be viewed in isolation. They are part of a broader paraglacial and periglacial sediment cascade [30,31]. Their activity is often influenced by their connectivity to upslope supply systems, such as talus and scree slopes [30]. A geomorphological analysis that integrates kinematic data with topographic variables, such as elevation, aspect, and slope, is essential to understand the primary drivers of rock glacier movement [32,33].
This study aims to provide the first regional-scale kinematic assessment of rock glaciers in the Pirin Mountains using Sentinel-1 PSInSAR data from both ascending and descending orbits. Specifically, we identify and map moving areas to update the existing rock glacier inventory according to the latest RGIK guidelines and investigate the relationships between surface displacement patterns, topographic controls, and permafrost-related landforms.
The findings of this research will contribute to the regional knowledge of Bulgarian permafrost and demonstrate the utility of standardized PSInSAR workflows for regional-scale monitoring in under-studied mountain ranges. Ultimately, this study provides a critical dataset for evaluating the resilience of high-mountain environments in the Balkan Peninsula under the mounting pressure of global climatic shifts.

2. Study Area

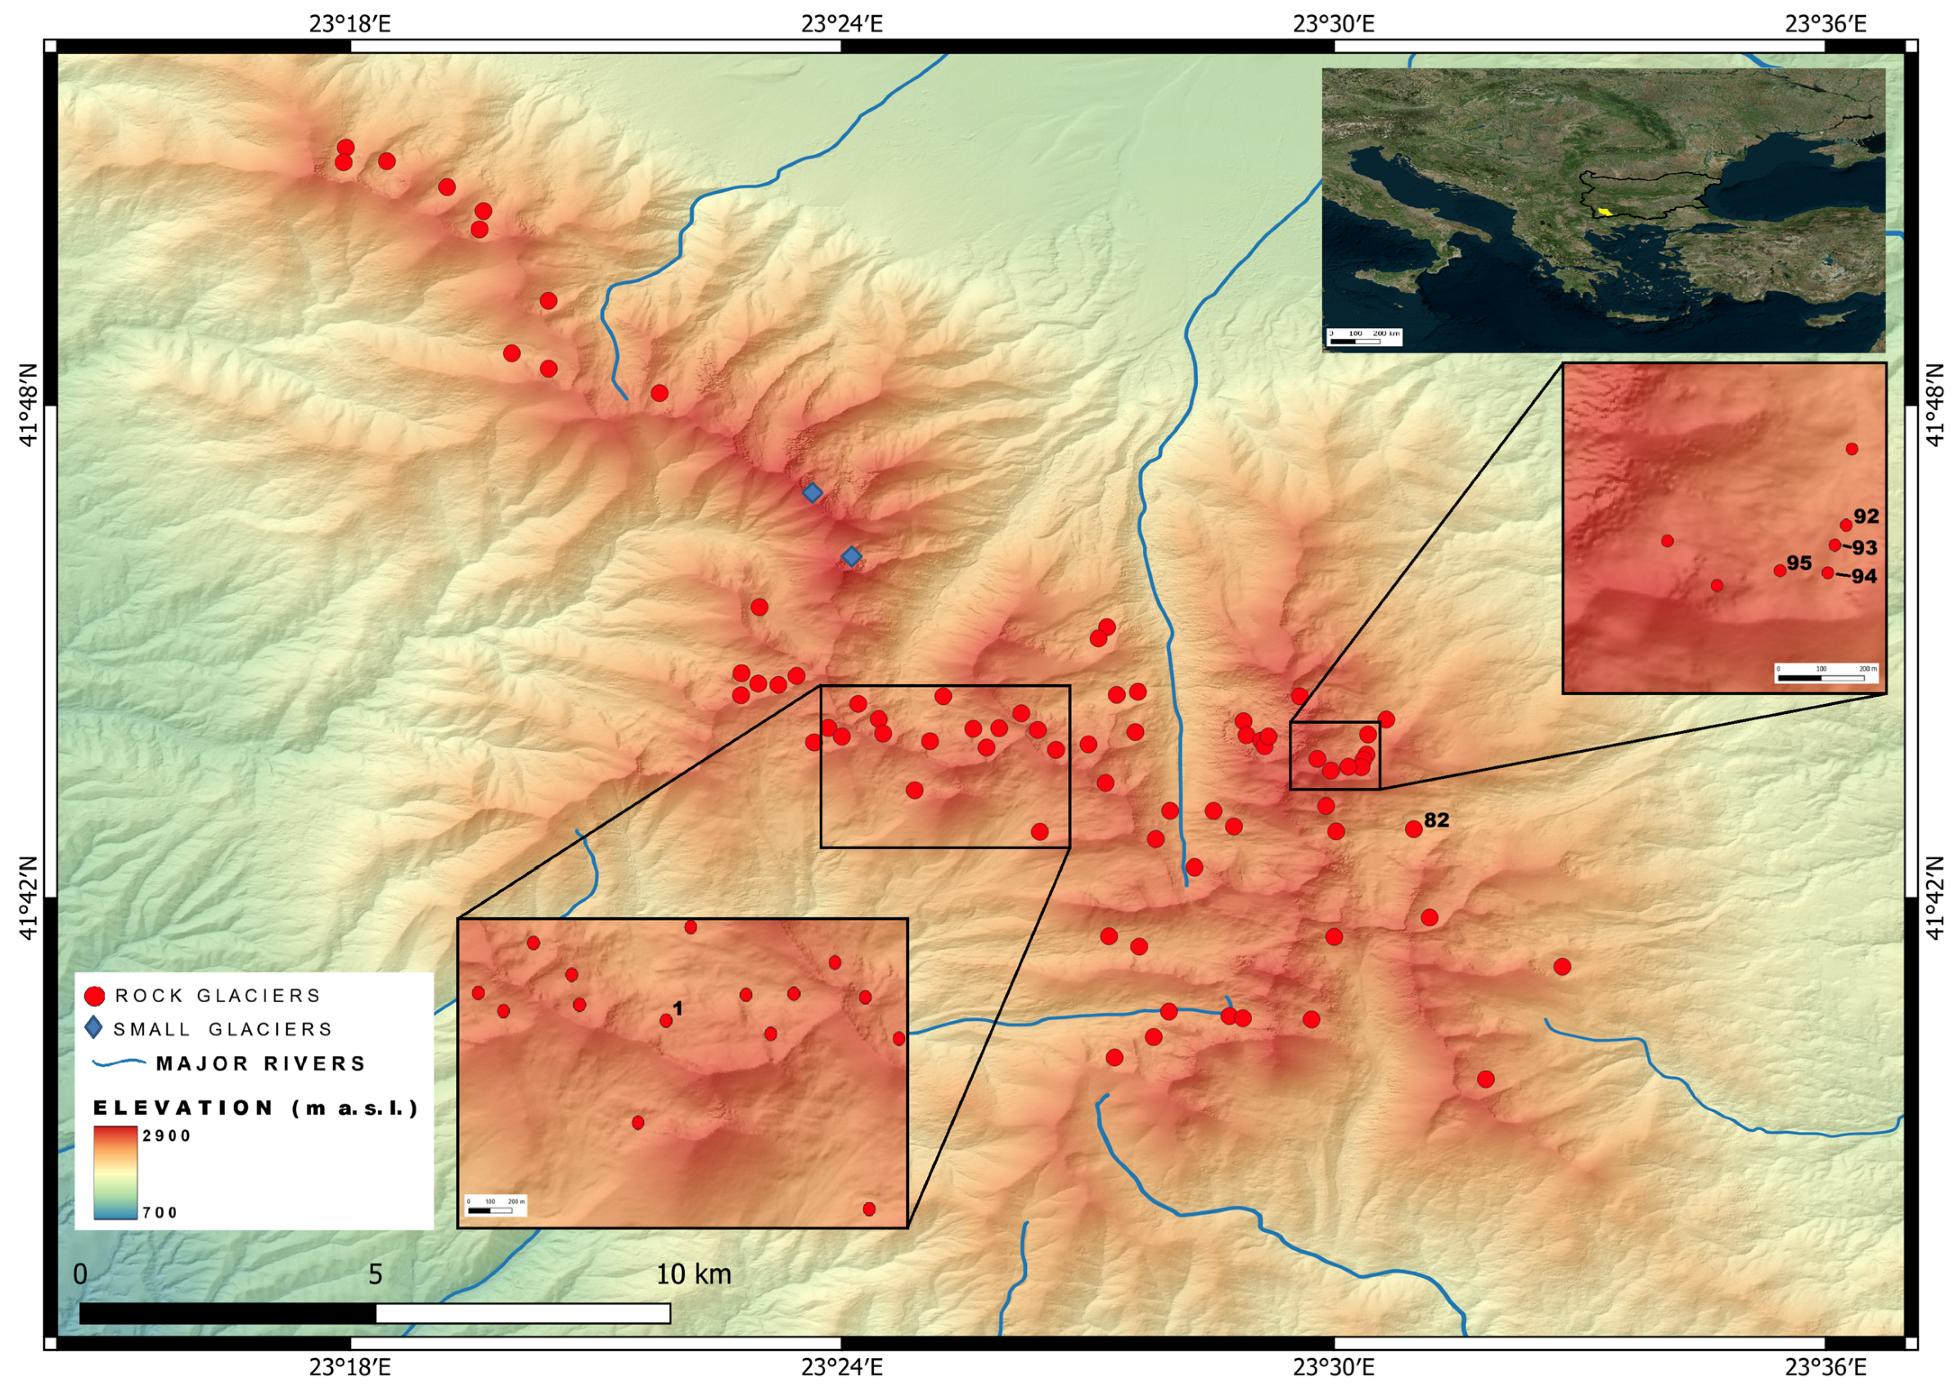
The Pirin Mountains, situated in southwestern Bulgaria (Figure 1), constitute one of the most prominent alpine massifs within the Rila–Rhodope morphotectonic unit. As the second-highest mountain range in Bulgaria and the third-highest in the Balkan Peninsula, the Pirin range extends over an area of approximately 2585 km2. The range is characterized by its rugged topography and extreme vertical relief, with its highest point, Vihren Peak, reaching an elevation of 2914 m a.s.l. This high-altitude environment is a product of intensive tectonic uplift during the Neogene and Quaternary, subsequently shaped by repeated glaciations during the Pleistocene [34].
The geological framework of the Pirin Mountains is complex and significantly influences the development of periglacial landforms. The mountain range is primarily composed of Hercynian granitoids (the Central Pirin and North Pirin plutons) and Proterozoic metamorphic rocks, including schists and gneisses. Notably, the northern section of the range is dominated by a massive marble complex, which includes the highest peaks of Vihren and Kutelo [28]. This lithological dichotomy is crucial for rock glacier dynamics; the highly fissured marbles and the blocky disintegration of granitoids provide an abundant supply of coarse-grained debris, which is essential for the formation and insulation of the internal ice cores characteristic of rock glaciers [37].
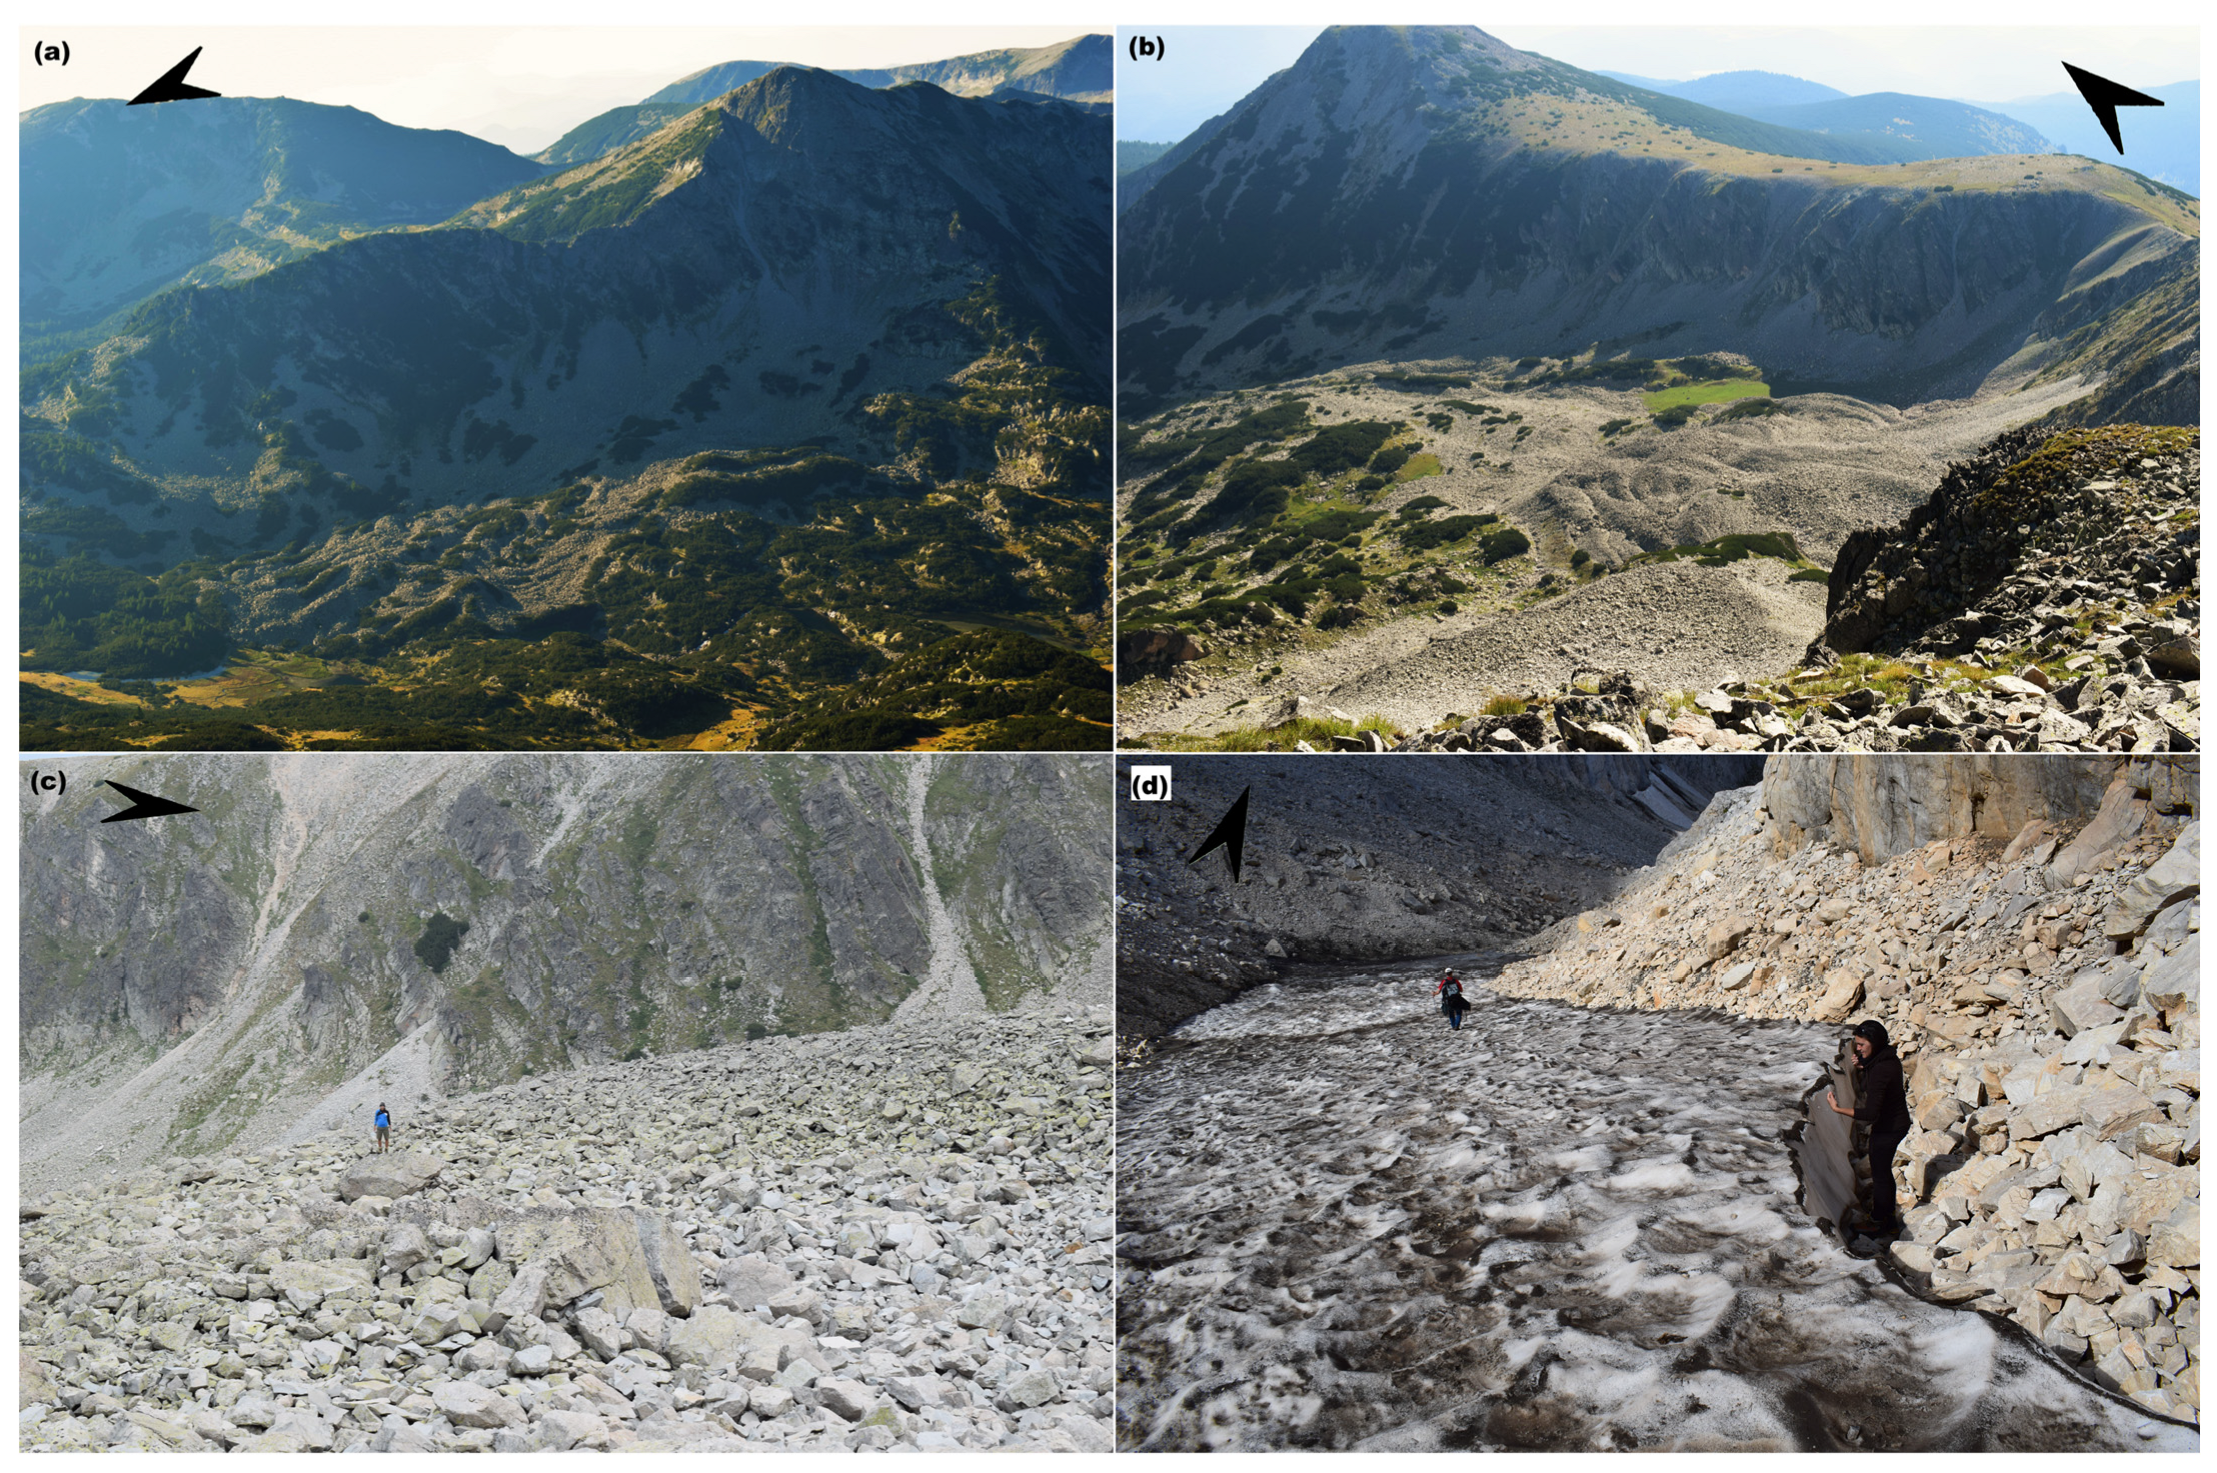
The climate of the Pirin Mountains is characterized by a transition between continental and Mediterranean influences, heavily modified by the high-alpine relief. At elevations above 2000 m, the climate is typically alpine, with Mean Annual Air Temperatures (MAATs) hovering near or below 0 °C. According to [38,39], the MAAT at Vihren Peak for 2014–2018 was −1.4 °C, while at Kazana Shelter (2445 m), a MAAT of +2.1 °C was recorded for 2011–2015. Precipitation is abundant, often exceeding 1000 mm annually, with a significant proportion falling as snow. The snow cover persists for 7 to 8 months in the high-altitude cirques (Figure 2d), playing a dual role in permafrost preservation: while deep snow provides thermal insulation, late-lying snow patches contribute to the cooling of the ground through meltwater infiltration and the shortening of the summer thawing season [40].
The contemporary landscape of Pirin is a mosaic of glacial and periglacial features. The range hosts over 110 glacial lakes and numerous cirques, troughs, and morainic complexes inherited from the Last Glacial Maximum (LGM). The marble-dominated glacio-karstic cirques of the Pirin range are characterized by deeper incision [41], which results in more extensive shaded areas compared to other lithologies. Within these cirques, particularly those with northern and northeastern exposures, periglacial processes remain active. The Pirin Mountains are renowned for hosting some of the southernmost micro-glaciers in Europe, such as Snezhnika and Banski Suhodol, as well as several perennial snow patches, which occupy deep, shaded marble cirques [34,42].
According to recent research, these small glaciers have persisted for at least several centuries [34,36,37]. Despite the fact that since the end of the Little Ice Age they have reduced their area by 18–35% and their volume by 45 to 55% [43], and despite the slight downward trend that has emerged in the last two decades [37], they have managed to persist 600–700 m below the present-day regional climatic glacier equilibrium line due to the highly favourable impact of local topographic conditions—carbonate lithology and developed karst, strong shading and significant contributions from avalanche and wind-drifted snow.
Furthermore, the Pirin range contains a significant number of rock glaciers, primarily concentrated between 2300 and 2700 m a.s.l. [28]. Given their location at the southern margin of the European permafrost extent, the rock glaciers of Pirin are highly sensitive to climatic fluctuations, making them ideal subjects for monitoring the impacts of modern warming trends in the Balkan Peninsula.
Concerning their origin, most rock glaciers likely formed during the Younger Dryas and the Early Holocene, either through the downwasting and transformation of debris-covered glaciers following deglaciation or by the progressive development of talus-derived rock glaciers under periglacial conditions. Evidence from the Bulgarian mountains supports both formation pathways, sometimes within a single landform, as demonstrated by the Musala rock glacier in the Rila Mountains [44].

3. Materials and Methods

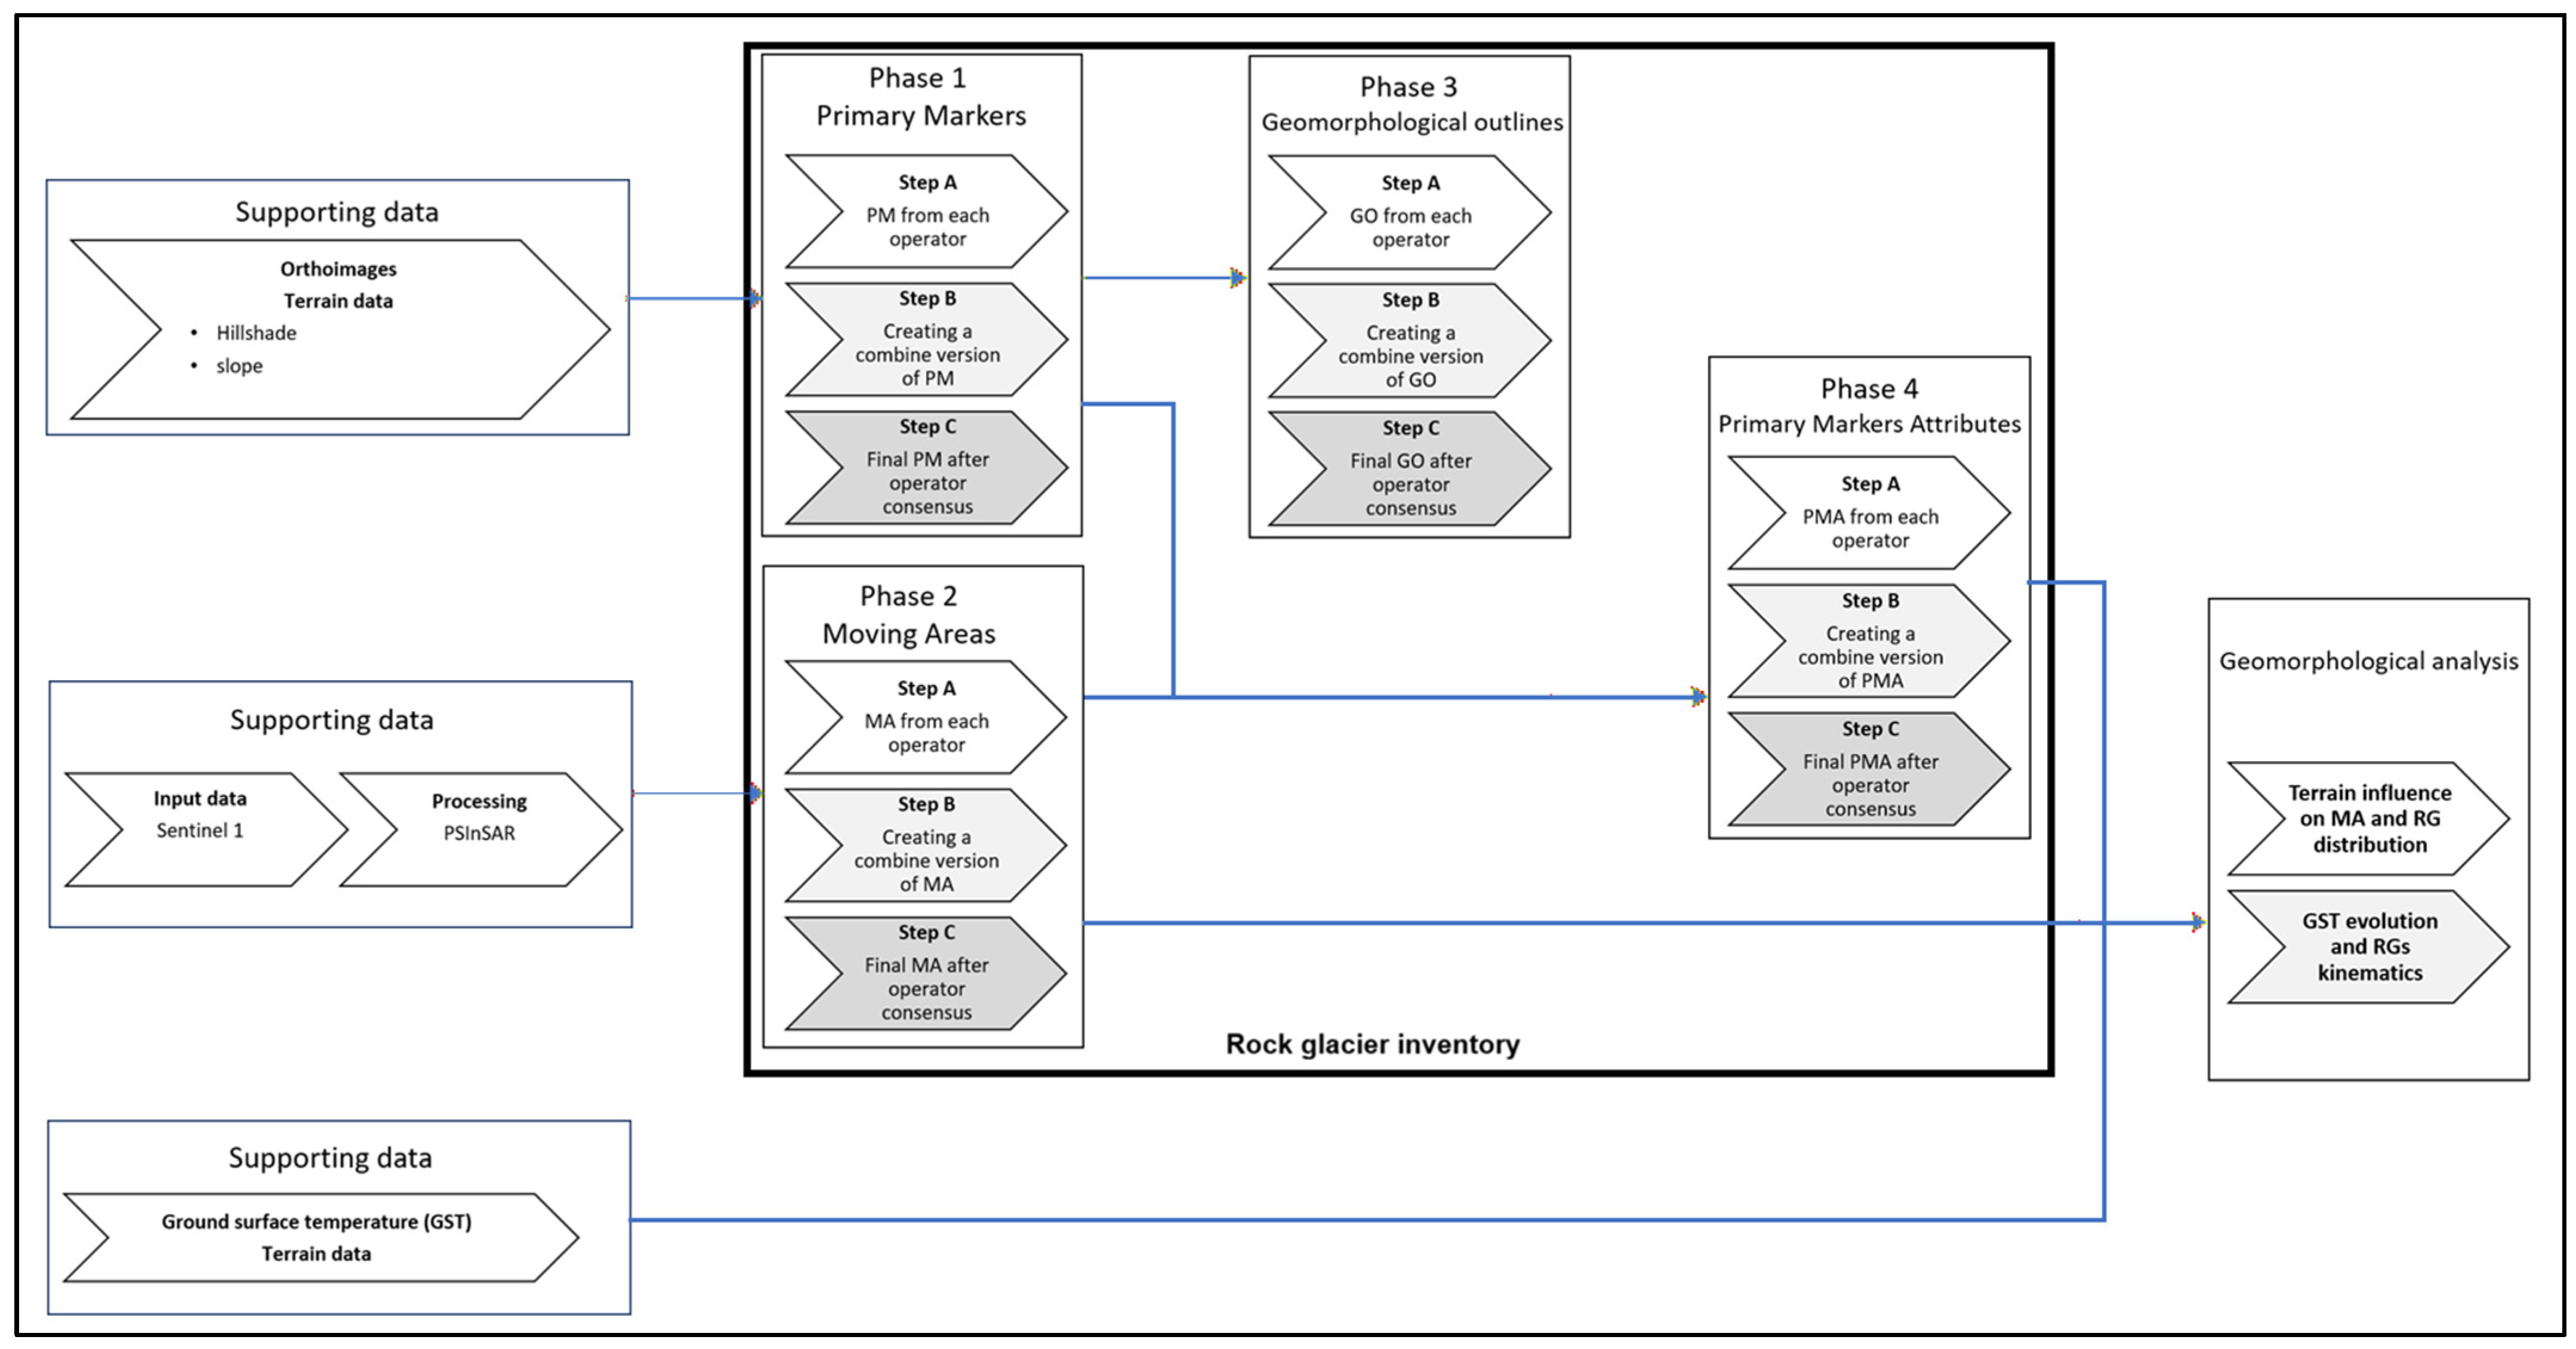
This section outlines the multi-methodological framework (Figure 3) implemented to assess rock glacier distribution and kinematics within the alpine zone of the Pirin Mountains. Surface displacement time-series and multi-annual LOS velocities were quantified using Persistent Scatterer Interferometry (PSInSAR) applied to snow-free Sentinel-1 C-band images captured between July 2015 and October 2023 (Table 1). The resulting kinematic dataset provided a robust, quantitative foundation for mapping and classifying landforms according to international standards.
Complementing the remote sensing analysis, a highly structured, multi-operator inventory framework was deployed in a QGIS environment to minimize mapping bias during landform identification and boundary digitization. High-resolution satellite orthoimages (from © Google satellite and Bing © Microsoft satellite, retrieved via QGIS using QuickMapServices, v1.1.0) and terrain derivatives (hillshade and slope) from a 12 m TanDEM-X DEM [35,36] supported the geomorphological delineation. Finally, to validate the spaceborne kinematic observations and characterize the underlying cryospheric conditions, long-term ground surface temperature (GST) monitoring was conducted at two representative sites (Banderishki Chukar and Bezbog) (Figure 1) using miniature data loggers.
Slope and slope aspect were extracted from a 12 m DEM [35] in QGIS (v3.34.2) using the raster analysis package. Potential incoming solar radiation was extracted in ArcGIS Pro (v3.2.0) using the Spatial Analyst toolbox over one year at 16-day intervals.

3.1. PSInSAR Processing of Sentinel-1 Data

Persistent Scatterer Interferometry (PSInSAR) is a multi-temporal InSAR approach designed to estimate time-series of surface displacements by mitigating the disturbing effects due to atmospheric phase screening, topographic effects and temporal decorrelation [23]. Since its introduction, PSInSAR has become a standard for monitoring surface displacements with millimetric precision in urban and unvegetated areas. The method relies on identifying pixels that maintain stable backscattering characteristics over long observation periods—known as Persistent Scatterers (PS). In mountainous regions, these are typically associated with large rock outcrops or boulders, which are abundant in the blocky surfaces of rock glaciers.
The InSAR phase has the following components [45]:
φ_meas = φ_flat + φ_orbit + φ_atm + φ_topo + φ_defo + φ_noise
where
φ_meas is the total measured phase difference between the reference and the slave SAR scenes;
φ_flat is the horizon effect phase;
φ_orbit is the residual phase resulting from inaccurate orbit information;
φ_atm is the phase delay resulting from the atmospheric disturbances in both master and slave scenes;
φ_topo is the phase resulting from the imaged topography;
φ_defo is the phase due to the displacement process;
φ_noise is the phase from the sum of the sensor’s thermal noise, de-correlation effects (changes in the backscattering pattern with time, baseline and Doppler shift differences between the master and the slave images) and any other unmodelled factors.
Of these components, only the actual displacement is of interest, but standard InSAR cannot separate all of these phase components to extract only displacement information. Most successful InSAR applications are possible in areas with low topography and dry ground where the displacement component dominates. In order to extract displacement information in all (unvegetated) areas, the PSInSAR technique is used [45,46].
For this study, the Sentinel-1 constellation is utilized, operating in the C-band (5.405 GHz) with the Interferometric Wide (IW) swath mode. The primary advantages of Sentinel-1 are its high temporal resolution (6 to 12-day revisit time), regular acquisitions and free and open distribution policy. The use of the Terrain Observation with Progressive Scans (TOPS) acquisition mode ensures a homogeneous Signal-to-Noise Ratio (SNR) and minimizes the scalloping effect common in traditional ScanSAR, though it requires extremely precise co-registration to avoid phase jumps between bursts [25]. The European Ground Motion Service (EGMS), which provides open-access ground motion data across Europe derived from Sentinel-1, is deemed unreliable for accurately identifying slow-moving rock glaciers due to temporal decorrelation caused by prolonged snow cover periods [27,47]. To mitigate coherence loss, rock glacier kinematics were assessed in our study using 181 snow-free Sentinel-1 images spanning from July 2015 to October 2023. To obtain continuous displacement profiles, displacement values for snow-covered periods were estimated using simple linear regression models fitted to the displacement observations acquired during snow-free periods. The fitted models were then used to interpolate displacement across the data gaps, allowing the construction of continuous time series for representative moving areas while preserving the long-term displacement trend.
The PSInSAR processing chain [48] was configured to preserve all displacement information, avoiding a priori atmospheric filtering, thereby maximizing the detection of millimetric velocities in unvegetated terrain.
Persistent Scatterer Interferometry (PSI) processing was performed using reference scenes selected based on an optimal distribution of perpendicular baselines, acquisition during the warm season, high coherence of consecutive interferograms, and minimal atmospheric perturbations. Persistent Scatterer (PS) candidates were identified using a Mean over Sigma Ratio (MSR) threshold of 1.4 and a point spectral correlation threshold of 0.35. Reference PS candidates were selected using more stringent criteria, with an MSR threshold of 3.0 and a point spectral correlation threshold of 0.5. Spatial phase unwrapping of the residual phases was carried out using a 16-point spatial filter, while phase unwrapping was performed iteratively through alternating single-reference and multi-reference (redundant) network configurations, combined with least-squares-based detection and correction of unwrapping errors within the redundant network. Topographic phase contributions were removed using the 15 m Shuttle Radar Topography Mission (SRTM) DEM, and no additional orbit corrections were required. Point quality was assessed using a similarity criterion between neighbouring pixels, whereas uncertainties associated with linear error components, including the topographic phase, were estimated by applying a linear fit to derive height uncertainties. The resulting PS density is very high and comparable to that typically observed over man-made infrastructure. The LOS velocity uncertainty varies for each measurement point. This metric was utilized as a selection criterion to filter data, generating maps that include only points below a specific uncertainty threshold (Figure S2).
A significant challenge in this workflow is that the residual phase related to atmospheric phase delay can exceed the deformation signal by two orders of magnitude [48], necessitating rigorous phase unwrapping and residual interferogram correction. Additional efforts were thus made to improve the accuracy of atmospheric delay modelling and compensation and limited the analysis to snow-free acquisitions. Consequently, a high density of radar targets on bare rock surfaces at mountain tops was preserved in our measurements. Surface motion is measured with PSInSAR only along the SAR LOS (Line-of-Sight) direction; however, the actual displacement of the rock glacier surface is expected to mainly occur along the slope or in the vertical direction. Furthermore, since 24 of the 74 rock glaciers are oriented along a North–South axis, their along-slope velocities may be underestimated due to the inherent lack of InSAR sensitivity to motion parallel to the satellite’s flight path [47].
Ascending and descending Sentinel-1 datasets were processed independently and were not combined to derive vertical or east–west displacement components. Owing to the steep topography of the study area, the two acquisition geometries were largely complementary, as favourable viewing conditions from one orbit frequently coincided with layover, foreshortening, shadowing, or suboptimal viewing geometry in the opposite orbit. Consequently, the ascending and descending datasets were used primarily to maximize spatial coverage of detectable moving areas, while the preferential direction of movement was interpreted considering local slope orientation derived from the DEM. This dual-orbit PSInSAR approach is essential for accurately classifying the kinematic state of rock glaciers. It provides a robust, quantitative basis for distinguishing between active, transitional, and relict landforms, aligning with the international standards set by the RGIK (2023) committee.
To handle the extensive ground displacement volume, the analysis of results was conducted via the PSTool web-based environment [48], developed by Terrasigna Inc. This tool enabled a multi-scalar approach to the PSInSAR results, ranging from the broad selection of moving areas to the detailed extraction of temporal averages and deformation profiles. Key to this study was the platform’s ability to export time-series data for external integration and to overlay custom geomorphological layers, ensuring a seamless correlation between kinematic data and local topographic features.

3.2. Rock Glacier Inventory

3.2.1. Delineating Moving Areas

Moving areas (MAs) were identified across the alpine zone of the Pirin Mountains (specifically above the timberline) based on multi-annual LOS velocities derived from the Terrasigna PSInSAR processing chain. Following established frameworks [17,27,49], these features were categorized into specific SAR LOS velocity classes (in cm yr−1): 0.3–1, 1–3, and 3–10, and ‘undefined’. The velocity class characterizes the average yearly LOS displacement rate recorded within a MA during the 2015–2023 period. An “undefined” class was assigned to MAs exhibiting inhomogeneous LOS velocity fields where a single rate could not be confidently attributed. Velocities < 0.3 cm yr−1 were classified as ‘no movement,’ as this threshold represents the lower detection limit for Sentinel-1 interferometric products in rugged alpine terrain [50]. The identified MAs were manually digitized and compiled into a comprehensive inventory within a QGIS (v. 3.34.2) environment, with support from the 12 m resolution DEM [35] for spatial and topographic analyses.

3.2.2. Delineating Rock Glaciers

Rock glaciers were mapped according to the guidelines established by the RGIK Standing Committee. The inventory procedure consisted of four phases, each with a three-step process (Figure 3):
Step A: Individual mapping or attribute entry performed independently by each operator.
Step B: Creation of a synthesized version incorporating the individual inputs.
Step C: Finalization of the data through team discussion and formal consensus.
In the first, third, and fourth phases (i.e., identifying rock glaciers and marking them with markers, digitizing the contours of the rock glaciers and setting the primary attributes of the rock glaciers), the work was performed by six operators. The second phase (moving area delineation) was performed by two operators, with Step C involving a group review and consensus by all six operators. This structured approach, moving from individual observation to group validation, is designed to minimize operator bias and produce a high-quality, standardized geomorphological and kinematic dataset.
For the first and third phases (i.e., identification and outline mapping), the definition used for a rock glacier was: “a debris landform generated by the former or current creep of frozen ground, detectable in the landscape by the following morphologies: front, lateral margins and optionally ridge-and-furrow surface topography” [9].
In the first phase, in addition to identifying primary markers for rock glaciers, the operators also identified “uncertain” rock glaciers. These are landforms that could not be identified as rock glaciers with sufficient certainty, either because of a lack of high-quality data (e.g., they are located in a highly vegetated area and their morphology is not clearly visible), or because the operators did not agree on them because of their complexity or because of their degradation.
The rock glaciers were identified and mapped in QGIS Desktop 3.34.2, using © Google satellite and Bing (© Microsoft) satellite orthoimages combined with terrain data (i.e., hillshade and slope layers) derived from the 12 m DEM [35].

3.3. Thermal Data and Geomorphological Analysis

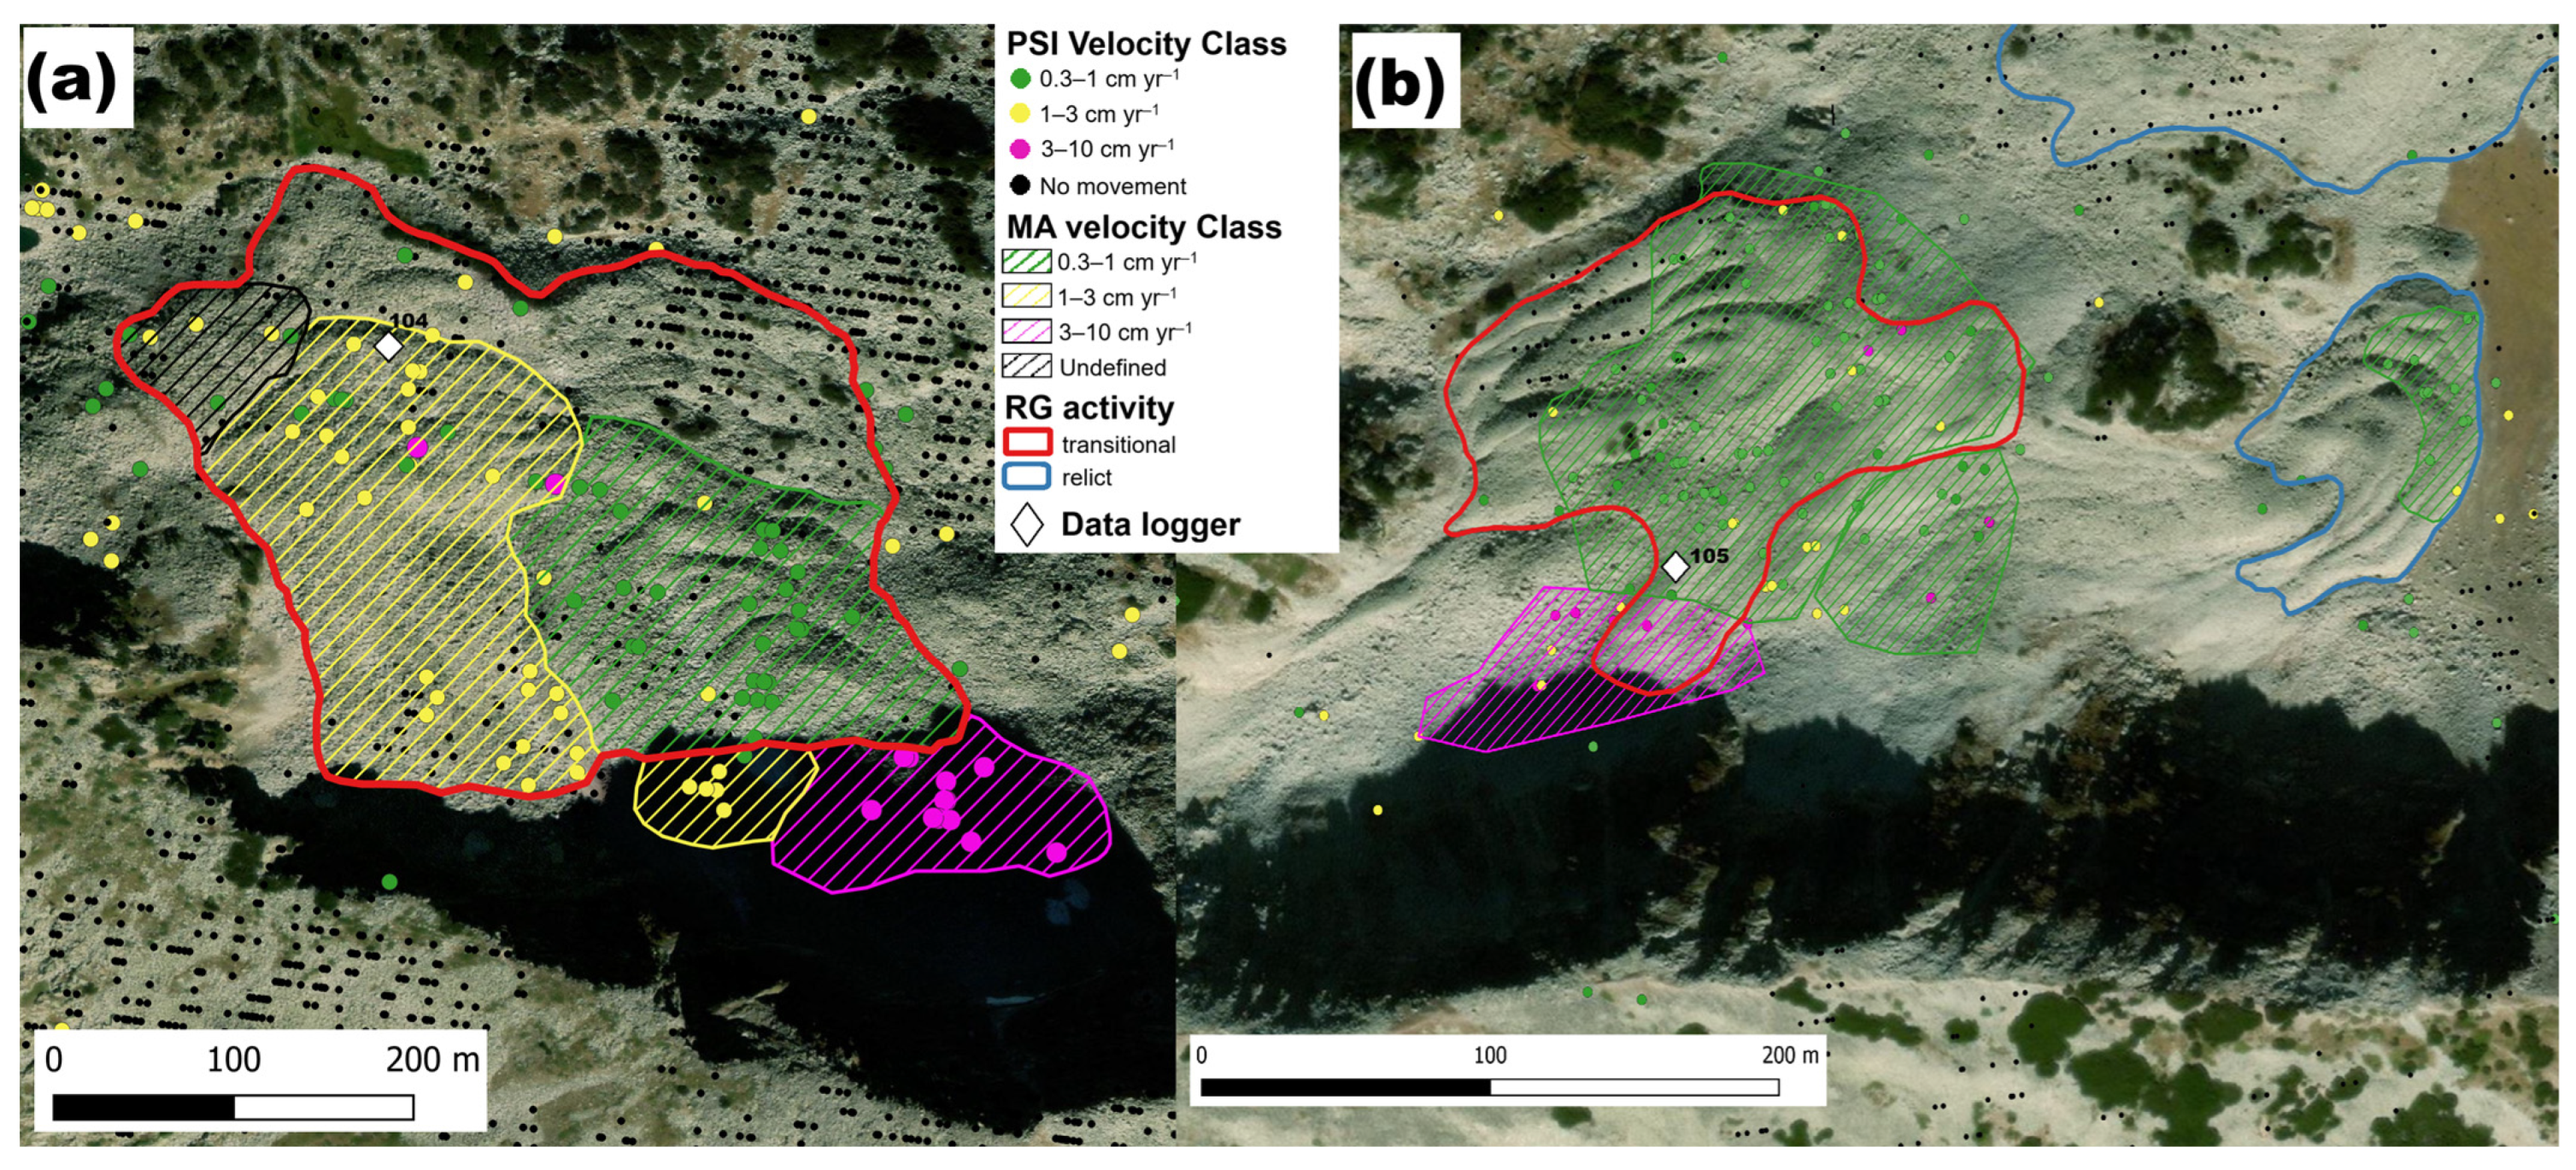
Miniature temperature data loggers are widely used in mountain permafrost environments to investigate ground thermal regimes and surface energy exchange processes [51]. In this study, two rock glaciers (i.e., Banderishki Chukar and Bezbog) located in the central and eastern parts of the Pirin Mountains (Figure 4) were instrumented for long-term ground surface temperature (GST) monitoring. GST measurements were acquired at 2 h intervals using DS1922L iButton sensors, which operate within a temperature range of −40 °C to 80 °C and have a manufacturer-specified accuracy of ±0.5 °C.
The sensors were indirectly calibrated at 0 °C using the zero-curtain period associated with snowmelt conditions [52]. During mid to late winter, ground surface temperatures commonly stabilize beneath a sufficiently thick snow cover, while subsurface processes dominate the ground–atmosphere energy exchange. This thermally stable phase, referred to as the winter equilibrium temperature (WEqT), is considered a reliable empirical indicator of permafrost occurrence when values remain below −2 °C [53]. For each monitoring site, both mean annual ground surface temperature (MAGST) and WEqT values were calculated. All yearly data were aggregated following the standard thermal/hydrological year for the GST monitoring, defined as running from 1 October to 30 September of the following year.
Due to travel restrictions during the summer of 2020, no in situ GST measurements are available for the 2019/2020 monitoring season.

Statistical Analysis on the Influence of Topography

To assess the influence of topographic factors (i.e., elevation, slope, solar radiation) on the kinematic behaviour of the identified Moving areas (MAs), a non-parametric statistical approach was adopted. For each individual MA polygon, the topographic variables were extracted from a 12 m TanDEM-X DEM [35]. The normality of these continuous environmental variables was evaluated using the Shapiro–Wilk test. Differences in topographic factors among the four LOS velocity classes were evaluated using the Kruskal–Wallis rank-sum test, a non-parametric alternative to one-way ANOVA that does not require the assumption of normal data distribution [54]. When statistically significant differences were identified (i.e., p < 0.05), pairwise comparisons between LOS velocity classes were performed using Dunn’s post hoc test with Bonferroni correction to account for multiple comparisons. To assess the directional control of terrain aspect (circular data), a Watson–Wheeler test [55] was performed. All statistical computations and high-resolution data visualizations were executed within the R Studio (R v4.6.0, R Studion v2026.05.1 [56] environment using the ggpubr (v0.6.3) [57] and circular packages (v0.5.2) [58].

3.4. Usage of GenAI

Generative artificial intelligence (GenAI) was used exclusively as a language-support tool during manuscript preparation. Its use was limited to language editing and the rephrasing of selected text to improve clarity, readability, and overall presentation. GenAI was not used to develop the study design or methodology, generate, process, analyze, or interpret data, produce analytical results, or formulate the scientific conclusions. All scientific content, analyses, interpretations, and conclusions presented in this manuscript were conceived, verified, and approved by the authors, who take full responsibility for the accuracy and integrity of the work.

4. Results

4.1. Moving Areas and Rock Glacier Inventory

The PSInSAR accuracy is on the order of 0.1 to 0.2 cm yr−1 for the rate of motion and of about 0.6 cm yr−1 per single measurement [59]. The minimum observable LOS velocity is 0.3 cm yr−1. The point density is heterogeneous, but it is sufficient to be used for delineating moving area (MA) polygons with high reliability (Figure 4).
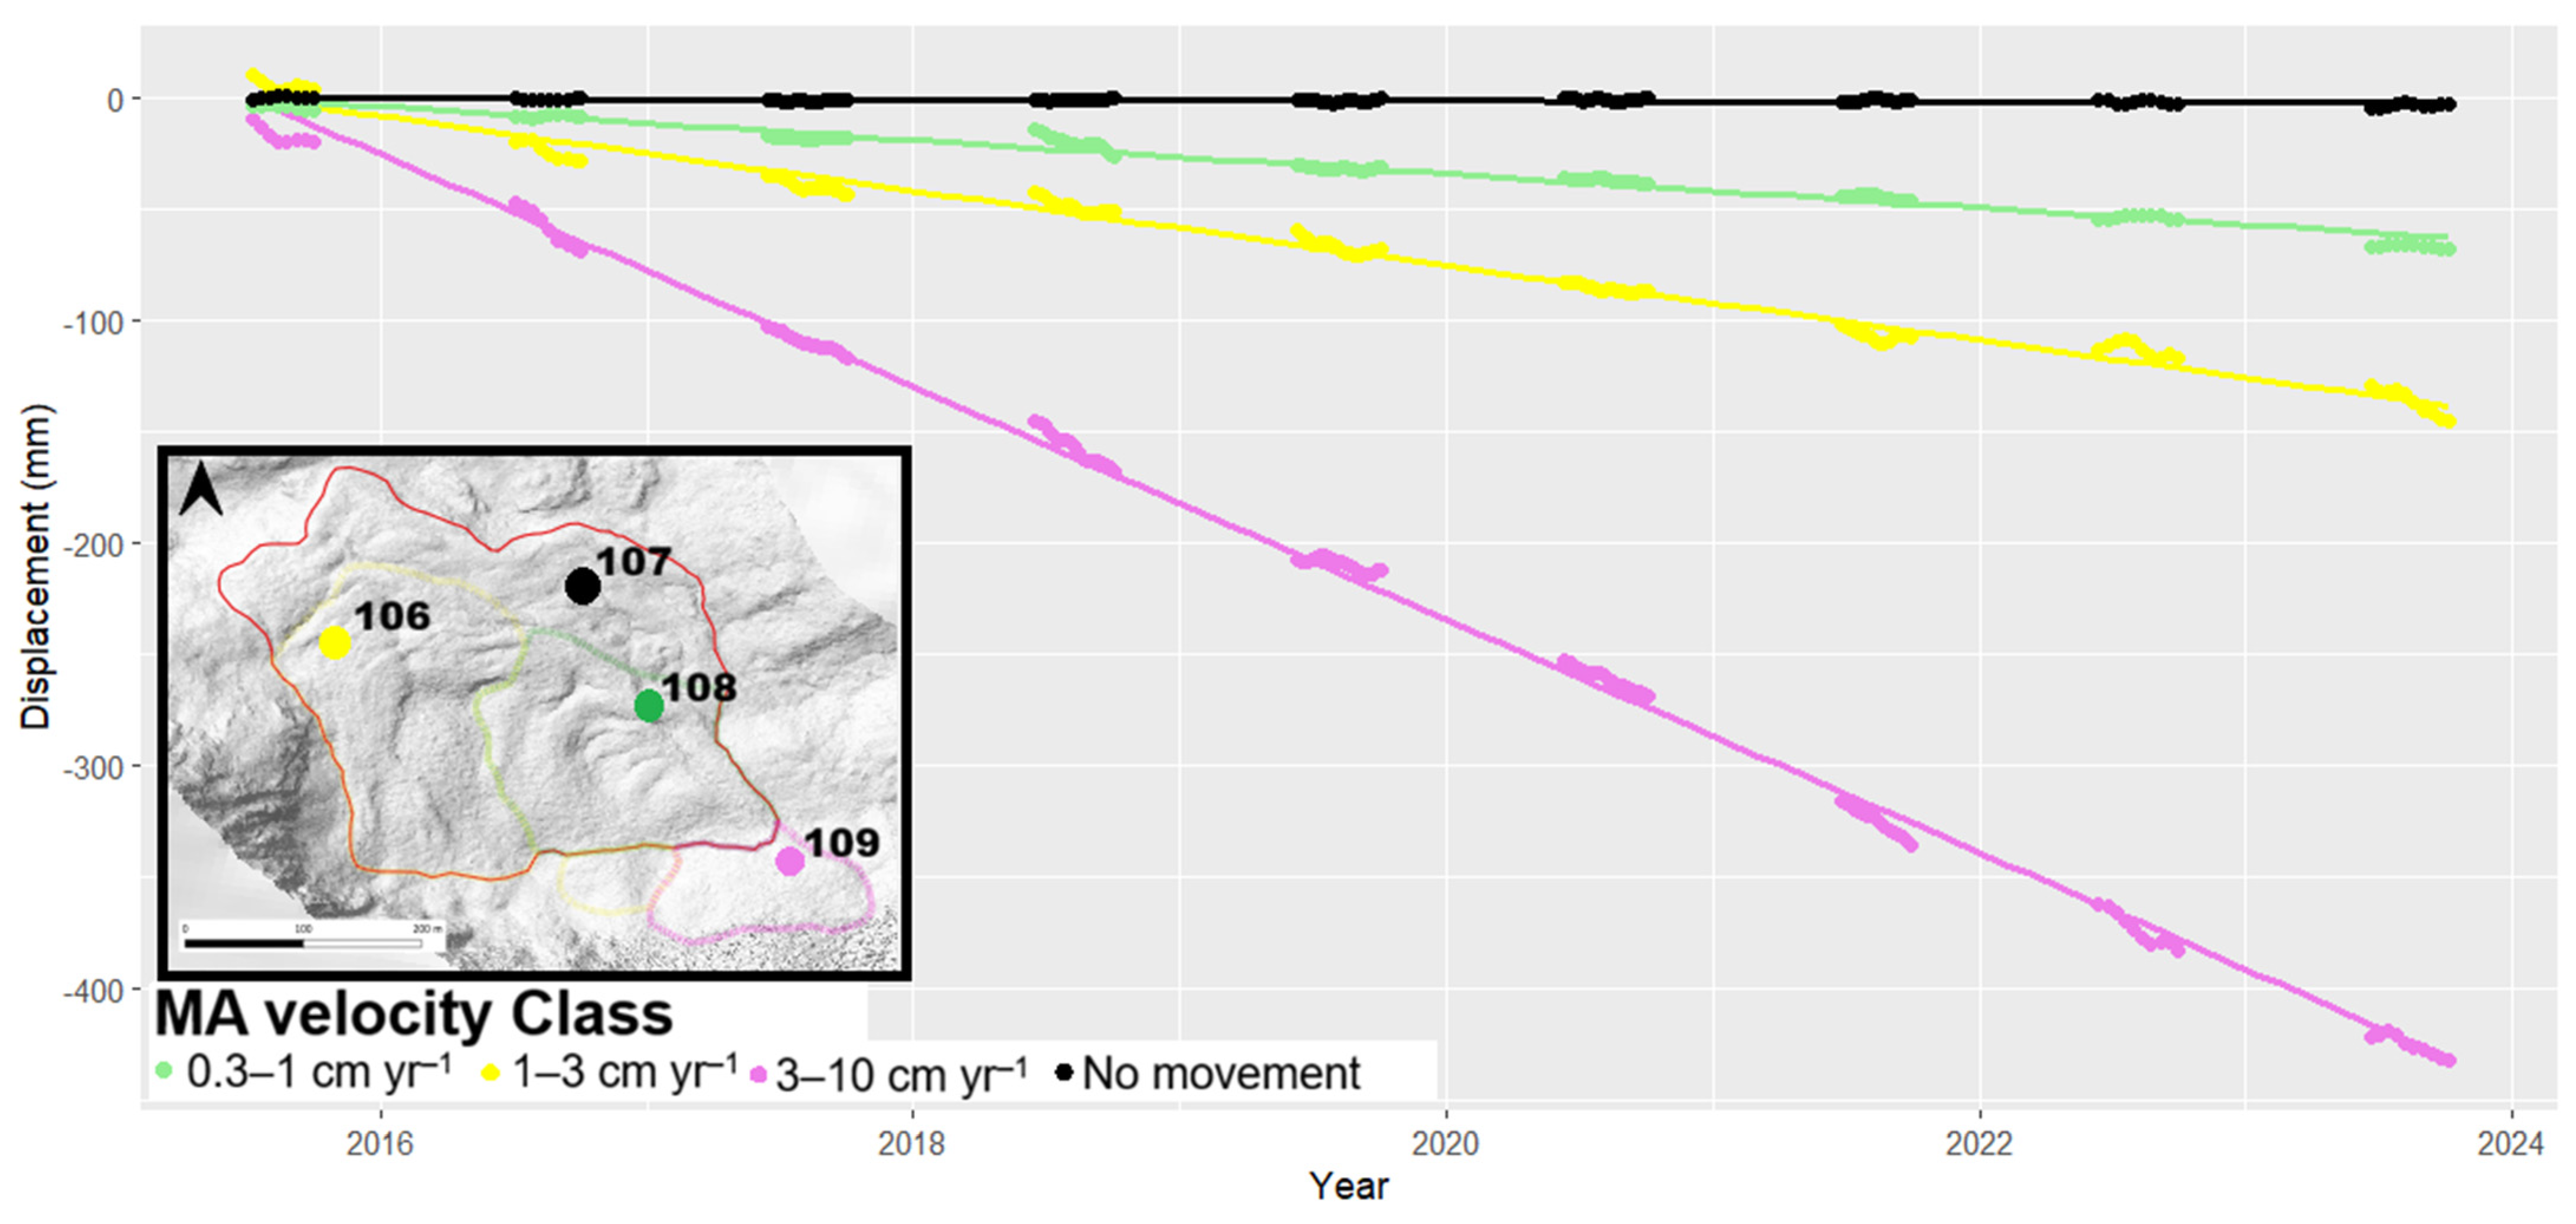
We mapped 89 moving areas (MAs) across the Pirin Mountains (Table 2), with mean annual LOS velocities ranging from 0.3 to 10 cm yr−1 during the 2015–2023 observation period (Figure 5). For most MAs, displacement rates remained relatively constant over time, with no significant temporal variations detected (Figure 6). Given the relatively low displacement rates, seasonal variability could not be assessed reliably; therefore, only annual or multiannual LOS velocity estimates were considered.
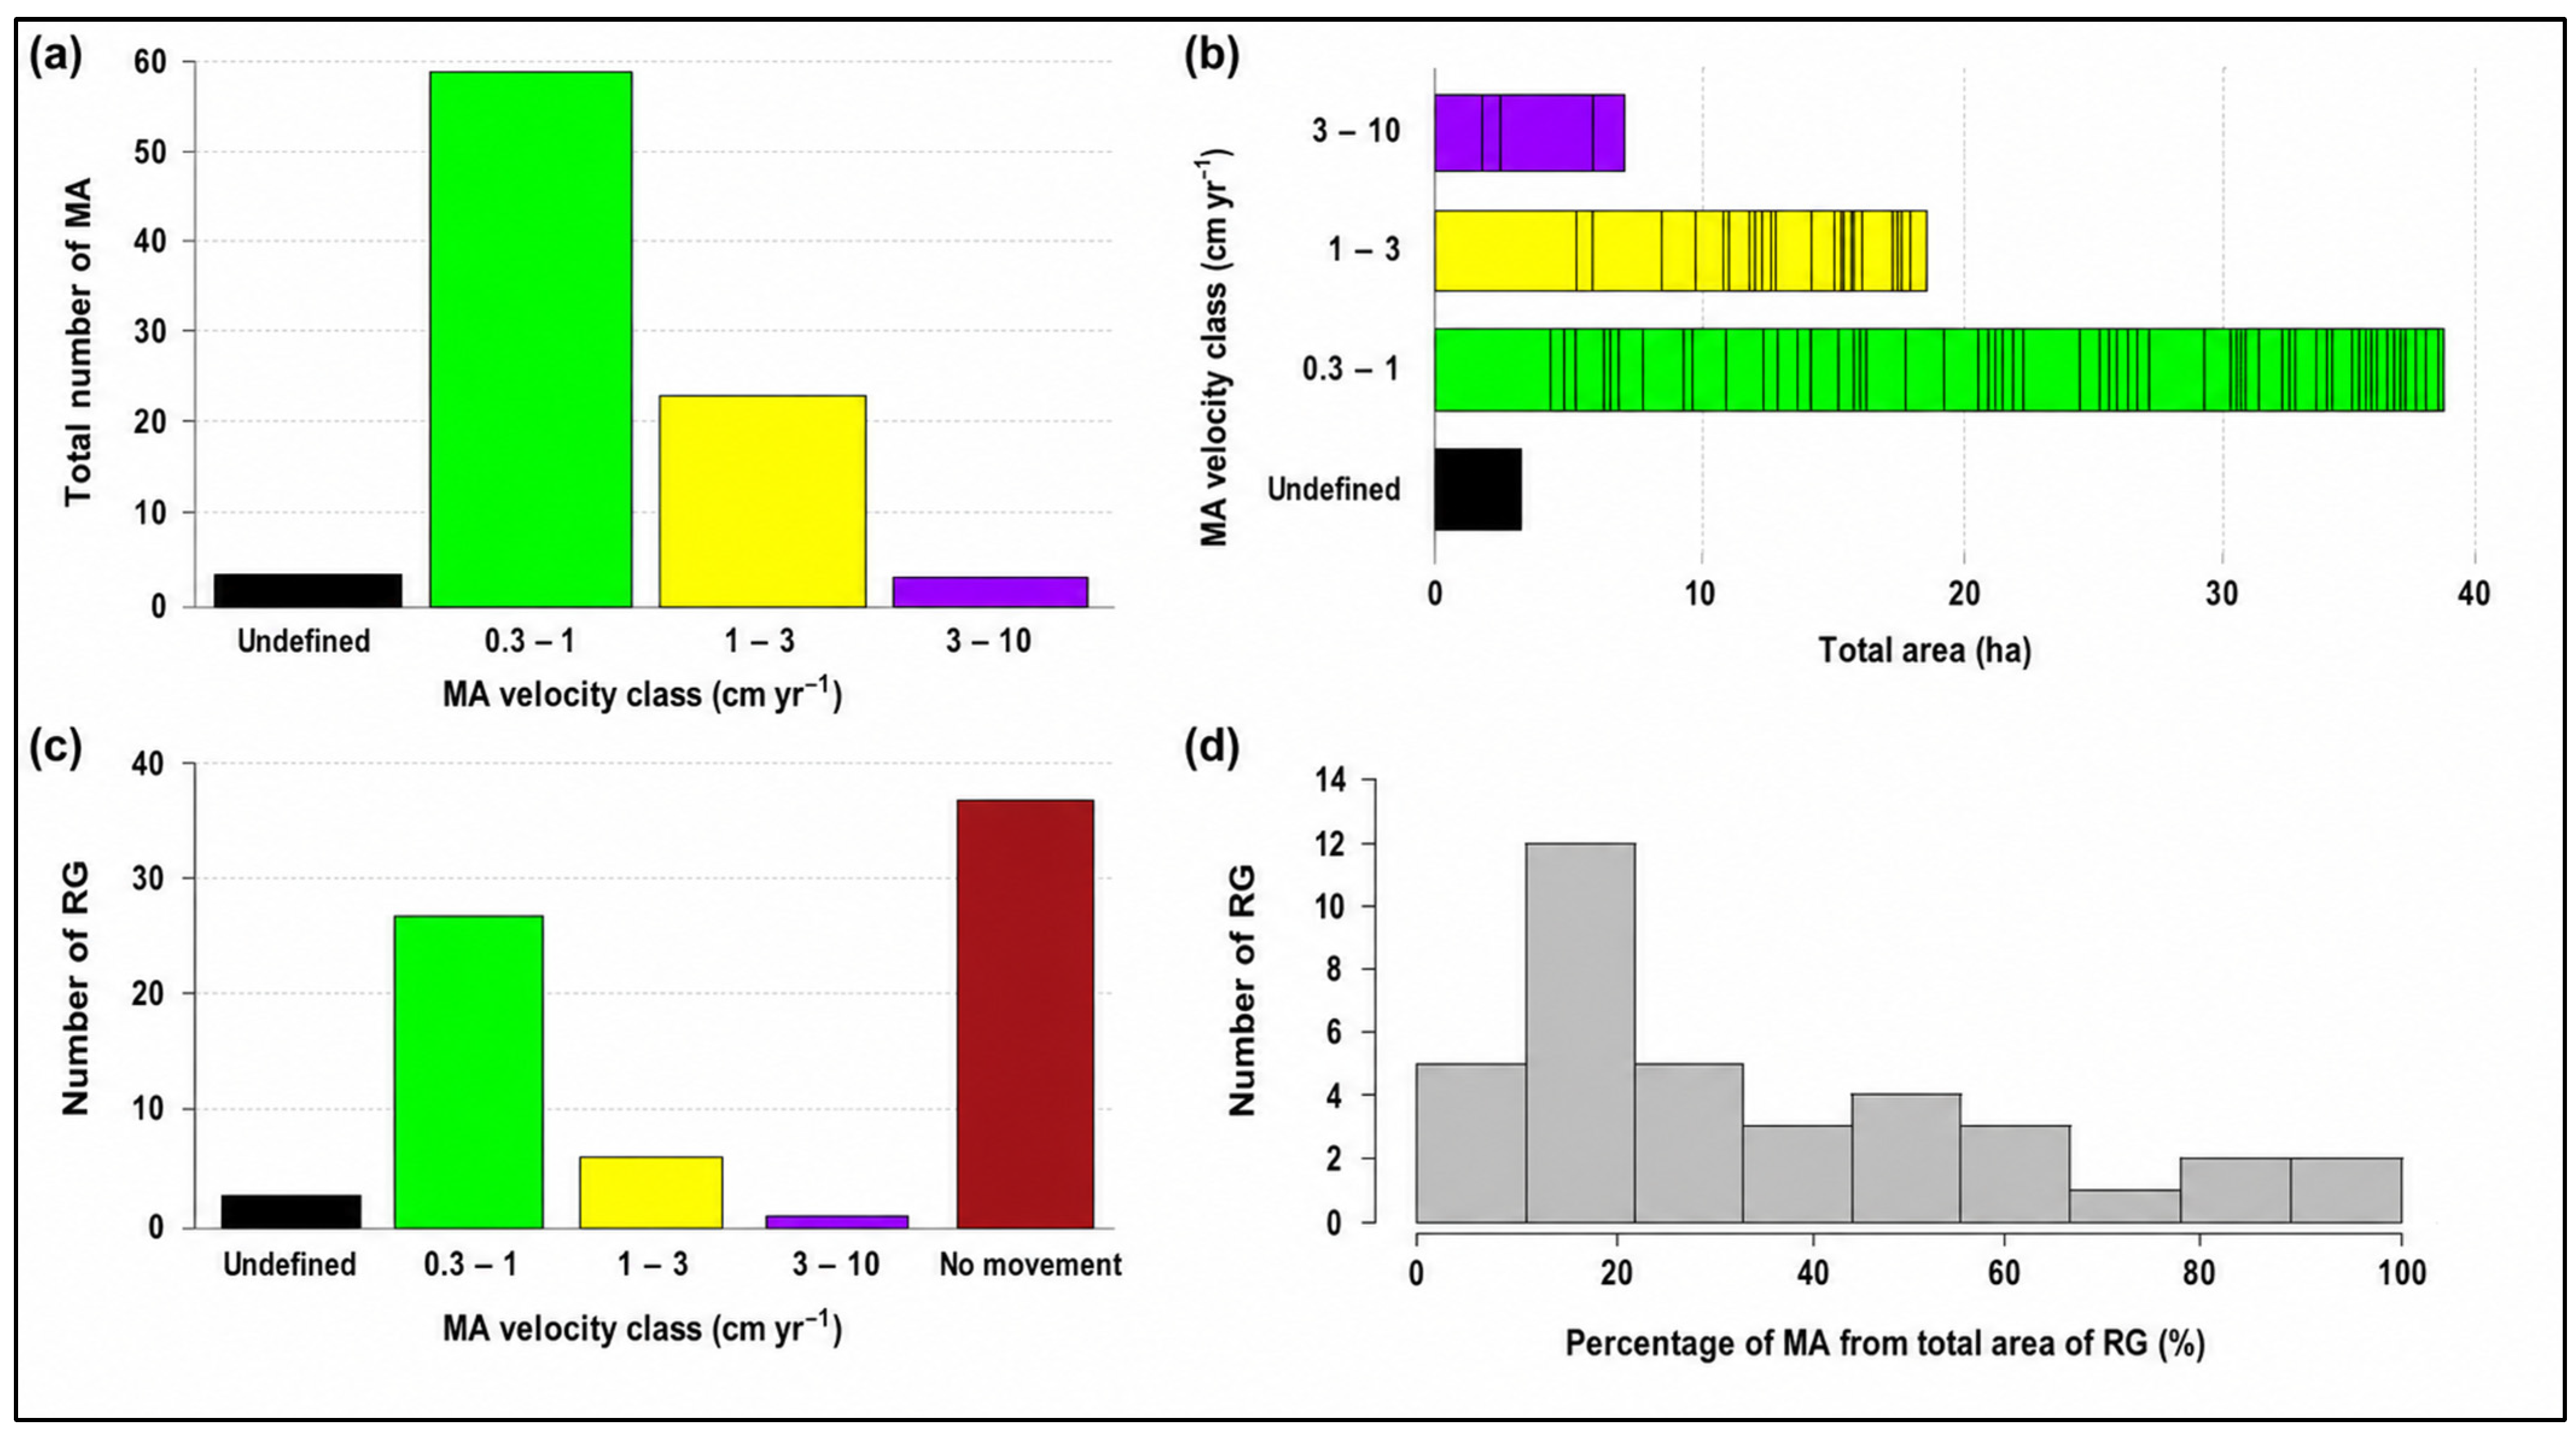
Of the mapped MAs, 58 were classified within the 0.3–1 cm yr−1 LOS velocity class, 23 within the 1–3 cm yr−1 class, and only four exhibited velocities between 3 and 10 cm yr−1 (Figure 5a). Four additional MAs were classified as uncertain, as movement was detected but a reliable LOS velocity class could not be assigned.
This frequency distribution (Figure 5a) aligns closely with the total spatial extent occupied by each LOS velocity class (Figure 5b). Thus, the cumulative area of MAs in the 0.3–1 cm yr−1 LOS velocity class is dominant, covering approximately 38 hectares of the alpine terrain. The intermediate class (1–3 cm yr−1) accounts for roughly 18 hectares, whereas the fastest active zones (3–10 cm yr−1) are spatially restricted to less than 6 hectares. The sizes of MAs range from 0.1 ha to over 2 ha, with a mean size of 0.73 ha. On average, the smallest MAs are in the slowest class, at 0.65 ha, while the fastest class contains the largest MAs with a mean size of 1.54 ha.
When classifying the rock glaciers based on their dominant internal kinematics (Figure 5c), half of the inventoried rock glaciers contain at least one MA. However, only 10% contain areas with velocities higher than 1 cm yr−1, confirming a relict or mostly inactive status for the vast majority of inventoried rock glaciers.
In most cases, MAs occupy less than 20% of the rock glacier surface; however, in four rock glaciers, the cumulative MA extent exceeds 70% of the total rock glacier area (Figure 5d). The number of MAs per rock glacier ranges from one to four, with the majority of rock glaciers (69%) containing a single MA.
In order to capture long-term kinematic trends, LOS displacement time-series profiles were extracted from specific persistent scatterer (PS) targets (Figure 6). The cumulative LOS displacement profiles spanning from 2015 to 2023 exhibit highly linear down-slope deformation patterns with negligible seasonal phase jumps, confirming the structural stability of the PS targets on blocky debris surfaces.
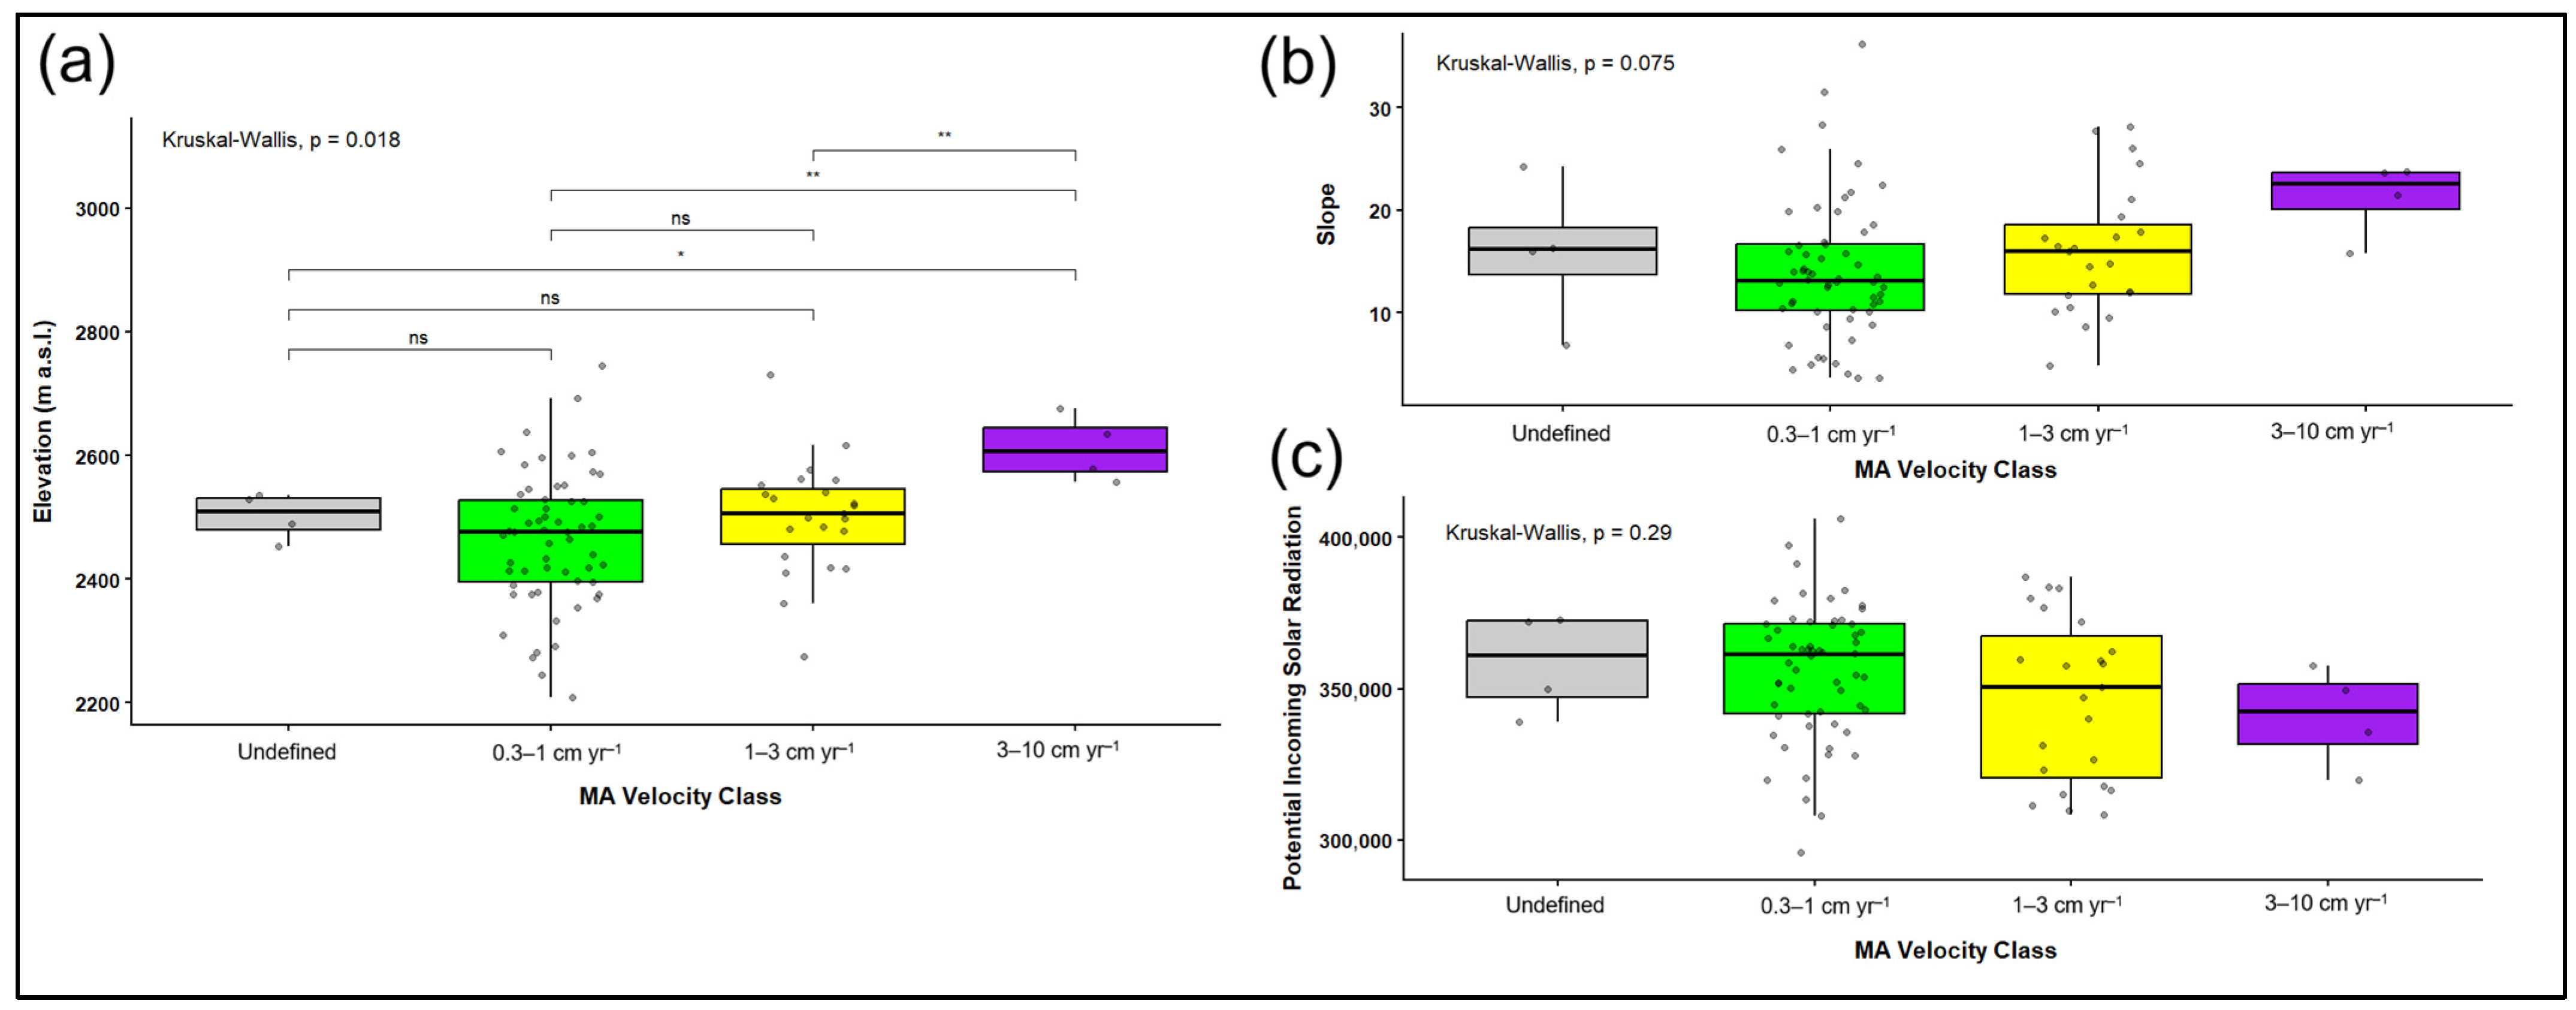
Significant differences in elevation were detected among the four LOS velocity classes (Kruskal–Wallis, H = 14.28, p = 0.003). Pairwise comparisons using Dunn’s test with Holm adjustment indicated that the MAs in the highest LOS velocity class were located at significantly higher elevations than the other MAs. There were no statistically significant differences between the 0.3 to 1 cm yr−1 class and 1 to 3 cm yr−1 class regarding their median elevation. In contrast, no significant differences were observed for slope (H = 6.90, p = 0.075) or potential incoming solar radiation (H = 3.79, p = 0.290). The circular Watson–Wheeler test indicated no statistically significant differences in the distribution of aspect among the LOS velocity classes (W = 5.26, p = 0.511), suggesting that slope orientation was not associated with rock glacier LOS velocity in the investigated dataset. Similarly, surface slope exhibited only a marginal, statistically non-significant relationship with LOS velocity (H = 6.90, p = 0.075), while potential solar radiation showed no significant relationship with LOS velocity (H = 3.79, p = 0.290). Overall, these results indicate that neither aspect, slope, nor potential solar radiation significantly influenced the observed LOS velocity patterns.
These results indicate that while topoclimatic shielding (aspect and solar radiation) and slope angles likely control the spatial niches required for rock glacier development and marginal permafrost preservation in the Pirin Mountains, they do not directly modulate the absolute magnitude of contemporary LOS velocities, which remain primarily sensitive to altitudinal gradients.
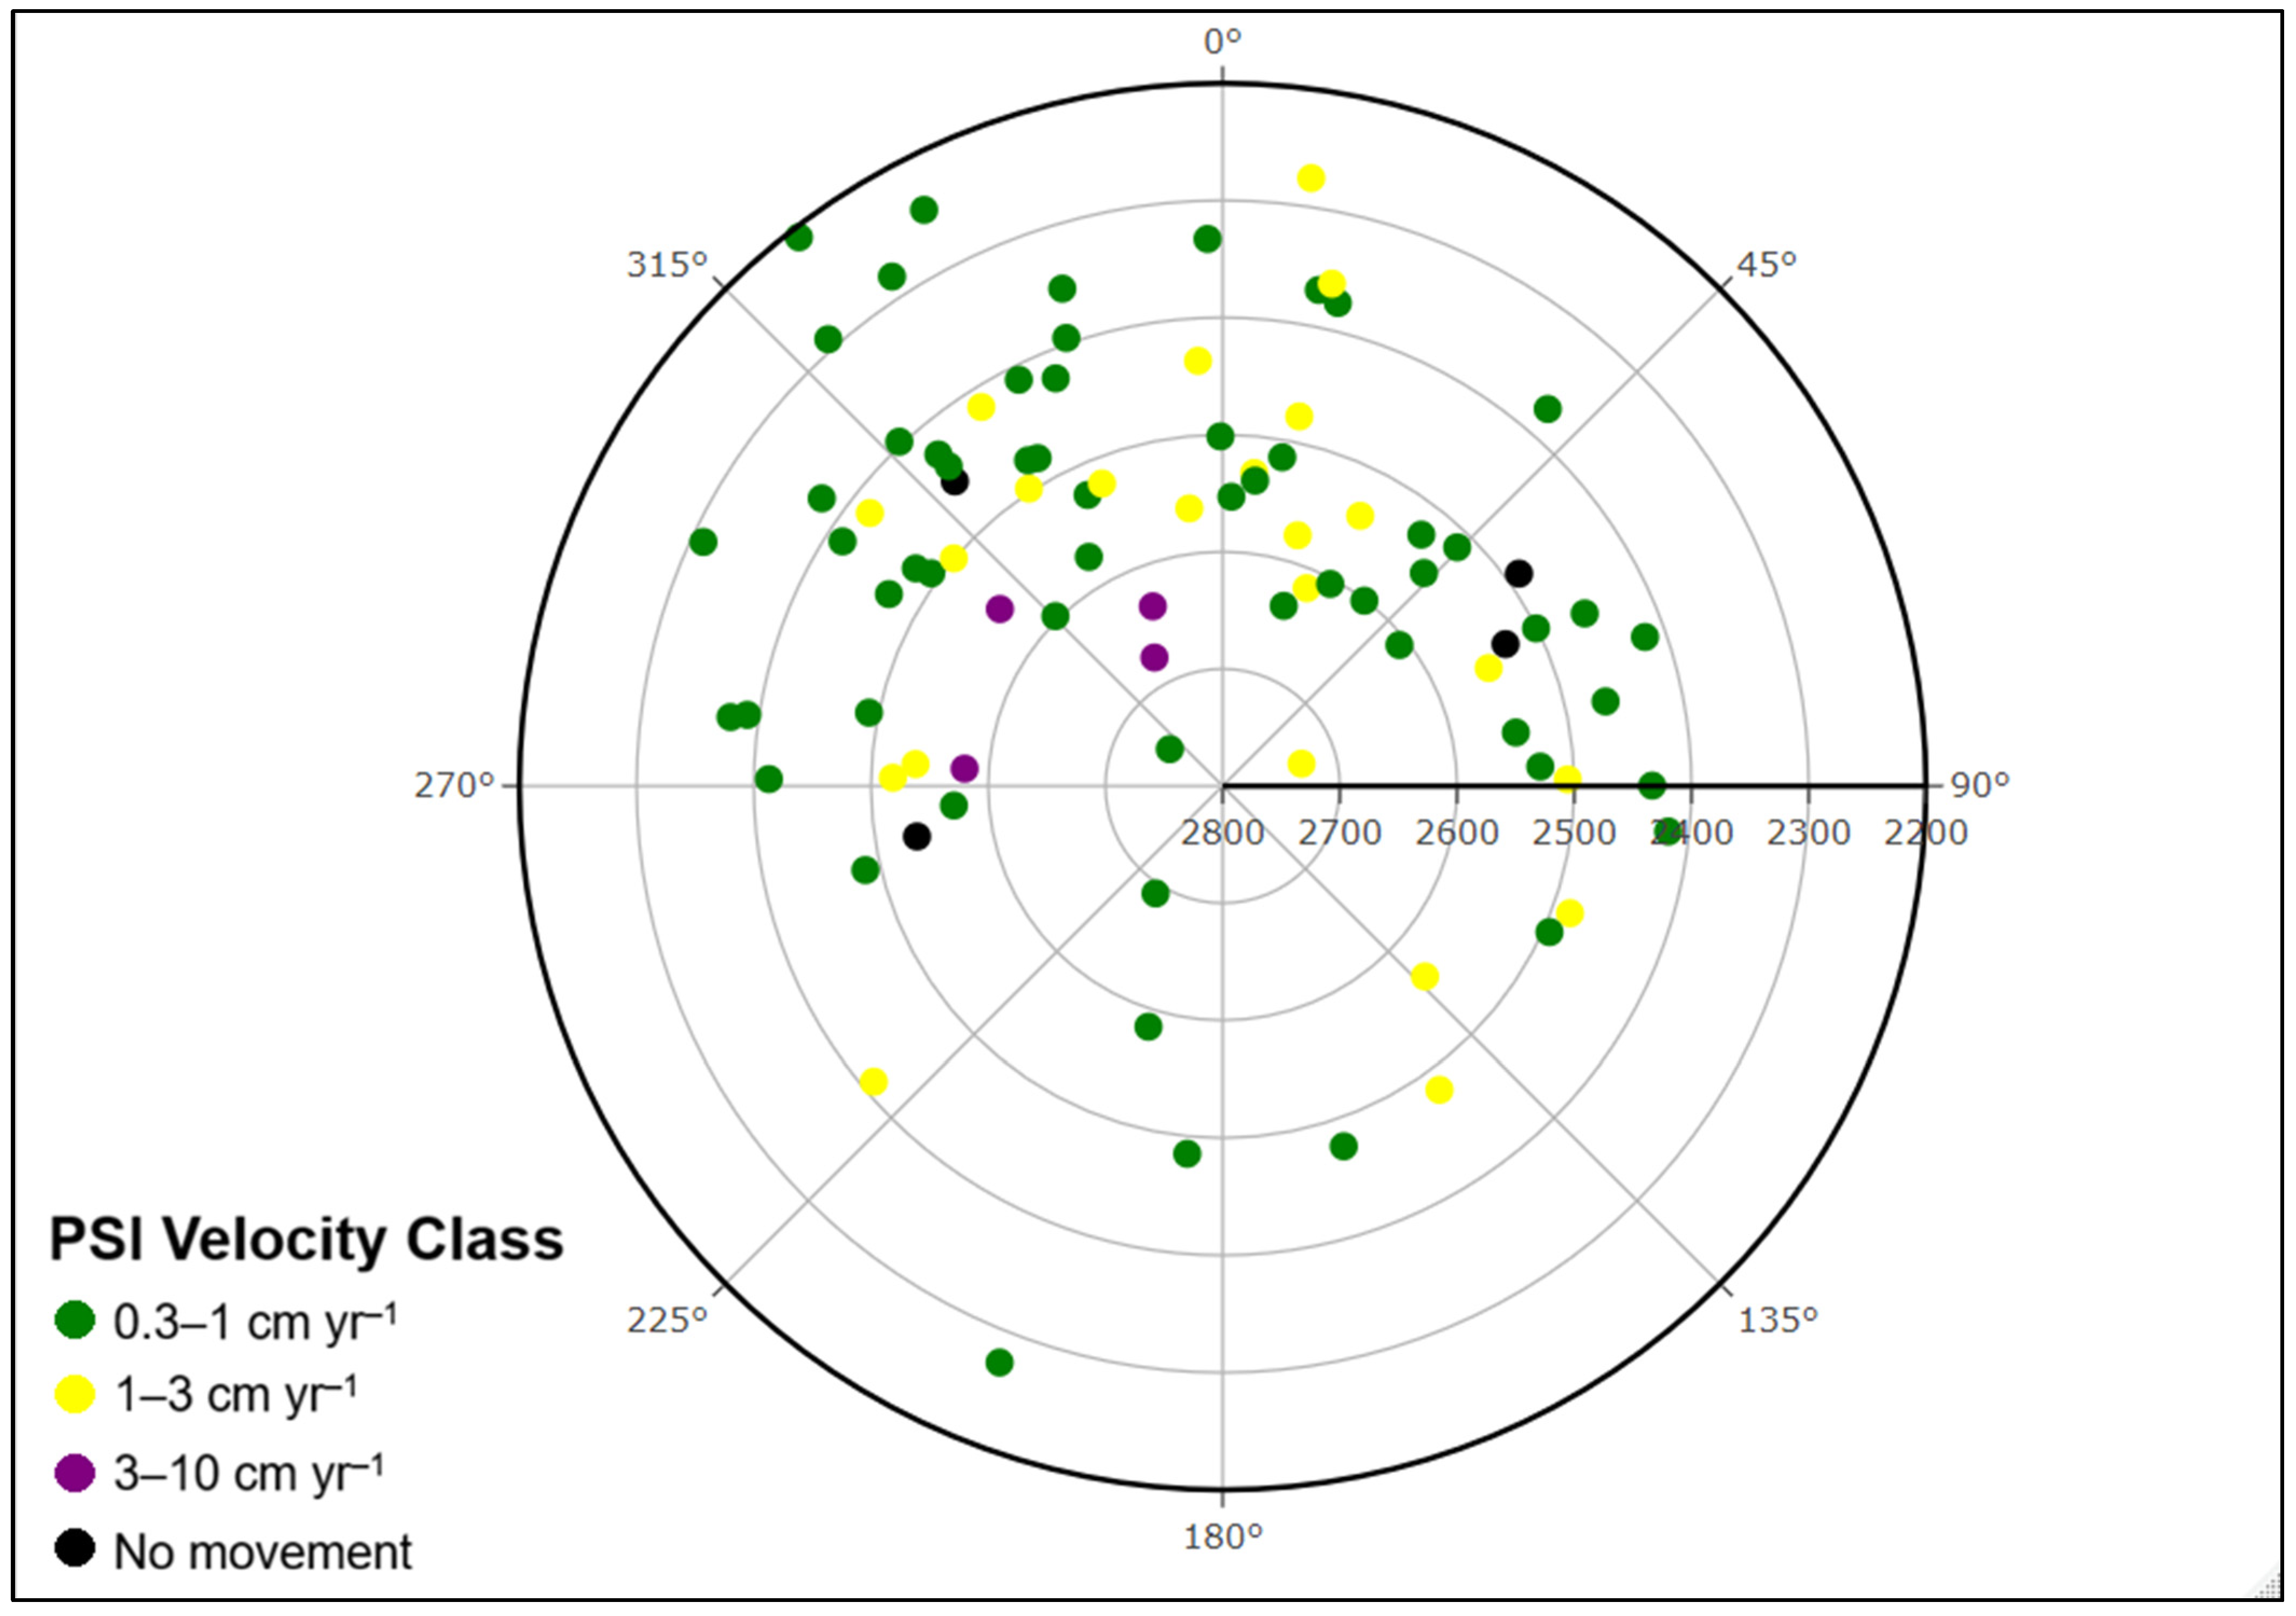
The majority of MAs (84%) are located on north-facing slopes, with northeast-facing aspects being the most common (Figure 7). In addition, all four MAs belonging to the 3–10 cm yr−1 LOS velocity class occur on north or northeast-facing slopes. Combined with their high elevations (>2600 m a.s.l.), these topographic settings likely promote reduced incoming solar radiation (Figure 8c) and more favourable conditions for the preservation of frozen ground. Nevertheless, the Watson–Wheeler test indicated no statistically significant differences in aspect among the LOS velocity classes (p = 0.511), suggesting that although aspect appears to influence the distribution of moving areas, it does not significantly control the magnitude of contemporary LOS velocities within the investigated dataset.

4.2. Rock Glacier Activity

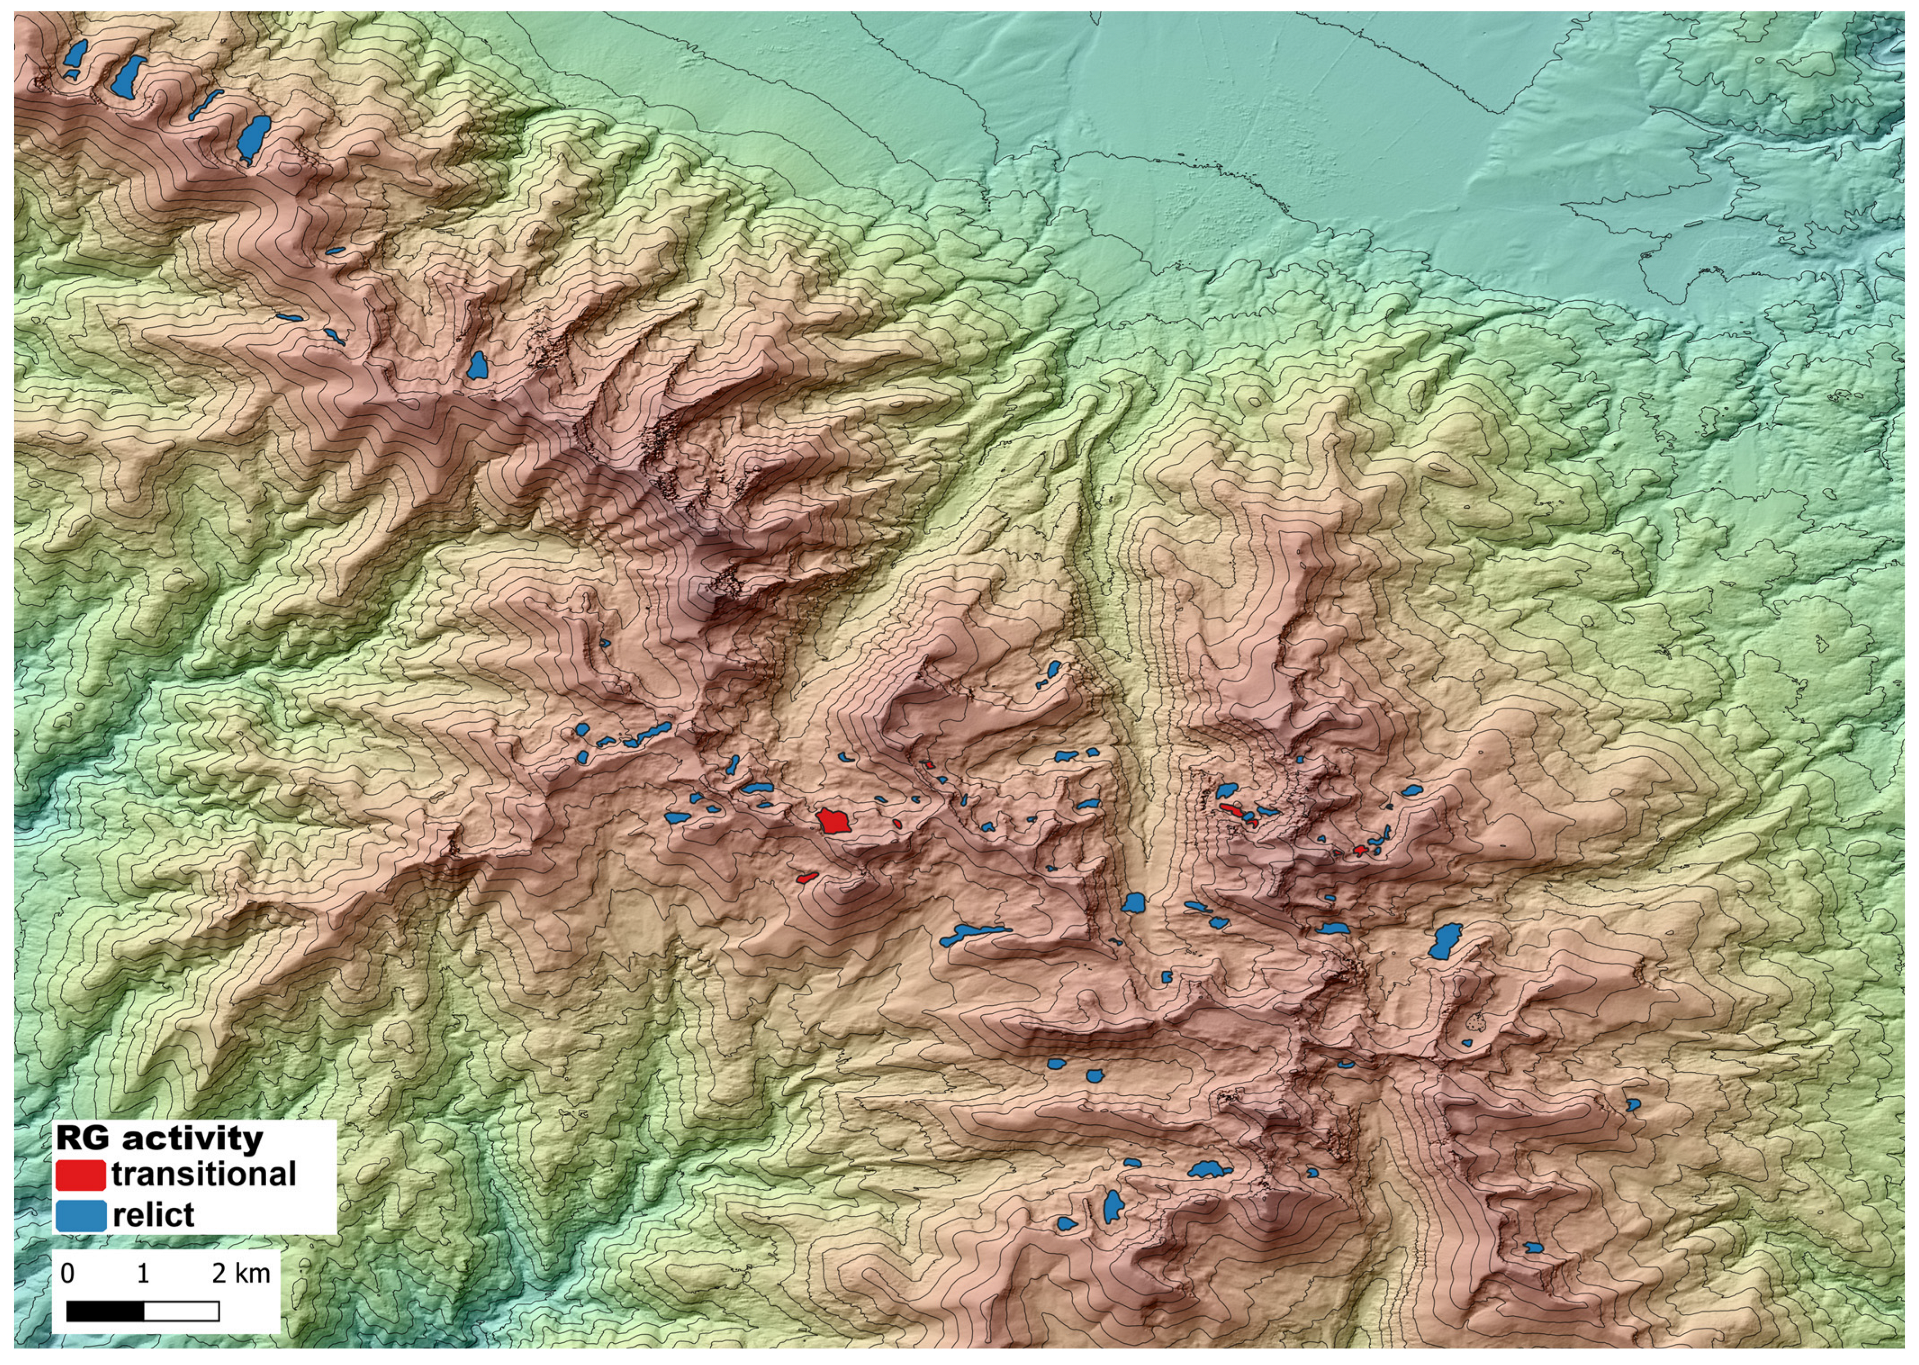
According to the Rock Glacier Inventories and Kinematics (RGIK) initiative [9] rock glaciers exhibiting no movement or only minimal displacement (<1 cm yr−1) should be classified as relict. Based on this criterion, eight rock glaciers (11% of the inventory) in the Pirin Mountains are classified as transitional, whereas all remaining rock glaciers are considered relict (Figure 9). All the transitional rock glaciers are grouped in two locations: the central part of the range in the upper reaches of the Banderitsa and Spano Pole valleys and in the eastern part of the range in two cirques surrounding Polejan Peak.
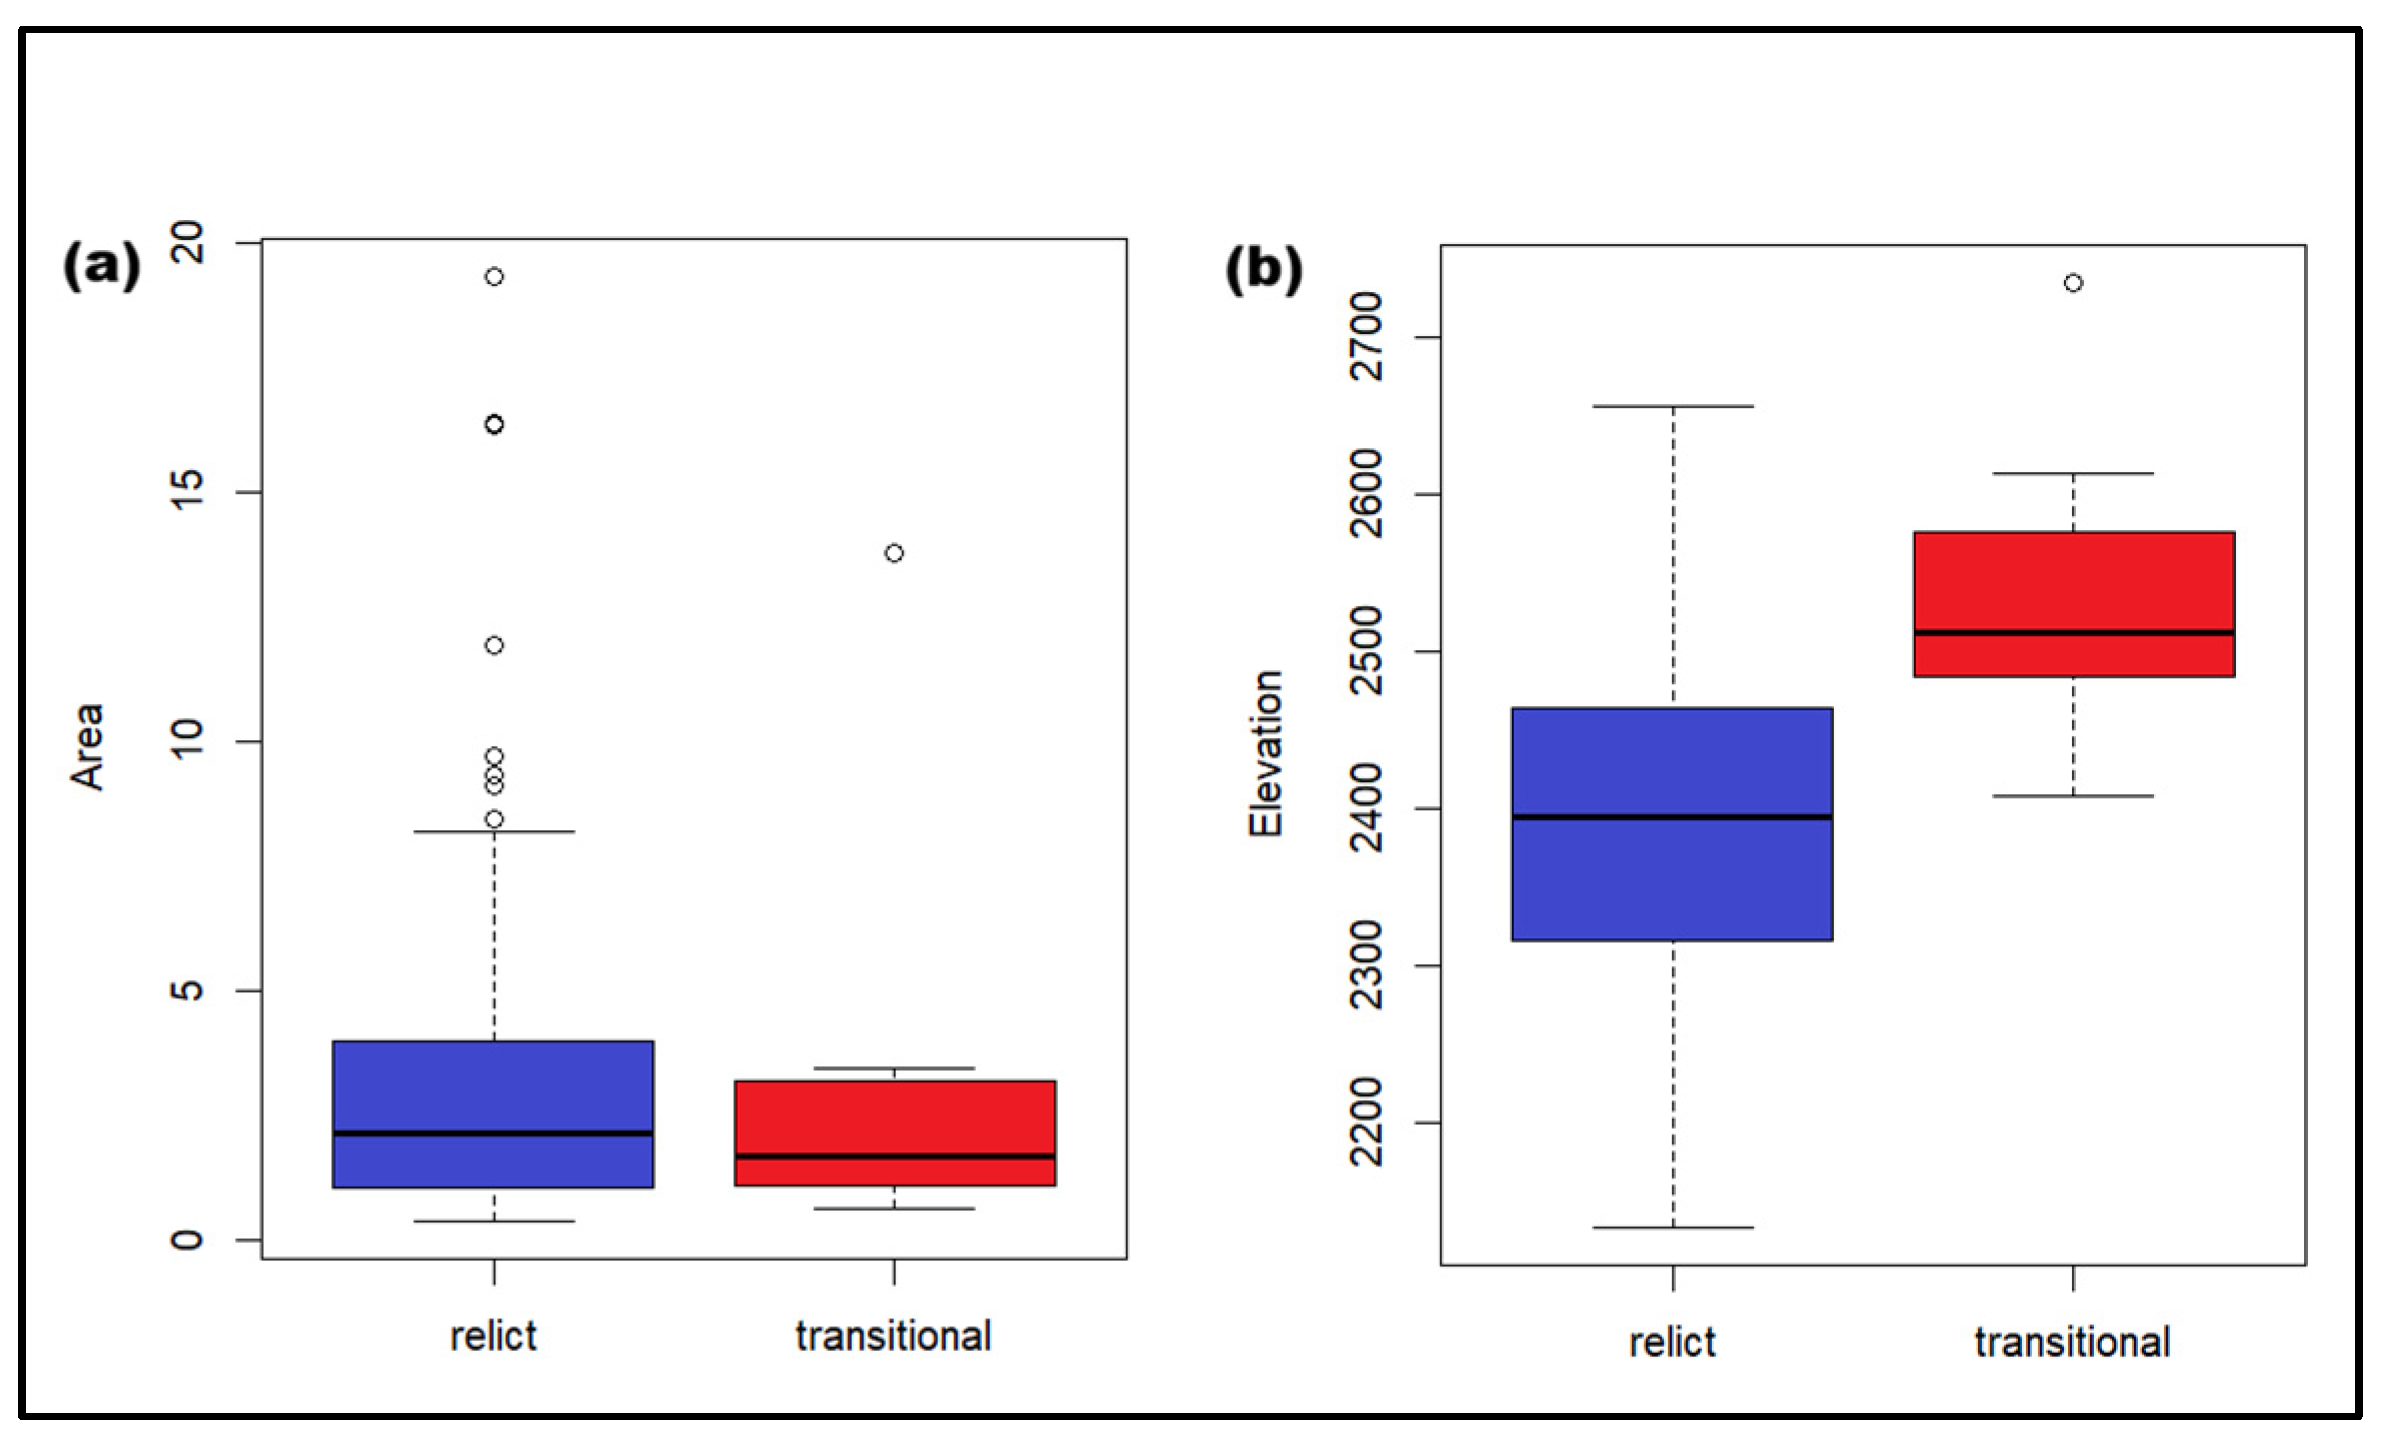
Transitional rock glaciers occur at significantly higher elevations, with a median elevation of 2535 m a.s.l., approximately 150 m higher than that of relict rock glaciers (Figure 10b). Relict landforms exhibit a slightly higher median surface area and a much wider range, characterized by several large-scale outliers exceeding 10 hectares, whereas transitional rock glaciers are more morphologically constrained, with a median area generally remaining below 3 hectares (Figure 10a).

4.3. Ground Surface Temperature

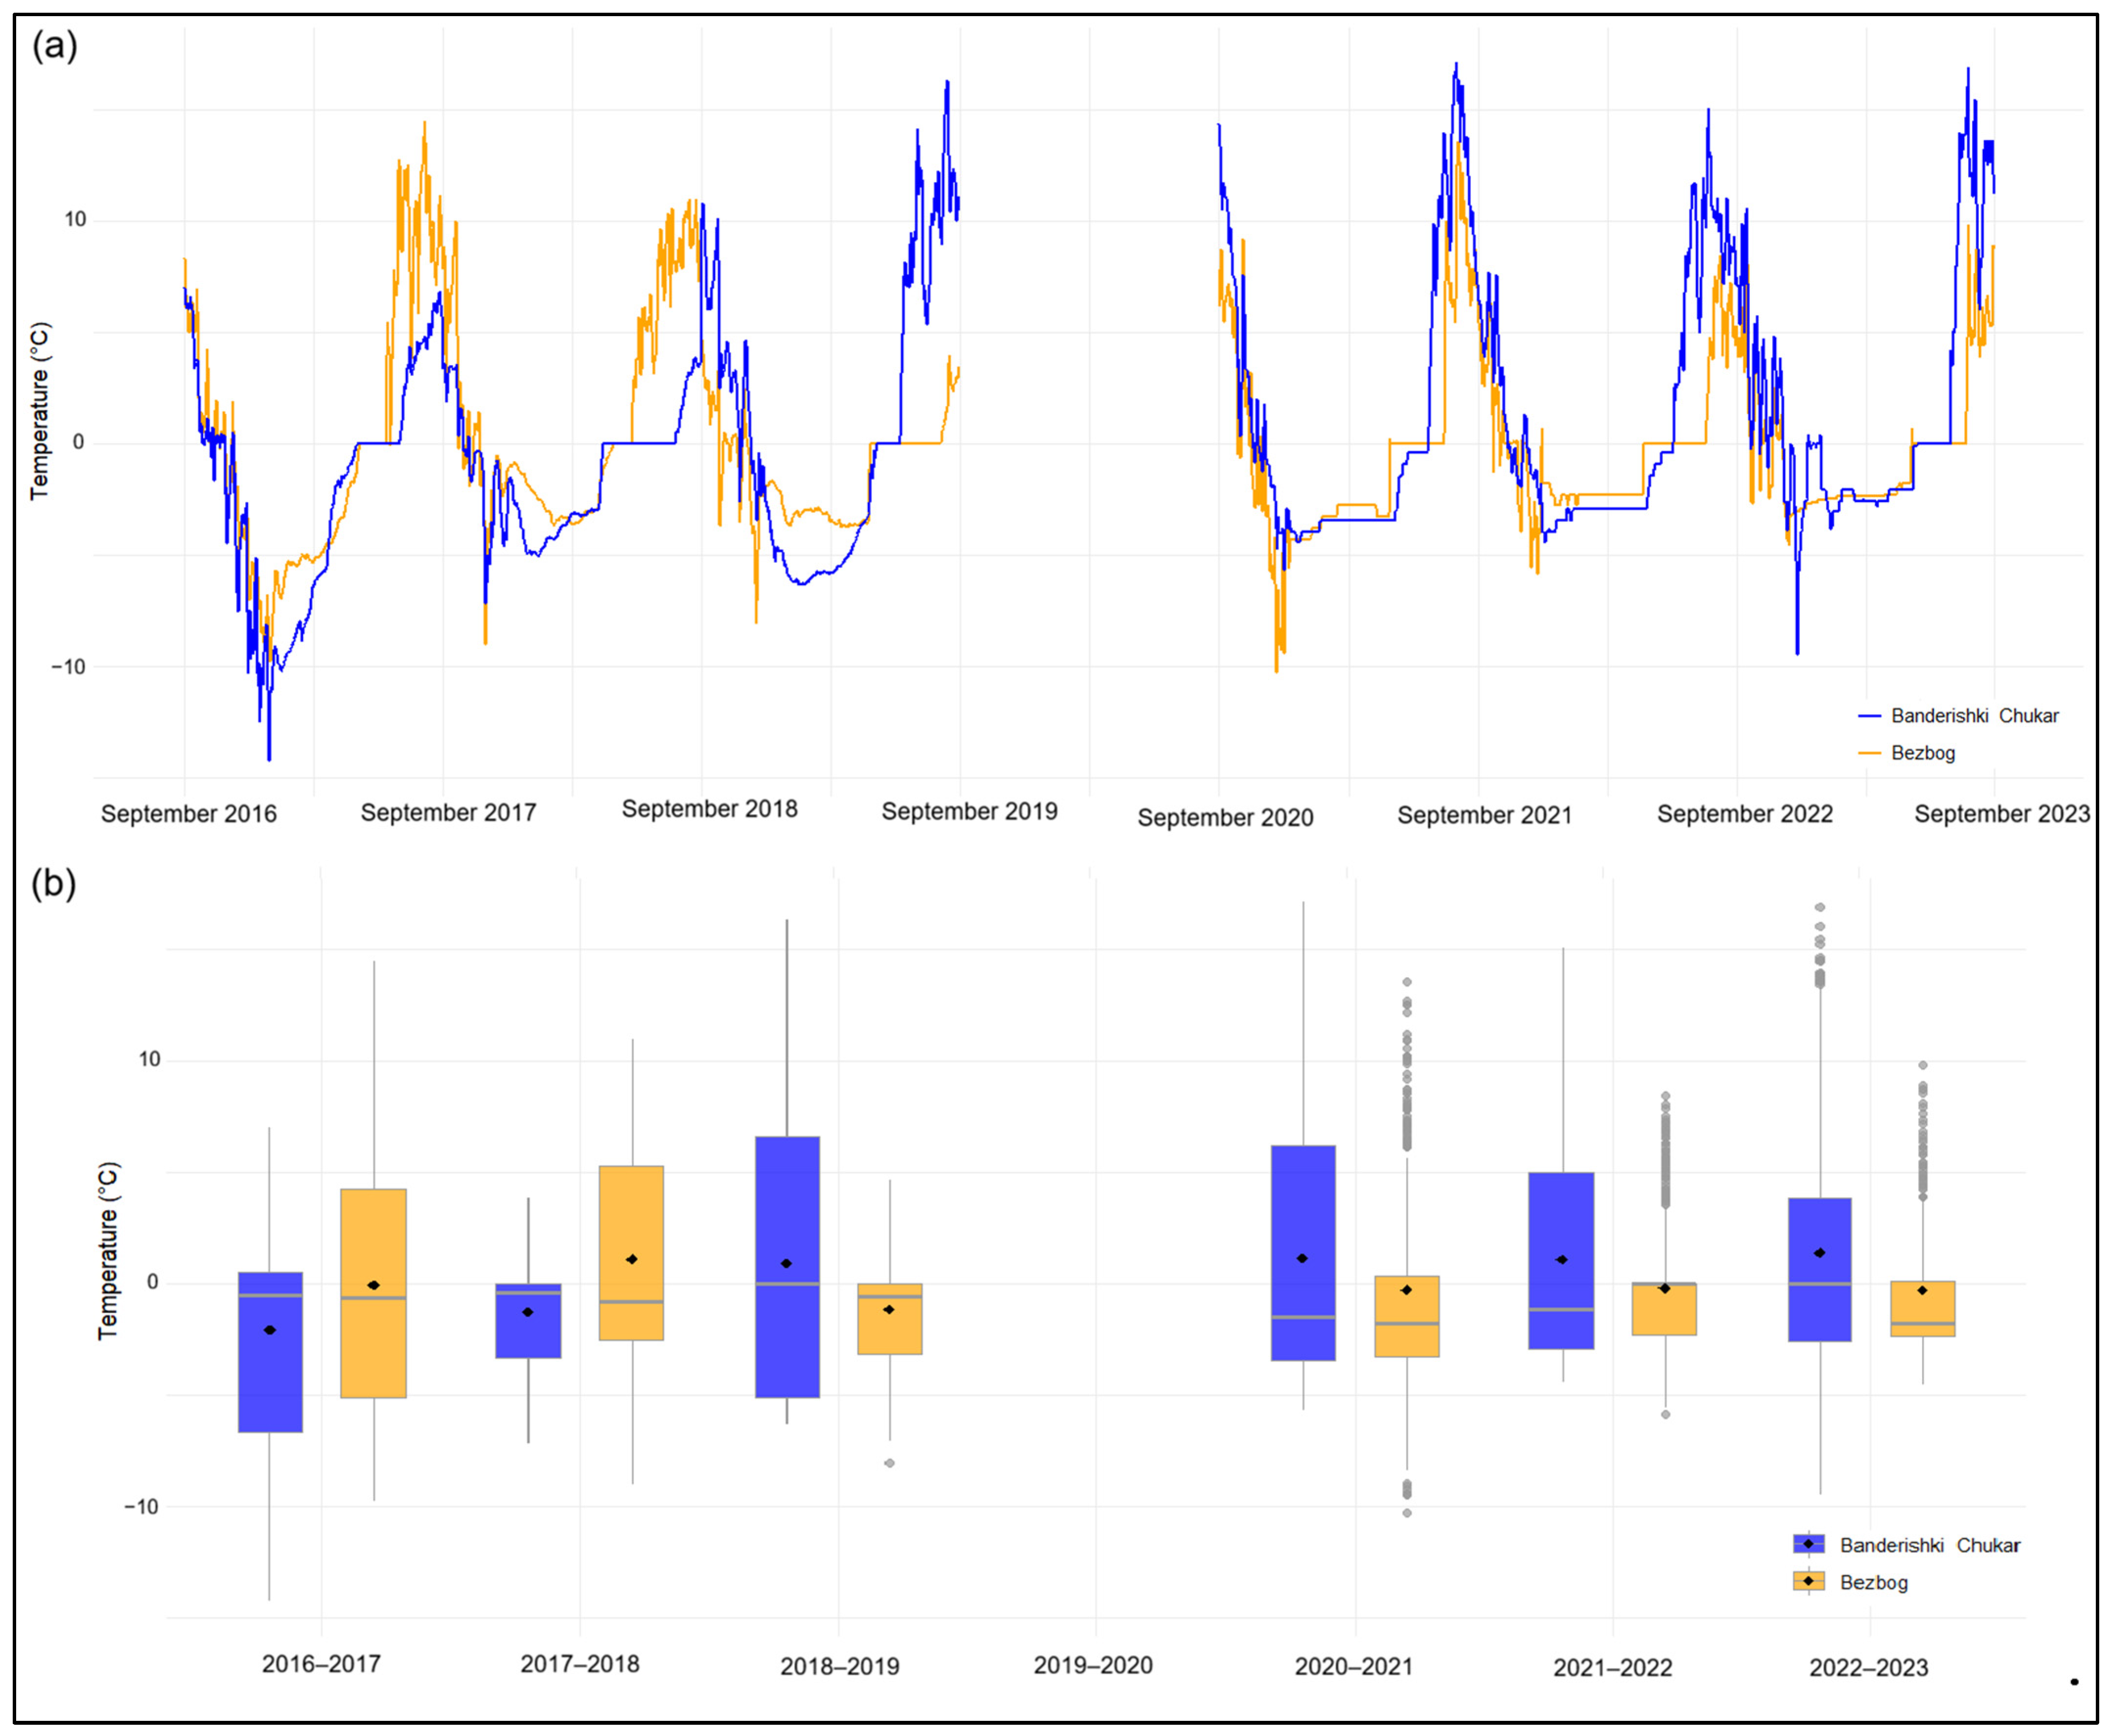
Ground surface temperature (GST) monitoring revealed marked seasonal variability at both study sites throughout the observation period (2016–2023), with similar thermal regimes observed at both the Banderishki Chukar and Bezbog rock glaciers (Figure 11). Both sites exhibited pronounced annual freeze–thaw cycles, characterized by positive summer temperatures and strongly negative winter temperatures. However, Banderishki Chukar RG consistently recorded lower winter temperatures and a larger annual thermal amplitude compared to the Bezbog rock glacier.
During winter, GST values at the Banderishki Chukar rock glacier frequently decreased below −10 °C, reaching minimum values of approximately −14 °C during the 2016–2017 season. In contrast, winter temperatures at Bezbog generally remained higher, rarely falling below −10 °C. Several winters exhibited prolonged periods of near-constant temperatures between approximately −2 °C and −4 °C, corresponding to winter equilibrium temperature (WEqT) conditions beneath a sufficiently thick snow cover.
The boxplot analysis (Figure 11b) further highlights the interannual variability of GST distributions. The Banderishki Chukar site shows consistently lower median and mean annual temperatures compared to Bezbog for most monitoring years. In addition, the wider interquartile ranges and more frequent extreme negative values observed at Banderishki Chukar indicate a more dynamic thermal regime and enhanced winter cooling. Conversely, Bezbog exhibits a comparatively narrower temperature distribution, suggesting a more thermally buffered ground surface regime.
Positive temperature outliers are particularly common during the 2020–2023 period at both sites and reflect short-term summer warming events and enhanced surface heating during snow-free conditions. The persistence of negative winter GST values at both sites suggests favourable conditions for the preservation of permafrost within coarse blocky material at the higher-elevation rock glacier sites (Figure 11b).
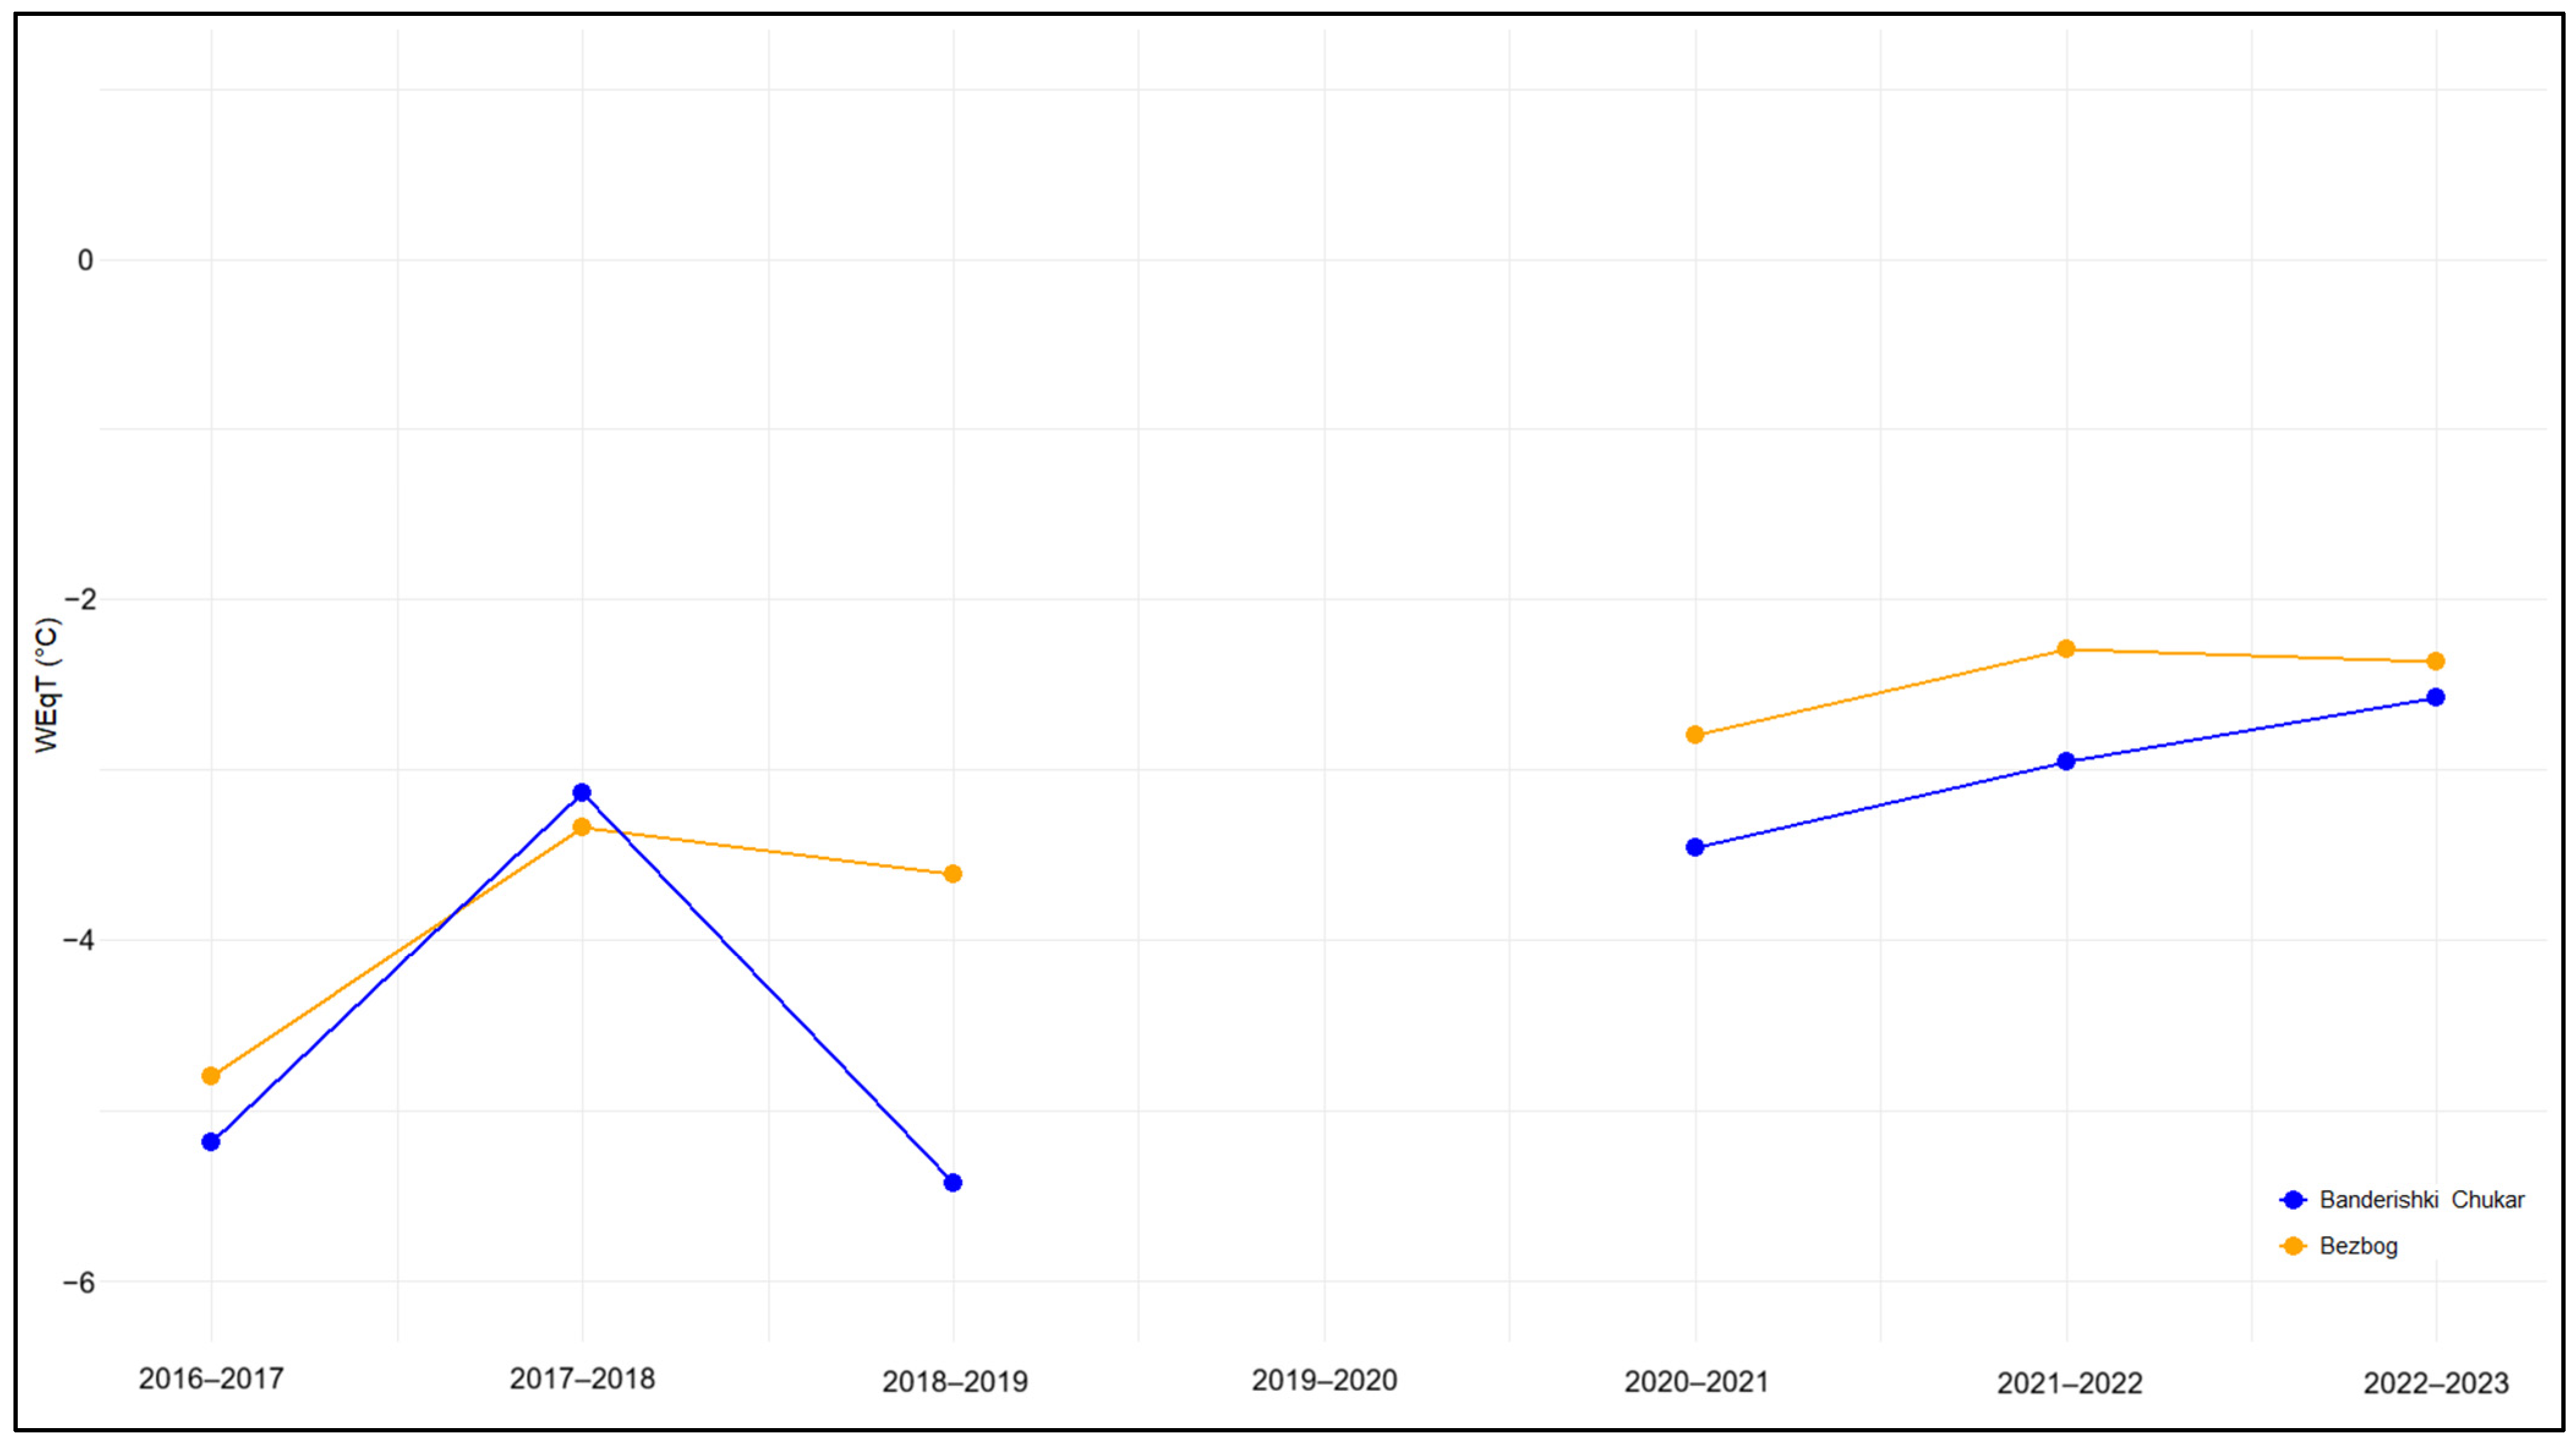
The winter equilibrium temperature (WEqT) measurements indicate consistently negative ground temperatures at both monitored rock glacier sites throughout the observation period (Figure 12), supporting the existence of favourable thermal conditions for permafrost preservation. WEqT values ranged between approximately −5.5 °C and −2.5 °C, with Banderishki Chukar systematically recording lower temperatures than Bezbog during most monitoring seasons.
The coldest conditions were observed during the 2018–2019 winter at Banderishki Chukar, where WEqT reached approximately −5.4 °C. In contrast, Bezbog exhibited comparatively higher and less variable WEqT values, generally remaining above −3.7 °C. Both sites show a gradual increase in WEqT after the 2020–2021 season, indicating a tendency toward warmer winter ground conditions in recent years. Despite this warming trend, all recorded WEqT values remained below the empirical −2 °C threshold [33,60] commonly associated with probable permafrost occurrence beneath coarse blocky material. The lower temperatures observed at Banderishki Chukar likely reflect more efficient winter cooling processes, potentially enhanced by advective air circulation within the coarse debris layer.
Overall, the WEqT dataset confirms the persistence of cold ground thermal regimes at both sites and supports the interpretation of discontinuous permafrost conditions within the highest sectors of the study area.

5. Discussion

5.1. Assessing the LOS Velocity of Rock Glaciers in the Marginal Periglacial Environment of Pirin Mountains

In marginal periglacial environments, rock glaciers typically exhibit low kinematic activity, with surface displacement velocities restricted to the millimetre-to-centimetre-per-year scale [47,61,62,63]. Quantifying such low-magnitude deformation rates presents significant observational challenges. Consequently, the systematic compilation and updating of moving areas (MAs) inventories are frequently constrained by the intrinsic limitations of conventional radar interferometry, including phase decorrelation and sensitivity thresholds [17].
PSInSAR partially mitigates these constraints, provided that the analysis is limited to snow-free acquisitions. Yet, PSInSAR inherently delivers one-dimensional (1D) measurements restricted to the satellite’s line of sight (LOS), thereby capturing only a single projection of the true 3D displacement vector. However, given the steep topographic relief characterizing alpine study areas, it is geomorphologically reasonable to assume that the principal component of motion is oriented parallel to the maximum downslope gradient. While standalone PSInSAR datasets cannot fully resolve the complete 3D velocity field without multi-geometry integration, they remain highly effective for detecting subtle surface deformations and significantly refining active rock glacier inventories in complex terrains. Furthermore, high-resolution optical imagery, such as Pléiades Neo [1], enables detailed mapping of horizontal displacement fields and may provide complementary information, particularly for areas affected by radar layover and shadow.
Slow-moving areas (i.e., 0.3–1 and 1–3 cm yr−1) are prevalent in this region, with only 5 % of MAs exceeding 3 cm yr−1. These faster MAs typically occur at higher elevations (i.e., above 2550 m a.s.l.) and receive less solar radiation than slower ones.
The temporal evolution of relative LOS velocity changes reveals a generally stable kinematic behaviour across most monitored areas, despite considerable local variability between individual features (Figure 6). Most LOS displacement time series show only moderate interannual fluctuations, suggesting relatively constant movement rates over the observation period. Nevertheless, several isolated features exhibit pronounced short-term accelerations, with relative LOS velocity values exceeding 0.4–0.5 cm yr−1, indicating episodic increases in LOS displacement.
The mean LOS velocity trend remains relatively low throughout the monitoring period, with values generally below 0.5 cm yr−1. In contrast, the upper percentile trends display a more dynamic behaviour, characterized by an initial increase between 2015 and 2016, followed by a stabilization phase and a second acceleration after 2020. This pattern may reflect the response of the most active landforms to short-term environmental forcing, such as years with anomalous temperatures, increased snow cover that takes more time to melt (see Figure 2d), or variations in ground thermal and moisture conditions.
The majority of monitored landforms exhibit low relative LOS velocity rates (<1 cm yr−1), while only a limited number of measurements account for the highest LOS displacement values. Such behaviour is consistent with observations from other mountain periglacial environments, where most rock glaciers remain relatively stable, and only a small subset displays enhanced kinematic activity [27,64,65].
The persistence of elevated LOS displacement rates in the upper LOS velocity classes after 2021 may indicate ongoing degradation of permafrost conditions and reduced internal ice stability (see Figure 12). Additionally, the large dispersion of individual trajectories highlights the strong spatial heterogeneity of rock glacier dynamics within the study area, likely controlled by local topographic, thermal, and geomorphological factors [27,66,67].

5.2. Rock Glacier Behaviour in Pirin Mountains

The PSInSAR analysis substantially enhances the existing rock glacier inventory by providing the first regional-scale assessment of rock glacier activity in the Pirin Mountains. Previous studies either did not consider the possible presence of intact rock glaciers [29] or only suggested their occurrence based on geomorphological indicators, without confirming active permafrost-related deformation due to the lack of kinematic observations [28].
The interferometric analysis revealed that eight rock glaciers exhibit LOS velocities exceeding 1 cm yr−1, indicating transitional or locally active conditions, while an additional 23 rock glaciers display low but detectable velocities between 0.3 and 1 cm yr−1. These results provide clear evidence for the persistence of permafrost-related creep processes in selected high-elevation sectors of the Pirin Mountains.
Rock glaciers in the Pirin Mountains exhibit generally low velocities and displacement patterns that typically affect only limited portions of the landform surface. These characteristics have also been reported in Northern Norway [50,61], the European Alps [63,64], the Southern Carpathians [27], the Pyrenees [47], the Tien Shan [68,69], New Zealand [70] and Utah, United States of America [71].
Such characteristics are typical of climatically inactive or transitional rock glaciers [3], which are commonly associated with thick unfrozen surface layers and relatively low internal ice content [72]. Consequently, the measured velocities may partly reflect processes such as ice-melt-induced subsidence, solifluction, or the downslope tilting and sliding of surface blocks within the active layer, rather than fully developed permafrost creep.
Nevertheless, the spatial distribution and consistency of the detected LOS displacement patterns suggest that at least part of the observed deformation is related to ongoing permafrost creep processes. Additional geophysical investigations and high-precision differential Global Navigation Satellite System (dGNSS) monitoring are required to better discriminate between these mechanisms and to improve the interpretation of rock glacier dynamics in marginal periglacial environments.

5.3. Moving Areas

An important result of this study is that a substantial proportion of the detected moving areas are located outside the mapped rock glacier boundaries. Specifically, three out of the four moving areas exhibiting velocities greater than 3 cm yr−1 and 16 out of the 23 moving areas within the 1–3 cm yr−1 LOS velocity class occur beyond the limits of the inventoried rock glaciers. This spatial distribution suggests that deformation processes in the study area are not restricted exclusively to well-developed rock glaciers but may also affect adjacent talus slopes, protalus ramparts, debris accumulations, or poorly developed periglacial landforms. Similar observations have been reported in other marginal permafrost regions, where active creep and seasonal deformation may occur in coarse blocky deposits lacking the characteristic morphology of mature rock glaciers.
The occurrence of relatively high displacement rates outside mapped rock glaciers also highlights the limitations of inventories based solely on geomorphological criteria. In several cases, PSInSAR data revealed coherent deformation patterns in areas previously considered inactive or not classified as rock glaciers. These findings demonstrate the added value of combining remote sensing-based kinematic analyses with traditional geomorphological mapping for identifying previously unrecognized landforms and processes. Furthermore, the presence of moving areas outside rock glaciers may indicate the existence of incipient periglacial features or isolated frozen debris bodies that remain undetected in conventional inventories due to subdued surface morphology or partial vegetation cover.
A substantial proportion of the detected moving areas (MAs) is located outside the boundaries of the currently mapped rock glaciers. To provide additional geomorphological context, all inventoried MAs were visually classified according to their geomorphological setting, and the resulting classification is presented in Supplementary Table S2. The identified landforms include mostly talus slopes and blocky debris accumulations that may favour the preservation of frozen ground. Nevertheless, the LOS displacement detected by PSInSAR alone does not allow the underlying deformation process to be clearly identified. Depending on the local geomorphological setting, the observed movements may reflect permafrost-related creep of coarse debris landforms, but they may also reflect talus creep, seasonal frost creep, block sliding, shallow instability, localized subsidence, or SAR-related artifacts. Therefore, the interpretation of these external moving areas as permafrost-related landforms should be regarded as preliminary and requires further validation through detailed geomorphological mapping, field investigations, or complementary datasets such as geophysical, thermal, or geodetic measurements. While the geomorphological classification presented in this study provides a first-order assessment of the environmental context of the detected moving areas, a process-based classification would require considerably more detailed investigations than those within the scope of the present study.

5.4. Marginal Permafrost in the Pirin Mountains

Previous investigations relying on regional climate models [73], top-of-permafrost equilibrium state modelling [14] and localized geophysical or thermal measurements [72] successfully indicated the probable distribution of permafrost in the Pirin Mountains. The current study advances these findings by providing a continuous, multi-annual kinematic perspective. The integration of multi-temporal PSInSAR datasets with mid to long-term in situ thermal monitoring allows us to extend both the temporal and the spatial dimensions of the study.
The PSInSAR analysis revealed persistent surface displacements in the satellite’s line of sight (LOS), ranging between 1 and 10 cm yr−1 in several moving areas, particularly above 2400 m a.s.l. Such displacement rates are consistent with the kinematic behaviour reported for transitional and locally active rock glaciers in other marginal permafrost environments across Europe [27,47,64].
Mid to long-term ground surface temperature monitoring (2016 to 2023) of two rock glaciers confirmed a cold-climate regime with MAGST values varying between −2.1 °C and 1.4 °C. Wintertime cooling and WEqT varying between −5.4 °C and −2.4 °C suggest conditions favourable for permafrost preservation. MAGST values remained predominantly negative throughout the monitoring period, while WEqT values consistently remained below the empirical −2 °C threshold commonly associated with probable permafrost occurrence beneath coarse blocky debris [53,60]. The lowest WEqT values, reaching approximately −5 °C, indicate highly efficient winter cooling conditions likely enhanced by advective air circulation within the porous debris cover [74,75]. Such thermal behaviour is characteristic of coarse blocky landforms where internal ventilation processes promote ground cooling and preserve frozen conditions despite relatively warm regional climatic settings.
These data provide evidence supporting the presence of frozen ground. They show that under the right topographical settings, high-elevation locations characterized by coarse blocky debris and shading offer favourable conditions for permafrost occurrence. However, the spatial coverage of the monitoring network is insufficient to validate the thermal conditions of all detected moving areas or all inventoried rock glaciers. Thus, the thermal observations should be regarded as site-specific evidence supporting, rather than confirming, the interpretation of permafrost-related deformation across the entire study area.
Additionally, the observed long-term GST evolution suggests that although recent years show a slight warming tendency, ground temperatures remain sufficiently low to allow the persistence of permafrost in topographically favourable locations. The predominance of north- and northeast-facing slopes, combined with high elevation and reduced incoming solar radiation, likely contributes to maintaining these cold ground thermal regimes. These conditions are similar to those found in the Rila Mountains [72] and the Southern Carpathians [27,76]. Taken together, the combined evidence from PSInSAR-derived kinematics, ground thermal monitoring (MAGST and WEqT), and geomorphological observations provides supporting evidence for the occurrence of marginal and spatially discontinuous permafrost within the upper sectors of several rock glaciers in the study area. These findings are consistent with observations from other mountain regions characterized by marginal periglacial conditions, where permafrost persistence is increasingly controlled by local topoclimatic factors and internal debris ventilation processes rather than by regional air temperature alone [28,61,76,77,78].

6. Conclusions

This study provides a comprehensive assessment of rock glacier dynamics in the marginal periglacial environment of the Pirin Mountains, leading to the following primary conclusions:
The geomorphological and kinematic inventory indicates a clear predominance of inactive landforms within the study area, with only approximately 11% of the inventoried rock glaciers classified as transitional.
The detected LOS displacement rates generally exhibit stable temporal trends throughout the monitoring period, proving that the application of PSInSAR is an effective approach for detecting long-term localized surface deformation and assessing rock glacier activity based on kinematic characteristics.
A total of 89 moving areas (MAs) were identified across the study area. The kinematic regime is dominated by low-velocity deformation, with most MAs belonging to the 0.3–1 cm yr−1 and 1–3 cm yr−1 LOS velocity classes. Areas exhibiting higher displacement rates (3–10 cm yr−1) are preferentially distributed above 2500 m a.s.l. within sectors characterized by reduced potential incoming solar radiation, emphasizing the importance of local topoclimatic controls for the preservation of frozen ground conditions.
Most of the faster-moving areas are located outside rock glaciers, predominantly on talus slopes, highlighting the possible presence of previously unrecognized permafrost-related deformation processes.
The updated rock glacier inventory and the identification of active landforms establish a valuable baseline for future studies on permafrost distribution, rock glacier dynamics, and climate change impacts in the Pirin Mountains. Expanding similar investigations to other Bulgarian mountain ranges would improve the regional understanding of periglacial landscape evolution and contemporary permafrost occurrence.

Supplementary Materials

The following supporting information can be downloaded at: https://www.mdpi.com/article/10.3390/rs18162754/s1, Figure S1: A comparison in PSInSAR point density between EGMS (left image) and PSTool from Terrasigna (right image). Please note that the aim of the figure is to compare point densities between the two data sets, thus the different time period of the acquisitions is irrelevant; Figure S2: An Example of measurements in the LOS direction that can be interpreted based on local topography, using PSTool: Path 7 DESC displacement pattern of a point in the middle of the rock glacier. The red points indicate subsidence, they are moving mainly downwards while they are located on a flat area; Figure S3: An Example of measurements in the LOS direction that can be interpreted based on local topography, using PSTool Path 7 DESC displacement patterns on the slopes of the mountain. The blue points indicate downslope movement. They are moving towards the SAR sensor and they are located on a slope; Figure S4: An Example of the transect functionality, that enhances the visualization of the spatial displacement in time for a more intuitive view of the dynamic process, of the PSTool. The data are derived from Path 7 DESC and the displacement values are on the LOS direction; Table S1: Rock glacier inventory. Note that the “fid” in the table is compatible with the “fid” in Table S3 and with the “fid” in additional data provided in the Zenodo repository; Table S2: Summary of the Moving Area (MA) mapped features with the attribute table used to derive the statistical analysis and Figure 5, Figure 7, Figure 8 and Figure 10. Note that the “fid” of the moving areas is compatible with the “fid” in additional data provided in the Zenodo repository; Table S3: Location of rock glaciers, small glaciers and all the other features mention in the present paper. Note that the “fid” of the rock glaciers is compatible with the “fid” in Table S1 and with the “fid” in additional data provided in the Zenodo repository.

Author Contributions

Conceptualization: F.S. and A.O.; methodology: F.S., V.P., T.S.; validation: E.G. and A.O.; formal analysis: F.S., F.A., A.O.; data curation: F.A.; writing—original draft preparation: F.S.; writing—review and editing: V.P., T.S., A.O.; project administration: F.S. All authors have read and agreed to the published version of the manuscript.

Funding

This research was funded by the ESA Permafrost CCI project—grant number 4000123681/18/I-NB; and ChronoCaRP, project code: PNRR-III-C9 2022-I8, CF 253/29.11.2022, contract no:760055/23.05.2023, funded by the EU, Next Generation Europe.

Data Availability Statement

The rock glacier inventory and the moving areas are freely available at: https://doi.org/10.5281/zenodo.20477315. The original PSInSAR data can be requested for viewing at https://pstool.terrasigna.com.

Acknowledgments

The authors would like to thank and acknowledge the work of Mirela Vasile, Cristian Adrian Ardelean and Petru Urdea for their work in compiling the rock glacier inventory.

Conflicts of Interest

Author Valentin Poncoș was employed by the company Terrasigna. Author Tazio Strozzi was employed by the company Gamma Remote Sensing. The remaining authors declare that the research was conducted in the absence of any commercial or financial relationships that could be construed as a potential conflict of interest.

Abbreviations

The following abbreviations are used in this manuscript:
PSInSARPersistent Scatterer Interferometric Synthetic Aperture Radar
MAMoving area
ECVEssential Climate Variable
GCOSGlobal Climate Observing System
GNSSGlobal Navigation Satellite Systems
dGNSSdifferential GNSS
TLSTerrestrial laser scanning
ESAEuropean Space Agency
IPAInternational Permafrost Association
MAATMean Annual Air Temperatures
LGMLast Glacial Maximum
GSTGround surface temperature
MAGSTMean annual ground surface temperature
WEqTWinter equilibrium temperature
PSPersistent Scatterers
TOPSTerrain Observation with Progressive Scans
SNRSignal-to-Noise Ratio
EGMSEuropean Ground Motion Service
LOSLine-of-Sight
DEMDigital elevation model
RoGIRock Glacier Inventory
RGIKRock Glacier Inventories and Kinematics
RGRock glacier

References

  1. Vivero, S.; Pellet, C.; Farías-Barahona, D. Evaluating Pléiades Neo capabilities for deriving rock glacier velocity. Int. J. Appl. Earth Obs. Geoinf. 2026, 148, 105207. [Google Scholar] [CrossRef] [Scilit]
  2. Ishikawa, M.; Watanabe, T.; Nakamura, N. Genetic differences of rock glaciers and the discontinuous mountain permafrost zone in Kanchanjunga Himal, eastern Nepal. Permafr. Periglac. Process. 2001, 12, 243–253. [Google Scholar] [CrossRef] [Scilit]
  3. Barsch, D. Rockglaciers: Indicators for the Present and Former Geoecology in High Mountain Environments; Springer: Berlin, Germany, 1996; Volume 331. [Google Scholar]
  4. Berthling, I. Beyond confusion: Rock glaciers as cryo-conditioned landforms. Geomorphology 2011, 131, 98–106. [Google Scholar] [CrossRef] [Scilit]
  5. Jones, D.B.; Harrison, S.; Anderson, K.; Betts, R.A. Mountain rock glaciers contain globally significant water stores. Sci. Rep. 2018, 8, 2834. [Google Scholar] [CrossRef] [Scilit] [PubMed]
  6. Haeberli, W.; Noetzli, J.; Arenson, L.; Delaloye, R.; Gärtner-Roer, I.; Gruber, S.; Isaksen, K.; Kneisel, C.; Krautblatter, M.; Phillips, M. Mountain permafrost: Development and challenges of a young research field. J. Glaciol. 2010, 56, 1043–1058. [Google Scholar] [CrossRef] [Scilit]
  7. Cicoira, A.; Beutel, J.; Faillettaz, J.; Vieli, A. Water controls the seasonal rhythm of rock glacier flow. Earth Planet. Sci. Lett. 2019, 528, 115844. [Google Scholar] [CrossRef] [Scilit]
  8. Brardinoni, F.; Vivero, S.; Barboux, C.; Bodin, X.; Cicoira, A.; Echelard, T.; Hu, Y.; Jones, N.; Lambiel, C.; Macdonell, S.; et al. RGIK guidelines for compiling consistent rock glacier inventories. Geomorphology 2026, 492, 110050. [Google Scholar] [CrossRef] [Scilit]
  9. RGIK. Guidelines for Inventorying Rock Glaciers: Baseline and Practical Concepts (Version 1.0); IPA Action Group Rock glacier Inventories and Kinematics: Fribourg, Switzerland, 2023. [Google Scholar] [CrossRef] [Scilit]
  10. Boeckli, L.; Brenning, A.; Gruber, S.; Noetzli, J. A statistical approach to modelling permafrost distribution in the European Alps or similar mountain ranges. Cryosphere 2012, 6, 125–140. [Google Scholar] [CrossRef] [Scilit]
  11. Schmid, M.O.; Baral, P.; Gruber, S.; Shahi, S.; Shrestha, T.; Stumm, D.; Wester, P. Assessment of permafrost distribution maps in the Hindu Kush Himalayan region using rock glaciers mapped in Google Earth. Cryosphere 2015, 9, 2089–2099. [Google Scholar] [CrossRef] [Scilit]
  12. Azócar, G.F.; Brenning, A.; Bodin, X. Permafrost distribution modelling in the semi-arid Chilean Andes. Cryosphere 2017, 11, 877–890. [Google Scholar] [CrossRef] [Scilit]
  13. Boeckli, L.; Brenning, A.; Gruber, S.; Noetzli, J. Permafrost distribution in the European Alps: Calculation and evaluation of an index map and summary statistics. Cryosphere 2012, 6, 807–820. [Google Scholar] [CrossRef] [Scilit]
  14. Obu, J.; Westermann, S.; Bartsch, A.; Berdnikov, N.; Christiansen, H.H.; Dashtseren, A.; Delaloye, R.; Elberling, B.; Etzelmüller, B.; Kholodov, A.; et al. Northern Hemisphere permafrost map based on TTOP modelling for 2000-2016 at 1 km2 scale. Earth-Sci. Rev. 2019, 193, 299–316. [Google Scholar] [CrossRef] [Scilit]
  15. Strozzi, T.; Caduff, R.; Jones, N.; Barboux, C.; Delaloye, R.; Bodin, X.; Kääb, A.; Mätzler, E.; Schrott, L. Monitoring Rock Glacier Kinematics with Satellite Synthetic Aperture Radar. Remote Sens. 2020, 12, 559. [Google Scholar] [CrossRef] [Scilit]
  16. Kääb, A.; Strozzi, T.; Bolch, T.; Caduff, R.; Trefall, H.; Stoffel, M.; Kokarev, A. Inventory and changes of rock glacier creep speeds in Ile Alatau and Kungoy Ala-Too, northern Tien Shan, since the 1950s. Cryosphere 2021, 15, 927–949. [Google Scholar] [CrossRef] [Scilit]
  17. Bertone, A.; Barboux, C.; Bodin, X.; Bolch, T.; Brardinoni, F.; Caduff, R.; Christiansen, H.H.; Darrow, M.M.; Delaloye, R.; Etzelmüller, B.; et al. Incorporating InSAR kinematics into rock glacier inventories: Insights from 11 regions worldwide. Cryosphere 2022, 16, 2769–2792. [Google Scholar] [CrossRef] [Scilit]
  18. RGIK. InSAR-Based Kinematic Attribute in Rock Glacier Inventories. Practical InSAR Guidelines, Version 4.0; 31.05.2023; IPA Action Group Rock Glacier Inventories and Kinematics (RGIK): Fribourg, Switzerland, 2023; p. 33. [Google Scholar]
  19. Rouyet, L.; Bolch, T.; Brardinoni, F.; Caduff, R.; Cusicanqui, D.; Darrow, M.; Delaloye, R.; Echelard, T.; Lambiel, C.; Pellet, C.; et al. Rock Glacier Inventories (RoGIs) in 12 areas worldwide using a multi-operator consensus-based procedure. Earth Syst. Sci. Data 2025, 17, 4125–4157. [Google Scholar] [CrossRef] [Scilit]
  20. Knight, J.; Harrison, S. Mountain Glacial and Paraglacial Environments under Global Climate Change: Lessons from the Past, Future Directions and Policy Implications. Geogr. Ann. Ser. A-Phys. Geogr. 2014, 96, 245–264. [Google Scholar] [CrossRef] [Scilit]
  21. Hu, Y.; Arenson, L.U.; Barboux, C.; Bodin, X.; Cicoira, A.; Delaloye, R.; Gärtner-Roer, I.; Kääb, A.; Kellerer-Pirklbauer, A.; Lambiel, C.; et al. Rock Glacier Velocity: An Essential Climate Variable Quantity for Permafrost. Rev. Geophys. 2025, 63, e2024RG000847. [Google Scholar] [CrossRef] [Scilit]
  22. Bürgmann, R.; Rosen, P.A.; Fielding, E.J. Synthetic aperture radar interferometry to measure Earth’s surface topography and its deformation. Annu. Rev. Earth Planet. Sci. 2000, 28, 169–209. [Google Scholar] [CrossRef] [Scilit]
  23. Ferretti, A.; Prati, C.; Rocca, F. Permanent scatterers in SAR interferometry. IEEE Trans. Geosci. Remote Sens. 2001, 39, 8–20. [Google Scholar] [CrossRef] [Scilit]
  24. Berti, M.; Corsini, A.; Franceschini, S.; Iannacone, J.P. Automated classification of Persistent Scatterers Interferometry time series. Nat. Hazards Earth Syst. Sci. 2013, 13, 1945–1958. [Google Scholar] [CrossRef] [Scilit]
  25. Crosetto, M.; Monserrat, O.; Cuevas-González, M.; Devanthéry, N.; Crippa, B. Persistent Scatterer Interferometry: A review. ISPRS J. Photogramm. Remote Sens. 2016, 115, 78–89. [Google Scholar] [CrossRef] [Scilit]
  26. Rouyet, L.; Lauknes, T.R.; Christiansen, H.H.; Strand, S.M.; Larsen, Y. Seasonal dynamics of a permafrost landscape, Adventdalen, Svalbard, investigated by InSAR. Remote Sens. Environ. 2019, 231, 111236. [Google Scholar] [CrossRef] [Scilit]
  27. Onaca, A.; Sîrbu, F.; Poncos, V.; Hilbich, C.; Strozzi, T.; Urdea, P.; Popescu, R.; Berzescu, O.; Etzelmüller, B.; Vespremeanu-Stroe, A.; et al. Slow-moving rock glaciers in marginal periglacial environment of Southern Carpathians. Earth Surf. Dyn. 2025, 13, 981–1001. [Google Scholar] [CrossRef] [Scilit]
  28. Magori, B.; Urdea, P.; Onaca, A.; Ardelean, F. Distribution and characteristics of rock glaciers in the Balkan Peninsula. Geogr. Ann. Ser. A-Phys. Geogr. 2020, 102, 354–375. [Google Scholar] [CrossRef] [Scilit]
  29. P Dimitrov, A.G. Relict rock glaciers identification and mapping in Pirin mountain using aerial and satellite images. In Proceedings of the Seventh Scientific Conference with International Participation “Space, Ecology, Safety”, Sofia, Bulgaria, 2–4 November 2012. [Google Scholar]
  30. Kummert, M.; Delaloye, R.; Braillard, L. Erosion and sediment transfer processes at the front of rapidly moving rock glaciers: Systematic observations with automatic cameras in the western Swiss Alps. Permafr. Periglac. Process. 2018, 29, 21–33. [Google Scholar] [CrossRef] [Scilit]
  31. Blöthe, J.H.; Rosenwinkel, S.; Höser, T.; Korup, O. Rock-glacier dams in High Asia. Earth Surf. Process. Landf. 2019, 44, 808–824. [Google Scholar] [CrossRef] [Scilit]
  32. Humlum, O. The climatic significance of rock glaciers. Permafr. Periglac. Process. 1998, 9, 375–395. [Google Scholar] [CrossRef]
  33. Brenning, A. Geomorphological, hydrological and climatic significance of rock glaciers in the Andes of Central Chile (33–35°S). Permafr. Periglac. Process. 2005, 16, 231–240. [Google Scholar] [CrossRef] [Scilit]
  34. Gachev, E.; Stoyanov, K.; Gikov, A. Small glaciers on the Balkan Peninsula: State and changes in the last several years. Quat. Int. 2016, 415, 33–54. [Google Scholar] [CrossRef] [Scilit]
  35. DLR. TanDEM-X 12 m Digital Elevation Model (DEM); German Aerospace Center: Cologne, Germany, 2016. [Google Scholar]
  36. Krieger, G.; Moreira, A.; Fiedler, H.; Hajnsek, I.; Werner, M.; Younis, M.; Zink, M. TanDEM-X: A satellite formation for high-resolution SAR interferometry. IEEE Trans. Geosci. Remote Sens. 2007, 45, 3317–3341. [Google Scholar] [CrossRef] [Scilit]
  37. Gachev, E. High mountain relief in marble in Pirin Mountains, Bulgaria: Structure, specifics and evolution. Rev. Geomorfol. 2017, 19, 118–135. [Google Scholar] [CrossRef] [Scilit]
  38. Grunewald, K.; Scheithauer, J. Climate Data and Geo-Archives of the Recent Past, in Landscape Development and Climate Change in Southwest Bulgaria (Pirin Mountains); Grunewald, K., Scheithauer, J., Eds.; Springer: Dordrecht, The Netherlands, 2011; pp. 61–121. [Google Scholar]
  39. Gachev, E. Small glaciers in the mountains of Souheastern Europe; Neofit Rilski University Publishing House: Bulgaria, Blagoevgrad, 2023; 320p. [Google Scholar]
  40. Kuhlemann, J.; Gachev, E.; Gikov, A.; Nedkov, S.; Krumrei, I.; Kubik, P. Glaciation in the Rila mountains (Bulgaria) during the Last Glacial Maximum. Quat. Int. 2013, 293, 51–62. [Google Scholar] [CrossRef] [Scilit]
  41. Telbisz, T.; Krasznai, M.; Gachev, E.; Gikov, A.; Ruszkiczay-Rüdiger, Z. Cirque morphometry of Rila and Pirin Mountains (Bulgaria). Geomorphology 2025, 483, 109819. [Google Scholar] [CrossRef] [Scilit]
  42. Georgieva, G.; Tzankov, C.; Kisyov, A. Geophysical measurements of the southernmost microglacier in Europe suggestpermafrost occurrence in the Pirin Mountains (Bulgaria). Cryosphere 2022, 16, 4847–4863. [Google Scholar] [CrossRef] [Scilit]
  43. Onaca, A.; Gachev, E.; Ardelean, F.; Ardelean, A.; Perșoiu, A.; Hegyi, A. Small is strong: Post-LIA resilience of Europe’s Southernmost glaciers assessed by geophysical methods. CATENA 2022, 213, 106143. [Google Scholar] [CrossRef] [Scilit]
  44. Haeberli, W. Creep of Mountain Permafrost: Internal Structure and Flow of Alpine Rock Glaciers; Eidgenössischen Technischen Hochschule: Zürich, Switzerland, 1985; p. 142. [Google Scholar]
  45. Ferretti, A.; Monti-Guarnieri, A.; Prati, C.; Rocca, F.; Massonnet, D. InSAR Principles: Guidelines for SAR Interferometry Processing and Interpretation; ESA TM-19; ESA Publications Division: Noordwijk, The Netherlands, 2007. [Google Scholar]
  46. Zhao, Z.; Wan, P.; Huang, N.; Shan, C.; Hu, Z.; Li, Y.; Zhang, J. Interferometric Synthetic Aperture Radar Phase Composition Analysis and Simulation. Sens. Mater. 2023, 35, 3279–3292. [Google Scholar] [CrossRef] [Scilit]
  47. Guerrero, J.; Guerra, M.; Yannick, T.; Desir, G.; Colas, B. Kinematic inventory of rock glaciers in the Pyrenees based on InSAR and airborne LiDAR data. Remote Sens. Environ. 2025, 326, 114798. [Google Scholar] [CrossRef] [Scilit]
  48. Poncos, V.; Stanciu, I.; Teleaga, D.; Matenco, L.; Bozsó, I.; Szakács, A.; Birtas, D.; Toma, S.A.; Stanica, A.; Radulescu, V. An Integrated Platform for Ground-Motion Mapping, Local to Regional Scale; Examples from SE Europe. Remote Sens. 2022, 14, 1046. [Google Scholar] [CrossRef] [Scilit]
  49. Barboux, C.; Delaloye, R.; Lambiel, C. Inventorying slope movements in an Alpine environment using DInSAR. Earth Surf. Process. Landf. 2014, 39, 2087–2099. [Google Scholar] [CrossRef] [Scilit]
  50. Rouyet, L.; Lilleoren, K.S.; Boehme, M.; Vick, L.M.; Delaloye, R.; Etzelmueller, B.; Lauknes, T.R.; Larsen, Y.; Blikra, L.H. Regional Morpho-Kinematic Inventory of Slope Movements in Northern Norway. Front. Earth Sci. 2021, 9, 681088. [Google Scholar] [CrossRef] [Scilit]
  51. Hoelzle, M.; Wegmann, M.; Krummenacher, B. Miniature temperature dataloggers for mapping and monitoring of permafrost in high mountain areas: First experience from the Swiss Alps. Permafr. Periglac. Process. 1999, 10, 113–124. [Google Scholar] [CrossRef] [Scilit]
  52. Onaca, A.; Ardelean, A.C.; Urdea, P.; Ardelean, F.; Sîrbu, F. Detection of mountain permafrost by combining conventional geophysical methods and thermal monitoring in the Retezat Mountains, Romania. Cold Reg. Sci. Technol. 2015, 119, 111–123. [Google Scholar] [CrossRef] [Scilit]
  53. Sattler, K.; Anderson, B.; Mackintosh, A.; Norton, K.; de Róiste, M. Estimating Permafrost Distribution in the Maritime Southern Alps, New Zealand, Based on Climatic Conditions at Rock Glacier Sites. Front. Earth Sci. 2016, 4, 4. [Google Scholar] [CrossRef] [Scilit]
  54. Kruskal, W.H.a.W.; Allen, W. Use of Ranks in One-Criterion Variance Analysis. J. Am. Stat. Assoc. 1952, 47, 583–621. [Google Scholar] [CrossRef] [Scilit]
  55. Mardia, K.V.; Jupp, P.E. Directional Statistics; John Wiley & Sons: Hoboken, NJ, USA, 2000. [Google Scholar]
  56. Team, R. RStudio: Integrated Development Environment for R; RStudio, Inc.: Boston, MA, USA, 2019. [Google Scholar]
  57. Kassambara, A. ggpubr: ‘ggplot2’ Based Publication Ready Plots; R Package Version 0.6; CRAN: Vienna, Austria, 2026. [Google Scholar]
  58. Agostinelli, C.; Lund, U. R Package ‘Circular’: Circular Statistics; R Package Version 0.5-1; CRAN: Vienna, Austria, 2024. [Google Scholar]
  59. Crosetto, M.; Monserrat, O.; Bremmer, C.; Hanssen, R.F.; Capes, R.; Marsh, S. Ground Motion Monitoring Using SAR Interferometry: Quality Assessment. Eur. Geol. Mag. 2009, 26, 12–15. [Google Scholar]
  60. Haeberli, W. Die Basis-Temperatur der winterlichen Schneedecke als moglicher Indikator fur die Verbreitung von Permafrost in den Alpen. Z. Gletscherkunde Glazialgeol. 1973, 9, 221–227. [Google Scholar]
  61. Lilleoren, K.S.; Etzelmüller, B.; Rouyet, L.; Eiken, T.; Slinde, G.; Hilbich, C. Transitional rock glaciers at sea level in northern Norway. Earth Surf. Dyn. 2022, 10, 975–996. [Google Scholar] [CrossRef] [Scilit]
  62. Necsoiu, M.; Onaca, A.; Wigginton, S.; Urdea, P. Rock glacier dynamics in Southern Carpathian Mountains from high-resolution optical and multi-temporal SAR satellite imagery. Remote Sens. Environ. 2016, 177, 21–36. [Google Scholar] [CrossRef] [Scilit]
  63. Agziou, J.; Lehmann, B.; Cusicanqui, D.; Corset, F.; Bodin, X.; Schoeneich, P. Relationship between geomorphological characteristics, environmental settings and activity of transitional rock glaciers: Insights from a statistical analysis in the French Alps. Earth Surf. Process. Landf. 2026, 51, e70243. [Google Scholar] [CrossRef] [Scilit]
  64. Bertone, A.; Jones, N.; Mair, V.; Scotti, R.; Strozzi, T.; Brardinoni, F. A climate-driven, altitudinal transition in rock glacier dynamics detected through integration of geomorphological mapping and synthetic aperture radar interferometry (InSAR)-based kinematics. Cryosphere 2024, 18, 2335–2356. [Google Scholar] [CrossRef] [Scilit]
  65. Kellerer-Pirklbauer, A.; Bodin, X.; Delaloye, R.; Lambiel, C.; Gärtner-Roer, I.; Damm, B.; Ikeda, A.; Kaufmann, V.; Krainer, K.; Seppi, R.; et al. Rock glacier velocity monitored by annual in-situ geodetic surveys: Long-term challenges, solutions and suggestions. Geomorphology 2026, 495, 110117. [Google Scholar] [CrossRef] [Scilit]
  66. Wagner, T.; Pauritsch, M.; Mayaud, C.; Kellerer-Pirklbauer, A.; Thalheim, F.; Winkler, G. Controlling factors of microclimate in blocky surface layers of two nearby relict rock glaciers (Niedere Tauern Range, Austria). Geogr. Ann. Ser. A-Phys. Geogr. 2019, 101, 310–333. [Google Scholar] [CrossRef] [Scilit]
  67. Kellerer-Pirklbauer, A.; Bodin, X.; Delaloye, R.; Lambiel, C.; Gärtner-Roer, I.; Bonnefoy-Demongeot, M.; Carturan, L.; Damm, B.; Eulenstein, J.; Fischer, A.; et al. Acceleration and interannual variability of creep rates in mountain permafrost landforms (rock glacier velocities) in the European Alps in 1995-2022. Environ. Res. Lett. 2024, 19, 034022. [Google Scholar] [CrossRef] [Scilit]
  68. Kaldybayev, A.; Sydyk, N.; Yelisseyeva, A.; Merekeyev, A.; Nurakynov, S.; Zulpykharov, K.; Issanova, G.; Chen, Y.N. The First Inventory of Rock Glaciers in the Zhetysu Alatau: The Aksu and Lepsy River Basins. Remote Sens. 2023, 15, 197. [Google Scholar] [CrossRef] [Scilit]
  69. Merekeyev, A.; Nurakynov, S.; Bolch, T.; Iskaliyeva, G.; Talgarbayeva, D.; Sydyk, N. Occurrence and Characteristics of Rock Glaciers in Western Tien Shan. Water 2026, 18, 367. [Google Scholar] [CrossRef] [Scilit]
  70. Lambiel, C.; Strozzi, T.; Paillex, N.; Vivero, S.; Jones, N. Inventory and kinematics of active and transitional rock glaciers in the Southern Alps of New Zealand from Sentinel-1 InSAR. Arct. Antarct. Alp. Res. 2023, 55, 2183999. [Google Scholar] [CrossRef] [Scilit]
  71. Brencher, G.; Handwerger, A.L.; Munroe, J.S. InSAR-based characterization of rock glacier movement in the Uinta Mountains, Utah, USA. Cryosphere 2021, 15, 4823–4844. [Google Scholar] [CrossRef] [Scilit]
  72. Onaca, A.; Ardelean, F.; Ardelean, A.; Magori, B.; Sîrbu, F.; Voiculescu, M.; Gachev, E. Assessment of permafrost conditions in the highest mountains of the Balkan Peninsula. Catena 2020, 185, 104288. [Google Scholar] [CrossRef] [Scilit]
  73. Dobinski, W. Permafrost of the Carpathian and Balkan Mountains, eastern and southeastern Europe. Permafr. Periglac. Process. 2005, 16, 395–398. [Google Scholar] [CrossRef] [Scilit]
  74. Amschwand, D.; Wicky, J.; Scherler, M.; Hoelzle, M.; Krummenacher, B.; Haberkorn, A.; Kienholz, C.; Gubler, H. Sub-surface processes and heat fluxes at coarse blocky Murtèl rock glacier (Engadine, eastern Swiss Alps): Seasonal ice and convective cooling render rock glaciers climate-robust. Earth Surf. Dyn. 2025, 13, 365–401. [Google Scholar] [CrossRef] [Scilit]
  75. Ionita, A.; Lopatita, I.; Urdea, P.; Berzescu, O.; Onaca, A. Low-Altitude, Overcooled Scree Slope: Insights into Temperature Distribution Using High-Resolution Thermal Imagery in the Romanian Carpathians. Land 2025, 14, 607. [Google Scholar] [CrossRef] [Scilit]
  76. Popescu, R.; Filhol, S.; Etzelmüller, B.; Vasile, M.; Plesoianu, A.; Vîrghileanu, M.; Onaca, A.; Sandric, I.; Savulescu, I.; Cruceru, N.; et al. Permafrost Distribution in the Southern Carpathians, Romania, Derived from Machine Learning Modeling. Permafr. Periglac. Process. 2024, 35, 243–261. [Google Scholar] [CrossRef] [Scilit]
  77. Ardelean, F.; Berzescu, O.; Chiroiu, P.; Ardelean, A.; Malaiestean, R.; Onaca, A. Southern Carpathian Periglaciation in Transition: The Role of Ground Thermal Regimes in a Warming Climate. Land 2025, 14, 1756. [Google Scholar] [CrossRef] [Scilit]
  78. Serrano, E.; de Sanjosé, J.J.; González-Trueba, J.J. Rock glacier dynamics in marginal periglacial environments. Earth Surf. Process. Landf. 2010, 35, 1302–1314. [Google Scholar] [CrossRef] [Scilit]
Figure 1. Topographic map of the Pirin Mountains study area showing the distribution of the rock glaciers investigated in this study. Labelled points correspond to unique Feature Identifiers (FIDs) that are consistently cross-referenced throughout the manuscript, the Supplementary Materials, and the Zenodo data repository: 1 (Banderishki Chukar), 95 (Bezbog), 92–94 (rock glaciers shown in Figure 2b), and 82 (rock glacier shown in Figure 2a). The background displays elevation (m a.s.l.) derived from a digital elevation model [35,36] and the major river network. The inset map shows the location of the study area within Bulgaria (background imagery © Google Satellite). The geographic coordinates of all mapped features, provided in decimal latitude–longitude (dLL) format, are available in Table S3 of the Supplementary Materials.
Remotesensing 18 02754 g001
Figure 2. Field photographs of the study area. (a) A relict rock glacier in the eastern part of the northern Pirin Mountains; (b) Bezbog rock glacier with Bezbog Peak in the background; (c) coarse blocky material on a rock glacier in the Demianitza Valley; (d) a large snow patch in late September 2016 in the Banski Suhodol cirque, northwestern Pirin. Arrows indicate north. Locations of the photographic viewpoints (dLL): (a) 41.72371814, 23.49937556; (b) 41.72454186, 23.49772328; (c) 41.73004624, 23.42182494; (d) 41.78753206, 23.39290274.
Remotesensing 18 02754 g002
Figure 3. Methodology of the rock glacier inventory and geomorphological analysis. Abbreviations are as follows: GST—ground surface temperature; PM—primary markers; GO—geomorphological outline; PMA—primary marker attributes; MA—moving area; RG—rock glacier.
Remotesensing 18 02754 g003
Figure 4. Rock glacier activity classification based on PSInSAR-derived moving areas and the location of GST monitoring sites. (a) Banderishki Chukar rock glacier; (b) Bezbog rock glacier. Diamond symbols mark the position of the GST data loggers, labelled as FID 104 and FID 105, respectively. These identifiers are cross-referenced across the manuscript, Supplementary Table S3 and the Zenodo data repository. Background imagery: Bing Maps © Microsoft, retrieved in QGIS via the QuickMapServices plugin. Coordinates [dLL: 41.73108811, 23.41909509] for (a) and [dLL: 41.72656004, 23.50297139] for (b).
Remotesensing 18 02754 g004
Figure 5. The moving areas (MAs) classified by number (a) and extent (b). The number of rock glaciers (RG) with and without moving areas (c) and the percentage of moving areas within rock glaciers (d).
Remotesensing 18 02754 g005
Figure 6. Line-of-Sight (LOS) displacement profiles over the study period (2015–2023) for four locations within the Banderishki Chukar rock glacier (Figure 1), representing each moving area (MA) LOS velocity class and the “no movement” class. Labelled points in the inset map correspond to unique Feature Identifiers (FIDs 106, 107, 108, and 109) cross-referenced in the text, Supplementary Table S3, and the Zenodo repository. The dots show the actual PSInSAR LOS displacement relative to 2015, while the trend lines (linear regression) represent the long-term displacement patterns. The downward trend indicates LOS displacement away from the sensor along the radar Line-of-Sight; Gaps in point density along the regression lines are due to seasonal snow cover, as measurements were strictly restricted to snow-free conditions (typically from late June to September). The inset displays the location of the analyzed points (See Table S3 for their geographical coordinates, FIDs 106–109) within the moving areas (hashed contours) of the Banderishki Chukar rock glacier (red contour).
Remotesensing 18 02754 g006
Figure 7. Distribution of moving areas (MAs) in relation to elevation (radial axis) and slope aspect (angular axis).
Remotesensing 18 02754 g007
Figure 8. Relationship between moving area (MA) LOS velocity classes and selected topographic variables. Boxplots illustrate the distribution of (a) elevation, (b) slope, and (c) potential incoming solar radiation for the four MA LOS velocity classes (Undefined, 0.3–1, 1–3, and 3–10 cm yr−1). Overall differences among LOS velocity classes were evaluated using the Kruskal–Wallis test, with p-values indicated within each panel. Pairwise comparisons for elevation were performed using Dunn’s post hoc test with Bonferroni correction; significant differences are denoted by asterisks (* p < 0.05, ** p < 0.01), while non-significant comparisons are labelled as ns. Boxes represent the interquartile range (IQR), the central line indicates the median, whiskers extend to 1.5 × IQR, and grey dots represent individual moving areas.
Remotesensing 18 02754 g008
Figure 9. The spatial distribution of transitional and relict rock glaciers in the Pirin Mountains.
Remotesensing 18 02754 g009
Figure 10. The size (a) and elevation (b) of relict and transitional rock glaciers. The lower and upper limits of the box are set to the 1st and 3rd quartile. The middle line represents the median in the data, and the dots represent outliers.
Remotesensing 18 02754 g010
Figure 11. (a) Ground surface temperature (GST) time series for the Banderishki Chukar and Bezbog rock glaciers from 1 September 2016 to 31 August 2023; (b) Ground surface temperature distributions for the Banderishki Chukar and Bezbog rock glaciers from the 2016/2017 to the 2022/2023 monitoring seasons. The boxes represent the 25th and 75th quartiles, the grey horizontal line inside the boxes represents the median value, while the black diamond represents the MAGST. Note that, due to travel restrictions, there are no in situ GST measurements during the 2019/2020 season.
Remotesensing 18 02754 g011
Figure 12. Winter equilibrium temperature (WEqT) for the Banderishki Chukar and Bezbog rock glaciers from the 2016/2017 to the 2022/2023 monitoring seasons. Note that, due to travel restrictions, no in situ GST measurements are available for the 2019/2020 season.
Remotesensing 18 02754 g012
Table 1. Data used for PSInSAR.
SensorTrackGeometryInterferograms UsedTime Interval
BeginningEnd
Sentinel-1102Ascending1358 August 201525 October 2023
Sentinel-17Descending1329 July 20157 October 2023
Table 2. Inventory of Moving areas and Rock glaciers.
DatasetCategoryNumberPercentage
Moving area (MA)Total inventoried moving areas89100
Related to a rock glacier4853.9
Unrelated to a rock glacier4146.1
Rock glacier inventory (RoGI)Total inventoried landforms96100
Rock glaciers (RG)7477.1
  • transitional
810.8 (of RG)
  • relict
6689.2 (of RG)
Uncertain Rock glaciers1919.8
Not rock glaciers33.1
Disclaimer/Publisher’s Note: The statements, opinions and data contained in all publications are solely those of the individual author(s) and contributor(s) and not of MDPI and/or the editor(s). MDPI and/or the editor(s) disclaim responsibility for any injury to people or property resulting from any ideas, methods, instructions or products referred to in the content.