Article

Event-Guided Spatiotemporal Transformer with Conditional Diffusion Refinement for High-Intensity Precipitation Nowcasting

1
College of Information Science and Engineering, Ocean University of China, Qingdao 266100, China
2
Qingdao Jari Industry Control Technology Co., Ltd., Qingdao 266100, China
3
Qingdao Port International Co., Ltd., Qingdao 266000, China
*
Author to whom correspondence should be addressed.
Remote Sens. 2026, 18(16), 2771; https://doi.org/10.3390/rs18162771
Submission received: 18 June 2026 / Revised: 12 August 2026 / Accepted: 14 August 2026 / Published: 16 August 2026
(This article belongs to the Section Ocean Remote Sensing)

Highlights

What are the main findings?
  • A data-driven two-stage nowcasting framework, EGN-Nowcast, is developed by combining an Event-Guided Spatiotemporal Transformer for precipitation structure prediction with a Conditional Diffusion Refiner for stochastic fine-scale refinement.
  • Under the evaluated KNMI radar setting, EGN-Nowcast provides improved probabilistic forecast performance and reduces false alarms for high-intensity precipitation events, while pixel-level recovery of rare high-intensity precipitation remains challenging.
What are the implications of the main finding?
  • The proposed framework provides a data-driven strategy for integrating deterministic precipitation structure prediction with conditional probabilistic refinement in radar-based nowcasting.
  • Application to other climatic regimes and radar networks requires further external validation and recalibration of dataset-specific preprocessing and event-definition settings.

Abstract

Accurate nowcasting of high-intensity precipitation is critical for urban flood control and short-term hydrological risk management. However, the high stochasticity of convective systems poses a significant challenge for traditional deep learning models in generating accurate predictions. Existing regression-based models, often constrained by Mean Squared Error loss, tend to produce over-smoothed results, leading to severe underestimation of heavy rainfall centers. To address this challenge, this study proposes an event-guided two-stage nowcasting framework, named EGN-Nowcast, which incorporates intensity-aware auxiliary supervision through an implicit regularization strategy. This framework integrates an event-aware spatiotemporal Transformer with a Conditional Diffusion Refiner. Specifically, an event-aware auxiliary mechanism is introduced to increase the optimization emphasis on high-intensity precipitation regions. The conditional diffusion module then refines the coarse precipitation prediction to recover fine-scale structures while preserving the spatiotemporal consistency learned by the first-stage predictor. This strategy is designed to alleviate over-smoothing and improve spatiotemporal consistency under the evaluated KNMI radar setting. Experiments based on the KNMI radar dataset from 2016 to 2025 show improvements in several pixel-level, categorical, and visual verification metrics, including a reduction in the false alarm rate for high-intensity precipitation events (>8 mm/h). These results suggest that the proposed framework can improve the representation of localized high-intensity precipitation structures and reduce false alarms under sparse high-intensity precipitation conditions on the selected KNMI radar dataset.

1. Introduction

In the context of global warming, the hydrological cycle has significantly intensified. This has led to an increasing trend in the frequency, intensity, and duration of extreme precipitation events worldwide [1,2]. Such sudden, strong convective weather often delivers massive amounts of precipitation within extremely short periods. Consequently, it easily triggers secondary disasters such as urban waterlogging, flash floods, and debris flows. These events pose severe challenges to urban infrastructure, transportation networks, and public safety [3]. Statistics indicate that over the past two decades, economic losses caused by extreme weather accounted for more than 70% of total global natural disaster losses [4]. Therefore, achieving high-resolution and accurate short-term precipitation nowcasting and evolution forecasting has become a key research hotspot in meteorology and hydrology. Furthermore, it serves as a core requirement for disaster prevention, mitigation, and emergency response systems [5,6].
Currently, precipitation nowcasting mainly relies on two technical approaches: Numerical Weather Prediction (NWP) and radar echo extrapolation methods. NWP and its variants, such as the Rapid Update Cycle (RUC), are based on atmospheric physics equations. However, they often encounter the “spin-up” problem during the initial stage. Furthermore, their massive computational load leads to high latency in data assimilation. Consequently, it is challenging for them to meet the low-latency requirements of short-term nowcasting, which often require high-resolution probabilistic predictions to be generated within a few minutes (e.g., 2–5 min) for a truncated look-ahead window spanning 0–2 h [7,8]. In contrast, methods based on radar echo extrapolation have become the preferred choice for nowcasting. This is due to their high spatiotemporal resolution and rapid update capabilities. Traditional extrapolation techniques are primarily based on optical flow methods. Prominent examples include the ROVER algorithm [9] and the PySteps framework [10]. These methods estimate the motion vectors of the precipitation field. They then utilize Lagrangian persistence to perform semi-Lagrangian advection extrapolation. However, optical flow methods typically rely on the assumption of Lagrangian persistence, where precipitation intensity is treated as constant. Consequently, they fail to capture the complex non-linear dynamics of convective cloud clusters, particularly their rapid growth and decay. In strong convective weather, this linear assumption causes forecast errors to accumulate rapidly over time. Ultimately, this leads to a severe underestimation of storm intensity [11,12].
In recent years, driven by breakthroughs in deep learning within the field of computer vision, data-driven approaches have demonstrated immense potential in spatiotemporal sequence forecasting tasks. Shi et al. were the first to formulate precipitation nowcasting as a spatiotemporal sequence learning problem [13]. They proposed the Convolutional Long Short-Term Memory network (ConvLSTM), which successfully captured the spatiotemporal correlations of precipitation, significantly outperforming traditional optical flow methods. Subsequently, to mitigate the issues of gradient vanishing and spatial information loss inherent in ConvLSTM, a series of improved architectures were proposed. Wang et al. introduced PredRNN, which enhanced long-term and short-term memory capabilities by incorporating spatiotemporal memory units [14]. Shi et al. developed TrajGRU [15], utilizing deformable convolutional structures to adapt to the rotation and deformation of cloud clusters. Recently, attention-based Transformer architectures have begun to gradually replace RNNs, owing to their superior ability to capture long-range dependencies [16]. For instance, the Pangu-Weather model [17] by Bi et al. and the FengWu model [18] by Chen et al. have demonstrated the dominance of Transformers in global medium-range weather forecasting. For local-scale nowcasting, the global self-attention mechanism of standard Vision Transformers (ViT) often incurs high computational costs. Furthermore, it tends to overlook the evolutionary dynamics of local small-scale features, such as convective cells [19]. To address this, contemporary paradigms like EarthFormer introduce space-time cuboid attention to balance computational budgets and macro-scale spatiotemporal representations. However, such single-stage regression-based backbones still inevitably encounter intrinsic intensity regressions and structural smoothing under zero-inflated target fields, leading to localized underestimation within severe convective cores.
Although the aforementioned discriminative deep learning models have achieved high forecasting skill, they universally face a critical limitation: the blurring of prediction results. From a statistical perspective, this is primarily attributed to the widespread adoption of Mean Squared Error (MSE) or Mean Absolute Error (MAE) as loss functions during model training. As noted by Mathieu et al. [20], MSE tends to yield the conditional mean of all possible future states. Consequently, the predicted precipitation fields lack high-frequency textures, resembling a superimposed average of multiple potential outcomes. In a meteorological context, this manifests as the smoothing of precipitation boundaries and the attenuation of high-intensity precipitation centers (extreme values) [21]. In the context of extreme precipitation forecasting, this deficiency not only degrades fine-scale structural representation but also contributes to the underestimation of high-intensity precipitation centers, thereby limiting the usefulness of such forecasts for early-warning applications.
To alleviate the over-smoothing tendency of regression-based models, generative models have been introduced to reconstruct high-frequency details. Ravuri et al. developed the Deep Generative Model of Radar (DGMR) using Generative Adversarial Networks (GANs) [22], which successfully generated precipitation fields with realistic textures. By incorporating spatial and temporal discriminators, DGMR effectively bypasses the smoothing effects of mean error losses; however, such unconstrained adversarial formulations frequently suffer from training instability, severe mode collapse, and a tendency to introduce physically implausible artifacts or geometric dislocations during extended lead-time forecasting. Recent research indicates that Diffusion Probabilistic Models are emerging as a new paradigm in generative AI [23,24]. Compared to GANs, diffusion models learn the gradient field of the data distribution and often provide more stable training and higher sample quality in image-generation tasks. Mardani et al. and Price et al. have preliminarily explored the application of diffusion models in climate downscaling and weather forecasting [25,26]. Recent studies have further investigated diffusion-based approaches for precipitation nowcasting. DiffCast [27] introduced a residual diffusion framework that decomposes precipitation nowcasting into a deterministic forecasting component and a diffusion-based residual refinement component. PreDiff [28] explored conditional diffusion models for probabilistic precipitation forecasting, while LDCast [29] investigated latent diffusion strategies to improve the computational efficiency of high-resolution precipitation generation. These studies demonstrate the potential of diffusion models for representing stochastic precipitation evolution and predictive uncertainty. Different from these diffusion-based frameworks, EGN-Nowcast adopts an event-guided deterministic prediction stage before diffusion refinement, rather than formulating the forecasting process as residual diffusion or latent-space generation. Specifically, it first learns event-aware spatiotemporal representations using an auxiliary event supervision strategy and then employs the diffusion module to conditionally refine the coarse precipitation prediction produced by the first-stage Transformer. The diffusion module in EGN-Nowcast does not independently generate future precipitation sequences; instead, it performs conditional refinement to recover fine-scale precipitation structures while preserving the learned large-scale spatiotemporal evolution. During training, the event-guided Transformer and diffusion refiner are optimized in a sequential two-stage manner, and predictive uncertainty is represented through stochastic diffusion sampling and ensemble variability. Nevertheless, efficiently applying diffusion models to capture the rapid evolution of local extreme convection remains a challenge.
To address the aforementioned challenges, this study proposes an event-guided two-stage nowcasting framework, named EGN-Nowcast. This framework decomposes the nowcasting task into two synergistic stages: macro-scale spatiotemporal evolution prediction and micro-scale convective detail reconstruction. This design aims to combine deterministic background-field forecasting with stochastic refinement of localized high-intensity structures. First, an Event-Guided Spatiotemporal Transformer is used as the coarse structure predictor. The Transformer backbone follows the standard 3D patch-embedding and multi-head self-attention formulation. The term event-guided refers to the use of auxiliary supervision derived from high-intensity precipitation events to increase the optimization emphasis on sparse heavy-precipitation samples, rather than to a new region-specific attention operator, manually designed spatial mask, hard-coded attention weight, or explicit physical constraint. By employing a patch embedding strategy, it models the spatiotemporal evolution of local precipitation structures. Furthermore, an auxiliary classification module is integrated during training to enhance sensitivity to extreme events by increasing the optimization emphasis on sparse convective-core samples. Subsequently, a Conditional Diffusion Refiner is introduced to refine the coarse prediction through conditional stochastic denoising rather than through a separate uncertainty-estimation branch. Utilizing the preliminary prediction from the Transformer as a structural condition, it serves as a conditional refinement process to selectively recover the smoothed high-frequency textures and extreme value centers while preserving the large-scale spatiotemporal evolution learned by the Transformer. Predictive uncertainty is obtained from multiple stochastic diffusion samples and their ensemble spread. Unlike diffusion-centered forecasting frameworks, EGN-Nowcast uses diffusion as a conditional refinement module guided by the event-aware prediction, rather than as an independent generation process. Therefore, the primary contribution of EGN-Nowcast lies in integrating event-guided spatiotemporal representation learning with conditional diffusion refinement for high-intensity precipitation structure representation and false-alarm reduction under rare-event conditions, rather than introducing a new diffusion formulation.

2. Materials and Methods

2.1. Data and Reproducible Preprocessing

2.1.1. Study Area and KNMI Radar Coverage

The study area is located in the Netherlands, a low-lying coastal country in northwestern Europe bordered by the North Sea. The Netherlands is characterized by a temperate maritime climate, with precipitation strongly influenced by westerly circulation from the North Atlantic and the North Sea. The regional precipitation regime is dominated by frequent stratiform and frontal rainfall systems, while short-duration convective precipitation events also occur, particularly during the warm season. These convective events are highly relevant for short-term precipitation nowcasting because they often exhibit rapid spatial displacement, local intensification, and strong small-scale variability.
The radar observations used in this study are derived from the radar network operated by the Royal Netherlands Meteorological Institute (KNMI). During the 2016–2025 study period, the network included the Den Helder radar in the northern Netherlands and a transition from the former De Bilt radar to the Herwijnen radar in January 2017. The KNMI radar network provides high-resolution radar-based precipitation observations over the Netherlands and surrounding regions, making it suitable for evaluating short-term precipitation nowcasting under a mid-latitude maritime rainfall regime.
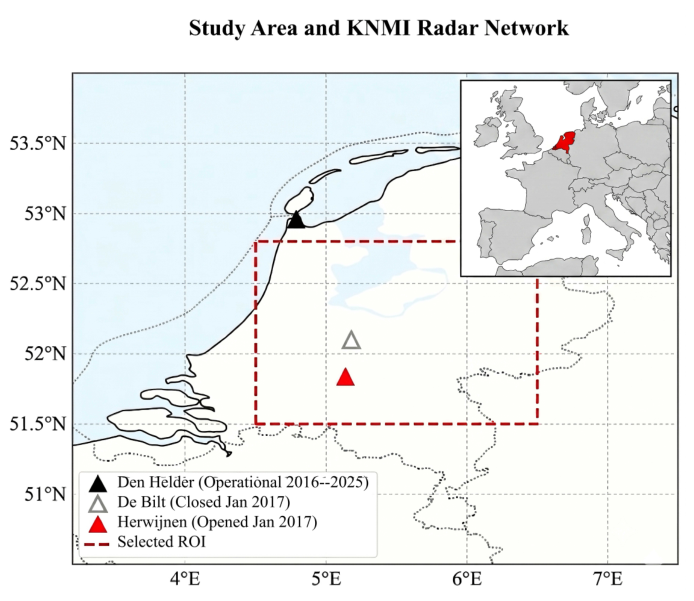
To improve the reproducibility and spatial interpretability of the experimental setting, Figure 1 shows the geographical context of the study area (including its macro-level location within Europe), the relevant KNMI radar stations, and the selected region of interest used for model training and evaluation. The selected region of interest covers the central part of the Netherlands and surrounding areas within the effective KNMI radar observation domain. This region provides a representative testbed for assessing the ability of nowcasting models to capture both large-scale precipitation displacement and localized convective precipitation structures.

2.1.2. Dataset Construction and Physical Consistency Correction

The historical quantitative precipitation estimation (QPE) data utilized in this study are obtained from the public climatological radar repository released by the Royal Netherlands Meteorological Institute (KNMI). The core product line relies on the Multi-Sensor Precipitation (MFBS) series, which maintains a high spatial resolution of 1 km. The original HDF5 products are archived as calibrated integer precipitation fields representing gauge-adjusted precipitation accumulation observations. Our forecasting pipeline is optimized completely within the physical hydrology domain. To transform these discrete observation logs into continuous physical fields suitable for generative deep learning and establish absolute methodological clarity, the direct mathematical target learned by EGN-Nowcast is explicitly defined as the normalized rainfall-intensity field expressed in mm/h. In this study, the 30 min interval refers to the temporal sampling interval and forecast lead time, not to 30 min precipitation accumulation. The original KNMI rainfall fields are provided on a native Cartesian grid of 765 × 700 pixels under the KNMI Cartesian projection (EPSG:28992). A fixed spatial region of interest (ROI) is extracted from the original 1 km grid using rows 264–519 and columns 242–497, resulting in an intermediate spatial representation of 256 × 256 pixels. The same spatial domain is applied to all radar frames to maintain spatial consistency during sequence construction. The cropped rainfall fields are subsequently resized to 128 × 128 pixels for model training and inference. Therefore, the effective spatial resolution of the processed model input is approximately 2 km per pixel. This effective resolution is considered when interpreting the spatial characteristics of predicted precipitation structures. To ensure full experimental reproducibility, a rigorous three-step preprocessing pipeline is implemented across the 10-year historical volume (2016–2025).
The original KNMI observations are available at a 5 min temporal resolution. The rainfall intensity fields are first converted from the original 5 min precipitation observations and then temporally sampled at a 30 min interval for sequence construction. No additional temporal accumulation is introduced during this sampling process. Specifically, the input sequence consists of three observations at T 60 , T 30 , and T, and the model forecasts six future precipitation fields at 30 min intervals, corresponding to lead times from T + 30 to T + 180 min. To rigorously evaluate the model’s generalization capabilities and strictly prevent implicit temporal leakage, we employ a strict chronological block partitioning strategy across the 10 year dataset (2016–2025). The Training Set spans from 2016 to 2023, capturing a robust climatological distribution that covers various historical weather regimes. The Validation Set comprises the entire year of 2024, utilized exclusively for hyperparameter fine-tuning and early-stopping monitoring. The Testing Set is strictly isolated as the entire year of 2025, serving as a completely independent, held-out evaluation set to assess model performance under the most recent climate conditions. This chronological block partition ensures that highly correlated sequential frames from the same squall line or mesoscale convective system never span across different data splits, thereby guaranteeing operational honesty during evaluation. After sequence construction and chronological partitioning, the final sequence dataset contains 38,215 training sequences, 4753 validation sequences, and 4819 testing sequences. The chronological separation between different years is strictly maintained to prevent temporal data leakage.
  • Rainfall Intensity Transformation: For each raw MFBS frame, the decoded precipitation accumulation values are transformed into the corresponding rainfall-intensity field R based on the original 5 min observation interval:
    R mm / h = 12 P 5 m i n
    where P 5 m i n denotes the precipitation accumulation within the original 5 min observation interval, and R mm / h represents the equivalent rainfall intensity expressed in mm/h. The converted rainfall-intensity field is directly used for normalization, sequence construction, and verification. The intensity thresholds used in this study serve different purposes. The 10 mm/h threshold is used only for generating event-guided auxiliary supervision during training, while the 8 mm/h threshold is adopted for high-intensity precipitation verification. The 40 mm/h value is used only for intensity clipping and normalization and does not represent an event definition. All subsequent processing and threshold-based evaluations are consistently performed in the rainfall-intensity domain.
  • Outlier Truncation and Missing-Data Handling: Despite automatic rain gauge cross-corrections, extreme convective cells may still be affected by hail contamination or non-meteorological reflections, which can induce anomalous radar-derived intensity spikes. We therefore implement a dataset-specific upper clipping strategy with R max = 40 mm / h to suppress abnormal intensity outliers and reduce training instability caused by extreme non-meteorological values. This clipping operation is treated as a preprocessing step calibrated to the KNMI data distribution, rather than as a universal meteorological upper bound for extreme precipitation. In the processed KNMI dataset, fewer than 0.05% of valid pixels exceed this clipping threshold, indicating that the operation affects only a very small fraction of the extreme tail of the precipitation distribution. Furthermore, to ensure preprocessing reproducibility and data quality, frames with invalid timestamps, corrupted grids, or missing radar fields are removed before sequence construction. Approximately 2.1% of the original radar frames were removed because of missing or corrupted records. Missing chronological blocks were discarded rather than interpolated, so that no artificially reconstructed precipitation evolution was introduced into the training, validation, or testing sequences.
  • Statistical Normalization and Range Realignment: To address the severe zero-inflated and long-tailed distribution (where clear-sky background pixels account for approximately 92% of the entire volume), the rainfall-intensity fields are linearly scaled and bounded via
    X t , i , j = R t , i , j c l i p 40.0
    where the denominator R max = 40 mm / h serves as an empirical scale regularizer implemented in our data-loading pipeline to stabilize gradient propagation and compress the latent dynamic range for diffusion generation. During evaluation and visualization, model outputs are transformed back to physical rainfall intensity by R ^ t , i , j = R max X ^ t , i , j .
The intensity thresholds used in this study serve different purposes. The 10 mm/h threshold is used to generate event-guided auxiliary supervision during training, whereas the 8 mm/h threshold is adopted for high-intensity precipitation verification. The 40 mm/h value is used only for intensity clipping and normalization.

2.1.3. Weakly Supervised Label Generation

To train the event-aware auxiliary classification head within the model, it is essential to automatically extract signals indicative of heavy precipitation from unlabeled radar streams. Distinct from traditional manual annotation methods, this study introduces a weakly supervised label generation algorithm based on Connected Component Analysis:
  • Threshold Selection and Binarization: For the KNMI dataset, a rainfall-intensity threshold of τ i n t = 10 mm/h is adopted to generate event-guided auxiliary labels for high-intensity precipitation regions. This threshold is treated as a dataset-calibrated event-aware supervision criterion rather than as a globally fixed definition of heavy precipitation. A binary mask M t is generated for each frame R t in the input sequence:
    M t , i , j = 1 , if R t , i , j τ i n t 0 , otherwise
  • Morphological Filtering: For each frame, connected components with intensities exceeding 10 mm/h are extracted. If the area of the largest connected component exceeds 5 km2, the corresponding sequence is labeled as a positive event sample, indicating the presence of a spatially coherent convective precipitation object rather than isolated noise. This sequence-level label is only used for event occurrence statistics and sample characterization, whereas the pixel-wise event mask M t defined above is exclusively used as the supervision target of the auxiliary classification head.
  • Statistical Significance: In the context of the Netherlands’ temperate maritime climate, 10 mm/h represents the top 1% of sparse long-tail events in the precipitation distribution. Through this approach, we automatically filtered approximately 48,000 samples containing convective cores. This provides event-guided auxiliary supervision for the model, increasing the training emphasis on sparse high-intensity samples and mitigating the dominance of clear-sky background pixels in the loss optimization. This threshold is calibrated to the KNMI precipitation distribution; therefore, transferring the framework to subtropical monsoon, tropical, or continental convective regimes would require recalibration according to local rainfall climatology and radar characteristics.
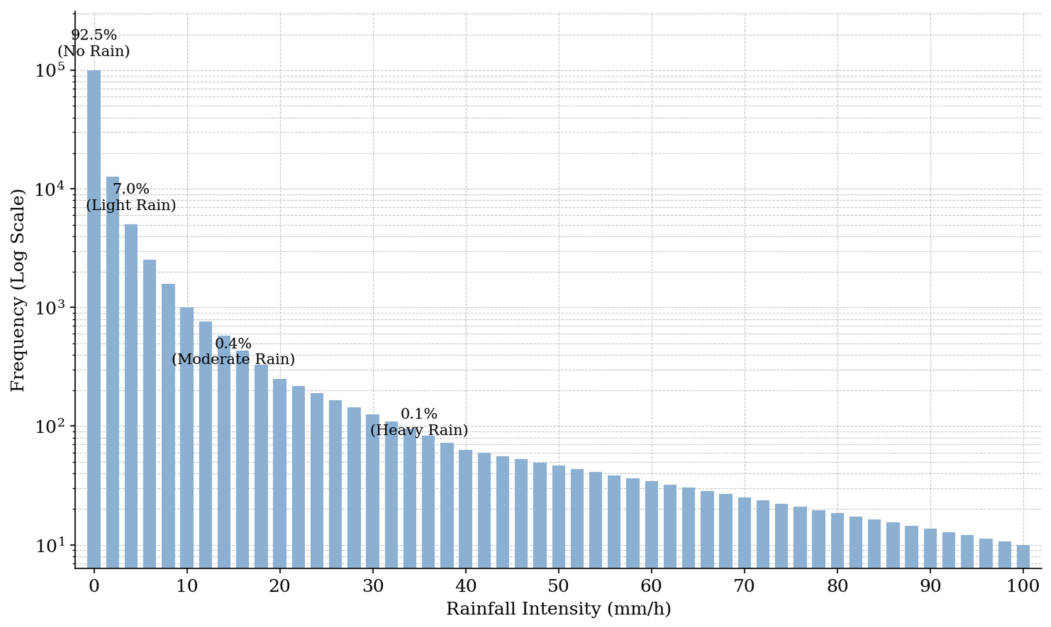
To further illustrate the task difficulty, Figure 2 shows the probability density function of non-zero precipitation intensity. As noted by Gultepe et al. [30], precipitation distributions inherently exhibit highly skewed, long-tailed characteristics. While their study highlights the climatological significance and high occurrence frequency of light precipitation (e.g., <0.5 mm/h), the present work focuses on the opposite tail of this distribution. The distribution is highly long-tailed: pixels exceeding 10 mm/h account for less than 0.5% of the precipitation area but are associated with most high-impact rainfall risks. This severe imbalance motivates the event-aware auxiliary supervision and the Conditional Diffusion Refiner.

2.2. EGN-Nowcast Framework Overview

Precipitation nowcasting is mathematically formulated as a spatiotemporal sequence forecasting problem within a high-dimensional physical space. Given an observed historical precipitation sequence X o b s = { X t T i n + 1 , , X t } , where each frame X i R H × W × C represents the spatial precipitation field tensor at time step i (H and W denote spatial resolution, and C represents the number of channels, directly corresponding to the physical normalized rainfall intensity fields X norm ). Our objective is to learn a parameterized mapping function F θ , to infer the future precipitation evolution sequence of length T o u t , denoted as Y = { X t + 1 , , X t + T o u t } . However, due to the chaotic nature of atmospheric dynamic systems and the locality of observational data, this prediction problem is essentially ill-posed. For a single historical input X o b s , the future atmospheric state may evolve into multiple plausible modes. Traditional deep learning approaches typically adopt a deterministic regression strategy, optimizing model parameters by minimizing the Mean Squared Error (MSE) or Mean Absolute Error (MAE):
θ = arg min θ E ( X , Y ) D [ Y F θ ( X o b s ) 2 2 ]
From a statistical perspective, the solution to the aforementioned optimization objective converges to the conditional expectation of the posterior distribution, denoted as Y ^ = E [ Y | X o b s ] . While this approach performs stably on low-frequency background fields, it inevitably converges to the average of all possible modes when confronting strong convective weather characterized by high stochasticity. This averaging effect directly leads to the blurring of predicted images and a systematic underestimation of extreme precipitation events within the long-tailed distribution.
To tackle the persistent challenges of prediction blurring and the loss of extreme values in precipitation nowcasting, this study reformulates the task as a conditional probabilistic generation problem. Rather than seeking a single deterministic solution, the objective is to approximate the conditional distribution of future precipitation states, p ( Y | X o b s ) , by introducing latent variable diffusion models.
A deep cascaded spatiotemporal nowcasting framework is proposed, designated as EGN-Nowcast. The design of this framework is motivated by the practical separation between relatively coherent large-scale precipitation displacement and more uncertain small-scale texture evolution.
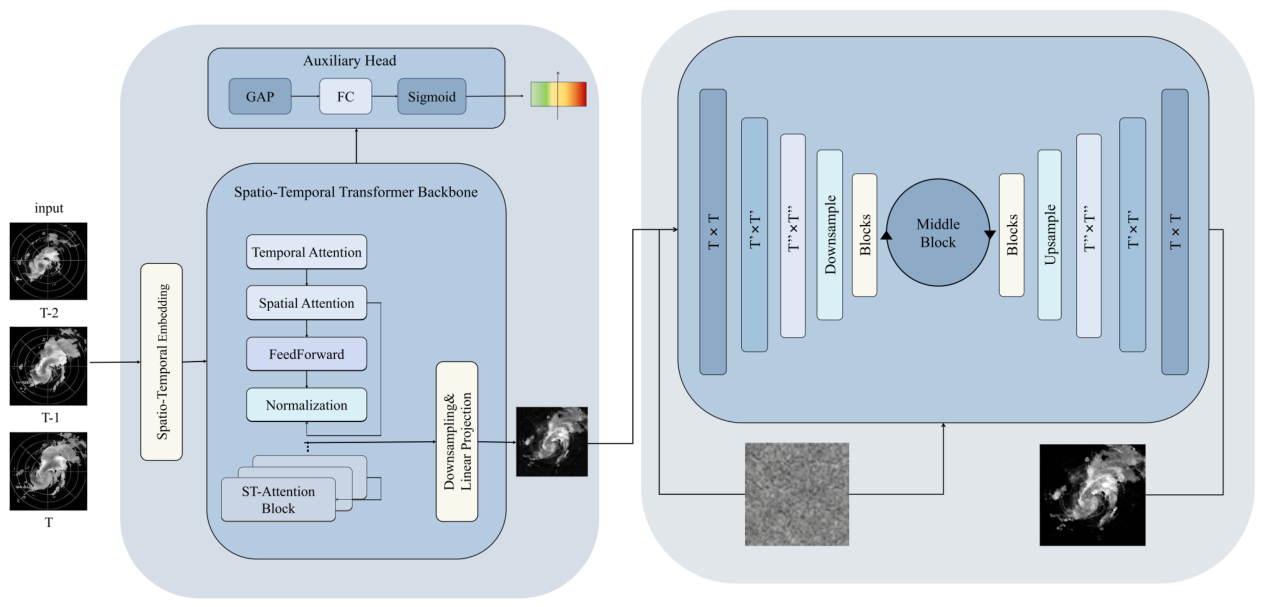
As illustrated in Figure 3, the complex inference of precipitation evolution is decoupled into two sequential yet complementary sub-tasks: macro-structure reconstruction and micro-texture refinement. Mathematically, the inference process of EGN-Nowcast is formulated as the composition of two parameterized mapping functions:
Y ^ = G ϕ ( F θ ( X o b s ) , Z )
Here, X o b s denotes the historical observation sequence. F θ functions as the deterministic structure predictor of the first stage, while G ϕ serves as the probabilistic texture refiner of the second stage. Additionally, Z represents a stochastic latent variable sampled from a standard normal distribution.

2.3. Event-Guided Spatiotemporal Structure Modeling

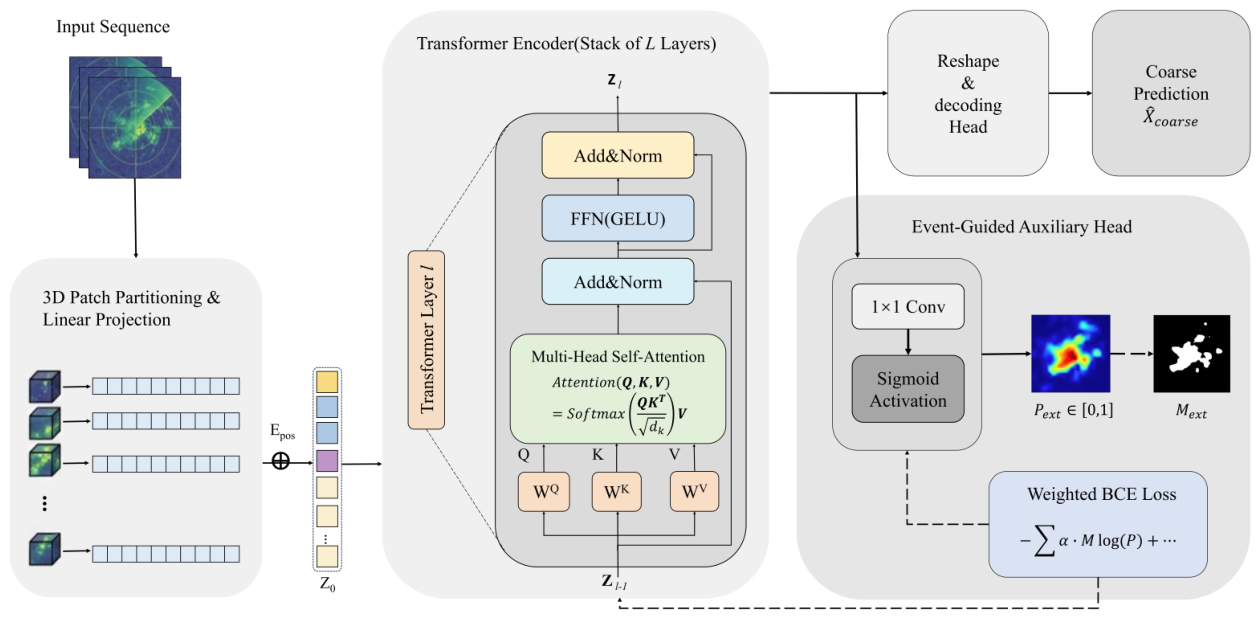
To capture long-range spatiotemporal dependencies and macro-evolutionary trends of precipitation, Stage I uses an Event-Guided Spatiotemporal Transformer as the coarse structure predictor F θ . The Transformer backbone follows the standard formulation, including 3D patch tokenization, learnable positional embeddings, stacked multi-head self-attention layers, and feed-forward networks. No new region-specific attention operator, manually designed spatial mask, or hard-coded attention weight is introduced. Unlike traditional convolutional recurrent networks, this global self-attention mechanism enables the model to represent complex storm dynamics, such as merging and splitting, across the entire radar scanning range. To address the challenge of zero-inflated data and sparse heavy rainfall centers, we integrate a parallel event-guided auxiliary classification head. By optimizing a weighted cross-entropy loss, this module increases the optimization emphasis on high-intensity precipitation regions and mitigates the dominance of clear-sky background pixels. Therefore, in this paper, the term event-guided refers to the use of auxiliary event supervision for high-intensity precipitation regions, rather than to a mathematically distinct attention mechanism or an explicit physical constraint. The event-guided mechanism operates through the training objective by introducing an auxiliary supervision branch, while the underlying Transformer backbone follows the standard spatiotemporal attention formulation. During inference, the auxiliary branch is removed, and the prediction is generated solely by the Transformer backbone. This design enables the model to increase the optimization emphasis on sparse high-intensity precipitation regions without modifying the inference-time architecture, as illustrated in Figure 4.
Distinct from Convolutional Neural Networks (CNNs), which operate directly on pixel grids, the Transformer architecture necessitates the serialization of input data. Given the historical radar observation tensor X o b s R T × H × W × C , the objective is to map it into a sequence of discrete feature vectors. A 3D Patch Partitioning strategy is employed, wherein X o b s is partitioned into non-overlapping spatiotemporal cubes (Patches). Assuming a patch size of (t, h, w), the length of the generated patch sequence is defined as N = T t × H h × W w . Subsequently, each patch is mapped to a latent embedding space of dimension D via a learnable Linear Projection layer:
Z 0 = [ x p 1 E ; x p 2 E ; ; x p N E ] + E p o s
E R ( t · h · w · C ) × D denotes the projection matrix. Since the self-attention mechanism is inherently permutation-invariant and incapable of perceiving the spatiotemporal order of the sequence, learnable positional embeddings E p o s R N × D are explicitly incorporated. This is performed to preserve the spatial topological structure and temporal causality of the radar echoes.
The core of feature extraction is constituted by L layers of stacked Transformer Encoder modules. Each module comprises two primary sub-layers: multi-head self-attention (MHSA) and a feed-forward network (FFN). To ensure gradient propagation stability in deep networks, Layer Normalization (LN) is applied before each sub-layer, and residual connections are introduced. Dependencies between any two spatiotemporal positions are directly calculated by the MHSA mechanism, thereby transcending the local receptive field limitations of convolution kernels. For the input Z l 1 of the l-th layer, it is first projected into Query, Key, and Value matrices Q = Z l 1 W Q , K = Z l 1 W K , V = Z l 1 W V . Subsequently, the aggregation of the global context is derived via the Scaled Dot-Product Attention computation:
Attention ( Q , K , V ) = Softmax Q K T d k V
This attention mechanism allows the model to associate distant but correlated precipitation regions across time, based on storm structures observed at earlier time steps such as T 5 . Consequently, this facilitates the representation of large-scale displacement patterns and advection motions associated with organized precipitation systems, such as squall lines and typhoon spiral rainbands. The output of the MHSA is normalized and subsequently fed into the FFN. This layer is composed of two linear transformations and a non-linear activation function, serving to perform pointwise non-linear transformation and fusion of features:
FFN ( x ) = GELU ( x W 1 + b 1 ) W 2 + b 2
Finally, the output of the l-th layer can be formulated as follows:
Z l = MHSA ( LN ( Z l 1 ) ) + Z l 1
Z l = FFN ( LN ( Z l ) ) + Z l
Although excellent performance in capturing global structures is exhibited by the Transformer, an underestimation of high-frequency extreme events is often induced by training directly with Mean Squared Error (MSE) loss. This is attributed to the inherent zero-inflated and long-tailed distribution characteristics of radar echo data—specifically, pixels with high precipitation intensity factors are extremely sparse within the spatiotemporal volume.
To address this issue, an Event-Aware Auxiliary Module is introduced at the output end of the decoder. This module is not utilized for generating the final prediction; rather, deep features are mapped to an extreme event probability map P e x t [ 0 , 1 ] H × W via a 1 × 1 convolutional layer. The Weighted Binary Cross-Entropy is adopted as the auxiliary loss function to explicitly enhance the gradient contribution of extreme samples:
L a u x = 1 N i , j α · M ext ( i , j ) log ( P ext ( i , j ) ) + ( 1 M ext ( i , j ) ) log ( 1 P ext ( i , j ) )
The auxiliary classification head receives the decoder feature representation corresponding to the target prediction time and outputs a pixel-wise event probability map P e x t [ 0 , 1 ] H × W . The target mask is the corresponding pixel-wise event mask generated from the same rainfall-intensity frame according to Equation (3). In the experiments, α was set to 20.0 as the positive-class weight to increase the optimization emphasis on sparse high-intensity precipitation samples. It is worth noting that L a u x denotes the event-guided auxiliary classification loss and operates as an intensity-aware data-driven regularization term. It should not be interpreted as an explicit numerical formulation of atmospheric governing equations or as a hard physical constraint. By minimizing the joint loss L t o t a l = L M S E + λ L a u x , where λ was set to 0.1 in this study, the model is encouraged to preserve sparse activation patterns associated with strong convection during the feature-extraction phase. Consequently, the regression-to-the-mean bias inherent in deterministic regression models is mitigated through this auxiliary supervision strategy.

2.4. Conditional Diffusion-Based Texture Refinement

Upon obtaining the macro-structural predictions from the first stage, the second stage aims to recover high-frequency details and reduce blurring without substantially changing the predicted large-scale evolution. To this end, we employ a conditional denoising diffusion probabilistic model (DDPM) as the stage-two conditional diffusion refiner.
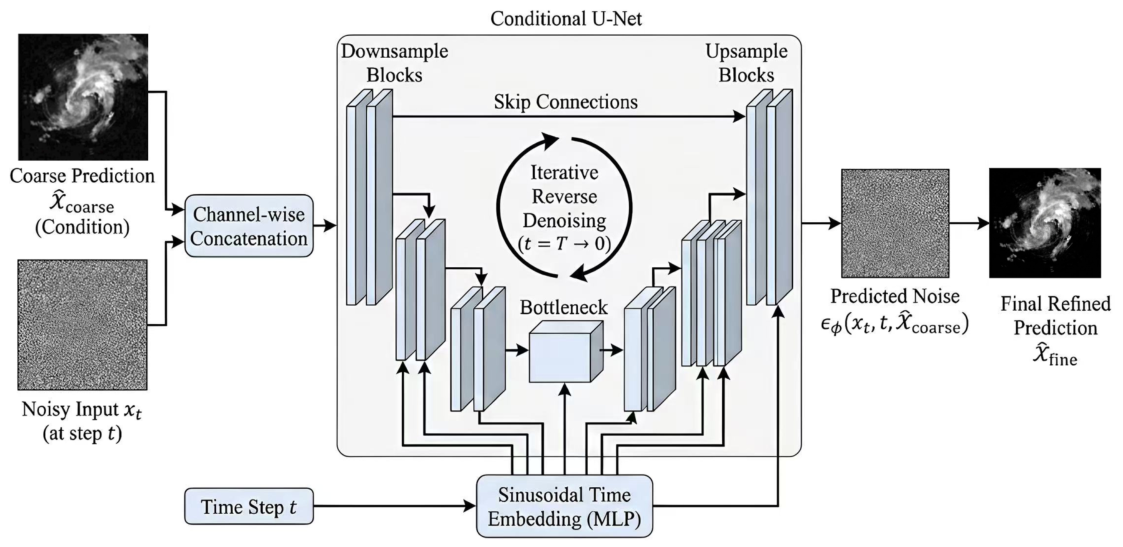
Unlike standard diffusion models that generate samples from pure Gaussian noise, EGN-Nowcast uses the coarse prediction X ^ c o a r s e as a structural condition by concatenating it with the current noisy state x t along the channel dimension. This design establishes a functional division between the two stages: the first stage provides the global precipitation structure, while the Conditional Diffusion Refiner focuses on local texture recovery and high-frequency precipitation detail refinement. During reverse generation, the denoising model G ϕ predicts the conditional noise component ϵ ϕ ( x t , t , X ^ c o a r s e ) , thereby narrowing the solution space and improving the sharpness of the generated radar echoes, as illustrated in Figure 5.
The forward diffusion process of EGN-Nowcast is defined as a standard Markovian Gaussian noising procedure. Starting from the ground-truth target precipitation field x 0 , Gaussian noise is gradually added over T timesteps according to a predefined variance schedule, progressively transforming the target precipitation field into an isotropic Gaussian distribution. The reverse process then learns to iteratively denoise these noisy representations to recover fine-grained precipitation details under the guidance of the coarse prediction generated by the first-stage Transformer. This formulation follows the standard diffusion probabilistic modeling framework and does not invoke any physical analogy to atmospheric dynamics. Given a real high-resolution radar observation sample x 0 q ( x ) , a fixed variance schedule β t ( 0 , 1 ) is defined. Gaussian noise is gradually injected into the data over discrete time steps t [ 1 , T ] . The transition probability for each step is defined as follows:
q ( x t | x t 1 ) = N ( x t ; 1 β t x t 1 , β t I )
By utilizing the reparameterization trick of Gaussian distributions, the state distribution at any arbitrary time step t is directly derived:
q ( x t | x 0 ) = N ( x t ; α ¯ t x 0 , ( 1 α ¯ t ) I )
Here, α ¯ t = s = 1 t ( 1 β s ) . Under this standard Gaussian noising procedure, when the total number of steps T is sufficiently large, the structural information of the original meteorological signal is completely corrupted, and the latent variable x T converges to an isotropic standard normal distribution N ( 0 , I ) .
To recover precipitation fields with high-fidelity textures from pure noise, the inverse mapping of the aforementioned process, known as the reverse denoising process, must be learned. This process corresponds to the generative model in variational inference, aiming to learn a parameterized Markov transition kernel p ϕ . Distinct from unconditional diffusion generation, EGN-Nowcast adopts a structural conditioning strategy in which the coarse prediction from the first stage guides the reverse denoising process. The reverse transition probability is modeled as a parameterized conditional Gaussian distribution p ϕ ( x t 1 | x t , X ^ c o a r s e ) . This implies that the denoising trajectory is not only dependent on the current stochastic state x t but is also constrained by the deterministic coarse structure X ^ c o a r s e output by the first stage. Its distribution is formulated as follows:
p ϕ ( x t 1 | x t , X ^ c o a r s e ) = N ( x t 1 ; μ ϕ ( x t , t , X ^ c o a r s e ) , β t I )
The task of the neural network is not to directly predict the image itself; rather, the noise component contained in the current time step is predicted via a function approximator ϵ ϕ .
Regarding the specific network architecture implementation, an improved multi-scale spatiotemporal residual network is adopted as the backbone. To effectively inject macro-structural information into the micro-generation process, computationally expensive cross-attention mechanisms were not adopted. Instead, a more direct channel-wise concatenation strategy that preserves spatial alignment characteristics was designed. Specifically, X ^ c o a r s e is first dimensionally aligned via a shallow feature extractor, and subsequently stacked with the noisy image x t along the channel dimension to form a joint input tensor I i n R H × W × ( C + C c o n d ) . Furthermore, to enable the network to perceive the diffusion progress, the time step t is mapped to a time embedding vector via sinusoidal positional encoding and injected into each residual block. This structural conditioning narrows the solution space because the macro-location and topological shape of cloud clusters are already constrained by X ^ c o a r s e . Consequently, the model can focus more on the frequency domain completion task—namely, inferring and synthesizing high-frequency texture details. The training objective is based on maximizing the variational lower bound of the log-likelihood. By ignoring constant terms related to weighting coefficients, the complex KL divergence minimization problem is simplified to the weighted MSE between the predicted noise and the actual added noise. The final loss function is defined as follows:
L d i f f = E x 0 , ϵ , t , X ^ c o a r s e ϵ ϵ ϕ ( x t , t , X ^ c o a r s e ) 2
Through this optimization objective, the network essentially performs denoising score matching, whereby the gradient field of the data distribution is implicitly learned.
During the inference phase, EGN-Nowcast exhibits the advantage of probabilistic ensemble forecasting. For a given deterministic historical input and the structure prediction X ^ c o a r s e , K distinct prediction samples { Y ^ ( k ) } k = 1 K can be generated in parallel. This is achieved by sampling different initial Gaussian noise vectors x T ( k ) N ( 0 , I ) . Because all samples are conditioned on the same coarse prediction, their large-scale precipitation structures are generally similar, while diversity appears mainly in local textures and high-intensity details. Consequently, not only can a single deterministic prediction map be provided, but precipitation probabilities and uncertainty confidence intervals can also be calculated. Thus, the ensemble outputs can provide additional probabilistic information for downstream nowcasting assessment.
The complete architecture and training configuration of EGN-Nowcast are shown in Table 1.
To clarify the computational cost of EGN-Nowcast, we report inference-speed and memory-consumption measurements during the evaluation phase. Training uses a standard 1000-step DDPM schedule, while inference adopts 50-step DDIM sampling. On 2 × NVIDIA RTX 4090 GPUs, the core model inference latency for one six-frame forecast sequence is 3.24 s for generating a single stochastic realization, covering predictions from T + 30 to T + 180 min. Since probabilistic forecasting requires multiple diffusion realizations, the total ensemble generation time depends on the number of generated members and the available computational resources. Multiple stochastic realizations can be generated through batch inference when sufficient GPU memory is available. In our offline local pipeline, the approximate latency including data loading, normalization, single-realization model inference, and model-output postprocessing remains below 6.00 s. This timing does not include upstream radar product generation, radar quality control, external data transfer, operational dissemination, or other system-level procedures. The runtime memory consumption during single-batch forward evaluation is approximately 1.84 GB of VRAM per GPU. These results suggest that EGN-Nowcast has moderate model-side computational cost, while further optimization of ensemble generation efficiency remains necessary for operational deployment.

2.5. Evaluation Metrics

To quantitatively evaluate the performance of EGN-Nowcast in the precipitation nowcasting task and to conduct a fair comparison with existing mainstream methods, two categories of evaluation metrics commonly used in the meteorological domain were adopted: continuous metrics measuring pixel-level prediction accuracy, and categorical scoring metrics measuring the capability to capture precipitation events.
Mean Squared Error (MSE), Mean Absolute Error (MAE), and Pearson Correlation Coefficient (PCC) are utilized to evaluate the consistency between predicted and observed precipitation fields in terms of numerical agreement and overall variation tendency. Specifically, MSE and MAE are employed to quantify the pixel-level error between predicted frames and ground truth after inverse normalization. Although rainfall fields are normalized during model training, the continuous metrics are calculated in the physical rainfall-intensity domain (mm/h), where lower values indicate higher prediction accuracy. The calculation formulas are as follows:
M S E = 1 T × H × W t = 1 T i = 1 H j = 1 W ( Y t , i , j Y ^ t , i , j ) 2
M A E = 1 T × H × W t = 1 T i = 1 H j = 1 W | Y t , i , j Y ^ t , i , j |
The observed rainfall-intensity field after inverse normalization is denoted by Y, and the corresponding predicted rainfall-intensity field is denoted by Y ^ , where T, H, and W represent the time steps, height, and width, respectively. Additionally, PCC is used to quantify the linear correlation between predicted and observed precipitation fields. In this study, PCC is calculated over all forecast cases, forecast lead times, and spatial locations in the independent 2025 test set after inverse normalization to the physical rainfall-intensity domain. Because precipitation fields contain a large proportion of zero-rainfall pixels, PCC is interpreted together with categorical and high-intensity precipitation verification metrics rather than as an independent indicator of extreme precipitation detection capability. The spatiotemporal calculation formula is presented as follows:
P C C = t = 1 T i = 1 H j = 1 W ( Y t , i , j Y ¯ ) ( Y t , i , j ^ Y ^ ¯ ) t = 1 T i = 1 H j = 1 W ( Y t , i , j Y ¯ ) 2 t = 1 T i = 1 H j = 1 W ( Y t , i , j ^ Y ^ ¯ ) 2
To evaluate the forecasting capability of the model for precipitation of varying intensities (e.g., light, moderate, and heavy rain), three key physical thresholds τ { 1 , 2 , 8 } mm / h are selected for binarization. These thresholds are applied directly to the de-normalized rainfall-intensity fields to maintain a clear and physically interpretable event-definition procedure. All threshold-based evaluations are consistently performed in the rainfall-intensity domain, where the thresholds correspond to rainfall intensities expressed in mm/h. Because X = R / R max with R max = 40 mm / h , the corresponding normalized thresholds used internally for binarization are 0.025 , 0.050 , and 0.200 for 1, 2, and 8 mm/h, respectively. Based on the relationship between the predicted value and the ground truth relative to the threshold τ , pixels are classified into the following categories: (1) TP (True Positive): Prediction τ and Ground Truth τ ; (2) FP (False Positive): Prediction τ but Ground Truth < τ ; (3) FN (False Negative): Prediction < τ but Ground Truth τ .
Based on the aforementioned contingency-table statistics, three categorical verification metrics were calculated: Probability of Detection (POD), Critical Success Index (CSI), and False Alarm Rate (FAR). POD measures the fraction of observed precipitation events that are correctly detected by the model. A higher POD indicates better event-detection sensitivity. It is defined as follows:
P O D = T P T P + F N
The hit rate of the model is comprehensively measured by the CSI, which reflects the reliability of the forecast. Compared to singular pixel-level errors, the effectiveness of the model in forecasting strong convective precipitation areas within actual meteorological operations is better reflected by the CSI metric. It serves as a core indicator for evaluating the comprehensive skill of nowcasting models, where a higher value indicates superior performance. It is defined as follows:
C S I = T P T P + F P + F N
The proportion of instances where precipitation is predicted by the model but does not occur in reality is reflected by the FAR. A lower FAR indicates fewer false alarms among predicted precipitation events, which is desirable for nowcasting applications. It is defined as follows:
F A R = F P T P + F P
To quantify the uncertainty of verification metrics, paired forecast-case-level bootstrap resampling was performed on the independent 2025 KNMI test set. For each bootstrap iteration, forecast cases were sampled with replacement, and the same resampled cases were applied to all compared models to maintain a paired comparison. The 95% confidence intervals were estimated from the 2.5th and 97.5th percentiles of the bootstrap distributions. The resampling unit was defined as a complete forecast case, including the input radar sequence, predicted sequence, and verifying observations, rather than individual pixels. This design preserves the spatial dependence within each precipitation field and avoids treating correlated pixels as independent samples. Since neighboring forecast cases may contain overlapping prediction horizons due to the 30 min stride, the resulting intervals should be interpreted as evaluation-protocol-based uncertainty estimates rather than fully independent climatological uncertainty bounds.

3. Results

3.1. Implementation Details

A large-scale real-world precipitation benchmark dataset covering the period from 2016 to 2025 was constructed in this study. Data preprocessing adheres to a standardized spatiotemporal tensor construction pipeline: After undergoing quality control and rainfall-intensity transformation, the continuous rainfall physical fields are spatially extracted from the original KNMI radar products and remapped onto a 128 × 128 Cartesian coordinate grid. Specifically, the original radar fields are provided on a 765 × 700 Cartesian grid. A fixed spatial window is extracted using the same cropping configuration for all samples, resulting in an intermediate 256 × 256 representation. The cropped fields are subsequently resized to 128 × 128 using bilinear interpolation. Invalid radar pixels marked by the missing-value flag are assigned zero rainfall intensity during preprocessing. Regarding temporal configuration, EGN-Nowcast operates on a 30 min sparse sampling interval extracted from the original continuous 5 min radar archive. This temporal configuration is designed to characterize large-scale precipitation evolution and structural transitions rather than high-frequency prediction of rapid convective initiation and short-lived precipitation fluctuations. An observation window of three sparse frames (spanning the past 90 min) and a prediction window of six sparse frames (covering a 180 min forecasting horizon) are established. Consecutive forecasting samples were generated with a 30 min stride, consistent with the sparse temporal sampling interval. To accommodate the latent distribution of diffusion generative models, all rainfall-intensity fields are scaled via an empirical divisor of R max = 40 mm / h to stabilize gradient propagation and bound the long-tailed values near the interval [ 0 , 1 ] . All experiments were implemented based on the PyTorch version 2.1.0 deep learning framework. A two-stage optimization strategy was adopted for training EGN-Nowcast. The first-stage Event-Guided Spatiotemporal Transformer was trained to generate coarse precipitation predictions with auxiliary event supervision, followed by separate training of the Conditional Diffusion Refiner using the coarse predictions generated by the first-stage predictor as conditional inputs.
  • Event-Guided Spatiotemporal Transformer: The first-stage structure predictor adopts a standard spatiotemporal Transformer backbone with event-guided auxiliary supervision. Spatial and temporal dependencies are learned from radar sequences through standard multi-head self-attention, while the auxiliary event-classification loss increases the optimization emphasis on high-intensity precipitation samples. This event-guided design is data-driven and does not rely on hand-crafted spatial masks, region-specific attention operators, or manually specified attention weights. The AdamW optimizer is employed, with momentum parameters set to β 1 = 0.9 and β 2 = 0.999 . Gradient accumulation with 4 accumulation steps is adopted, resulting in an effective batch size of 64.
  • Conditional Diffusion Refiner: The probabilistic refinement module is based on a standard Gaussian diffusion process, with time steps set to T = 1000 . A conditional U-Net architecture with base channels of 64 and channel multipliers of [1, 2, 4, 8] is adopted for the denoising network. The coarse prediction generated by the first-stage Transformer is used as the conditional input of the denoising network. In the inference phase, the DDIM sampling algorithm is employed to compress the reverse generation process to 50 steps. The checkpoint with the lowest monitored validation loss was selected for final evaluation.

3.2. Comparative Analysis of Nowcasting Performance

To evaluate the performance of EGN-Nowcast in handling complex precipitation evolution, a cross-generational comparison is conducted between EGN-Nowcast and representative models spanning multiple generations within the current field of precipitation nowcasting. The full spectrum, ranging from classic physical extrapolation to cutting-edge large models, is covered by the selected baselines: First, PySTEPS, a traditional physical algorithm based on the optical flow method, is included; second, ConvLSTM, regarded as a foundational work in deep learning spatiotemporal prediction, is selected to represent the performance benchmark of early Recurrent Neural Networks; furthermore, TECO [31], a video generation model possessing strong spatiotemporal coherence modeling capabilities, is chosen; finally, variants of spatiotemporal large models representing the current SOTA are included, namely Nuwä-EVL [32]—based on multimodal evolution—along with NowcastingGPT and NGE [33]. Here, NGE denotes the NowcastingGPT-EVL with the generative evolution setting, which is used as the strongest generative baseline in our comparison.
To improve the reproducibility and fairness of the baseline comparison, all learning-based baselines were evaluated under the same KNMI experimental protocol, including identical preprocessing pipeline, chronological train/validation/test split, input–output configuration, spatial resolution, temporal sampling setting, and evaluation procedure. The architectures and capacity settings of external baselines were based on their original papers or publicly available implementations, with necessary adaptations only for the unified KNMI input–output setting. The optimization configurations, including optimizer, learning rate, batch size, and checkpoint selection strategy, followed the corresponding baseline implementations and were selected based on validation performance under the KNMI validation set. The independent 2025 test set was used only for final performance reporting, and a fixed random seed was used for data loading and model initialization in the reported comparison. PySTEPS was not trained because it is an optical-flow-based extrapolation method, but it was configured and evaluated under the same input–output and verification protocol. Since large generative baselines, including TECO, Nuwä-EVL, NowcastingGPT, and NGE, were evaluated without their original external pretraining data or pretrained weights, the results should be interpreted as a controlled comparison under the KNMI radar setting rather than a universal comparison across all possible pretrained configurations.
By benchmarking against baselines spanning physical extrapolation, recurrent structures, and large-model architectures, we evaluate the relative performance of EGN-Nowcast under a unified KNMI experimental setting. The average performance of each model on the test set is summarized in Table 2:
The quantitative evaluation in Table 2 shows that EGN-Nowcast achieves competitive performance in both continuous error metrics and categorical precipitation-event verification. The results indicate that the proposed framework improves event detection while reducing false alarms, particularly under more stochastic precipitation conditions.
Because rare-event metrics can become unstable when the number of observed positive samples is small, we additionally report the number of observed positive pixels at each rainfall-intensity threshold and forecast lead time. For a threshold τ and lead time l, the positive-sample count is computed as
N τ , l + = n , i , j I R n , l , i , j τ ,
where R n , l , i , j denotes the de-normalized observed rainfall intensity for forecast case n, lead time l, and grid cell ( i , j ) .
Table 3 shows that the number of observed positive samples decreases sharply as the threshold increases, especially at 8 mm/h. This confirms that heavy-rainfall verification is more sensitive to sampling variability than the 1 and 2 mm/h thresholds, and helps explain why the absolute CSI values at 8 mm/h remain low.
To further quantify the uncertainty of these deterministic metrics, Table 4 reports forecast-case-level bootstrap confidence intervals for EGN-Nowcast and the strongest baseline, NGE. Different from the standard deviations reported in Table 2, the uncertainty values in Table 4 denote the half-width of the 95% bootstrap confidence intervals obtained from forecast-case-level resampling.
Under the moderate-rainfall threshold of 2 mm/h, EGN-Nowcast achieves a CSI of 0.158, compared with 0.120 for NGE, while reducing FAR from 0.710 to 0.590. The bootstrap uncertainty estimates in Table 4 show non-overlapping 95% confidence ranges for POD, FAR, and CSI between EGN-Nowcast and NGE at 2 mm/h, suggesting statistically stable moderate-rainfall improvements under the current KNMI test-set distribution. This gain suggests that the event-guided spatiotemporal structure predictor helps improve precipitation localization while reducing the dominance of clear-sky background pixels during optimization.
At the more challenging 8 mm/h threshold, EGN-Nowcast achieves a CSI of 0.011 and reduces FAR from 0.52 to 0.42. However, the absolute CSI remains low, and the improvement over NGE is small in absolute terms. As shown in Table 3, observed positive pixels at 8 mm/h are much fewer than those at the 1 and 2 mm/h thresholds, making heavy-rainfall verification more sensitive to sampling variability. The bootstrap confidence intervals in Table 4 further show that the 95% confidence ranges of POD and CSI overlap between EGN-Nowcast and NGE, whereas the FAR intervals do not overlap. Therefore, the 8 mm/h results should be interpreted as modest but favorable improvements in false-alarm suppression and localized high-intensity structure refinement, rather than as evidence of complete pixel-level detection of rare high-intensity precipitation. Beyond the overall test-set comparison, we further examine whether this performance pattern is consistent across different seasonal precipitation regimes.
To assess seasonal robustness, we stratify the 2025 test set into summer (JJA, convective-dominant) and winter (DJF, stratiform-dominant). Summer is evaluated at 8 mm/h. Winter 8 mm/h events are too rare for meaningful statistical comparison, so we report 2 mm/h instead. Results are shown in Table 5.
In summer, EGN-Nowcast reduces FAR from 0.54 to 0.44 while improving CSI from 0.008 to 0.010. In winter, FAR drops from 0.67 to 0.55, and CSI rises from 0.132 to 0.169. These results suggest consistent false-alarm reduction across both convective- and stratiform-dominant regimes, although the summer 8 mm/h gains remain modest because localized convective cores are sparse and sensitive to spatial displacement errors.
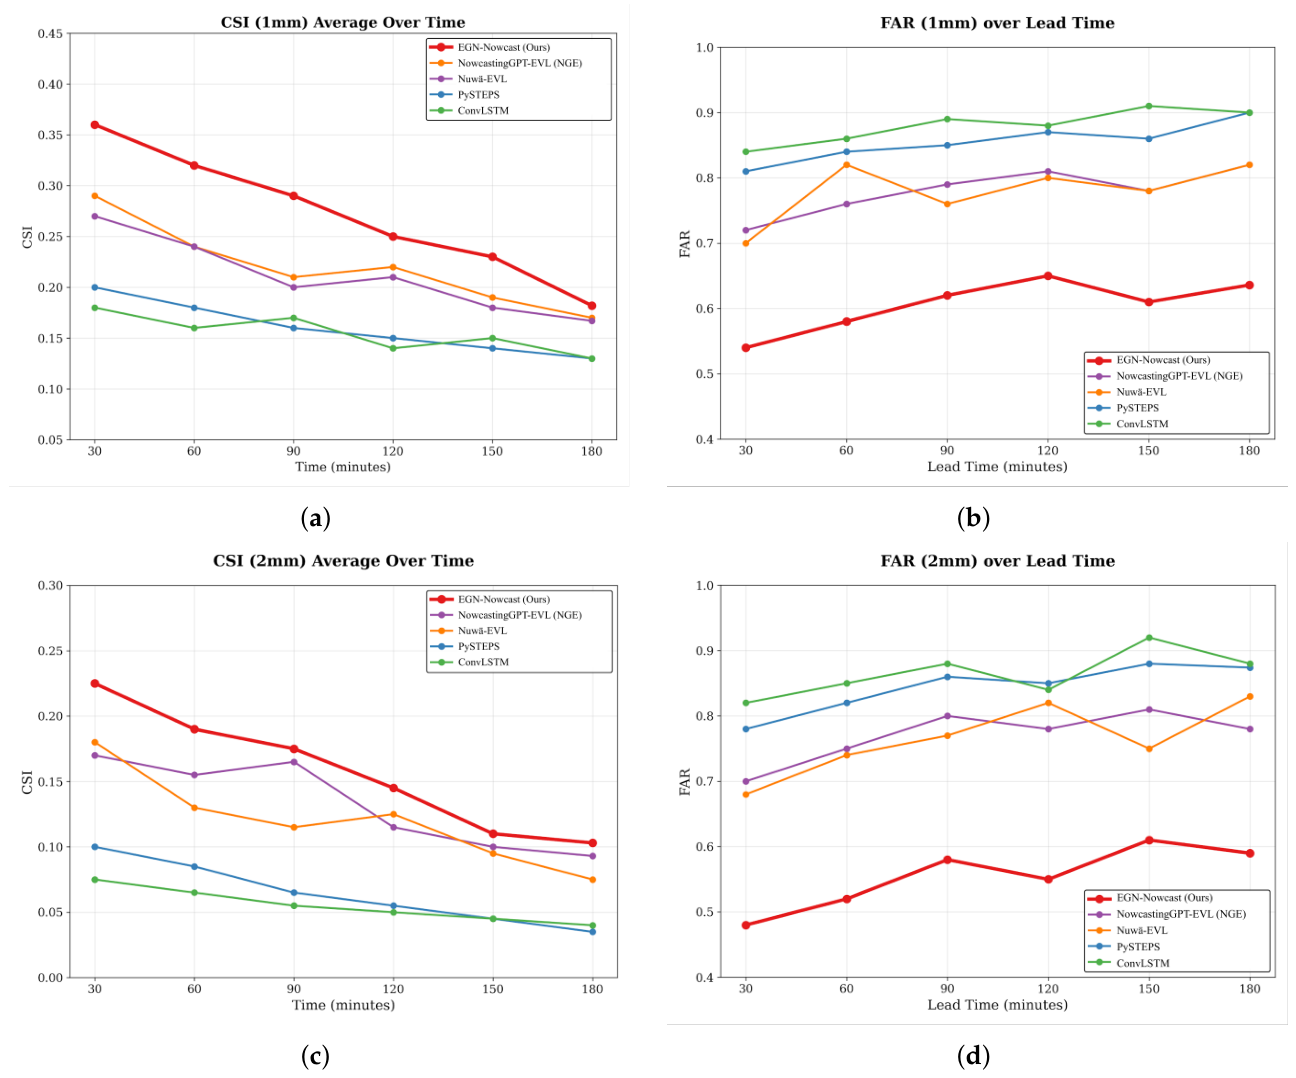
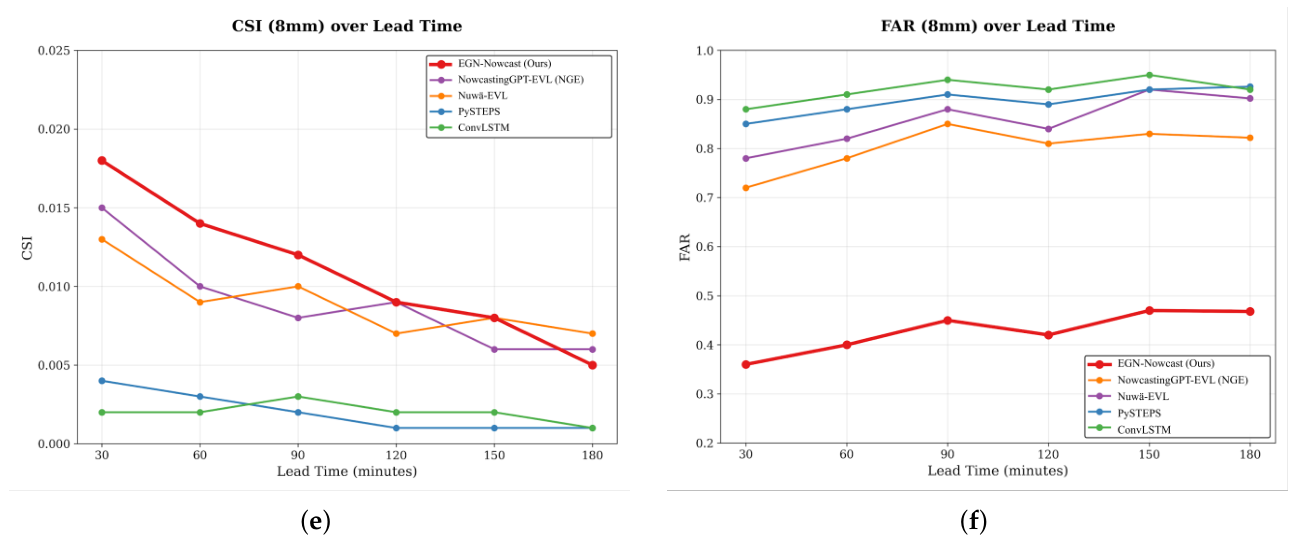
To further evaluate the model’s robustness and its performance decay over temporal scales, we visualize the lead-time evolution of CSI and FAR across three precipitation thresholds (1 mm/h, 2 mm/h, and 8 mm/h) in Figure 6.
The non-monotonic FAR evolution at the 8 mm/h threshold in Figure 6f should be interpreted cautiously. Since heavy-rainfall pixels above 8 mm/h are extremely sparse, FAR at this threshold is highly sensitive to a small number of false-alarm or missed-event pixels at individual lead times. Therefore, the observed fluctuation mainly reflects rare-event sampling variability and threshold sensitivity, rather than a stable physical trend in model behavior.
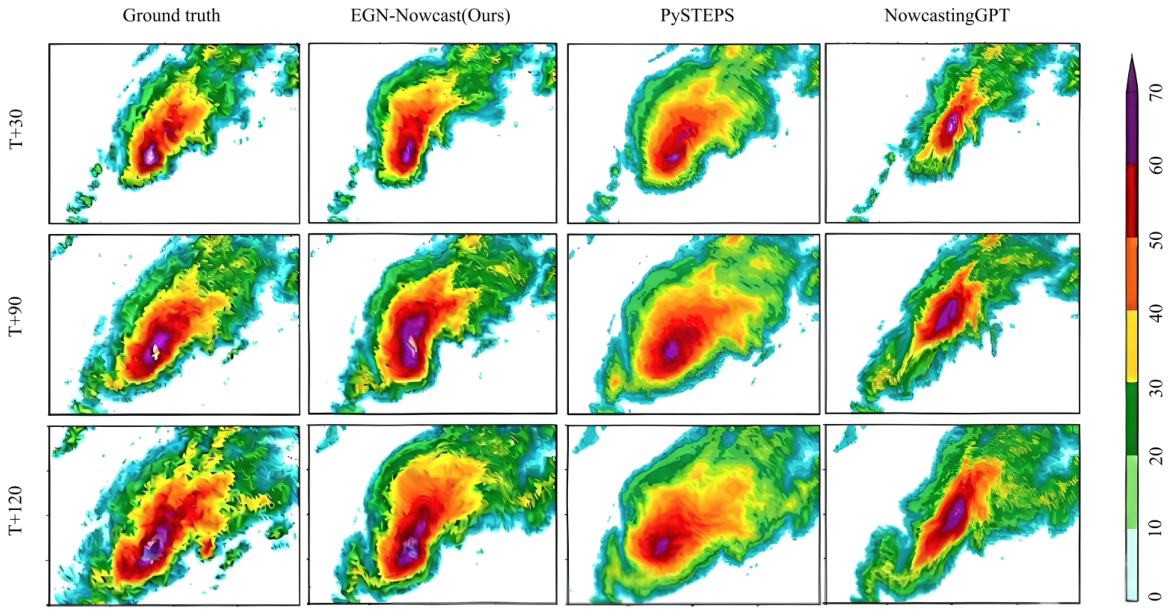
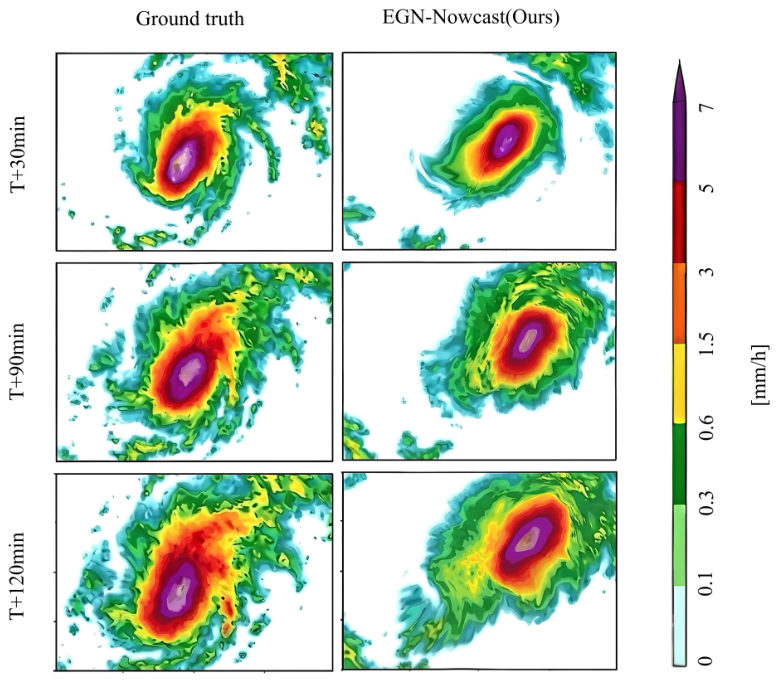
To further validate the predictive robustness of EGN-Nowcast over extended horizons, Figure 7 presents a visual comparison across three critical stages: T = 30 min, T = 90 min, and T = 120 min.
At the early stage (T = 30 min), all models, including the operational baseline PySTEPS and the generative model NowcastingGPT, exhibit reasonable skill in capturing the initial storm structure (top row in Figure 7). As the lead time extends to the mid-to-long range (T = 90 and 120 min), differences among the methods become more evident. PySTEPS shows noticeable spatial displacement and a pixel-scatter effect, leading to a loss of coherent convective structure (third column of Figure 7). Although NowcastingGPT maintains a relatively clear precipitation morphology, it tends to underestimate the peak intensity of the precipitation centers; the high-intensity precipitation cores observed in the ground truth are predicted as moderate-intensity regions (fourth column of Figure 7). In comparison, EGN-Nowcast provides improved localization and structural representation of high-intensity precipitation regions at longer lead times (as highlighted by the white dashed ellipses in the second column of Figure 7). This visual comparison is consistent with the quantitative results, suggesting that event-guided auxiliary supervision helps reduce localization errors, while the Conditional Diffusion Refiner contributes to the recovery of fine-scale precipitation details that are often smoothed in long-lead forecasts. To clarify the case-selection procedure, this case was selected from the independent 2025 test set based on predefined precipitation characteristics, including the occurrence of high-intensity precipitation exceeding the 8 mm/h verification threshold, sufficient precipitation-object coverage, and continuous temporal evolution during the forecast period. The selection was performed independently of model performance and was not based on case-specific verification scores or visually favorable results of EGN-Nowcast. This example is intended only as a qualitative illustration; the overall model comparison is based on the full-test-set quantitative metrics. To further illustrate the limitations of EGN-Nowcast, Appendix A (Figure A1) provides a representative failure case. In that case, EGN-Nowcast captures the main precipitation structure and maintains high-intensity precipitation at extended lead times, but exhibits a spatial displacement error, with the predicted convective core lagging behind the observed location. This highlights the remaining challenge of accurately predicting the location and displacement speed of rapidly evolving convective systems at longer lead times.

3.3. Ablation Study

To systematically investigate the contributions of the core components within the EGN-Nowcast framework, a series of ablation variants were designed for comparative experiments. The aim of this section is to examine the role of event-guided auxiliary supervision in high-intensity precipitation representation and the effectiveness of the Conditional Diffusion Refiner in recovering fine-scale precipitation details. We emphasize that the first-stage Transformer uses standard self-attention; therefore, the ablation does not remove a mathematically distinct region-aware attention operator, but evaluates the effect of event-guided supervision and the two-stage refinement strategy.
The following five configurations were compared on the same test set to evaluate the contributions of event-guided auxiliary supervision and the Conditional Diffusion Refiner. In this study, event-guided optimization refers to the training strategy implemented through the auxiliary classification loss, rather than an independent architectural component. (1) Baseline: A deterministic Transformer backbone without auxiliary event supervision and without the Conditional Diffusion Refiner. The deterministic backbone prediction is directly used as the final output. (2) R1: A variant in which the event-guided training strategy is removed from the first-stage predictor, and the coarse prediction is generated using only the standard reconstruction objective. This variant evaluates the influence of event-guided optimization on the deterministic precipitation representation. (3) R2 (w/o Conditional Diffusion Refiner): the first-stage structure predictor is retained, but the diffusion model in the second stage is removed, and the deterministic prediction from the first stage is directly used as the final output. (4) w/o Aux: The complete two-stage architecture is retained, while only the auxiliary classification loss is disabled by setting its weight to zero. This variant isolates the contribution of the auxiliary supervision signal within the event-guided training strategy. (5) EGN-Nowcast: The complete model combining event-guided auxiliary supervision and conditional diffusion refinement.
The performance differences in various variants on key metrics are presented in Table 6.
The quantitative results in Table 6 demonstrate the distinct and complementary roles of the proposed components. Compared with the Baseline, which only employs the deterministic Transformer backbone, the ablation variants reveal the contributions of event-guided auxiliary supervision and conditional diffusion refinement. The effect of event-guided auxiliary supervision varies across evaluation metrics, indicating its influence on precipitation localization and intensity representation under severe class imbalance. When the event-guided optimization strategy is removed in R1, the CSI at 2 mm/h decreases from 0.158 to 0.128, accompanied by an increase in FAR from 0.59 to 0.69. This suggests that event-guided optimization contributes to precipitation localization under background-dominated conditions. The comparison between R1 and w/o Aux further reveals the different roles of the event-guided training strategy and the auxiliary classification objective. R1 evaluates the effect of removing the event-guided optimization strategy from the first-stage predictor, whereas w/o Aux retains the two-stage forecasting framework and disables only the auxiliary classification loss. Therefore, R1 reflects the contribution of the overall event-guided training strategy, while w/o Aux isolates the specific effect of the auxiliary classification signal within the complete forecasting framework. Overall, the ablation results indicate that the proposed components contribute to different aspects of precipitation forecasting rather than uniformly improving all evaluation metrics.
It is worth noting that R2, which removes the Conditional Diffusion Refiner, achieves lower MSE and MAE than the Baseline but shows a lower CSI at the 8 mm/h threshold. This behavior reflects the mismatch between pixel-level average-error metrics and high-intensity precipitation verification under severe class imbalance. Since MSE and MAE are dominated by clear-sky and weak-to-moderate precipitation pixels, a deterministic regression model can reduce average errors by producing smoother and more conservative precipitation fields. However, this smoothing tendency suppresses localized high-intensity convective cores, which are critical for high-intensity precipitation representation. As a result, R2 improves global pixel-level accuracy relative to the Baseline, but loses skill in high-intensity precipitation representation compared with the full EGN-Nowcast model. This result supports the role of the Conditional Diffusion Refiner in recovering high-frequency precipitation structures that may be smoothed by deterministic prediction. It should be noted that EGN-Nowcast does not uniformly improve all categorical metrics. For example, the deterministic Baseline achieves a higher CSI at the 2 mm/h threshold than the full model. This reflects the trade-off between categorical pixel-level detection and diffusion-based structural refinement. Therefore, the contribution of EGN-Nowcast is mainly reflected in improving localized precipitation structure representation and reducing false alarms, rather than maximizing every individual verification metric.
The auxiliary-loss ablation further clarifies the role of event-aware supervision. Here, the Event-Aware Auxiliary Loss should be interpreted as a data-driven intensity-aware regularizer rather than as a physical constraint. It does not explicitly enforce mass conservation, moisture conservation, storm-motion constraints, or atmospheric governing equations. Instead, it increases the optimization emphasis on sparse high-intensity precipitation regions during training. Compared with the full EGN-Nowcast model, removing the Event-Aware Auxiliary Loss leads to moderate degradation in MSE and MAE, from 3.22 to 3.38 and from 0.58 to 0.60, respectively. However, the degradation is more evident for high-intensity precipitation verification: CSI at 8 mm/h decreases from 0.011 to 0.009, while FAR at 8 mm/h increases from 0.42 to 0.52. These results suggest that the auxiliary loss mainly provides an additional intensity-aware optimization signal for sparse high-intensity regions and contributes to reducing false alarms under high-intensity precipitation conditions, rather than uniformly improving all precipitation metrics.
Finally, the full EGN-Nowcast model combines event-guided supervised structure prediction with conditional diffusion refinement. Accurate spatiotemporal structural representations are enhanced through event-guided auxiliary supervision, while high-frequency textures and localized precipitation details are recovered via the diffusion model. Consequently, EGN-Nowcast achieves a favorable empirical trade-off among pixel-level, categorical, and high-intensity precipitation verification metrics.

3.4. Probabilistic Forecast Verification

To further evaluate the probabilistic forecasting capability of EGN-Nowcast, we conduct probabilistic verification using the Continuous Ranked Probability Score (CRPS) and a reliability diagram for heavy-precipitation events. During inference, EGN-Nowcast generates N = 10 stochastic realizations for each input sequence through multi-realization diffusion sampling. The ensemble size of N = 10 is adopted to balance probabilistic verification with inference efficiency under the current computational budget. We note that this ensemble size provides an initial estimate of predictive uncertainty, but remains limited for robust estimation of tail probabilities associated with rare heavy-rainfall events. Therefore, the probabilistic results, especially those at the 8 mm/h threshold, should be interpreted cautiously. The final deterministic forecast used for MSE, MAE, PCC, CSI, and FAR is obtained as the ensemble mean of these generated samples:
Y ^ det = 1 N n = 1 N Y ^ ( n )
where Y ^ ( n ) denotes the n-th stochastic prediction. Before deterministic verification, the ensemble-mean prediction is converted back to the physical rainfall-intensity domain for comparison with the ground-truth rainfall fields. For event-based probabilistic verification, the exceedance probability at rainfall threshold τ is computed as the fraction of generated samples exceeding τ :
p τ ( i ) = 1 N n = 1 N I Y ^ i ( n ) τ
where i denotes a spatial grid point.
The overall predictive distribution is evaluated using the Continuous Ranked Probability Score (CRPS). For an ensemble predictive distribution F and observation y, CRPS is defined as
C R P S ( F , y ) = + F ( z ) I ( z y ) 2 d z .
For an ensemble forecast with N members, the empirical CRPS is computed as
C R P S = 1 N n = 1 N | x ^ ( n ) y | 1 2 N 2 n = 1 N m = 1 N | x ^ ( n ) x ^ ( m ) | .
CRPS is computed on the normalized predictive distribution and averaged over all spatial locations and forecast lead times; therefore, the reported CRPS is dimensionless, and lower values indicate better probabilistic forecast performance. Through multi-realization stochastic sampling, EGN-Nowcast achieves a lower mean CRPS of 0.142 than NowcastingGPT (0.168), indicating improved predictive distribution quality. This result suggests that the conditional diffusion refinement stage contributes not only to localized spatial texture recovery but also to probabilistic forecast skill. Since deterministic regression variants do not generate multiple stochastic realizations, their probabilistic spread is not directly comparable in this CRPS evaluation.
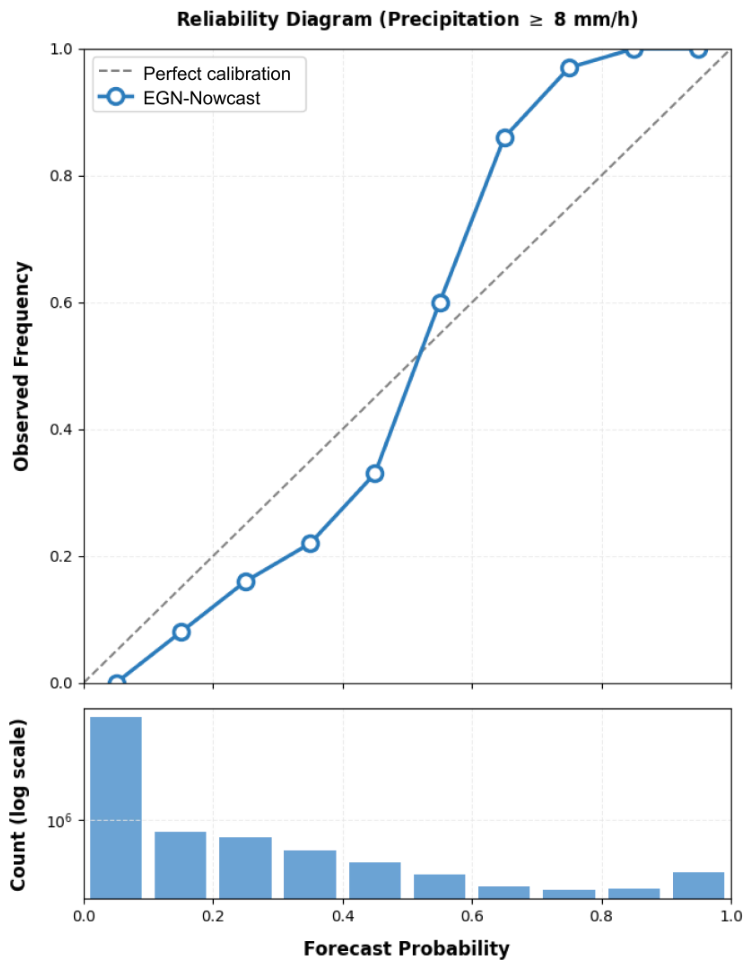
To further examine probability calibration for heavy precipitation, we construct a reliability diagram for the precipitation ≥ 8 mm/h event, as shown in Figure 8. The forecast probability at each grid point is computed as the fraction of N = 10 stochastic samples exceeding the threshold. The reliability curve shows a clear monotonic relationship between forecast probability and observed event frequency, indicating that the diffusion ensemble provides informative probabilistic ranking for heavy precipitation. Meanwhile, its deviation from the perfect-calibration line, with most populated bins lying above the diagonal, suggests that the raw ensemble probabilities are somewhat conservative for this rare event. The lower histogram reports the number of grid points in each forecast-probability bin on a logarithmic scale, highlighting the strong imbalance between low- and high-probability bins.
Because the reliability diagram pools grid-point probabilities across space and forecast lead times, the samples exhibit spatial and temporal dependence. Therefore, the reliability curve is interpreted as a calibration diagnostic rather than an independent-sample statistical test. For the 8 mm/h reliability diagram, because the 10-member ensemble produces exactly eleven discrete exceedance probabilities, namely p = m / 10 for m = 0 , 1 , , 10 , the reliability diagram is constructed using these eleven discrete probability categories rather than continuous probability intervals. The sample counts for the categories p = 0 , 0.1 , , 0.9 are 1,685,290,121, 412,543, 185,312, 94,271, 52,834, 31,419, 18,922, 11,283, 6514, and 6989, respectively, and the p = 1.0 category has a count of zero in the 2025 test set. These counts refer to all grid-point forecast-probability samples, rather than observed positive pixels. Most samples are concentrated in the lowest-probability category, confirming that the 8 mm/h reliability curve is strongly affected by class imbalance and should therefore be interpreted cautiously. The Brier Score for the 8 mm/h exceedance event was computed from the ensemble exceedance probability and the binary observed event indicator on the independent 2025 test set, yielding a value of 4.68 × 10 5 . Given the low frequency of this rare precipitation event, the absolute Brier Score is strongly affected by the large number of non-event samples. Therefore, the climatological reference score and Brier Skill Score are calculated to provide a more meaningful probabilistic assessment.
The event climatological frequency is defined as:
p c l i m = N ( R 8 mm / h ) N t o t a l
where N ( R 8 mm / h ) denotes the number of observed grid points exceeding the 8 mm/h threshold, and N t o t a l denotes the total number of evaluated grid-point samples across all forecast cases and lead times in the independent 2025 test set.
B S c l i m = p c l i m ( 1 p c l i m )
B S S = 1 B S B S c l i m
Therefore, BS, BSS, reliability analysis, and categorical metrics are jointly considered for evaluating probabilistic performance under severe event imbalance. As an ensemble-dispersion diagnostic, the correlation between ensemble spread and ensemble-mean absolute error is computed over forecast cases. The ensemble spread is calculated from the 10 stochastic forecast members, and the resulting spread–error correlation is r = 0.42 , indicating that ensemble dispersion contains information related to forecast uncertainty.
To further evaluate temporal consistency, we perform an object-based trajectory analysis of high-intensity precipitation objects defined by an 8 mm/h verification threshold. Connected-component labeling is applied to binary rainfall masks generated from the predicted and observed precipitation fields. Eight-neighbor connectivity is adopted for precipitation object extraction. To reduce isolated noisy detections caused by radar uncertainty and stochastic diffusion sampling, objects with an area smaller than 5 connected pixels are removed before object matching. Since the final verification grid has a spatial resolution of approximately 2 km per pixel, this filtering corresponds to an effective minimum object area of approximately 20 km2. The object-based verification is conducted on the final forecast grid (128 × 128 pixels), which is identical to the resolution used for quantitative forecast evaluation. Predicted and observed precipitation objects are associated between consecutive forecast frames using a one-to-one centroid-based matching strategy. A predicted object is considered matched with an observed object when the centroid distance is within 10 pixels. This analysis is used to evaluate precipitation localization and structural evolution rather than as an independent object detection framework. The Mean Absolute Displacement Error (MADE) between predicted and ground-truth object centroids is used to quantify trajectory deviation. EGN-Nowcast achieves a lower MADE of 0.83 pixels/frame compared with 1.47 pixels/frame for NGE, indicating improved consistency in the spatial evolution of precipitation objects during forecast sequences.
Object Detection Rate (ODR) measures the fraction of observed heavy-rainfall objects matched by predicted objects, while area bias measures the ratio between the total area of matched predicted and observed objects. Unmatched observed objects are counted as missed detections, while unmatched predicted objects contribute to false object occurrences. Object-based metrics are reported as point estimates calculated on the independent 2025 KNMI test set. These metrics are used to evaluate precipitation-object localization and structural evolution consistency rather than to provide probabilistic uncertainty estimates.
As shown in Table 7, EGN-Nowcast achieves higher ODR, lower MADE, and an area bias closer to 1 than NGE, suggesting modest improvements in heavy-rainfall localization and object-size representation.


4. Discussion

The experimental results show that EGN-Nowcast improves the representation of localized high-intensity precipitation structures by decoupling precipitation nowcasting into deterministic precipitation evolution modeling coupled with conditional diffusion-based structural refinement. This two-stage design is motivated by the practical distinction between large-scale precipitation evolution and small-scale texture uncertainty, rather than by an explicit numerical formulation of atmospheric governing equations. The present results do not indicate that the trade-off between pixel-level accuracy and perceptual realism has been fundamentally resolved. Instead, the observed improvements suggest that the proposed framework provides a favorable empirical compromise under the selected KNMI radar dataset, preprocessing pipeline, and evaluation protocol. Further validation across different radar systems, climatic regimes, spatial resolutions, and operational nowcasting settings is required before drawing broader conclusions. Traditional regression-based models, such as ConvLSTM and PredRNN, often suffer from regression-to-the-mean effects caused by pixel-wise error minimization, resulting in over-smoothed precipitation fields and underestimated high-intensity rainfall. In contrast, EGN-Nowcast first generates a coherent structural representation Y ^ s t r and then employs a Conditional Diffusion Refiner to recover fine-scale precipitation textures, which helps improve the representation of localized convective structures over extended lead times. As illustrated in the visual comparisons, this structure–texture refinement strategy reduces the blurring and over-smoothing effects commonly observed in deep learning-based precipitation nowcasting.
EGN-Nowcast does not impose explicit physical constraints such as mass conservation, moisture conservation, storm-motion constraints, or atmospheric governing equations. Instead, the Event-Aware Auxiliary Loss acts as a data-driven intensity-aware regularizer by increasing the optimization emphasis on high-intensity convective grids. Therefore, the event-guided mechanism should be interpreted as a learning-based optimization strategy rather than a physical constraint. The PCC of 0.21, the CRPS of 0.142, and the reliability analysis in Figure 8 indicate improved structural consistency and useful probabilistic information under severe precipitation class imbalance. Integration with explicit physical constraints remains an important direction for future work.
Furthermore, the event-guided spatiotemporal Transformer helps alleviate the zero-inflated and long-tailed distribution of precipitation data by increasing sensitivity to sparse but important convective regions. This reduces the dominance of clear-sky background pixels and allows the Conditional Diffusion Refiner to focus on fine-scale precipitation detail refinement rather than basic precipitation localization. This effect is achieved through auxiliary supervision and does not rely on a new region-specific attention mechanism or explicit physical modeling.
From the perspective of deployment-oriented nowcasting, the computational cost of diffusion-based refinement remains an important consideration. All runtime measurements were obtained on 2× NVIDIA RTX 4090 GPUs. For a single six-frame forecast sequence, EGN-Nowcast requires 3.24 s for core model inference, while the complete offline pipeline, including data loading, normalization, inference, and postprocessing, remains below 6.00 s. These measurements represent model-side latency and do not include upstream radar product generation, quality control, data transmission, or operational dissemination procedures.
For probabilistic forecasting, EGN-Nowcast currently uses N = 10 stochastic realizations. This ensemble size provides an initial estimate of predictive uncertainty but remains limited for robust estimation of rare-event tail probabilities, particularly at the 8 mm/h threshold. Future deployment-oriented studies will investigate more efficient diffusion sampling, consistency distillation, latent-space diffusion, mixed-precision inference, pruning, and parallel ensemble generation to improve operational scalability. In addition, the uncertainty estimates reported in this study mainly characterize stochastic sampling variability under a fixed trained model. The contribution of training initialization variability is not explicitly evaluated in the current controlled KNMI benchmark setting. Future studies will further investigate uncertainty decomposition across different training seeds and stochastic inference processes. Therefore, the reported uncertainty intervals should be interpreted as predictive sampling uncertainty and metric uncertainty under the fixed trained model, rather than complete model uncertainty.
Several limitations remain regarding rare high-intensity precipitation representation and generalization. Rapid convective initiation without clear historical precursors, storm displacement, and localized high-intensity structures remain challenging, particularly at longer lead times and under rare-event conditions. It should also be noted that the direct pixel-level detection of rare high-intensity precipitation events remains challenging due to severe class imbalance and limited event frequency. Therefore, the improvements observed in this study should be interpreted primarily as enhanced localized high-intensity precipitation structure representation and false-alarm control under rare-event conditions, rather than complete recovery of all high-intensity precipitation pixels. A broader multi-event evaluation with additional object-based, neighborhood-based, or scale-aware verification would further improve the assessment of high-intensity precipitation forecasting capability.
The current evaluation is limited to the KNMI radar dataset, representing a mid-latitude temperate maritime precipitation regime. Therefore, the results should not be directly generalized to other climatic or radar environments without further validation. Tropical, monsoon, mountainous, and continental convective systems may require recalibration of event definitions, precipitation conversion procedures, and normalization strategies. Radar-network differences, including attenuation correction, beam blockage, calibration procedures, spatial sampling geometry, and polarization availability, may also affect transfer performance. Practical transfer to external radar domains would therefore require radar-specific quality control, local QPE or Z–R recalibration, threshold re-estimation, and potentially transfer learning or domain adaptation using local observations.
Finally, the current study does not include a direct comparison with DGMR. Although DGMR is an important generative baseline for radar nowcasting, a fair comparison requires retraining and evaluation under the same preprocessing pipeline, temporal configuration, spatial resolution, and probabilistic verification protocol. A partial reproduction without the original training conditions may introduce additional uncertainty. Future work will extend the evaluation to independent high-impact storm events, external radar domains, operational nowcasting systems, and broader probabilistic verification frameworks.

5. Conclusions

To address the persistent challenges of image blurring and the underrepresentation of localized high-intensity precipitation structures in precipitation nowcasting, an event-guided two-stage nowcasting framework—EGN-Nowcast—is proposed in this study. Deterministic structure modeling is coupled with stochastic texture refinement within this framework, aiming to alleviate the tension between spatiotemporal consistency and high-frequency detail recovery that is commonly observed in traditional regression-based models. By introducing an event-guided auxiliary supervision strategy built upon a spatiotemporal Transformer backbone, the framework is designed to increase the optimization emphasis on sparse high-intensity precipitation samples. This enables the model to better capture localized high-intensity convective structures during coarse prediction, thereby improving the representation of large-scale precipitation evolution. On this basis, fine-scale precipitation textures are refined by the Conditional Diffusion Refiner. This is achieved by conditioning the stochastic denoising process on the coarse prediction from the first stage, mitigating the smoothing effect in strong convective cores under the evaluated radar setting.
Extensive experiments on the KNMI radar dataset show that EGN-Nowcast achieves competitive performance compared with representative baseline and SOTA methods (e.g., NGE) under the evaluated KNMI test protocol. The ablation studies further suggest that the event-guided auxiliary supervision acts as a data-driven intensity-aware regularizer and mainly contributes to precipitation localization and active-area prediction, whereas the diffusion refinement module contributes to recovering localized high-intensity structures and suppressing false alarms. By combining these two components, EGN-Nowcast demonstrates a favorable empirical balance between pixel-level error, structural detail preservation, and false-alarm suppression on the selected KNMI test set. The results also indicate that different evaluation metrics may reflect different optimization preferences, and EGN-Nowcast achieves improvements mainly in localized high-intensity precipitation structure representation and false-alarm control rather than uniformly optimizing every metric.
Despite the improved performance of EGN-Nowcast, its inference latency is increased by the inherent multi-step iterative denoising mechanism of diffusion models. This remains a challenge for short-term nowcasting scenarios that require low-latency inference, especially under multi-member ensemble generation. Furthermore, the current framework does not explicitly enforce mass conservation, moisture conservation, storm-motion constraints, or atmospheric governing equations. The event-guided auxiliary supervision should therefore be interpreted as a data-driven intensity-aware regularizer, rather than as a physical constraint. Because the current validation is limited to the KNMI radar dataset, external validation on independent radar datasets and different precipitation regimes is needed before generalizing the findings beyond the evaluated mid-latitude maritime setting.

Author Contributions

Conceptualization, B.Y.; methodology, W.L., H.Z., and B.Y.; software, W.L. and B.Y.; validation, W.L. and H.Z.; formal analysis, H.C. and T.B.; investigation, H.C., T.B., and Y.G.; resources, H.C.; writing—original draft preparation, W.L.; writing—review and editing, B.Y., H.C., and H.Z.; visualization, W.L. and B.Y.; supervision, H.C.; project administration, H.C.; funding acquisition, B.Y. All authors have read and agreed to the published version of the manuscript.

Funding

This research was funded by the Taishan Industrial Leading Talent Project, the Blue Talent Project, and the Joint Funds of the National Natural Science Foundation of China (No. U22A2068).

Data Availability Statement

The radar-derived precipitation data used in this study were obtained from the Royal Netherlands Meteorological Institute (KNMI) and are available at https://doi.org/10.4121/uuid:05a7abc4-8f74-43f4-b8b1-7ed7f5629a01 and https://doi.org/10.21944/5c23-p429.

Acknowledgments

During the preparation of this work, the authors used OpenAI’s ChatGPT (GPT-5.5) to assist with language refinement and editing. The authors reviewed and revised all AI-assisted content and take full responsibility for the final manuscript.

Conflicts of Interest

Author Bo Yin and author Haipeng Cui were employed by Qingdao Jari Industry Control Technology Co., Ltd. Author Tao Bi was employed by Qingdao Port International Co., Ltd. The remaining authors declare that the research was conducted in the absence of any commercial or financial relationships that could be construed as a potential conflict of interest.

Appendix A. Representative Failure Case Analysis

To provide a transparent boundary of model performance, Figure A1 illustrates a representative failure mode of the EGN-Nowcast model evaluated on an independent test case. This case features a large-scale rotational system where predicting exact spatial advection is highly challenging.
Figure A1. A representative failure case (spatial displacement error) from the 2025 test set. While EGN-Nowcast successfully maintains the extreme precipitation intensity and structure (purple cores) at extended lead times ( T + 90 min and T + 120 min), the predicted location exhibits a noticeable phase lag compared to the actual movement of the Ground Truth.
Remotesensing 18 02771 g0a1

References

  1. IPCC. Climate Change 2021: The Physical Science Basis. Contribution of Working Group I to the Sixth Assessment Report of the Intergovernmental Panel on Climate Change; Cambridge University Press: Cambridge, UK; New York, NY, USA, 2021. [Google Scholar]
  2. Papalexiou, S.M.; Montanari, A. Global and Regional Increase of Precipitation Extremes Under Global Warming. Water Resour. Res. 2019, 55, 4901–4914. [Google Scholar] [CrossRef] [Scilit]
  3. Tabari, H. Climate change impact on flood and extreme precipitation increases with water availability. Sci. Rep. 2020, 10, 13768. [Google Scholar] [CrossRef] [Scilit] [PubMed]
  4. World Meteorological Organization. State of the Global Climate 2025; Technical Report WMO-No. 1391; World Meteorological Organization (WMO): Geneva, Switzerland, 2025. [Google Scholar] [CrossRef] [Scilit]
  5. Sun, J.; Xue, M.; Wilson, J.W.; Zawadzki, I.; Ballard, S.P.; Onvlee-Hooimeyer, J.; Joe, P.; Barker, D.M.; Li, P.W.; Golding, B.; et al. Use of NWP for Nowcasting Convective Precipitation: Recent Progress and Challenges. Bull. Am. Meteorol. Soc. 2014, 95, 409–426. [Google Scholar] [CrossRef] [Scilit]
  6. Cuo, L.; Pagano, T.C.; Wang, Q.J. A Review of Quantitative Precipitation Forecasts and Their Use in Short- to Medium-Range Streamflow Forecasting. J. Hydrometeorol. 2011, 12, 713–728. [Google Scholar] [CrossRef] [Scilit]
  7. Bauer, P.; Thorpe, A.; Brunet, G. The quiet revolution of numerical weather prediction. Nature 2015, 525, 47–55. [Google Scholar] [CrossRef] [Scilit] [PubMed]
  8. Yano, J.I.; Ziemiański, M.Z.; Cullen, M.; Termonia, P.; Onvlee, J.; Bengtsson, L.; Carrassi, A.; Davy, R.; Deluca, A.; Gray, S.L.; et al. Scientific Challenges of Convective-Scale Numerical Weather Prediction. Bull. Am. Meteorol. Soc. 2018, 99, 699–710. [Google Scholar] [CrossRef] [Scilit]
  9. Woo, W.c.; Wong, W.k. Operational Application of Optical Flow Techniques to Radar-Based Rainfall Nowcasting. Atmosphere 2017, 8, 48. [Google Scholar] [CrossRef] [Scilit]
  10. Pulkkinen, S.; Nerini, D.; Pérez Hortal, A.A.; Velasco-Forero, C.; Seed, A.; Germann, U.; Foresti, L. Pysteps: An open-source Python library for probabilistic precipitation nowcasting (v1.0). Geosci. Model Dev. 2019, 12, 4185–4219. [Google Scholar] [CrossRef] [Scilit]
  11. Foresti, L.; Reyniers, M.; Seed, A.; Delobbe, L. Development and verification of a real-time stochastic precipitation nowcasting system for urban hydrology in Belgium. Hydrol. Earth Syst. Sci. 2016, 20, 505–527. [Google Scholar] [CrossRef] [Scilit]
  12. Imhoff, R.O.; De Cruz, L.; Dewettinck, W.; Brauer, C.C.; Uijlenhoet, R.; van Heeringen, K.J.; Velasco-Forero, C.; Nerini, D.; Van Ginderachter, M.; Weerts, A.H. Scale-dependent blending of ensemble rainfall nowcasts and numerical weather prediction in the open-source pysteps library. Q. J. R. Meteorol. Soc. 2023, 149, 1335–1364. [Google Scholar] [CrossRef] [Scilit]
  13. Shi, X.; Chen, Z.; Wang, H.; Yeung, D.Y.; Wong, W.k.; Woo, W.c. Convolutional LSTM Network: A machine learning approach for precipitation nowcasting. In NIPS’15, Proceedings of the 29th International Conference on Neural Information Processing Systems—Volume 1, Cambridge, MA, USA, 2015; ACM: New York, NY, USA, 2015; pp. 802–810. [Google Scholar]
  14. Wang, Y.; Long, M.; Wang, J.; Gao, Z.; Yu, P.S. PredRNN: Recurrent neural networks for predictive learning using spatiotemporal LSTMs. In NIPS’17, Proceedings of the 31st International Conference on Neural Information Processing Systems, Red Hook, NY, USA, 2017; ACM: New York, NY, USA, 2015; pp. 879–888. [Google Scholar]
  15. Shi, X.; Gao, Z.; Lausen, L.; Wang, H.; Yeung, D.; Wong, W.; Woo, W. Deep Learning for Precipitation Nowcasting: A Benchmark and A New Model. In Proceedings of the Advances in Neural Information Processing Systems 30: Annual Conference on Neural Information Processing Systems 2017, Long Beach, CA, USA, 4–9 December 2017; pp. 5617–5627. [Google Scholar]
  16. Vaswani, A.; Shazeer, N.; Parmar, N.; Uszkoreit, J.; Jones, L.; Gomez, A.N.; Kaiser, L.; Polosukhin, I. Attention is all you need. In NIPS’17, Proceedings of the 31st International Conference on Neural Information Processing Systems, Red Hook, NY, USA, 2017; ACM: New York, NY, USA, 2015; pp. 6000–6010. [Google Scholar]
  17. Bi, K.; Xie, L.; Zhang, H.; Chen, X.; Gu, X.; Tian, Q. Accurate medium-range global weather forecasting with 3D neural networks. Nature 2023, 619, 533–538. [Google Scholar] [CrossRef] [Scilit] [PubMed]
  18. Chen, K.; Han, T.; Ling, F.; Gong, J.; Bai, L.; Wang, X.; Luo, J.J.; Fei, B.; Zhang, W.; Chen, X.; et al. The operational medium-range deterministic weather forecasting can be extended beyond a 10-day lead time. Commun. Earth Environ. 2025, 6, 533–538. [Google Scholar] [CrossRef] [Scilit]
  19. Gao, Z.; Shi, X.; Wang, H.; Zhu, Y.; Wang, Y.B.; Li, M.; Yeung, D.Y. Earthformer: Exploring Space-Time Transformers for Earth System Forecasting; ACM: New York, NY, USA, 2022; Volume 35, pp. 25390–25403. [Google Scholar]
  20. Mathieu, M.; Couprie, C.; LeCun, Y. Deep multi-scale video prediction beyond mean square error. In Proceedings of the 4th International Conference on Learning Representations (ICLR 2016), San Juan, Puerto Rico, 2–4 May 2016. [Google Scholar]
  21. Trebing, K.; Staǹczyk, T.; Mehrkanoon, S. SmaAt-UNet: Precipitation nowcasting using a small attention-UNet architecture. Pattern Recognit. Lett. 2021, 145, 178–186. [Google Scholar] [CrossRef] [Scilit]
  22. Ravuri, S.; Lenc, K.; Willson, M.; Kangin, D.; Lam, R.; Mirowski, P.; Fitzsimons, M.; Athanassiadou, M.; Kashem, S.; Madge, S.; et al. Skilful precipitation nowcasting using deep generative models of radar. Nature 2021, 597, 672–677. [Google Scholar] [CrossRef] [Scilit] [PubMed]
  23. Ho, J.; Jain, A.; Abbeel, P. Denoising diffusion probabilistic models. Adv. Neural Inf. Process. Syst. 2020, 33, 6840–6851. [Google Scholar]
  24. Song, Y.; Sohl-Dickstein, J.; Kingma, D.P.; Kumar, A.; Ermon, S.; Poole, B. Score-Based Generative Modeling through Stochastic Differential Equations. In Proceedings of the 9th International Conference on Learning Representations (ICLR 2021), Virtual Event, 3–7 May 2021. [Google Scholar]
  25. Mardani, M.; Brenowitz, N.; Cohen, Y.; Pathak, J.; Chen, C.Y.; Liu, C.C.; Vahdat, A.; Nabian, M.A.; Ge, T.; Subramaniam, A.; et al. Residual corrective diffusion modeling for km-scale atmospheric downscaling. Commun. Earth Environ. 2025, 6, 124. [Google Scholar] [CrossRef] [Scilit]
  26. Price, I.; Sanchez-Gonzalez, A.; Alet, F.; Andersson, T.R.; El-Kadi, A.; Masters, D.; Ewalds, T.; Stott, J.; Mohamed, S.; Battaglia, P.; et al. GenCast: Diffusion-based ensemble forecasting for medium-range weather. In Proceedings of the 105th Annual AMS Meeting 2025, New Orleans, LA, USA, 12–16 January 2025; Volume 105, p. 449275. [Google Scholar]
  27. Yu, D.; Li, X.; Ye, Y.; Zhang, B.; Luo, C.; Dai, K.; Wang, R.; Chen, X. DiffCast: A Unified Framework via Residual Diffusion for Precipitation Nowcasting. In Proceedings of the 2024 IEEE/CVF Conference on Computer Vision and Pattern Recognition (CVPR), Seattle, WA, USA, 17–21 June 2024; pp. 27758–27767. [Google Scholar] [CrossRef] [Scilit]
  28. Gao, Z.; Shi, X.; Han, B.; Wang, H.; Jin, X.; Maddix, D.C.; Zhu, Y.; Li, M.; Wang, B. PreDiff: Precipitation Nowcasting with Latent Diffusion Models. In Proceedings of the Thirty-Seventh Conference on Neural Information Processing Systems, New Orleans, LA, USA, 10–16 December 2023. [Google Scholar]
  29. Leinonen, J.; Hamann, U.; Nerini, D.; Germann, U.; Franch, G. Latent diffusion models for generative precipitation nowcasting with accurate uncertainty quantification. arXiv 2023, arXiv:2304.12891. [Google Scholar]
  30. Gultepe, I.; Rabin, R.; Ware, R.; Pavolonis, M. Chapter Three—Light Snow Precipitation and Effects on Weather and Climate. In Advances in Geophysics; Elsevier: Amsterdam, The Netherlands, 2016; Volume 57, pp. 147–210. [Google Scholar] [CrossRef] [Scilit]
  31. Yan, W.; Hafner, D.; James, S.; Abbeel, P. Temporally Consistent Transformers for Video Generation. In Proceedings of the International Conference on Machine Learning, Baltimore, MD, USA, 17–23 July 2022. [Google Scholar]
  32. Wu, C.; Liang, J.; Ji, L.; Yang, F.; Fang, Y.; Jiang, D.; Duan, N. Nüwa: Visual Synthesis Pre-training for Neural Visual World Creation. In Proceedings of the European Conference on Computer Vision; Springer: New York, NY, USA, 2022; pp. 720–736. [Google Scholar]
  33. Meo, C.; Roy, A.; Lica, M.; Yin, J.; Bou Che, Z.; Wang, Y.; Imhoff, R.; Uijlenhoet, R.; Dauwels, J. Extreme Precipitation Nowcasting using Transformer-based Generative Models. In Proceedings of the ICLR 2024 Workshop on Tackling Climate Change with Machine Learning, Vienna, Austria, 7–11 May 2024. [Google Scholar]
Figure 1. Study area and KNMI radar network over The Netherlands, with an inset map showing its geographical location within Europe. The Den Helder, former De Bilt, and Herwijnen radar sites are marked, and the red dashed rectangle indicates the selected region of interest used for model training and evaluation.
Remotesensing 18 02771 g001
Figure 2. Distribution of non-zero rainfall intensity pixels (mm/h) in the dataset. The y-axis is on a logarithmic scale. The plot reveals a significant long-tail distribution, where extreme precipitation events are rare but critical. To accommodate this long-tailed distribution, a dataset-specific linear scaling strategy with R max = 40 mm / h is applied during preprocessing.
Remotesensing 18 02771 g002
Figure 3. Overview of the proposed EGN-Nowcast framework. The first-stage Event-Guided Spatiotemporal Transformer (left) predicts coarse precipitation structures, and the second-stage Conditional Diffusion Refiner (right) performs fine-scale refinement. The colors distinguish different functional modules, and the arrows indicate the direction of data flow.
Remotesensing 18 02771 g003
Figure 4. Structure of the Event-Guided Spatiotemporal Transformer with auxiliary supervision for high-intensity precipitation regions. The colors distinguish different functional modules, and the arrows indicate the direction of data flow.
Remotesensing 18 02771 g004
Figure 5. Structure of the Conditional Diffusion Refiner for precipitation texture refinement. The coarse prediction is used as the structural condition during iterative denoising. The arrows indicate the direction of data flow and the iterative denoising process.
Remotesensing 18 02771 g005
Figure 6. Performance evolution of CSI and FAR over 180 min across three precipitation thresholds. Panels (a,c,e) show CSI at 1 mm/h, 2 mm/h, and 8 mm/h, respectively, while panels (b,d,f) show the corresponding FAR at the same thresholds.
Remotesensing 18 02771 g006aRemotesensing 18 02771 g006b
Figure 7. Visual comparison of precipitation nowcasting for a representative case from the independent 2025 KNMI test set at T + 30 , T + 90 , and T + 120 min. Columns show Ground Truth, EGN-Nowcast, PySTEPS, and NowcastingGPT; dashed ellipses and arrows indicate high-intensity precipitation regions and storm propagation.
Remotesensing 18 02771 g007
Figure 8. Reliability diagram for the precipitation ≥ 8 mm/h event on the 2025 test set. The lower panel shows forecast-probability bin counts on a logarithmic scale.
Remotesensing 18 02771 g008
Table 1. Architecture and training configuration of EGN-Nowcast.
ComponentParameterValue
TransformerLayers12
Attention heads8
Embedding dimension256
Patch size1 × 16 × 16
MLP hidden dimension1024
Dropout rate0.1
Input frames3
output frames6
Image resolution128 × 128
Temporal sampling interval30 min
Diffusion U-NetBase channels64
Prediction modeJoint six-frame generation
Channel multipliers[1, 2, 4, 8]
Diffusion steps (training)1000
β scheduleLinear, β 1 = 1 × 10 4 , β T = 0.02
TrainingOptimizerAdamW ( β 1 = 0.9 , β 2 = 0.999 )
Learning rate 1 × 10 4
Weight decay0.01
Batch size64
Epochs100
Precision16-bit mixed
Hardware2 × NVIDIA RTX 4090 (24 GB)
Training duration∼36 h
Table 2. Performance comparison with baseline and representative SOTA models on the KNMI dataset under the unified KNMI test protocol. For stochastic generative models, values are reported as mean ± standard deviation across ensemble members generated from different stochastic diffusion samples under the same trained model. The reported standard deviations characterize variability introduced by stochastic sampling during inference and do not quantify uncertainty associated with model retraining under different initialization seeds. The number of repeated stochastic ensemble generations was set to N = 10 . Deterministic baselines without stochastic sampling are reported as single values. Continuous error metrics are reported in the physical rainfall-intensity domain. The bold formatting in the last column indicates the results of the proposed EGN-Nowcast model. Upward arrows indicate that higher values are better, whereas downward arrows indicate that lower values are better.
MetricPySTEPSConvLSTMTECONuwä-EVLNowcastingGPTNGEEGN-Nowcast
PCC ↑0.150.170.190.200.21 ± 0.0020.22 ± 0.0020.21 ± 0.002
MSE ( ( mm / h ) 2 ) ↓6.223.983.653.523.50 ± 0.023.45 ± 0.023.22 ± 0.008
MAE (mm/h) ↓0.930.850.681.000.72 ± 0.0050.69 ± 0.0050.58 ± 0.003
CSI (1 mm/h) ↑0.1850.1910.2050.2120.215 ± 0.0020.22 ± 0.0020.272 ± 0.001
CSI (2 mm/h) ↑0.0920.0940.1050.1120.115 ± 0.0010.12 ± 0.0010.158 ± 0.001
CSI (8 mm/h) ↑0.0100.0050.0070.0080.007 ± 0.00050.009 ± 0.00040.011 ± 0.0004
FAR (1 mm/h) ↓0.550.620.690.610.59 ± 0.0010.59 ± 0.0010.48 ± 0.002
FAR (2 mm/h) ↓0.700.750.780.760.71 ± 0.00090.71 ± 0.00090.59 ± 0.004
FAR (8 mm/h) ↓0.890.920.490.850.59 ± 0.0030.52 ± 0.0020.42 ± 0.006
Table 3. Number of observed positive pixels at each rainfall-intensity threshold and lead time on the independent KNMI test set. Counts are accumulated over all test forecast cases and computed from de-normalized ground-truth rainfall-intensity fields.
ThresholdT + 30T + 60T + 90T + 120T + 150T + 180
1 mm/h168,423171,054169,381170,892167,915169,540
2 mm/h67,26168,91466,84268,12567,08866,432
8 mm/h416542814194411842454153
Table 4. Bootstrap uncertainty estimates for EGN-Nowcast and the strongest baseline on the independent KNMI test set. Values are reported as point estimate ± half-width of the 95% confidence interval estimated using forecast-case-level bootstrap resampling. The bold formatting in the last column indicates the results of the proposed EGN-Nowcast model. Upward arrows indicate that higher values are better, whereas downward arrows indicate that lower values are better.
MetricNGEEGN-Nowcast (Ours)
MSE ( ( mm / h ) 2 ) ↓ 3.45 ± 0.05 3.22 ± 0.06
POD (2 mm/h) ↑ 0.231 ± 0.009 0.278 ± 0.010
FAR (2 mm/h) ↓ 0.710 ± 0.012 0.590 ± 0.014
CSI (2 mm/h) ↑ 0.120 ± 0.006 0.158 ± 0.007
POD (8 mm/h) ↑ 0.025 ± 0.006 0.032 ± 0.007
FAR (8 mm/h) ↓ 0.520 ± 0.029 0.420 ± 0.032
CSI (8 mm/h) ↑ 0.009 ± 0.0014 0.011 ± 0.0017
Table 5. Seasonal robustness analysis. Winter 8 mm/h events are too sparse for meaningful statistics; winter metrics are therefore reported at 2 mm/h.
Regime (Threshold)NGEEGN-Nowcast (Ours)
Summer CSI (8 mm/h)0.0080.010
Summer FAR (8 mm/h)0.540.44
Winter CSI (2 mm/h)0.1320.169
Winter FAR (2 mm/h)0.670.55
Table 6. The experiments evaluate the effects of event-guided auxiliary supervision and conditional diffusion refinement. The bold formatting in the last column indicates the EGN-Nowcast model. Upward arrows indicate that higher values are better, whereas downward arrows indicate that lower values are better.
MetricBaselineR1R2w/o AuxEGN-Nowcast
PCC ↑0.1650.180.200.190.21 ± 0.002
MSE ( ( mm / h ) 2 ) ↓3.963.853.423.383.22 ± 0.008
MAE (mm/h) ↓0.740.650.610.600.58 ± 0.003
CSI (1 mm/h) ↑0.210.2250.2450.250.272 ± 0.001
CSI (2 mm/h) ↑0.1720.1280.1420.1450.158 ± 0.001
CSI (8 mm/h) ↑0.0100.0100.0060.0090.011 ± 0.0004
FAR (1 mm/h) ↓0.580.580.500.520.48 ± 0.002
FAR (2 mm/h) ↓0.700.690.600.630.59 ± 0.004
FAR (8 mm/h) ↓0.560.480.550.520.42 ± 0.006
Table 7. Object-based verification of high-intensity precipitation objects at the 8 mm/h threshold. Values are reported as point estimates on the independent 2025 KNMI test set.
ModelODRMADEArea Bias
NGE0.311.470.74
EGN-Nowcast (Ours)0.380.830.86
Disclaimer/Publisher’s Note: The statements, opinions and data contained in all publications are solely those of the individual author(s) and contributor(s) and not of MDPI and/or the editor(s). MDPI and/or the editor(s) disclaim responsibility for any injury to people or property resulting from any ideas, methods, instructions or products referred to in the content.