Article

Topographic Modulation of Extreme Precipitation-Driven Rainfall Erosivity in the Hengduan Mountains


1
Faculty of Land Resource Engineering, Kunming University of Science and Technology, Kunming 650093, China
2
Yunnan Key Laboratory of Quantitative Remote Sensing, Kunming 650093, China
3
Yunnan International Joint Laboratory for Integrated Sky-Ground Intelligent Monitoring of Mountain Hazards, Kunming 650093, China
4
Institute of International Rivers and Eco-Security, Yunnan University, Kunming 650500, China
5
Yunnan Key Laboratory of Soil Erosion Prevention and Green Development, Yunnan University, Kunming 650500, China
6
Faculty of Geographical Science, Beijing Normal University, Beijing 100875, China
*
Author to whom correspondence should be addressed.
Remote Sens. 2026, 18(16), 2772; https://doi.org/10.3390/rs18162772
Submission received: 17 June 2026 / Revised: 10 August 2026 / Accepted: 14 August 2026 / Published: 16 August 2026

Highlights

What are the main findings?
  • CHM_PRE best captured precipitation extremes in the Hengduan Mountains.
  • R95p and R99p contributed disproportionately to rainfall erosivity.
  • Rainfall erosivity hotspots clustered in elevated and steep terrain along the southeastern and southern mountain margins.
What are the implications of the main findings?
  • Medium-to-high relief mountains are priority areas for erosion-risk management.

Abstract

Extreme precipitation can disproportionately enhance rainfall erosivity in complex mountainous terrain, yet its spatial amplification and topographic differentiation remain poorly understood. Focusing on the Hengduan Mountains, this study evaluated three precipitation products (ChinaMet, CHM_PRE, and IMERG) against station observations and assessed their ability to capture precipitation extremes. Using the best-performing product, rainfall erosivity associated with total (PRCPTOT), heavy (R95p), and extreme (R99p) precipitation was estimated for 2005–2024, and its spatial patterns, amplification effects, topographic differentiation, and hotspots were analyzed. CHM_PRE showed the best overall performance, with a correlation coefficient (CC) of 0.83 and a Kling–Gupta efficiency (KGE) of 0.74, together with the highest probability of detection (POD = 0.95), accuracy (ACC = 0.83), and critical success index (CSI = 0.78) for extreme precipitation. Precipitation and the corresponding rainfall erosivity exhibited a pronounced southeast-to-northwest decreasing gradient. Although R95p and R99p accounted for only 9.61% and 2.43% of total precipitation, they contributed 14.84% and 4.33% of total rainfall erosivity, yielding erosivity amplification factors (AFs) of 1.52 and 1.73, respectively. This indicates a disproportionate contribution of precipitation extremes to rainfall erosivity, with stronger amplification under R99p. Rainfall erosivity also exhibited pronounced topographic differentiation, and high-level hotspots were consistently concentrated along the southeastern and southern margins. Extreme hotspots under PRCPTOT and R95p occurred at mean elevations of 2735.19–2791.92 m and mean slopes of 14.79–15.09°, whereas R99p intense hotspots occurred at a mean elevation of 2374.15 m and a mean slope of 12.28°. Strongly undulating mid-high mountains were the dominant geomorphic units within PRCPTOT and R95p extreme hotspots, while moderately and strongly undulating mid-high mountains dominated R99p intense hotspots. Moreover, hotspots became increasingly localized as precipitation extremity increased. These findings highlight the disproportionate erosive significance and spatial selectivity of precipitation extremes and provide a basis for identifying priority areas for soil and water conservation and rainfall-related hazard management in the Hengduan Mountains under climate change.

1. Introduction

Global warming is profoundly altering terrestrial water cycles and driving significant changes in the intensity, frequency, duration, and seasonal distribution of extreme precipitation events [1,2,3]. Existing studies indicate that as the atmosphere’s water-holding capacity increases, extreme precipitation is intensifying across many global regions, and the probability of record-breaking precipitation events is likely to rise further in the future [4,5]. Unlike the gradual changes observed in long-term average precipitation, short-duration, high-intensity, and highly concentrated extreme precipitation events can release immense hydrodynamic energy over a brief period, thereby triggering a cascade of hydro-geomorphic hazards [6,7,8]. In alpine and cold regions, climate warming can intensify erosion and sediment transport by accelerating glacier retreat and permafrost degradation, enhancing meltwater runoff, and increasing the intensity of heavy precipitation [9,10], with cascading risks to river systems, infrastructure, and downstream ecosystems [2,11,12,13].
To date, considerable progress has been made in characterizing extreme precipitation in terms of its amount, frequency, intensity, duration, and return levels [5,14,15,16]. However, precipitation statistics alone are insufficient to fully capture the geomorphic and erosional consequences of extreme rainfall in mountainous environments. The hazardous effects of extreme precipitation depend not only on rainfall amount and occurrence frequency, but also on its capacity to generate high raindrop kinetic energy, rapid hillslope runoff, and strong erosive forces over short periods, thereby promoting soil erosion [17,18], sediment transport [11], landslides [13], debris flows [7], and floods [8]. Rainfall erosivity provides a physically meaningful measure of this erosive potential by integrating key rainfall characteristics, including precipitation amount, intensity, and kinetic energy. As a major climatic factor in soil erosion models such as the USLE, RUSLE, and CSLE [19,20,21], it also provides an important link between changes in extreme precipitation and rainfall-driven erosion processes [22]. Rainfall erosivity is commonly quantified using rainfall kinetic energy together with the maximum 30 min rainfall intensity [23,24], thereby representing the potential capacity of rainfall to induce sheet and rill erosion on hillslopes [20,25]. In recent years, substantial advances have been made in the mapping, historical reconstruction, and future projection of rainfall erosivity at global and regional scales. Global datasets such as GloRESatE have provided an important basis for large-scale erosion-risk assessment [25,26,27], while regional studies across Europe [28], South America [29], South Asia [30], and Central Asia [31] have further demonstrated the strong sensitivity of rainfall erosivity to climate variability and change.
Rainfall erosivity responds strongly and nonlinearly to precipitation intensity, such that increases in extreme rainfall can generate disproportionately larger increases in erosivity [32]. Importantly, extreme precipitation events are not necessarily synonymous with extreme erosivity events, because erosivity is jointly influenced by peak rainfall intensity, event duration, intra-event structure, and seasonality [33]. Consequently, a relatively small number of extreme rainfall events can account for a disproportionately large share of total rainfall erosivity and soil loss [22,32,34]. A notable example is the 7·20 rainstorm in Henan, China, which produced the highest rainfall erosivity event recorded in the country up to 2022, illustrating the exceptional erosive potential of individual extreme storms [33]. Moreover, the most erosive events do not necessarily occur in regions with the highest long-term mean precipitation, but can emerge from the interaction of specific weather systems, short-duration high-intensity rainfall, and local topographic conditions [33]. Similar asymmetry has been reported in southern China, where a small number of high-intensity rainfall events contribute a disproportionately large fraction of total erosivity [35]. Hillslope experiments further suggest threshold-like responses of soil erosion to extreme rainfall, with a substantial proportion of soil loss occurring once critical rainfall conditions are exceeded [34,36]. Together, these findings suggest that the erosive effects of extreme precipitation cannot be described by a simple linear relationship with rainfall amount; instead, they may exhibit disproportionate or nonlinear amplification as rainfall intensity increases.
Despite substantial progress in characterizing the spatial patterns, long-term variability, and future changes in rainfall erosivity across global [37,38,39], intercontinental [19,40], and national [41] scales [10,42,43], important knowledge gaps remain in complex mountainous regions [44]. First, most studies focus primarily on annual mean precipitation, average rainfall erosivity, or mean erosion risk driven by total precipitation, while paying insufficient attention to the erosivity contributions and amplification effects associated with extreme precipitation events of varying intensities, such as R95p and R99p [22,45,46]. Second, complex topography strongly redistributes precipitation through processes such as orographic lifting, valley channeling, and localized convection [47,48,49], yet how these terrain effects shape the spatial variability and concentration of rainfall erosivity associated with extreme precipitation remains poorly understood. Third, reliable estimation of extreme rainfall erosivity depends critically on the ability of precipitation datasets to capture heavy and extreme rainfall. Satellite-based, reanalysis, and merged precipitation products can exhibit substantial uncertainties [50,51,52,53], especially under rugged terrain and sparse gauge coverage [54,55,56], and these uncertainties may become increasingly important toward the upper tail of the precipitation distribution. Addressing these gaps therefore requires both a careful evaluation of precipitation products and a quantitative assessment of how precipitation extremity and topographic heterogeneity jointly shape rainfall erosivity in complex mountainous terrain.
Mountainous Southwest China is particularly susceptible to rainfall-driven erosion and related geomorphic hazards under ongoing climate change. Previous studies have documented pronounced spatial and seasonal variability in rainfall erosivity across the Southwest Karst region [43], the middle reaches of the Yellow River basin [57], and the Tibetan Plateau [27], highlighting strong terrain-climate interactions. Located on the southeastern margin of the Tibetan Plateau, the Hengduan Mountains are characterized by extreme topographic relief, deeply incised valleys, and steep environmental gradients [58]. Their precipitation regime is jointly influenced by the South Asian and East Asian monsoons, the westerlies, and plateau-related thermal forcing, while orographic lifting, valley-mountain circulation, and moisture transport further enhance spatial heterogeneity in precipitation and extreme rainfall [59,60,61]. Recent studies indicate increasing intensity and frequency of extreme precipitation in parts of the region, with associated increases in flood, landslide, debris-flow, and soil-erosion hazards [62,63,64]. Topographic factors such as elevation, slope, and relief have also been shown to modulate precipitation and hydro-geomorphic responses [65]. However, previous studies have largely examined precipitation variability, rainfall erosivity, or geomorphic hazards separately. How extreme precipitation of different intensities disproportionately contributes to rainfall erosivity, how this erosivity is spatially concentrated into hotspots, and how complex topography structures these patterns remain insufficiently quantified in the Hengduan Mountains.
To address these gaps, this study develops an integrated framework for assessing extreme precipitation-driven rainfall erosivity in the Hengduan Mountains. Three precipitation products, ChinaMet, CHM_PRE, and IMERG, are first evaluated against ground-based observations to assess their performance in representing precipitation and precipitation extremes, while the relative deviation in rainfall erosivity (RD) is used to quantify uncertainty propagated from precipitation inputs to erosivity estimates. Based on the best-performing product, the ETCCDIs PRCPTOT, R95p, and R99p are used to characterize precipitation at different intensity levels and to quantify their relative contributions to rainfall erosivity and associated amplification effects. Elevation, slope, and mountain type are further incorporated to examine the topographic differentiation and spatial concentration of rainfall erosivity hotspots. Accordingly, this study addresses three questions: (1) how reliably multi-source precipitation products can characterize extreme precipitation and the associated rainfall erosivity in complex mountainous terrain; (2) whether heavy and extreme precipitation contribute disproportionately to rainfall erosivity; and (3) how topographic heterogeneity structures the spatial distribution and concentration of rainfall erosivity hotspots. By linking precipitation extremes, erosivity amplification, and terrain-associated spatial heterogeneity, this study provides a process-oriented basis for identifying erosion-prone areas and supporting soil and water conservation and rainfall-related hazard management in complex mountain regions under climate change.

2. Materials and Methods

2.1. Study Area

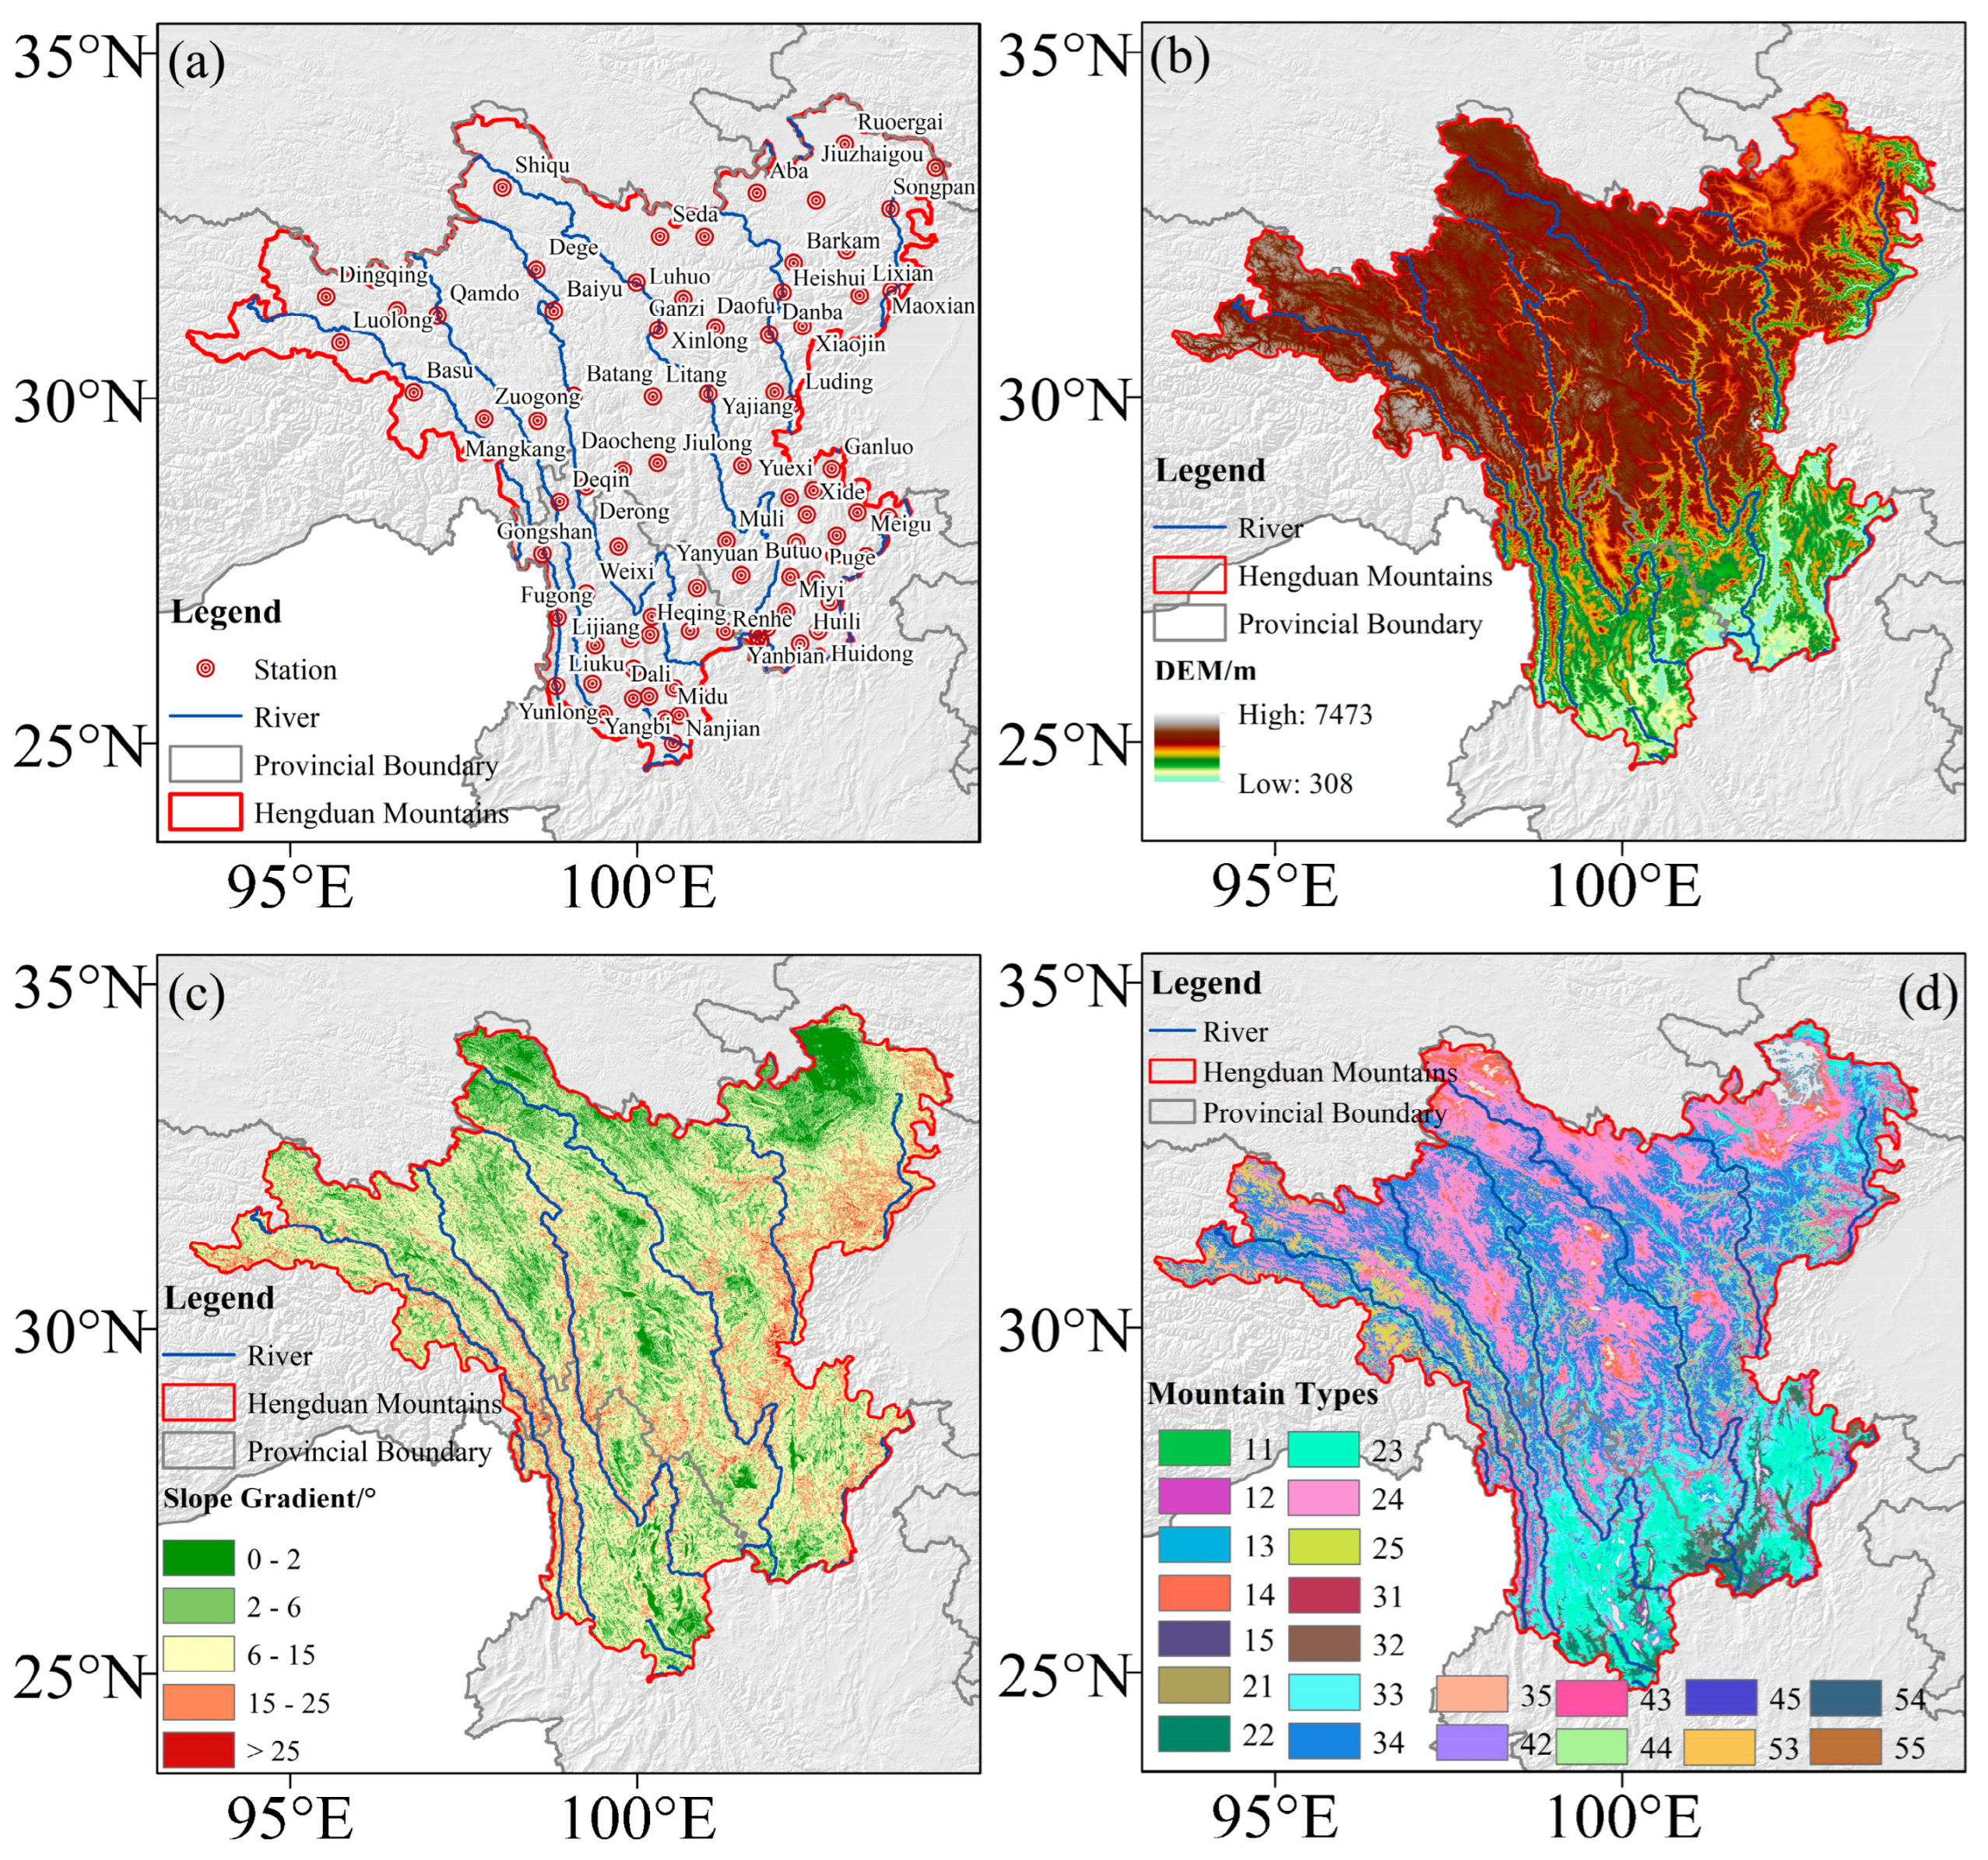
The Hengduan Mountains region (HMR) is located on the southeastern margin of the Qinghai–Tibet Plateau in southwestern China (24°48′–33°39′N, 96°20′–104°04′E), covering approximately 6.0 × 10⁵ km2 across western Sichuan, northwestern Yunnan, and southeastern Xizang (Figure 1). As a transitional zone connecting the Qinghai–Tibet Plateau, the Yunnan–Guizhou Plateau, and the Sichuan Basin, the HMR is characterized by a topographic framework of seven mountain ranges and six major rivers. North–south oriented mountain ranges are deeply dissected by the Nujiang (Salween), Lancang (Mekong), Jinsha (upper Yangtze), Yalong, Dadu, and Min rivers, forming a pronounced mountain–valley landscape. The region exhibits some of the most rugged terrain in the world, with elevations ranging from 308 to 7473 m, with local relief reaching 2500–3500 m over horizontal distances of less than 30 km [66,67]. This extreme topographic relief, together with deeply incised valleys and diverse geomorphic environments, produces strong elevational gradients and pronounced vertical climatic zonation.
The HMR is jointly influenced by the South Asian and East Asian monsoons, the westerlies, and plateau thermal forcing, resulting in substantial spatial heterogeneity in precipitation. The north–south oriented mountain–valley system acts both as a barrier to atmospheric flow and corridor for inland moisture transport, thereby enhancing orographic precipitation and modulating the spatial distribution of extreme rainfall [58]. Precipitation is highly seasonal, with more than 85% of the annual total occurring during the wet season from May to October, peaking between June and August. Mean annual precipitation ranges from approximately 400–600 mm in the inner-plateau valleys (e.g., parts of the upper Jinsha/Nujiang reaches) to more than 2000–2500 mm on the windward flanks of the Gaoligong and peripheral ranges. Extreme precipitation events occur frequently and constitute important triggers of floods, landslides, debris flows, and severe soil erosion [59,68,69]. Together with steep slopes, shallow soils, and active neotectonic processes, this concentrated and spatially heterogeneous precipitation regime makes the HMR highly susceptible to rainfall-induced erosion and associated geomorphic hazards.
Figure 1. Overview of HMR: (a) locations of meteorological stations; (b) elevation; (c) slope; and (d) mountain types. Definitions of the mountain types are provided in Table 1.
Remotesensing 18 02772 g001
Table 1. Classification and codes of mountain types used in this study.
CodeMountain TypeCodeMountain Type
11Slightly Undulating Low Mountain12Slightly Undulating Middle Mountain
13Slightly Undulating Mid-high Mountain14Slightly Undulating High Mountain
15Slightly Undulating Extremely High Mountain21Gently Undulating Low Mountain
22Gently Undulating Middle Mountain23Gently Undulating Mid-high Mountain
24Gently Undulating High Mountain25Gently Undulating Extremely High Mountain
31Moderately Undulating Low Mountain32Moderately Undulating Middle Mountain
33Moderately Undulating Mid-high Mountain34Moderately Undulating High Mountain
35Moderately Undulating Extremely High Mountain42Strongly Undulating Middle Mountain
43Strongly Undulating Mid-high Mountain44Strongly Undulating High Mountain
45Strongly Undulating Extremely High Mountain53Very Strongly Undulating Mid-high Mountain
54Very Strongly Undulating High Mountain55Very Strongly Undulating Extremely High Mountain

2.2. Research Data

2.2.1. Meteorological Station Data

Daily precipitation observations were obtained from the China Surface Meteorological Observation Data (V3.0), provided by the National Meteorological Information Center (http://data.cma.cn) of the China Meteorological Administration. The dataset contains long-term daily meteorological records from 699 stations across China beginning in 1951. For this study, daily precipitation records from 82 stations within and surrounding the Hengduan Mountains region were selected for the period 2005–2024 (Figure 1a). These station observations were used as the reference for evaluating the performance of the gridded precipitation products.

2.2.2. Data on Mountain Types in China

Mountain-type information was obtained from the National Mountain Types Dataset of China (2021), which was derived from a 30 m Digital Surface Model (DSM). The dataset provides a nationwide classification of mountain types based on terrain characteristics and includes both a mountain intensity index and a mountain-type classification. Mountain areas are identified by index values ≥ 46, with different index values corresponding to specific mountain types. The mountain-type classes used in this study are listed in Table 1.

2.2.3. Precipitation Products

Three gridded precipitation products were evaluated in this study: the multisource integrated high-resolution meteorological dataset for China (ChinaMet) [70] (https://www.ncdc.ac.cn/portal/metadata/21691d03-bef2-4800-924e-5614e7268b87, accessed on 15 January 2026), the China Daily Gridded Precipitation Dataset V2 (CHM_PRE V2) [54] (https://doi.org/10.5281/zenodo.15735374, accessed on 15 January 2026), and the GPM IMERG Version 07 Daily Product (IMERG) [71] (https://disc.gsfc.nasa.gov/, accessed on 15 January 2026) (Table 2). The daily precipitation observations from meteorological stations were first subjected to quality control, including checks for missing values, abnormal values, and temporal consistency. After quality screening, no missing measurements were identified during the study period (2005–2024). Therefore, all available station records were retained to evaluate the consistency of different precipitation products with ground observations. It should be noted that CHM_PRE V2 was developed using gauge observations from the national meteorological network; therefore, the station-based assessment in this study represents a consistency evaluation rather than a fully independent validation of the CHM_PRE V2 generation process. Given the strong topographic control and spatial heterogeneity of precipitation in the Hengduan Mountains, the performance of gridded precipitation products may vary substantially with elevation, terrain-induced rainfall variability, and remote-sensing retrieval limitations [72,73]. Therefore, the three products were evaluated against ground observations before their use in characterizing precipitation extremes and rainfall erosivity.

2.2.4. DEM Data

This study utilizes the SRTM DEM, which originated from a radar altimetry mission launched in 2000 through a collaboration between NASA, the NGA, and the space agencies of Germany and Italy. Using radar interferometry (InSAR), the mission generated a Digital Elevation Model (DEM) of the Earth’s land surface, covering approximately 80% of the landmass (ranging from 60°N to 56°S), with a spatial resolution of 90 m. Elevation and slope were derived from the DEM and subsequently resampled to ensure spatial consistency with the other datasets used in the analysis.

2.3. Methods

2.3.1. Accuracy Evaluation Metrics

The performance of the gridded precipitation products was evaluated against rain-gauge observations using six statistical metrics: correlation coefficient (CC), relative bias (BIAS), mean absolute error (MAE), root-mean-square error (RMSE), relative root-mean-square error (rRMSE), and Kling-Gupta efficiency (KGE). CC measures the strength of agreement between estimated and observed precipitation, with values closer to 1 indicating stronger positive correspondence. BIAS quantifies systematic over- or underestimation, with values closer to zero indicating lower bias, whereas MAE, RMSE, and rRMSE characterize the magnitude of estimation errors, with lower values indicating better performance. KGE provides an integrated assessment of correlation, bias, and variability, with values closer to 1 indicating better overall agreement. The metrics were calculated as follows:
C C = i = 1 n ( O i O ¯ ) ( P i P ¯ ) i = 1 n ( O i O ¯ ) 2 i = 1 n ( P i P ¯ ) 2
B I A S = i = 1 n ( P i O i ) i = 1 n O i × 100 %
M A E = 1 n i = 1 n | P i O i |
R M S E = 1 n i = 1 n ( P i O i ) 2
r R M S E = 1 n i = 1 n ( P i O i ) 2 1 n i = 1 n O i × 100 %
K G E = 1 ( C C 1 ) 2 + ( β 1 ) 2 + ( γ 1 ) 2 with   β = μ p μ o   and   γ = σ p / μ p σ o / μ o
* Note: O i and P i denote observed and estimated precipitation, respectively; O ¯ and P ¯ are the corresponding mean values; μ o and μ p represent the means of observations and estimates, respectively; σ o and σ p represent the corresponding standard deviations; n is the number of samples.
To compare the performance of various precipitation products across different precipitation thresholds, classification metrics—including the Probability of Detection (POD), False Alarm Ratio (FAR), Critical Success Index (CSI), and Accuracy (ACC)—were employed to evaluate the precipitation estimation capabilities of the products regarding three precipitation intensity indices: PRCPTOT, R95p, and R99p. The formulas for these classification metrics are as follows:
P O D = H H + M
F A R = F H + F
C S I = H H + M + F
A C C = H + C H + M + F + C
* Note: H represents the number of precipitation events accurately estimated by the precipitation product, F represents the number of incorrectly estimated events, M represents the number of missed events, and C represents the number of zero-precipitation events accurately estimated.
In addition to evaluating precipitation uncertainties using statistical metrics, the uncertainty propagated into rainfall erosivity estimation was quantified using the relative deviation (RD). Based on the half-month rainfall erosivity model, annual erosivity values were calculated from station observations and each precipitation product. RD was defined as:
R D = R p R o R o × 100 %
where Rp represents rainfall erosivity estimated from each precipitation product and Ro represents the station-based estimate. Higher RD values indicate greater uncertainty introduced by the precipitation dataset.

2.3.2. Extreme Precipitation Index

The Expert Team on Climate Change Detection and Indices (ETCCDI) developed a standardized set of indices for characterizing climate extremes. In this study, PRCPTOT, R95p, and R99p were selected to represent total, heavy, and extreme precipitation, respectively. These indices were first calculated using station observations and the three precipitation products (ChinaMet, CHM_PRE, and IMERG) to evaluate their performance across different precipitation intensities. Following the comprehensive product evaluation, CHM_PRE was selected as the optimal precipitation dataset and subsequently used to characterize the spatial patterns of PRCPTOT, R95p, and R99p and to calculate their corresponding rainfall erosivity. The definitions of the three indices are provided in Table 3.

2.3.3. Calculation of Rainfall Erosivity (R)

Rainfall erosivity was estimated using the warm- and cold-season daily precipitation-based model [23,74]. These models were established using long-term rainfall process observations from 16 meteorological stations across China and account for seasonal differences in rainfall characteristics. Compared with the conventional EI30 model, the daily precipitation-based approach provides an effective alternative for regional-scale applications where high-resolution rainfall intensity data are unavailable. Previous validations across different climatic regions, including southwestern mountainous areas, have confirmed its reliability, making it applicable for rainfall erosivity estimation in the Hengduan Mountains. The models for the cold and warm seasons are as follows:
R = k = 1 24 R ¯ k
where R ¯ k is the rainfall erosivity of the k-th half-month period, which is calculated as:
R ¯ k = 1 n j = 1 n l = 1 m α P j , k , l β
where n is the number of years of rainfall records; j denotes the year index ( j = 1 , 2 , , n ) ; k represents the 24 half-month periods in a year ( k = 1 , 2 , , 24 ) ; m is the number of erosive rainfall days (daily precipitation ≥ 12 mm [23]) in the k-th half-month of year j; l denotes the erosive rainfall day index l = 1 , 2 , , m ; and P j , k , l is the precipitation amount (mm) of the l-th erosive rainfall day in the k-th half-month of year j. α is a seasonal coefficient, with ( α = 0.3937) for the warm season (May–September) and ( α = 0.3101) for the cold season (January–April and October–December). β is an empirical parameter, generally taken as ( β = 1.7265).
The rainfall erosivity associated with extreme precipitation events was further calculated based on the erosive rainfall series. The 95th and 99th percentile precipitation thresholds were determined separately for each grid cell using daily erosive rainfall records during 2005–2024. Precipitation events exceeding the corresponding thresholds were identified as 95th and 99th percentile extreme precipitation events, respectively. The accumulated rainfall erosivity from these events was then used to derive R95p_R and R99p_R, representing the erosivity generated by extreme precipitation events at the 95th and 99th percentile levels.

2.3.4. Amplification Effect of Extreme Precipitation on Rainfall Erosivity

To quantitatively assess the varying contributions of precipitation events of different intensities to erosion processes, an analytical framework for the amplification effect of extreme precipitation erosivity (EPEA) was adopted [32]. The precipitation contribution rate (CP) and erosivity contribution rate (CR) were first calculated to represent the respective contributions of R95p and R99p events to total precipitation and total rainfall erosivity. The amplification factor (AF) was then defined as the ratio of CR to CP, indicating whether the contribution of extreme precipitation to rainfall erosivity exceeds its contribution to total precipitation:
C P i = P i P P R C P T O T × 100 %
C R i = R i R P R C P T O T × 100 %
A F = C R C P
where i represents the values of R95p and R99p. AF is used to measure the degree of amplification during the transformation of the precipitation contribution into the erosion contribution. AF > 1 indicates that the erosion contribution exceeds the precipitation contribution, signifying that this type of precipitation possesses high erosive efficiency; the higher the AF value, the more significant the precipitation event’s intensifying effect on the erosion process.

2.3.5. Statistical Analysis of Topographic Differences in Rainfall Erosivity

Differences in rainfall erosivity among elevation, slope, and mountain-type classes were assessed using the non-parametric Kruskal–Wallis test [75]. This test was selected because rainfall erosivity departed from normality and exhibited heterogeneous variability among topographic classes. Given the large number of raster pixels and potential spatial autocorrelation, an equal number of pixels was randomly sampled from each class prior to statistical testing. This procedure reduced the influence of extremely large and unequal sample sizes on statistical significance while preserving representative variability across topographic classes. The Kruskal–Wallis statistic was calculated as follows:
H = 12 n ( n + 1 ) i = 1 k R i 2 n i 3 ( n + 1 )
where H is the Kruskal–Wallis test statistic; k is the number of topographic groups; ni is the sample size of the i-th group; Ri is the sum of ranks of the i-th group; and n = i = 1 k n i is the total number of samples.
The null hypothesis assumes that all groups originate from the same population. A significance level of p < 0.05 indicates that at least one group differs significantly from the others. To further quantify the strength of the topographic effect, the effect size was estimated using epsilon-squared (ε2) [76]:
ε 2 = H k + 1 N k
where H is the Kruskal–Wallis statistic, k is the number of groups, and N is the total sample size. The ε2 value ranges from 0 to 1, with larger values indicating a stronger influence of topographic classification on rainfall erosivity.

2.3.6. Percentile-Based Identification of Rainfall Erosivity Hotspots

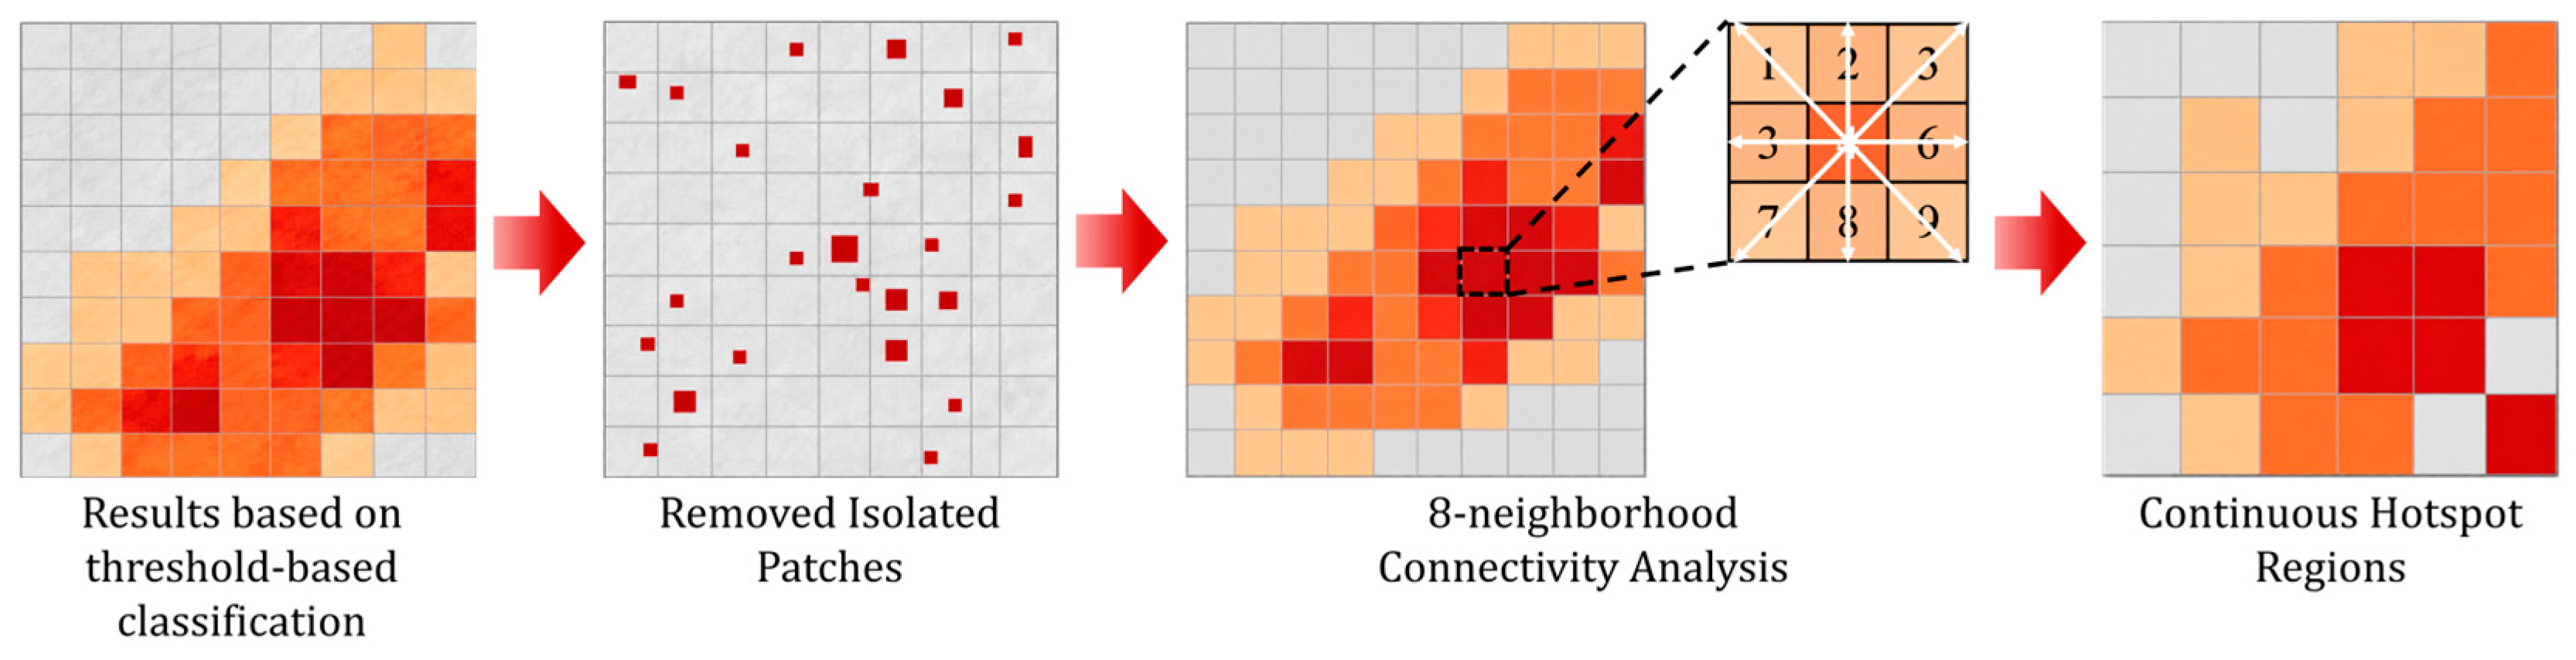
Rainfall erosivity hotspots were identified using a percentile-based classification approach (Figure 2). Pixels above the 90th percentile were defined as hotspots and classified into four levels: weak (P90–P95), medium (P95–P97), intense (P97–P99), and extreme (≥P99), with progressively darker colors representing higher hotspot levels. An 8-neighbor connected-component analysis was used to delineate spatially contiguous hotspot patches. In this analysis, the eight surrounding pixels of each target pixel were considered as its neighboring cells, as illustrated by the directional arrows in Figure 2. Isolated patches smaller than 20 pixels were removed to reduce spatial noise. The resulting hotspot maps were then overlaid with elevation, slope, and mountain-type data to characterize the topographic attributes associated with different hotspot levels.

3. Results

3.1. Analysis of Precipitation Product Applicability

3.1.1. Accuracy Assessment Based on Statistical Metrics

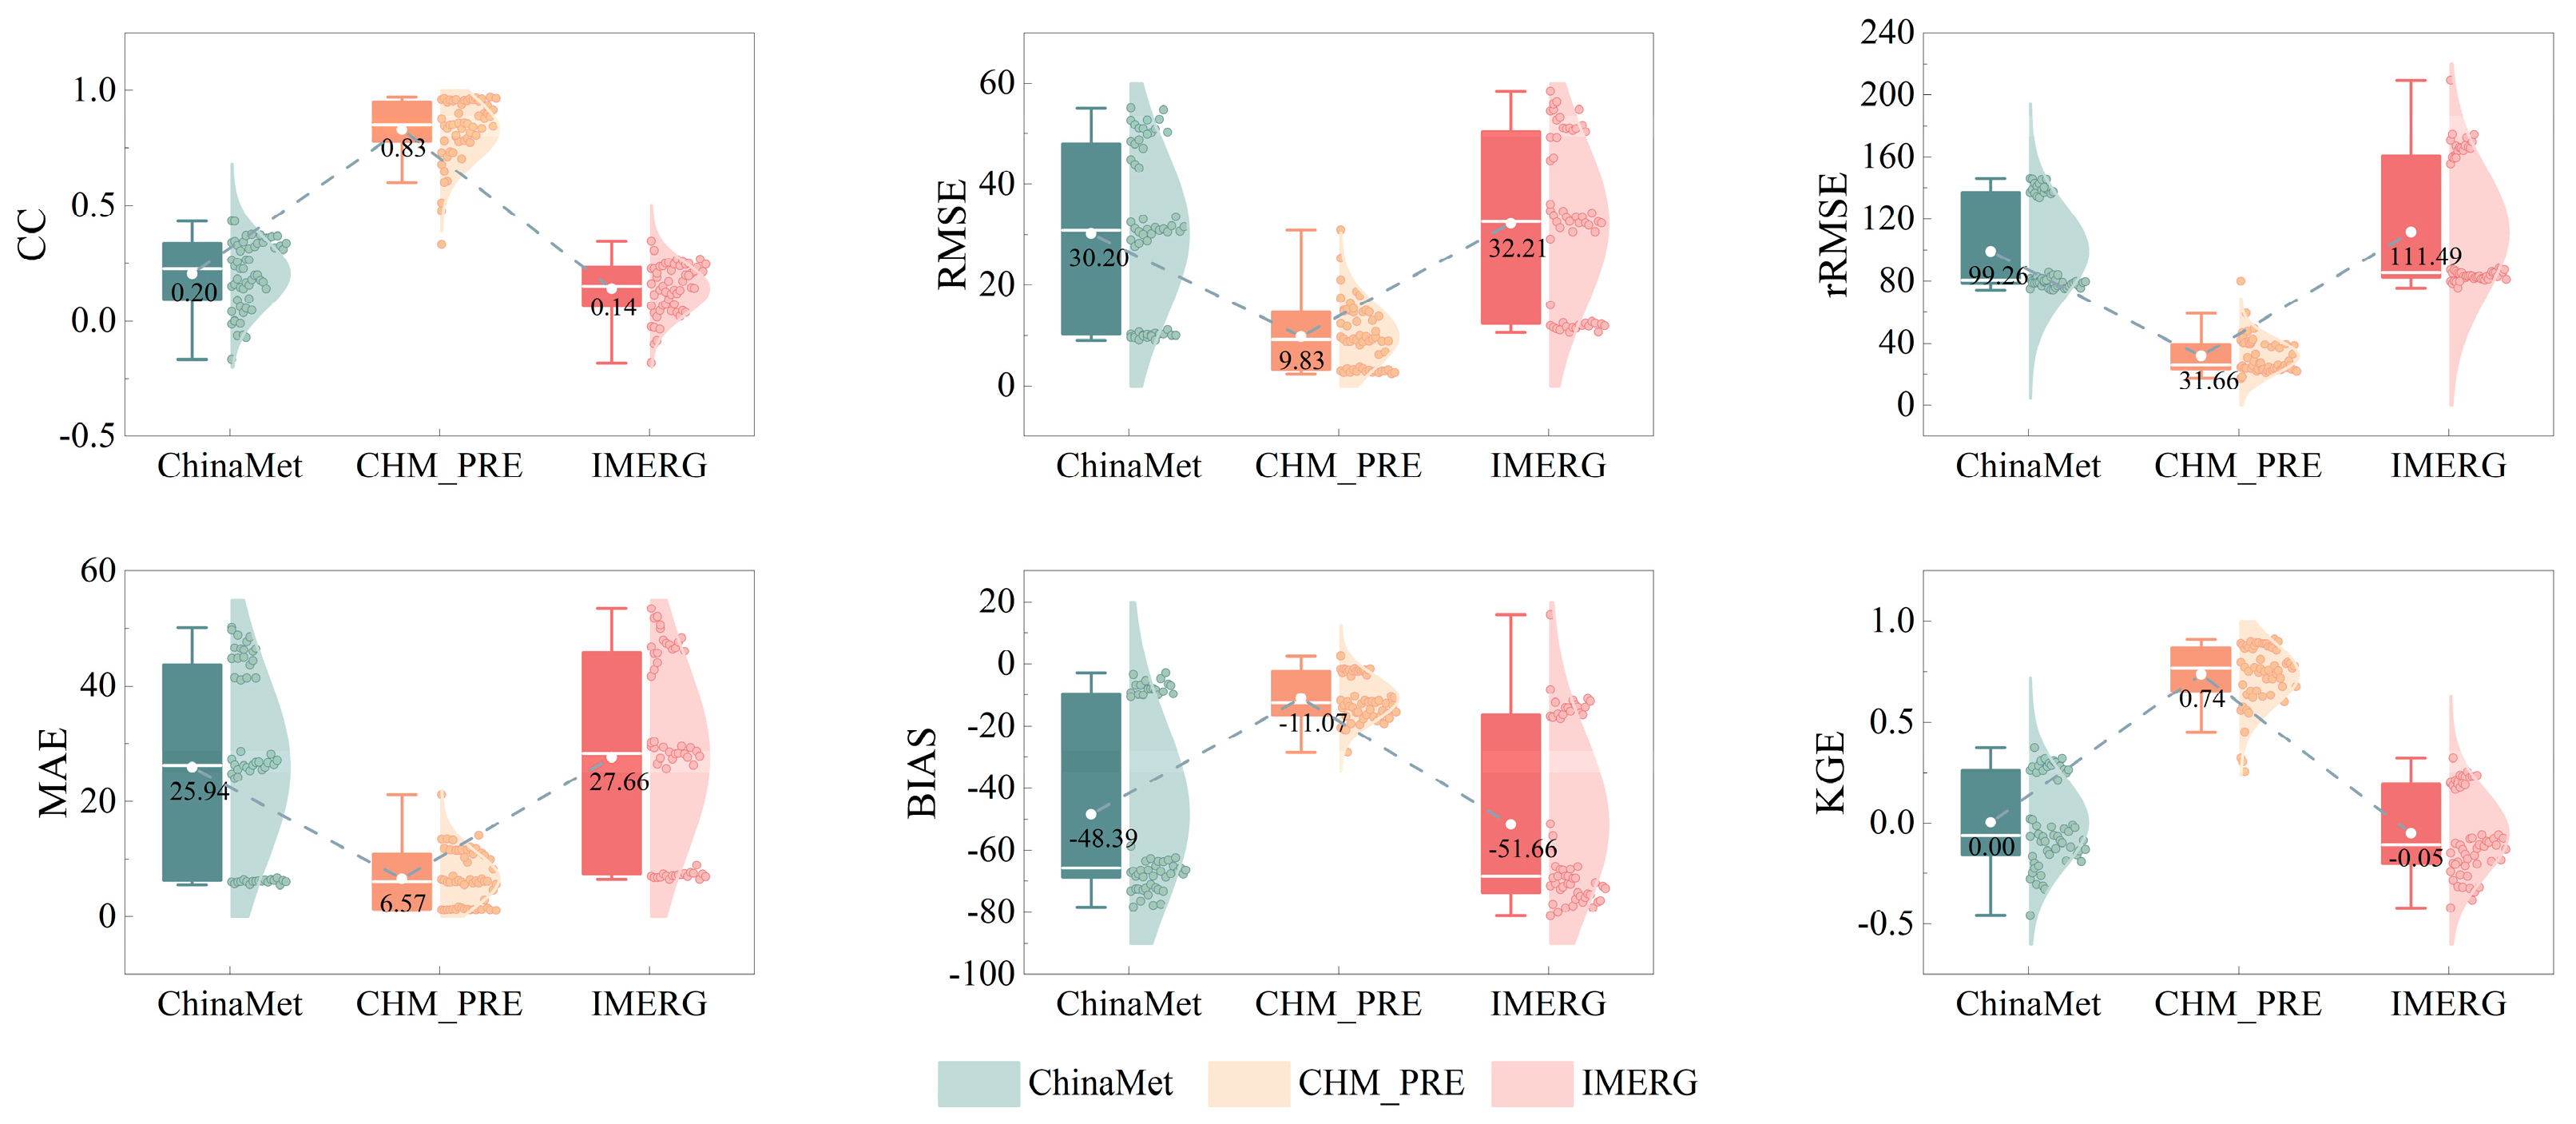
Based on observational data from 82 meteorological stations spanning 2005 to 2024, the applicability of three precipitation products, ChinaMet, CHM_PRE, and IMERG, was evaluated for the Hengduan Mountains region. Statistical results reveal marked differences in the performance of these three products within the study area (Figure 3). Overall, CHM_PRE outperformed ChinaMet and IMERG in terms of correlation, error levels, and comprehensive simulation efficiency, demonstrating superior stability and reliability.
Specifically, CHM_PRE exhibited the highest correlation (CC = 0.83) and Kling–Gupta efficiency (KGE = 0.74) relative to station observations, exceeding those of both ChinaMet and IMERG. Furthermore, all error metrics (RMSE, rRMSE, MAE) for CHM_PRE were markedly lower than those of the other two products, with error levels approximately one-third of those observed for ChinaMet and IMERG. Regarding systematic bias, all three products showed varying degrees of underestimation; however, CHM_PRE exhibited the least underestimation (BIAS = –11.07%), whereas ChinaMet and IMERG demonstrated severe systematic underestimation (BIAS < –48%) and substantially larger relative errors. In summary, CHM_PRE is the most reliable and accurate precipitation estimation product among those evaluated in this study.

3.1.2. Performance of Precipitation Products in Capturing Extreme Precipitation

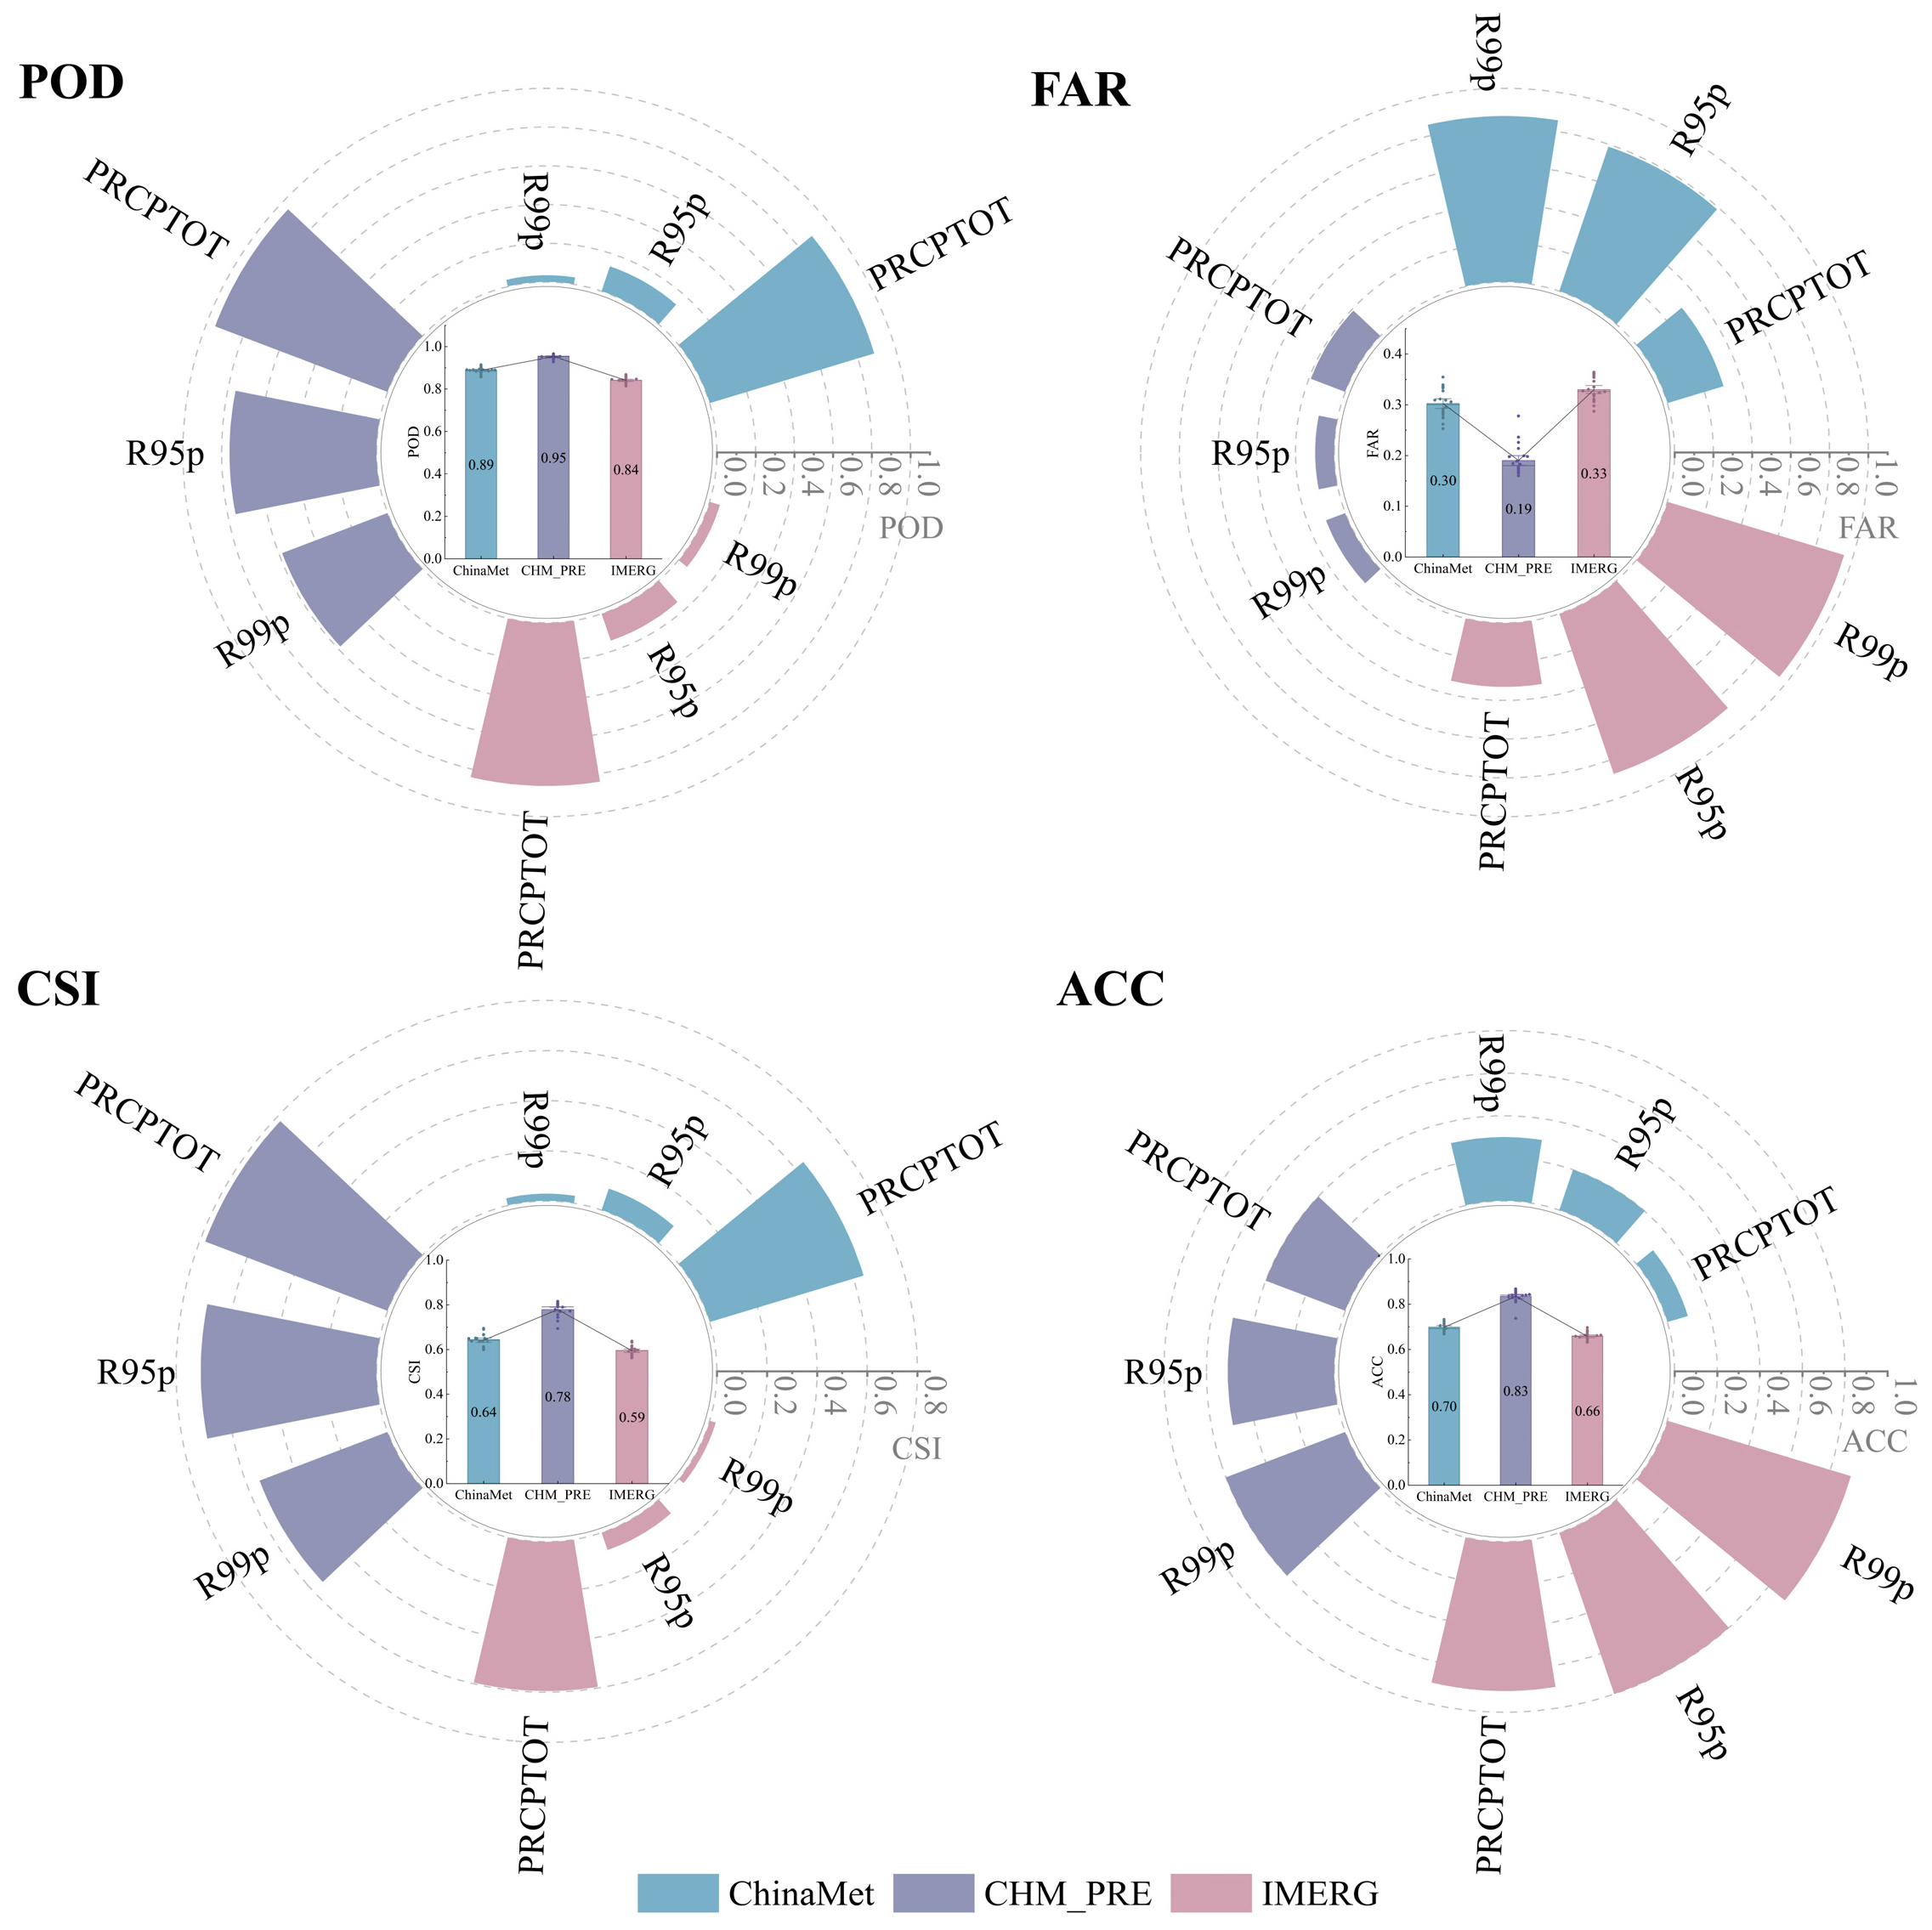
To further evaluate the ability of the three precipitation products to capture precipitation extremes, PRCPTOT, R95p, and R99p were calculated according to their respective definitions, and categorical detection metrics were subsequently assessed. Overall, the products showed good event-detection performance, particularly for heavy and extreme precipitation (Figure 4). Among them, CHM_PRE achieved the highest probability of detection (POD = 0.95) and accuracy (ACC = 0.83), together with a relatively low false alarm ratio (FAR = 0.19), resulting in the highest critical success index (CSI = 0.78). CHM_PRE also maintained strong detection performance for R95p and R99p, indicating greater reliability in capturing heavy and extreme precipitation over the Hengduan Mountains. In contrast, IMERG showed greater uncertainty, with higher false alarm rates and lower overall categorical performance. Considering both precipitation-estimation accuracy and extreme-event detection, CHM_PRE showed the best overall performance and was therefore selected for subsequent analyses.

3.1.3. Quantification of Rainfall Erosivity Uncertainty Using Relative Deviation (RD)

To quantify uncertainty arising from precipitation inputs, the relative deviation of rainfall erosivity (RD) was calculated using station-based rainfall erosivity as the reference. RD increased with precipitation intensity for all three products (Table 4). CHM_PRE consistently showed the lowest deviations, with RD values of 18.95%, 25.39%, and 31.82% for PRCPTOT, R95p, and R99p, respectively. In comparison, ChinaMet showed larger deviations of 23.48–87.33%, while IMERG exhibited the highest overall uncertainty, with RD values ranging from 43.74% to 87.44%. Under R99p conditions, the RD of CHM_PRE was approximately 55–64% lower than those of ChinaMet and IMERG, indicating substantially lower uncertainty in rainfall erosivity estimates derived from CHM_PRE under extreme precipitation. These results are consistent with its stronger overall performance in CC, KGE, POD, and RMSE, supporting the selection of CHM_PRE for subsequent rainfall erosivity analyses in the Hengduan Mountains.

3.2. Spatial Variations in Extreme Precipitation and Corresponding Rainfall Erosivity

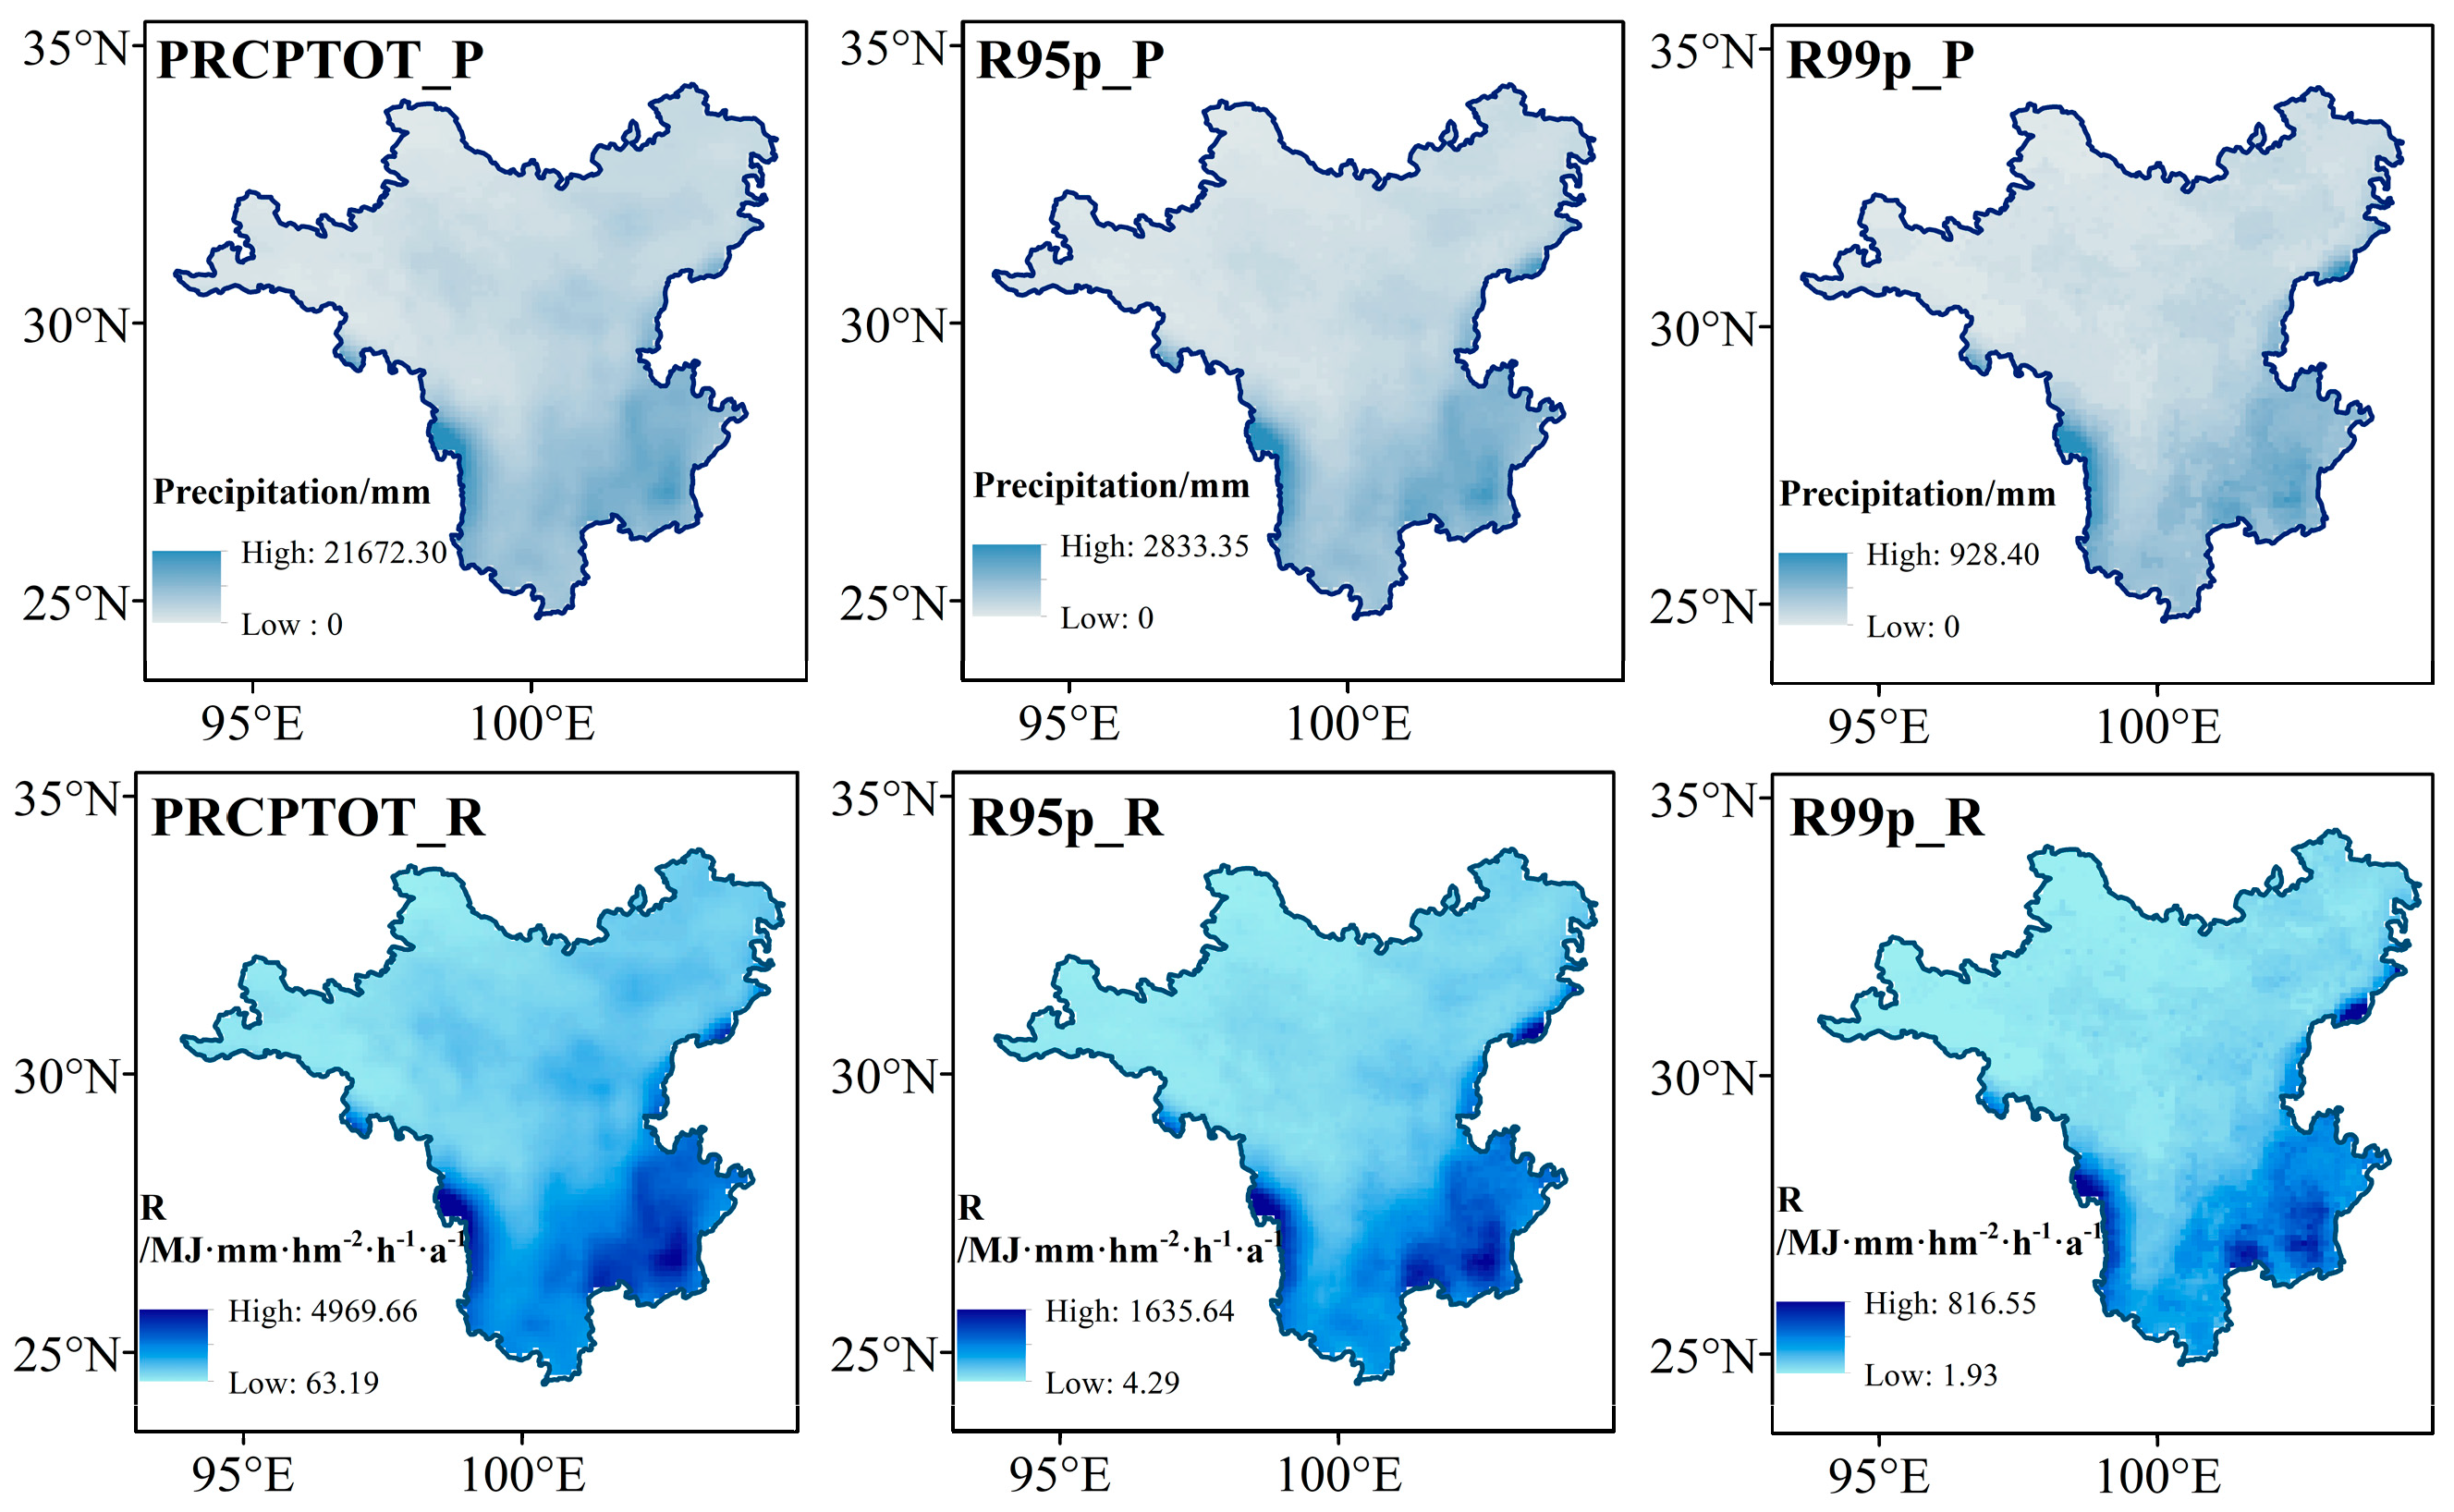
Based on the product evaluation, CHM_PRE was selected for subsequent analyses of precipitation and rainfall erosivity during 2005–2024. Precipitation and the corresponding rainfall erosivity were calculated for PRCPTOT, R95p, and R99p, followed by analyses of their spatial patterns and topographic differentiation. Both precipitation and rainfall erosivity exhibited pronounced spatial heterogeneity across the Hengduan Mountains (Figure 5). PRCPTOT, R95p, and R99p showed a consistent southeast-to-northwest decreasing gradient, with high-value areas concentrated along the southeastern and southern margins and relatively low values in the high-altitude northwestern region. During 2005–2024, the maximum cumulative PRCPTOT reached 21,672.30 mm, while the corresponding maxima for R95p and R99p were 2833.35 and 928.40 mm, respectively. The spatial coincidence of these high-value areas indicates that total, heavy, and extreme precipitation were consistently concentrated in the southeastern Hengduan Mountains.
The corresponding rainfall erosivity showed a broadly similar spatial pattern, with values decreasing from the southeastern and southern margins toward the northwest. PRCPTOT_R, R95p_R, and R99p_R denote rainfall erosivity associated with total, heavy (R95p), and extreme (R99p) precipitation, respectively. PRCPTOT_R ranged from 63.19 to 4969.66 MJ·mm·hm−2·h−1·a−1, across the region, whereas the maximum values of R95p_R and R99p_R reached 1635.64 and 816.55 MJ·mm·hm−2·h−1·a−1, respectively. High R95p_R and R99p_R values were concentrated primarily along the southeastern and southern margins of the Hengduan Mountains, indicating that these areas consistently experienced strong rainfall erosivity associated with heavy and extreme precipitation. Overall, high-precipitation areas largely coincided with zones of high rainfall erosivity. However, as precipitation intensity increased from PRCPTOT to R95p and R99p, high-erosivity areas became progressively more spatially concentrated. This pattern indicates increasing spatial selectivity of rainfall erosivity associated with precipitation extremes, with the highest erosivity confined to relatively localized areas of the southeastern and southern Hengduan Mountains.

3.3. Analysis of the Erosivity Contribution and Amplification Effect of Extreme Precipitation

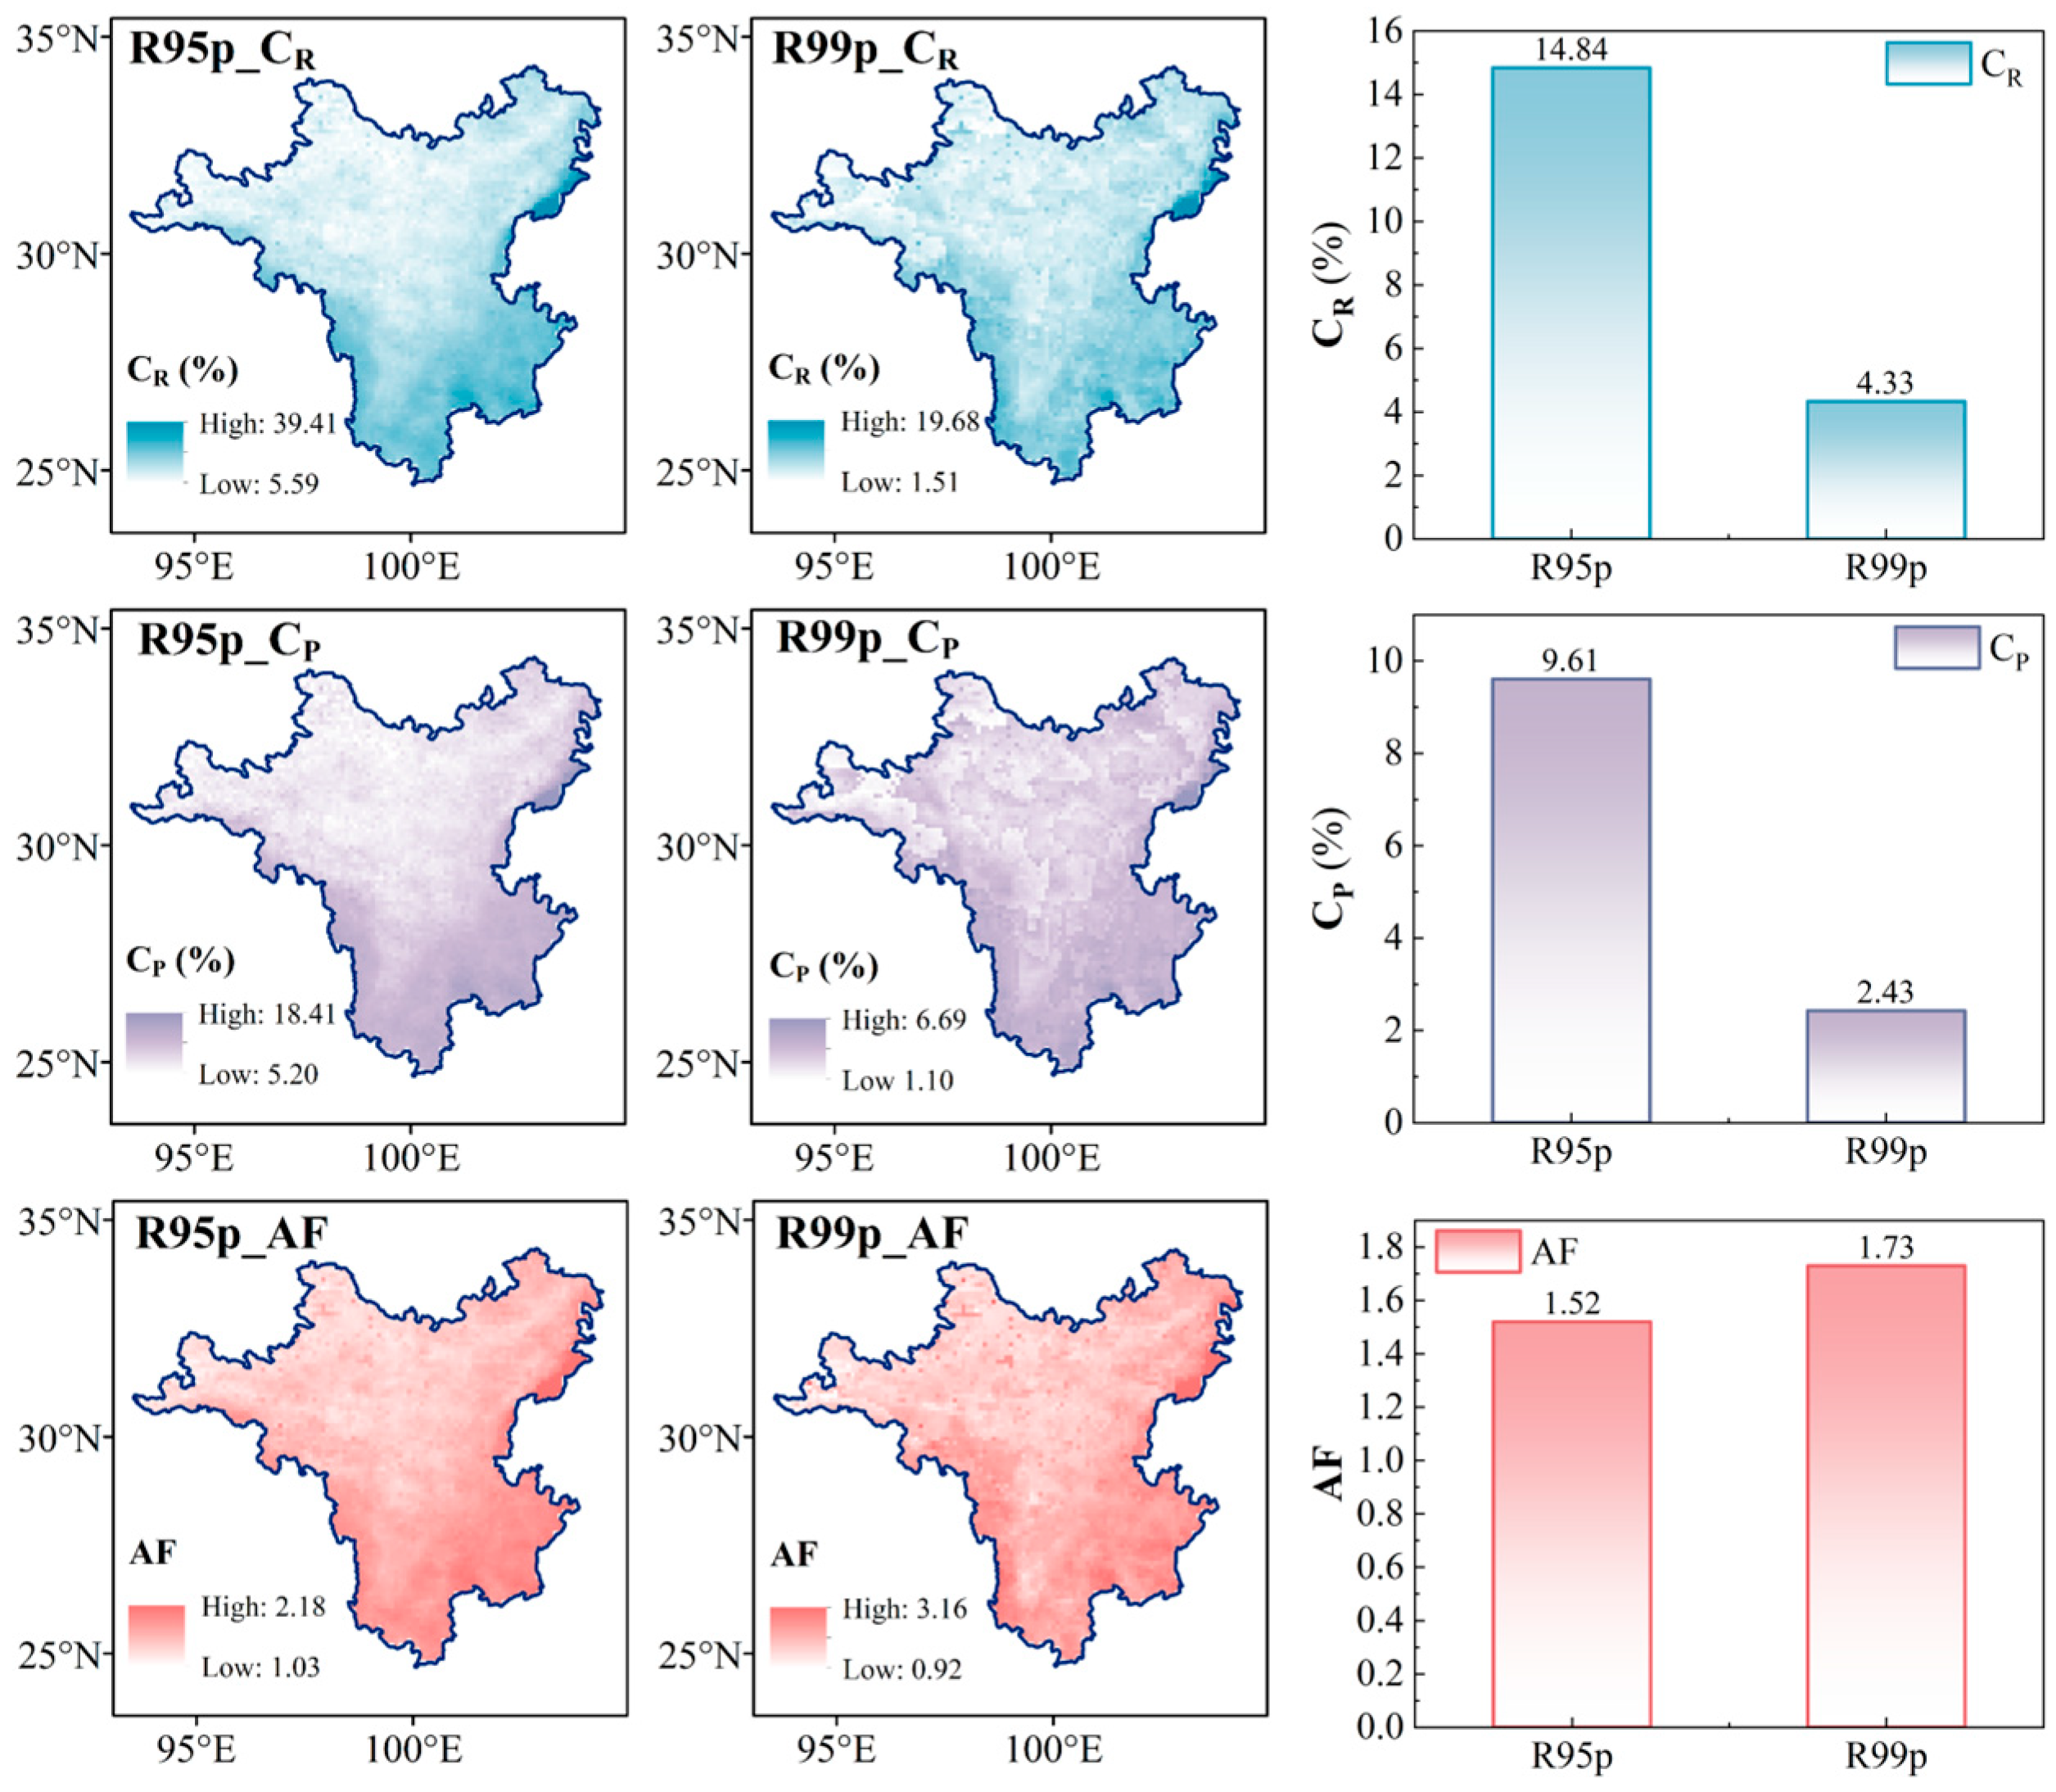
Figure 6 shows the spatial distributions of precipitation contribution (CP), erosivity contribution (CR), and erosion amplification factor (AF) for R95p and R99p, which accounted for only 9.61% and 2.43% of total precipitation, respectively, but contributed 14.84% and 4.33% of total rainfall erosivity. The corresponding mean AF values were 1.52 and 1.73, indicating that the contribution of extreme precipitation to rainfall erosivity was disproportionately greater than its contribution to total precipitation, with stronger amplification for R99p. Spatially, high AF values were concentrated mainly along the southern and southeastern margins of the study area, where local R99p AF values reached 3.16. These patterns indicate that the disproportionate erosivity contribution of extreme precipitation is spatially concentrated in specific mountainous areas, providing an important basis for the formation of regional rainfall-erosivity hotspots.

3.4. Spatial Heterogeneity of Rainfall Erosivity for Extreme Precipitation Under Complex Terrain

3.4.1. Topographic Differentiation of Rainfall Erosivity

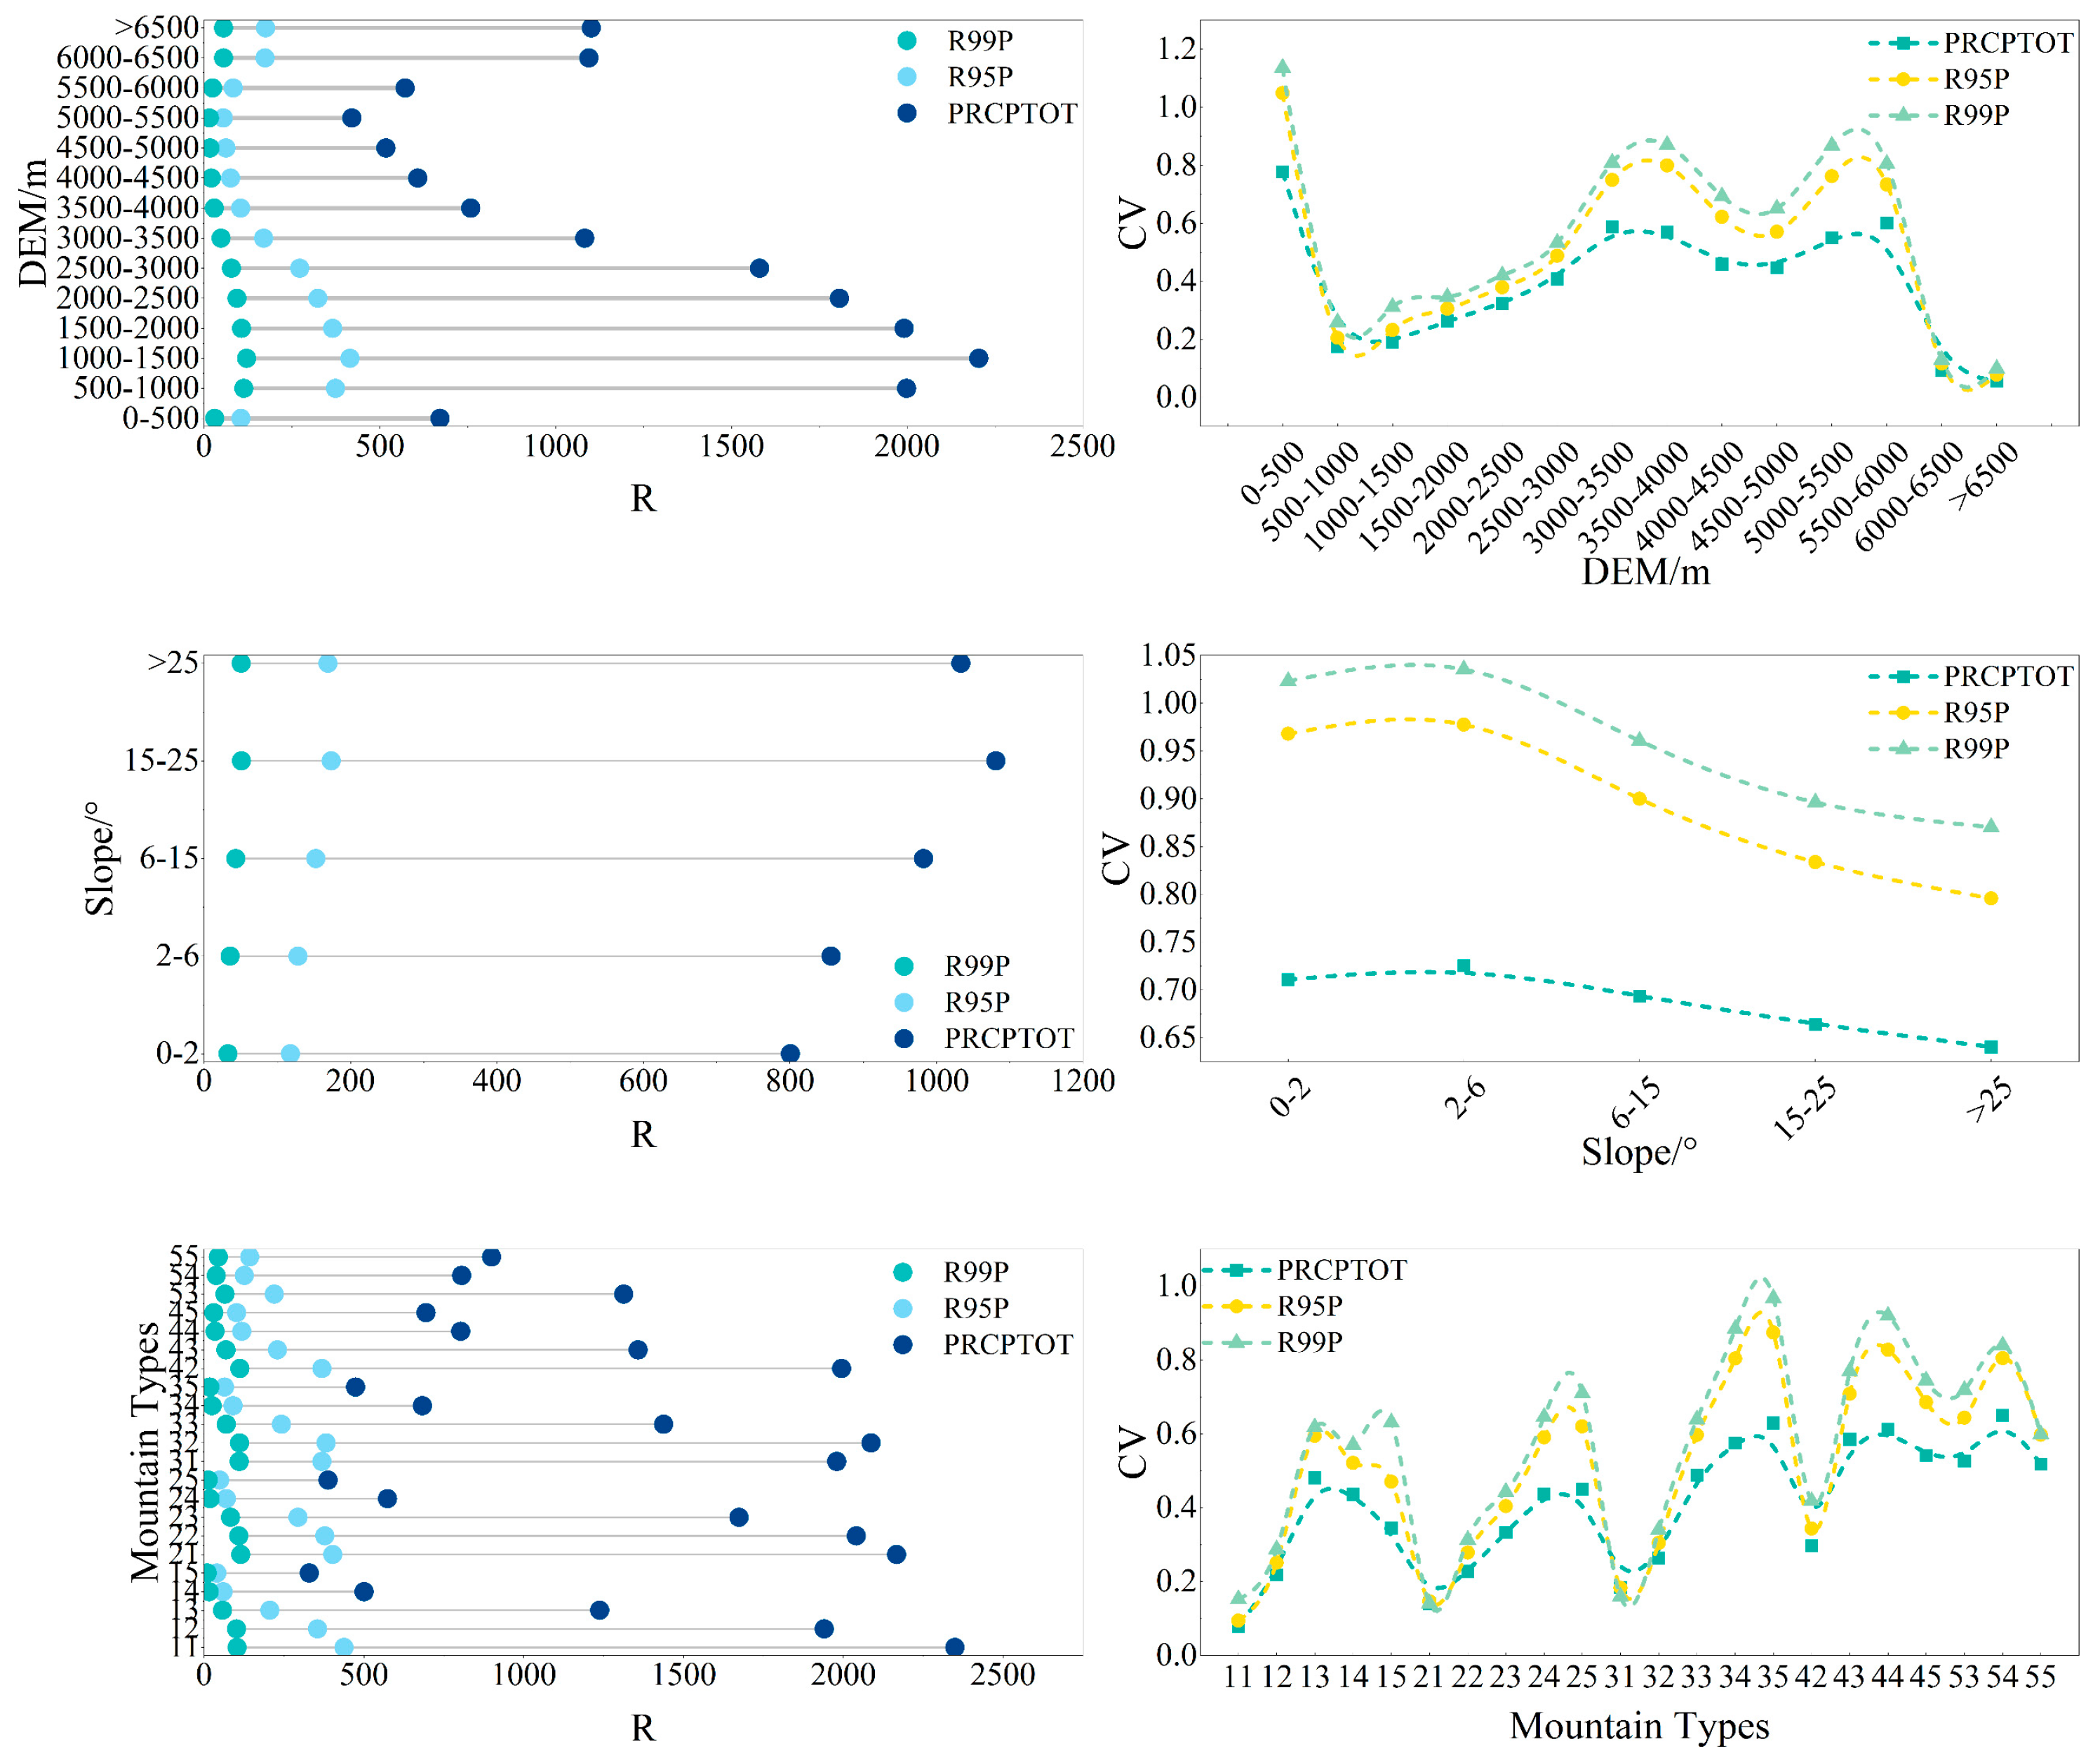
To characterize the topographic heterogeneity of rainfall erosivity, the mean values and coefficients of variation (CVs) of PRCPTOT_R, R95p_R, and R99p_R were compared across elevation, slope, and mountain-type classes. Rainfall erosivity exhibited pronounced differentiation among topographic gradients and precipitation-intensity categories (Figure 7).
Along the elevation gradient, PRCPTOT_R, R95p_R, and R99p_R exhibited similar non-monotonic patterns, generally increasing at lower elevations, decreasing toward higher elevations, and rising slightly again at the highest elevations. Mean erosivity peaked within the 1000–1500 m elevation band, where PRCPTOT_R reached approximately 2200 MJ·mm·hm−2·h−1·a−1, whereas it dropped to a lower level of about 500 MJ·mm·hm−2·h−1·a−1 in the 4500–5500 m zone. The CV of R99p_R displayed a bimodal pattern, with relatively high values in both the 0–500 m and 3000–6000 m elevation zones. The maximum CV reached 1.14 at 0–500 m, indicating particularly strong spatial variability in rainfall erosivity associated with extreme precipitation at low elevations.
Across slope gradient classes, mean rainfall erosivity generally increased with slope. PRCPTOT_R increased from approximately 800 MJ·mm·hm−2·h−1·a−1 at 0–2° to about 1080 MJ·mm·hm−2·h−1·a−1 at 15–25°. In contrast, the CV of R99p_R decreased from 1.03 in the 0–2° class to 0.87 at slopes > 25°, indicating lower relative spatial variability of extreme-precipitation erosivity on steeper terrain. Rainfall erosivity also varied substantially among mountain types. Slightly Undulating Low Mountain (Type 11), Gently Undulating Low Mountain (Type 21), Moderately Undulating Low Mountain (Type 31), and Moderately Undulating Middle Mountain (Type 32) exhibited relatively high total rainfall erosivity, with mean PRCPTOT_R values exceeding 2000 MJ·mm·hm−2·h−1·a−1. In particular, Moderately Undulating High Mountain (Type 34) and Moderately Undulating Extremely High Mountain (Type 35) showed R99p_R CVs approaching or exceeding 1.0, indicating pronounced spatial heterogeneity in extreme-precipitation erosivity within these terrain classes.
Overall, R95p_R and R99p_R generally exhibited greater relative spatial variability than PRCPTOT_R across the examined topographic gradients, with R99p_R showing the strongest heterogeneity. These patterns indicate that rainfall erosivity associated with extreme precipitation is more strongly differentiated among specific elevation bands, slope classes, and mountain types.

3.4.2. Statistical Assessment of Topographic Effects on Rainfall Erosivity

Kruskal–Wallis tests were used to assess differences in rainfall erosivity among elevation, slope, and mountain-type classes (Table 5). Significant differences were detected for PRCPTOT_R, R95p_R, and R99p_R across all three topographic factors (all p < 0.001), confirming pronounced topographic differentiation in rainfall erosivity.
Effect sizes, however, differed markedly among topographic factors. Elevation showed the largest effect sizes (ε2 = 0.682–0.704), followed by mountain type (ε2 = 0.604–0.621), whereas slope exhibited substantially smaller values (ε2 = 0.036–0.058). Among the three erosivity indices, R95p_R showed the strongest differentiation across elevation classes (ε2 = 0.704). In contrast, the effect size associated with slope increased from PRCPTOT_R (ε2 = 0.036) to R95p_R (ε2 = 0.049) and R99p_R (ε2 = 0.058), suggesting that differences among slope classes become somewhat more pronounced with increasing precipitation extremity, although they remain much weaker than those associated with elevation and mountain type.
Overall, elevation and mountain type exhibited substantially stronger associations with the spatial differentiation of rainfall erosivity than slope, indicating that erosivity patterns in the Hengduan Mountains are more strongly differentiated across elevational and geomorphological settings.

3.5. Identification of Hotspots of Extreme Rainfall Erosivity and Key Geomorphic Units

3.5.1. Identification of Rainfall Erosivity Hotspots and Key Geomorphic Units

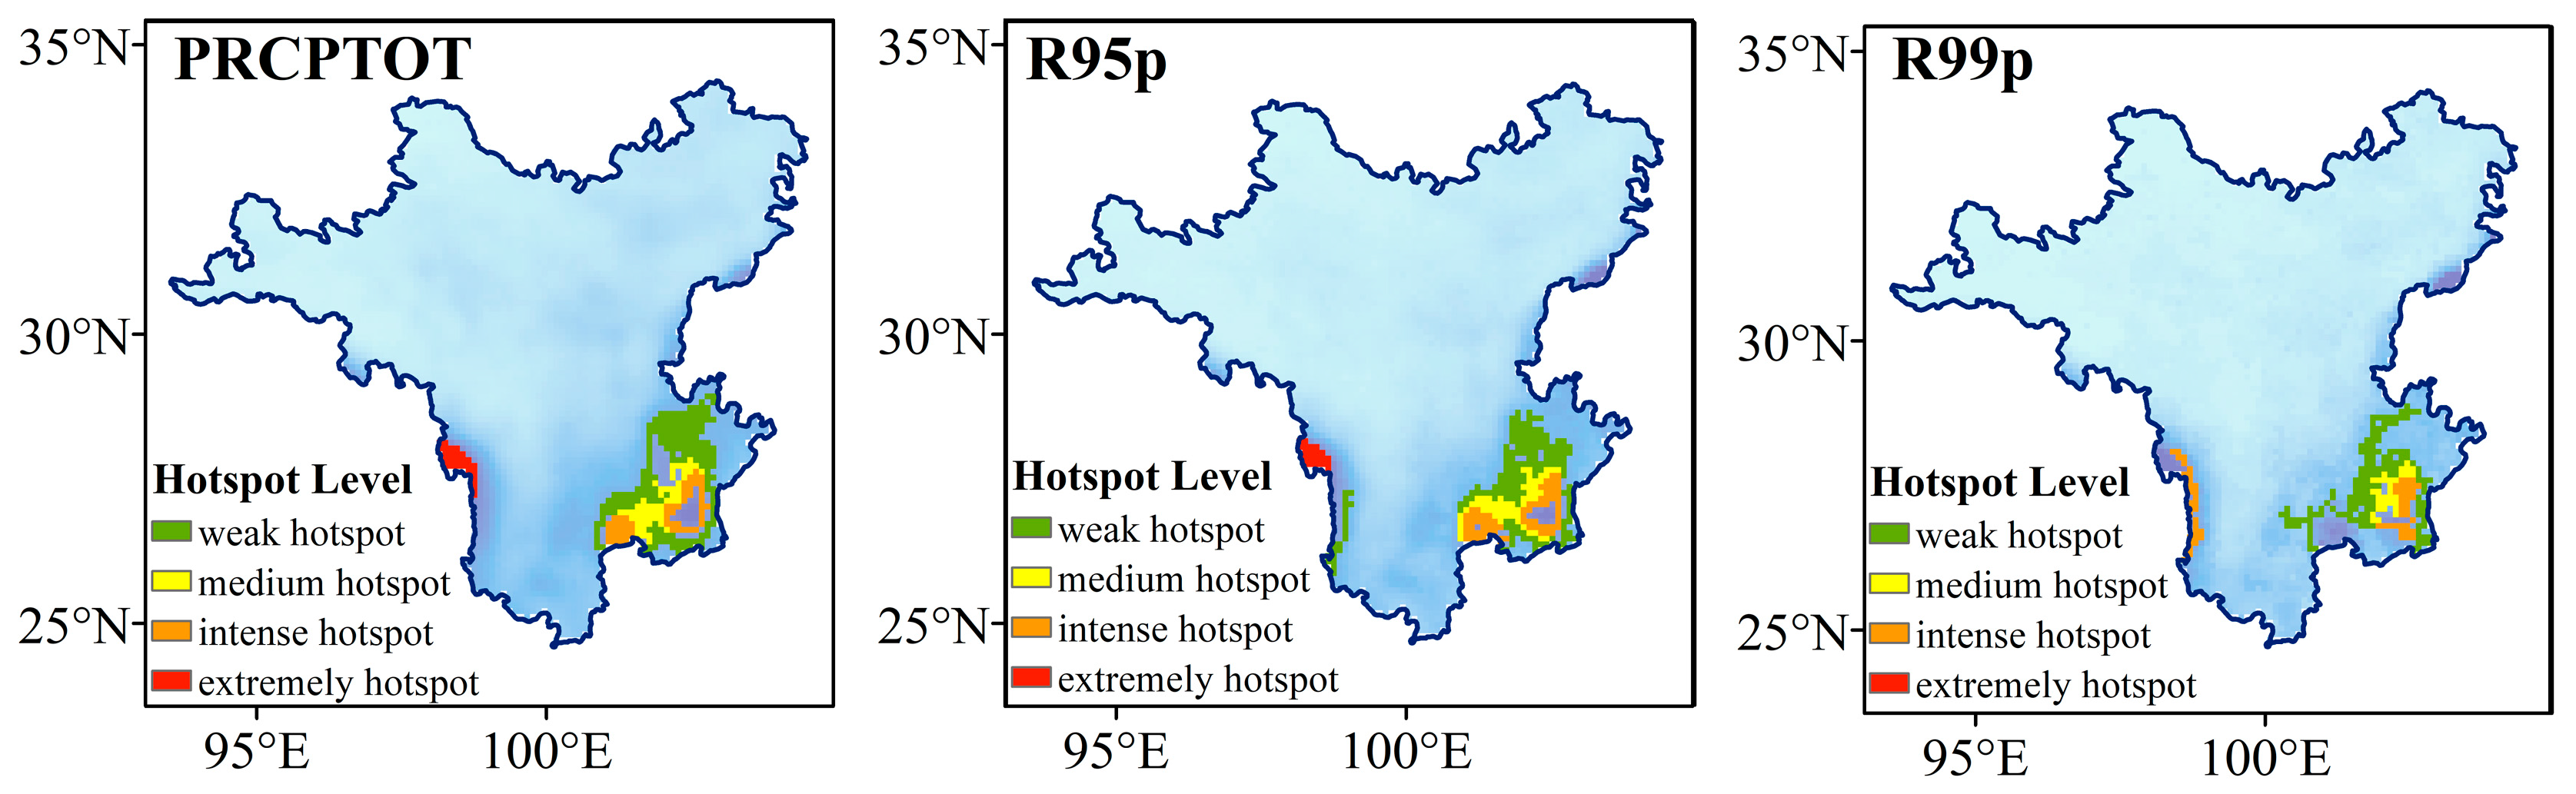
Figure 8 shows the spatial patterns of rainfall erosivity hotspots associated with PRCPTOT, R95p, and R99p. Across all three precipitation categories, hotspots were consistently concentrated along the southeastern and southern margins of the Hengduan Mountains, indicating a broadly stable spatial core of high rainfall erosivity. As precipitation shifted from total precipitation (PRCPTOT) to heavy (R95p) and extreme (R99p) precipitation, however, the highest-level hotspots became progressively more spatially restricted, changing from relatively contiguous zones to smaller and more localized patches. This contraction was particularly evident along the southwestern boundary, where extreme hotspots were substantially reduced under R99p conditions. Overall, rainfall erosivity associated with increasingly extreme precipitation exhibited greater spatial localization, with the highest erosivity confined to a limited number of sensitive areas.

3.5.2. Elevation and Slope Characteristics of Rainfall Erosivity Hotspots

Table 6 summarizes the elevation and slope characteristics of rainfall erosivity hotspots across precipitation-intensity categories. Although elevation and slope did not vary monotonically across all hotspot levels, the highest-level hotspots were generally associated with relatively elevated and steep terrain. For PRCPTOT and R95p, extreme hotspots occurred at mean elevations of 2735.19 and 2791.92 m, respectively, with corresponding mean slopes of 15.09° and 14.79°. Under R99p conditions, no extreme hotspots were identified; however, intense hotspots occurred at a mean elevation of 2374.15 m and a mean slope of 12.28°, compared with 2303.98 m and 9.67° for weak hotspots. Overall, these patterns indicate that the highest levels of rainfall erosivity hotspots tend to be associated with relatively high elevations and steep slopes, although the topographic gradients vary among precipitation-intensity categories.

3.5.3. Mountain-Type Composition of Rainfall Erosivity Hotspots

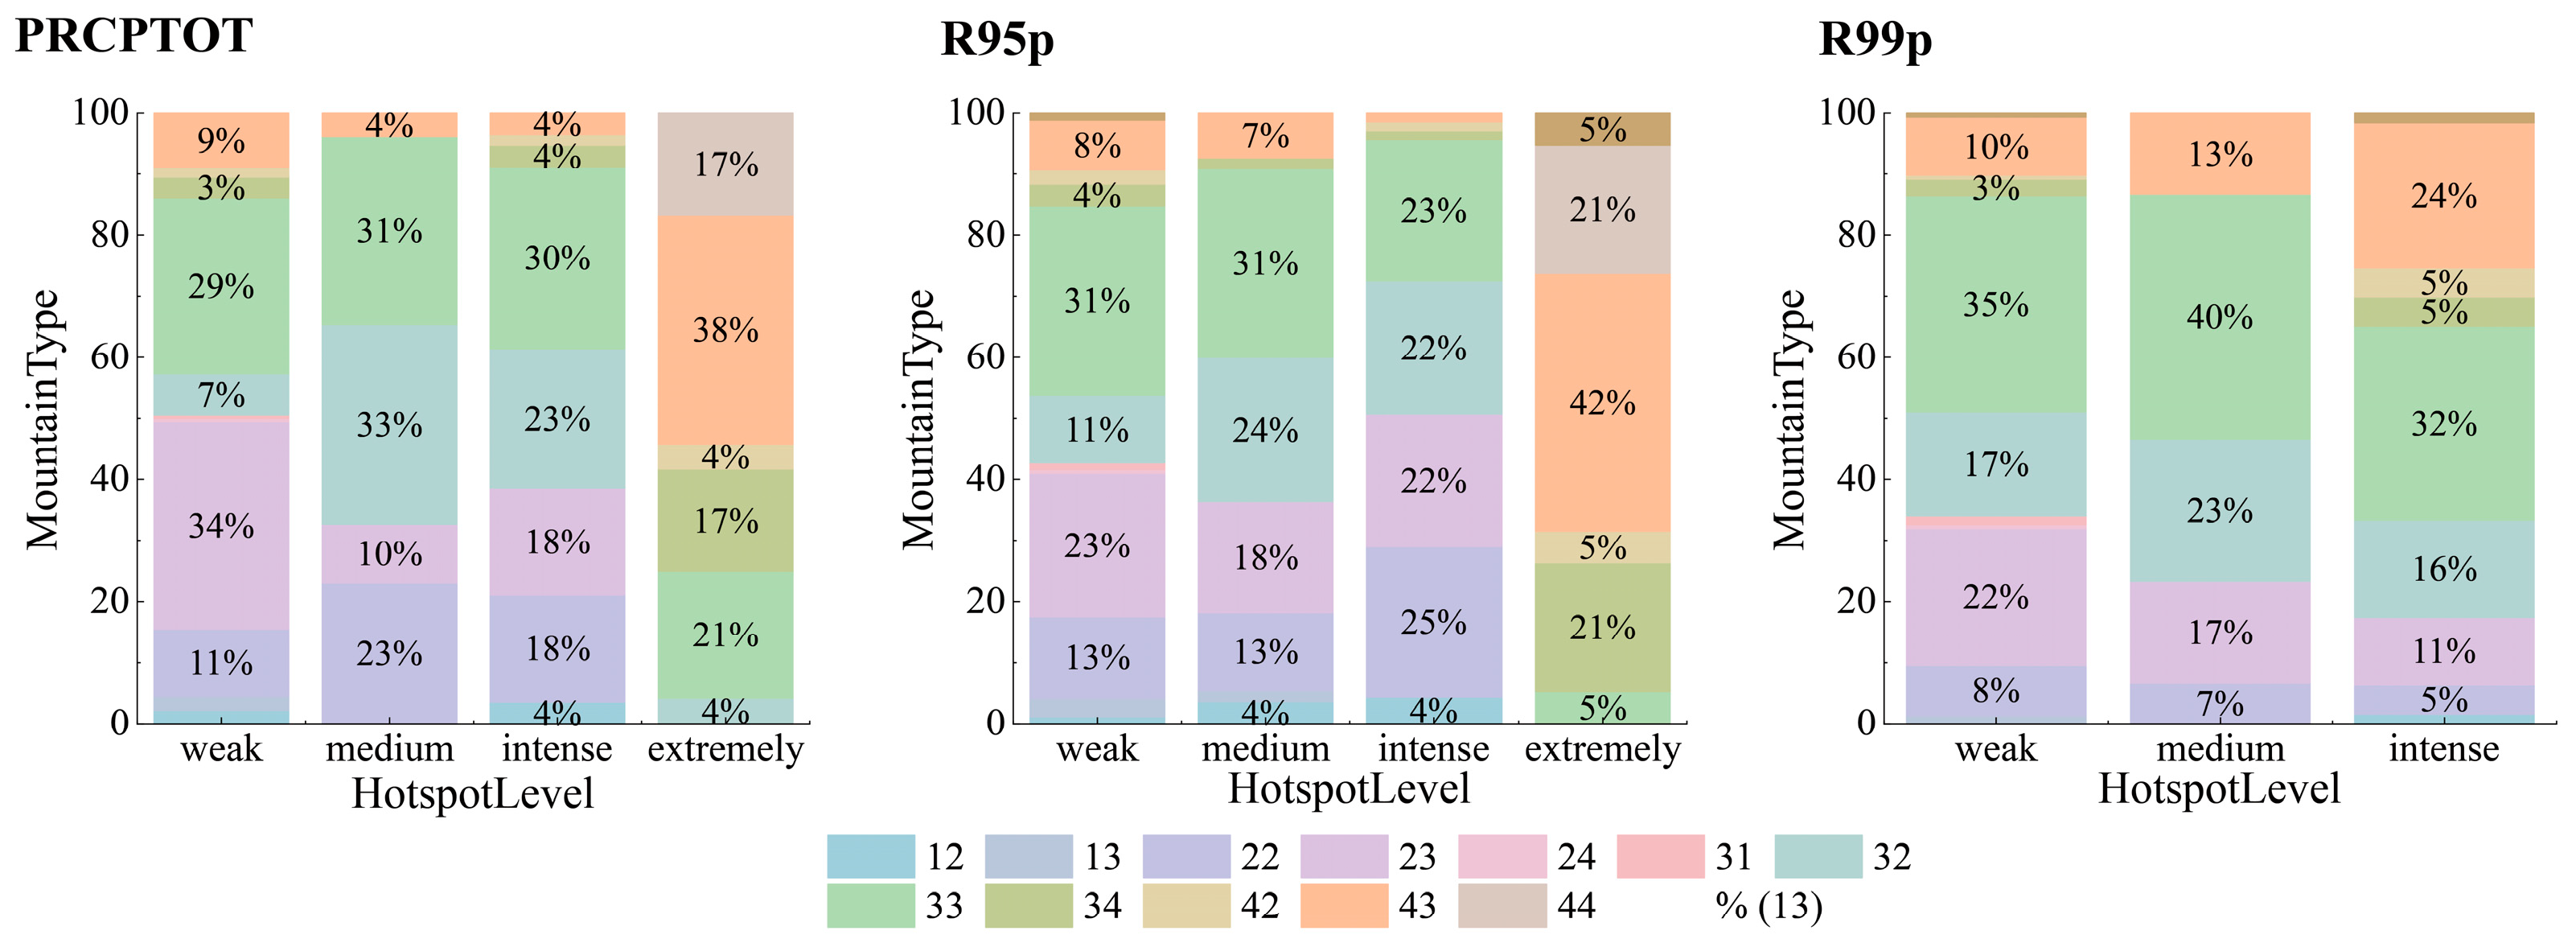
Figure 9 shows the mountain-type composition of rainfall erosivity hotspots across precipitation-intensity categories. High-level hotspots were concentrated within a limited number of mountain types. Under PRCPTOT and R95p conditions, extreme hotspots were dominated by Strongly Undulating Mid-High Mountain (Type 43), accounting for 36% and 42% of the hotspot area, respectively. Under R99p conditions, no extreme hotspots were identified; instead, Moderately Undulating Mid-High Mountain (Type 33) and Strongly Undulating Mid-High Mountain (Type 43) accounted for 32% and 24% of intense hotspots, respectively. These results indicate that high-level rainfall erosivity hotspots are preferentially concentrated within specific geomorphic settings, with Type 43 consistently representing a major component of hotspots associated with heavy and extreme precipitation.

4. Discussion

4.1. Erosive Significance and Amplification Effects of Extreme Precipitation

Studies of extreme precipitation have traditionally emphasized climatic statistics such as amount, frequency, intensity, duration, and return level. For soil erosion and rainfall-driven geomorphic hazards, however, rainfall amount alone does not fully represent the erosive forcing exerted at the land surface. Rainfall erosivity integrates rainfall intensity and kinetic energy and thus provides a process-oriented measure linking precipitation extremes to erosion potential. Incorporating erosive forcing into analyses of precipitation extremes can therefore improve understanding of soil erosion, sediment transport, and related mountain hazards under climate change [62,63,64].
In the Hengduan Mountains, precipitation and the corresponding rainfall erosivity showed broadly similar spatial patterns, indicating that regional precipitation provides the first-order spatial control on erosive forcing. Nevertheless, erosivity associated with R95p and R99p was more spatially concentrated than that associated with total precipitation, particularly within complex terrain. Thus, heavy and extreme precipitation cannot be regarded simply as smaller subsets of total precipitation, nor can their erosive effects be inferred directly from annual or long-term mean precipitation. This study reveals a disproportionate contribution of extreme precipitation to rainfall erosivity in the Hengduan Mountains, which is consistent with previous findings from related studies [32,33,34,35]. From a process perspective, R95p and R99p represent not only precipitation defined by percentile thresholds but also rainfall events with a greater contribution to rainfall erosivity.
The proposed framework further quantified this disproportionate contribution. R95p and R99p accounted for only 9.61% and 2.43% of total precipitation, respectively, but contributed 14.84% and 4.33% of total rainfall erosivity, yielding AF values of 1.52 and 1.73. The larger AF for R99p indicates that the relative erosivity contribution increased with precipitation extremity. Previous hillslope studies have reported threshold-like increases in soil loss under extreme rainfall [36], but such thresholds cannot be directly inferred from rainfall erosivity alone. Rather, the present results demonstrate at the regional scale that extreme precipitation contributes disproportionately to rainfall erosivity, even without explicitly simulating runoff and sediment yield.
This disproportionate contribution has important implications under a warming climate, in which extreme precipitation is expected to intensify even where changes in total precipitation are comparatively modest. A growing contribution from rainfall extremes could therefore enhance erosion potential in mountain environments, although actual soil loss remains dependent on soil properties, vegetation, runoff generation, land use, and conservation practices. These results highlight the need to consider precipitation extremes, rather than long-term mean precipitation alone, in erosion assessment and watershed management. In the Hengduan Mountains, the southeastern and southern margins, where erosivity amplification is strongest, warrant particular attention in soil and water conservation and rainfall-related hazard management.

4.2. Topographic Modulation and Spatial Selectivity of Extreme Rainfall Erosivity

The Hengduan Mountains are characterized by extreme topographic relief and deeply incised alpine–gorge terrain, where precipitation is jointly shaped by large-scale atmospheric circulation and local topographic forcing. Orographic lifting, valley channeling, elevation gradients, and local circulation can substantially redistribute precipitation and modify the occurrence of extreme rainfall [49,77,78]. Consistent with this setting, rainfall erosivity differed markedly among elevation, slope, and mountain-type classes, indicating that topography is closely associated with its spatial differentiation rather than acting merely as a passive geographic background.
Rainfall erosivity exhibited a pronounced non-monotonic response along the elevation gradient, increasing at lower elevations, declining toward higher elevations, and rising slightly again at the highest elevations. This pattern suggests that high erosivity is not simply associated with increasing elevation, but may emerge within transitional zones where moisture transport, orographic effects, precipitation characteristics, hillslope conditions, and vegetation interact. Such complexity is consistent with the strong vertical climatic zonation of the Hengduan Mountains, where hydrothermal conditions, vegetation, and geomorphic settings vary substantially with elevation [79]. The Kruskal–Wallis results further showed that elevation produced the largest effect sizes (ε2 = 0.682–0.704), highlighting a strong altitudinal differentiation of rainfall erosivity.
Slope showed a much weaker statistical association with rainfall erosivity (ε2 = 0.036–0.058), despite a general increase in mean erosivity toward steeper terrain. In contrast, mountain type exhibited considerably larger effect sizes (ε2 = 0.604–0.621). This difference is likely related to the fact that mountain type integrates multiple geomorphic attributes, including elevation, relief, and terrain structure, whereas slope represents only one local terrain property. The preferential occurrence of R95p_R and R99p_R hotspots within moderately and strongly undulating middle- and high-mountain terrain further suggests that extreme-rainfall erosivity is associated with specific combinations of elevation and geomorphic relief.
A further feature is the progressive spatial contraction of rainfall-erosivity hotspots with increasing precipitation extremity. Although PRCPTOT_R, R95p_R, and R99p_R hotspots were consistently concentrated along the southeastern and southern margins of the Hengduan Mountains, their spatial configuration shifted from relatively continuous zones under PRCPTOT toward increasingly localized and fragmented patches under R95p and R99p. The contraction of R99p_R hotspots indicates increasing spatial selectivity of extreme rainfall erosivity, with the highest erosivity becoming confined to a limited number of topographically sensitive areas.
This spatial selectivity extends previous understanding of extreme rainfall erosivity, which has largely emphasized disproportionate event contributions and regional mean changes. The present results suggest that the disproportionate erosivity associated with extreme precipitation is not only temporally asymmetric [32], but also spatially heterogeneous and strongly structured by terrain. This is particularly relevant to the Hengduan Mountains, where monsoonal moisture transport interacts with alpine–gorge topography and where extreme precipitation and geomorphic responses are highly sensitive to climate variability and change [10,13,49,79]. The persistent concentration of high erosivity along the southeastern and southern margins therefore identifies these areas as particularly sensitive to extreme precipitation–related erosive forcing.
Rainfall erosivity, however, represents the potential erosive forcing of rainfall rather than actual soil loss. Erosion magnitude is additionally influenced by soil properties, vegetation cover, runoff generation, land use, and conservation practices. The identified hotspots should therefore be interpreted as areas of elevated rainfall-driven erosion potential rather than direct estimates of soil erosion intensity.

4.3. Uncertainty and Limitations

Reliable rainfall erosivity assessment in complex mountainous regions depends strongly on the quality of precipitation inputs. In the Hengduan Mountains, rugged terrain, sparse gauge coverage, and pronounced precipitation heterogeneity can introduce substantial uncertainty in the detection of heavy and extreme precipitation [51,52,53,80,81]. Among the three evaluated products, CHM_PRE showed the best overall performance, with a CC of 0.83 and a POD of 0.95. Its relatively strong performance likely reflects the integration of gauge observations, multi-source data, and terrain-related covariates, which improves the representation of precipitation heterogeneity over complex terrain. In contrast, although IMERG provides broad spatial coverage and high temporal continuity, its performance remains more uncertain for orographic and extreme precipitation. These results highlight the importance of evaluating precipitation products before applying them to rainfall erosivity assessments in mountainous environments.
The relative deviation of rainfall erosivity (RD) further showed that uncertainty increased with precipitation extremity. CHM_PRE consistently exhibited the lowest RD, whereas ChinaMet and IMERG showed deviations exceeding 80% for R99p. This pattern indicates that rainfall erosivity associated with extreme precipitation is particularly sensitive to errors in precipitation inputs, emphasizing the need for caution when interpreting erosivity estimates derived from gridded precipitation products. It should also be noted that the evaluation of CHM_PRE is not fully independent because gauge observations from the national meteorological network were incorporated into its construction. Its superior performance should therefore be interpreted as greater consistency with ground observations rather than as an entirely independent validation.
Additional uncertainty arises from the daily rainfall erosivity model used in this study. Rainfall erosivity is fundamentally related to rainfall kinetic energy and short-duration peak intensity, which are better captured by hourly or sub-hourly observations [25,40,57,82]. Although daily-scale models are suitable for regional and long-term assessments, they may underestimate the contribution of short-duration intensity peaks during extreme storms. Future studies should integrate higher-temporal-resolution precipitation data with hillslope runoff and sediment observations and geohazard inventories to better evaluate the correspondence between extreme-rainfall-erosivity hotspots and actual erosion-related hazards.

5. Conclusions

This study evaluated multi-source precipitation products and quantified the amplification and topographic differentiation of extreme-precipitation rainfall erosivity in the Hengduan Mountains. CHM_PRE showed the best overall performance in statistical accuracy and extreme-precipitation detection (CC = 0.83, POD = 0.95), supporting its use for regional rainfall erosivity assessment. Rainfall erosivity exhibited a pronounced southeast-to-northwest decreasing gradient. Although R95p and R99p accounted for only 9.61% and 2.43% of total precipitation, they contributed 14.84% and 4.33% of total rainfall erosivity, yielding AF values of 1.52 and 1.73, respectively. These results demonstrate a disproportionate erosivity contribution from precipitation extremes, with stronger amplification for R99p. Rainfall erosivity also exhibited pronounced topographic differentiation, and high-level hotspots were preferentially concentrated in relatively elevated and steep terrain and within specific mountain types. As precipitation extremity increased, hotspots became increasingly localized, particularly along the southeastern and southern margins of the Hengduan Mountains. These areas therefore warrant particular attention in soil and water conservation and rainfall-related hazard management.

Author Contributions

Data curation, methodology, software, writing—original draft, Q.D.; Conceptualization, funding acquisition, review and editing, formal analysis, G.C.; Data curation, formal analysis, investigation, visualization, F.J.; Review and editing, formal analysis, visualization, C.H.; Software, formal analysis, investigation, Z.C.; Validation, software, formal analysis, J.F. All authors have read and agreed to the published version of the manuscript.

Funding

This research was funded by the Basic Research Project of Yunnan Province (Grant No. 202501AT070326).

Data Availability Statement

Data are available upon request.

Acknowledgments

We would like to thank the Plateau Remote Sensing Innovation Research Team for their support.

Conflicts of Interest

The authors declare no conflicts of interest.

References

  1. Li, C.; Liu, J.; Du, F.; Zwiers, F.W.; Feng, G. Increasing certainty in projected local extreme precipitation change. Nat. Commun. 2025, 16, 850. [Google Scholar] [CrossRef] [Scilit] [PubMed]
  2. Piao, S.; Zhang, X.; Chen, A.; Liu, Q.; Lian, X.; Wang, X.; Peng, S.; Wu, X. The impacts of climate extremes on the terrestrial carbon cycle: A review. Sci. China Earth Sci. 2019, 62, 1551–1563. [Google Scholar] [CrossRef] [Scilit]
  3. Zhu, D.; Pfahl, S.; Knutti, R.; Fischer, E.M. Future extreme precipitation may shift to colder seasons in northern mid- and high latitudes. Commun. Earth Environ. 2025, 6, 657. [Google Scholar] [CrossRef] [Scilit]
  4. de Vries, I.; Sippel, S.; Zeder, J.; Fischer, E.M.; Knutti, R. Increasing extreme precipitation variability plays a key role in future record-shattering event probability. Commun. Earth Environ. 2024, 5, 482. [Google Scholar] [CrossRef] [Scilit] [PubMed]
  5. Wu, X.; Guo, S.; Yin, J.; Yang, G.; Zhong, Y.; Liu, D. On the event-based extreme precipitation across China: Time distribution patterns, trends, and return levels. J. Hydrol. 2018, 562, 305–317. [Google Scholar] [CrossRef] [Scilit]
  6. Li, Z.; Fang, H. Impacts of climate change on water erosion: A review. Earth-Sci. Rev. 2016, 163, 94–117. [Google Scholar] [CrossRef] [Scilit]
  7. Thomas, M.A.; Michaelis, A.C.; Oakley, N.S.; Kean, J.W.; Gensini, V.A.; Ashley, W.S. Rainfall intensification amplifies exposure of American Southwest to conditions that trigger postfire debris flows. npj Nat. Hazards 2024, 1, 14. [Google Scholar] [CrossRef] [Scilit]
  8. Breugem, A.J.; Wesseling, J.G.; Oostindie, K.; Ritsema, C.J. Meteorological aspects of heavy precipitation in relation to floods—An overview. Earth-Sci. Rev. 2020, 204, 103171. [Google Scholar] [CrossRef] [Scilit]
  9. Li, Q.; Peng, X.; Frauenfeld, O.W.; Wu, Z.; Wang, Y.; Mu, C. Extreme rainfall reshapes permafrost thermal regimes across the Northern Hemisphere. Nat. Commun. 2026, 17, 3204. [Google Scholar] [CrossRef] [Scilit] [PubMed]
  10. Jia, X.; Liu, F.; Dong, W.; Chen, X.; Qian, Q. Amplified summer extreme precipitation over the Tibetan Plateau in the early 21st century. npj Clim. Atmos. Sci. 2025, 8, 390. [Google Scholar] [CrossRef] [Scilit]
  11. Zhang, T.; Li, D.; East, A.E.; Walling, D.E.; Lane, S.; Overeem, I.; Beylich, A.A.; Koppes, M.N.; Lu, X. Warming-driven erosion and sediment transport in cold regions. Nat. Rev. Earth Environ. 2022, 3, 832–851. [Google Scholar] [CrossRef] [Scilit]
  12. Li, J.; Wang, G.; Song, C.; Sun, S.; Ma, J.; Wang, Y.; Guo, L.; Li, D. Recent intensified erosion and massive sediment deposition in Tibetan Plateau rivers. Nat. Commun. 2024, 15, 722. [Google Scholar] [CrossRef] [Scilit] [PubMed]
  13. Li, D.; Lu, X.; Walling, D.E.; Zhang, T.; Steiner, J.F.; Wasson, R.J.; Harrison, S.; Nepal, S.; Nie, Y.; Immerzeel, W.W.; et al. High Mountain Asia hydropower systems threatened by climate-driven landscape instability. Nat. Geosci. 2022, 15, 520–530. [Google Scholar] [CrossRef] [Scilit]
  14. Li, T.; Yin, S.; Xiao, Y.; Wang, M.; Chen, L.; Zou, W.; Peleg, N. Quantifying rainfall variability and potential hazards of extreme events in Beijing through stochastic simulations. J. Hydrol. Reg. Stud. 2026, 63, 103068. [Google Scholar] [CrossRef] [Scilit]
  15. Fan, X.; Miao, C.; Wu, Y.; Mishra, V.; Chai, Y. Comparative assessment of dry- and humid-heat extremes in a warming climate: Frequency, intensity, and seasonal timing. Weather Clim. Extrem. 2024, 45, 100698. [Google Scholar] [CrossRef] [Scilit]
  16. Duan, W.; Zou, S.; Christidis, N.; Schaller, N.; Chen, Y.; Sahu, N.; Li, Z.; Fang, G.; Zhou, B. Changes in temporal inequality of precipitation extremes over China due to anthropogenic forcings. npj Clim. Atmos. Sci. 2022, 5, 33. [Google Scholar] [CrossRef] [Scilit]
  17. Eekhout, J.P.; de Vente, J. Global impact of climate change on soil erosion and potential for adaptation through soil conservation. Earth-Sci. Rev. 2022, 226, 103921. [Google Scholar] [CrossRef] [Scilit]
  18. Xiong, M.; Leng, G. Global soil water erosion responses to climate and land use changes. Catena 2024, 241, 108043. [Google Scholar] [CrossRef] [Scilit]
  19. Yin, S.; Nearing, M.A.; Borrelli, P.; Xue, X. Rainfall erosivity: An overview of methodologies and applications. Vadose Zone J. 2017, 16, 1–16. [Google Scholar] [CrossRef] [Scilit]
  20. Chen, G.; Zhao, J.; Duan, X.; Tang, B.; Zuo, L.; Wang, X.; Guo, Q. Spatial quantification of cropland soil erosion dynamics in the Yunnan Plateau based on sampling survey and multi-source LUCC data. Remote Sens. 2024, 16, 977. [Google Scholar] [CrossRef] [Scilit]
  21. Nearing, M.A.; Yin, S.; Borrelli, P.; Polyakov, V.O. Rainfall erosivity: An historical review. Catena 2017, 157, 357–362. [Google Scholar] [CrossRef] [Scilit]
  22. Zhao, Y.; Zhu, D.; Wu, Z.; Cao, Z. Extreme rainfall erosivity: Research advances and future perspectives. Sci. Total Environ. 2024, 917, 170425. [Google Scholar] [CrossRef] [Scilit] [PubMed]
  23. Xie, Y.; Yin, S.-Q.; Liu, B.-Y.; Nearing, M.A.; Zhao, Y. Models for estimating daily rainfall erosivity in China. J. Hydrol. 2016, 535, 547–558. [Google Scholar] [CrossRef] [Scilit]
  24. Chen, W.; Huang, Y.-C.; Lebar, K.; Bezak, N. A systematic review of the incorrect use of an empirical equation for the estimation of the rainfall erosivity around the globe. Earth-Sci. Rev. 2023, 238, 104339. [Google Scholar] [CrossRef] [Scilit]
  25. Chen, G.; Zhang, Z.; Guo, Q.; Wang, X.; Wen, Q. Quantitative assessment of soil erosion based on CSLE and the 2010 national soil erosion survey at regional scale in Yunnan Province of China. Sustainability 2019, 11, 3252. [Google Scholar] [CrossRef] [Scilit]
  26. Das, S.; Jain, M.K.; Gupta, V.; McGehee, R.P.; Yin, S.; de Mello, C.R.; Azari, M.; Borrelli, P.; Panagos, P. GloRESatE: A dataset for global rainfall erosivity derived from multi-source data. Sci. Data 2024, 11, 926. [Google Scholar] [CrossRef] [Scilit] [PubMed]
  27. Chen, Y.; Duan, X.; Ding, M.; Qi, W.; Wei, T.; Li, J.; Xie, Y. New gridded dataset of rainfall erosivity (1950–2020) on the Tibetan Plateau. Earth Syst. Sci. Data 2022, 14, 2681–2695. [Google Scholar] [CrossRef] [Scilit]
  28. Bezak, N.; Borrelli, P.; Panagos, P. A first assessment of rainfall erosivity synchrony scale at pan-European scale. Catena 2021, 198, 105060. [Google Scholar] [CrossRef] [Scilit]
  29. Riquetti, N.B.; Mello, C.R.; Beskow, S.; Viola, M.R. Rainfall erosivity in South America: Current patterns and future perspectives. Sci. Total Environ. 2020, 724, 138315. [Google Scholar] [CrossRef] [Scilit] [PubMed]
  30. Das, S.; Jain, M.K.; Gupta, V. An assessment of anticipated future changes in water erosion dynamics under climate and land use change scenarios in South Asia. J. Hydrol. 2024, 637, 131341. [Google Scholar] [CrossRef] [Scilit]
  31. Dou, X.; Ma, X.; Zhao, C.; Li, J.; Yan, Y.; Zhu, J. Risk assessment of soil erosion in Central Asia under global warming. Catena 2022, 212, 106056. [Google Scholar] [CrossRef] [Scilit]
  32. Chen, L.; Xiao, Y.; Yin, S.; Wang, W.; Strohmeier, S.; Vásquez, C.; Klik, A.; Strauss, P. Disproportionate contributions and spatiotemporal patterns of extreme rainfall and erosivity events across mainland China. Int. Soil Water Conserv. Res. 2025, 14, 100596. [Google Scholar] [CrossRef] [Scilit]
  33. Xiao, Y.; Yin, S.; Yu, B.; Fan, C.; Wang, W.; Xie, Y. The most extreme rainfall erosivity event ever recorded in China up to 2022: The 7.20 storm in Henan Province. Hydrol. Earth Syst. Sci. 2023, 27, 4563–4577. [Google Scholar] [CrossRef] [Scilit]
  34. Duan, J.; Liu, Y.-J.; Yang, J.; Tang, C.J.; Shi, Z.-H. Role of groundcover management in controlling soil erosion under extreme rainfall in citrus orchards of southern China. J. Hydrol. 2020, 582, 124290. [Google Scholar] [CrossRef] [Scilit]
  35. Zhu, D.; Cao, Z.; Zhao, Y.; Wu, Z.; Xiao, H. Analysis of the asymmetric characteristic of extreme rainfall erosivity in 8 provinces of southern China during 1961–2020. Water 2023, 15, 2408. [Google Scholar] [CrossRef] [Scilit]
  36. Ma, Y.; Zhuang, X.; Lu, F.; Zhao, Z.; Wang, W. Soil erosion processes on layered loess slopes under extreme rainfall events. J. Hydrol. 2026, 677, 135778. [Google Scholar] [CrossRef] [Scilit]
  37. Chen, Y.; Wei, T.; Li, J.; Xin, Y.; Ding, M. Future changes in global rainfall erosivity: Insights from the precipitation changes. J. Hydrol. 2024, 638, 131435. [Google Scholar] [CrossRef] [Scilit]
  38. Dai, Q.; Zhu, J.; Lv, G.; Kalin, L.; Yao, Y.; Zhang, J.; Han, D. Radar remote sensing reveals potential underestimation of rainfall erosivity at the global scale. Sci. Adv. 2023, 9, eadg5551. [Google Scholar] [CrossRef] [Scilit] [PubMed]
  39. Panagos, P.; Borrelli, P.; Matthews, F.; Liakos, L.; Bezak, N.; Diodato, N.; Ballabio, C. Global rainfall erosivity projections for 2050 and 2070. J. Hydrol. 2022, 610, 127865. [Google Scholar] [CrossRef] [Scilit]
  40. Panagos, P.; Ballabio, C.; Meusburger, K.; Spinoni, J.; Alewell, C.; Borrelli, P. Towards estimates of future rainfall erosivity in Europe based on REDES and WorldClim datasets. J. Hydrol. 2017, 548, 251–262. [Google Scholar] [CrossRef] [Scilit] [PubMed]
  41. Lee, S.; Bae, J.H.; Hong, J.; Yang, D.; Panagos, P.; Borrelli, P.; Yang, J.E.; Kim, J.; Lim, K.J. Estimation of rainfall erosivity factor in Italy and Switzerland using Bayesian optimization based machine learning models. Catena 2022, 211, 105957. [Google Scholar] [CrossRef] [Scilit]
  42. Uber, M.; Haller, M.; Brendel, C.; Hillebrand, G.; Hoffmann, T. Past, present and future rainfall erosivity in central Europe based on convection-permitting climate simulations. Hydrol. Earth Syst. Sci. 2024, 28, 87–102. [Google Scholar] [CrossRef] [Scilit]
  43. Xu, X.; Yan, Y.; Dai, Q.; Yi, X.; Hu, Z.; Cen, L. Spatial and temporal dynamics of rainfall erosivity in the karst region of southwest China: Interannual and seasonal changes. Catena 2023, 221, 106763. [Google Scholar] [CrossRef] [Scilit]
  44. Diodato, N.; Bellocchi, G. Decadal modelling of rainfall–runoff erosivity in the Euro-Mediterranean region using extreme precipitation indices. Glob. Planet. Change 2012, 86, 79–91. [Google Scholar] [CrossRef] [Scilit]
  45. Yin, C.; Bai, C.; Zhu, Y.; Shao, M.A.; Han, X.; Qiao, J. Future soil erosion risk in China: Differences in erosion driven by general and extreme precipitation under climate change. Earth’s Future 2025, 13, e2024EF005390. [Google Scholar] [CrossRef] [Scilit]
  46. Wang, W.; Yin, S.; He, Z.; Chen, D.; Wang, H.; Klik, A. Projections of rainfall erosivity in climate change scenarios for mainland China. Catena 2023, 232, 107391. [Google Scholar] [CrossRef] [Scilit]
  47. Dallan, E.; Bagarello, V.; Ferro, V.; Pampalone, V.; Borga, M. Evaluation and projected changes in rainfall erosivity: Topography dependence revealed by convection-permitting climate projections for the Mediterranean island of Sicily. Catena 2025, 254, 108975. [Google Scholar] [CrossRef] [Scilit]
  48. Rojpratak, S.; Supharatid, S. Regional extreme precipitation index: Evaluations and projections from the multi-model ensemble CMIP5 over Thailand. Weather Clim. Extrem. 2022, 37, 100475. [Google Scholar] [CrossRef] [Scilit]
  49. Liu, P.; Wu, Z.; Xie, K.; Zhang, Q.; Liu, C.; Liu, P.; Wang, G. Unraveling spatiotemporal distribution of extreme precipitation in the southern Tibetan Plateau: Synergistic effects between atmospheric circulation and topography. J. Hydrol. Reg. Stud. 2025, 62, 102809. [Google Scholar] [CrossRef] [Scilit]
  50. Mekonnen, K.; Velpuri, N.M.; Leh, M.; Akpoti, K.; Owusu, A.; Tinonetsana, P.; Hamouda, T.; Ghansah, B.; Paranamana, T.P.; Munzimi, Y. Accuracy of satellite and reanalysis rainfall estimates over Africa: A multi-scale assessment of eight products for continental applications. J. Hydrol. Reg. Stud. 2023, 49, 101514. [Google Scholar] [CrossRef] [Scilit]
  51. Feng, J.; Chen, G.; Duan, X.; Tang, B.; Liu, Z.; Huang, Y.; Deng, Y. Multi-Scale Accuracy Assessment of Meteorological Satellite Precipitation Products in the Dry-Hot Valley of Jinsha River. J. Hydrol. Reg. Stud. 2025, 60, 102535. [Google Scholar] [CrossRef] [Scilit]
  52. Pradhan, R.K.; Markonis, Y.; Vargas Godoy, M.R.; Villalba-Pradas, A.; Andreadis, K.M.; Nikolopoulos, E.I.; Papalexiou, S.M.; Rahim, A.; Tapiador, F.J.; Hanel, M. Review of GPM IMERG performance: A global perspective. Remote Sens. Environ. 2022, 268, 112754. [Google Scholar] [CrossRef] [Scilit]
  53. Feng, J.; Chen, G.; Duan, X.; Cai, F.; Zhao, H.; Zhang, Y.; Duan, Q. Time-Lag and Accumulation Responses of Vegetation to Precipitation in the Jinsha River Dry-Hot Valley at Multiple Spatial–Temporal Scales. J. Hydrol. 2025, 661, 133605. [Google Scholar] [CrossRef] [Scilit]
  54. Hu, J.; Miao, C.; Su, J.; Zhang, Q.; Gou, J.; Sun, Q. An upgraded high-precision gridded precipitation dataset for the Chinese mainland considering spatial autocorrelation and covariates. Earth Syst. Sci. Data 2025, 17, 3987–4004. [Google Scholar] [CrossRef] [Scilit]
  55. Freitas, E.D.S.; Coelho, V.H.R.; Xuan, Y.; Melo, D.C.D.; Gadelha, A.N.; Santos, E.A., Jr.; Galvao, C.O.; Filho, G.M.R.; Barbosa, L.R.; Huffman, G.J.; et al. The performance of the IMERG satellite-based product in identifying sub-daily rainfall events and their properties. J. Hydrol. 2020, 589, 125128. [Google Scholar] [CrossRef] [Scilit]
  56. Bezak, N.; Borrelli, P.; Panagos, P. Exploring the possible role of satellite-based rainfall data in estimating inter- and intra-annual global rainfall erosivity. Hydrol. Earth Syst. Sci. 2022, 26, 1907–1924. [Google Scholar] [CrossRef] [Scilit]
  57. Chang, Y.; Lei, H.; Zhou, F.; Yang, D. Spatial and temporal variations of rainfall erosivity in the middle Yellow River Basin based on hourly rainfall data. Catena 2022, 216, 106406. [Google Scholar] [CrossRef] [Scilit]
  58. Zhang, X.; Xu, X.; Li, X.; Cui, P.; Zheng, D. A New Scheme of Climate-Vegetation Regionalization in the Heng-duan Mountains Region. Sci. China Earth Sci. 2024, 67, 751–768. [Google Scholar] [CrossRef] [Scilit]
  59. Tao, W.; Huang, G.; Lau, W.K.M.; Dong, D.; Wang, P.; Wen, G. How Can CMIP5 AGCMs’ Resolution Influence Precipitation in Mountain Areas: The Hengduan Mountains? Clim. Dyn. 2020, 54, 159–172. [Google Scholar] [CrossRef] [Scilit]
  60. Xiang, R.; Steger, C.R.; Li, S.; Pellissier, L.; Sørland, S.L.; Willett, S.D.; Schär, C. Assessing the Regional Climate Response to Different Hengduan Mountains Geometries With a High-Resolution Regional Climate Model. JGR Atmos. 2024, 129, e2023JD040208. [Google Scholar] [CrossRef] [Scilit]
  61. Wu, H.; Hua, W.; Wu, X.; Yuan, W. The Eastward Propagation of Hourly Rainfall at the Western Edge of the Hengduan Mountains and Its Leading Circulation Patterns during the Warm Season. Meteorol. Appl. 2025, 32, e70045. [Google Scholar] [CrossRef] [Scilit]
  62. Li, J.; Liu, Z.; Wang, R.; Zhang, X.; Liu, X.; Yao, Z. Analysis of Debris Flow Triggering Conditions for Different Rainfall Patterns Based on Satellite Rainfall Products in Hengduan Mountain Region, China. Remote Sens. 2022, 14, 2731. [Google Scholar] [CrossRef] [Scilit]
  63. Guo, Q.; Wang, A.; Wei, Q.; Shan, Z.; Gong, J.; Wang, D.; Ding, L. Changes in the Characteristics of Flood Discharge and Sediment Yield in a Typical Watershed in the Hengduan Mountain Region, Southwest China, under Extreme Precipitation Events. Ecol. Indic. 2022, 145, 109600. [Google Scholar] [CrossRef] [Scilit]
  64. Liang, X.; Zhang, L.; He, S.; Song, K.; Zheng, Z. Characteristics and Projection of Rainfall Erosivity Distribution in the Hengduan Mountains. Land 2023, 12, 1435. [Google Scholar] [CrossRef] [Scilit]
  65. Zhang, M.; Li, J.; Li, N. Steep Orographic Effects on Local Precipitation in the Hengduan Mountain Region: Insights from an Idealized Modeling Perspective. Q. J. R. Meteorol. Soc. 2025, 151, e4931. [Google Scholar] [CrossRef] [Scilit]
  66. Li, B.Y. On the Boundaries of the Hengduan Mountains. Mt. Res. 1987, 2, 74–82. (In Chinese) [Google Scholar]
  67. Li, Z.S.; He, Y.Q.; Xin, H.J.; Wang, C.F.; Jia, W.X.; Zhang, W.; Liu, J. Spatiotemporal variations of temperature and precipitation in the Hengduan Mountains region of China during 1960–2008. Acta Geogr. Sin. 2010, 65, 563–579. (In Chinese) [Google Scholar]
  68. Tao, W.; Huang, G.; Wang, P.; Wang, Y.; Gong, H.; Dong, D. The Onset and Cessation of Rainy Season over the Hengduan Mountains. Clim. Dyn. 2023, 61, 4773–4791. [Google Scholar] [CrossRef] [Scilit]
  69. Dong, D.; Tao, W.; Lau, W.K.M.; Li, Z.; Huang, G.; Wang, P. Interdecadal Variation of Precipitation over the Hengduan Mountains during Rainy Seasons. J. Clim. 2019, 32, 3743–3760. [Google Scholar] [CrossRef] [Scilit]
  70. Zhang, L.; Li, X.; Zheng, D.; Zhang, K.; Ma, Q.; Zhao, Y.; Ge, Y. Merging Multiple Satellite-Based Precipitation Products and Gauge Observations Using a Novel Double Machine Learning Approach. J. Hydrol. 2021, 594, 125969. [Google Scholar] [CrossRef] [Scilit]
  71. Skofronick-Jackson, G.; Petersen, W.A.; Berg, W.; Kidd, C.; Stocker, E.F.; Kirschbaum, D.B.; Kakar, R.; Braun, S.A.; Huffman, G.J.; Iguchi, T.; et al. The Global Precipitation Measurement (GPM) Mission for Science and Society. Bull. Am. Meteorol. Soc. 2017, 98, 1679–1695. [Google Scholar] [CrossRef] [Scilit] [PubMed]
  72. Chen, H.; Wen, D.; Du, Y.; Xiong, L.; Wang, L. Errors of Five Satellite Precipitation Products for Different Rainfall Intensities. Atmos. Res. 2023, 285, 106622. [Google Scholar] [CrossRef] [Scilit]
  73. Li, L.; Chen, X.; Ma, Y.; Zhao, W.; Zuo, H.; Liu, Y.; Cao, D.; Xu, X. Implications for Validation of IMERG Satellite Precipitation in a Complex Mountainous Region. Remote Sens. 2023, 15, 4380. [Google Scholar] [CrossRef] [Scilit]
  74. Yin, S.Q.; Zhang, W.B.; Liu, S.H. Spatial Distribution of Rainfall Erosivity in China Based on High-Density Station Network. China Soil Water Conserv. 2013, 10, 45–50. (In Chinese) [Google Scholar]
  75. Kruskal, W.H.; Wallis, W.A. Use of Ranks in One-Criterion Variance Analysis. J. Am. Stat. Assoc. 1952, 47, 583–621. [Google Scholar] [CrossRef] [Scilit]
  76. Tomczak, M.; Tomczak, E. The Need to Report Effect Size Estimates Revisited: An Overview of Some Recommended Measures of Effect Size. Trends Sport Sci. 2014, 21, 19–25. [Google Scholar]
  77. Song, Y.; Xu, S.; Lettenmaier, D.P.; Beck, H.E.; Chen, X.; Yu, Z.; Dong, N.; Cao, Q.; Fu, X.; Yang, Z.; et al. Intensification of extreme precipitation across the Tibetan Plateau and its climatic drivers over 1982–2020. Glob. Planet. Change 2026, 256, 105182. [Google Scholar] [CrossRef] [Scilit]
  78. Huang, J.; Zhou, X.; Wu, G.; Xu, X.; Zhao, Q.; Liu, Y.; Duan, A.; Xie, Y.; Ma, Y.; Zhao, P.; et al. Global climate impacts of land-surface and atmospheric processes over the Tibetan Plateau. Rev. Geophys. 2023, 61, e2022RG000771. [Google Scholar] [CrossRef] [Scilit]
  79. Wang, Y.; Wang, G.; Sun, J.; Song, C.; Lin, S.; Sun, S.; Hu, Z.; Wang, X.; Sun, X. The impact of extreme precipitation on water use efficiency along vertical vegetation belts in Hengduan Mountain during 2001 and 2020. Sci. Total Environ. 2024, 943, 173638. [Google Scholar] [CrossRef] [Scilit] [PubMed]
  80. Wang, L.; Li, Y.; Gan, Y.; Zhao, L.; Qin, W.; Ding, L. Rainfall erosivity index for monitoring global soil erosion. Catena 2024, 234, 107593. [Google Scholar] [CrossRef] [Scilit]
  81. Wei, L.; Jiang, S.; Ren, J.; Yong, B.; Hua, Z.; Zhang, L.; Zeng, L.; Duan, Z.; Xu, C.-Y. A time-varying weighted merging method for integrating multisource precipitation data considering error variations. J. Hydrol. 2025, 664, 134547. [Google Scholar] [CrossRef] [Scilit]
  82. Yue, T.; Xie, Y.; Yin, S.; Yu, B.; Miao, C.; Wang, W. Effect of time resolution of rainfall measurements on the erosivity factor in the USLE in China. Int. Soil Water Conserv. Res. 2020, 8, 373–382. [Google Scholar] [CrossRef] [Scilit]
Figure 2. Schematic diagram of hotspot identification based on threshold-based partitioning.
Remotesensing 18 02772 g002
Figure 3. Comparison of statistical accuracy metrics for three precipitation products.
Remotesensing 18 02772 g003
Figure 4. Comparison of categorical detection metrics (POD, FAR, ACC, and CSI) among the three precipitation products.
Remotesensing 18 02772 g004
Figure 5. Spatial distribution of precipitation of varying intensities and rainfall erosivity (2005–2024).
Remotesensing 18 02772 g005
Figure 6. Spatial distribution characteristics of precipitation contribution (CP), erosivity contribution (CR), and erosion amplification factor (AF) for extreme precipitation events of varying intensities.
Remotesensing 18 02772 g006
Figure 7. Variation in rainfall erosivity across elevation, slope, and mountain-type classes under different precipitation-intensity categories.
Remotesensing 18 02772 g007
Figure 8. Rainfall erosivity hotspots associated with PRCPTOT, R95p, and R99p.
Remotesensing 18 02772 g008
Figure 9. Mountain-type composition of rainfall erosivity hotspots across precipitation-intensity categories.
Remotesensing 18 02772 g009
Table 2. Summary of the precipitation datasets.
DatasetsTemporal ResolutionSpatial
Resolution
Data Source
ChinaMetDaily0.01°/0.1°National Cryosphere Desert Data Center
CHM_PRE V2Daily0.1°National Tibetan Plateau Data CenterThird Pole Environment Data Center
IMERGDaily0.1°NASA
Table 3. Three precipitation intensity indices defined by the Expert Team on Climate Change Detection and Indices (ETCCDI).
IndexNameDescriptionsUnit
PRCPTOTAnnual precipitationAnnual total precipitation from wet days with daily precipitation ≥ 1 mmmm
R95pHeavy rainfallCumulative precipitation from days exceeding the 95th percentile of daily precipitation during the study periodmm
R99pExtreme heavy rainfallCumulative precipitation from days exceeding the 99th percentile of daily precipitation during the study periodmm
Table 4. Relative deviation (RD, %) of rainfall erosivity across precipitation products and intensity levels.
ProductsRD
PRCPTOTR95pR99p
ChinaMet23.4880.1887.33
CHM_PRE18.9525.3931.82
IMERG43.7482.1387.44
Table 5. Kruskal–Wallis test results for rainfall erosivity across different topographic classes.
Topographic FactorRainfall ErosivityH Statisticp-Valueε2 (Effect Size)
ElevationPRCPTOT31,480.04<0.0010.682
R95p32,520.98<0.0010.704
R99p31,831.38<0.0010.689
Mountain typePRCPTOT44,766.29<0.0010.607
R95p45,759.54<0.0010.621
R99p44,513.76<0.0010.604
SlopePRCPTOT905.28<0.0010.036
R95p1206.41<0.0010.049
R99p1437.08<0.0010.058
Table 6. Mean elevation and slope of rainfall erosivity hotspots across precipitation-intensity categories.
Hotspot LevelPRCPTOTR95pR99p
M_Elevation (m)M_Slope (°)M_Elevation (m)M_Slope (°)M_Elevation (m)M_Slope (°)
Weak2349.368.772315.739.632303.989.67
Medium1990.039.122094.849.102188.179.73
Intense1972.058.601958.658.532374.1512.28
Extreme2735.1915.092791.9214.79
Disclaimer/Publisher’s Note: The statements, opinions and data contained in all publications are solely those of the individual author(s) and contributor(s) and not of MDPI and/or the editor(s). MDPI and/or the editor(s) disclaim responsibility for any injury to people or property resulting from any ideas, methods, instructions or products referred to in the content.