Article

High-Resolution Typhoon Risk Assessment Based on Geospatial Big Data: A Case Study of Haikou, China


1
School of Public Administration, Hebei University of Economics and Business, Shijiazhuang 050061, China
2
Key Laboratory of Land Surface Pattern and Simulation, Institute of Geographic Sciences and Natural Resources Research, Chinese Academy of Sciences, Beijing 100101, China
3
Hebei Collaborative Innovation Center for Urban-Rural Integrated Development, Shijiazhuang 050061, China
*
Author to whom correspondence should be addressed.
Remote Sens. 2026, 18(16), 2770; https://doi.org/10.3390/rs18162770
Submission received: 15 June 2026 / Revised: 4 August 2026 / Accepted: 12 August 2026 / Published: 16 August 2026
(This article belongs to the Section Remote Sensing for Geospatial Science)

Highlights

What are the main findings?
  • A high-resolution framework was developed for typhoon risk mapping.
  • Mitigation capacity was spatially quantified across three capacity dimensions.
What are the implications of the main findings?
  • Multi-source geospatial big data were integrated with remote sensing and GIS.
  • High-risk zones covered 18.99% of Haikou and matched fatality records.

Abstract

Typhoons often cause severe casualties, property losses, and infrastructure damage, and high-resolution spatial risk assessment is an important basis for developing effective disaster prevention and mitigation strategies. However, most existing typhoon risk assessments are conducted at relatively coarse spatial scales and provide limited representation of intra-urban differences in mitigation capacity. To address this gap, this study takes Haikou, China, as the study area and develops a spatially detailed mitigation-capacity indicator system. Mitigation capacity is incorporated as a key dimension into the conventional hazard–exposure–vulnerability framework. Based on multi-source geospatial data, data mining, and spatial analysis, a risk assessment system comprising 23 indicators was established. Indicator weights were determined using the analytic hierarchy process, and all indicator layers were harmonized to generate a typhoon risk map on a 30 m analytical grid. The results show that the high-resolution risk maps can effectively characterize the spatial extent and level differentiation of typhoon risk while revealing significant spatial heterogeneity in risk at the fine grid scale. In Haikou, 18.99% of the area is classified as being at high and very high risk levels, mainly distributed along the coastal zones of Shishan Town, Xixiu Town, Changliu Town, Lingshan Town, and Yanfeng Town. A preliminary plausibility check was conducted using eight georeferenced typhoon-related fatality locations recorded from 2015 to 2024. Five were located in high- or very-high-risk zones. Given the limited sample size, this comparison does not constitute formal statistical validation, but the observed spatial correspondence provides preliminary support for the plausibility of the assessment results. This study provides spatially explicit decision support for identifying intra-urban variations in typhoon risk, delineating priority areas for disaster mitigation, and optimizing the allocation of mitigation resources.

1. Introduction

Typhoons are among the most frequent natural hazards affecting most coastal regions worldwide [1,2]. Accompanied by high-speed winds, extreme rainfall, and storm surges, typhoons often result in casualties, property losses, and widespread damage to infrastructure [3,4,5]. Recent studies have shown that, under future climate warming, increases in sea surface temperature may intensify typhoon strength [6,7], which may further exacerbate typhoon risk in coastal areas [6,7]. The western North Pacific is one of the most active tropical cyclone basins worldwide, with approximately 25 typhoons forming annually on average [8]. Located adjacent to the Northwest Pacific, China is affected by typhoons almost every year, resulting in severe losses [9,10]. Historical records indicate that, from 2000 to 2014, typhoons caused more than USD 6 billion in economic losses annually on average [11]. Owing to differences in the natural environment, socioeconomic characteristics, and mitigation resources, typhoon disaster risks and associated losses vary substantially across regions. Therefore, high-resolution typhoon risk assessment is urgently needed to accurately identify intra-regional risk levels and the locations of high-risk areas, thereby supporting the development of targeted disaster mitigation plans and strategies.
According to UNISDR [12], disaster risk can be defined as “the potential disaster losses, in lives, health, livelihoods, assets, and services, that could occur to a particular community or society over a specified future time period”. Risk is generally regarded as the outcome of interactions among hazards, exposed elements, and their specific vulnerability. The Hazard–Exposure–Vulnerability (HEV) framework has been extensively applied in natural hazard risk assessment to characterize potential losses that may be caused by specific hazardous events. However, recent studies have indicated that disaster consequences are not solely determined by hazard intensity, the magnitude of exposed elements, and their vulnerability, but are also substantially influenced by regional mitigation capacity. Mitigation capacity is defined as the resources and capabilities a region can provide to reduce risk and vulnerability. Greater mitigation capacity can effectively reduce the actual damage to exposed assets and hamper the transformation of hazards into disaster losses. Consequently, mitigation capacity is increasingly recognized as a critical dimension that cannot be overlooked in comprehensive disaster risk assessment. On this basis, this study extends the conventional HEV framework by incorporating mitigation capacity and proposes an integrated Hazard–Exposure–Vulnerability–Mitigation Capacity (HEV–MC) risk assessment framework, aiming to more comprehensively characterize regional typhoon risk and its spatial heterogeneity. To date, numerous scholars have conducted a series of risk assessment studies for different natural hazards. For example, assessment systems have been developed for floods [13,14,15,16], earthquakes [17,18], debris flows [19,20], landslides [21,22], and droughts [23,24], and have been validated in countries such as China, Iran, Bangladesh, and the United States. For typhoon risk assessment, multi-indicator-based risk assessment methods have been widely applied [25]. Scholars commonly select indicators representing multiple risk components to construct typhoon risk assessment frameworks [26,27,28], and employ principal component analysis [29], the analytic hierarchy process [30], the fuzzy analytic hierarchy process [27], and the entropy weight method [31] to calculate regional typhoon risk levels.
In existing studies, fine-scale assessment of typhoon risk remains insufficient. On the one hand, most typhoon risk assessments are conducted at relatively coarse spatial scales, making it difficult to capture intra-regional spatial heterogeneity. For example, assessment scales are often based on provinces [32], prefecture-level cities [33,34], and counties [35,36,37]. Risk assessments based on administrative units assume that risk levels within an administrative unit are homogeneous, and that risk differences exist only between different administrative areas [26]. However, the natural environment, exposure, and mitigation resources within administrative areas often exhibit significant spatial differences [38], which may lead to varying internal risk levels. Therefore, assessments based on administrative boundaries may overlook the spatial heterogeneity of risk within regions. A fine-grid risk assessment can better capture local spatial variations within urban areas and identify priority risk zones within towns and subdistricts. The resulting information can provide an important basis for emergency resource allocation, evacuation and shelter planning, and the prioritized protection of critical infrastructure. On the other hand, the limited number of studies that have conducted high-resolution risk assessments have mostly focused on using numerical simulation techniques to refine the simulation of hazards, such as rainfall, strong winds, and storm surges [39,40,41,42]. For instance, Nakamura and Mall [43] quantitatively assessed the impacts of storm surges along the Japanese coast through high-resolution numerical simulations. However, these studies have neglected the high-resolution quantification of mitigation capacity. Mitigation capacity is closely associated with monitoring and early-warning facilities, transportation accessibility, medical response, shelters, and the disaster resistance of buildings. These factors jointly influence the efficiency of information acquisition, evacuation, and emergency response. As a key factor regulating disaster losses and vulnerability, mitigation capacity has important implications for risk assessment due to its spatial variability [44]. Compared with hazard, exposure, and vulnerability, mitigation capacity is more comprehensive and dynamic. Relevant data are often dispersed across different administrative departments and are commonly available only as administrative statistics or facility locations. These characteristics make consistent quantification and fine-scale spatial representation difficult. Consequently, previous studies have often simplified or omitted mitigation capacity in risk assessment frameworks, limiting the identification of intra-urban differences and their effects on risk [45,46].
In recent years, the rapid development of high-resolution remote sensing and multi-source geospatial big data has provided a data foundation for the refined quantification of the components of typhoon risk, including hazard, exposure, vulnerability, and mitigation capacity [36]. Effectively mining and integrating these multi-source data to achieve high-resolution spatial representation of risk elements has become a key prerequisite for high-spatial-resolution risk assessment. At present, the rapid development of remote sensing technology and GIS has provided technical support for fine-scale typhoon risk assessment [47,48]. Remote sensing technology has enhanced the capacity to obtain spatial environmental data from satellite imagery, such as information on land use, building height, and coastal vegetation [49]. GIS-based spatial analysis methods support the collection, processing, and integration of multi-source data, and can integrate spatial and non-spatial information to create high-resolution spatial layers for each indicator, thereby enabling high-resolution mapping at the grid scale.
Typhoon risk is not the direct outcome of a single hazardous process; rather, it is a complex spatial phenomenon shaped by the combined effects of hazard, exposure, vulnerability, and mitigation capacity, and therefore exhibits significant spatial heterogeneity. Spatial statistical methods, such as Moran’s I and the G-statistic, are effective tools for identifying the spatial association of geographic phenomena and their significance levels, and can clarify the clustering characteristics and spatial distribution patterns of typhoon risk [30]. However, the application of spatial statistical methods for characterizing the spatial patterns and clustering characteristics of typhoon risk remains relatively less explored compared with conventional risk assessment approaches. Previous studies have applied spatial statistical techniques to investigate the spatial heterogeneity and hotspot distributions of typhoon risk in mainland China [36] and Guangdong Province [37], demonstrating the potential of these methods for identifying spatial risk patterns. Therefore, systematically revealing the spatial clustering patterns and hotspot areas of typhoon risk using spatial statistical methods is of great significance for supporting refined risk management.
In view of the above, this study develops a high-resolution typhoon risk assessment framework to address the relatively coarse spatial scales and insufficient quantification of mitigation capacity in existing assessments. The framework comprises four dimensions: hazard, exposure, vulnerability, and mitigation capacity. Multi-source geospatial and remote-sensing data are integrated through disaster-process-oriented data mining, feature extraction, and GIS-based spatial analysis. On this basis, typhoon risk is assessed on a 30 m × 30 m analytical grid, and spatial statistical methods are used to identify risk patterns and priority areas. The main contribution of this study is the fine-scale spatial quantification of mitigation capacity and its integration into a comprehensive typhoon risk assessment framework. The results provide spatially explicit support for identifying intra-urban risk differences, delineating priority areas for disaster mitigation, and optimizing resource allocation.

2. Materials and Methods

2.1. Study Area

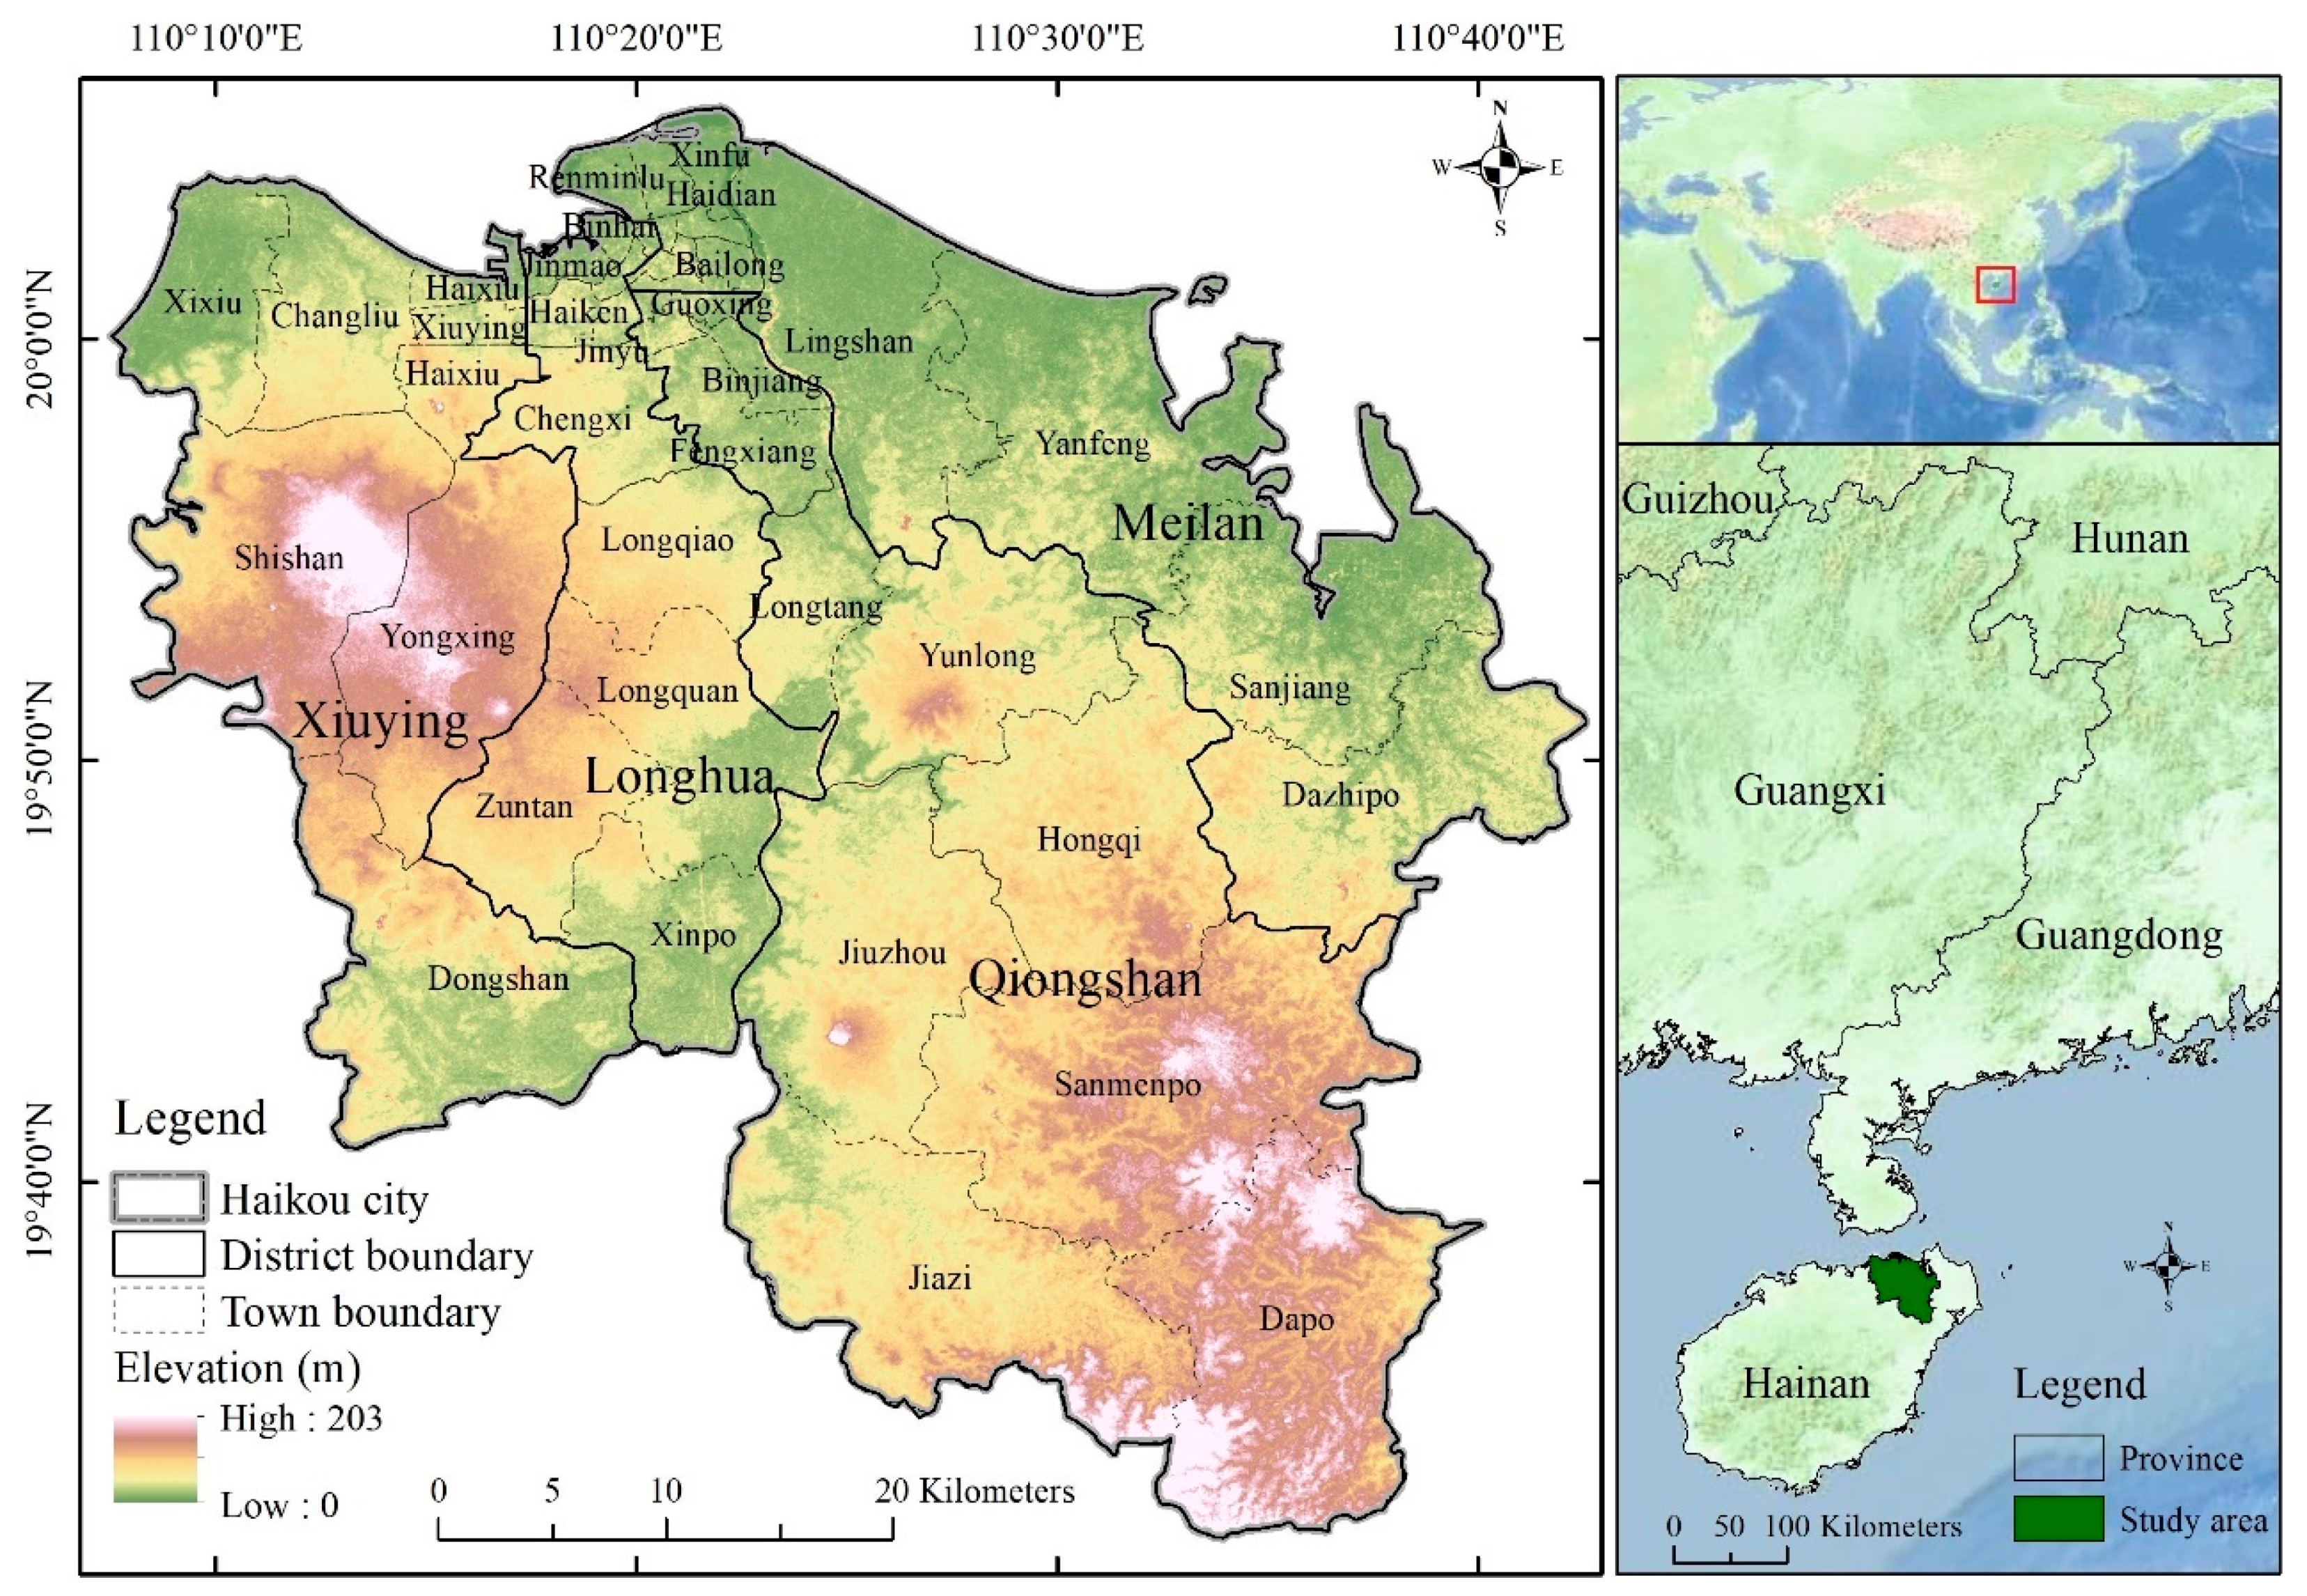
Haikou City (19°31′–20°04′N, 110°07′–110°42′E) is located on northern Hainan Island and serves as the capital of Hainan Province, covering a total area of 3126.83 km2 (Figure 1). The city administers four districts, namely Xiuying, Longhua, Qiongshan, and Meilan, comprising 21 subdistricts and 22 towns. By the end of 2020, Haikou had a permanent resident population of 2.8734 million, with an urban population share of 81.8%, and its per capita gross regional product was approximately USD 9179. Owing to its geographical location and coastal environment, Haikou has long been exposed to a high threat of typhoon disasters. According to historical typhoon track records, a total of 36 typhoons made landfall in Haikou between 1950 and 2018, causing varying degrees of disaster losses. For example, Super Typhoon Rammasun caused direct economic losses of approximately USD 798 million after making landfall in Haikou. Therefore, conducting high-resolution typhoon risk assessment and accurately identifying intra-urban risk levels and their key influencing factors are of great significance for developing targeted mitigation strategies, optimizing the allocation of mitigation resources, and reducing disaster risk.

2.2. Data Sources

In this study, multi-source geospatial big datasets were obtained from multiple data platforms and institutions. For example, typhoon track data were derived from the Tropical Cyclone Data Center of the China Meteorological Administration, including information such as typhoon name, identification number, central position (longitude and latitude), minimum central pressure, and typhoon intensity. Remote sensing data included a digital elevation model and land-use data, while meteorological data included rainfall and wind speed data. Vector data included road networks at different levels in Haikou, coastal dikes, coastlines, administrative boundary data of Haikou, and point-of-interest (POI) data for infrastructure such as healthcare and educational facilities. Detailed information on the multi-source geospatial big data used in this study is presented in Table 1. The temporal coverage of each indicator depends on data availability and its role within the risk framework. Historical meteorological and oceanographic observations were used to characterize the background typhoon hazard, whereas the latest available data from 2023–2024 were used to represent current exposure, vulnerability, and mitigation capacity. The final assessment therefore represents current-condition baseline risk under a historical hazard background.

2.3. Typhoon Risk Assessment Indicators and Mapping

In this study, the indicators for typhoon risk components were selected based on an extensive review of the literature [10,35,36] while also considering data availability and their relevance to typhoon risk. Finally, 23 indicators were selected under four risk components: hazard, exposure, vulnerability, and mitigation capacity. GIS and remote sensing techniques were used to preprocess each indicator and generate spatial raster layers. Each spatial raster layer was produced with a consistent spatial resolution of 30 m × 30 m. It should be noted that the 30 m grid serves only as a common analytical unit for the spatial harmonization of multi-source data and integrated risk computation. It does not imply that all input datasets have a native observational resolution of 30 m. The following subsections provide a detailed description of the characteristics of the selected indicators and their spatial mapping methods.

2.3.1. Mapping of Mitigation Capacity Sub-Indicators

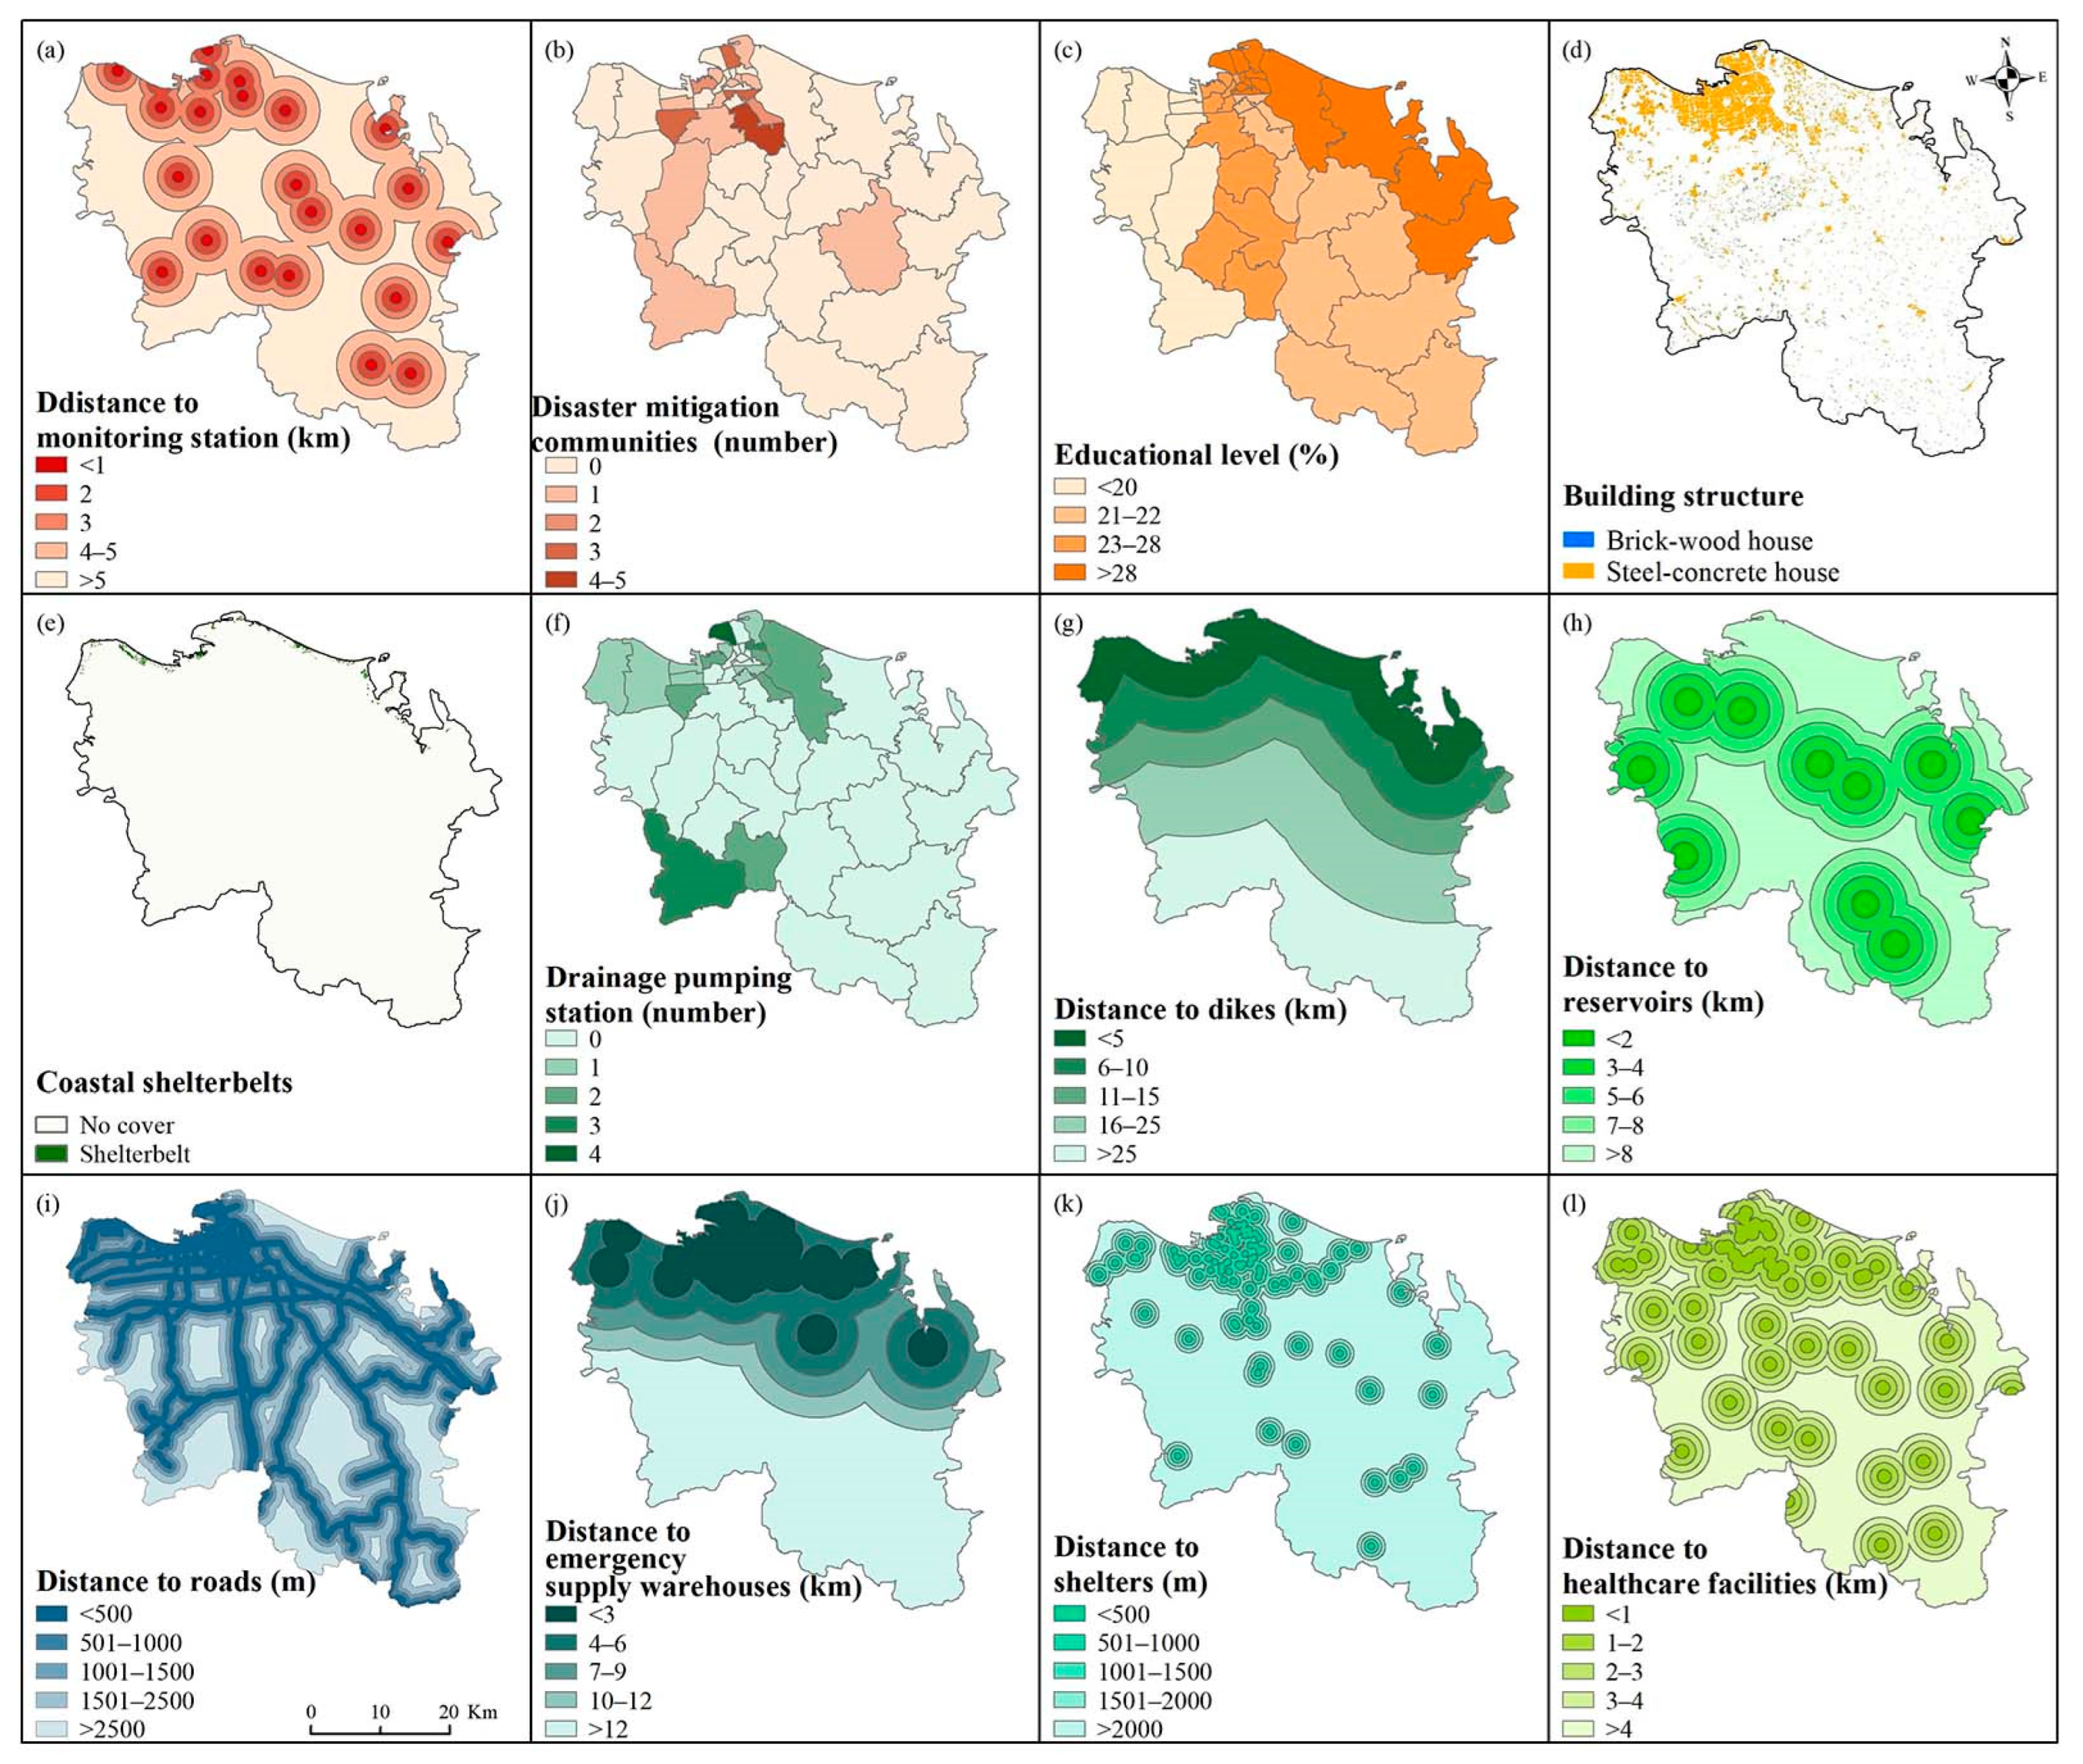
Previous spatial risk assessment studies have either not considered mitigation capacity or have included only a limited number of mitigation capacity indicators [30,50], which may affect the accuracy of risk assessment and constrain the formulation and implementation of mitigation measures [46,51]. Based on multi-source geospatial big data, this study constructs an indicator system for assessing mitigation capacity from the perspective of the entire disaster process, including the pre-disaster, during-disaster, and post-disaster phases [52]. Of the 23 indicators included in the complete typhoon risk assessment system, 12 were used to characterize mitigation capacity. These indicators were further grouped into three subdimensions: prevention capacity, resistance capacity, and rescue capacity. Remote sensing and GIS techniques were then used to achieve high-resolution spatial quantification of these indicators (Figure 2).
Prevention capacity refers to the ability of a region to reduce the likelihood of disaster occurrence or mitigate potential disaster losses before a disaster occurs through measures such as monitoring and early warning, public education, and risk prevention. It is mainly represented by indicators such as monitoring stations, disaster mitigation demonstration communities, and educational level. Advanced monitoring and early-warning platforms provide real-time observational data and support dynamic forecasting and warning updates for rainfall, wind speed, and typhoon tracks. Given the inherent uncertainty in forecasts, this indicator represents a region’s capacity to support monitoring and early warning rather than an absolute guarantee of forecast accuracy. Information on monitoring stations was obtained from the Haikou Meteorological Bureau and verified through field investigations. Based on the GIS platform, the Euclidean Distance tool was used to generate a spatial distance map to typhoon monitoring stations. Disaster mitigation demonstration communities generally have relatively well-developed comprehensive disaster emergency response plans and regularly conduct disaster mitigation publicity, education, and training activities; therefore, a larger number of disaster mitigation demonstration communities within a region indicates stronger prevention capacity. Data on disaster mitigation demonstration communities were obtained from the Haikou Emergency Management Bureau and included the number of such communities in each town and subdistrict. The statistical records were first matched to the corresponding administrative boundary layers using town and subdistrict names. The attribute join tool in ArcGIS 10.7 was then used to assign the number of demonstration communities to the corresponding administrative units, thereby generating the spatial distribution layer. Educational attainment can, to some extent, reflect residents’ ability to understand warning information and take protective action. It was therefore used as a proxy indicator of prevention capacity. However, higher educational attainment does not necessarily translate into greater risk awareness. Its effect may also depend on disaster experience, risk communication, and community-based training. In this study, a monotonic relationship was adopted for spatial assessment, and potential nonlinear or threshold effects were not explicitly modeled. Educational attainment data were obtained from the Haikou Statistical Bureau and represented by the proportion of residents with higher education in each district. The statistical records were first matched to the district-level administrative boundary layer using district names. The attribute join tool in ArcGIS 10.7 was then used to assign the higher-education proportion to the corresponding district units, thereby generating the spatial distribution layer of educational attainment in Haikou.
Resistance capacity refers to the ability of a region to rely on engineering facilities and protective systems to withstand disaster impacts and reduce disaster losses during the occurrence of natural hazards. It is mainly represented by indicators such as building structure, coastal shelterbelts, dikes, reservoirs, and drainage pumping stations. Building structure is one of the key indicators characterizing regional resistance capacity. In general, reinforced concrete buildings have stronger wind, rain, and flood resistance than brick–timber buildings, enabling them to more effectively withstand the impacts of typhoon-induced strong winds, heavy rainfall, and flooding, and thereby enhancing residents’ capacity to cope with typhoon events [53]. Building-structure types were determined primarily through field surveys. The dominant building structures in Haikou include reinforced-concrete, brick–concrete, and brick–timber structures. Reinforced-concrete and brick–concrete buildings generally have greater resistance to strong winds and heavy rainfall than brick–timber buildings. Therefore, the former two types were grouped into one category, while brick–timber buildings were classified separately. High-resolution optical imagery available in Google Earth Pro and acquired between April and October 2024 was then used to verify building locations, roof forms, and spatial distributions. Building footprints were subsequently delineated through visual interpretation. Coastal shelterbelts play an important role in attenuating the impacts of typhoon-induced strong winds and storm surges [54]. Coastal shelterbelts in Haikou were identified on the basis of field surveys. Continuous or semi-continuous belts of woody vegetation distributed along the coast were defined as coastal shelterbelts when they provided wind and coastal protection. Visual interpretation was then conducted using high-resolution Google Earth imagery acquired between April and October 2024. Interpretation criteria included canopy characteristics, belt-shaped morphology, vegetation continuity, and spatial relationships with the coastline. The spatial extent of the coastal shelterbelts was delineated through visual interpretation. Their boundaries were then checked and refined using the field-survey records. Reservoirs and dikes are important engineering measures for coping with typhoon-induced rainstorms and associated flooding. Based on the ArcGIS 10.7 platform, the Euclidean Distance tool was used to generate spatial distance maps from each grid cell to reservoirs and dikes, respectively, to characterize the spatial accessibility of their engineering protection services. Drainage pumping stations help alleviate the risk of urban waterlogging induced by heavy rainfall and reduce casualties and property losses. The number of drainage pumping stations in each district was obtained from the Haikou Water Affairs Bureau, and the spatial distribution map of drainage pumping stations in Haikou was generated using the attribute-join tool in ArcGIS 10.7.
Rescue capacity refers to the ability of a region to carry out disaster response and recovery during or after a disaster through measures such as emergency rescue, material allocation, population resettlement, and medical assistance. It is mainly represented by indicators such as emergency supply warehouses, road accessibility, shelters, and medical facilities. Road accessibility and emergency supply reserves are key factors in ensuring the efficiency of emergency rescue and the capacity for material transportation. The road system was classified by hierarchy into urban primary roads, urban secondary roads, expressways, national roads, provincial roads, and county roads. The construction of typhoon shelters is an important mitigation measure for reducing population exposure and ensuring temporary resettlement for affected people. When typhoon disasters occur, shelters can provide temporary refuge and basic accommodation conditions for affected populations [55]. A larger number of emergency shelters with a more dispersed spatial distribution is more conducive to the rapid evacuation and nearby resettlement of affected populations. In China, in addition to government-designated shelters, public facilities such as public gymnasiums and schools can also serve as emergency shelters for typhoon disasters [38]. Considering that typhoon-induced strong winds and heavy rainfall may affect the safety of outdoor sites, outdoor emergency shelters such as parks and green spaces were not included in this study. Medical conditions are also an important indicator for measuring rescue capacity. Before and after typhoon landfall, local healthcare facilities can provide emergency medical services for affected populations, thereby reducing the impacts of typhoon disasters on residents’ health. The medical facilities considered in this study mainly included general hospitals, township health centers, and community health service centers. Based on the ArcGIS 10.7 platform, the Euclidean Distance tool was used to generate spatial distance layers from each grid cell to roads, emergency supply warehouses, typhoon shelters, and medical facilities, respectively, to characterize the spatial accessibility of rescue resources and emergency services.

2.3.2. Mapping of Hazard Sub-Indicators

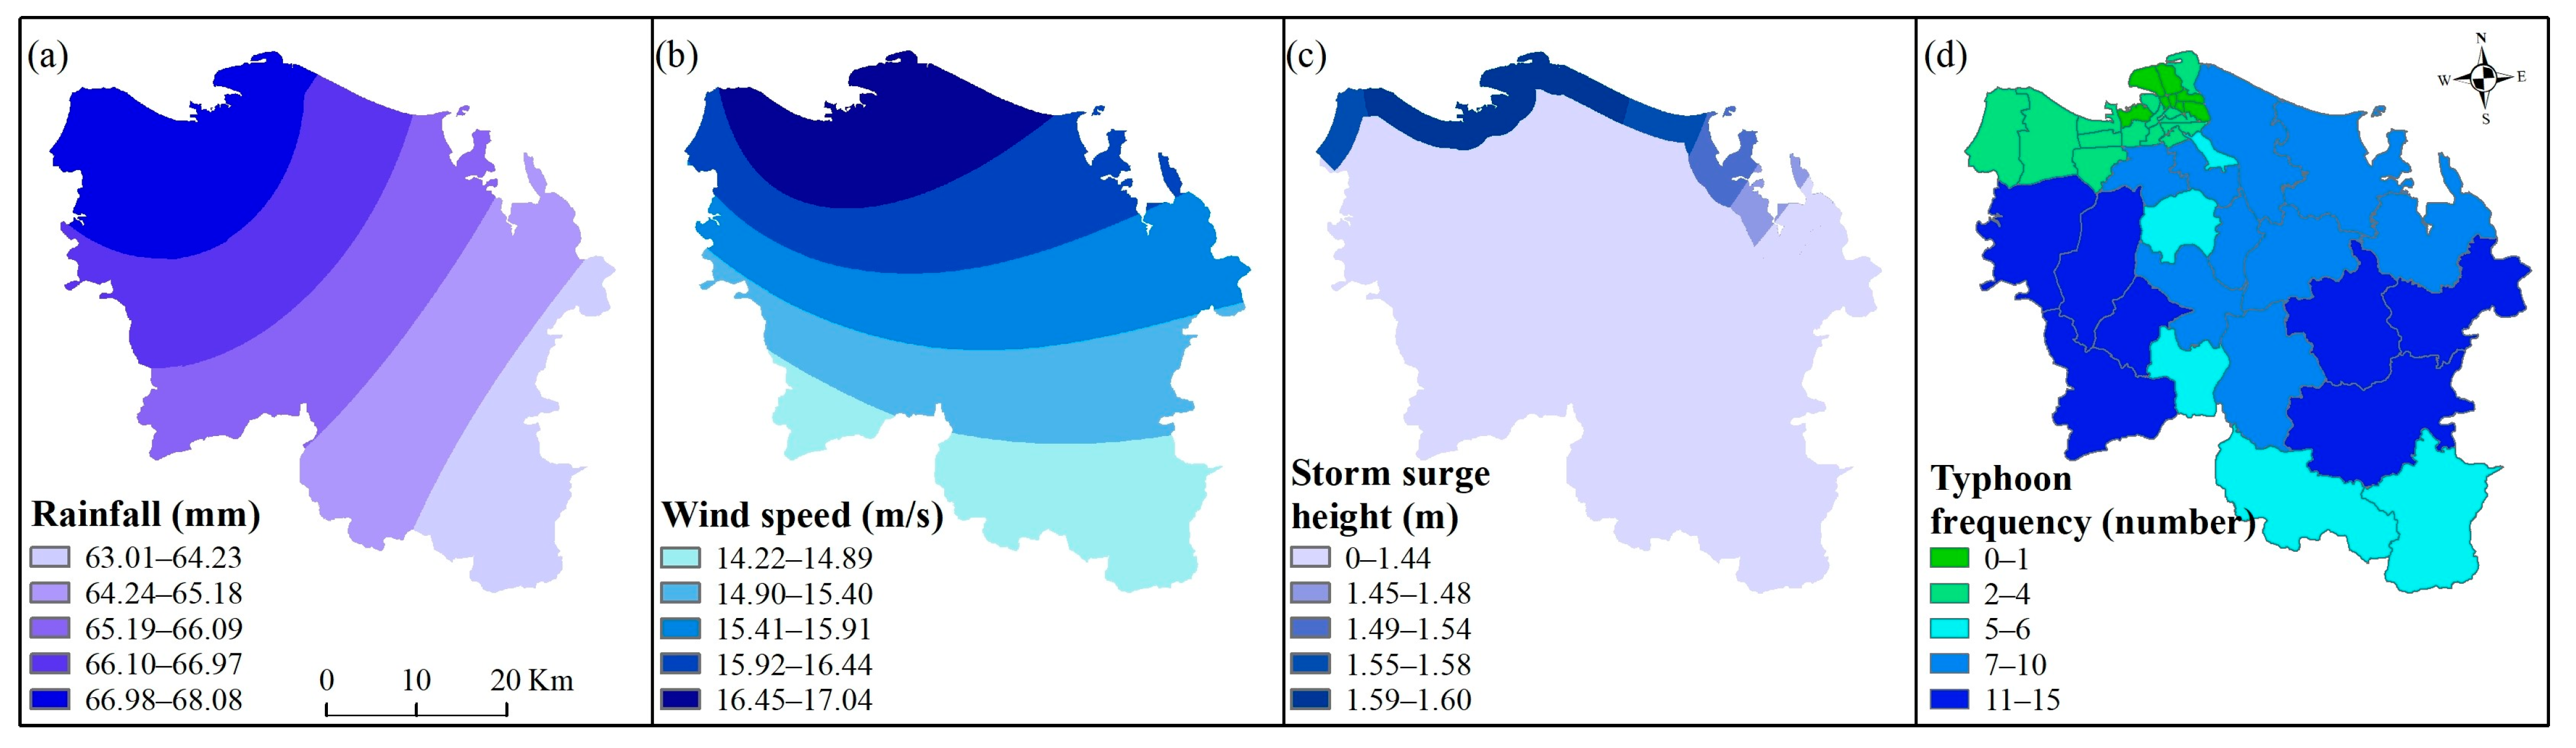
This study selected four indicators, namely rainfall, wind speed, typhoon frequency, and storm surge, to characterize typhoon hazard (Figure 3). It should be noted that the rainfall, wind-speed, and storm-surge layers were derived from spatial interpolation of station observations. Their effective spatial resolution is constrained by station density, inter-station distance, spatial autocorrelation structure, and the selected interpolation method rather than by the cell size of the output raster. The 30 m grid was used only for spatial alignment of the multi-source layers and integrated risk computation. The interpolated hazard fields were intended to represent long-term regional spatial backgrounds and broad gradients across Haikou and its surrounding areas, rather than local hazard intensity or precise extremes at the 30 m scale.
Typhoon wind speed is an important factor affecting the safety of buildings and infrastructure [56,57], and its intensity largely determines the extent of damage to the natural environment and built landscape in affected areas [58]. Typhoon processes are usually accompanied by extreme rainfall and may induce flooding, posing serious threats to buildings, farmland, and infrastructure. Based on meteorological observations from county-level stations across Hainan Island during 2015–2024, the maximum daily rainfall and maximum wind speed during each typhoon passage were first extracted for each station. The event-specific maxima were then averaged over all typhoon events during the study period to derive the mean event-maximum daily rainfall and mean event-maximum wind speed at each station. These indicators characterize the long-term spatial patterns of extreme rainfall and strong-wind intensity associated with typhoon events. Kriging interpolation was subsequently applied to generate the spatial distributions of the two indicators across Hainan Island, and the corresponding layers for Haikou were extracted using ArcGIS 10.7.
Storm surge can induce coastal flooding and cause severe damage to populations, property, and ecological environments in coastal areas. Based on storm surge residual data from tide gauge stations in Hainan Province from 2006 to 2024, this study used the Gumbel distribution method to calculate the return periods of the maximum storm surge residuals at three tide gauge stations, and generated a spatial distribution map of the maximum storm surge residuals across Hainan Island using inverse distance weighting interpolation. On this basis, the spatial distribution layer of storm surge within Haikou was extracted using the spatial analysis tools on the ArcGIS 10.7 platform. It should be noted that the interpolated surface was intended primarily to represent the regional spatial gradient of storm surge residuals within the study area. The layer was converted to a 30 m grid to ensure spatial consistency with the other assessment indicators. However, this conversion does not imply that the original storm surge data have an observational accuracy or effective spatial resolution of 30 m.
Regional typhoon hazard is also closely associated with typhoon landfall frequency. In general, areas with frequent typhoon landfalls are more likely to be affected by typhoon disasters than areas with fewer typhoon landfalls. Based on historical typhoon track data for China from 1950 to 2024, this study screened typhoon events that made landfall in Haikou, counted the number of typhoon landfalls in each town or subdistrict, and generated a typhoon frequency spatial layer using the spatial analysis tools on the ArcGIS 10.7 platform.

2.3.3. Mapping of Exposure and Vulnerability Sub-Indicators

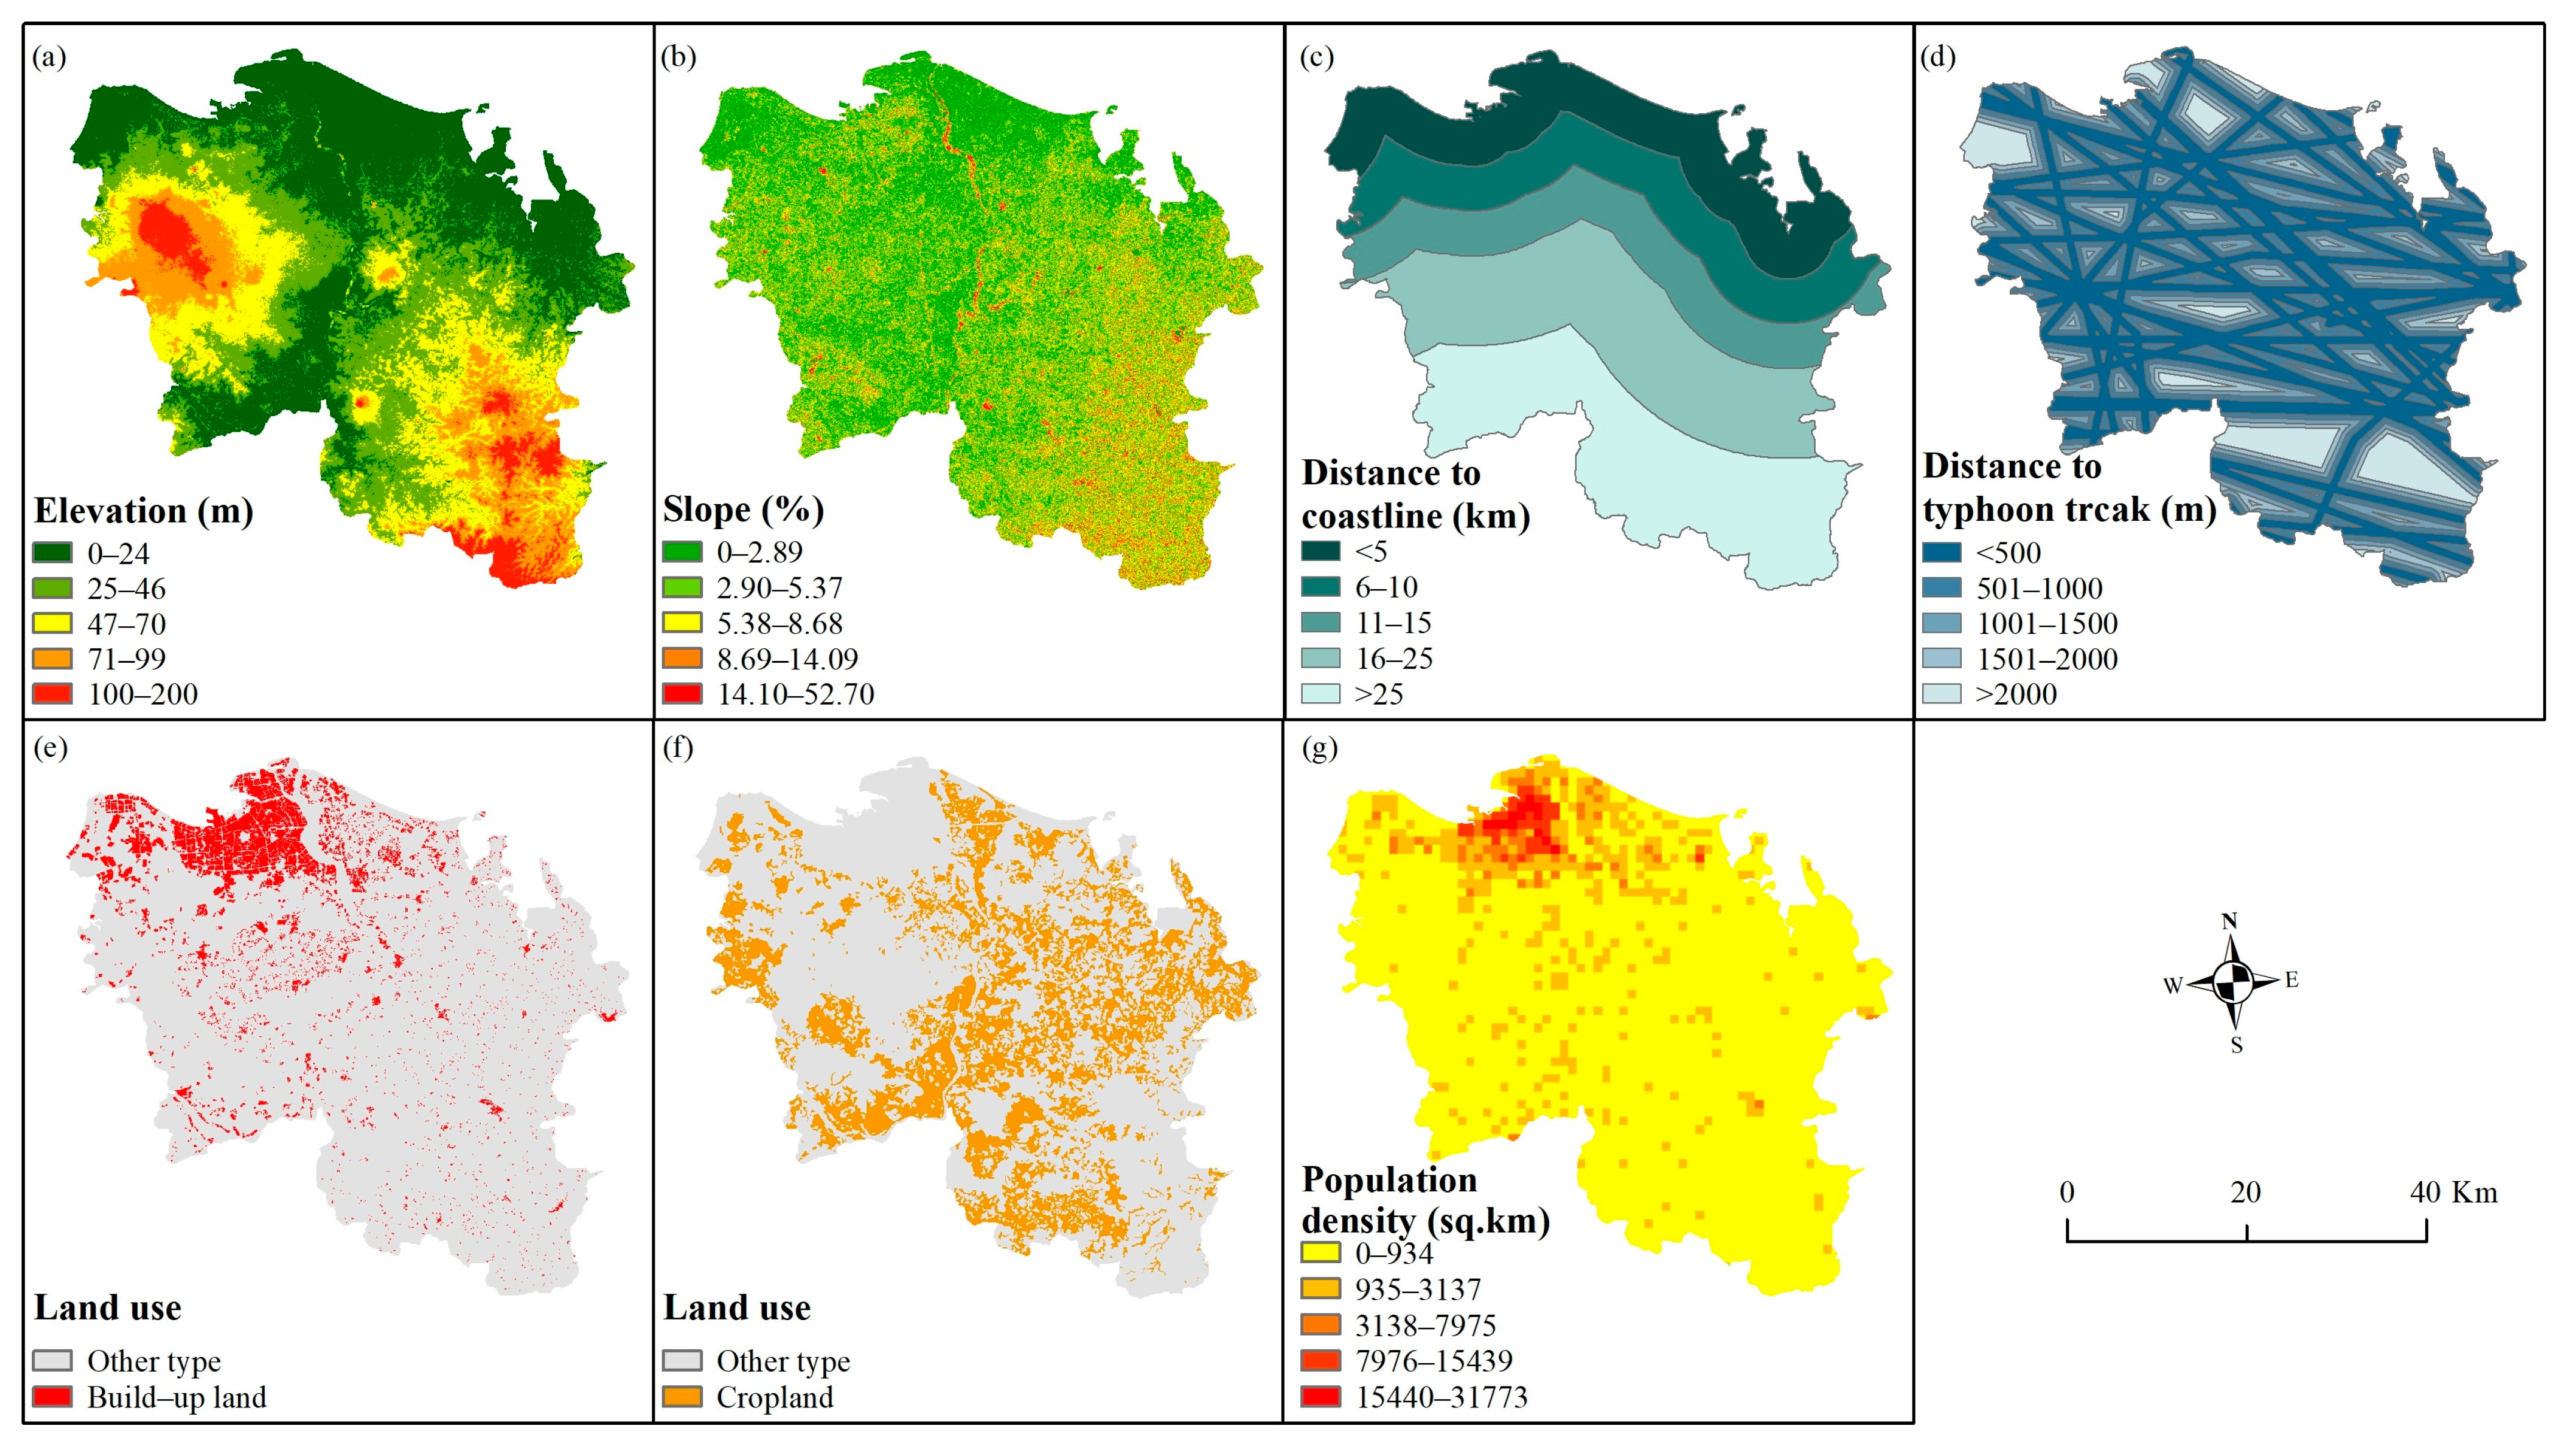
In this study, seven indicators, namely elevation, slope, distance to the coastline, distance to typhoon tracks, population density, built-up land, and cropland, were selected to characterize typhoon exposure and vulnerability (Figure 4). In this study, vulnerability is used in a broad disaster-risk sense and includes physical conditions that influence the susceptibility of exposed elements to typhoon impacts. Within the combined exposure and vulnerability dimension, population density and built-up land primarily represent the spatial concentration of exposed people and assets, whereas elevation and slope characterize physical vulnerability, particularly susceptibility to flooding, runoff concentration, and related typhoon impacts.
Elevation and slope are important topographic factors influencing typhoon vulnerability. Compared with high-elevation and steep-slope areas, low-elevation and gently sloping areas are generally more susceptible to typhoons and their associated impacts, such as flooding and storm surges. Based on a digital elevation model (DEM) with a spatial resolution of 30 m, elevation information for Haikou was extracted, and a slope spatial layer was subsequently generated. Distance to the coastline and distance to typhoon tracks reflect the potential degree to which exposed elements, such as populations and infrastructure, are subject to typhoon-induced strong winds and storm surges. Using the measuring tool in Google Earth, distances from different sections of the study area to the coastline were calculated to generate a coastline distance spatial layer. In addition, based on historical typhoon track data for Haikou from 1950 to 2024, the buffer tool on the ArcGIS 10.7 platform was used to generate a spatial layer representing distance to typhoon tracks.
Built-up land and cropland are important indicators for characterizing typhoon exposure. Areas with concentrated built-up land generally accommodate higher levels of population, assets, and infrastructure, whereas cropland reflects the exposure of agricultural production systems to typhoon hazards. Based on the 2023 China Land Use Remote Sensing Monitoring Dataset (30 m spatial resolution), cropland information for Haikou was extracted to generate a cropland spatial layer. Meanwhile, built-up land within the study area was manually digitized and interpreted from high-resolution Google Earth imagery to generate a built-up land spatial layer. Population density is a key indicator for measuring population exposure. Coastal populations are generally more vulnerable to typhoon impacts, and the continuous growth of coastal populations worldwide has further increased regional exposure to typhoon disasters. In this study, population density data were obtained from the China Population Spatial Distribution Kilometer Grid Dataset (1 km spatial resolution). The population density spatial layer for Haikou was extracted using the spatial analysis tools on the ArcGIS 10.7 platform and subsequently resampled to a spatial resolution of 30 m to ensure consistency with the spatial scale of the other indicators.

2.4. Indicator Ranking and Standardization

For each spatial indicator, classification thresholds listed in Table 2 were determined based on its physical meaning, direction of influence on typhoon risk, and the local conditions of Haikou City. Subsequently, each indicator was classified into five levels and assigned ordinal scores ranging from 1 to 5, where 1 denotes very low risk and 5 denotes very high risk. For hazard, exposure, and vulnerability indicators, larger indicator values generally correspond to higher risk levels, whereas mitigation capacity indicators were inversely scored according to their risk-reducing effects. This classification procedure was intended to transform indicators with differing dimensions, value ranges, and directions of influence into an ordinal scale with consistent risk implications. All criterion layers were then converted into raster format with a 30 m pixel size to support the raster-based weighted overlay technique. Since the integrated spatial index requires a weighted aggregation of multiple indicators, different variables must be transformed to a uniform dimensionless scale. Accordingly, Equation (1) was applied to further standardize the ordinal scores of each indicator to a range of 0–1. This standardization eliminates dimensional discrepancies among indicators and ensures their comparability in the comprehensive evaluation.
N = X X m i n X m a x X m i n
where N is the normalized value of the indicator, X m i n and X m a x are the minimum and maximum values of the indicator, respectively, and X represents the value of a single cell in each spatial raster layer. This approach is appropriate for identifying intra-urban risk patterns, which is the primary objective of this study. However, the normalized results should not be directly compared across different regions unless a common reference range is adopted.
The indicators in Table 2 were not classified using a single uniform method. Instead, the classification approach was selected according to the data type and empirical distribution of each indicator. Continuous indicators with uneven distributions or pronounced clustering were classified using the Jenks natural-breaks method. The remaining indicators were divided using fixed intervals, with reference to previous studies and consideration of the local conditions of the study area. These class boundaries were primarily used to define relative risk-contribution levels. Unless supported by explicit physical or technical criteria, they should not be interpreted as strict physical thresholds at which hazard, vulnerability, or mitigation capacity changes abruptly.

2.5. Indicator Weights

The analytic hierarchy process (AHP) has been widely applied in typhoon risk assessment [25,46]. Therefore, it was adopted in this study to determine the indicator weights. Three experts with extensive experience in typhoon risk assessment and emergency management were invited to participate in the weighting process. Before the pairwise comparisons, the experts were provided with the definition, data source, and direction of influence of each indicator. This step ensured a consistent understanding of the indicator meanings and evaluation criteria. Subsequently, the experts independently evaluated the relative importance of indicators within the same hierarchical level using the Saaty 1–9 scale, and corresponding pairwise comparison matrices were constructed. For each matrix, the values in each column were first summed. Each entry was then divided by the corresponding column total to obtain a normalized matrix, in which the entries of each column summed to 1. Finally, the consistency of each judgment matrix was evaluated using the consistency ratio (CR). A judgment matrix was considered to have acceptable consistency when the CR was less than 0.10. The CR was calculated using Equation (2):
C R = C o n s i s t e n c y   I n d e x / R a n d o m   I n d e x
where the Random Index (RI) is the random index, and the Consistency Index (CI) is calculated using Equation (3):
C I = ( λ m a x n ) / ( n 1 )
where λ m a x is the largest eigenvalue of the pairwise comparison matrix, and n is the order of the matrix. In AHP, λ m a x reflects the consistency of the pairwise judgments.
Table 3 lists the indicator weights and consistency ratios calculated using AHP. Differences in indicator weights reflect their relative contributions to typhoon risk within the same assessment dimension. The weighting process mainly considered three aspects: the directness of the relationship between each indicator and disaster losses, the spatial extent of its influence, and its role throughout the typhoon disaster process. Within the hazard dimension, Rainfall, Wind speed, and Storm surge height can directly cause flooding and structural damage. Therefore, these indicators were assigned relatively high weights. By contrast, Typhoon frequency mainly represents the historical likelihood of typhoon occurrence and was thus assigned a lower weight. Within the exposure and vulnerability dimension, Build-up land and Population density directly reflect the spatial concentration of populations, assets, and infrastructure. Consequently, they received relatively high weights. Within the mitigation capacity dimension, monitoring stations directly support early warning for typhoon tracks, rainfall, and wind speed. Building structure determines the resistance of exposed elements to strong winds and heavy rainfall. Therefore, these indicators were also assigned relatively high weights.

2.6. Typhoon Risk Assessment

Based on the spatial layers of each indicator and their corresponding weights, the weighted overlay technique was used to calculate the hazard index, exposure and vulnerability index, and mitigation capacity index, respectively. According to the index values, these indices were classified into five categories: very low, low, moderate, high, and very high. To evaluate the influence of mitigation capacity on the spatial pattern of composite risk and to examine the sensitivity of the results to different functional representations of mitigation capacity, three risk formulations were considered. First, the divisive HEV–MC formulation adopted as the primary model in this study was expressed as:
R i s k   i n d e x = H × E V M C
where H , E V , and M C denote the hazard index, exposure and vulnerability index, and mitigation capacity index, respectively. This formulation treats mitigation capacity as an inverse modifier of composite risk. Under the same levels of hazard and exposure and vulnerability, areas with greater mitigation capacity are therefore assigned lower risk values. The risk map generated using Equation (4) was used as the primary assessment result in this study.
However, because the mitigation-capacity index was normalized to the range of 0–1, small values of MC may substantially amplify the resulting risk index. To examine the sensitivity of the risk pattern to this numerical characteristic, a bounded divisive formulation was additionally considered:
R i s k   i n d e x = H × E V ( 1 + M C )
The formulation preserves the inverse relationship between mitigation capacity and risk while constraining its effect to a bounded range. Equation (5) was used as an alternative formulation for sensitivity analysis rather than as the primary risk model. Finally, the conventional HEV formulation without mitigation capacity was used as a baseline model:
R i s k   i n d e x =   H × E V
This formulation characterizes the baseline spatial risk pattern jointly determined by hazard, exposure, and vulnerability without considering spatial variations in mitigation capacity. Comparison between Equations (4) and (6) was used to evaluate the additional spatial differentiation introduced by incorporating mitigation capacity.
To ensure the comparability of risk levels across different areas, the resulting risk index was further normalized to a range of 0–1 using Equation (1) and classified into five risk levels: very low, low, moderate, high, and very high. Comparisons among the three models were used to assess the influence of mitigation capacity and the sensitivity of the mapped risk pattern to the selected functional form.

2.7. Identification of Spatial Patterns of Typhoon Risk

Spatial autocorrelation analysis was applied to identify statistically significant spatial clustering patterns of typhoon risk. This analysis helps reveal risk aggregation patterns and provides a basis for determining priority intervention areas and phased disaster mitigation actions. Multiple spatial statistical models were used to quantify the geographic heterogeneity of typhoon risk, including global Moran’s I [59], local Moran’s I [35], and the Gi statistic [30]. Moran’s I ranges from −1 to 1, with values closer to +1 indicating stronger positive spatial autocorrelation, values closer to −1 indicating stronger negative spatial autocorrelation, and values close to 0 indicating insignificant spatial autocorrelation. Global Moran’s I is primarily used to characterize the overall spatial autocorrelation of the study area, but it is limited in revealing differences in local spatial associations between subregions and their neighboring areas. Therefore, this study further employed the local indicator of spatial association (LISA) to identify statistically significant local spatial clusters and reveal the spatial heterogeneity of typhoon risk. Based on local Moran’s I, LISA classifies the risk value of each spatial unit into five types of spatial association [60]: high–high clusters (high-risk clusters), low–low clusters (low-risk clusters), high–low clusters, low–high clusters, and non-significant types. Finally, the Getis–Ord Gi* statistic was used to identify statistically significant spatial clusters of high and low risk at the 90%, 95%, and 99% confidence levels, namely hot spots and cold spots.

3. Results

3.1. Spatial Patterns of the Risk Components

3.1.1. Hazard

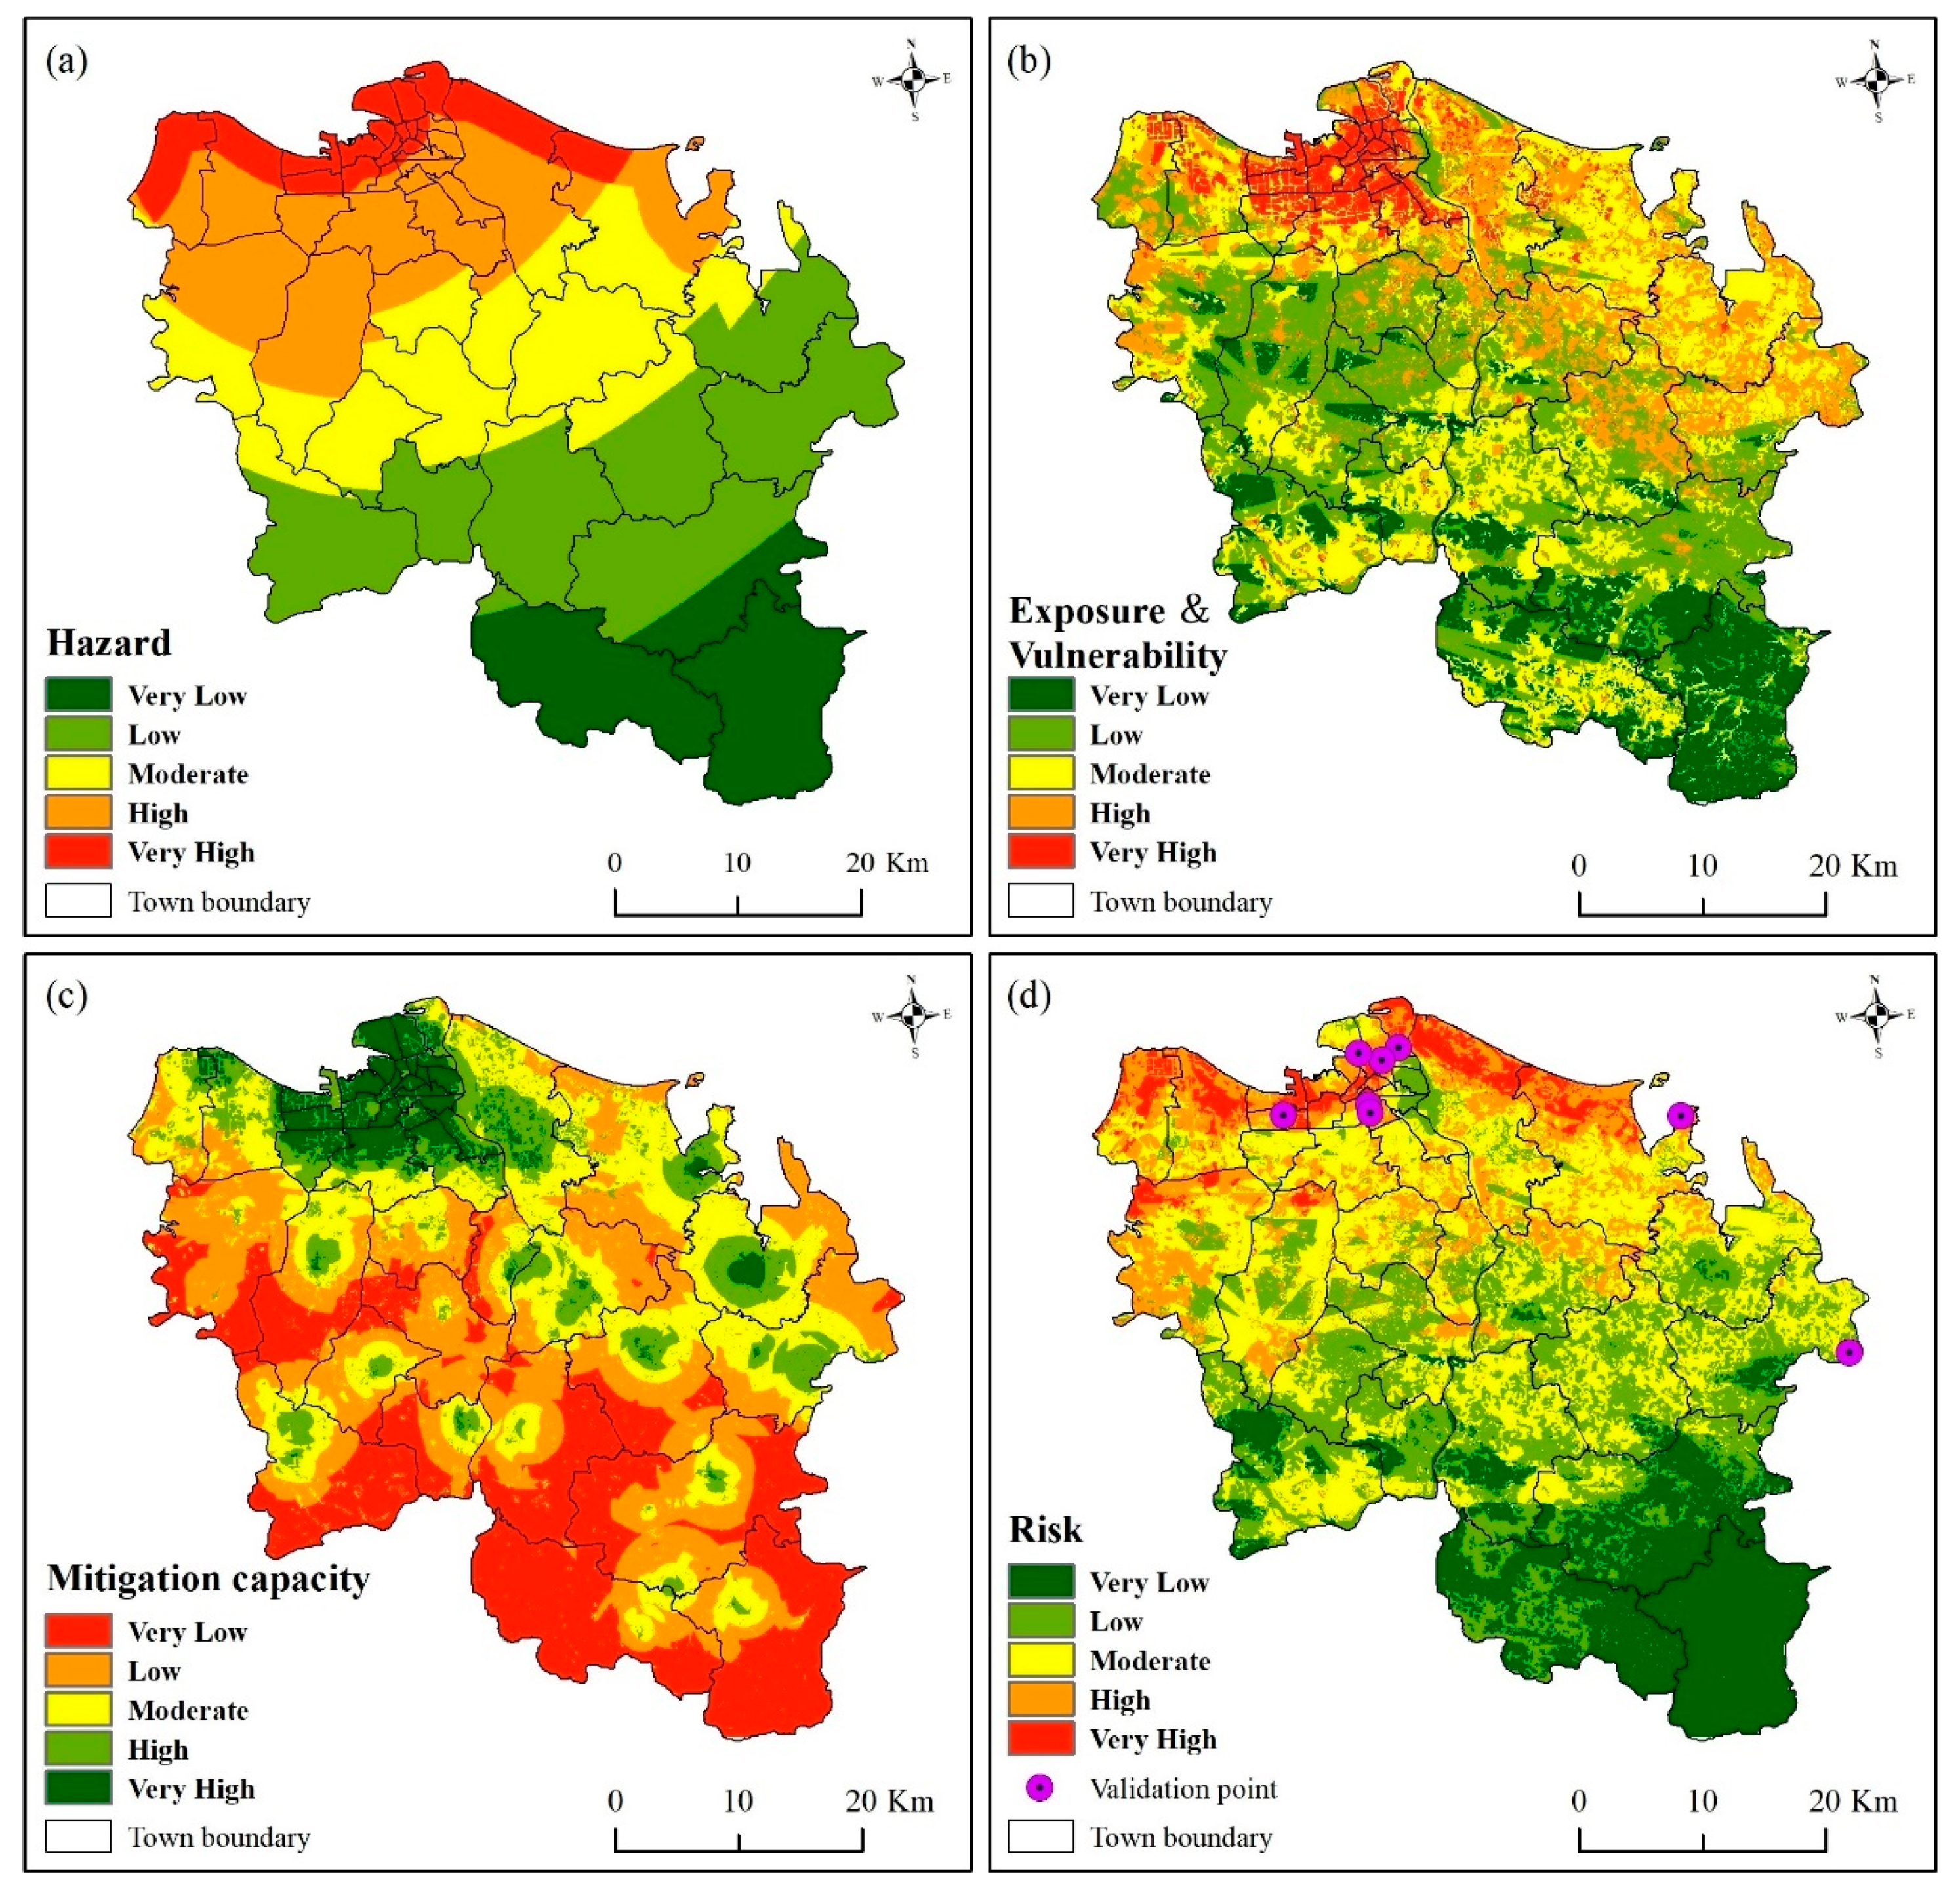
The typhoon hazard index for Haikou was calculated using the weighted comprehensive evaluation method, and the spatial distribution pattern of typhoon hazard intensity was obtained (Figure 5a). Overall, typhoon hazard intensity in Haikou exhibits pronounced spatial variation. High-value areas are mainly concentrated in the northwest, whereas low-value areas are primarily distributed in the southeast. Areas classified as having a very high hazard level account for 7.38% of the total area of the city and are mainly located along the northern coast. These areas are characterized by high rainfall intensity, strong wind speed, low-lying terrain, and proximity to the coastline, making them more susceptible to storm surge impacts. Areas with a high hazard level account for 21.64%. Areas with a moderate hazard level account for 23.95% and are mainly distributed in central Haikou. Areas classified as having low and very low hazard levels account for 30.91% and 16.12%, respectively. These areas cover most of eastern and southeastern Haikou, including Dapo Town, Sanmenpo Town, and Dazhipo Town, as well as the southern parts of Sanjiang Town, Hongqi Town, and Jiuzhou Town. Because these areas are relatively less affected by rainfall, wind speed, and storm surge, their hazard intensity is markedly lower.

3.1.2. Exposure and Vulnerability

The spatial distribution map of exposure and vulnerability shows that northern and eastern Haikou have relatively high levels of exposure and vulnerability, whereas central and southern areas show relatively low levels (Figure 5b). Spatial statistics indicate that areas with high and very high exposure and vulnerability levels account for 22.34% of the total area of the city. The main urban area of Haikou is classified as having a very high exposure and vulnerability level. The northern parts of Xixiu Town, Changliu Town, and Dazhipo Town, as well as parts of Lingshan Town, Yanfeng Town, and Sanjiang Town, are mainly classified as having high exposure and vulnerability levels. These areas are characterized by relatively high socioeconomic development, concentrated built-up land, and high population density. They are also close to the coastline, with low-lying terrain and gentle slopes. As a result, their exposure and vulnerability levels are relatively high. Areas with moderate exposure and vulnerability levels account for 29.48% and are widely distributed across the study area. Areas with low and very low exposure and vulnerability levels account for 33.27% and 14.91%, respectively. These areas are mainly located in central-western and southern Haikou, including Yongxing Town, Longqiao Town, Dongshan Town, Sanmenpo Town, Jiazi Town, and Dapo Town. Most of these areas are towns and rural settlements, with low population density and limited exposure of built-up land and assets. In addition, they are farther from the coastline and have relatively higher elevations, resulting in lower levels of exposure and vulnerability.

3.1.3. Mitigation Capacity

Based on indicators related to prevention capacity, resistance capacity, and rescue capacity, this study calculated the mitigation capacity index for Haikou. The index was classified into five levels using the natural breaks method to generate the spatial distribution map of mitigation capacity (Figure 5c). A higher mitigation capacity level indicates a stronger ability to reduce disaster risk. It also suggests that the area can mitigate typhoon impacts through measures such as early warning, engineering protection, emergency sheltering, and medical assistance. The results show that mitigation capacity is relatively high in northern Haikou and relatively low in the southern areas. Spatial statistics indicate that areas with moderate to very high mitigation capacity levels account for 41.44% of the study area and are mainly distributed in the main urban area of Haikou and some towns. These areas generally have relatively well-developed typhoon monitoring systems, higher awareness of disaster prevention and mitigation, and stronger engineering protection capacity. They are also close to typhoon emergency shelters and healthcare facilities, which can provide better emergency evacuation and rescue services for residents. In contrast, areas with low and very low mitigation capacity levels account for 58.56% of the study area and are mainly concentrated in rural areas. These areas are generally characterized by relatively weak awareness of disaster prevention and mitigation, insufficient engineering protection measures, and a limited number of typhoon emergency shelters and healthcare facilities with poor spatial accessibility.

3.2. Typhoon Risk Pattern Under the Primary HEV–MC Formulation

3.2.1. Spatial Distribution of Typhoon Risk

Based on the hazard index, exposure and vulnerability index, and mitigation capacity index, this study calculated the typhoon risk index for Haikou and generated a spatial distribution map of typhoon risk (Figure 5d). The results show that high-risk areas are mainly distributed in northern and western Haikou. Moderate-risk areas are widely distributed in the central-northern part of the city, whereas low- and very-low-risk areas are mainly located in the south. Spatial statistics indicate that very-high-risk and high-risk areas account for 4.13% and 14.86% of the total area of Haikou, respectively. These areas are mainly distributed along the coastal zones of Shishan Town, Xixiu Town, Changliu Town, Haixiu Subdistrict, Jinmao Subdistrict, Xinbu Subdistrict, Lingshan Town, and Yanfeng Town. These areas are close to the coastline and have relatively high hazard intensity. They also have high population density and high levels of exposure and vulnerability. Although Haikou has implemented certain mitigation measures, typhoon disaster risk in these areas remains relatively high. Moderate-risk areas account for 31.97% and are mainly distributed across most parts of Haixiu Town, Yongxing Town, Longqiao Town, Fengxiang Subdistrict, and Chengxi Town. Low-risk and very-low-risk areas account for 28.66% and 20.38%, respectively, together representing 49.04% of the study area. These areas are mainly distributed in Dazhipo Town, Sanmenpo Town, Jiazi Town, and Dapo Town. Although mitigation capacity in these areas is relatively limited, their typhoon risk levels remain comparatively low because they are far from the coastline and have low hazard intensity, as well as low levels of exposure and vulnerability.
Figure 5d represents the baseline spatial pattern of typhoon risk under the available data conditions rather than a continuous time-series assessment. This pattern may change with variations in hazard conditions, population and built-up land, mitigation facilities, and building characteristics.

3.2.2. Spatial Association Characteristics of Typhoon Risk

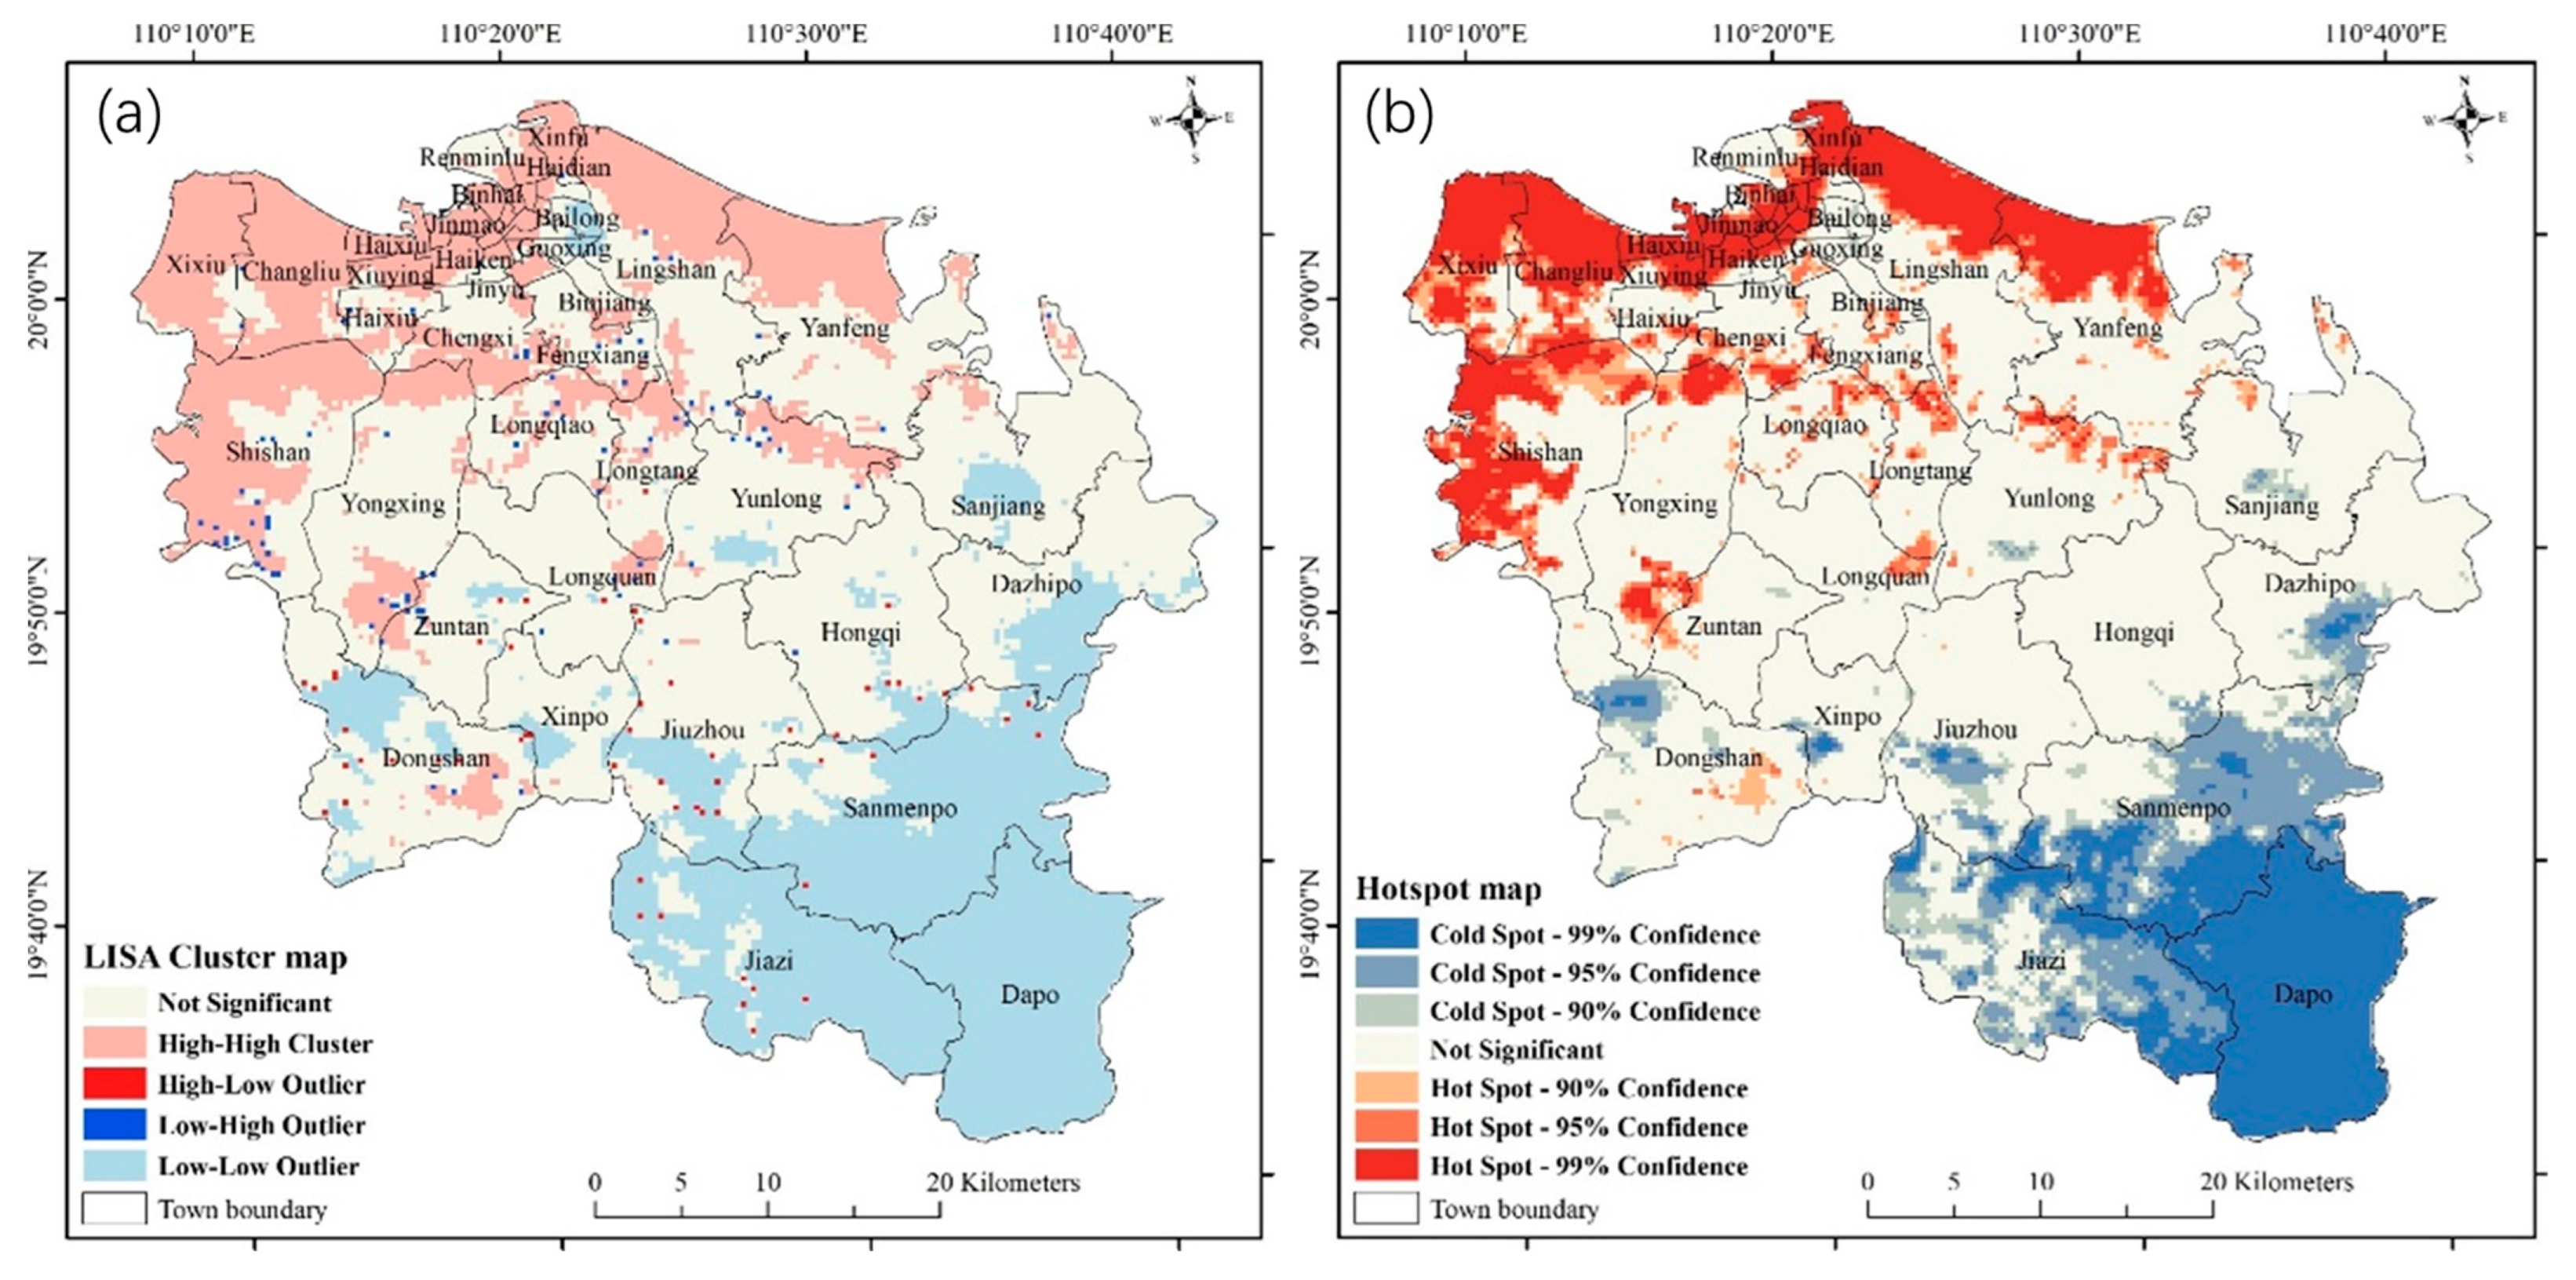
The results of global spatial autocorrelation analysis show that the global Moran’s I for typhoon risk in Haikou is 0.85, with a Z-score of 264.62 and a p-value less than 0.001. This result indicates strong positive spatial autocorrelation at the adopted 30 m grid resolution and under the specified spatial-weights matrix. However, the observed pattern may reflect both the substantive clustering of risk-related factors and spatial smoothing introduced during data processing. Several indicators were derived through spatial interpolation or distance decay functions, potentially increasing the resemblance between neighboring grid cells and thereby raising the observed spatial autocorrelation to some degree. To further reveal the local spatial association patterns of typhoon disaster risk, a LISA cluster map was generated using ArcGIS 10.7 (Figure 6a). The results show that typhoon risk is mainly characterized by high–high and low–low clustering, whereas high–low and low–high clusters are not significant. High–high clusters are mainly distributed in coastal towns and subdistricts of Haikou, including Xixiu Town, Changliu Town, Haixiu Subdistrict, Jinmao Subdistrict, Xinbu Subdistrict, and the northern parts of Lingshan Town and Yanfeng Town. These areas have high typhoon risk levels, and their neighboring units also show high risk values. Low–low clusters are mainly located in Dapo Town, Jiazi Town, and Sanmenpo Town in southern Haikou. These areas have low risk levels and are surrounded primarily by units with similarly low risk values.
Figure 6b presents the Getis–Ord Gi* statistic results for typhoon risk in Haikou. The hot spot analysis shows that statistically significant hot spots of high typhoon risk are formed in northern Haikou at the 99%, 95%, and 90% confidence levels. These hot spots mainly include Xixiu Town, Changliu Town, and Haixiu Subdistrict. In contrast, significant cold spots of low typhoon risk are formed in southern Haikou, such as Dapo Town. These results indicate that the high–high and low–low clusters identified by LISA correspond to statistically significant hot spots and cold spots, respectively. This further confirms the significance of the spatial clustering pattern of typhoon risk.

3.2.3. Validation of Results

Validation is an important step in assessing the reliability of spatial risk assessment results. At present, large-scale studies commonly validate the accuracy of assessment results by examining the statistical correlation between disaster losses and risk levels. However, rigorous statistical validation at a fine-grid scale remains difficult because georeferenced disaster-loss data are often limited. Therefore, this study conducted a preliminary plausibility check by examining the spatial correspondence between typhoon-related fatality locations and the mapped risk zone. Records of typhoon-related fatalities from 2015 to 2024 were obtained from local government departments and georeferenced according to the reported places of death. The fatality locations were then overlaid with the typhoon risk map. As shown in Figure 5d, eight typhoon-related fatality locations were recorded during 2015–2024. Among them, two were located in very-high-risk zones, three in high-risk zones, two in moderate-risk zones, and one in a low-risk zone. Overall, seven of the eight fatalities occurred in moderate-or-higher-risk zones. Five fatalities, accounting for 62.5% of the total, were located in high- or very-high-risk zones. Given the relatively limited spatial extent of these zones within the built-up area of Haikou, the fatality locations showed a degree of spatial concentration in areas with higher mapped risk.
One fatality occurred in a low-risk zone. The available record did not provide sufficient case-specific information to determine the exact cause of this mismatch. It may be related to event-specific local hazards, individual exposure or behavior, uncertainty in the reported location, or risk factors not represented by the selected indicators. In addition, the risk map represents a long-term pattern of relative risk, whereas each fatality was associated with a specific typhoon event and local circumstance.
This comparison provides preliminary support for the plausibility and potential utility of the mapped risk pattern. However, the small number of fatalities does not permit formal statistical validation. Moreover, the validation was limited to human fatalities because spatially consistent data on property damage, infrastructure disruption, agricultural losses, and other typhoon impacts were unavailable. The results should therefore be interpreted as a preliminary check of spatial consistency rather than a comprehensive validation of the overall risk model.

3.3. Comparative and Sensitivity Analyses of the Risk Formulations

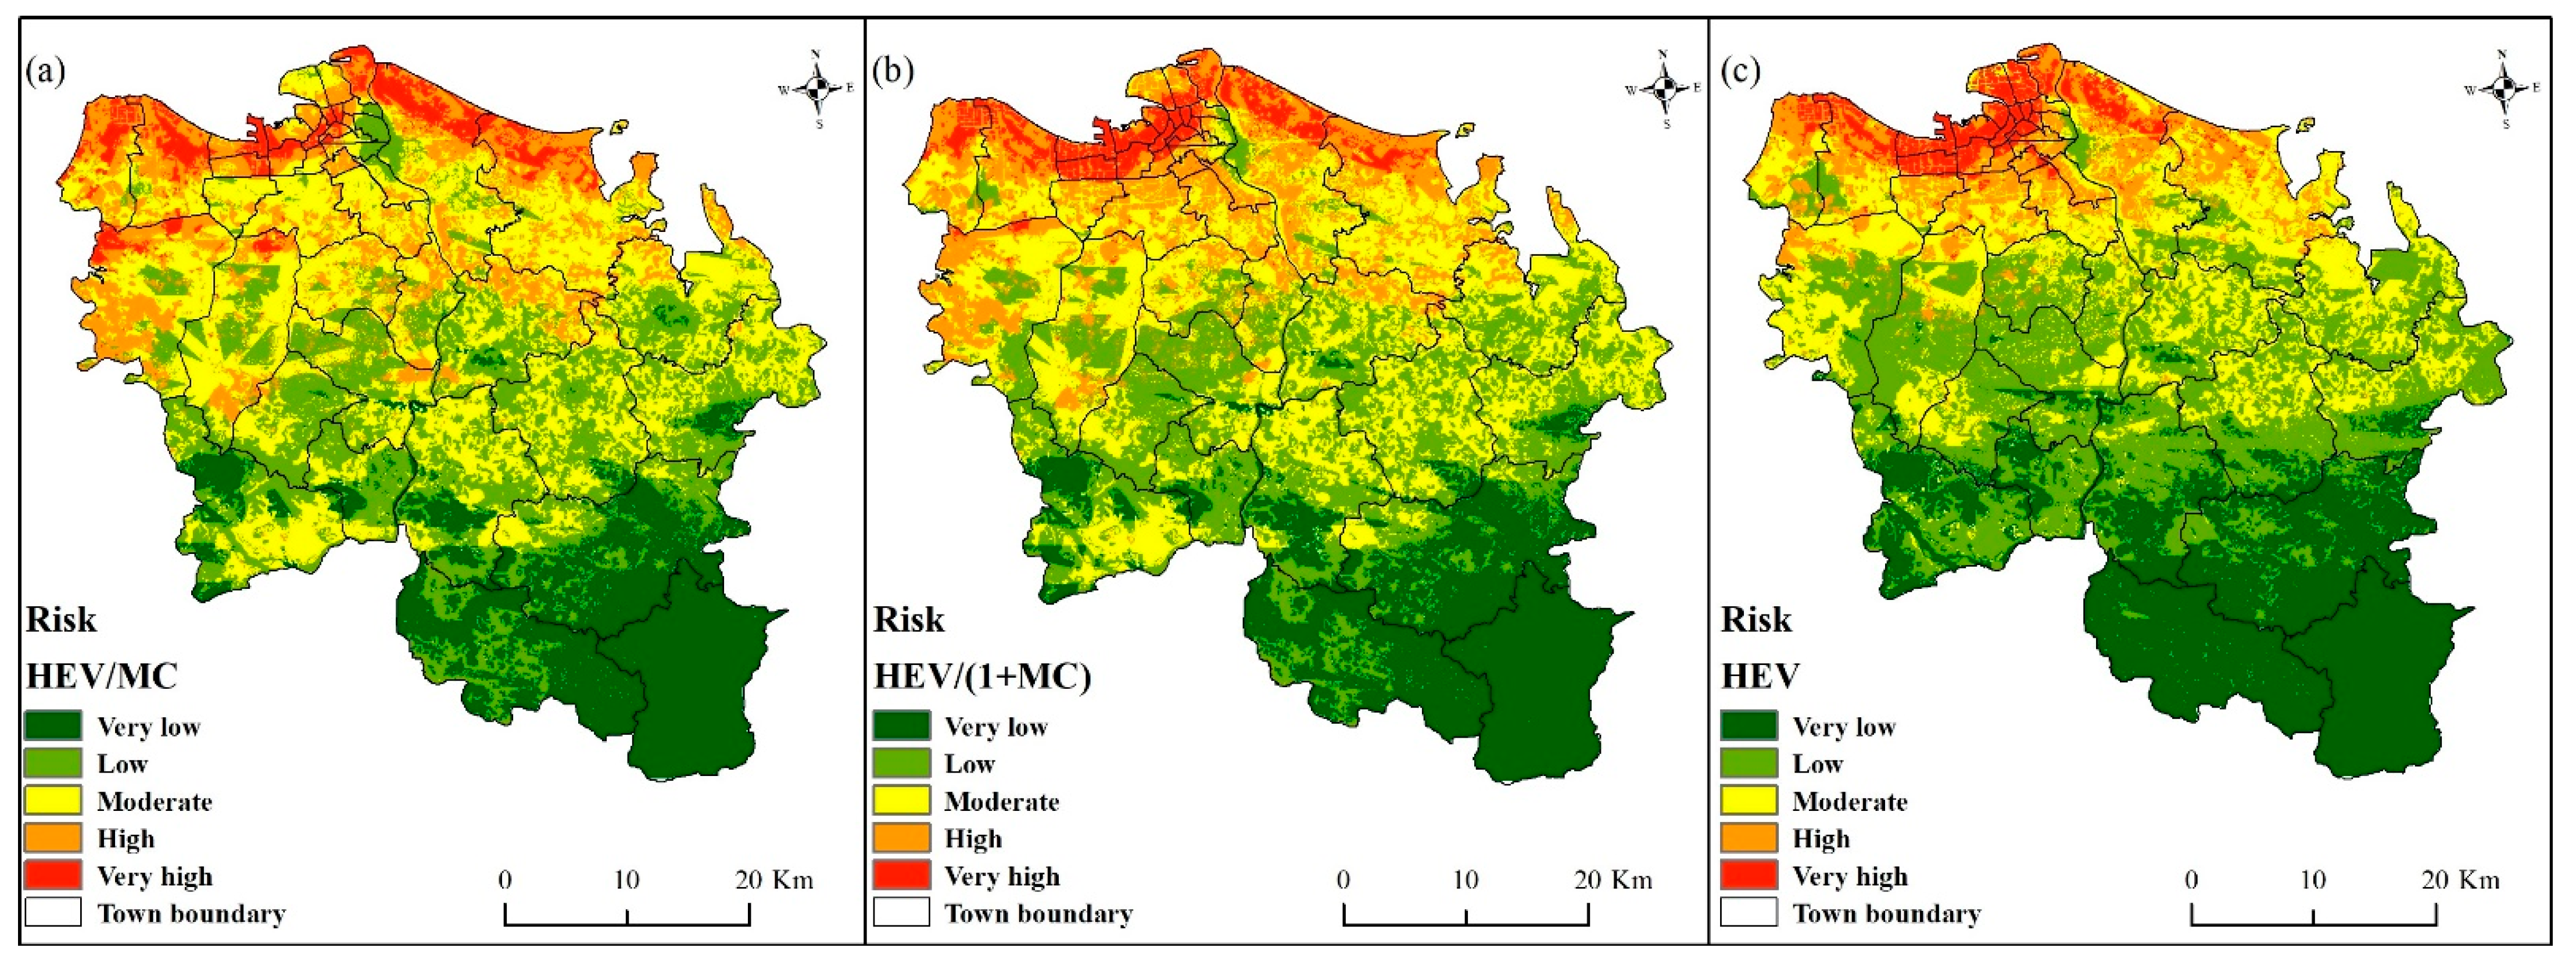
The three risk formulations produced somewhat different areal distributions of the risk classes (Figure 7). The conventional HEV model without mitigation capacity was dominated by very-low- and low-risk areas, which together accounted for 62.96% of the study area. Moderate-, high-, and very-high-risk areas accounted for 23.22%, 10.06%, and 3.75%, respectively. Under the HEV/MC formulation, the combined proportion of very-low- and low-risk areas decreased to 49.04%, while the proportion of moderate-risk areas increased to 31.97%. High- and very-high-risk areas together accounted for 18.99%. Under the bounded HEV/(1 + MC) formulation, very-low- and low-risk areas jointly accounted for 50.38%, moderate-risk areas accounted for 29.88%, and high- and very-high-risk areas together accounted for 19.74%. Compared with the HEV model without mitigation capacity, both formulations incorporating mitigation capacity resulted in smaller proportions of lower-risk areas and larger proportions of moderate- and higher-risk areas. This redistribution indicates that accounting for spatial variations in mitigation capacity can further identify areas with relatively limited disaster-reduction resources and alter the relative positions of some grid cells within the citywide risk pattern. It should be emphasized that these differences represent a redistribution of relative risk classes among the models and should not be interpreted as an increase in absolute risk caused by the incorporation of mitigation capacity.
The risk-class structures generated using the HEV/MC and HEV/(1 + MC) formulations were broadly similar. The combined proportions of high- and very-high-risk areas were 18.99% and 19.74%, respectively, while very-high-risk areas accounted for 4.13% and 4.05%. The largest difference in the areal proportion of an individual risk class was 2.09 percentage points and occurred in the moderate-risk class. Overall, the differences in risk-class structure produced by the two functional representations of mitigation capacity were relatively limited, whereas their differences from the HEV model without mitigation capacity were more pronounced. These findings indicate that incorporating mitigation capacity provides additional information for distinguishing the spatial variation in urban risk. Meanwhile, the areal structure of the principal risk classes exhibited a certain degree of robustness to the selected functional form of mitigation capacity. The primary HEV/MC model therefore provides a relatively stable representation of the moderating role of mitigation capacity in intra-urban typhoon risk and supports the main conclusion that its incorporation improves the spatial differentiation of risk.

4. Discussion

Typhoon risk assessment provides an important scientific basis for pre-disaster prevention, risk management, and mitigation decision-making. Haikou is one of the typical typhoon-prone areas in China. However, existing studies are often limited by coarse spatial scales and insufficient quantification of mitigation capacity, making it difficult to support refined and differentiated risk response strategies. Spatially explicit grid-based assessment can better reveal intra-urban risk variations and provide spatial information for disaster loss reduction, mitigation resource allocation, and risk governance [61]. This study integrates multi-source geospatial big data, remote sensing, and GIS technologies to develop a comprehensive typhoon risk assessment framework that incorporates hazard, exposure, vulnerability, and mitigation capacity. This framework is consistent with recent comprehensive risk assessment studies that emphasize the joint effects of hazard, exposure, vulnerability, and capacity-related factors in shaping disaster risk [36]. Typhoon risk was mapped on a common 30 m analytical grid. The selection of this grid size considered both the urban spatial characteristics of Haikou and the spatial granularity of the principal input datasets. Population, built-up land, and mitigation resources are unevenly distributed within districts, towns, and subdistricts. An assessment conducted directly at the administrative-unit level could therefore homogenize local risk and obscure differences among densely built-up areas, peri-urban zones, and coastal settlements. The 30 m grid represents a practical compromise between retaining intra-urban spatial variations and remaining consistent with the information content of the principal remote-sensing, topographic, and land-use datasets. Compared with assessments conducted at coarser provincial, municipal, or county scales, this approach enables a more detailed identification of relative intra-urban risk variations and localized high-risk clusters. A key contribution of the framework is the spatially explicit representation of mitigation capacity. This allows the assessment to reflect not only the spatial combination of hazard, exposure, and vulnerability, but also geographical differences in disaster-reduction resources and response capacity. Nevertheless, the input datasets differ in their native spatial scales and information content. The 30 m grid serves only as a common unit for spatial harmonization and integrated computation; it does not imply that all variables have an effective spatial resolution of 30 m. Harmonizing the datasets on this grid facilitates spatial alignment and aggregation but does not increase the information content of the original data. Therefore, the results are intended to identify relative intra-urban risk patterns and priority areas rather than provide precise risk predictions at the 30 m scale. The spatial correspondence between the risk map and typhoon-related fatality locations provides preliminary support for the plausibility and potential utility of the framework. However, further statistical evaluation using more comprehensive disaster-loss data, including economic losses and infrastructure damage, is still required.
The method proposed in this study has potential transferability across spatial scales and hazard types, although its implementation depends on the availability and quality of basic spatial data. At a minimum, the framework requires spatial information representing hazard, exposure, vulnerability, and mitigation capacity. These data may include historical typhoon tracks or rainfall and wind records, population and built-up land, elevation or topography, and basic information on roads, medical facilities, shelters, and monitoring facilities. In data-scarce regions, openly available datasets, such as global population grids, digital elevation models, land-cover products, nighttime light data, road networks, and points of interest for public facilities, may be used as proxy indicators. Before integration, the input datasets should be quality checked and harmonized in terms of temporal reference, coordinate system, and spatial scale. Point, line, and administrative statistical data should also be converted to a common analytical grid. Proxy indicators and their weights should be adjusted according to local hazard conditions and data availability, and the associated uncertainty should be explicitly acknowledged. Thus, the framework is transferable at the methodological level, but its indicator system and parameter settings require regional adaptation. For example, high-resolution remote sensing imagery has been widely used for building identification [62,63], land-use/land-cover mapping [64], and coastal vegetation extraction [55]. Therefore, the proposed method can be extended to other typhoon-affected regions. Fine-grid-scale typhoon risk assessment can be conducted by incorporating local remote sensing imagery, POI data, including healthcare facilities, shelters, and infrastructure, as well as key information such as historical typhoon records. In addition, with appropriate adjustments to some indicators, this method can also be applied to the risk assessment of other natural hazards. For example, maximum inundation depth is often a key indicator in flood risk assessment [65], whereas drought risk assessment places greater emphasis on climatic factors such as rainfall and temperature [66].
High-resolution risk assessment is an important basis for developing targeted disaster prevention plans and risk mitigation strategies. This study helps reveal intra-regional risk differences, identify high-risk hot spots, and determine priority intervention areas and corresponding mitigation measures. These insights can help reduce the impacts of typhoon disasters on populations, ecosystems, and economic activities. The results indicate that northern Haikou is a hot spot of typhoon risk and should be prioritized in mitigation planning. This area is characterized by high typhoon hazard intensity, dense population, and high levels of exposure and vulnerability. Accordingly, targeted measures may include optimizing urban spatial layout [67,68], controlling urban population density [69], and improving early-warning capacity and public awareness of disaster mitigation [70]. These measures can help reduce the likelihood of residents being affected by typhoon disasters. In contrast, southern Haikou has a relatively low overall risk level, but its mitigation capacity remains limited. Therefore, mitigation capacity building is still needed in this area. We recommend improving building materials and reinforcing dilapidated buildings [71], strengthening infrastructure such as roads, shelters, and hospitals [72], and enhancing the overall capacity to cope with typhoon events [73].
This study also has several limitations. Regarding the indicator system, multi-source geospatial big data help characterize risk-related factors more comprehensively. However, future studies should strengthen collinearity analysis among indicators to reduce information redundancy. The rainfall, wind-speed, and storm-surge hazard layers in this study were derived from spatial interpolation of station observations. Their effective spatial resolution is constrained by station density, inter-station distance, and the interpolation methods and is therefore considerably coarser than the 30 m analytical grid used in the final assessment. Kriging and inverse distance weighting can represent broad regional gradients but may smooth local extremes and small-scale variations between observation stations. Storm surge height is mainly used to characterize the spatial distribution characteristics of storm surge at the regional scale, rather than to simulate coastal inundation processes with high precision. Future research should further integrate tide gauge observation data and introduce high-resolution hydrodynamic models to improve the spatial accuracy of storm surge hazard assessment. The strong spatial autocorrelation of typhoon risk may have both substantive and methodological origins. On the one hand, typhoon hazard, population and built-up area distributions, and infrastructure conditions generally exhibit clear spatial continuity and clustering. Consequently, adjacent areas often show similar risk levels. On the other hand, several indicators were derived through spatial interpolation or distance-decay functions. Such spatialization procedures may increase similarity among neighboring grid cells and thereby raise the estimated level of spatial autocorrelation. Regarding weight determination, the analytic hierarchy process has been widely used in typhoon risk assessment [25], but its subjectivity remains difficult to fully avoid. Regarding result validation, the limited availability of fine-scale disaster-loss data meant that the risk map was evaluated primarily through a qualitative spatial comparison between fatality locations and mapped risk zones. However, because of the small number of fatality records, this comparison should be regarded only as an exploratory plausibility check. It does not constitute rigorous statistical validation of the accuracy or reliability of the risk map. Future studies should integrate longer-term and more comprehensive disaster-loss records, including casualties, economic losses, and infrastructure damage, to further assess the robustness of the risk results. Despite these limitations, the method proposed in this study can still provide reliable spatial information support for typhoon risk assessment and the formulation of mitigation measures.

5. Conclusions

High-resolution spatial assessment of typhoon risk is essential for reducing disaster risk and improving mitigation planning. This study proposed a high-resolution typhoon risk assessment method that integrates multi-source geospatial big data, remote sensing, and GIS-based spatial analysis. The applicability of the method was examined in Haikou, China, at a fine grid scale of 30 m × 30 m. The results show that the high-resolution risk map can effectively characterize the spatial extent, level differentiation, and spatial heterogeneity of typhoon risk. In Haikou, 18.99% of the area is classified as being at high and very high risk levels. These areas are mainly concentrated along the coastal zones of Shishan Town, Xixiu Town, Changliu Town, Lingshan Town, and Yanfeng Town. They are also statistically significant hot spots of high typhoon risk. Low- and very-low-risk areas account for 49.04% and are mainly distributed in southern Haikou. The risk map shows good spatial consistency with typhoon-induced fatality records, indicating that the integration of geospatial big data and GIS technology provides a reliable approach for high-resolution assessment of comprehensive typhoon risk. The assessment framework developed in this study is flexible and transferable. By integrating local remote sensing imagery, field survey data, POI data, and key information such as historical typhoon records and development plans, the framework can be applied to typhoon risk assessment in other coastal regions. This study demonstrates that high-resolution typhoon risk assessment can accurately identify spatial risk patterns at a fine scale. It can provide a reliable spatial baseline for developing disaster risk reduction strategies and mitigating the impacts of typhoon disasters.

Author Contributions

F.L. and E.X. conceived the study. Material preparation, data collection, and analysis were performed by F.L. and E.X. F.L. drafted the manuscript. E.X., H.Z., Y.L. and X.Z. reviewed and edited the manuscript. All authors have read and agreed to the published version of the manuscript.

Funding

This research was funded by the Natural Science Foundation of Hebei Province (grant number D2025207001), the National Key Research and Development Program of China (grant number 2018YFC1508801), and the Youth Innovation Promotion Association of CAS (grant number 2021052).

Data Availability Statement

The publicly available datasets used in this study, including the digital elevation model, land-use data, meteorological observations, and typhoon-track records, can be obtained from the data sources cited in the manuscript. Typhoon-related fatality records and certain local emergency-management datasets were provided by local government departments and are not publicly available because they contain sensitive or restricted information. These data may be made available by the corresponding author upon reasonable request and subject to approval by the relevant data providers.

Conflicts of Interest

The authors declare no conflicts of interest.

References

  1. Tran, T.L.; Ritchie, E.A.; Perkins-Kirkpatrick, S.E.; Bui, H.; Luong, T.M. Future Changes in Tropical Cyclone Exposure and Impacts in Southeast Asia From CMIP6 Pseudo-Global Warming Simulations. Earth’s Future 2022, 10, e2022EF003118. [Google Scholar] [CrossRef] [Scilit]
  2. Gori, A.; Lin, N.; Xi, D.Z.; Emanuel, K. Tropical cyclone climatology change greatly exacerbates US extreme rainfall-surge hazard. Nat. Clim. Change 2022, 12, 171–178. [Google Scholar] [CrossRef] [Scilit]
  3. Jing, R.; Heft-Neal, S.; Chavas, D.R.; Griswold, M.; Wang, Z.; Clark-Ginsberg, A.; Guha-Sapir, D.; Bendavid, E.; Wagner, Z. Global population profile of tropical cyclone exposure from 2002 to 2019. Nature 2024, 626, 549–554. [Google Scholar] [CrossRef] [Scilit] [PubMed]
  4. Meiler, S.; Vogt, T.; Bloemendaal, N.; Ciullo, A.; Lee, C.-Y.; Camargo, S.J.; Emanuel, K.; Bresch, D.N. Intercomparison of regional loss estimates from global synthetic tropical cyclone models. Nat. Commun. 2022, 13, 6156. [Google Scholar] [CrossRef] [Scilit] [PubMed]
  5. Young, R.; Hsiang, S. Mortality caused by tropical cyclones in the United States. Nature 2024, 635, 121–128. [Google Scholar] [CrossRef] [Scilit] [PubMed]
  6. Deng, E.; Xiang, Q.; Ouyang, D.H.; Chan, K.T.F.; He, D.X.; Lin, N.; Chan, J.C.L.; Tu, S.F.; Chan, P.W.; Liu, Z.Z.; et al. Tropical cyclone rainfall extends inland. Nat. Commun. 2026, 17, 3926. [Google Scholar] [CrossRef] [Scilit] [PubMed]
  7. Wang, P.Y.; Yang, Y.; Xue, D.K.; Qu, Y.; Tang, J.P.; Leung, L.R.; Liao, H. Increasing Compound Hazards of Tropical Cyclones and Heatwaves over Southeastern Coast of China under Climate Warming. J. Clim. 2023, 36, 2243–2257. [Google Scholar] [CrossRef] [Scilit]
  8. Liu, Z.; Xu, L.; Lu, Q. Comprehensive Typhoon Hazard Zoning in China Based on Historical Records. Geomat. Nat. Hazards Risk 2024, 1, 2300813. [Google Scholar]
  9. Lai, Y.C.; Li, J.F.; Gu, X.H.; Chen, Y.D.; Kong, D.D.; Gan, T.Y.; Liu, M.F.; Li, Q.Q.; Wu, G.F. Greater flood risks in response to slowdown of tropical cyclones over the coast of China. Proc. Natl. Acad. Sci. USA 2020, 117, 14751–14755. [Google Scholar] [CrossRef] [Scilit] [PubMed]
  10. Meng, C.N.; Xu, W.; Qiao, Y.; Liao, X.L.; Qin, L.J. Quantitative Risk Assessment of Population Affected by Tropical Cyclones Through Joint Consideration of Extreme Precipitation and Strong Wind-A Case Study of Hainan Province. Earth’s Future 2021, 9, e2021EF002235. [Google Scholar] [CrossRef] [Scilit]
  11. Zhang, Y.; Fan, G.F.; He, Y.; Cao, L.J. Risk assessment of typhoon disaster for the Yangtze River Delta of China. Geomat. Nat. Hazards Risk 2017, 8, 1580–1591. [Google Scholar] [CrossRef] [Scilit]
  12. UNISDR. UNISDR Terminology on Disaster Risk Reduction; UNISDR: Geneva, Switzerland, 2009. [Google Scholar]
  13. Hoque, M.A.; Sami, M.S.; Hasan, M.; Pradhan, B. A Comparative Study of Spatial MCDM Techniques for Flash Flood Risk Mapping in Northeastern Bangladesh. Earth Syst. Environ. 2026, 10, 6077–6095. [Google Scholar] [CrossRef] [Scilit]
  14. Peng, J.Q.; Zhang, J.M. Urban flooding risk assessment based on GIS- game theory combination weight: A case study of Zhengzhou City. Int. J. Disaster Risk Reduct. 2022, 77, 103080. [Google Scholar] [CrossRef] [Scilit]
  15. Sun, N.; Li, C.L.; Guo, B.Y.; Sun, X.K.; Yao, Y.K.; Wang, Y. Urban flooding risk assessment based on FAHP-EWM combination weighting: A case study of Beijing. Geomat. Nat. Hazards Risk 2023, 14, 2240943. [Google Scholar] [CrossRef] [Scilit]
  16. Wei, Q.; Zhang, H.J.; Chen, Y.Q.; Xie, Y.F.; Yin, H.L.; Xu, Z.X. City scale urban flooding risk assessment using multi-source data and machine learning approach. J. Hydrol. 2025, 651, 132626. [Google Scholar] [CrossRef] [Scilit]
  17. Alemdar, K.D. Seismic risk assessment of transportation networks for the impending Istanbul earthquake with GIS-based MCDM approach. Nat. Hazards 2025, 121, 10085–10123. [Google Scholar] [CrossRef] [Scilit]
  18. Yang, Y.T.; Wu, J.D.; Wang, L.L.; Ya, R.; Tang, R.M. Dynamic Earthquake-Induced Landslide Susceptibility Assessment Model: Integrating Machine Learning and Remote Sensing. Remote Sens. 2024, 16, 4006. [Google Scholar] [CrossRef] [Scilit]
  19. Paudel, B.; Fall, M.; Daneshfar, B. GIS-based assessment of debris flow hazards in Kulekhani Watershed, Nepal. Nat. Hazards 2020, 101, 143–172. [Google Scholar] [CrossRef] [Scilit]
  20. Zhou, Y.Y.; Yue, D.X.; Liang, G.; Li, S.Y.; Zhao, Y.; Chao, Z.Z.; Meng, X.M. Risk Assessment of Debris Flow in a Mountain-Basin Area, Western China. Remote Sens. 2022, 14, 2942. [Google Scholar] [CrossRef] [Scilit]
  21. Nguyen, B.Q.V.; Kim, Y.T. Regional-scale landslide risk assessment on Mt. Umyeon using risk index estimation. Landslides 2021, 18, 2547–2564. [Google Scholar] [CrossRef] [Scilit]
  22. Caleca, F.; Tofani, V.; Raspini, F.; Segoni, S.; Casagli, N. Quantitative landslide risk assessment for Italy. Landslides 2025, 22, 3537–3559. [Google Scholar] [CrossRef] [Scilit]
  23. Fasihi, S.; Lim, W.Z.; Wu, W.Y.; Proverbs, D. Key Drivers in Flood and Drought Risk Assessment: Unveiling Risk Factors through a Multi-Metric Network Approach. Water Resour. 2025, 52, 885–903. [Google Scholar] [CrossRef] [Scilit]
  24. Guo, J.; Xiao, D.Y.; Sun, X.L.; Guo, F.C.; Xue, S.; Fan, L.X. Drought risk assessment on arid region under different socioeconomic scenarios: A case of Loess Plateau, China. Ecol. Indic. 2024, 167, 112728. [Google Scholar] [CrossRef] [Scilit]
  25. Hoque, M.A.A.; Phinn, S.; Roelfsema, C.; Childs, I. Tropical cyclone disaster management using remote sensing and spatial analysis: A review. Int. J. Disaster Risk Reduct. 2017, 22, 345–354. [Google Scholar] [CrossRef] [Scilit]
  26. Do, C.; Kuleshov, Y. Multi-Hazard Tropical Cyclone Risk Assessment for Australia. Remote Sens. 2023, 15, 795. [Google Scholar] [CrossRef] [Scilit]
  27. Sawant, S.; Sumanth, K.C. A multidimensional approach to cyclone risk assessment: Integrating GIS and Fuzzy-AHP data in coastal Odisha, India. Geomat. Nat. Hazards Risk 2025, 16, 2568948. [Google Scholar] [CrossRef] [Scilit]
  28. Zhou, Z.Y.; Yang, S.N.; Hu, F.Y.; Chen, B.R.; Shi, X.W.; Liu, X.Y. Tropical Cyclone Storm Surge-Based Flood Risk Assessment Under Combined Scenarios of High Tides and Sea-Level Rise: A Case Study of Hainan Island, China. Earth’s Future 2024, 12, e2023EF004236. [Google Scholar] [CrossRef] [Scilit]
  29. Lou, W.P.; Chen, H.Y.; Qiu, X.F.; Tang, Q.Y.; Zheng, F. Assessment of economic losses from tropical cyclone disasters based on PCA-BP. Nat. Hazards 2012, 60, 819–829. [Google Scholar] [CrossRef] [Scilit]
  30. Zhou, M.D.; Kuang, Y.Q.; Ruan, Z.; Xie, M.Y. Geospatial modeling of the tropical cyclone risk in the Guangdong Province, China. Geomat. Nat. Hazards Risk 2021, 12, 2931–2955. [Google Scholar] [CrossRef] [Scilit]
  31. Tan, R.P.; Zhang, W.D. Decision-making method based on new entropy and refined single-valued neutrosophic sets and its application in typhoon disaster assessment. Appl. Intell. 2021, 51, 283–307. [Google Scholar] [CrossRef] [Scilit]
  32. Cai, L.; Li, Y.; Chen, M.; Zou, Z. Tropical cyclone risk assessment for China at the provincial level based on clustering analysis. Geomat. Nat. Hazards Risk 2020, 11, 869–886. [Google Scholar] [CrossRef] [Scilit]
  33. Zhao, R.D.; Fang, C.L.; Liu, J.; Zhang, L.F. The evaluation and obstacle analysis of urban resilience from the multidimensional perspective in Chinese cities. Sustain. Cities Soc. 2022, 86, 104160. [Google Scholar] [CrossRef] [Scilit]
  34. Yu, D.J. Intuitionistic fuzzy theory based typhoon disaster evaluation in Zhejiang Province, China: A comparative perspective. Nat. Hazards 2015, 75, 2559–2576. [Google Scholar] [CrossRef] [Scilit]
  35. Sajjad, M.; Chan, J.C.L.; Kanwal, S. Integrating spatial statistics tools for coastal risk management: A case-study of typhoon risk in mainland China. Ocean Coast. Manag. 2020, 184, 105018. [Google Scholar] [CrossRef] [Scilit]
  36. Wang, Z.K.; Xia, N.; Zhao, X.; Ji, X.K.; Wang, J.C. Comprehensive risk assessment of typhoon disasters in China ‘s coastal areas based on multi-source geographic big data. Sci. Total Environ. 2024, 926, 171815. [Google Scholar] [CrossRef] [Scilit] [PubMed]
  37. Zhu, J.; Lu, Y.; Ren, F.M.; McBride, J.L.; Ye, L.B. Typhoon disaster risk zoning for China’s coastal area. Front. Earth Sci. 2022, 16, 291–303. [Google Scholar] [CrossRef] [Scilit]
  38. Li, H.W.; Xu, E.Q.; Zhang, H.Q. High-resolution assessment of urban disaster resilience: A case study of Futian District, Shenzhen, China. Nat. Hazards 2021, 108, 1001–1024. [Google Scholar] [CrossRef] [Scilit]
  39. Akter, A.; Dayem, A. Tropical cyclone risk mapping for a coastal city using geospatial techniques. J. Coast. Conserv. 2021, 25, 1. [Google Scholar] [CrossRef] [Scilit]
  40. Varikkodan, H.; Balaji, S.; Arjun, S.; Mandal, K.K. Tropical cyclone risk assessment of Port Blair, Andaman Islands, India by using numerical modelling and geospatial techniques. J. Earth Syst. Sci. 2023, 132, 37. [Google Scholar] [CrossRef] [Scilit]
  41. Nujhat, M.; Amin, M.K.; Hasan, G.M.J. Coastal vulnerability assessment of the western coastal zone of Bangladesh using a coupled surge-wave-hydrodynamic model. Ocean Coast. Manag. 2025, 267, 107720. [Google Scholar] [CrossRef] [Scilit]
  42. Liao, X.L.; Meng, C.N.; Tao, K.; Su, P.; Han, Q.M.; Qin, L.J.; Xu, W. Comprehensive Hazard Assessment of Tropical Cyclone-Induced Wind, Rainfall, and Storm Surge: A Case Study of Zhejiang Province, China. Int. J. Disaster Risk Sci. 2026, 17, 590–606. [Google Scholar] [CrossRef] [Scilit]
  43. Nakamura, R.; Mall, M.; Shibayama, T. Street-scale storm surge load impact assessment using fine-resolution numerical modelling: A case study from Nemuro, Japan. Nat. Hazards 2019, 99, 391–422. [Google Scholar] [CrossRef] [Scilit]
  44. Liu, F.T.; Xu, E.R.; Zhang, H.Q. Constructing vulnerability curves considering mitigation capacity to enhance the predictive ability of disaster losses. Nat. Hazards 2025, 121, 10225–10243. [Google Scholar] [CrossRef] [Scilit]
  45. Ahmed, N.; Hoque, M.A.A.; Howlader, N.; Pradhan, B. Flood risk assessment: Role of mitigation capacity in spatial flood risk mapping. Geocarto Int. 2022, 37, 8394–8416. [Google Scholar] [CrossRef] [Scilit]
  46. Mansour, S. Geospatial modelling of tropical cyclone risks to the southern Oman coasts. Int. J. Disaster Risk Reduct. 2019, 40, 101151. [Google Scholar] [CrossRef] [Scilit]
  47. Zhang, C.X.; Yin, K.D.; Shi, X.R.; Yan, X.D. Risk assessment for typhoon storm surges using geospatial techniques for the coastal areas of Guangdong, China. Ocean Coast. Manag. 2021, 213, 105880. [Google Scholar] [CrossRef] [Scilit]
  48. Zhang, S.M.; Zhang, J.; Li, X.M.; Du, X.X.; Zhao, T.Q.; Hou, Q.; Jin, X.F. Quantitative risk assessment of typhoon storm surge for multi-risk sources. J. Environ. Manag. 2023, 327, 116860. [Google Scholar] [CrossRef] [Scilit] [PubMed]
  49. Wang, G.P.; Hu, Z.Y.; Liu, Y.; Zhang, G.M.; Liu, J.F.; Lyu, Y.L.; Gu, Y.; Huang, X.C.; Zhang, Q.Y.; Tong, Z.Z.; et al. Impact of Expansion Pattern of Built-Up Land in Floodplains on Flood Vulnerability: A Case Study in the North China Plain Area. Remote Sens. 2020, 12, 3172. [Google Scholar] [CrossRef] [Scilit]
  50. Do, C.; Kuleshov, Y. Tropical cyclone multi-hazard risk mapping for Queensland, Australia. Nat. Hazards 2023, 116, 3725–3746. [Google Scholar] [CrossRef] [Scilit]
  51. Liu, F.T.; Xu, E.R.; Zhang, H.Q. An improved typhoon risk model coupled with mitigation capacity and its relationship to disaster losses. J. Clean. Prod. 2022, 357, 131913. [Google Scholar] [CrossRef] [Scilit]
  52. Liu, F.T.; Xu, E.R.; Zhang, H.Q. Assessing typhoon disaster mitigation capacity and its uncertainty analysis in Hainan, China. Nat. Hazards 2024, 120, 9401–9420. [Google Scholar] [CrossRef] [Scilit]
  53. Li, Y.; Wu, J.D.; Tang, R.M.; Wu, K.J.; Nie, J.; Shi, P.J.; Li, N.; Liu, L.Y. Vulnerability to typhoons: A comparison of consequence and driving factors between Typhoon Hato (2017) and Typhoon Mangkhut (2018). Sci. Total Environ. 2022, 838, 156476. [Google Scholar] [CrossRef] [Scilit] [PubMed]
  54. Shokatian-Beiragh, M.; Banan-Dallalian, M.; Golshani, A.; Allahdadi, M.N.; Samiee-Zenoozian, M. The effectiveness of mangrove forests as a nature-based solution against flood risk under an extreme weather event. Reg. Stud. Mar. Sci. 2024, 77, 103630. [Google Scholar] [CrossRef] [Scilit]
  55. Nguyen, K.A.; Liou, Y.A.; Terry, J.P. Vulnerability of Vietnam to typhoons: A spatial assessment based on hazards, exposure and adaptive capacity. Sci. Total Environ. 2019, 682, 31–46. [Google Scholar] [CrossRef] [Scilit] [PubMed]
  56. Lochhead, M.; Goldwyn, B.; Venable, C.; Liel, A.B.; Javernick-Will, A. Assessment of hurricane wind performance and potential design modifications for informally constructed housing in Puerto Rico. Nat. Hazards 2022, 112, 1165–1189. [Google Scholar] [CrossRef] [Scilit]
  57. Zeng, D.Q.; Zhang, H.; Li, Q.W.; Ellingwood, B.R. Tropical cyclone damage assessment of distributed infrastructure systems under spatially correlated wind speeds. Struct. Saf. 2021, 91, 102080. [Google Scholar] [CrossRef] [Scilit]
  58. Ye, M.Q.; Wu, J.D.; Liu, W.H.; He, X.; Wang, C.L. Dependence of tropical cyclone damage on maximum wind speed and socioeconomic factors. Environ. Res. Lett. 2020, 15, 094061. [Google Scholar] [CrossRef] [Scilit]
  59. Hou, J.D.; Lv, J.; Chen, X.; Yu, S.W. China’s regional social vulnerability to geological disasters: Evaluation and spatial characteristics analysis. Nat. Hazards 2016, 84, S97–S111. [Google Scholar] [CrossRef] [Scilit]
  60. Dong, Y.H.; Peng, F.L.; Li, H.; Men, Y.Q. Spatial autocorrelation and spatial heterogeneity of underground parking space development in Chinese megacities based on multisource open data. Appl. Geogr. 2023, 153, 102897. [Google Scholar] [CrossRef] [Scilit]
  61. Fox, S.; Agyemang, F.; Hawker, L.; Neal, J. Integrating social vulnerability into high-resolution global flood risk mapping. Nat. Commun. 2024, 15, 3155. [Google Scholar] [CrossRef] [Scilit] [PubMed]
  62. Xing, Z.; Yang, S.; Zan, X.; Dong, X.; Yao, Y.; Liu, Z.; Zhang, X. Flood vulnerability assessment of urban buildings based on integrating high-resolution remote sensing and street view images. Sustain. Cities Soc. 2023, 92, 104467. [Google Scholar] [CrossRef] [Scilit]
  63. Liu, Y.H.; So, E.; Li, Z.Q.; Su, G.W.; Gross, L.; Li, X.L.; Qi, W.H.; Yang, F.; Fu, B.; Yalikun, A.; et al. Scenario-based seismic vulnerability and hazard analyses to help direct disaster risk reduction in rural Weinan, China. Int. J. Disaster Risk Reduct. 2020, 48, 101577. [Google Scholar] [CrossRef] [Scilit]
  64. Hoque, M.A.; Phinn, S.; Roelfsema, C.; Childs, I. Assessing tropical cyclone risks using geospatial techniques. Appl. Geogr. 2018, 98, 22–33. [Google Scholar] [CrossRef] [Scilit]
  65. Xu, H.S.; Ma, C.; Lian, J.J.; Xu, K.; Chaima, E. Urban flooding risk assessment based on an integrated k-means cluster algorithm and improved entropy weight method in the region of Haikou, China. J. Hydrol. 2018, 563, 975–986. [Google Scholar] [CrossRef] [Scilit]
  66. Hoque, M.A.-A.; Pradhan, B.; Ahmed, N.; Sohel, M.S.I. Agricultural drought risk assessment of Northern New South Wales, Australia using geospatial techniques. Sci. Total Environ. 2021, 756, 143600. [Google Scholar] [CrossRef] [Scilit] [PubMed]
  67. Ghosh, P.; Sudarsan, J.S.; Nithiyanantham, S. Nature-Based Disaster Risk Reduction of Floods in Urban Areas. Water Resour. Manag. 2024, 38, 1847–1866. [Google Scholar] [CrossRef] [Scilit]
  68. Fu, X.P.; Wang, M.; Zhang, D.Q.; Chen, F.R.; Peng, X.T.; Wang, L.; Tan, S.K. An XGBoost-SHAP framework for identifying key drivers of urban flooding and developing targeted mitigation strategies. Ecol. Indic. 2025, 175, 113579. [Google Scholar] [CrossRef] [Scilit]
  69. Zheng, Y.T.; Huang, J.Y.; Li, S.; Nie, J.; Chen, H.; Han, G.Y. Socioeconomic impacts on damage risk from typhoons in mega-urban regions in China: A case study using Typhoons Mangkhut and Lekima. Int. J. Disaster Risk Reduct. 2024, 101, 104210. [Google Scholar] [CrossRef] [Scilit]
  70. Chan, F.K.S.; Chen, W.Y.; Sang, Y.F.; Chen, Y.D.; Huang, W.; Chen, W.Q.; Griffiths, J.; Li, J.F.; Peng, Y.; Cai, X.F.; et al. Build in prevention and preparedness to improve climate resilience in coastal cities: Lessons from China’s GBA. One Earth 2021, 4, 1356–1360. [Google Scholar] [CrossRef] [Scilit]
  71. Xiao, S.; Li, N.; Guo, X. Analysis of flood impacts on masonry structures and mitigation measures. J. Flood Risk Manag. 2021, 14, e12743. [Google Scholar] [CrossRef] [Scilit]
  72. Zhu, S.Y.; Li, D.Z.; Feng, H.B.; Zhang, N. The influencing factors and mechanisms for urban flood resilience in China: From the perspective of social-economic-natural complex ecosystem. Ecol. Indic. 2023, 147, 109959. [Google Scholar] [CrossRef] [Scilit]
  73. Cariolet, J.M.; Vuillet, M.; Diab, Y. Mapping urban resilience to disasters—A review. Sustain. Cities Soc. 2019, 51, 101746. [Google Scholar] [CrossRef] [Scilit]
Figure 1. The location and digital elevation model of Haikou.
Remotesensing 18 02770 g001
Figure 2. Mitigation capacity mapping indicator layers: (a) distance to monitoring station, (b) number of disaster mitigation demonstration communities, (c) education level, (d) building structure, (e) coastal shelterbelts, (f) drainage pumping stations, (g) distance to dikes, (h) distance to reservoirs, (i) distance to roads, (j) distance to emergency supply warehouses, (k) distance to typhoon shelters, and (l) distance to healthcare facilities.
Remotesensing 18 02770 g002
Figure 3. Hazard mapping indicator layers: (a) rainfall, (b) wind speed, (c) storm surge height, and (d) typhoon frequency.
Remotesensing 18 02770 g003
Figure 4. Exposure and vulnerability mapping indicator layers: (a) elevation, (b) slope, (c) distance to the coastline, (d) distance to typhoon track, (e) built-up land, (f) cropland, and (g) population density.
Remotesensing 18 02770 g004
Figure 5. Spatial distribution of the risk components and integrated risk of typhoon in Haikou: (a) Hazard, (b) Exposure and Vulnerability, (c) Mitigation Capacity, and (d) Risk.
Remotesensing 18 02770 g005
Figure 6. Local Moran statistics and Getis-Ord Gi* statistics for typhoon risk in Haikou: (a) LISA cluster map and (b) Hotspot Map.
Remotesensing 18 02770 g006
Figure 7. Spatial distributions of typhoon risk derived from different risk formulations: (a) HEV/MC, (b) HEV/(1+MC), (c) HEV.
Remotesensing 18 02770 g007
Table 1. Data types and sources of typhoon risk assessment.
Data TypeIndicatorPeriodSource
Historical typhoon dataTyphoon frequency; distance to typhoon tracks1950–2024Tropical Cyclone Data Center of the China Meteorological Administration, https://tcdata.typhoon.org.cn/
Meteorological dataRainfall; wind speed2015–2024Resource and Environmental Science Data Platform, https://www.resdc.cn/
Storm surge2006–2024Haikou Water Affairs Bureau
Vector dataRoad accessibility2024Resource and Environmental Science Data Platform
Shelters; healthcare facilities2024POI data
Emergency supply warehouses; dikes; reservoirs; drainage pumping stations; monitoring stations2024Haikou Civil Affairs Bureau; Haikou Meteorological Bureau; Haikou Water Affairs Bureau
Remote sensing dataCropland2023Resource and Environmental Science Data Platform
Built-up land2023Resource and Environmental Science Data Platform
Elevation; slope2024Resource and Environmental Science Data Platform
Building structure; coastal shelterbelts2024Manually digitized and interpreted from high-resolution Google Earth imagery
Socioeconomic dataPopulation density2024Resource and Environmental Science Data Platform
Disaster mitigation demonstration communities2024Haikou Emergency Management Bureau
Educational level2024Haikou Statistics Bureau
Table 2. Ranking scheme based on the contribution to typhoon risk.
ComponentIndicatorsRanking (Based on Risk)
Very Low (1)Low (2)Moderate (3)High (4)Very High (5)
HazardRainfall (mm)<64.2364.24–65.1865.19–66.0966.10–66.97>66. 98
Wind speed (m/s)<14.8914.90–15.4015.41–15.9115.92–16.44>16.45
Storm surge height (m)<1.441.45–1.481.49–1.541.55–1.58>1.59
Typhoon frequency (number)<12–45–67–10>11
Exposure and VulnerabilityElevation (m)>9970–9946–7024–46<24
Slope (Degree)>148.68–145.37–8.682.89–5.37<2.89
Built-up land----Built-up land
Cropland---Cropland-
Population density (sq. km)<934934–31373137–79757975–15,439>15,439
Distance to coastline (km)>2515–2510–155–10<5
Distance to typhoon tracks (m)>20001500–20001000–1500500–1000<500
Mitigation capacityDistance to monitoring stations (km)<11–22–33–5>5
Disaster mitigation demonstration communities (number)>53–52–31–2<1
Educational level (%)>2823–2822–2321–22<21
Building structureConcrete house---Brick-wood house
Distance to reservoirs (km)<22–44–66–8>8
Distance to drainage pumping stations (km)>43–42–31–2<1
Distance to dikes (km)<55–1010–1515–25>25
Coastal shelterbelts-Cover-Uncovered-
Distance to roads (m)<500500–10001000–15001500–2000>2000
Distance to emergency supply warehouses (km)<33–66–99–12>12
Distance to typhoon shelters (m)1500500–10001000–15001500–2000>2000
Distance to healthcare facilities (km)<11–22–33–4>4
Table 3. Weight and consistency ratio of indicators calculated by AHP.
ComponentIndicatorsWeightComponent IndicatorsWeight
Hazard
Consistency ratio: 0.0226
Rainfall 0.3369Mitigation capacity
Consistency ratio: 0.000
Prevention capacity
Consistency ratio: 0.0088
Distance to monitoring stations 0.2158
Wind speed 0.2833Disaster mitigation demonstration communities0.1188
Storm surge height 0.2382Educational level0.0654
Typhoon frequency 0.1416Resistance capacity
Consistency ratio: 0.0326
Building structure0.1374
Exposure and Vulnerability
Consistency ratio: 0.0243
Elevation 0.0997Distance to reservoir0.0728
Slope 0.0741Distance to drainage pumping station0.0552
Build-up land0.2202Distance to dikes0.0960
Cropland0.1482Coastal shelterbelts0.0386
Population density 0.1995Rescue capacity
Consistency ratio: 0.0171
Distance to roads0.0717
Distance to coastline0.1482Distance to emergency supply warehouses0.0222
Distance to typhoon tracks 0.1101Distance to typhoon shelters0.0603
Distance to healthcare facilities0.0458
Disclaimer/Publisher’s Note: The statements, opinions and data contained in all publications are solely those of the individual author(s) and contributor(s) and not of MDPI and/or the editor(s). MDPI and/or the editor(s) disclaim responsibility for any injury to people or property resulting from any ideas, methods, instructions or products referred to in the content.