Article

UNet-DFH: A Semantic Segmentation Network Combining Multi-Scale Edge Fusion and Attention-Deformable Modules for Sugarcane Mapping in Heterogeneous Karst Regions

1
College of Geomatics and Geoinformation, Guilin University of Technology, Guilin 541004, China
2
Guangxi Key Laboratory of Ecological Spatio-Temporal Big Data Sensing Service, Guilin 541004, China
3
School of Computer Science, University of Birmingham, Birmingham B15 2TT, UK
*
Author to whom correspondence should be addressed.
Remote Sens. 2026, 18(16), 2815; https://doi.org/10.3390/rs18162815
Submission received: 10 July 2026 / Revised: 17 August 2026 / Accepted: 18 August 2026 / Published: 20 August 2026

Highlights

What are the main findings?
  • The proposed UNet-DFH achieves competitive segmentation accuracy (IoU = 0.8008, OA = 0.9209) on optical–SAR fused data (among five models evaluated under fusion input) and outperforms 11 state-of-the-art models trained under optical-only conditions on the same Guangxi karst dataset, with improved boundary preservation for irregular and fragmented sugarcane plots.
  • In optical–SAR fusion experiments evaluating five distinct models, the integration of Sentinel-1 SAR data with optical imagery yielded a notable gain: Recall surged by 5.5 percentage points, climbing from 83.54% to 89.04%. This enhancement, however, came with a modest trade-off—a decrease in Precision of 3.05 percentage points, from 91.89% to 88.84%. This trade-off reflects the expected increase in false positives due to SAR speckle noise, but the overall gain confirms the net benefit of multimodal fusion.
What are the implications of the main findings?
  • The synergistic combination of the MSEF module and the ADFM highlights that explicitly handling boundary preservation and geometric distortion is beneficial for reliable crop mapping in heterogeneous landscapes, as confirmed by the improved performance on the karst dataset.
  • The proposed framework achieves a favorable balance between accuracy and computational efficiency on the evaluated dataset, and its modular design provides a basis for further adaptation to other fragmented agricultural landscapes.

Abstract

In karst regions, sugarcane mapping faces challenges from fragmented fields, undulating terrain, spectral confusion, and persistent cloud cover, which limit traditional optical remote sensing. To address these issues, we propose a fine-scale extraction framework that integrates Sentinel-2 optical and Sentinel-1 synthetic aperture radar (SAR) imagery through image-level fusion, and introduces a UNet-DFH network with a Multi-Scale Edge Fusion (MSEF) module and an Attention-Deformable Fusion Module (ADFM). This study makes three core contributions: (1) we construct a dedicated optical–SAR collaborative sugarcane extraction dataset for typical karst regions, alleviating the scarcity of multimodal labeled samples; (2) we propose the UNet-DFH network, where MSEF enhances boundary preservation and topological detail in shallow decoding stages, while ADFM improves robustness to geometric deformation and local misalignment in deep semantic stages; (3) we demonstrate that the joint mechanism of edge-preserving filtering and deformable adaptation yields a synergistic effect in addressing the precision–recall trade-off. Experiments in a typical karst area of Guangxi, China, demonstrate that optical–SAR fusion achieves an IoU of 80.08% and an OA of 92.09% during the sugar accumulation and maturity stage. During the more challenging tillering stage, UNet-DFH maintains relatively stable performance under optical-only conditions, with an IoU of 72.98%, Recall of 82.78%, and OA of 92.12%. Moreover, optical–SAR fusion improves Recall by 5.5 percentage points over optical-only inputs (from 83.54% to 89.04%), while Precision exhibits a moderate decrease from 91.89% to 88.84%, reflecting the expected trade-off associated with speckle noise. These results confirm the complementary value of multimodal data and the effectiveness of the proposed modules in preserving fragmented plot boundaries and improving segmentation performance in complex karst terrain. The framework offers a promising approach for high-precision crop mapping in the studied karst agricultural landscape.

1. Introduction

Sugarcane is one of the world’s major sugar crops and an important bioenergy feedstock, playing a critical role in ensuring sugar security and supporting sustainable agricultural development [1]. Guangxi contributes over 60% of national sugarcane production and is China’s largest sugarcane-producing region. Accurate mapping of sugarcane distribution in this region is essential for yield forecasting and precision agriculture management [2,3,4]. However, in complex karst landscapes, sugarcane monitoring via remote sensing faces considerable challenges. Highly fragmented agricultural landscapes result in scattered planting plots with irregular boundaries, where sugarcane is often intermixed with adjacent crops and exposed carbonate rocks. Meanwhile, persistent cloud cover under the subtropical climate causes severe gaps in optical time-series data. These gaps degrade spectral separability during critical phenological stages, substantially limiting the performance of traditional classification algorithms that rely on complete temporal profiles, particularly in cloud-prone and finely fragmented agricultural settings [5,6]. Consequently, optical data alone are insufficient for reliable, large-scale crop identification [7,8]—a limitation that is especially pronounced in karst environments characterized by fragmented terrain, severe spectral mixing, topographic shadowing, and frequent cloud cover.
To overcome the spatiotemporal discontinuity of optical imagery, synthetic aperture radar (SAR) serves as an important complementary data source for multimodal collaborative monitoring. Compared with optical sensors, SAR offers two distinct advantages: its all-weather imaging capability ensures data acquisition regardless of weather and atmospheric conditions, guaranteeing temporal continuity in persistently cloudy subtropical regions [9]; its sensitivity to vegetation geometric structure and surface roughness provides structural information complementary to spectral signatures [10]. These advantages make SAR highly valuable for crop monitoring in cloudy regions. However, in karst environments, the application of SAR data is affected by multiple interacting factors: speckle noise arising from the coherent imaging mechanism [11,12,13], topographic distortions caused by side-looking geometry over undulating terrain [14], and residual local nonlinear pixel shifts—i.e., non-rigid deformation—that persist after global rigid registration between optical and SAR modalities [15,16,17]. Speckle noise and topographic deformation interact spatially, further exacerbating the misalignment and confusion of multimodal features and collectively introducing systematic errors into heterogeneous feature fusion [18,19].
In recent years, deep learning methods have achieved notable progress in multimodal remote sensing segmentation [20,21,22]. However, when applied to the specific challenges of karst environments, existing methods still exhibit clear limitations. On one hand, they struggle to balance noise suppression and edge preservation. MCANet [23] employs cross-attention for optical–SAR feature fusion but lacks explicit edge-preserving modules, resulting in over-smoothed boundaries in fine-grained scenes. CMTFNet [24] and UNetFormer [25] leverage Transformer architectures for global context modeling, yet their self-attention mechanisms tend to generate overly smooth predictions that fail to preserve narrow and irregular parcel boundaries. MCCANet [26] introduces boundary supervision via auxiliary losses, but this operates at the loss level rather than the feature level, providing only limited capability for dynamic edge preservation. On the other hand, the ability to model non-rigid geometric deformation remains absent [27]. Most optical–SAR fusion methods—including MCANet and its variants—assume rigid alignment between modalities after preprocessing, lacking explicit mechanisms to compensate for terrain-induced pixel shifts. Although deformable convolution has been preliminarily explored in remote sensing [28], it is typically applied to single-modal imagery and is not integrated with cross-modal attention to preserve semantic consistency. In summary, existing frameworks face two core bottlenecks in karst environments. First, the lack of explicit structural priors makes it difficult to decouple high-frequency speckle noise from real land-cover textures [29]; conventional smoothing methods inevitably blur fine parcel boundaries while suppressing noise, leading to severe omission of small-scale plots [30]. Second, the neglect of non-rigid deformation—coupled with the rigid alignment assumption—can cause local semantic misalignment and feature contamination, severely disrupting segmentation decision boundaries [31].
To this end, this study proposes a collaborative segmentation framework, named UNet-DFH, for fine-scale sugarcane extraction in karst regions. The main contributions of this study are as follows: (1) We construct a dedicated optical–SAR collaborative sugarcane extraction dataset for a typical karst region, alleviating the scarcity of multimodal labeled samples in this environment. (2) We propose the UNet-DFH collaborative segmentation network, in which a Multi-Scale Edge Fusion (MSEF) module achieves dynamic edge preservation in the shallow decoding stages to enhance boundaries and topological details of small plots, while an Attention-Deformable Fusion Module (ADFM) decouples global context from local non-rigid deformation in the deep semantic stages, improving the elastic representation of cross-modal features. (3) We demonstrate that under strong noise and terrain distortion, the joint mechanism of dynamic edge-preserving filtering and non-rigid deformation decoupling produces a synergistic effect that illustrates the inherent precision-recall trade-off. This provides useful insights for fine-scale crop extraction from multi-source remote sensing in complex land forms.

2. Methods

2.1. Study Area

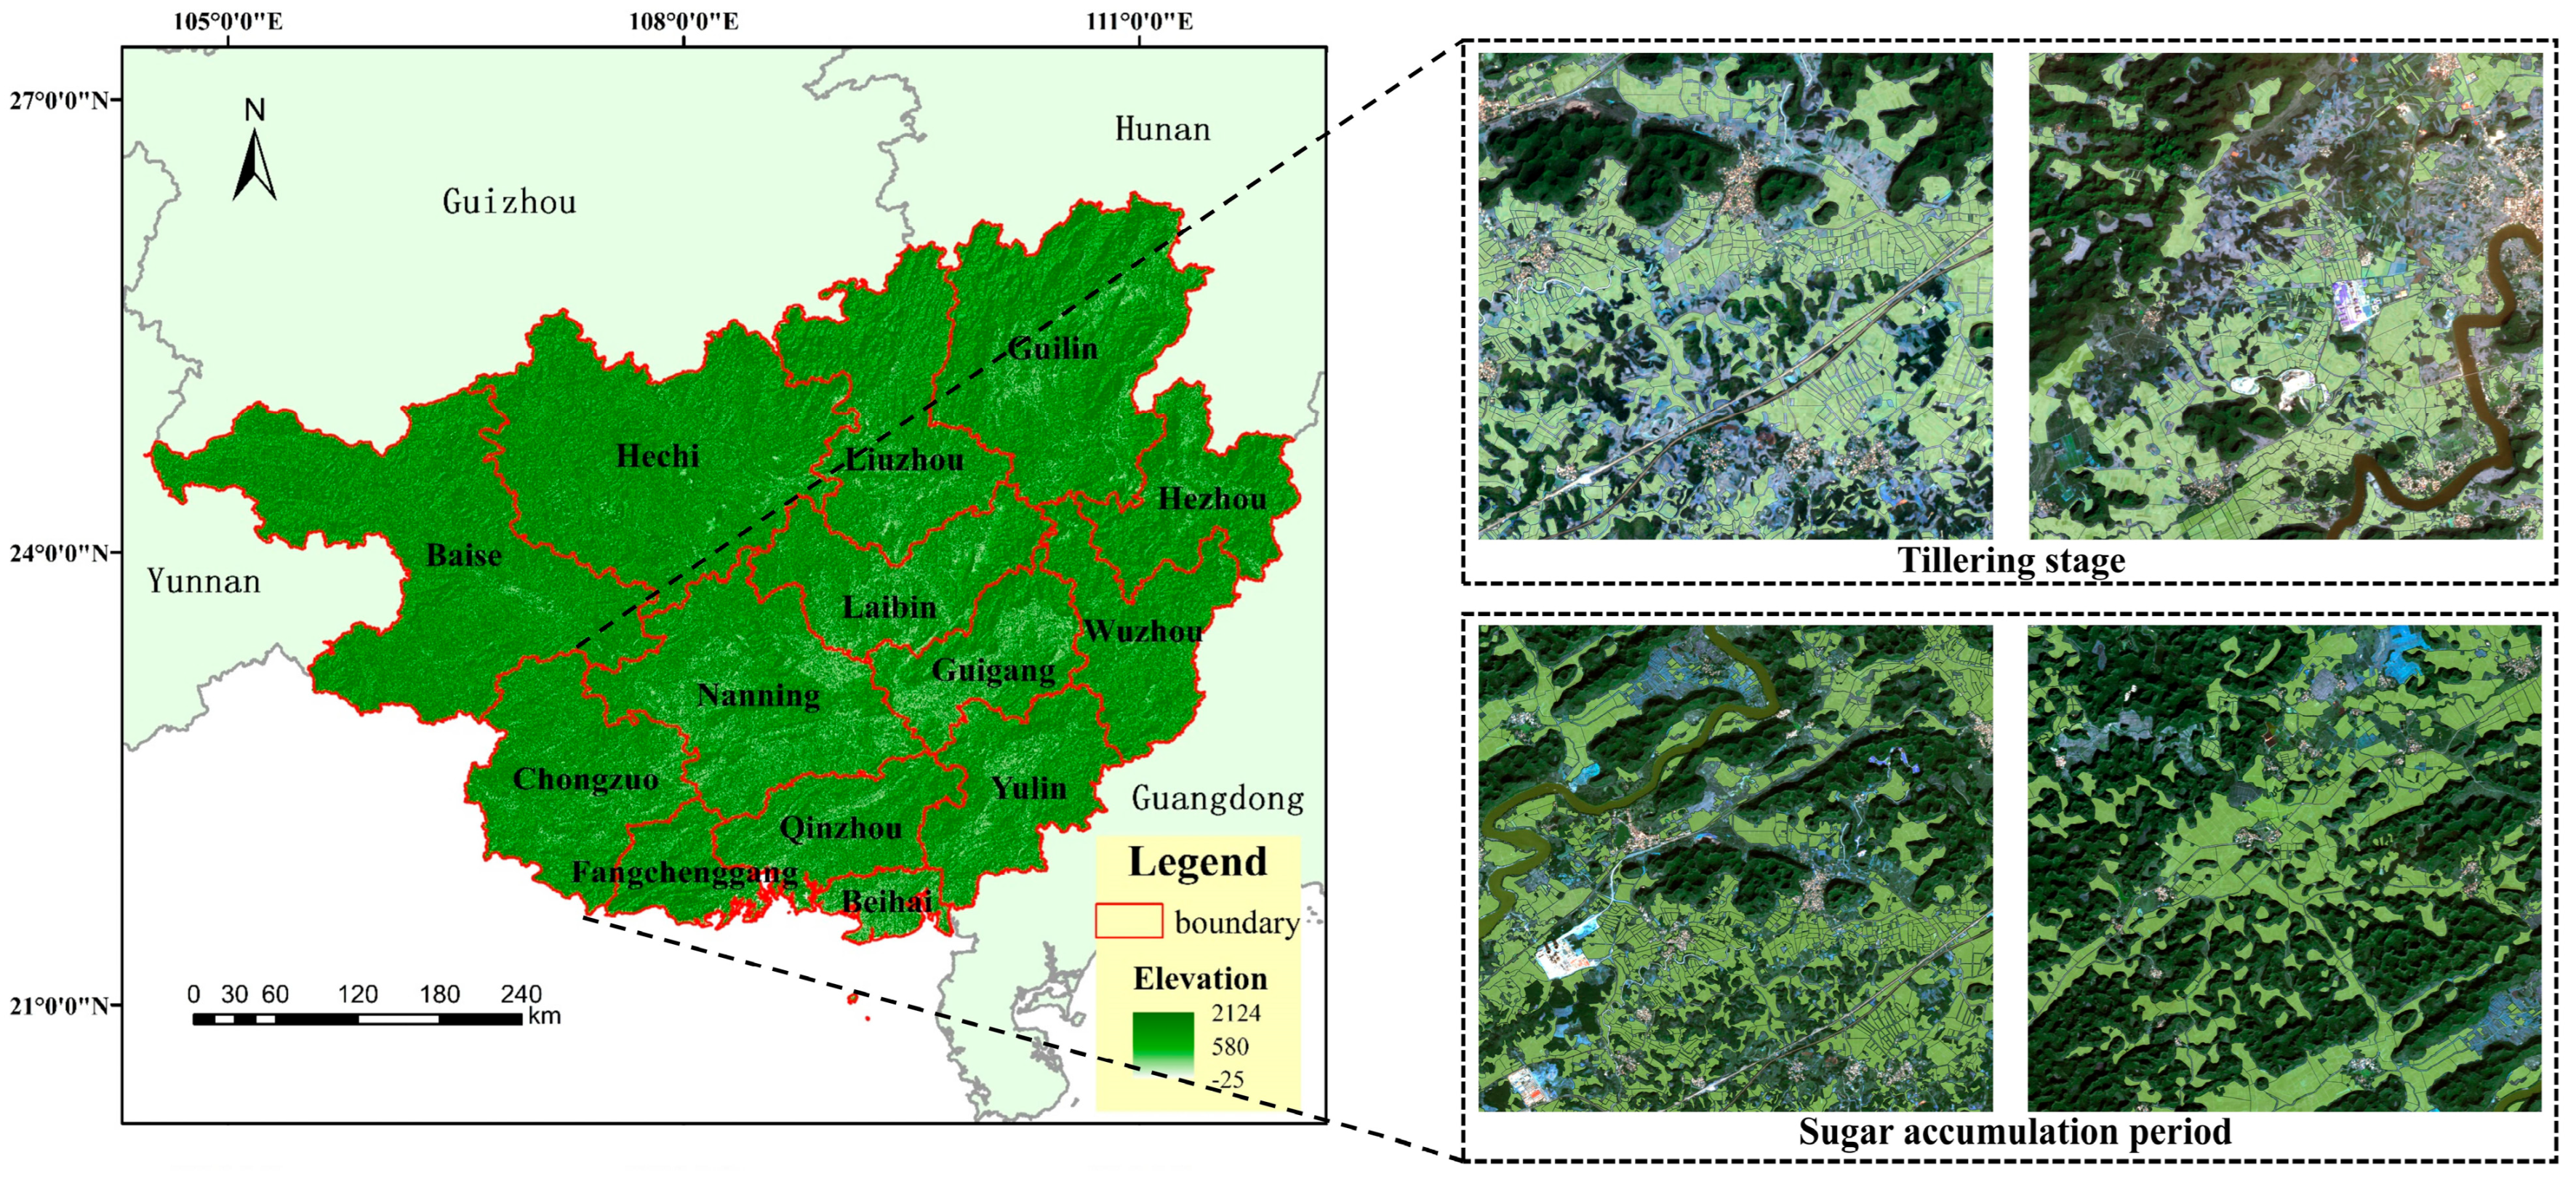
This study selected a typical karst region in Chongzuo City, Guangxi Zhuang Autonomous Region, China, as the study area. Chongzuo is located in southwestern Guangxi (approximately 21°36′–23°22′N, 106°33′–108°6′E) and covers a total area of approximately 17,300 km2. The region is characterized by highly undulating karst terrain, with widespread exposures of carbonate rocks and fragmented agricultural landscapes. Sugarcane planting plots are predominantly small and fragmented, with irregular boundaries. These features pose significant challenges for remote sensing interpretation. The study area has a subtropical monsoon climate. Persistent cloud cover and frequent rainfall are common throughout the growing season. As a result, optical remote sensing imagery is often obscured by cloud cover during critical phenological stages of sugarcane. Sugarcane cultivation in the study area is primarily under decentralized smallholder management, and sugarcane often intermingles with maize, forestland, and other crops. This leads to severe spectral confusion. Therefore, the area is suitable for validating fine-scale segmentation methods in complex agricultural settings, as shown in Figure 1.

2.2. Sentinel Imagery Acquisition and Preprocessing

2.2.1. Data Source

This study used Sentinel-2 multispectral optical imagery and Sentinel-1 C-band synthetic aperture radar (SAR) data to construct the experimental dataset. Both datasets were obtained from the European Space Agency’s Copernicus Open Access Hub (https://dataspace.copernicus.eu/ (accessed on 23 July 2025)) and were subsequently preprocessed using the ESA Sentinel Application Platform (SNAP) version 10.0.0.
Sentinel-2 data: Multispectral images were downloaded as Level-1C (L1C) top-of-atmosphere reflectance products. To ensure image clarity, only acquisitions with less than 15% cloud cover were selected. Considering the variations in sugarcane phenology across Guangxi, two scenes were chosen to represent critical growth stages: the tillering stage (5 March 2024) and the sugar accumulation and maturity stage (10 November 2024). After preprocessing, four spectral bands with a native spatial resolution of 10 m were retained for analysis: blue (B2), green (B3), red (B4), and near-infrared (B8).
Sentinel-1 data: SAR data were acquired in Interferometric Wide Swath (IW) mode as Ground Range Detected (GRD) products, consisting of dual-polarization (VV and VH) channels. In this study, we utilized only the VV polarization band, as it is more sensitive to surface structure and canopy morphology—key factors for distinguishing fragmented sugarcane plots in karst environments. The VH band was not included, as it is more susceptible to volume scattering noise from vegetation density variations. In this acquisition mode, the single-look slant-range resolution is approximately 5 m × 20 m (range × azimuth). After multi-looking and ground-range projection, the standard GRD product has a pixel spacing of 10 m × 10 m, with an effective spatial resolution of approximately 20 m × 22 m. To ensure temporal compatibility with the optical data, SAR acquisitions were selected within a maximum time difference of six days from the corresponding Sentinel-2 overpasses.
Auxiliary data: The Shuttle Radar Topography Mission (SRTM) Global 1 arc second (GL1) Version 3 digital elevation model (DEM) with a 30 m spatial resolution was used for SAR terrain correction, as shown in Table 1.

2.2.2. Data Preprocessing

To eliminate differences in sensor imaging mechanisms and ensure spatiotemporal consistency, rigorous preprocessing and spatial registration were applied to all data. The complete processing workflow is detailed below.
Sentinel-2 preprocessing: The L1C products were atmospherically corrected using the official Sen2Cor tool (v2.11) to generate Level-2A (L2A) bottom-of-atmosphere (BOA) reflectance images, eliminating aerosol interference. The accompanying scene classification masks were used to exclude cloudy pixels. Since the four selected bands (B2, B3, B4, B8) already had a native resolution of 10 m, no further spatial resampling was required for the optical data.
Sentinel-1 preprocessing: The GRD products were processed using the following sequential steps. First, precise orbit state vectors were applied for orbit correction. Second, thermal noise removal was performed. Third, radiometric calibration was conducted to convert digital pixel values to backscatter coefficients (σ0). Fourth, the 30 m SRTM GL1 V3 DEM was reprojected to the WGS-84/UTM zone 48N coordinate system and resampled to 10 m using bilinear interpolation. Range-Doppler terrain correction was then applied using this DEM to geocode the SAR data to the 10 m map grid, simultaneously correcting for geometric distortions caused by side-looking imaging and generating terrain-flattened gamma naught (γ0) values, with the resampled 10 m DEM ensuring that the terrain-corrected product aligns with the Sentinel-2 pixel grid for subsequent spatial alignment. Fifth, a 7 × 7 Refined Lee filter was employed to suppress speckle noise while preserving edge details. Finally, the filtered γ0 values were converted to decibel (dB) scale.
Spatial registration: To achieve precise pixel-level alignment for multi-source fusion, both preprocessed datasets were projected to the common WGS-84/UTM zone 48N coordinate system. Using the Sentinel-2 image as the spatial reference, a fine co-registration was performed on the preprocessed Sentinel-1 image. A total of 25 well-distributed ground control points (GCPs) covering the entire study area were manually selected, and an affine transformation was applied. This ensured that the pixel misregistration between the two modalities was within 0.5 pixels, a threshold widely adopted in multi-temporal and multi-sensor analyses to avoid significant geometric bias [32].

2.2.3. Sample Annotation and Dataset Split

This study used high-resolution Google Earth imagery (October 2024, spatial resolution ~0.5 m) as the primary reference source. We manually delineated sugarcane planting boundaries through visual interpretation. To ensure labeling reliability, two independent annotators with remote sensing interpretation experience performed pixel-wise delineation on a randomly selected subset of 100 patches. The inter-annotator consistency yielded a Cohen‘s Kappa of 0.87 and an Overall Agreement of 94.85%, indicating high reliability. Disagreements were resolved through joint discussion and re-examination against the reference imagery. For the remaining patches, one annotator completed the initial labeling, and the second annotator reviewed and corrected all ambiguous areas. Binary ground-truth masks were then generated. The 10 m pixel grid of Sentinel imagery inherently differs from sub-meter reference imagery, which may introduce boundary uncertainty for narrow field edges and fragmented plots. The above annotation protocol helped ensure the reliability of supervision signals at the edges of fragmented plots and provided high-quality data support for the model to learn complex geometric features.
To prevent spatial information leakage, a geographic block-wise split strategy was adopted instead of simple random splitting. The study area was partitioned into non-overlapping 5 km × 5 km spatial blocks, and patches were assigned to training, validation, and test sets at an approximate 8:1:1 ratio based on these blocks. All images were subsequently cropped into 256 × 256 pixel patches with a uniform 10 m pixel spacing. To augment the limited dataset, a 10% overlap was retained between adjacent patches during extraction; however, because overlapping patches occur within the same block, they are always assigned to the same subset, thereby eliminating cross-subset spatial correlation. Each phenological stage contains 735 patches.
The final partition yielded 588 training, 74 validation, and 73 test patches. Data augmentation strategies including random rotation, horizontal flip, and vertical flip were applied to expand the training set. The validation and test sets received no data augmentation and were only normalized to ensure unbiased evaluation.

2.3. Two-Stage Cascaded Framework

To address the spatial fragmentation, irregular morphology, and severe spectral confusion of sugarcane planting plots in karst regions, this study proposes a two-stage cascaded framework that integrates optical–SAR image fusion and fine semantic segmentation. The framework adopts a decoupled two-stage strategy: optical–SAR image fusion followed by semantic segmentation. This design simplifies model debugging and hyperparameter tuning, and the fused images generated offline can be directly reused across different downstream tasks without retraining the fusion network.
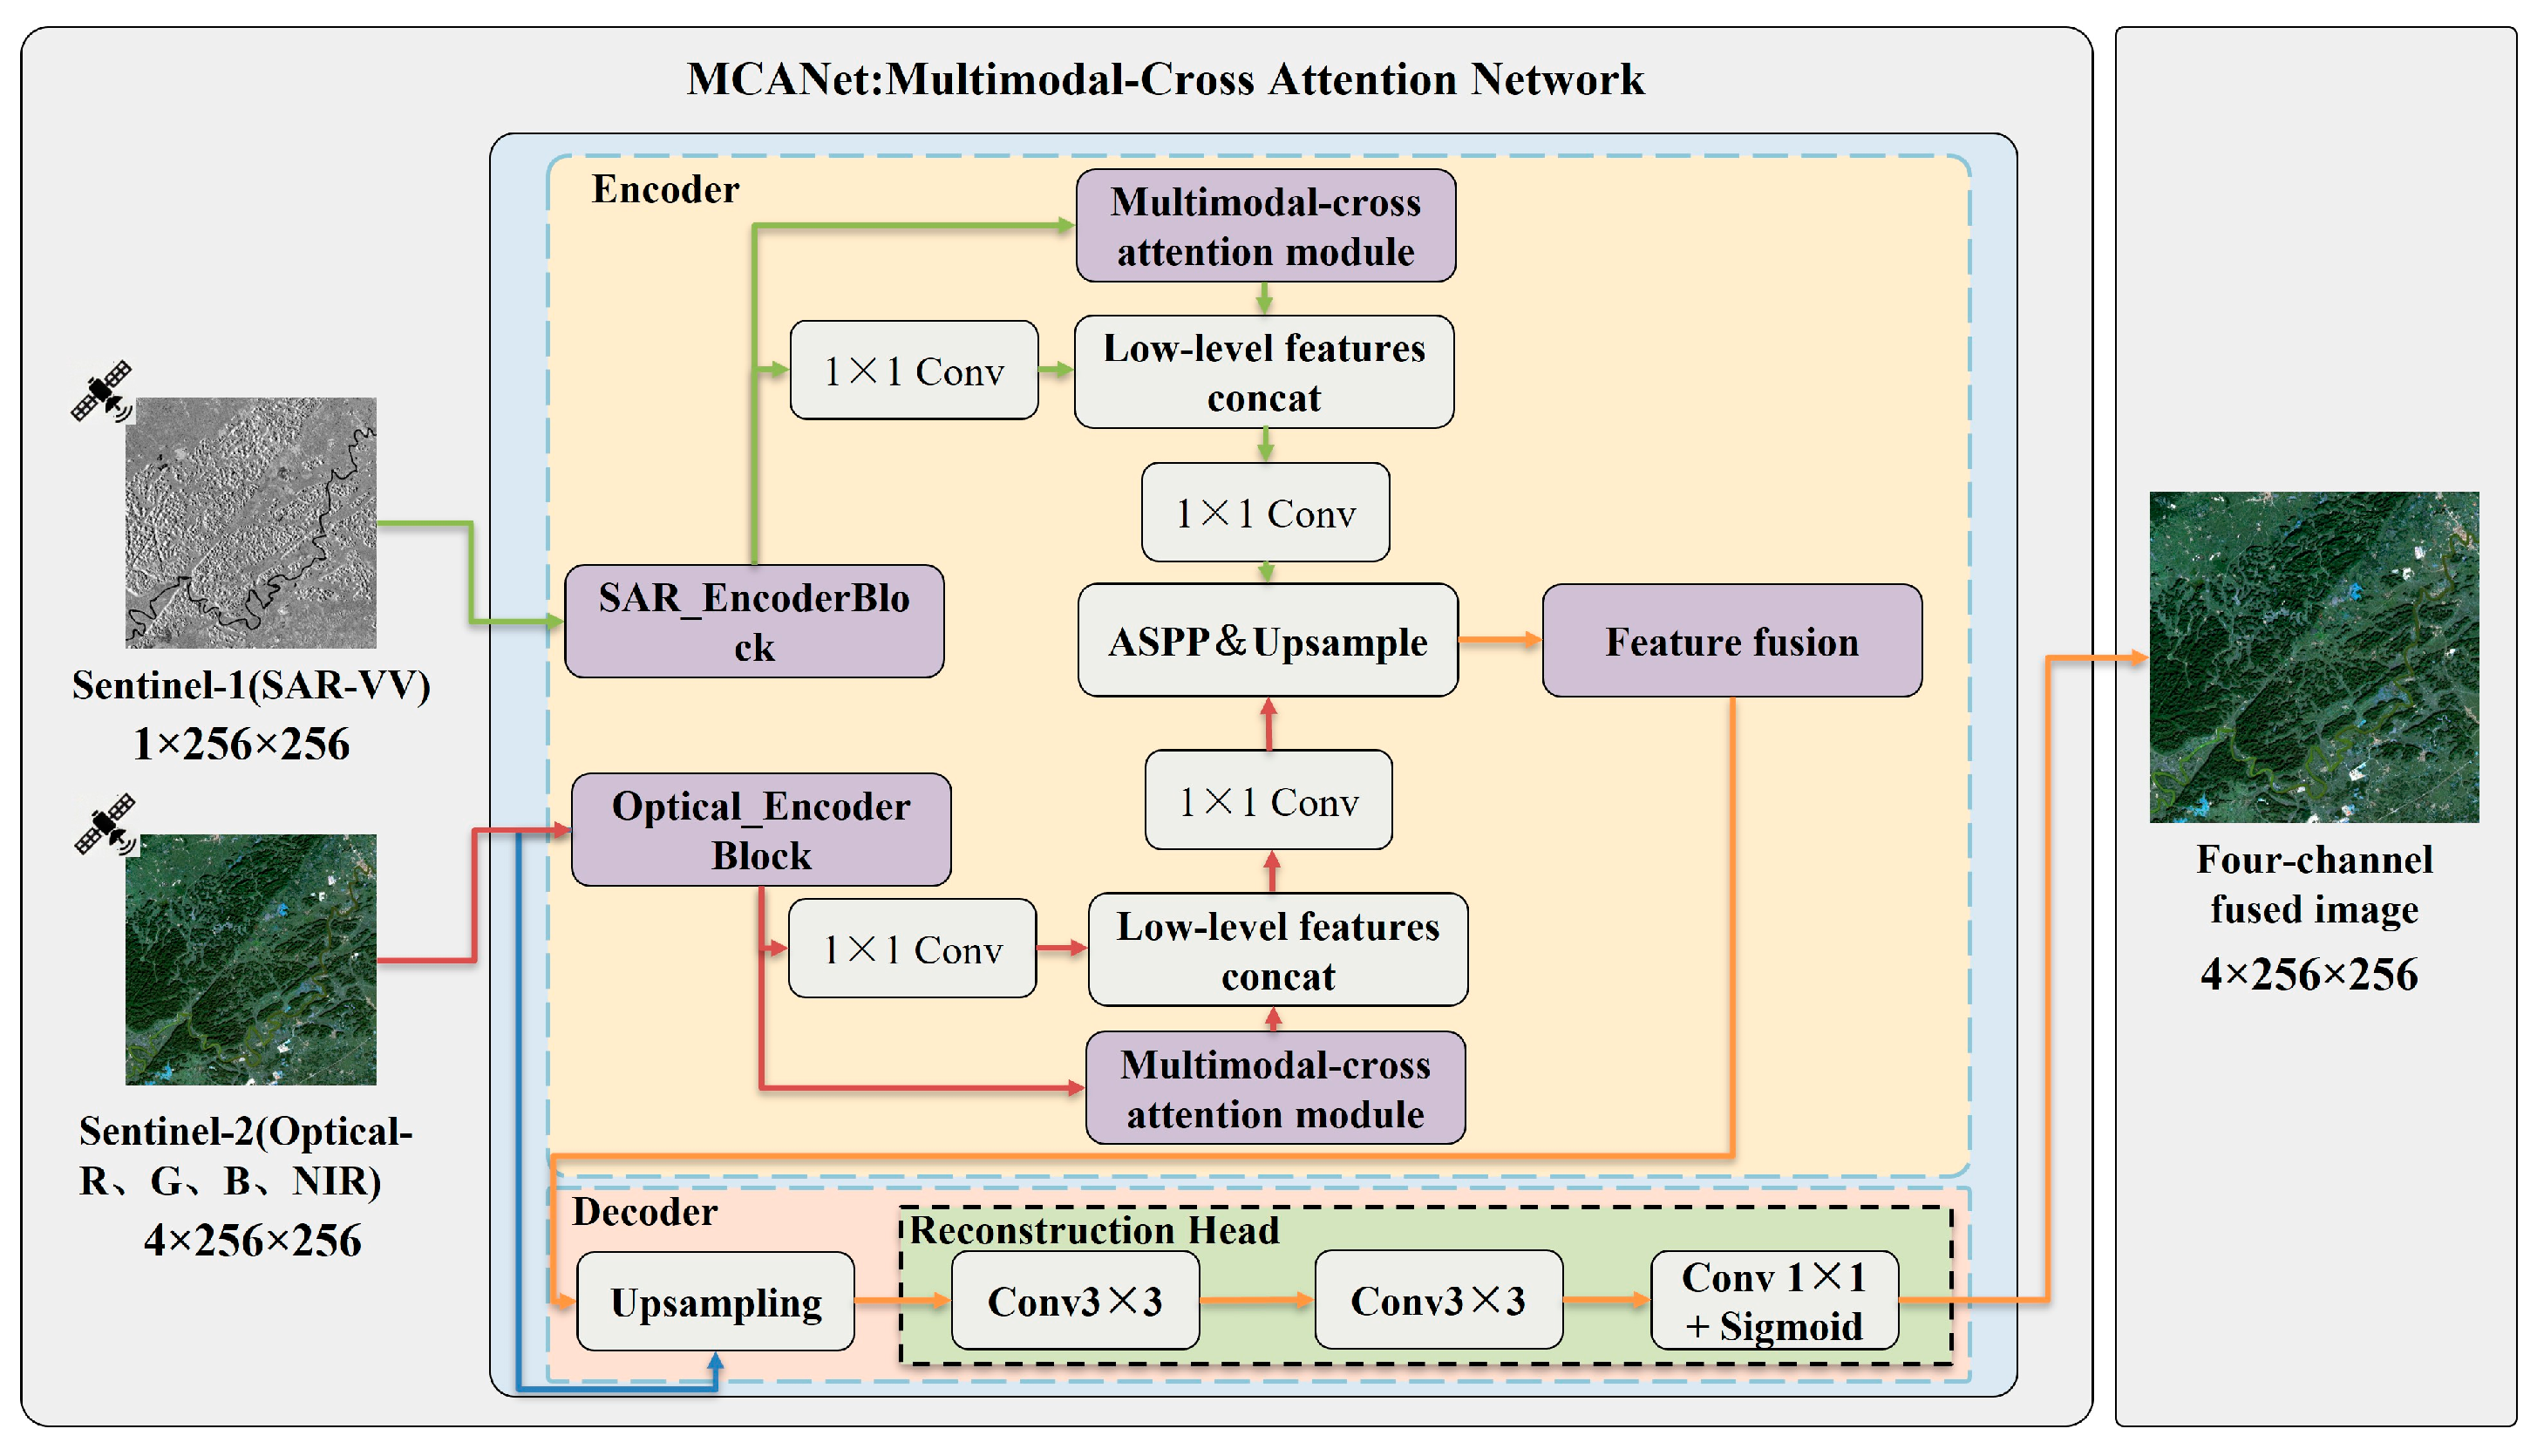
The framework consists of two sequential but decoupled stages: an optical–SAR multimodal image fusion stage, and a segmentation stage featuring detail enhancement and deformation adaptation. The architecture of the optimized MCANet network is shown in Figure 2.
In the optical–SAR multimodal image fusion stage, we adopt MCANet as the fusion backbone, following its original design. MCANet is a dual-stream encoder–decoder network originally designed for land use classification. We initialized the network with publicly available pre-trained weights. To adapt it for image fusion, we replaced the original Softmax classification layer with a reconstruction head consisting of two 3 × 3 convolutional layers followed by a 1 × 1 convolutional layer, with a Sigmoid activation function to constrain the output values to the [0, 1] range, producing a four-channel fused image. In the original MCANet decoder, transposed convolution was used for upsampling, which can introduce checkerboard artifacts in reconstruction tasks. We replaced transposed convolutions with bilinear upsampling followed by standard 3 × 3 convolutions, reducing such artifacts while maintaining upsampling quality.
To adapt the pretrained MCANet to karst-specific image characteristics, we collected an independent set of 200 optical–SAR image pairs from a neighboring karst region spatially separated from our study area. This independent dataset shares the same acquisition dates and phenological coverage as the main study dataset. It was used exclusively for fine-tuning the reconstruction head of MCANet, with the encoder backbone frozen. The dataset was randomly split into training (80%) and validation (20%) subsets. The network was trained for 20 epochs using the AdamW optimizer (β1 = 0.9, β2 = 0.999, weight decay = 1 × 10⁻⁴) with a learning rate of 1 × 10⁻⁵. For the loss function, we replaced the cross-entropy classification loss with a composite reconstruction loss composed of three terms: L1 pixel loss, SSIM structural similarity loss, and SAM spectral angle mapping loss, which constrain pixel-wise accuracy, structural similarity, and spectral fidelity, respectively. The total loss is defined as L f u s i o n = λ 1 · L L 1 + λ 2 · L S S I M + λ 3 · L S A M , with weights set to λ 1 = 1.0, λ 2 = 0.5, and λ 3 = 0.3. The original four-band optical image served as the training target. The resulting four-band fused image, into which SAR structural information from the VV polarization was integrated, served as the input to the subsequent segmentation stage.
The UNet-DFH segmentation network consists of two complementary modules that jointly address the dual challenges of karst crop mapping. The MSEF module operates in the shallow decoder stages, where spatial resolution is highest, to enhance boundary details and preserve fine topological structures of fragmented plots. The ADFM operates at the bottleneck bridge, where semantic abstraction is richest, to compensate for terrain-induced non-rigid geometric deformation. Through the decoder’s progressive up-sampling pathway, the ADFM-refined deep features and MSEF-enhanced shallow features are gradually integrated via skip connections, enabling the network to simultaneously preserve fine-grained spatial details and maintain global semantic coherence.
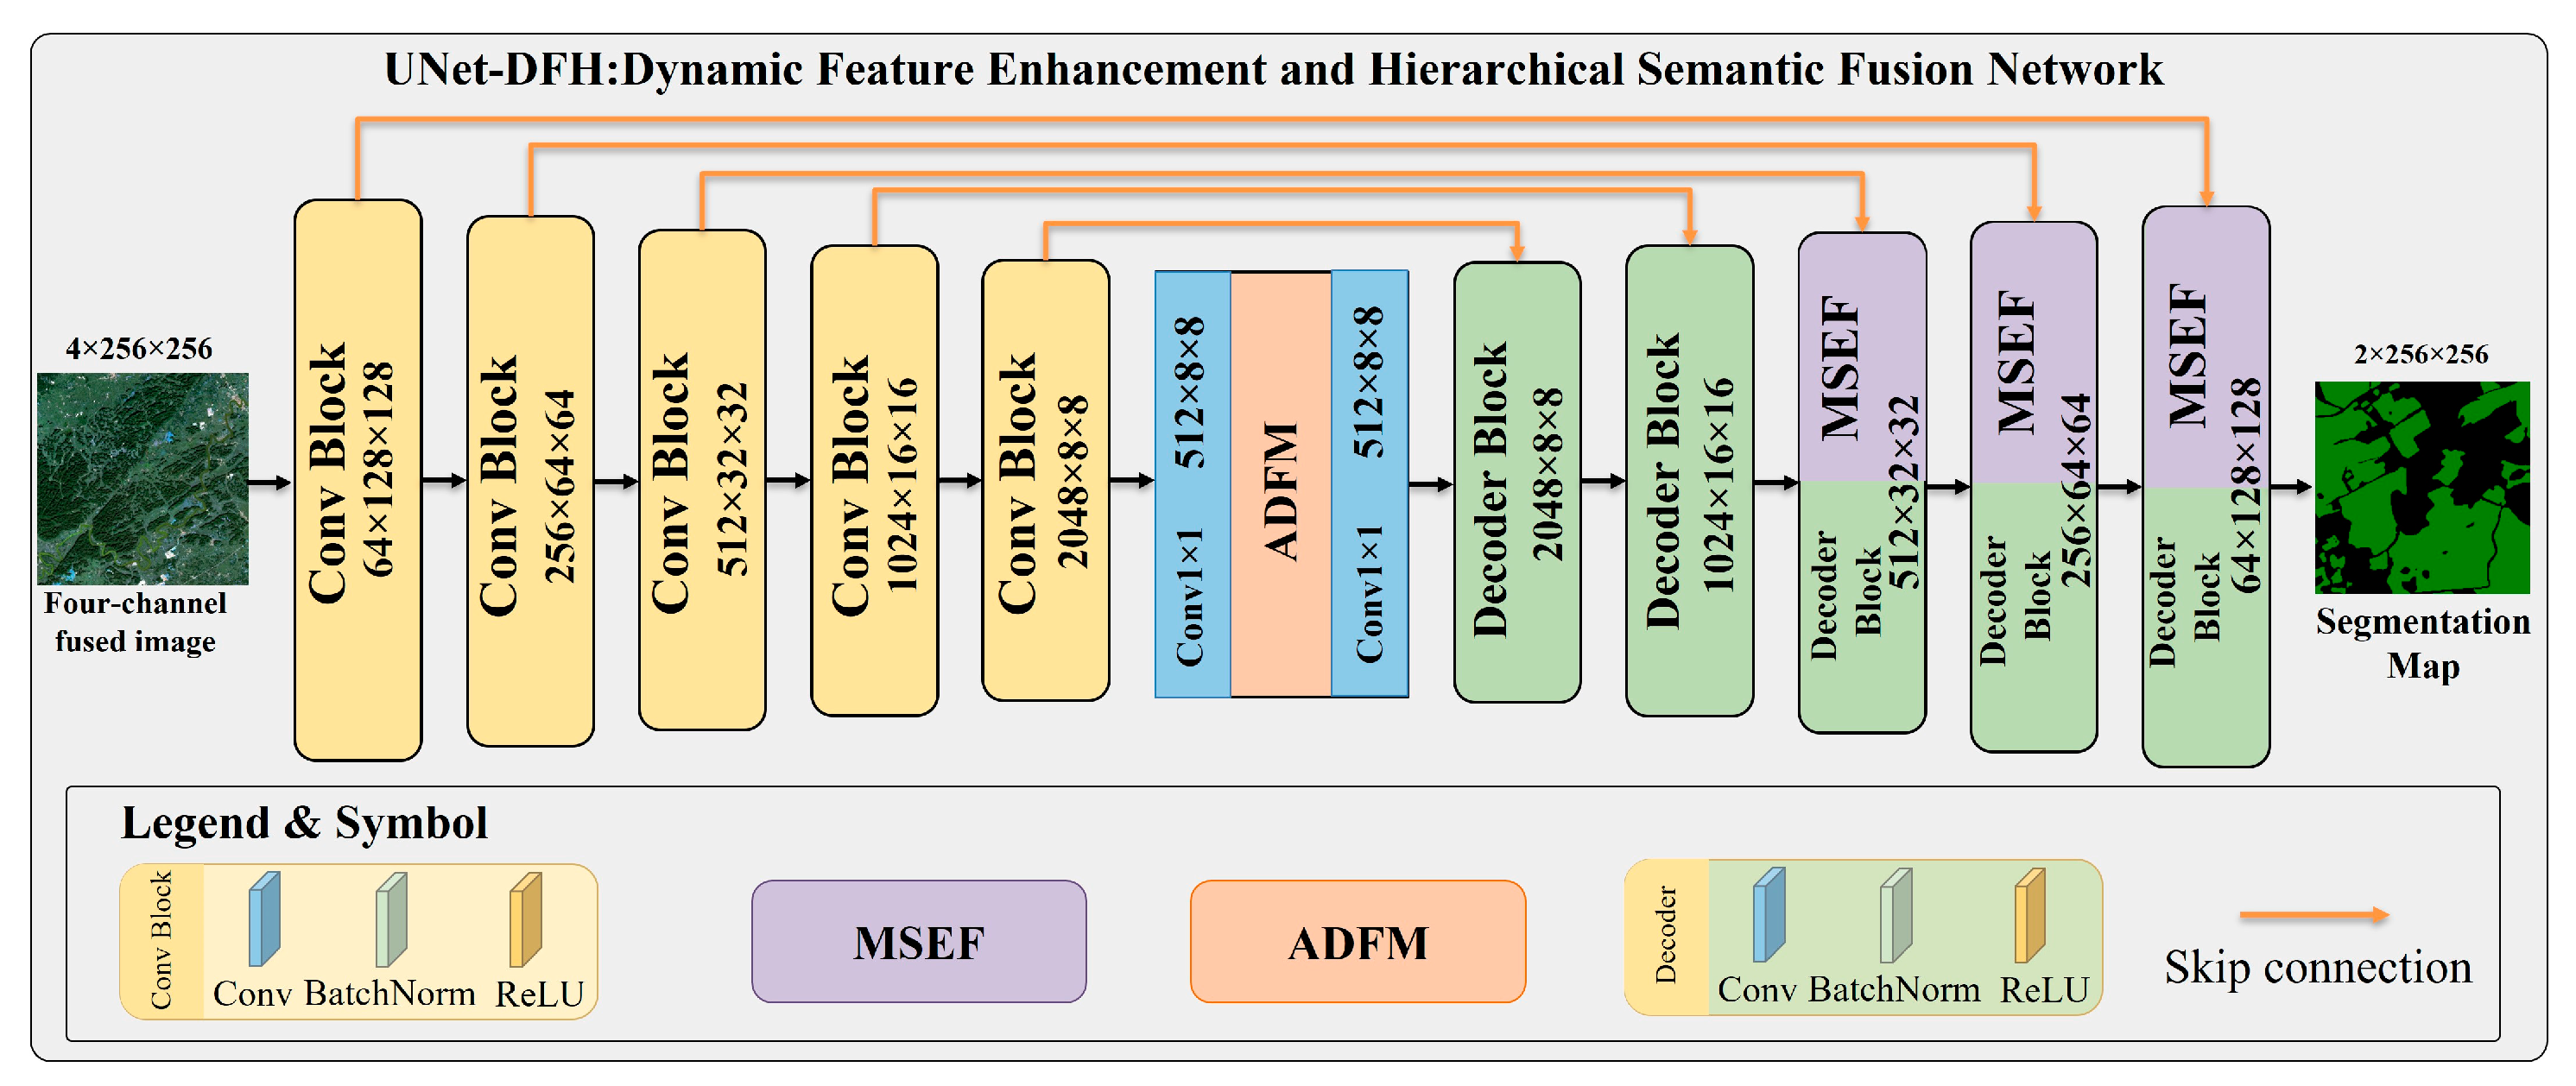
The UNet-DFH segmentation network is trained independently using the pre-generated fused four-channel images and the corresponding binary sugarcane ground-truth masks. The detailed process is illustrated in Figure 3.

2.4. UNet-DFH Segmentation Network Architecture

The UNet-DFH is based on the classic U-Net framework and consists of an encoding path, decoding path, and cross-layer feature connections. Unlike the standard U-Net, this study introduces two major improvements to the network from two aspects: boundary and detail enhancement, and geometric representation capability. In shallow layers, the focus is on preserving boundaries and enhancing details. In deep layers, the focus is on strengthening semantic consistency and spatial structure understanding. The encoding path progressively extracts multi-scale semantic features. The decoding path restores spatial resolution through progressive upsampling and integrates shallow detail information via skip connections.

2.4.1. Multi-Scale Edge Fusion Module (MSEF)

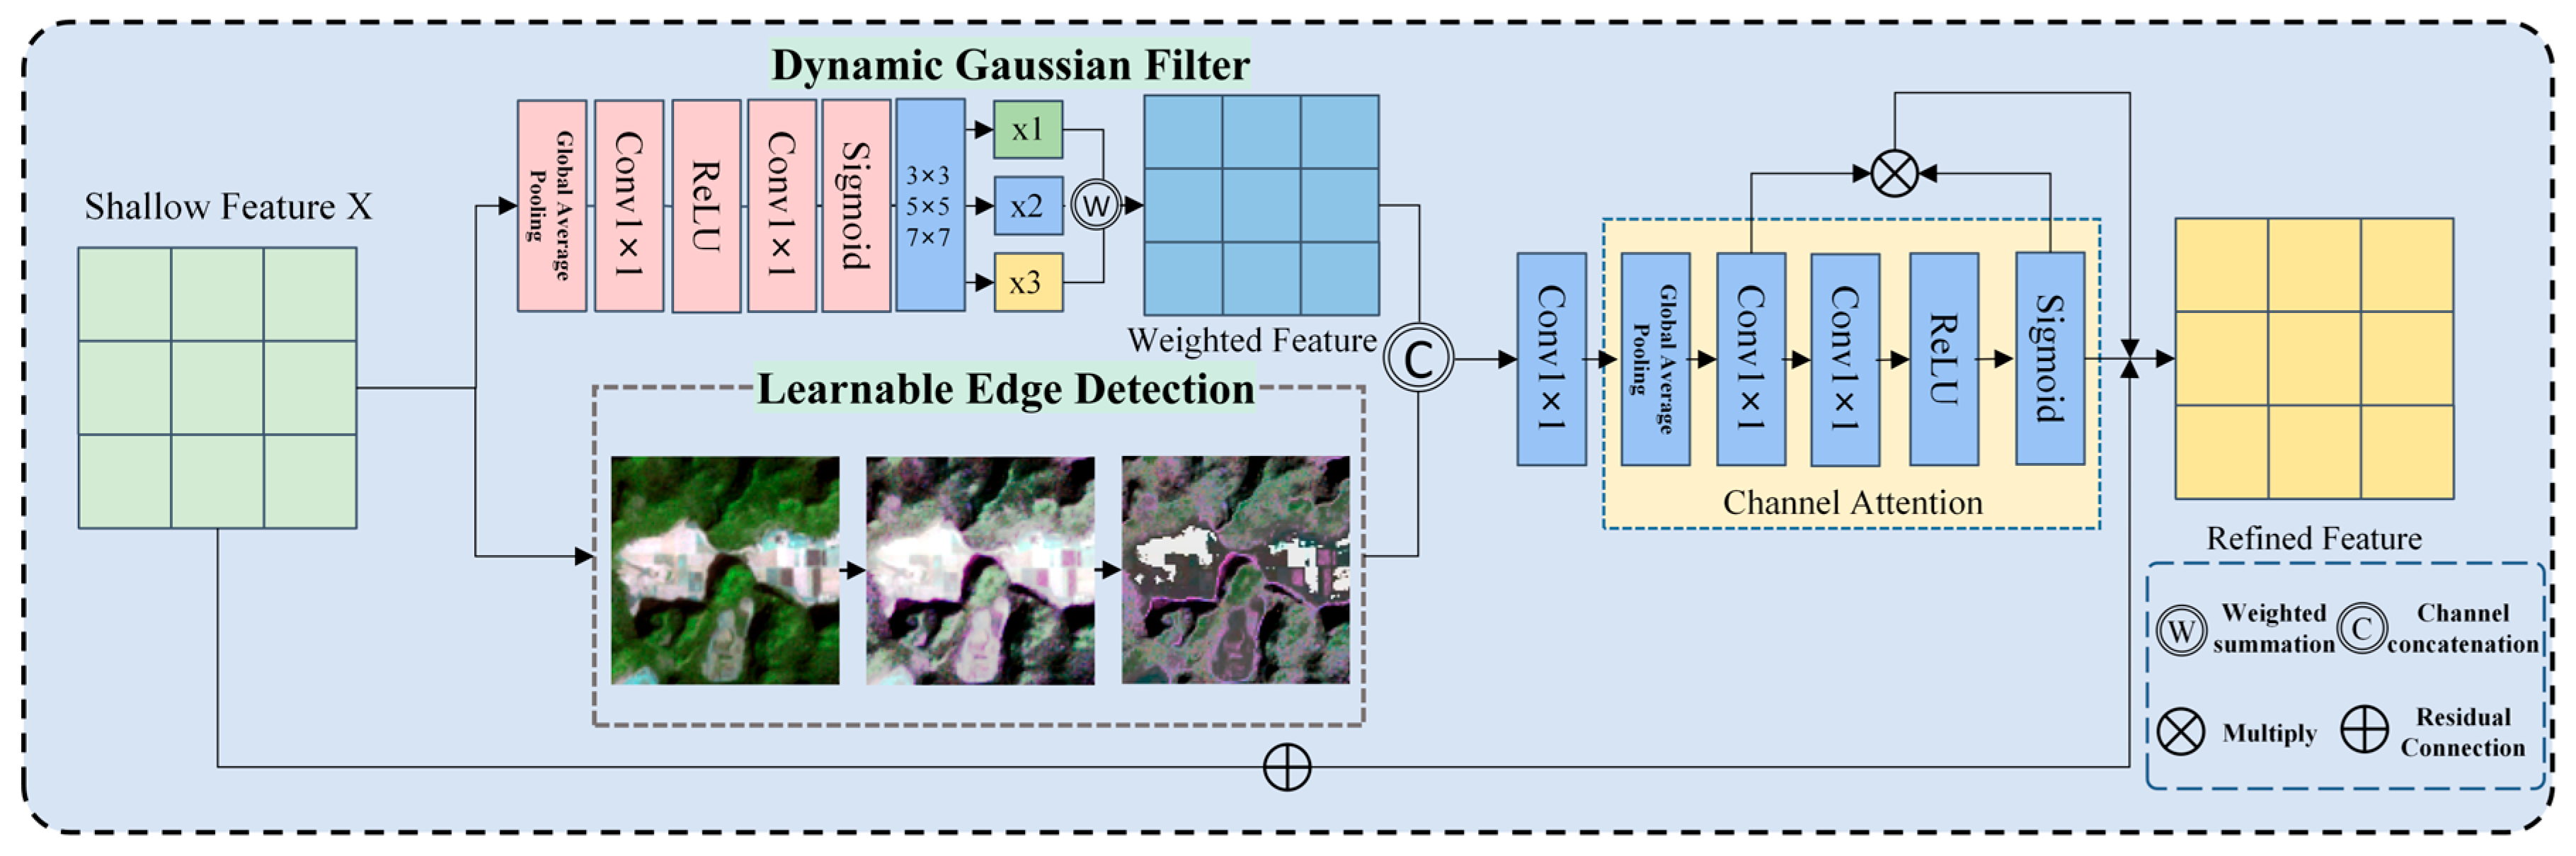
As illustrated in Figure 4, in the decoder’s high-resolution up-sampling stages, feature maps possess rich spatial detail but are susceptible to interference from optical background variations and SAR speckle noise. To address this, we designed the Multi-Scale Edge Fusion (MSEF) module to enhance boundary representations and preserve fine-scale topological structures of fragmented sugarcane plots. This module was placed exclusively on the skip connection feature maps in the shallow decoder stages, where spatial detail is richest. This module consists of two parallel branches: a dynamic Gaussian filtering branch and a learnable edge detection branch. The synergistic combination of these two branches enables effective enhancement of structural characteristics while maintaining spatial fidelity.
The dynamic Gaussian filtering branch adaptively selects multi-scale smoothing kernels based on the global context of the input feature. Unlike conventional Gaussian filtering with fixed kernel sizes, this branch captures the overall structural characteristics of the input feature X R H × W × C and predicts scale-wise aggregation weights. It uses global average pooling (GAP) to extract a feature vector, then generates normalized multi-scale weight coefficients ω k through a two-layer 1 × 1 convolution mapping followed by Softmax normalization. The calculation formula is shown in Equation (1).
ω k = Softmax MLP GAP X , k { 3 , 5 , 7 }
where k represents the receptive field size of the Gaussian convolution kernel and ω k denotes the fusion weight for the Gaussian kernel at the k -th scale, with the weights normalized by Softmax to sum to 1. The MLP is implemented with two layers of 1 × 1 convolution for non-linear feature mapping, while GAP compresses the spatial dimensions of the input feature X into a channel-wise feature vector. Subsequently, the generated weights are used to fuse three parallel multi-scale Gaussian operators G k . The definition of G k is shown in Equation (2).
G k u , v = 1 2 π σ k 2 exp u 2 + v 2 2 σ k 2
where u and v represent the spatial coordinate offsets within the Gaussian kernel, typically with the kernel center as the origin. σ k is the standard deviation of the k -th scale Gaussian kernel. It controls the spread of the Gaussian distribution. The term e x p denotes the exponential function. The factor 2 π σ k 2 is the normalization constant of the Gaussian distribution. It ensures that the kernel weights sum to 1. The final output of the filtering branch, denoted as F D G F , is expressed as shown in Equation (3).
F D G F = k { 3,5 , 7 } ω k X G k
Through this global context-driven weighting mechanism, the network adjusts the scale selection according to the overall texture complexity of each input feature map: maps with relatively homogeneous textures favor larger kernels, while those with more fragmented patterns emphasize smaller kernels. By providing a structurally enriched input to the subsequent edge detection branch, the dynamic Gaussian filter facilitates more accurate boundary responses.
To address the problem of blurred sugarcane field boundaries, the other branch uses a learnable grouped convolution initialized with Sobel operators. During training, its kernels evolve through gradient descent. This enables the branch to capture complex non-linear edge features in karst regions, as shown in Equation (4).
F L E D = LearnableConv X , W S o b e l
The dual-branch features are concatenated along the channel dimension, and a channel attention mechanism is then introduced to explicitly model the interdependencies between channels and re-weight the concatenated geometric features. The process is expressed in Equation (5).
F r e f i n e = Sigmoid MLP GAP F D G F , F L E D F D G F , F L E D
Finally, the original shallow features X are fused with the reconstructed features using residual connections to ensure that spatial details are fully preserved. The calculation formula is given by Equation (6).
X out = X + Conv 1 × 1 F r e f i n e
This design enhances boundary discrimination accuracy in complex karst landscapes with severe spectral confusion and fragmented agricultural patterns.

2.4.2. Attention-Deformable Fusion Module (ADFM)

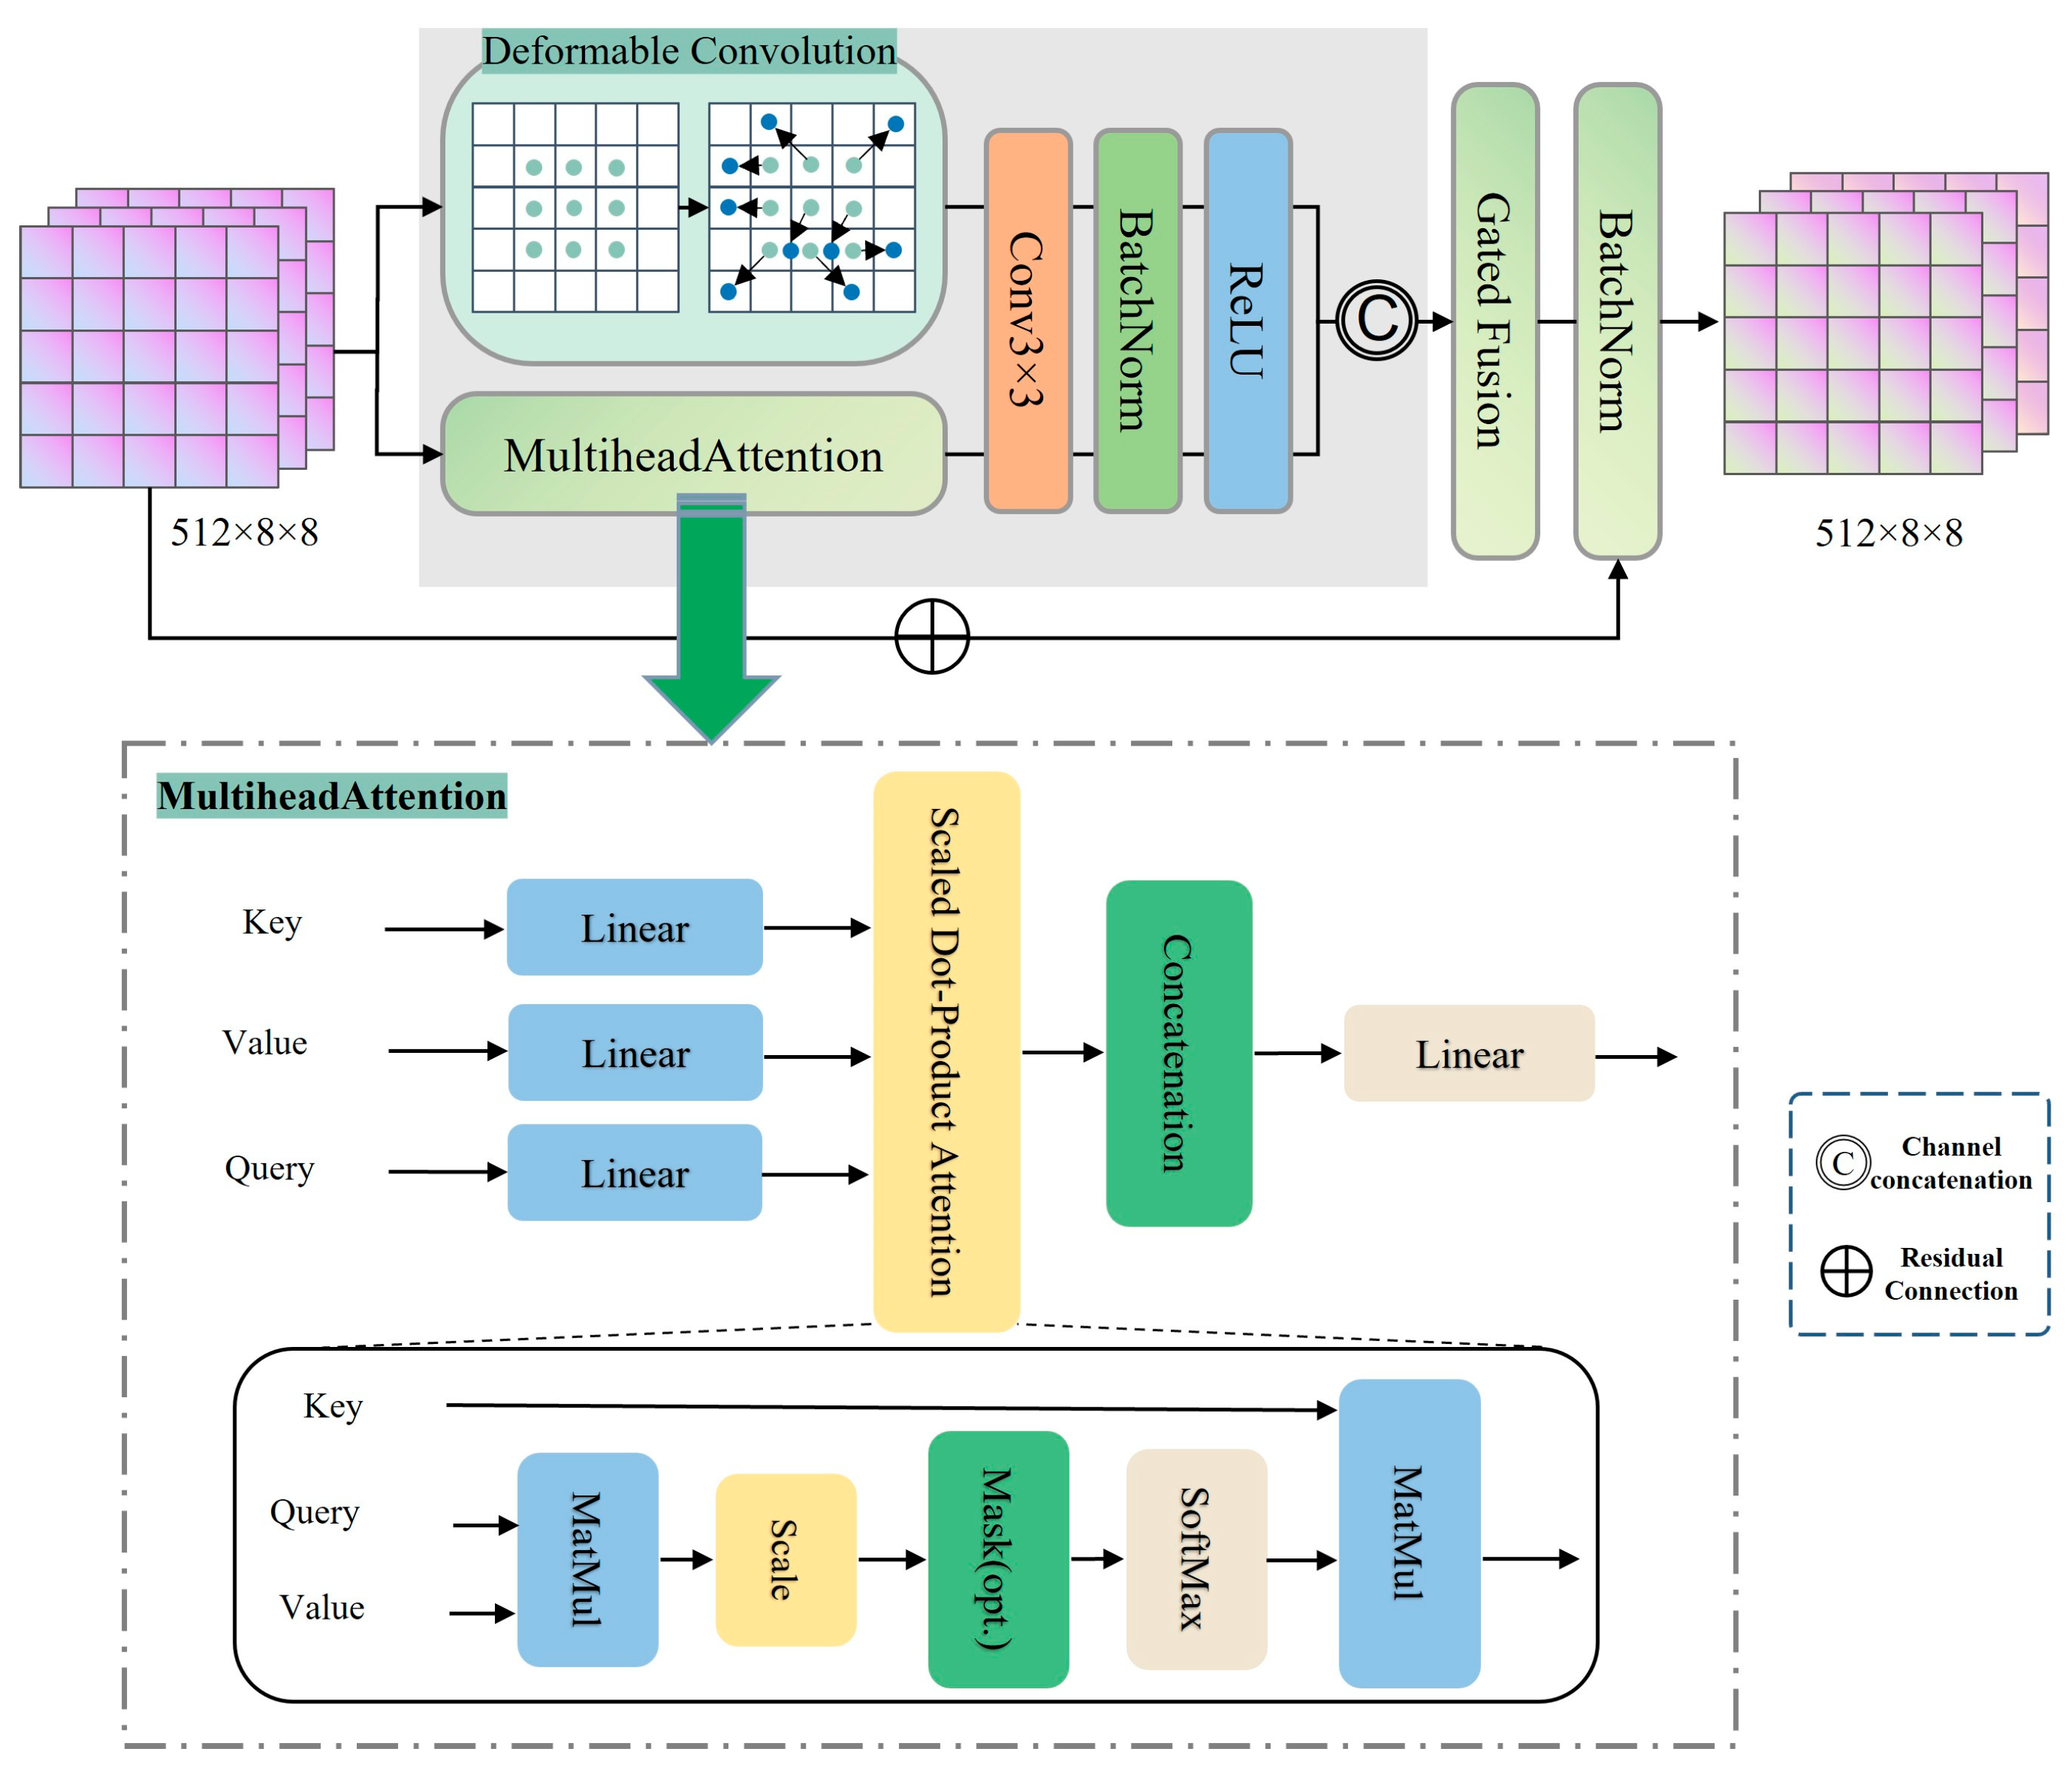
To further enhance the model’s ability to resolve non-rigid geometric deformation of fragmented and distorted plots in complex karst regions, this study introduces an Attention-Deformable Fusion Module (ADFM) into the bridge layer between the encoder and decoder. Specifically, the deepest encoder features (2048 channels, 1/32 resolution) are first projected to 512 channels via a 1 × 1 bottleneck convolution, after which the ADFM enhances these compressed features. The enhanced features are then projected back to 2048 channels via another 1 × 1 convolution with a residual connection. This bottleneck design reduces computational cost by a factor of approximately 16 × (20482/5122 = 16), as both multi-head self-attention and deformable convolution scale quadratically with channel dimension. The ADFM is configured with 8 attention heads (head dimension 64), a 3 × 3 deformable convolution with four groups, and an offset field predicted by a 3 × 3 convolution generating 18 offset channels (padding = 1). In the deep feature space, semantic information is rich, but the low spatial resolution often blurs the geometric shapes of small plots. ADFM combines multi-head self-attention (MHA) for global context and deformable convolution (DCN) for local geometric compensation. The structure is shown in Figure 5.
The MHA branch captures global semantic dependencies. For an input feature F i n R H × W × C , query vectors Q, key vectors K, and value vectors V are first generated through mapping. The calculation formula for the i -th attention head is shown in Equation (7).
head i = Softmax Q i K i T d k V i
where d k is the feature dimension scaling factor. The outputs from all heads are aggregated as F M H A , as shown in Equation (8).
F M H A = Concat head 1 , , head h W O
This mechanism allows the network to capture long-range dependencies and use semantic consistency to reduce confusion between sugarcane and spectrally similar background vegetation.
To more effectively respond to the typical non-rigid plot geometries, this module introduces deformable convolution to enhance the network’s spatial adaptability. Unlike standard convolution, DCN predicts an offset field p n through an additional lightweight convolutional layer. This shifts the sampling points toward the geometric center of the target plot. The detailed process is shown in Equation (9).
F D C N p 0 = p n R w p n F i n p 0 + p n + Δ p n
where p 0 represents the current center position. p n represents the offset in the regular sampling grid. This design enables the network to capture non-rigid deformation and compensates for the geometric information loss caused by deep downsampling.
To balance global semantic consistency and local shape accuracy, this study employs a Gated Fusion Network. This mechanism dynamically weighs the dual-branch features by learning a spatial mask. First, F M H A and F D C N are concatenated. A lightweight convolutional layer then generates a spatial gating weight G     [ 0 ,   1 ] , as shown in Equation (10). The fused feature is computed as shown in Equation (11).
G = σ Conv 1 × 1 F M H A , F D C N
F f u s e d = G F D C N + 1 G F M H A
where σ denotes the Sigmoid activation function, and denotes element-wise multiplication. Finally, a residual connection and batch normalization (BN) produce the final feature F o u t , as shown in Equation (12).
F o u t = B N F i n + F f u s e d

2.5. Loss Function

To simultaneously ensure pixel-level classification accuracy, alleviate class imbalance in karst regions, and improve the segmentation quality of fragmented boundaries, we designed a composite loss function. It consists of a weighted sum of Weighted Cross Entropy (WCE), Focal Loss, and Dice Loss. The proposed loss guides model optimization from three complementary perspectives: distribution, difficulty, and region overlap. The total loss function L t o t a l is defined as shown in Equation (13).
L t o t a l = λ W C E L W C E + λ F o c a l L F o c a l + λ D i c e L D i c e
where λ W C E , λ F o c a l , and λ D i c e are hyperparameters that represent the weights of each loss term.
  • Weighted Cross-Entropy
In karst regions, sugarcane plots are scattered across complex landscapes, resulting in a highly uneven class distribution. This study adopts WCE loss as the basic classification loss. Class weight factors w c are introduced to increase the contribution of the sugarcane class, as shown in Equation (14).
L W C E = 1 N i = 1 N c = 1 C w c y i , c log p i , c
where N is the total number of pixels in a mini-batch, C is the number of classes, y i , c indicates whether pixel i belongs to class c , p i , c is the predicted probability, and w c is computed from the inverse frequency of the class pixel proportion in the training set.
2.
Focal Loss
In karst mountainous areas, sugarcane and surrounding vegetation share similar spectral characteristics, resulting in hard-to-classify samples. To address this issue, Focal Loss is introduced. A modulating factor 1 p i , c γ is used to dynamically reduce the weight of well-classified samples. This encourages the model to focus its training on edge-fragmented and extremely small sugarcane plots, as shown in Equation (15).
L F o c a l = 1 N i = 1 N c = 1 C α c 1 p i , c γ y i , c log p i , c
where α c is a balancing factor used to adjust the ratio of positive to negative samples; γ is the focus parameter (set to 2 in this study), used to adjust the rate of loss reduction.
3.
Dice Loss
Dice Loss is introduced to improve boundary delineation and prevent boundary blurring caused by terrain undulation. It directly measures the overlap between predicted and ground truth regions and is sensitive to plot shape features, as shown in Equation (16).
L D i c e = 1 2 i = 1 N p i y i + ϵ i = 1 N p i + i = 1 N y i + ϵ
where p i and y i represent the predicted value and the ground truth value of pixel i , respectively; ϵ is a smoothing factor used to prevent the denominator from becoming zero and to ensure numerical stability.

2.6. Experimental Parameter Settings

All experiments were conducted on a single NVIDIA RTX 2060 GPU using Python 3.11 and PyTorch 2.4.1. To ensure reproducibility, a fixed random seed of 42 was used. Considering the memory constraints of some models, the batch size was fixed at 4, and the input image size was 256 × 256 pixels. The Adam optimizer was used with a fixed learning rate of 1 × 10⁻⁴ and weight decay of 1 × 10⁻⁴. The weighting coefficients of the loss function were set to λ W C E = 0.5, λ F o c a l = 0.3, and λ D i c e = 0.2, determined through preliminary experiments in which multiple combinations were tested; the selected configuration yielded the best overall performance. Data augmentation—random rotation, horizontal flip, and vertical flip—was applied only to the training set. All models were trained for a fixed 100 epochs without early stopping, as the loss curves (Section 3.4) confirmed sufficient convergence. The best model was selected based on the highest validation IoU during training. To ensure fair comparison, all methods were trained with identical configurations including learning rate, batch size, optimizer settings, and number of epochs.
To evaluate the semantic segmentation performance of the model, we used six evaluation metrics: Intersection over Union (IoU), Precision, Recall, F1-score, Overall Accuracy (OA), and Boundary F1-score (B-F1) as shown in Equations (17)–(22).
IoU = T P T P + F P + F N
Precision = T P T P + F P
Recall = T P T P + F N
F 1 = 2 × Precision × Recall Precision + Recall
OA = TP + TN TP + TN + FP + FN × 100 %
B F 1 = 2 × T P b 2 × T P b + F P b + F N b
where TP, TN, FN, and FP represent true positives, true negatives, false negatives, and false positives, respectively. Precision measures the reliability of positive predictions; Recall measures the proportion of actual positives correctly identified; and IoU quantifies the overlap between prediction and ground truth. For B F 1 , T P b , F P b , and F N b are computed on extracted boundary pixels, where a predicted boundary point is matched to a ground-truth point if their distance is within a tolerance of 2 pixels. B-F1 thus provides a quantitative assessment of boundary delineation quality.

3. Results

3.1. Sugarcane Mapping Performance of Optical Imagery Across Phenological Stages

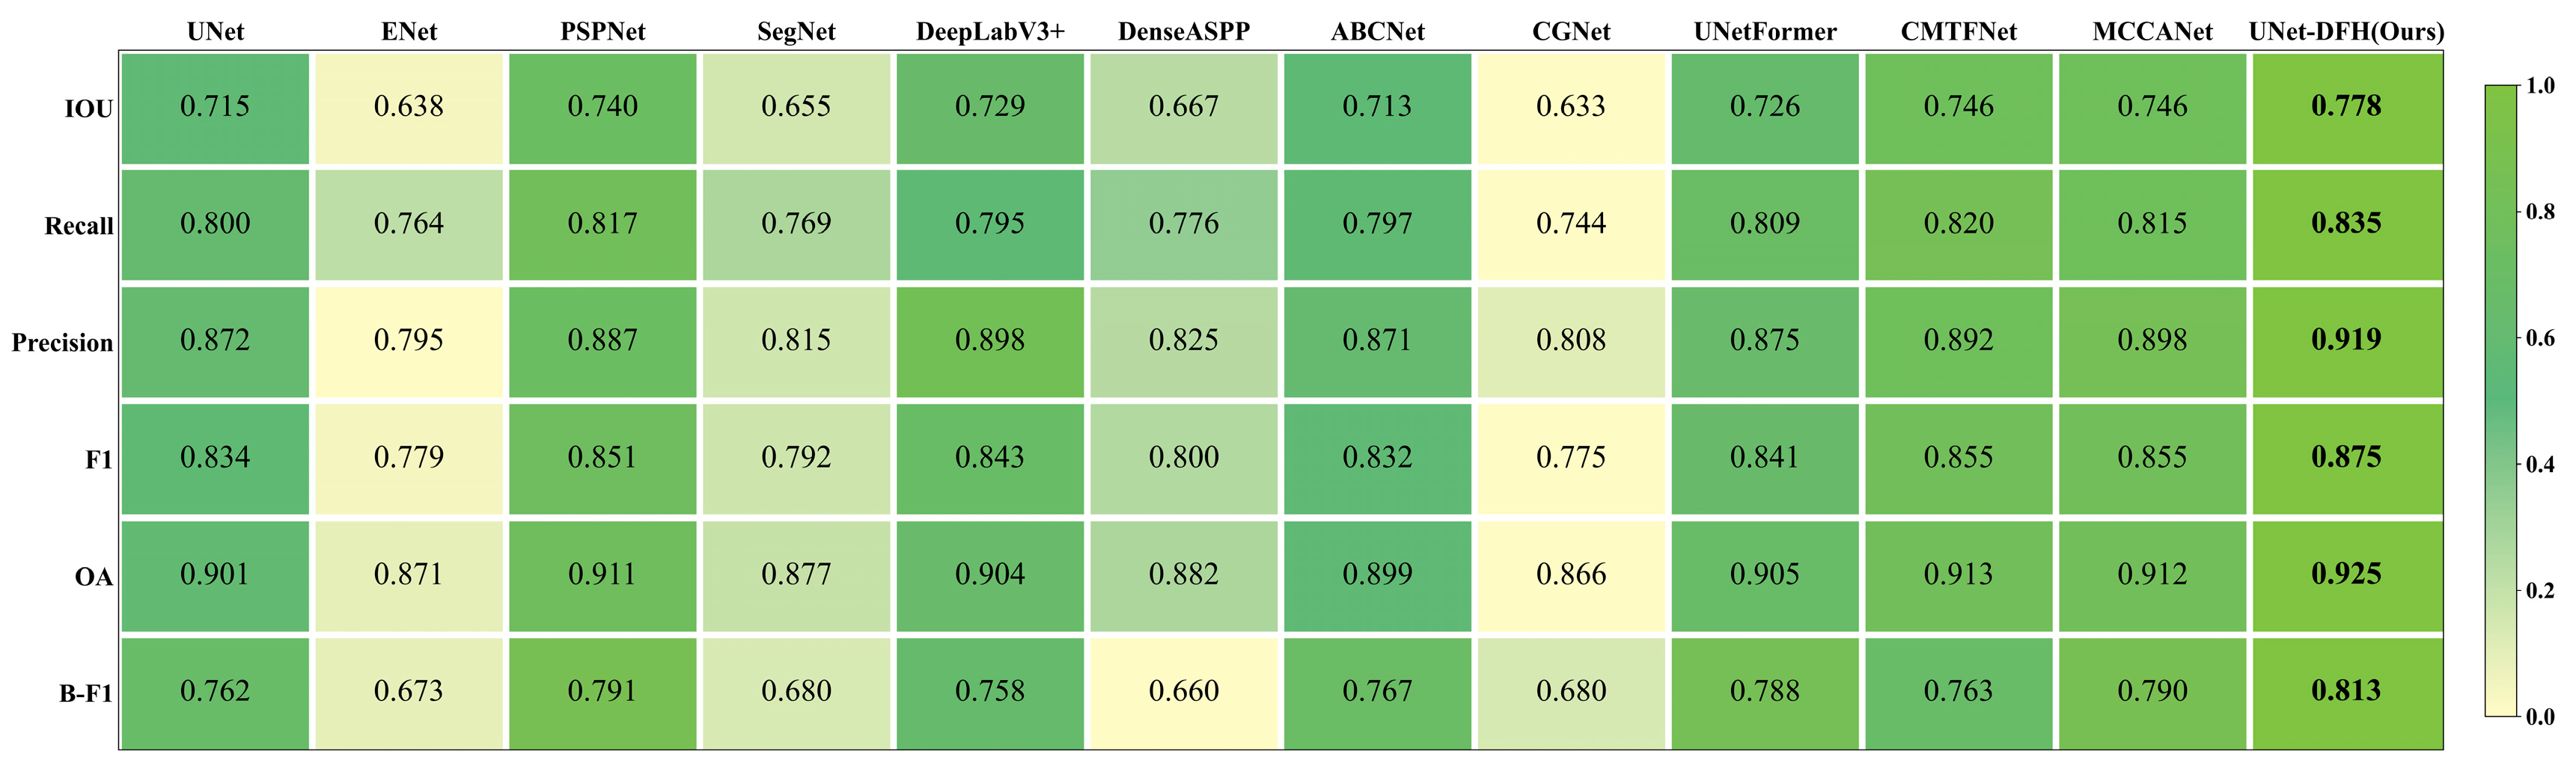
To comprehensively evaluate the segmentation stability of optical imagery across different growth stages, this study selected multi-temporal optical images from typical sugarcane growth phases. The same network architecture and training strategy were applied. Models were trained independently for each phenological stage. U-Net [33] served as the baseline model and was compared with several semantic segmentation models, including ENet [34], PSPNet [35], SegNet [36], DeepLabV3+ [37], DenseASPP [38], ABCNet [39], CGNet [40], UNetFormer, CMTFNet, and MCCANet. The detailed results are shown in Figure 6, Figure 7, Figure 8 and Figure 9.
As illustrated in Figure 6, UNet-DFH outperformed the comparison methods on all evaluation metrics. In complex karst habitats, the segmentation performance of traditional convolutional networks is highly susceptible to background clutter. During the sugar accumulation and maturity stage, the baseline U-Net achieved an IoU of only 0.715. In contrast, UNet-DFH was the top-performing framework, achieving an IoU of 0.778 and an OA of 0.925, which outpaced the baseline U-Net by 6.3 and 2.4 percentage points, respectively. Across all evaluated models, advanced architectures such as UNetFormer (IoU = 0.726) and CMTFNet (IoU = 0.746) achieved the second-best performance, whereas lightweight networks like ENet (IoU = 0.638) suffered from severe performance degradation.
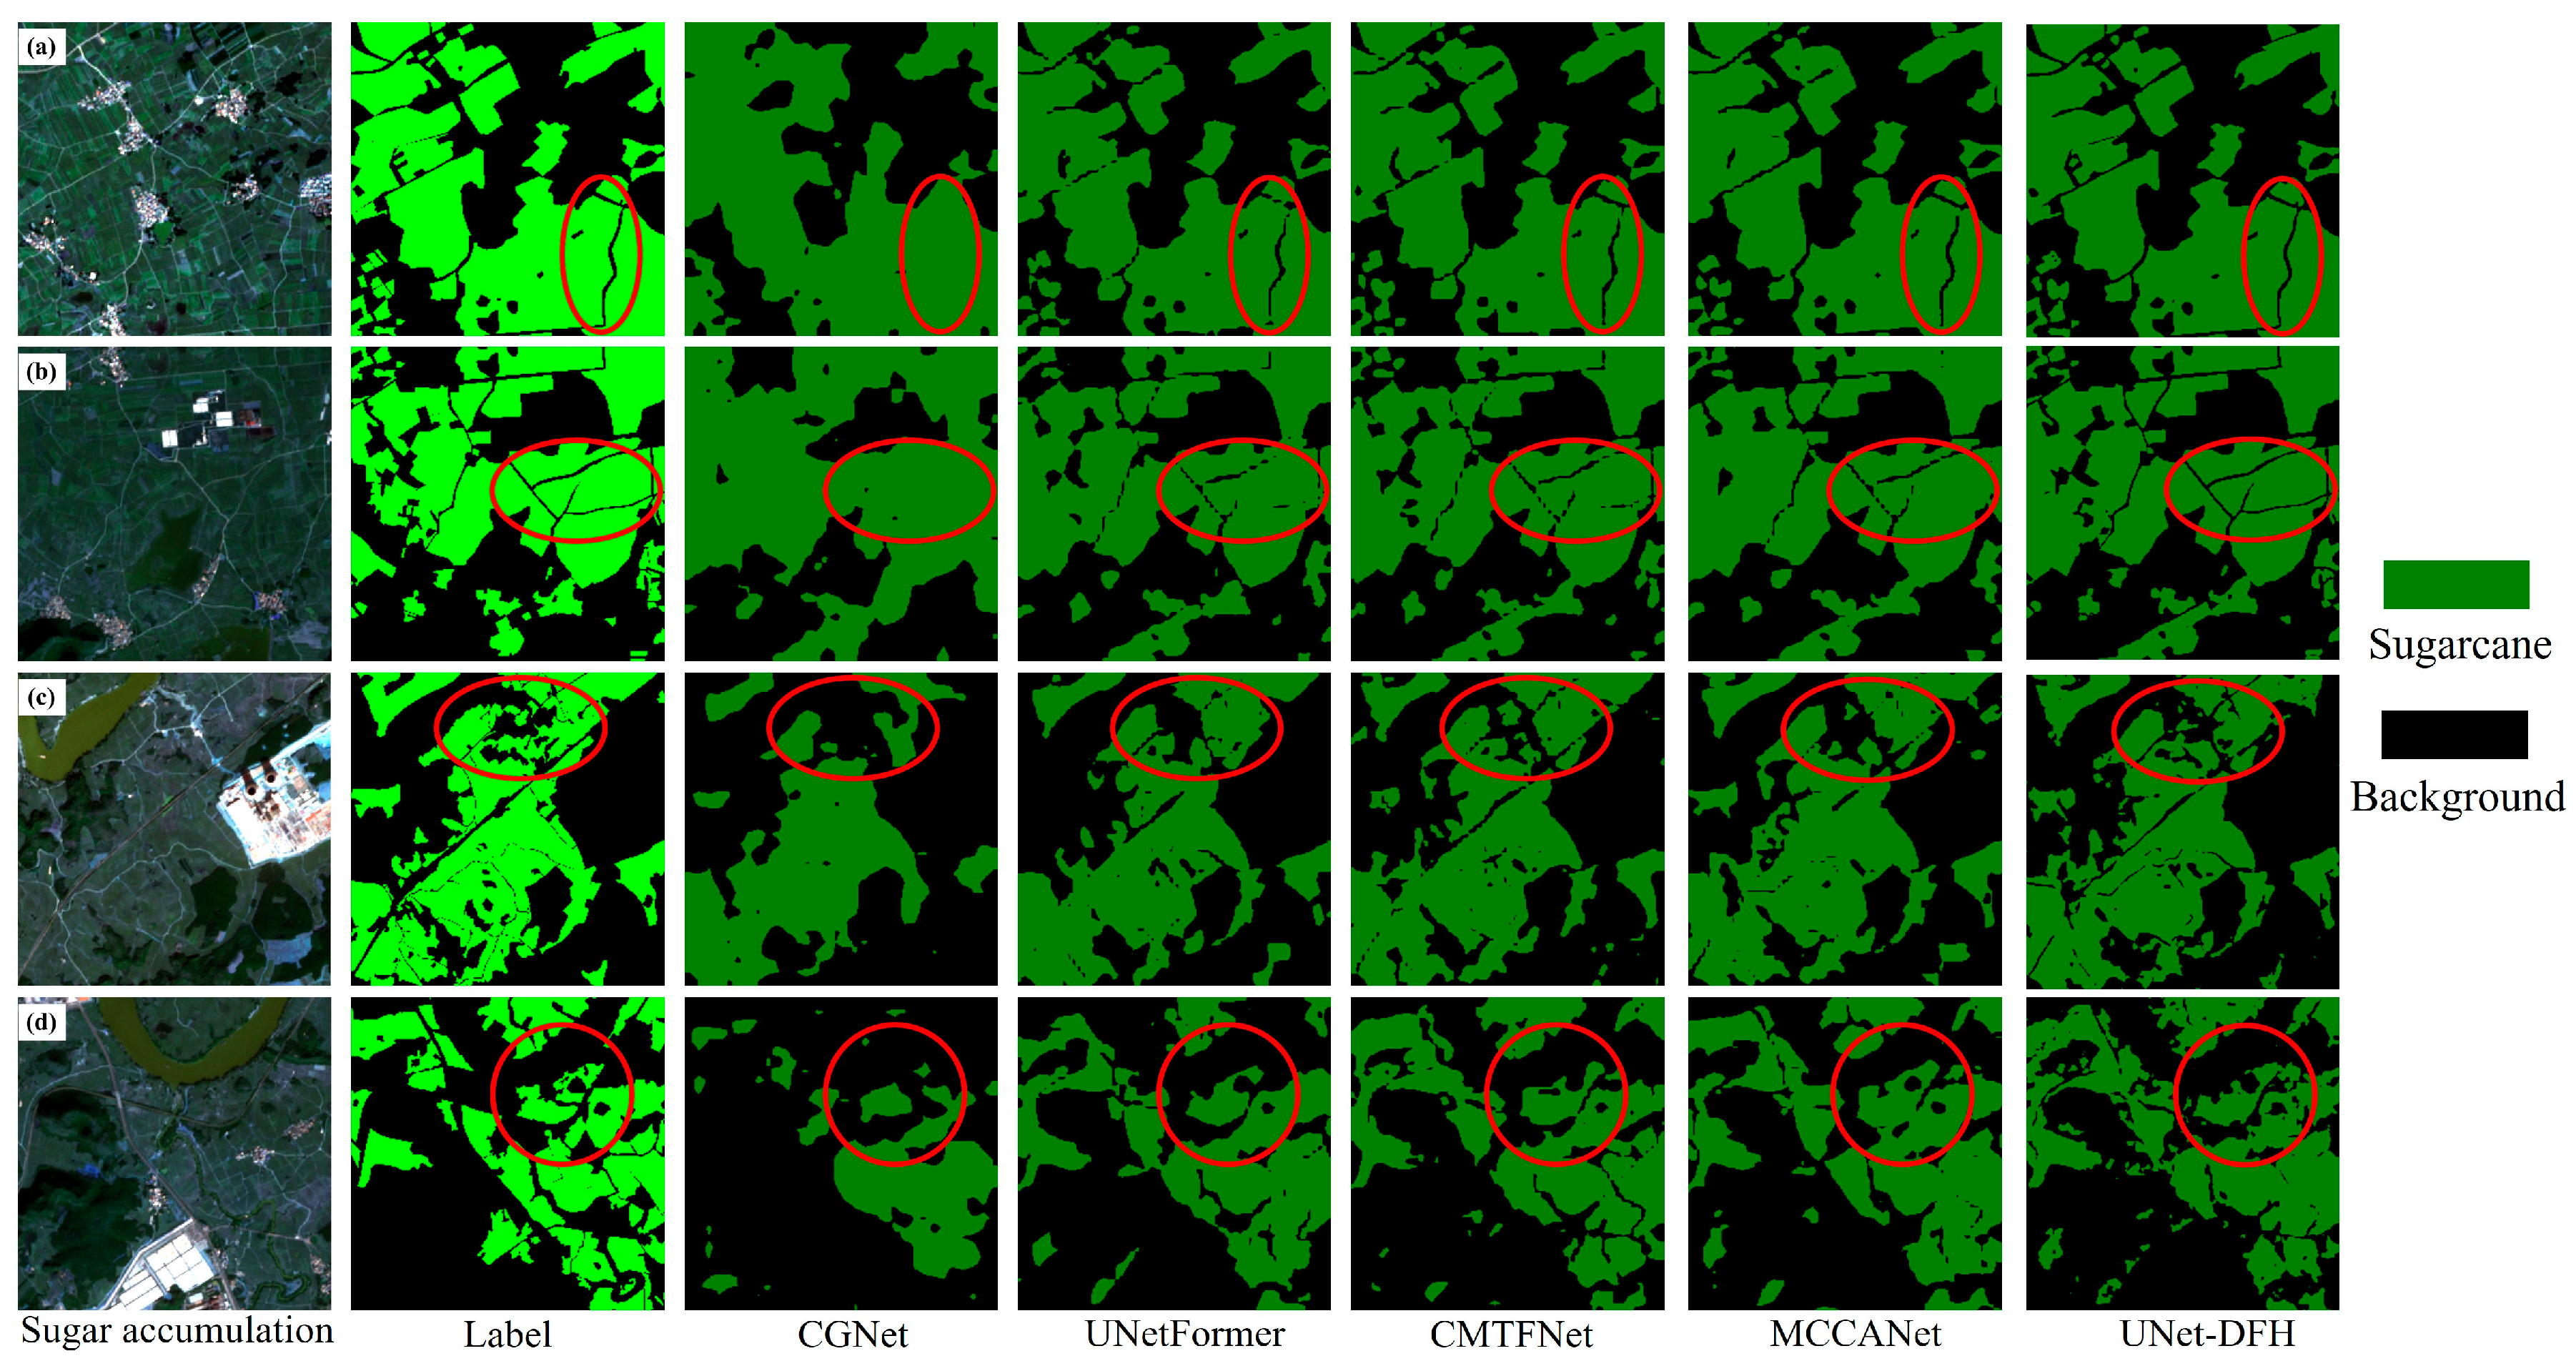
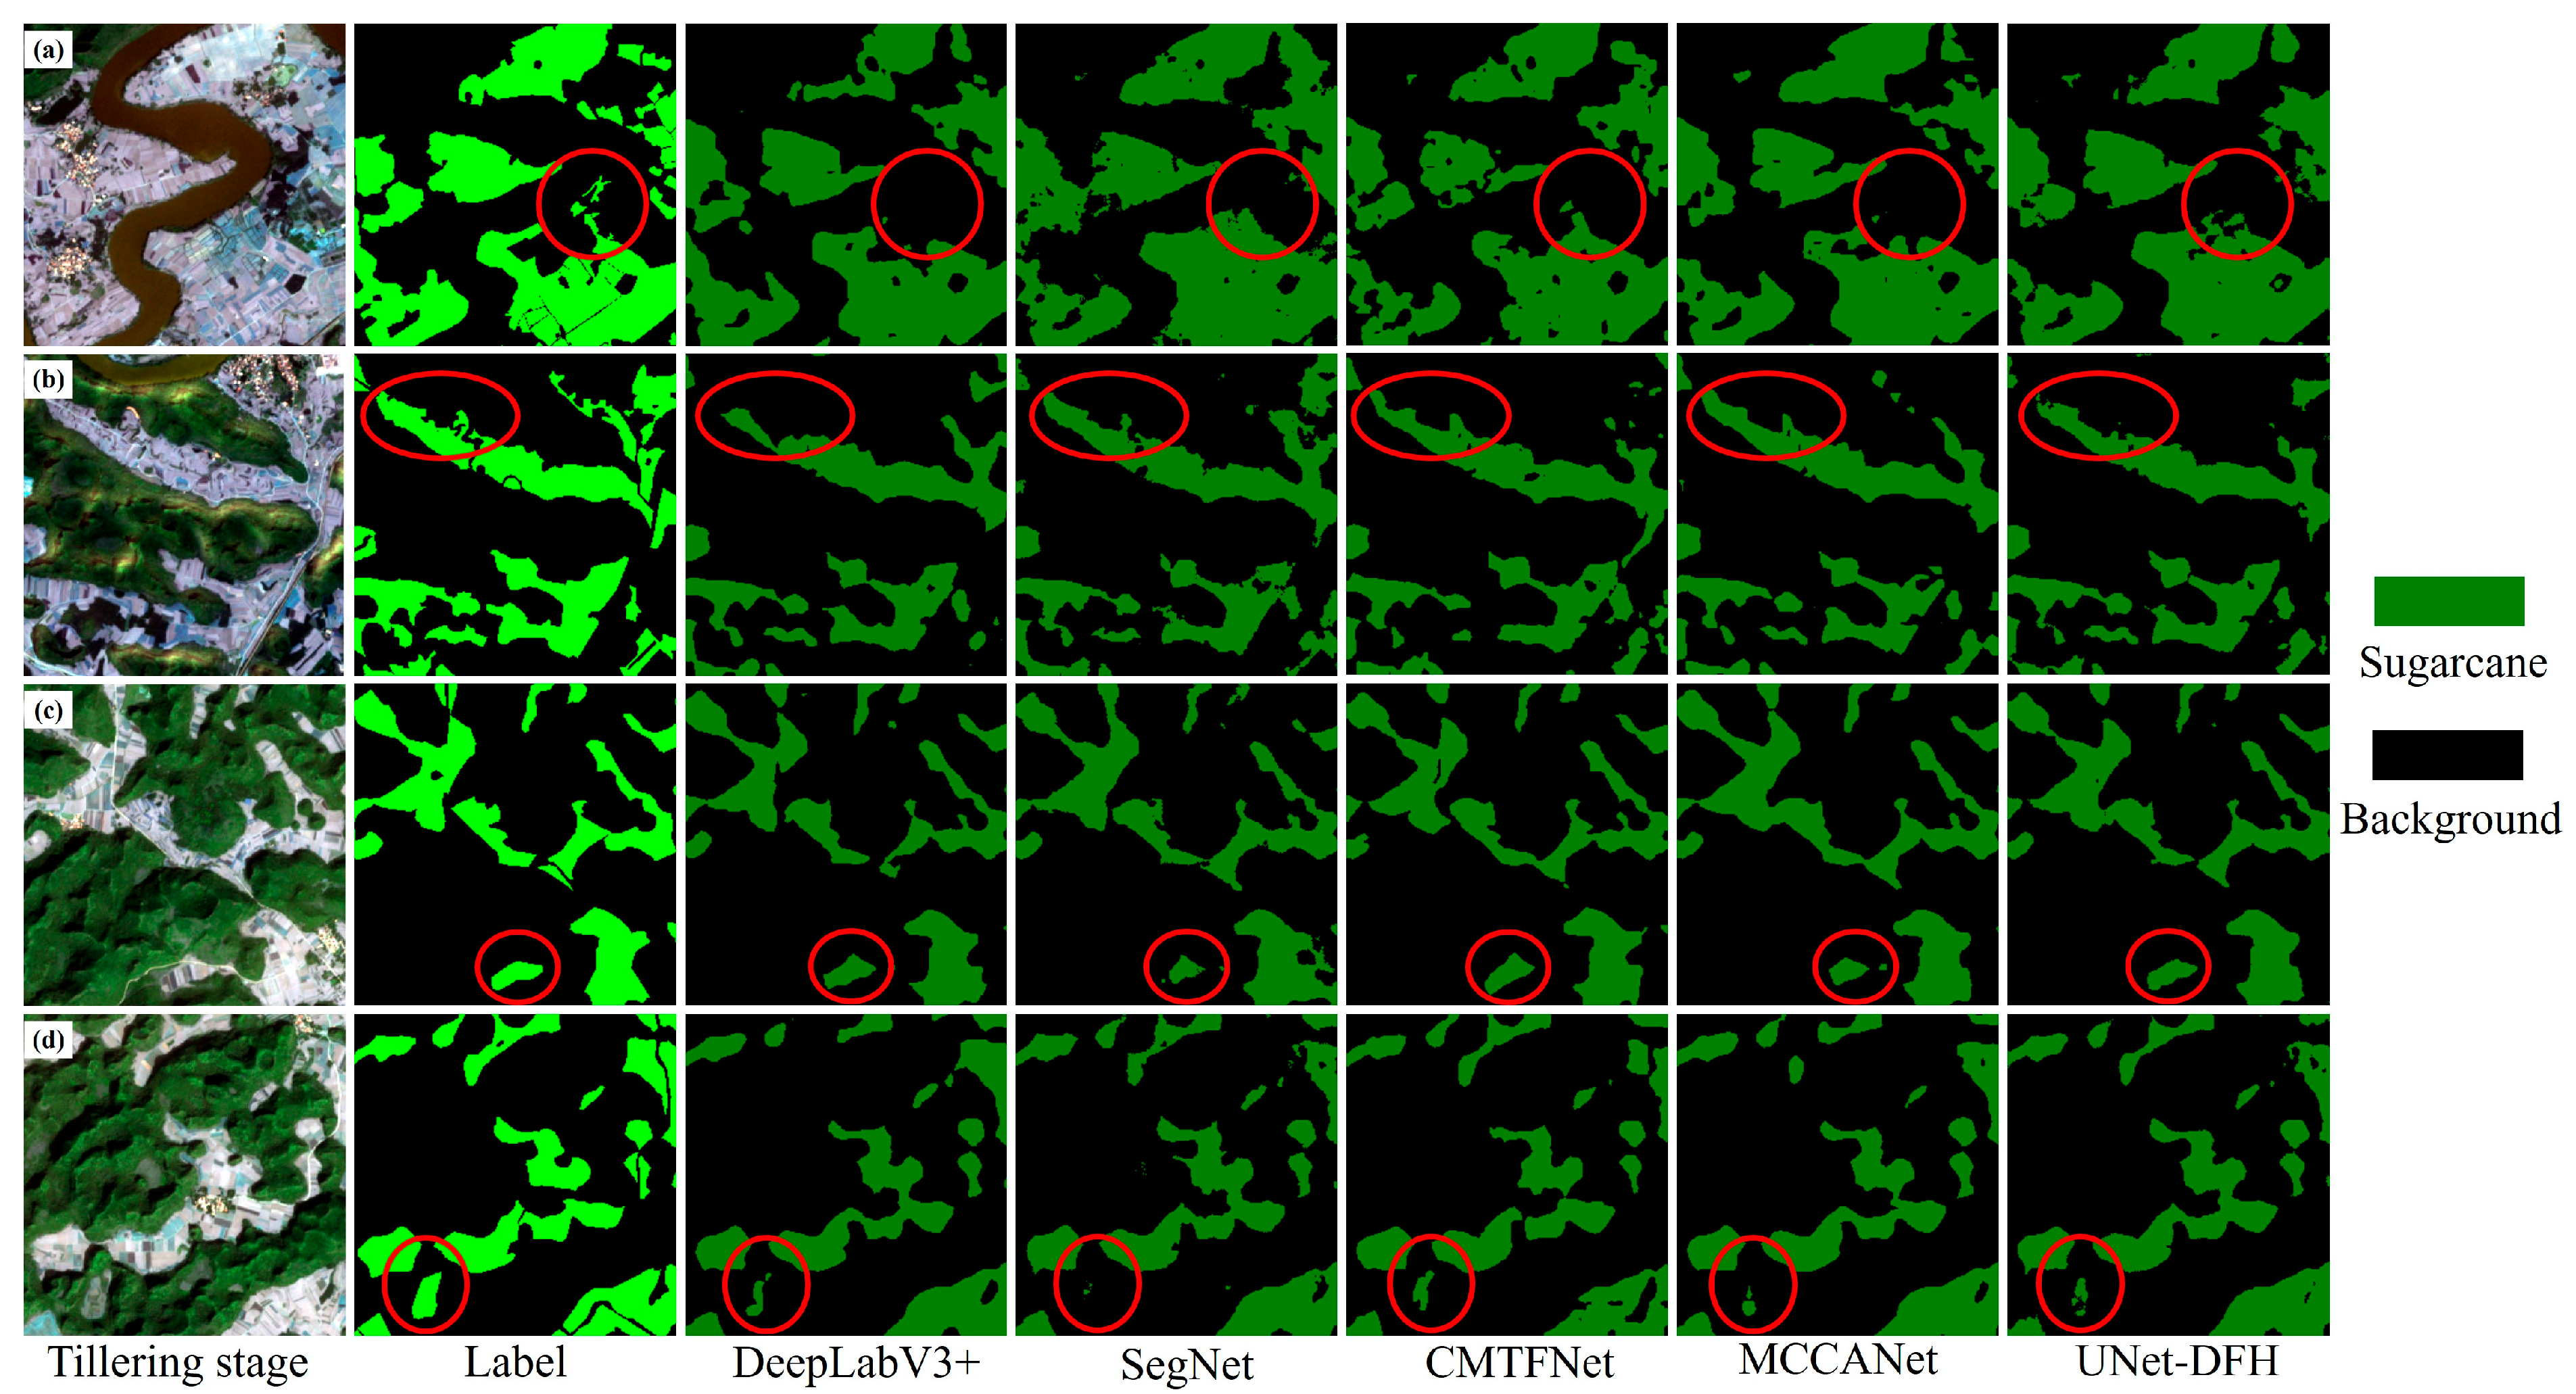
All comparison methods were capable of identifying large and continuous sugarcane fields. However, significant differences were observed in fragmented agricultural landscapes and irregular field boundaries. As illustrated in Figure 7, visual comparisons further demonstrate these quantitative improvements. In regions containing irregular parcel boundaries, narrow field ridges, and highly fragmented planting patterns, UNet-DFH generated more continuous and complete segmentation results. Small sugarcane plots that were frequently missed by conventional methods were successfully preserved, while boundary discontinuities and background interference caused by karst terrain were reduced. These observations indicate that the proposed framework possesses better capability for preserving fine-scale spatial structures under heterogeneous landscape conditions.
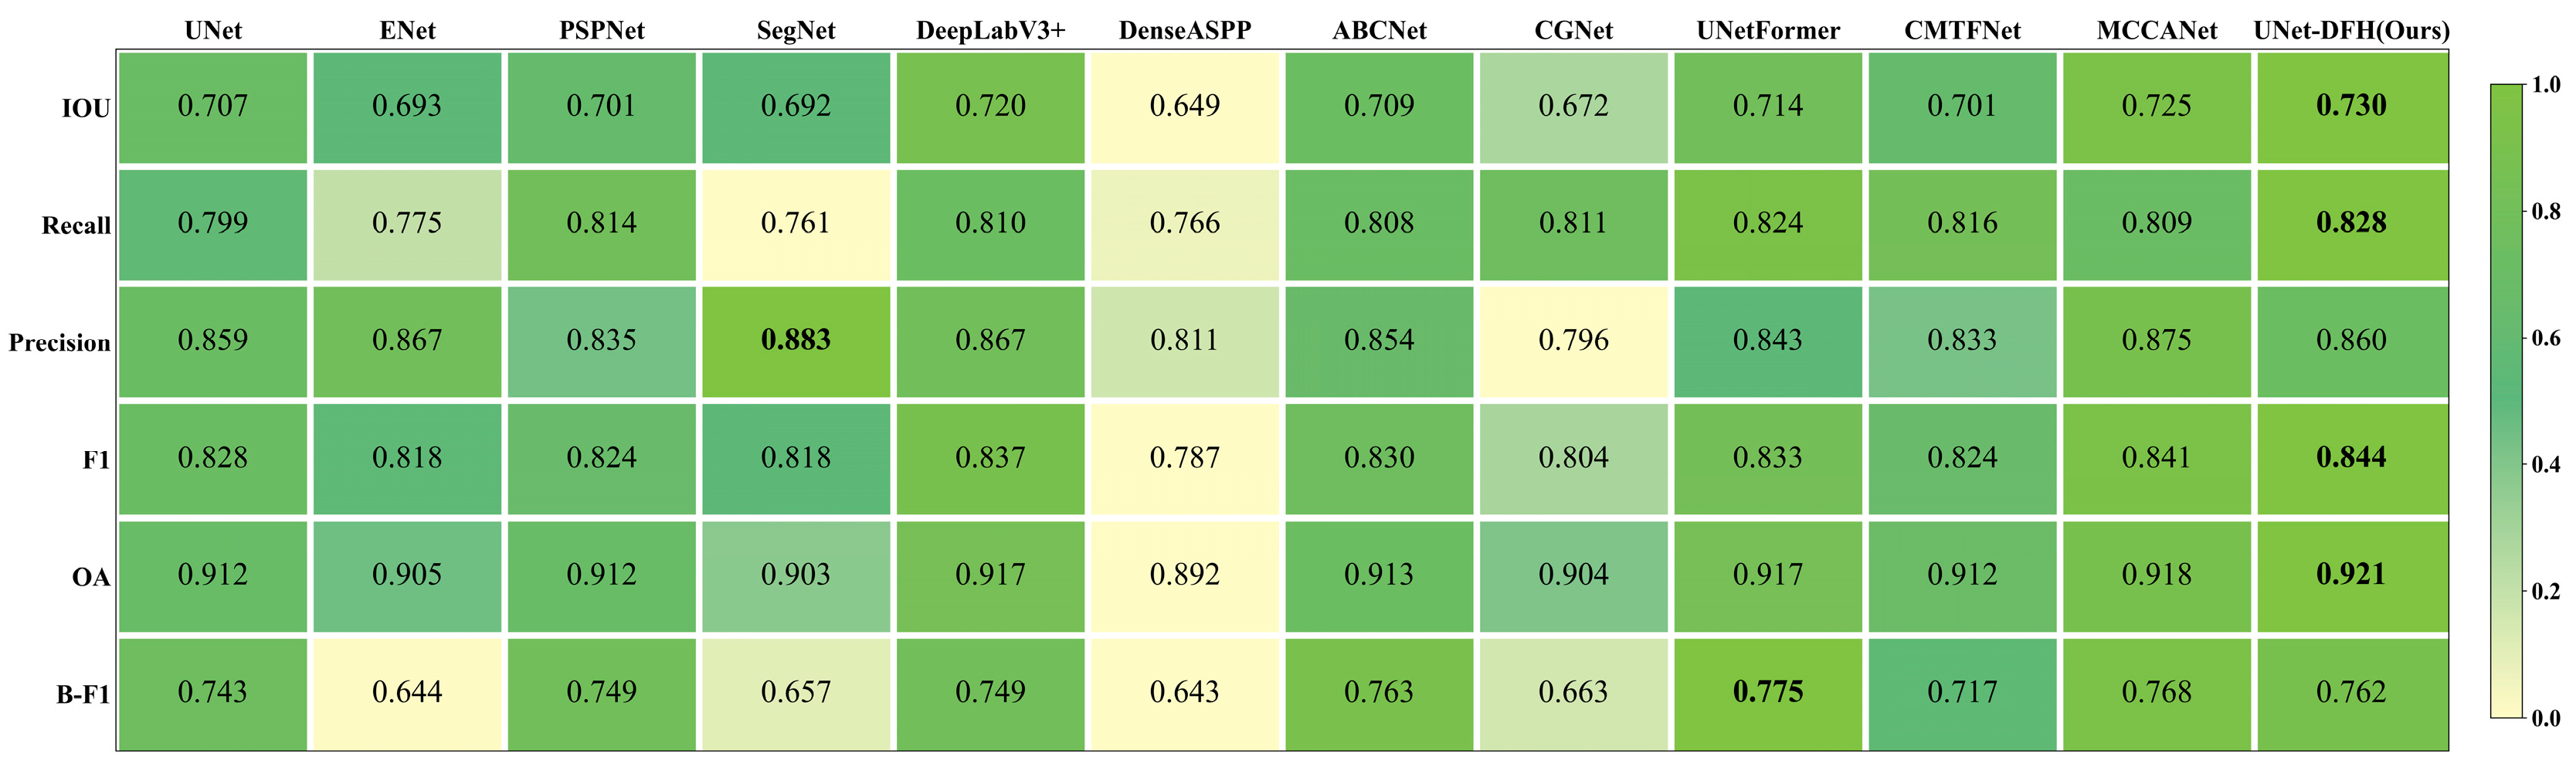
Cross-phenological-stage experiments further validated the topological robustness of the model. Compared with the sugar accumulation and maturity stage, the tillering stage presents greater challenges for sugarcane identification due to incomplete canopy closure and prominent soil exposure, which lead to reduced spectral separability and severe class confusion. The quantitative results are shown in Figure 8 and Figure 9.
As illustrated in Figure 8, all evaluated methods exhibited varying degrees of performance decline during the tillering stage. Nevertheless, UNet-DFH still demonstrates relatively stable performance, achieving an IoU of 0.730, which was 2.3 percentage points higher than that of the baseline U-Net. Under these conditions, UNet-DFH achieved the best results in IoU, Recall, F1, and OA among all compared methods, with values of 0.730, 0.828, 0.844, and 0.921 respectively, substantially outperforming DenseASPP and CGNet. Its Precision (0.860) was slightly lower than that of SegNet (0.883), ranking second among all models. Meanwhile, in terms of boundary quality, UNet-DFH achieved a B-F1 of 0.762, slightly lower than UNetFormer’s 0.775, also ranking second among all methods.
As shown in Figure 9, boundary fragmentation becomes more pronounced during the tillering stage. This is accompanied by increased omission errors, particularly for small and scattered plots located in mountainous areas. All evaluated methods show varying degrees of increase in both false positives and omissions, especially for plots distributed in hilly regions. Conventional convolutional networks such as SegNet and MCCANet struggle to recognize fine fragmented plots, while the Transformer-based CMTFNet suffers from over-smoothing of boundaries. Compared with other methods, UNet-DFH demonstrates stronger robustness in preserving fragmented parcels and reducing omission errors. Even under challenging phenological conditions, the proposed method consistently delineates irregular plot boundaries and maintains fine-scale agricultural patterns.
Overall, segmentation accuracy decreased for all models during the tillering stage. This decline was attributed to weaker spectral discrimination. However, the performance degradation of UNet-DFH was considerably smaller than that of competing models, confirming its relatively stable feature representation capability under stage-specific training.

3.2. Contribution of Optical–SAR Multimodal Fusion

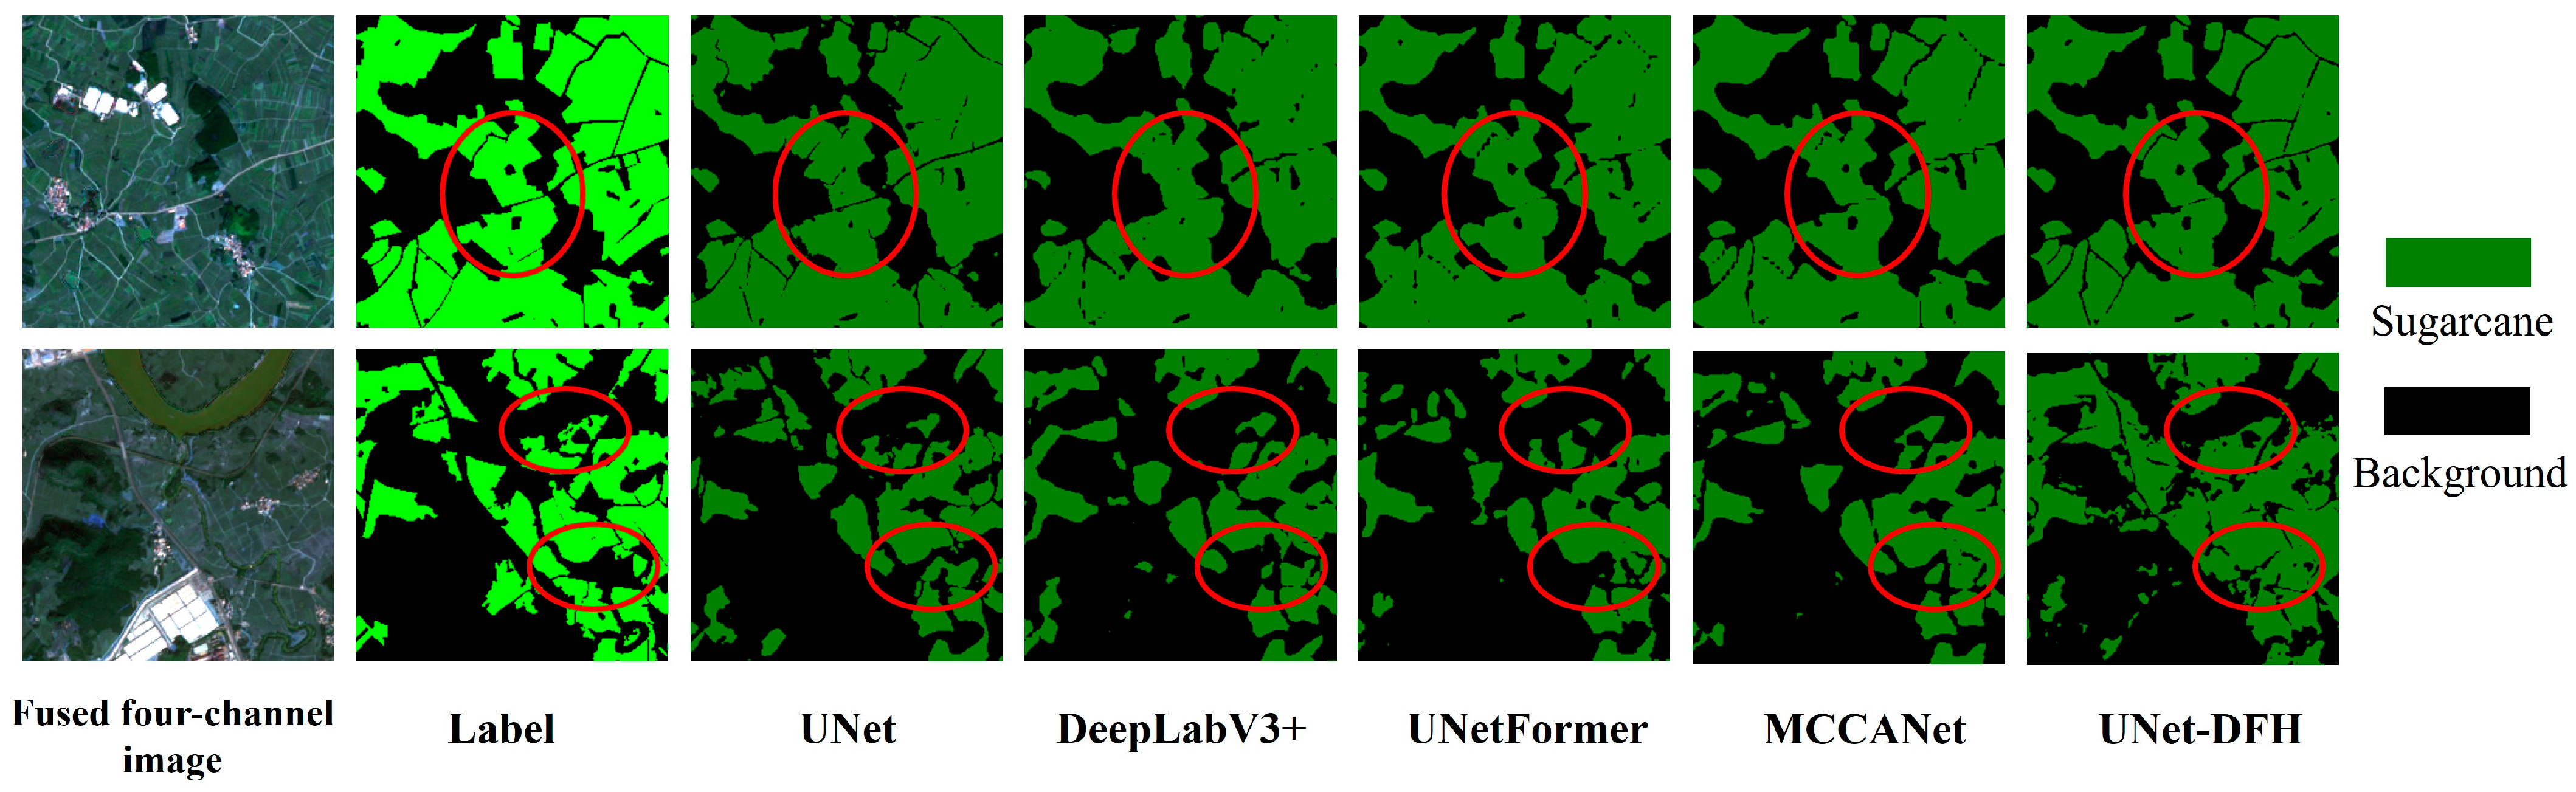
To evaluate the contribution of multimodal information to sugarcane mapping in heterogeneous karst regions, and to compare the performance of different models on fused imagery, experiments were conducted using images acquired during the sugar accumulation and maturity stage. Five segmentation models—U-Net, DeepLabV3+, MCCANet, UNetFormer, and the proposed UNet-DFH—were selected, each tested under two input modes: the optical-only mode directly uses the original four-channel Sentinel-2 image (R, G, B, and NIR), while the optical–SAR fusion mode uniformly takes the four-channel fused image generated by MCANet as input. All models under the fusion mode were trained and tested on the same set of fused images to ensure a fair comparison. Figure 10 visualizes the segmentation results of the five models on the fused imagery, and Figure 11 illustrates their performance differences between the optical and fused modalities.
As shown in Figure 10, using the same fused input, all evaluated models successfully identified large, spatially continuous sugarcane fields. However, when handling irregular plot boundaries, the comparison models commonly suffered from over-smoothing, leading to boundary adhesion between adjacent parcels. In contrast, the proposed UNet-DFH maintained clear boundary delineation, demonstrating superior geometric preservation capability.
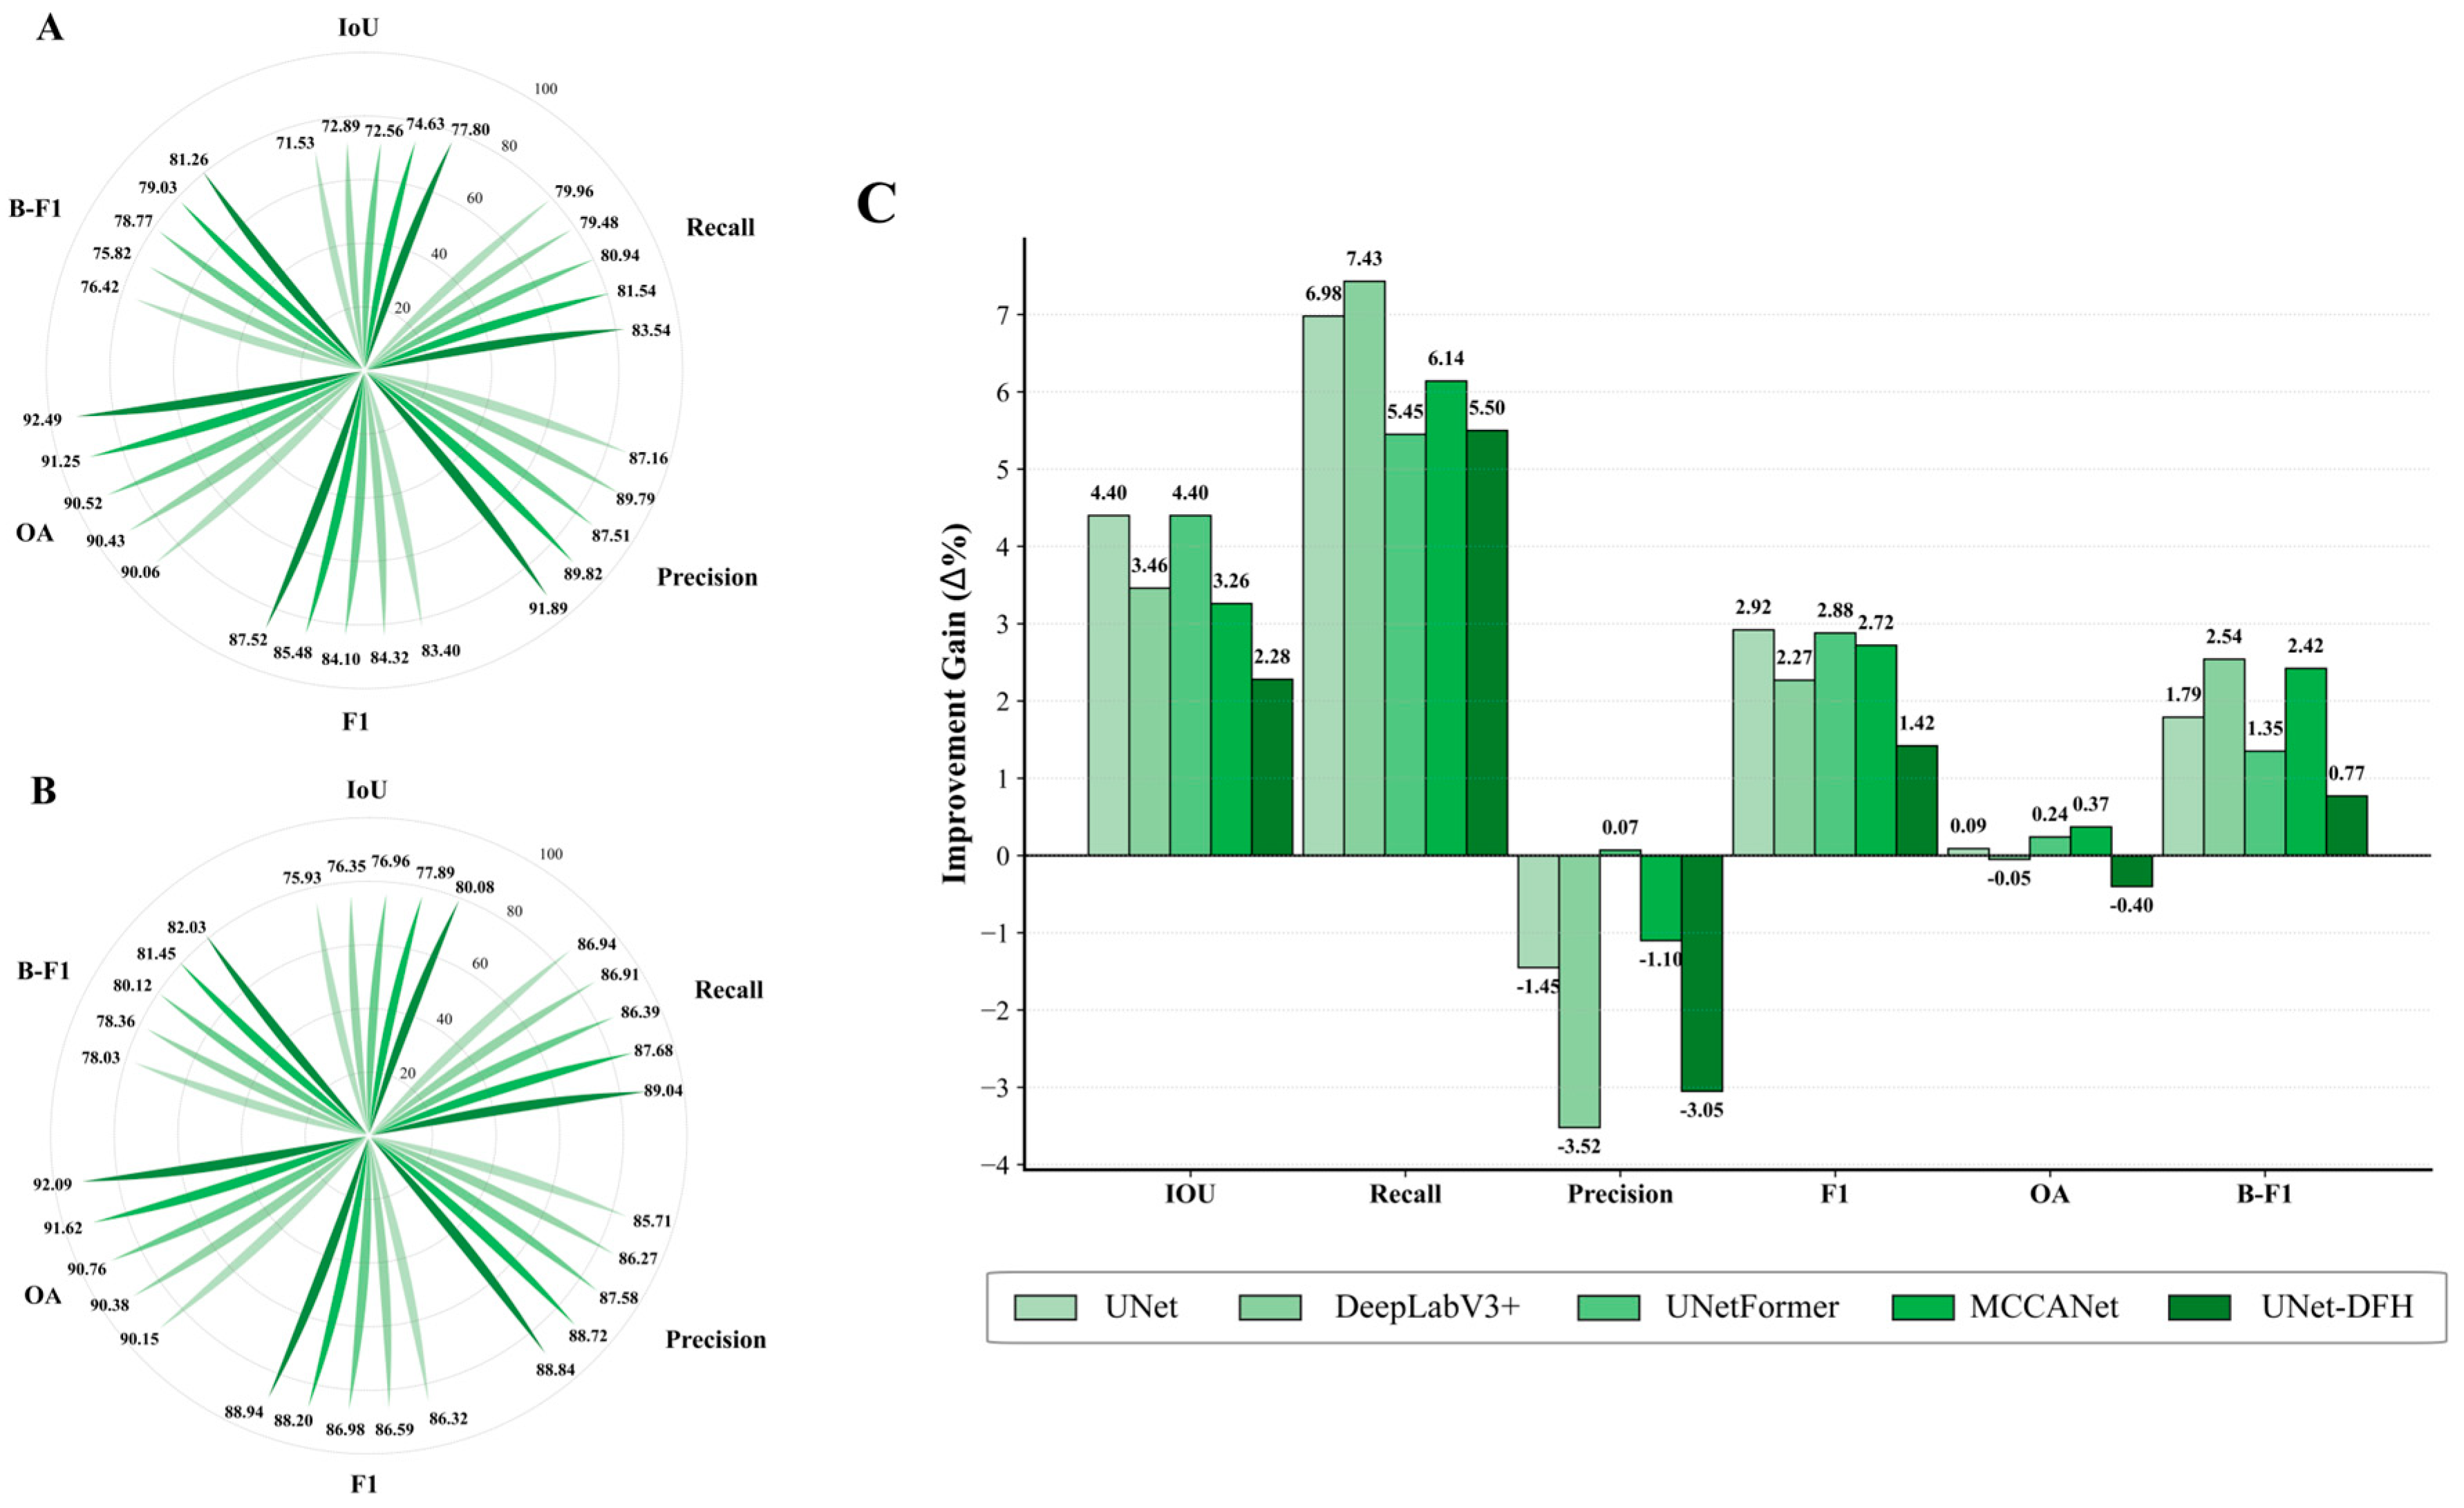
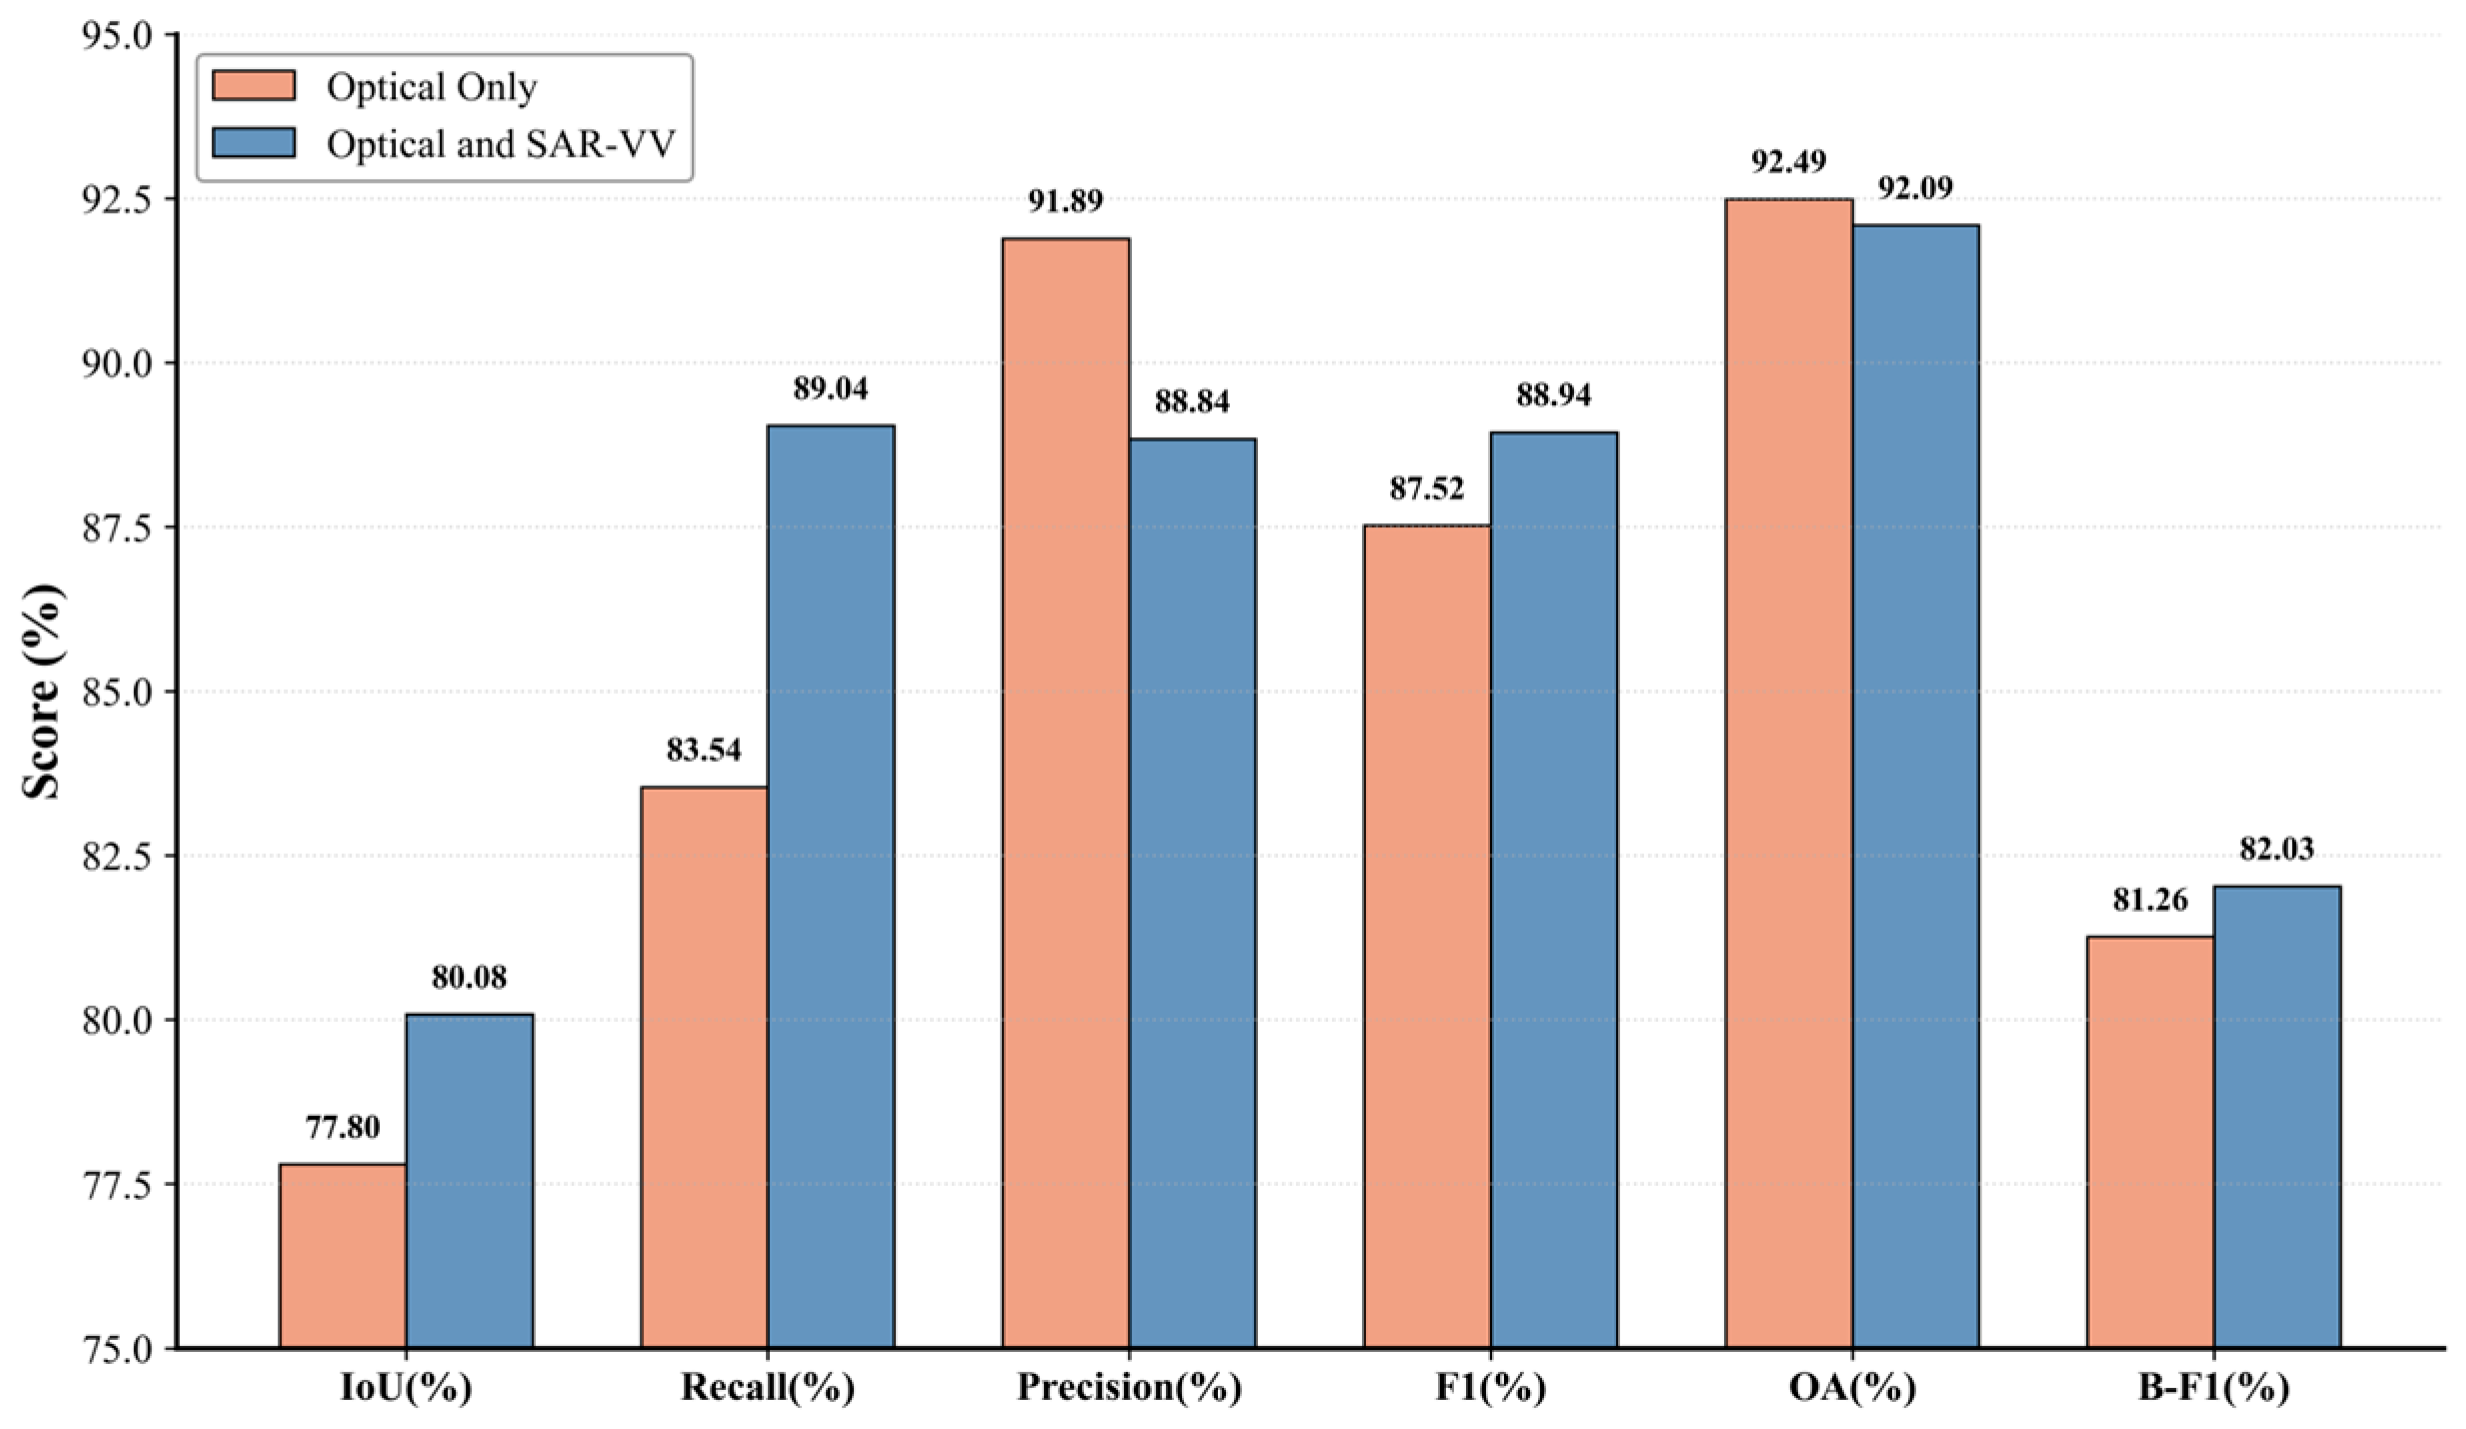
Quantitative evaluation results are presented in Figure 11. After incorporating SAR data, all models exhibited improvements in IoU, Recall, and F1. For UNet-DFH, Recall increased from 83.54% under optical-only conditions to 89.04% under optical–SAR fusion, a gain of 5.50 percentage points, while IoU rose from 77.80% to 80.08%, an improvement of 2.28 percentage points. However, the selected models showed an overall decline in both Precision and OA. UNet-DFH’s Precision dropped from 91.89% to 88.84%, a decline of 3.05 percentage points, and OA decreased from 92.49% to 92.09%, a decline of 0.40 percentage points. Similar trends were observed for the other comparison models.
The introduction of SAR data entails an important trade-off: Recall improves by 5.50 percentage points, while Precision declines by 3.05 percentage points, corresponding to an increase in false positives. Nevertheless, the net gain in IoU of 2.28 percentage points indicates that the overall segmentation performance benefits from SAR’s complementary structural information.

3.3. Ablation Study

To systematically evaluate the effectiveness of the UNet-DFH framework in complex karst agricultural habitats, this section conducts a quantitative, progressive ablation analysis. The analysis focuses on two dimensions: multimodal synergy and network architecture.

3.3.1. Modality Ablation Experiments

To verify the necessity of introducing SAR data to overcome the observation limitations of optical imagery, we fixed the model architecture and quantitatively analyzed the contribution of different input modalities to sugarcane extraction accuracy. This is shown in Figure 12 and Figure 13.
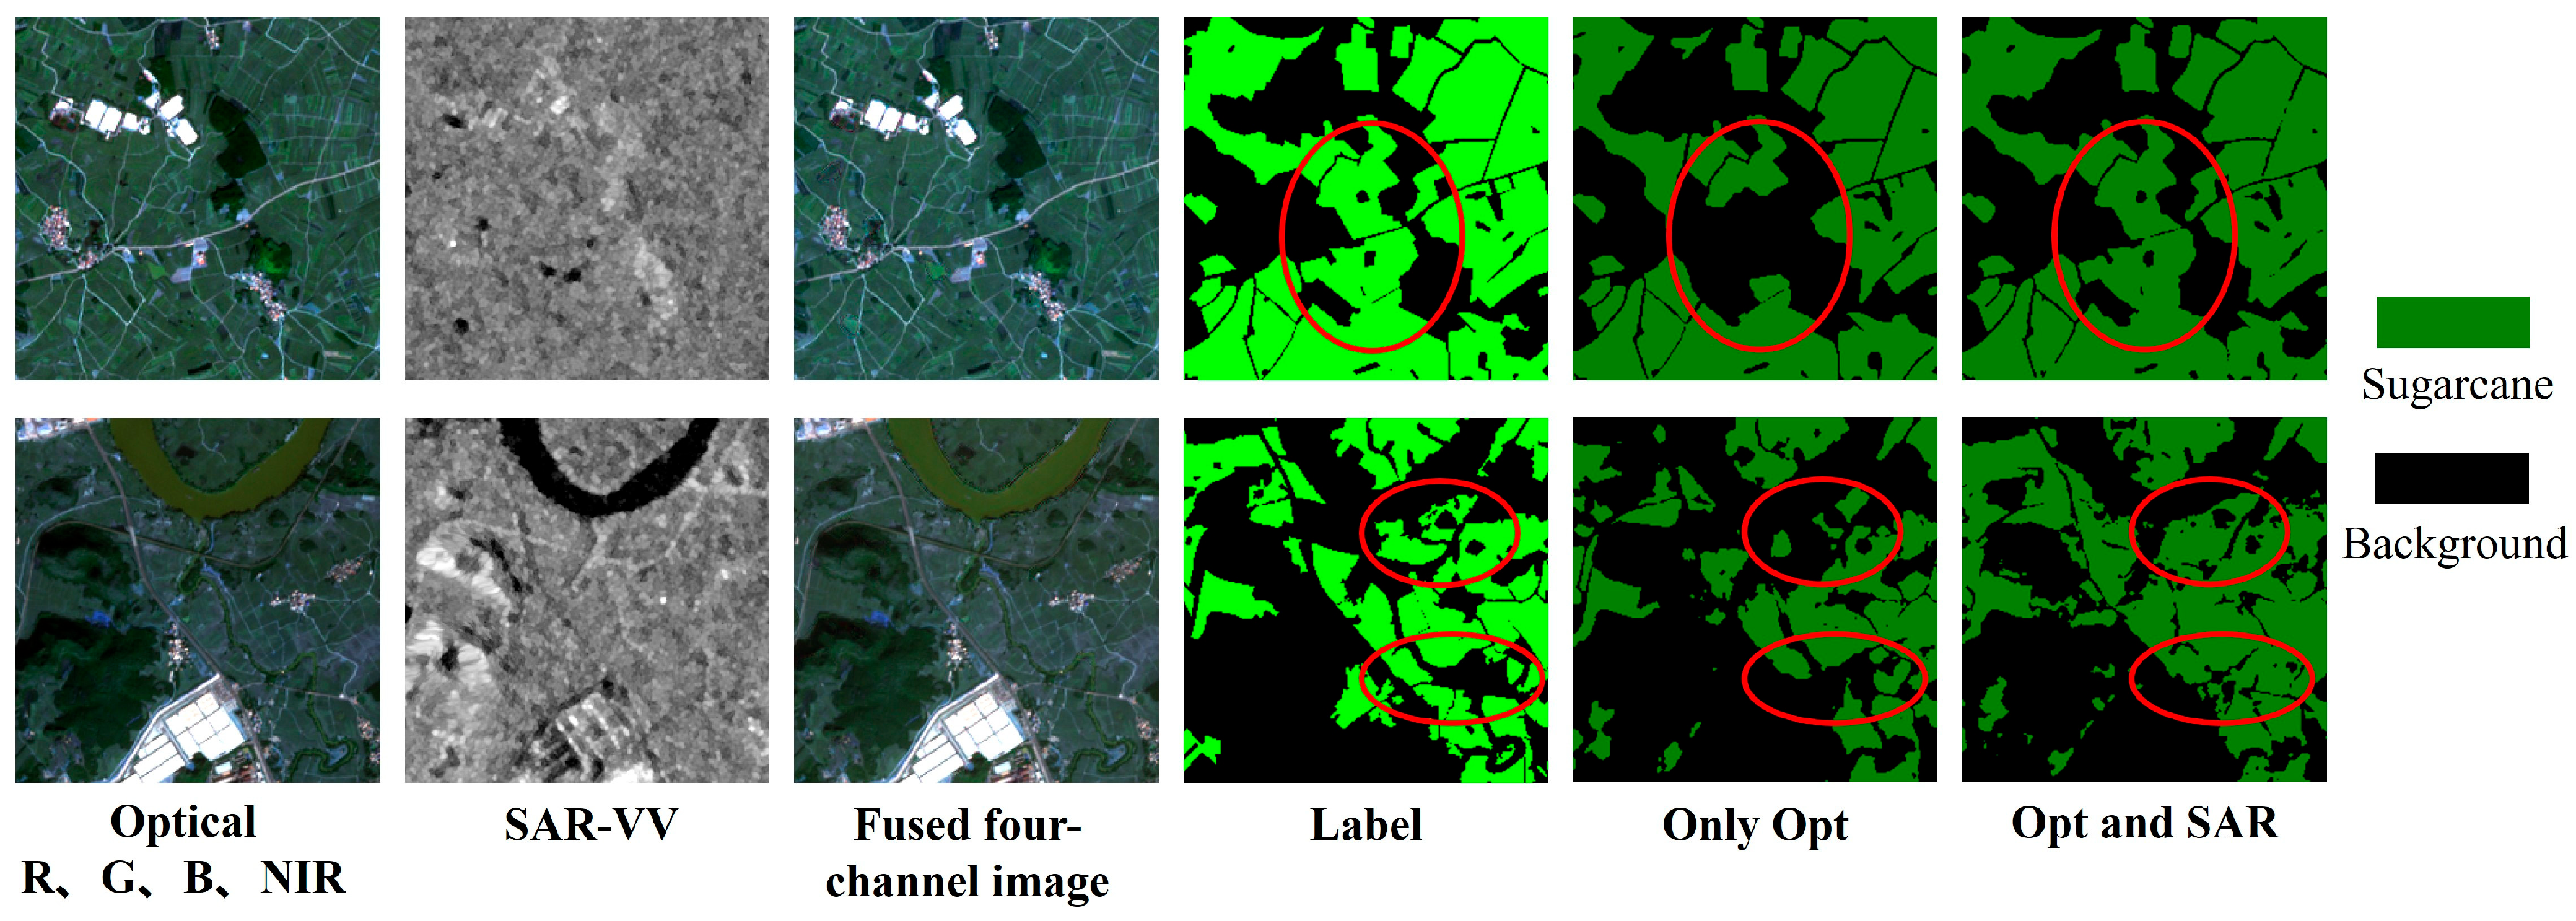
As shown in Figure 12, the incorporation of SAR data enables the model to effectively recover previously omitted sugarcane parcels compared with using optical imagery alone. The second row of visualizations reveals that the introduction of SAR data also brings in noise. This consequently leads to an increase in misclassifications. Quantitative comparisons are presented in Figure 13. When the model input changed from single-modal optical to dual-modal fusion, Recall increased by 5.5 percentage points, directly driving IoU from 77.80% to 80.08%. However, multimodal fusion is not a lossless superposition of features. After incorporating SAR data, the model’s Precision declined from 91.89% to 88.84%. This trade-off suggests an important observation. While SAR data substantially improve the completeness of sugarcane extraction, they also introduce false positives due to speckle noise and terrain-induced geometric distortions.
The quantitative and qualitative results jointly demonstrate a clear conclusion. Optical–SAR fusion provides substantial complementary information for sugarcane mapping in complex karst environments. Compared with optical imagery alone, multimodal fusion improves the detection capability for fragmented and small-scale parcels. This leads to more complete extraction results. It also yields higher overall mapping accuracy. These findings confirm the effectiveness of integrating Sentinel-1 and Sentinel-2 data. The approach is particularly valuable for agricultural monitoring in heterogeneous mountainous regions.

3.3.2. Module Ablation Experiments

To verify the effectiveness of each component in the improved U-Net network, we conducted ablation experiments using U-Net as the baseline network. The sub-structures examined included Gaussian filtering, edge detection, the ADFM, and the MSEF module. All experiments were performed on the optical-only dataset acquired during the tillering stage and the sugar accumulation and maturity stage.
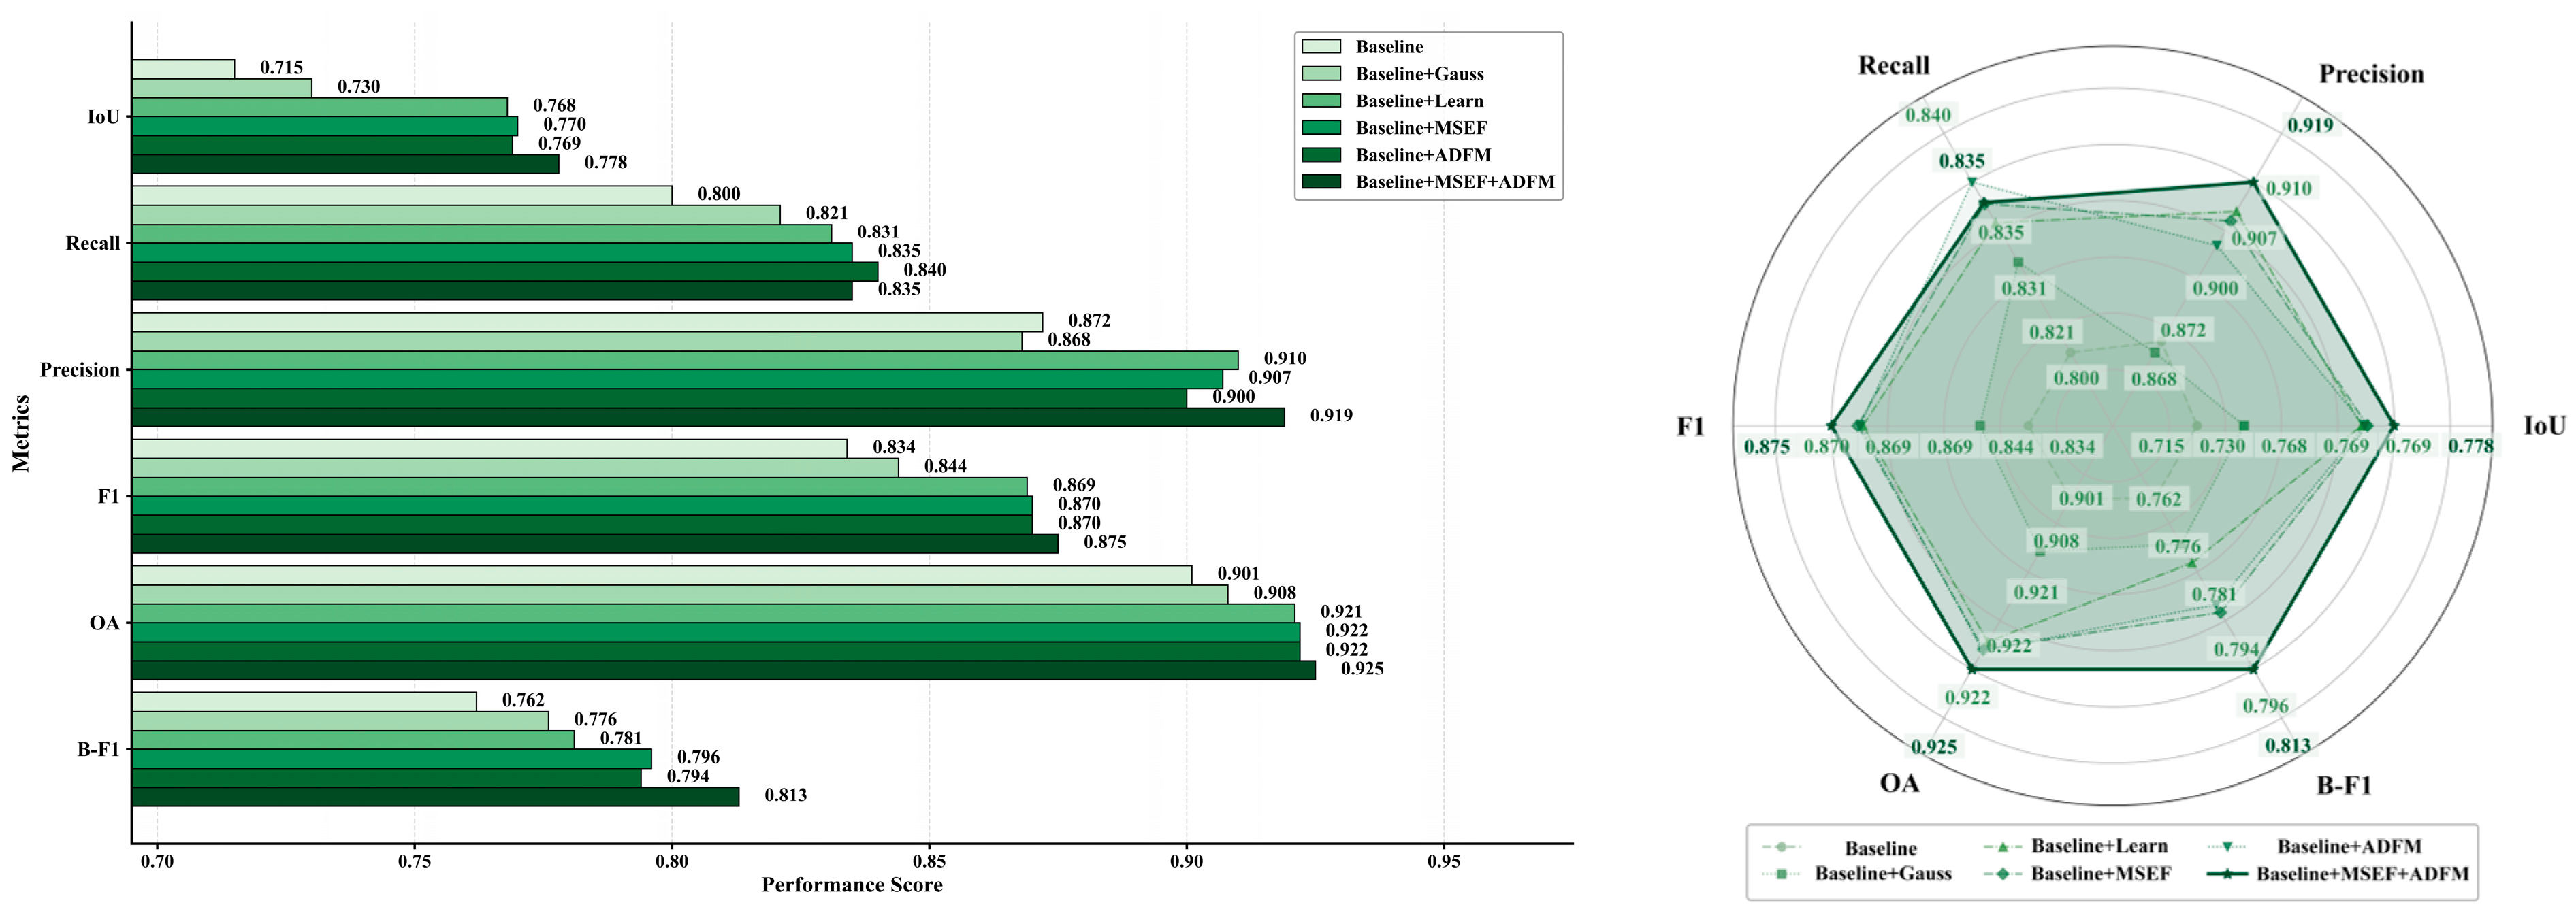
Ablation results for individual components are presented in Figure 14. Compared with the baseline U-Net, introducing the Gaussian filtering branch improved IoU by 1.5 percentage points (from 0.715 to 0.730) while Precision decreased slightly from 0.872 to 0.868. Incorporating the learnable edge detection branch resulted in a more substantial gain, with IoU increasing by 5.3 percentage points (from 0.715 to 0.768). The complete MSEF module achieved an IoU of 0.770 and an OA of 0.922, outperforming either sub-branch alone and confirming the synergistic effect of the two parallel branches. The ADFM alone yielded an IoU of 0.769, demonstrating its individual effectiveness in handling geometric deformation. When both modules were combined in the full UNet-DFH, IoU reached 0.778, a total gain of 6.3 percentage points over the baseline, and B-F1 improved from 0.762 to 0.813, reflecting enhanced boundary delineation quality.
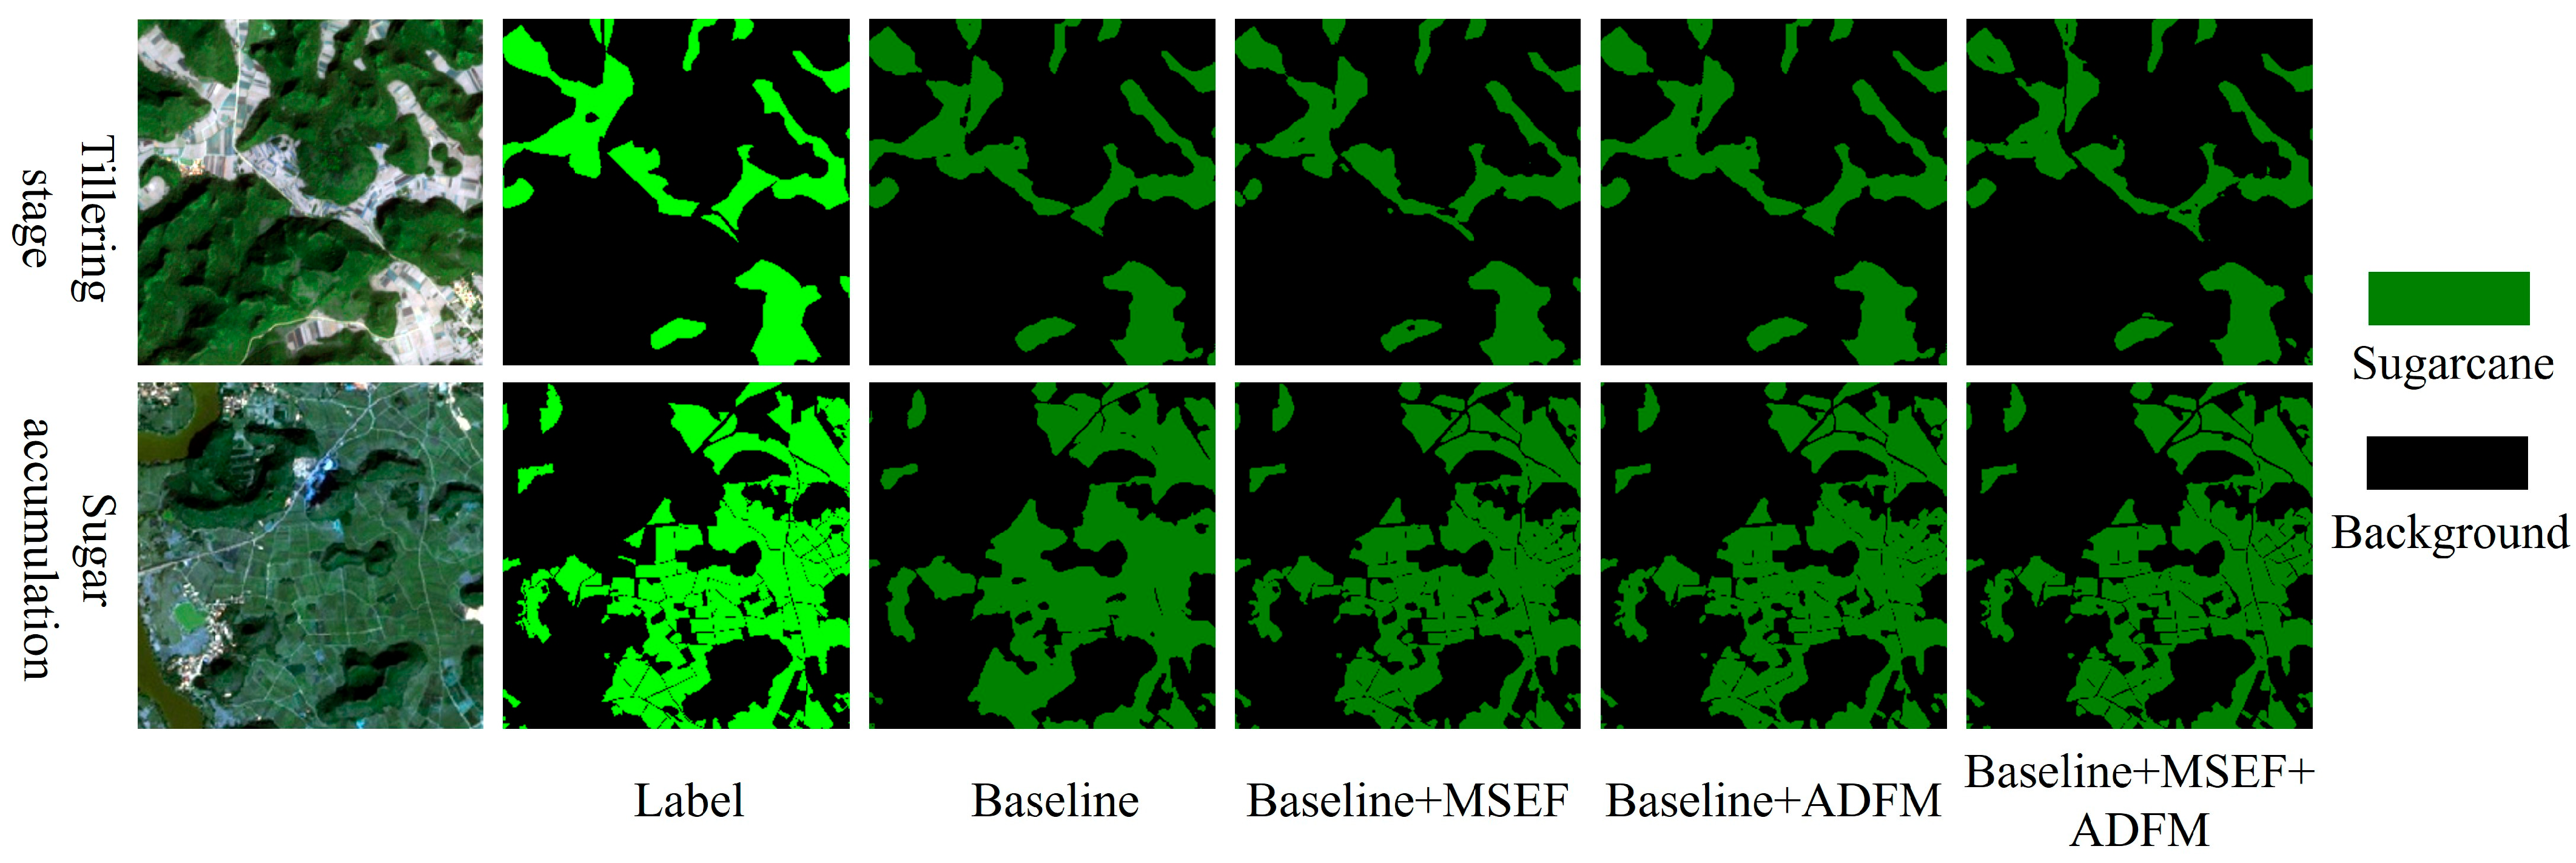
The quantitative improvements were further supported by the visual comparisons shown in Figure 15. The baseline U-Net exhibited several common errors in complex karst environments, including omission of fragmented sugarcane fields, discontinuous parcel boundaries, and false predictions caused by heterogeneous background vegetation. With the MSEF module, fragmented plots became more continuous, boundary discontinuities were reduced, and internal field structures were better preserved. The full UNet-DFH model achieved the highest visual quality among all evaluated configurations: small and isolated sugarcane parcels were successfully detected, irregular field boundaries were accurately delineated, and the predicted parcel shapes exhibited higher spatial consistency with the reference labels, resulting in more complete and coherent agricultural field extraction.

3.4. Training Convergence and Computational Complexity and Efficiency Metrics

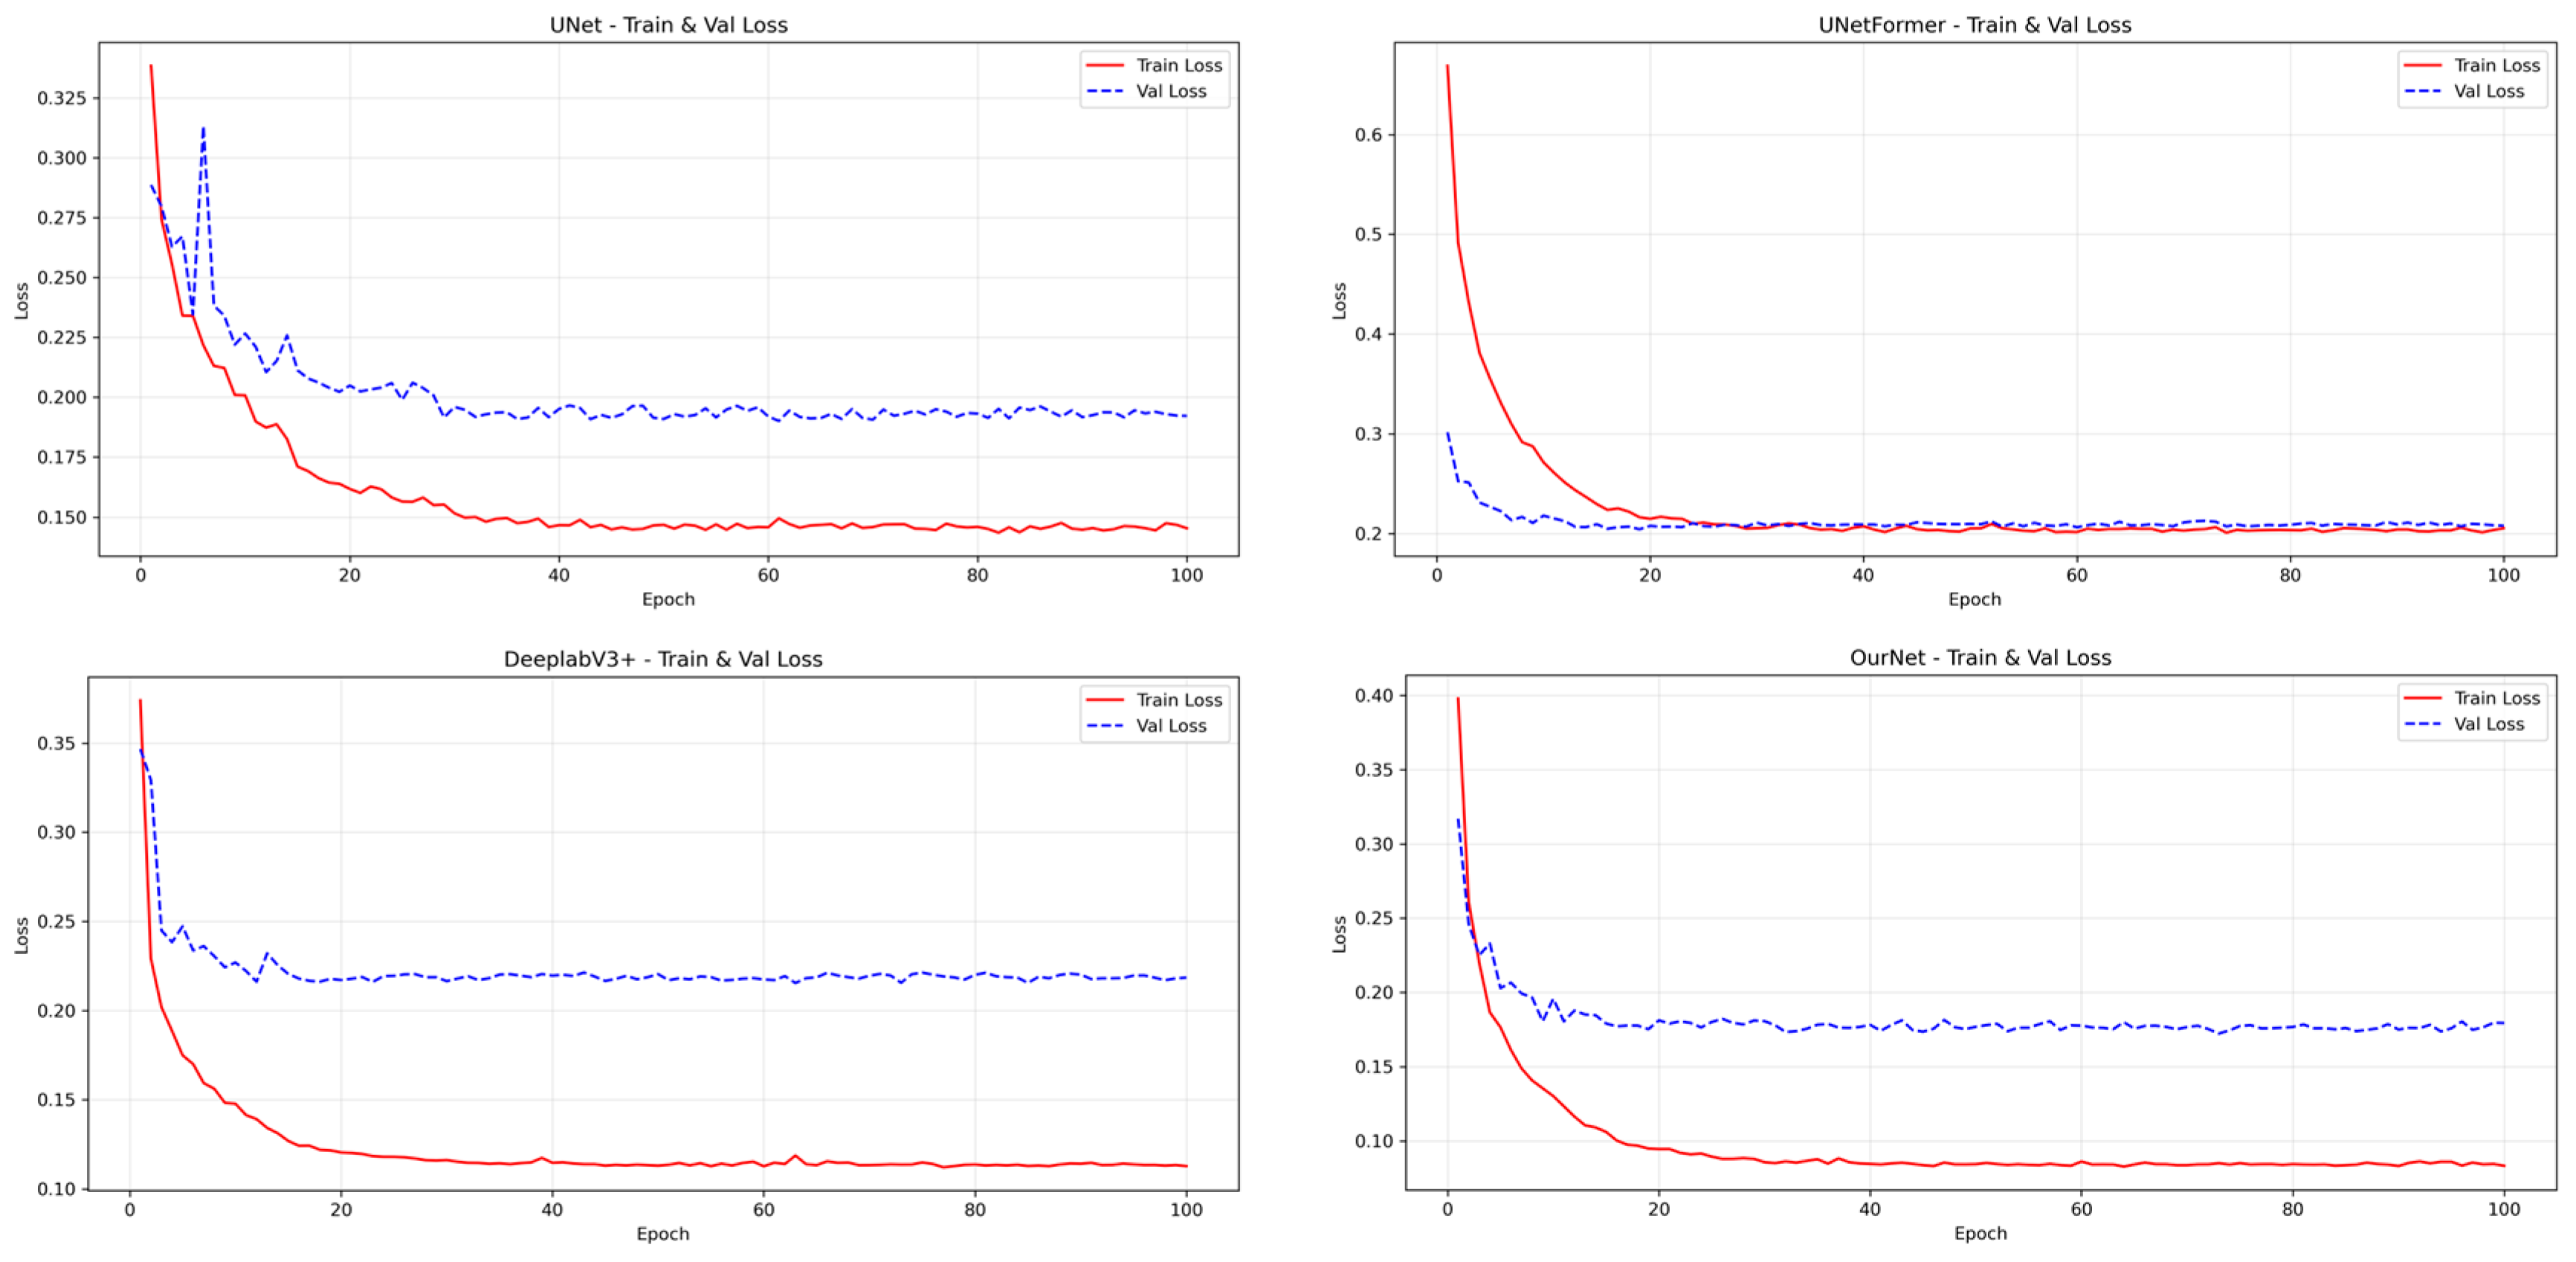
To evaluate the training behavior of UNet-DFH and the comparison models, we recorded the training and validation loss curves during the training process. The curves for U-Net, DeepLabV3+, and UNetFormer were also presented for comparison. As shown in Figure 16, the training loss decreases rapidly during the first 20 epochs and then gradually levels off, with the validation loss following a similar trend. The gap between the two loss curves exists but gradually narrows throughout the training process, indicating that the models do not overfit to the training set. These observations confirm that the models converge stably under the current training configuration.
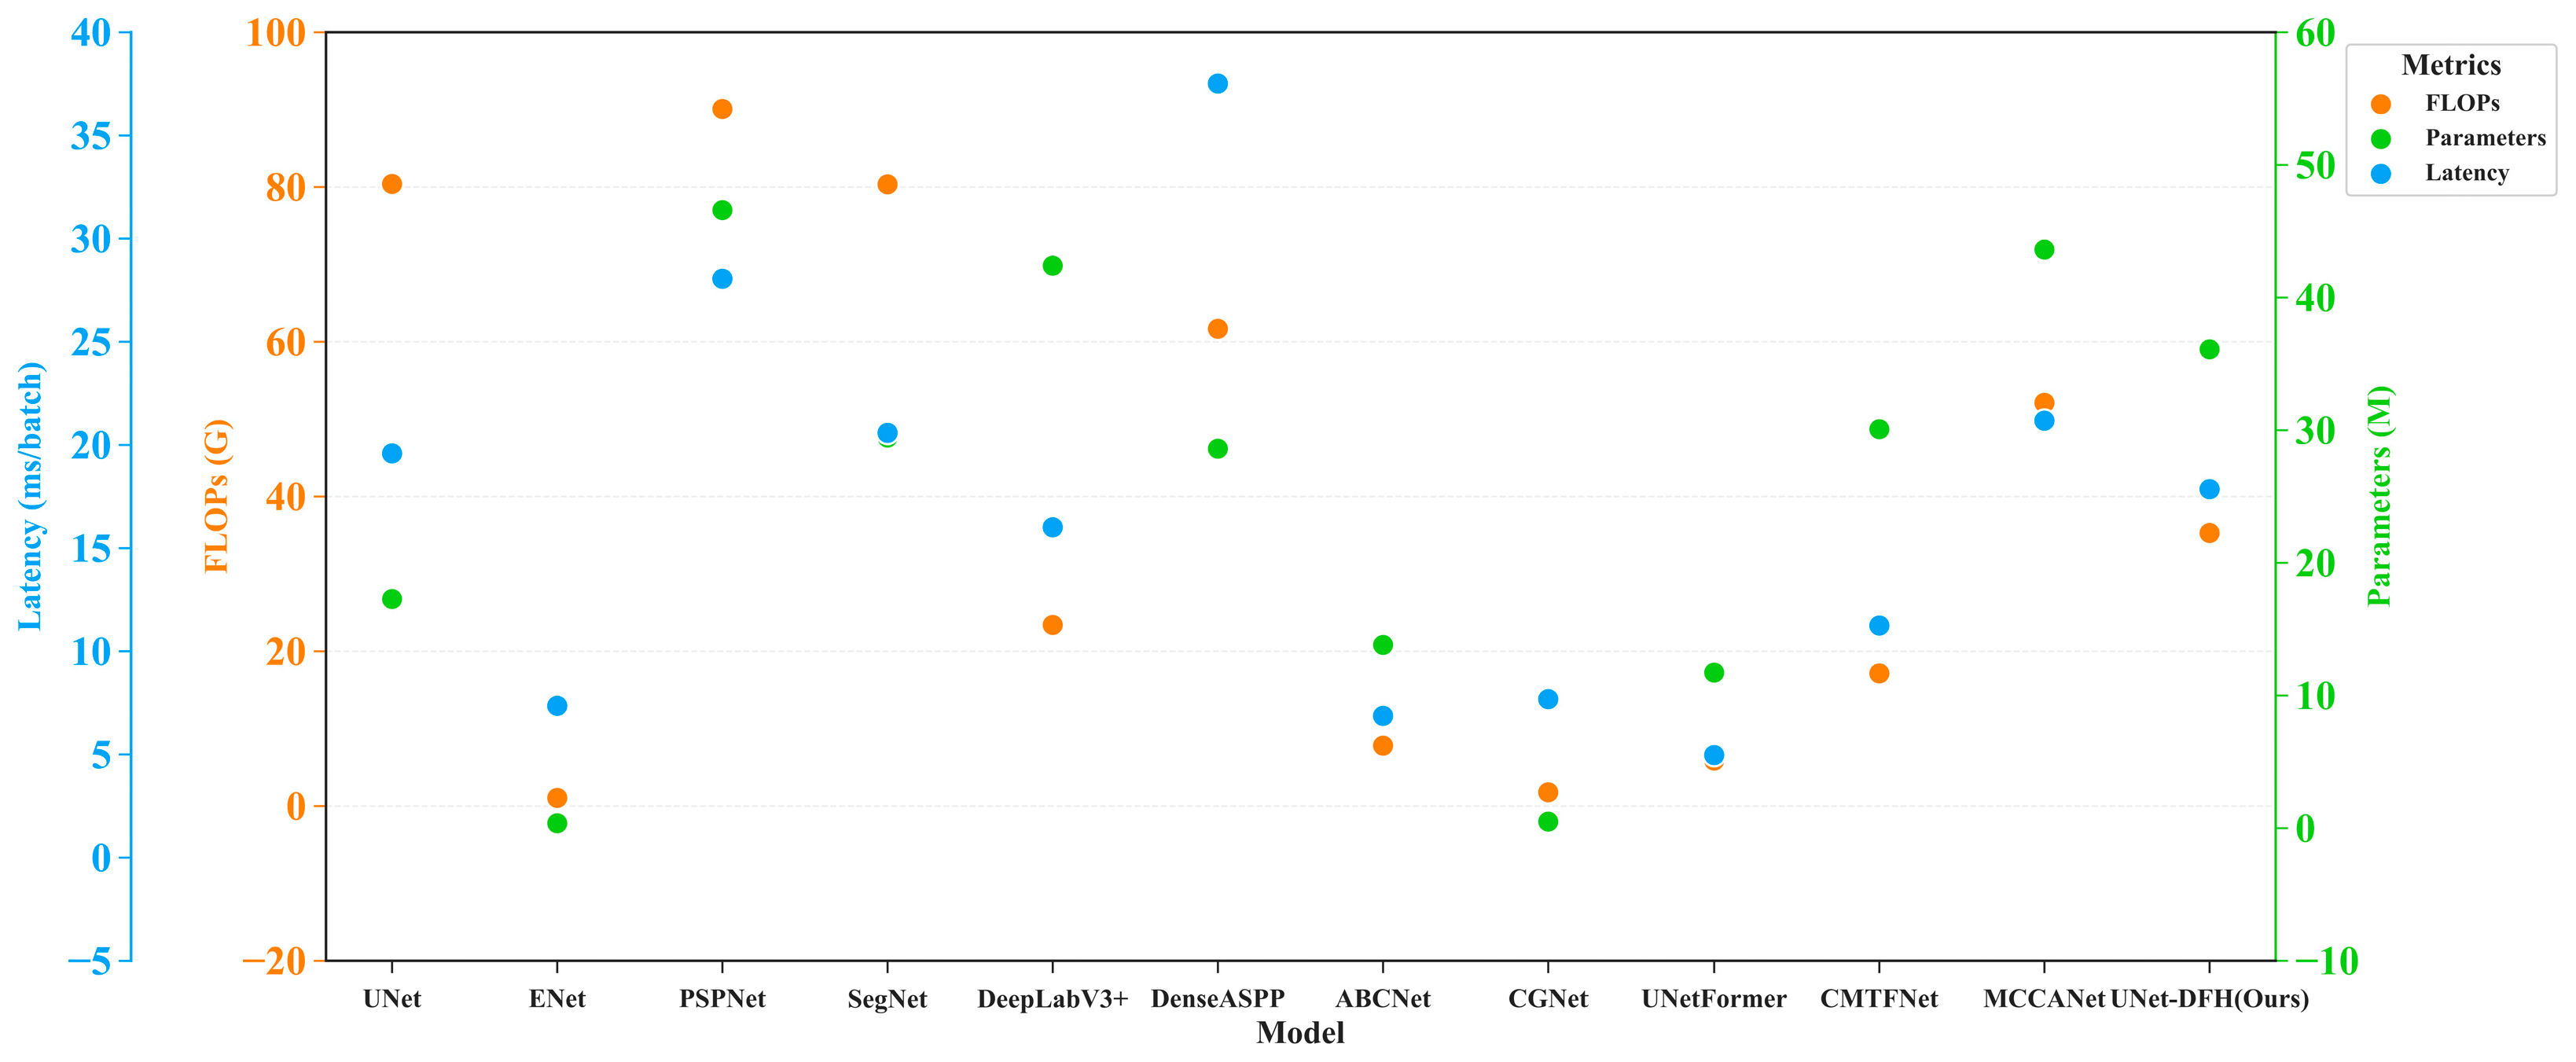
To evaluate the applicability of UNet-DFH in practical agricultural remote sensing tasks, we compared the number of parameters, floating-point operations (FLOPs), and inference latency of each model under the same experimental settings. The statistical results are shown in Figure 17.
Figure 17 compares model efficiency in terms of parameters, FLOPs, and latency. Lightweight models such as ENet, ABCNet, and CGNet achieve the lowest parameter counts, ranging from 0.363 M to 13.812 M, along with minimal FLOPs and latencies under 8 ms per batch. The proposed UNet-DFH contains 36.093 M parameters, which is higher than that of U-Net at 17.267 M but remains substantially lower than PSPNet at 46.590 M and DeepLabV3+ at 42.396 M. Its FLOPs are 35.285 G, representing a 56.1% reduction compared with U-Net at 80.381 G, while inference latency is 17.856 ms per batch, slightly lower than the 19.586 ms of U-Net. Although UNet-DFH demands more computational resources than UNetFormer with 11.724 M parameters, 5.869 G FLOPs, and 4.970 ms latency, it achieves superior IoU and Recall. Overall, UNet-DFH strikes a favorable balance between computational cost and segmentation accuracy, with latency showing potential for agricultural monitoring applications.

4. Discussion

4.1. Cross-Modal Information Synergy and Biophysical Trade-Offs Under Topographic Distortions

The experimental results presented in Section 3 demonstrate that UNet-DFH outperforms existing Convolutional Neural Network (CNN)-based and Transformer-based semantic segmentation networks on the karst sugarcane dataset. This advantage holds under both optical-only and optical–SAR fusion conditions and is primarily attributed to the complementary interaction among three components: dynamic edge enhancement, adaptive feature alignment, and optical–SAR multimodal fusion.
Recent reviews have highlighted that deep feature fusion of optical and SAR images can alleviate the limitations of single-source imagery and improve semantic segmentation accuracy. MCANet demonstrated the effectiveness of cross-attention for land use classification, while SACFNet [41] introduced an align-first, fuse-later paradigm to explicitly rectify geometric and scale discrepancies between modalities, and DRIDBFNet [42] addressed redundancy by decoupling common and specific features. Compared with these approaches, our framework differs in two respects: we adopt a decoupled two-stage strategy that generates fused images offline for reuse across downstream tasks, and we explicitly address non-rigid geometric deformation through the ADFM—a dimension largely underexplored in the current optical–SAR fusion literature.
Karst agricultural landscapes are characterized by fragmented field distribution, irregular parcel boundaries, terrain-induced shadows, and strong background heterogeneity. Conventional convolutional networks rely on local receptive fields and tend to lose fine boundary information during repeated down-sampling, while Transformer-based models often produce overly smooth predictions and perform poorly on fine-grained fragmented parcels. The proposed MSEF module addresses the inherent trade-off of traditional filtering operators by operating at the feature level in shallow decoder stages, dynamically preserving edge information through a learnable edge detection branch combined with adaptive multi-scale Gaussian filtering. This distinguishes our approach from existing boundary enhancement methods such as BEDSN [43] and BAFormer [44], which typically apply boundary supervision at the loss level rather than directly influencing feature propagation. The ADFM addresses the irregular and non-rigid geometries typical of karst agricultural parcels by jointly integrating deformable convolution with multi-head self-attention within a gated fusion architecture. While deformable convolution has been employed in remote sensing to enhance learning capability for irregular field shapes, most existing applications focus on single-modal imagery or generic segmentation tasks [45]. Our ADFM is specifically designed to compensate for the non-rigid deformation that persists after global rigid registration between optical and SAR modalities—a synergistic integration which has received limited attention in karst crop mapping.
The computational efficiency of UNet-DFH also warrants attention. Despite having 36.093 M parameters (higher than the baseline U-Net’s 17.267 M), the model consumes only 35.285 GFLOPs, representing a 56.1% reduction from the baseline’s 80.381 GFLOPs. This is primarily attributed to the bottleneck design of the ADFM: the bridge layer reduces the feature dimension from 2048 to 512 before applying ADFM, decreasing the computational complexity of multi-head attention and deformable convolution by approximately 16× relative to operations at 2048 dimensions. Moreover, this module is applied only once at the coarsest spatial scale. Combined with bilinear up-sampling and localized module deployment, these optimizations achieve a favorable balance between segmentation accuracy and computational cost.
The incorporation of Sentinel-1 SAR-VV imagery further enhances mapping performance. Compared with optical imagery alone, SAR provides structural information that is largely independent of optical reflectance, complementing observations in terrain-shadowed regions and improving the representation of fragmented parcels. Experimental results indicate that integrating SAR and optical imagery increases mapping completeness while maintaining competitive overall segmentation accuracy.
However, the introduction of SAR data also entails an important trade-off. Recall improves by 5.50 percentage points, while Precision declines by 3.05 percentage points, corresponding to an increase in false positives that may lead to some overestimation of sugarcane area. This can be understood as an expected consequence of SAR data incorporation—residual speckle noise persists after preprocessing and fusion, particularly in shallow feature maps near boundaries and fragmented patches, and exacerbates misclassification across all models. This highlights the need for feature-level noise mitigation strategies such as the MSEF module. Nevertheless, the net gain in IoU of 2.28 percentage points confirms that the overall segmentation performance benefits from SAR’s complementary structural information, particularly for detecting fragmented and shadowed plots that would otherwise be missed in optical-only inputs.
These experimental results suggest that accurate crop mapping in karst regions depends not only on stronger semantic representation but also on effective preservation of spatial geometry throughout feature extraction and fusion. Future work should investigate strategies to further reduce commission errors, such as incorporating additional polarimetric features or post-processing refinement.

4.2. Limitations and Future Perspectives

Despite the competitive performance of UNet-DFH for sugarcane mapping in heterogeneous karst regions, several limitations remain to be addressed. (1) The reported results are limited to a single region in Guangxi; cross-regional generalization has not been validated. Future work should assess transferability using multi-region and multi-season datasets. (2) The sub-meter Google Earth reference imagery introduces boundary uncertainty relative to the 10 m Sentinel pixel grid, and no independent field survey data were collected for validation. Future studies should incorporate ground-truth measurements to further verify the labels. (3) Due to computational constraints, all results are based on a single training run per model, and the evaluation relies primarily on pixel-based metrics. Object-level assessment and statistical stability (e.g., multiple runs with different seeds) remain to be explored. (4) The current study relies exclusively on optical and SAR data. The inclusion of additional remote sensing modalities could provide complementary information. These modalities include hyperspectral imagery, Light Detection and Ranging (LiDAR), or high-resolution Unmanned Aerial Vehicle (UAV) observations. Such data could further enhance segmentation performance in highly heterogeneous agricultural environments. (5) Real-time deployment on edge platforms has not been investigated. Moreover, the sensitivity of MSEF to Refined Lee filter removal, DEM resolution, and BRDF effects has not been systematically analyzed. These aspects are left for future work.

5. Conclusions

This study addressed the challenges of sugarcane mapping in fragmented karst landscapes by proposing UNet-DFH, a dual-modal semantic segmentation network integrating an MSEF module and an ADFM. Experiments on the Guangxi karst dataset using multi-temporal Sentinel-2 and Sentinel-1 SAR imagery demonstrated that UNet-DFH outperformed existing state-of-the-art models under both optical-only and optical–SAR fusion scenarios. Under optical-only input, UNet-DFH achieved an IoU of 0.778, Precision of 0.919, Recall of 0.835, F1 of 0.875, OA of 0.925, and B-F1 of 0.813. With optical–SAR fusion, the model achieved an IoU of 0.801, Precision of 0.888, Recall of 0.890, F1 of 0.889, OA of 0.921, and B-F1 of 0.820. Fusion improved IoU by 2.3 percentage points and Recall by 5.5 percentage points, while Precision and OA decreased moderately by 3.1 and 0.4 percentage points, respectively. The net IoU gain confirms that SAR structural information provides an overall benefit for mapping fragmented sugarcane plots. The improvement was particularly evident for highly fragmented, small-scale plots.
The proposed architecture also achieves a favorable balance between model complexity and computational efficiency. By introducing the MSEF module and ADFM at specific network locations and adopting optimized up-sampling strategies in the deeper decoder stages, we substantially reduced FLOPs by 56.1% to 35.285 GFLOPs while maintaining competitive segmentation accuracy. In conclusion, UNet-DFH achieves a favorable balance between global semantic consistency, local boundary fidelity, and computational efficiency on the evaluated dataset, showing potential for high-precision crop mapping in complex terrains.
Future work will focus on two directions. First, we will collect multiregional datasets and develop unsupervised domain adaptation algorithms to enhance model generalization across diverse karst subtypes. Second, we will explore structural network pruning to facilitate deployment on edge-computing agricultural nodes.


Author Contributions

Conceptualization, Y.L. and J.L. (Jinshuang Liu); methodology, Y.L. and L.Z.; software, J.L. (Jinshuang Liu); validation, Y.L. and J.L. (Jinshuang Liu); writing—original draft preparation, J.L. (Jinshuang Liu) and L.Z.; writing—review and editing, L.Z., J.W. and J.L. (Jingwen Li); supervision, Y.L. All authors have read and agreed to the published version of the manuscript.

Funding

This work was supported by Guangxi Natural Science Foundation under Grant No. 2026GXNSFBA00640175.

Data Availability Statement

The Sentinel-1 and Sentinel-2 imagery used in this study are publicly available from the European Space Agency’s Copernicus Open Access Hub (https://dataspace.copernicus.eu/ (accessed on 23 July 2025)). The ground truth labels were manually generated by the authors through visual interpretation of Google Earth imagery, which was used solely as a reference for annotation; these label products are original contributions of this study. The code, trained weights, and dataset splits are part of an ongoing research project funded by the Guangxi Natural Science Foundation and have not yet been publicly released. Upon reasonable request to the corresponding author, we are committed to sharing these materials where permitted.

Acknowledgments

During the preparation of this study, the authors used ChatGPT (OpenAI, San Francisco, CA, USA, GPT-5) only for superficial tasks, specifically preliminary literature retrieval and basic grammatical adjustments. It was not involved in any core aspects of this study, such as experimental design, data collection, statistical analysis, or interpretation of results. All scientific conclusions were drawn independently by the authors.

Conflicts of Interest

The authors declare no conflicts of interest.

References

  1. de França e Silva, N.R.; Chaves, M.E.D.; Luciano, A.C.S.; Sanches, I.D.; de Almeida, C.M.; Adami, M. Sugarcane Yield Estimation Using Satellite Remote Sensing Data in Empirical or Mechanistic Modeling: A Systematic Review. Remote Sens. 2024, 16, 863. [Google Scholar] [CrossRef] [Scilit]
  2. Som-ard, J.; Immitzer, M.; Vuolo, F.; Atzberger, C. Sugarcane yield estimation in Thailand at multiple scales using the integration of UAV and Sentinel-2 imagery. Precis. Agric. 2024, 25, 1581–1608. [Google Scholar] [CrossRef] [Scilit]
  3. Suwanlee, S.R.; Pinasu, D.; Som-ard, J.; Borgogno-Mondino, E.; Sarvia, F. Estimating Sugarcane Aboveground Biomass and Carbon Stock Using the Combined Time Series of Sentinel Data with Machine Learning Algorithms. Remote Sens. 2024, 16, 750. [Google Scholar] [CrossRef] [Scilit]
  4. Satpathi, A.; Chand, N.; Setiya, P.; Ranjan, R.; Nain, A.S.; Vishwakarma, D.K.; Saleem, K.; Obaidullah, A.J.; Yadav, K.K.; Kisi, O. Evaluating statistical and machine learning techniques for sugarcane yield forecasting in the Tarai region of North India. Comput. Electron. Agric. 2025, 229, 109667. [Google Scholar] [CrossRef] [Scilit]
  5. Huang, D.; Zhou, Z.; Zhang, Z.; Dai, Q.; Lu, H.; Li, Y.; Huang, Y. Land Use/Land Cover Remote Sensing Classification in Complex Subtropical Karst Environments: Challenges, Methodological Review, and Research Frontiers. Appl. Sci. 2025, 15, 9641. [Google Scholar] [CrossRef] [Scilit]
  6. Li, B.; Zhou, Z.; Wu, T.; Luo, J. Fine-Grained Land Use Remote Sensing Mapping in Karst Mountain Areas Using Deep Learning with Geographical Zoning and Stratified Object Extraction. Remote Sens. 2025, 17, 2368. [Google Scholar] [CrossRef] [Scilit]
  7. Waters, E.K.; Chen, C.C.-M.; Rahimi Azghadi, M. Sugarcane health monitoring with satellite spectroscopy and machine learning: A review. Comput. Electron. Agric. 2025, 229, 109686. [Google Scholar] [CrossRef] [Scilit]
  8. Xue, W.; Ko, J.; Cao, R.; Yu, Z. Improving Reliability in Reconstruction of Landsat EVI Seasonal Trajectory over Cloud-Prone, Fragmented, and Mosaic Agricultural Landscapes. Remote Sens. 2023, 15, 4673. [Google Scholar] [CrossRef] [Scilit]
  9. Hashemi, M.G.Z.; Jalilvand, E.; Alemohammad, H.; Tan, P.-N.; Das, N.N. Review of synthetic aperture radar with deep learning in agricultural applications. ISPRS J. Photogramm. Remote Sens. 2024, 218, 20–49. [Google Scholar] [CrossRef] [Scilit]
  10. Karmakar, P.; Teng, S.W.; Murshed, M.; Pang, S.; Li, Y.; Lin, H. Crop monitoring by multimodal remote sensing: A review. Remote Sens. Appl. Soc. Environ. 2024, 33, 101093. [Google Scholar] [CrossRef] [Scilit]
  11. Bu, L.; Zhang, J.; Zhang, Z.; Yang, Y.; Deng, M. Deep Learning for Integrated Speckle Reduction and Super-Resolution in Multi-Temporal SAR. Remote Sens. 2024, 16, 18. [Google Scholar] [CrossRef] [Scilit]
  12. Huang, Z.; Jing, H.; Liu, Y.; Yang, X.; Wang, Z.; Liu, X.; Gao, K.; Luo, H. Segment Anything Model Combined with Multi-Scale Segmentation for Extracting Complex Cultivated Land Parcels in High-Resolution Remote Sensing Images. Remote Sens. 2024, 16, 3489. [Google Scholar] [CrossRef] [Scilit]
  13. Yuan, Y.; Wu, Y.; Fu, Y.; Wu, Y.; Zhang, L.; Jiang, Y. An Advanced SAR Image Despeckling Method by Bernoulli-Sampling-Based Self-Supervised Deep Learning. Remote Sens. 2021, 13, 3636. [Google Scholar] [CrossRef] [Scilit]
  14. Shi, C.; Zuo, X.; Zhang, J.; Zhu, D.; Li, Y.; Bu, J. Accuracy Assessment of Geometric-Distortion Identification Methods for Sentinel-1 Synthetic Aperture Radar Imagery in Highland Mountainous Regions. Sensors 2024, 24, 2834. [Google Scholar] [CrossRef] [Scilit] [PubMed]
  15. Chen, T.; Pan, J.; Xu, J.; Hu, J.; Cao, L.; Li, J. MDCA-Net: A multi-directional alignment and dynamic context aggregation network for optical and SAR image fusion. Geo-Spat. Inf. Sci. 2025, 29, 1281–1299. [Google Scholar] [CrossRef] [Scilit]
  16. Liu, R.; Wang, F.; Jiao, N.; You, H.; Hu, Y.; Zhou, G.; Chen, Y. Multi-View Data-Based Layover Information Compensation Method for SAR Image Mosaic. Remote Sens. 2024, 16, 564. [Google Scholar] [CrossRef] [Scilit]
  17. Pyeon, S.-J.; Kim, S.-H.; Shin, H.-K.; Kim, T.; Nam, W.-J. AWM-GAN: SAR-to-Optical Image Translation with Adaptive Weight Maps. Remote Sens. 2025, 17, 3878. [Google Scholar] [CrossRef] [Scilit]
  18. Li, K.; Zhao, W.; Peng, R.; Ye, T. Multi-branch self-learning Vision Transformer (MSViT) for crop type mapping with Optical-SAR time-series. Comput. Electron. Agric. 2022, 203, 107497. [Google Scholar] [CrossRef] [Scilit]
  19. Liu, C.; Sun, Y.; Xu, Y.; Sun, Z.; Zhang, X.; Lei, L.; Kuang, G. A Review of Optical and SAR Image Deep Feature Fusion in Semantic Segmentation. IEEE J. Sel. Top. Appl. Earth Obs. Remote Sens. 2024, 17, 12910–12930. [Google Scholar] [CrossRef] [Scilit]
  20. Quan, Y.; Zhang, R.; Li, J.; Ji, S.; Guo, H.; Yu, A. Learning SAR-Optical Cross Modal Features for Land Cover Classification. Remote Sens. 2024, 16, 431. [Google Scholar] [CrossRef] [Scilit]
  21. Hamidi, M.; Homayouni, S.; Safari, A.; Hasani, H. Deep learning based crop-type mapping using SAR and optical data fusion. Int. J. Appl. Earth Obs. Geoinf. 2024, 129, 103860. [Google Scholar] [CrossRef] [Scilit]
  22. Vyas, N.; Singh, S.; Sethi, G.K. An efficient posterior probability-based image fusion change detection model for the estimation of seasonal agricultural changes using microwave and optical datasets. Comput. Electron. Agric. 2025, 237, 110683. [Google Scholar] [CrossRef] [Scilit]
  23. Li, X.; Zhang, G.; Cui, H.; Hou, S.; Wang, S.; Li, X.; Chen, Y.; Li, Z.; Zhang, L. MCANet: A joint semantic segmentation framework of optical and SAR images for land use classification. Int. J. Appl. Earth Obs. Geoinf. 2022, 106, 102638. [Google Scholar] [CrossRef] [Scilit]
  24. Wu, H.; Huang, P.; Zhang, M.; Tang, W.; Yu, X. CMTFNet: CNN and Multiscale Transformer Fusion Network for Remote-Sensing Image Semantic Segmentation. IEEE Trans. Geosci. Remote Sens. 2023, 61, 2004612. [Google Scholar] [CrossRef] [Scilit]
  25. Wang, L.; Li, R.; Zhang, C.; Fang, S.; Duan, C.; Meng, X.; Atkinson, P.M. UNetFormer: A UNet-like transformer for efficient semantic segmentation of remote sensing urban scene imagery. ISPRS J. Photogramm. Remote Sens. 2022, 190, 196–214. [Google Scholar] [CrossRef] [Scilit]
  26. Zheng, J.; Shao, A.; Yan, Y.; Wu, J.; Zhang, M. Remote Sensing Semantic Segmentation via Boundary Supervision-Aided Multiscale Channelwise Cross Attention Network. IEEE Trans. Geosci. Remote Sens. 2023, 61, 4405814. [Google Scholar] [CrossRef] [Scilit]
  27. Monji-Azad, S.; Hesser, J.; Löw, N. A review of non-rigid transformations and learning-based 3D point cloud registration methods. ISPRS J. Photogramm. Remote Sens. 2023, 196, 58–72. [Google Scholar] [CrossRef] [Scilit]
  28. Sun, Z.; Zhi, S.; Li, R.; Xia, J.; Liu, Y.; Jiang, W. GDROS: A Geometry-Guided Dense Registration Framework for Optical-SAR Images under Large Geometric Transformations. IEEE Trans. Geosci. Remote Sens. 2025, 63, 5650315. [Google Scholar] [CrossRef] [Scilit]
  29. Wang, Z.; Zhang, M.; Wang, Y.; Qiu, X.; Yan, J.; Niu, N. DST-SARNet: A Dual-Stage Texture-Aware SAR Prior Network for Cloud Removal in Optical Remote Sensing Images. Remote Sens. 2026, 18, 2199. [Google Scholar] [CrossRef] [Scilit]
  30. Zhu, X.; Hu, H.; Lin, S.; Dai, J. Deformable ConvNets v2: More Deformable, Better Results. In Proceedings of the IEEE/CVF Conference on Computer Vision and Pattern Recognition (CVPR), Long Beach, CA, USA, 15–25 June 2019; pp. 9308–9316. [Google Scholar]
  31. Wang, J.; Chen, K.; Xu, R.; Liu, Z.; Loy, C.C.; Lin, D. CARAFE: Content-Aware ReAssembly of FEatures. In Proceedings of the IEEE/CVF International Conference on Computer Vision (ICCV), Seoul, Republic of Korea, 27 October–2 November 2019; pp. 3007–3016. [Google Scholar]
  32. Piantanida, R.; Recchia, A.; Franceschi, N.; Valentino, A.; Miranda, N.; Schubert, A. Accurate Geometric Calibration of Senti-nel-1 Data. In Proceedings of the EUSAR, Aachen, Germany, 4–7 June 2018; pp. 1–6. [Google Scholar]
  33. Ronneberger, O.; Fischer, P.; Brox, T. U-Net: Convolutional Networks for Biomedical Image Segmentation. In Medical Image Computing and Computer-Assisted Intervention—MICCAI 2015; Navab, N., Hornegger, J., Wells, W.M., Frangi, A.F., Eds.; Springer International Publishing: Cham, Switzerland, 2015; pp. 234–241. [Google Scholar]
  34. Paszke, A.; Chaurasia, A.; Kim, S.; Culurciello, E. ENet: A Deep Neural Network Architecture for Real-Time Semantic Segmentation. arXiv 2016, arXiv:1606.02147. [Google Scholar]
  35. Zhao, H.; Shi, J.; Qi, X.; Wang, X.; Jia, J. Pyramid Scene Parsing Network. In Proceedings of the 30th IEEE Conference on Computer Vision and Pattern Recognition (CVPR), Honolulu, HI, USA, 21–26 July 2017; pp. 6230–6239. [Google Scholar]
  36. Badrinarayanan, V.; Kendall, A.; Cipolla, R. SegNet: A Deep Convolutional Encoder-Decoder Architecture for Image Segmentation. IEEE Trans. Pattern Anal. Mach. Intell. 2017, 39, 2481–2495. [Google Scholar] [CrossRef] [Scilit] [PubMed]
  37. Chen, L.-C.; Zhu, Y.; Papandreou, G.; Schroff, F.; Adam, H. Encoder-Decoder with Atrous Separable Convolution for Semantic Image Segmentation. In Computer Vision—ECCV 2018; Ferrari, V., Hebert, M., Sminchisescu, C., Weiss, Y., Eds.; Springer International Publishing: Cham, Switzerland, 2018; pp. 833–851. [Google Scholar]
  38. Yang, M.; Yu, K.; Zhang, C.; Li, Z.; Yang, K. DenseASPP for Semantic Segmentation in Street Scenes. In Proceedings of the 2018 IEEE/CVF Conference on Computer Vision and Pattern Recognition, Salt Lake City, UT, USA, 18–23 June 2018; pp. 3684–3692. [Google Scholar]
  39. Li, R.; Zheng, S.; Zhang, C.; Duan, C.; Wang, L.; Atkinson, P.M. ABCNet: Attentive bilateral contextual network for efficient semantic segmentation of Fine-Resolution remotely sensed imagery. ISPRS J. Photogramm. Remote Sens. 2021, 181, 84–98. [Google Scholar] [CrossRef] [Scilit]
  40. Wu, T.; Tang, S.; Zhang, R.; Cao, J.; Zhang, Y. CGNet: A Light-Weight Context Guided Network for Semantic Segmentation. IEEE Trans. Image Process. 2021, 30, 1169–1179. [Google Scholar] [CrossRef] [Scilit] [PubMed]
  41. Li, J.; Wang, Z.; Xu, N.; You, Z. Semantic segmentation with scale alignment and contextual information fusion for multimodal remote sensing images. Inf. Fusion 2026, 126, 103671. [Google Scholar] [CrossRef] [Scilit]
  42. Wu, S.; Jiang, W. A De-Redundancy Interaction and Decouple-Balance Fusion Network for Optical-SAR Multimodal Semantic Segmentation. In Proceedings of the 2025 IEEE International Conference on Unmanned Systems (ICUS), Changzhou, China, 18–19 September 2025; pp. 927–932. [Google Scholar]
  43. Li, X.; Xie, L.; Wang, C.; Miao, J.; Shen, H.; Zhang, L. Boundary-enhanced dual-stream network for semantic segmentation of high-resolution remote sensing images. GISci. Remote Sens. 2024, 61, 2356355. [Google Scholar] [CrossRef] [Scilit]
  44. Li, Z.; Wang, Y.; Tian, F.; Zhang, J.; Chen, Y.; Li, K. BAFormer: A Novel Boundary-Aware Compensation UNet-like Transformer for High-Resolution Cropland Extraction. Remote Sens. 2024, 16, 2526. [Google Scholar] [CrossRef] [Scilit]
  45. Liu, W.; Liu, D.; Wang, L. Survey of Deformable Convolutional Networks. J. Front. Comput. Sci. Technol. 2023, 17, 1549–1564. [Google Scholar]
Figure 1. Overview of the study area. The green mask indicates sugarcane labels, shown for reference.
Remotesensing 18 02815 g001
Figure 2. Schematic architecture of the optimized MCANet network. The network takes both optical and SAR images as input. Colored arrows distinguish different data flows: green for SAR encoding, red for optical encoding, orange for fused-feature decoding, and blue for skip connection. The green box highlights the improved reconstruction head, which produces a four-channel output image that incorporates SAR information.
Remotesensing 18 02815 g002
Figure 3. Architecture of UNet-DFH. Purple boxes denote the MSEF module, orange boxes denote the ADFM, and orange arrows represent skip connection.
Remotesensing 18 02815 g003
Figure 4. Schematic diagram of the MSEF. The module takes Shallow Feature X as input, processes it through two parallel branches—Dynamic Gaussian Filter and Learnable Edge Detection—and then adaptively weights the fused features via Channel Attention to output the Refined Feature.
Remotesensing 18 02815 g004
Figure 5. Architecture of the ADFM. The input feature map is fed in parallel into two branches, namely Deformable Convolution and Multihead Attention. The outputs of the two branches are fused via a gating mechanism and then added with the residual connection to produce the enhanced feature.
Remotesensing 18 02815 g005
Figure 6. Comparison of evaluation metrics between UNet-DFH and 11 semantic segmentation models during the sugar accumulation and maturity stage.
Remotesensing 18 02815 g006
Figure 7. Qualitative comparison of UNet-DFH with mainstream models under typical karst region scenes during the sugar accumulation and maturity stage. Examples were selected to represent four typical scene types: (a,b) discontinuous and irregular boundaries; (c,d) fragmented small plots. Green indicates sugarcane, and black indicates non-sugarcane background. Red circles indicate representative errors (omissions, false positives, or blurred boundaries) to facilitate visual comparison across models.
Remotesensing 18 02815 g007
Figure 8. Comparison of evaluation metrics between UNet-DFH and 11 semantic segmentation models during the tillering stage.
Remotesensing 18 02815 g008
Figure 9. Detailed comparison of UNet-DFH and mainstream models under typical karst region scenes during the sugarcane tillering stage. Examples were selected to cover four scene types: (a,b) fine fragmented plots and jagged boundaries; (c,d) spectrally confusing hilly areas with false positive and omission cases. Green indicates sugarcane, and black indicates non-sugarcane background. Red circles indicate representative errors to facilitate visual comparison across models.
Remotesensing 18 02815 g009
Figure 10. Visual comparison of segmentation results on fused imagery across five models. Green indicates sugarcane, and black indicates non-sugarcane background. Red circles highlight representative misclassifications and omissions to facilitate visual comparison across models.
Remotesensing 18 02815 g010
Figure 11. Panels (A,B) show the performance metrics for models trained on optical imagery alone and optical–SAR imagery, respectively; panel (C) illustrates the improvement in performance metrics when using optical–SAR imagery compared to optical imagery alone.
Remotesensing 18 02815 g011
Figure 12. Comparison of UNet-DFH recognition and segmentation results under single-modal and multimodal imagery. Green indicates sugarcane, and black indicates non-sugarcane background. Red circles highlight representative misclassifications and omissions to facilitate visual comparison across models.
Remotesensing 18 02815 g012
Figure 13. Comparison of performance metrics for the UNet-DFH model under two modalities.
Remotesensing 18 02815 g013
Figure 14. Ablation performance comparison of individual components during the sugar accumulation and maturity stage.
Remotesensing 18 02815 g014
Figure 15. Visualization of segmentation results from ablation experiments during the tillering stage and the sugar accumulation and maturity stage. Green indicates sugarcane, and black indicates non-sugarcane background.
Remotesensing 18 02815 g015
Figure 16. Training loss curves for four randomly chosen models (OurNet denotes our proposed UNet-DFH model).
Remotesensing 18 02815 g016
Figure 17. Efficiency comparison of 12 models in terms of parameters (green), FLOPs (orange), and inference latency (blue). All values are derived from single-run measurements on the test set.
Remotesensing 18 02815 g017
Table 1. Remote sensing datasets and auxiliary data employed in this study.
Data TypeProductBandsSpatial ResolutionOriginal LevelAcquisition Date
Sentinel-2Sentinel-2 MSIB2, B3, B4, B810 mL1C5 March 2024,
10 November 2024
Sentinel-1Sentinel-1 C-SARVV10 mGRD11 March 2024,
10 November 2024
DEMSRTM GL1 V3 (2013)Elevation30 mStandard product-
Disclaimer/Publisher’s Note: The statements, opinions and data contained in all publications are solely those of the individual author(s) and contributor(s) and not of MDPI and/or the editor(s). MDPI and/or the editor(s) disclaim responsibility for any injury to people or property resulting from any ideas, methods, instructions or products referred to in the content.