Article

Multidimensional Quantification of Engineering Distresses and Secondary Periglacial Hazards Along Linear Infrastructure in the Permafrost Region of Northeast China Using UAV-LiDAR and Synchronous Visible-Light Imagery

1
State Key Laboratory of Cryospheric Science and Frozen Soil Engineering, Northwest Institute of Eco-Environment and Resources, Chinese Academy of Sciences, Lanzhou 730000, China
2
University of Chinese Academy of Sciences, Beijing 100049, China
3
International Research Center for China-Mongolia-Russia Cold and Arid Regions Environment and Engineering, Chinese Academy of Sciences, Lanzhou 730000, China
4
Laboratory of Permafrost Geothermics, Melnikov Permafrost Institute, Siberian Branch of the Russian Academy of Science, Yakutsk 677010, Russia
*
Author to whom correspondence should be addressed.
These authors contributed equally to this work.
Remote Sens. 2026, 18(17), 2938; https://doi.org/10.3390/rs18172938
Submission received: 16 July 2026 / Revised: 27 August 2026 / Accepted: 28 August 2026 / Published: 1 September 2026

Highlights

What are the main findings?
  • A synergistic optical–LiDAR framework was developed for centimeter-level, multidimensional quantification of engineering distresses and secondary periglacial hazards along linear infrastructure.
  • The framework quantifies deformation, volumetric change, structural attitude, and temporal evolution across highways, railways, transmission towers, and pipelines.
What are the implications of the main findings?
  • The framework provides a reproducible methodology for cross-infrastructure distress assessment and structural health monitoring (SHM).
  • It extends effective monitoring of infrastructure condition and periglacial processes from snow-free to snow-covered periods.

Abstract

Permafrost degradation is intensifying differential settlement, structural deformation, and secondary periglacial hazards along linear infrastructure in cold regions, underscoring the need for monitoring approaches that integrate corridor-scale screening with fine-scale quantification. This study investigated highways, railways, transmission tower foundations, and buried pipelines in the permafrost region of Northeast China using multi-temporal UAV-borne LiDAR point clouds and synchronous visible-light imagery acquired by a DJI Matrice 300 unmanned aerial vehicle equipped with a DJI Zenmuse L1 sensor (DJI, Shenzhen, China). A synergistic optical–LiDAR framework was developed for distress identification and multidimensional quantification. The overall root mean square errors (RMSEs) at flight altitudes of 50 m and 100 m were 3.25 cm and 4.13 cm, respectively. By integrating texture and boundary information from synchronous visible-light imagery, elevation and volumetric metrics from LiDAR-derived digital elevation models (DEMs) and digital surface models (DSMs), and structural attitude parameters extracted from three-dimensional (3D) models, the framework enabled the parametric quantification of pavement cracking, differential shoulder settlement, railway embankment slump, transmission tower inclination, thaw settlement and ponding in pipeline trenches, and secondary icing. Snow-depth retrievals agreed well with field measurements (R2 = 0.87, RMSE = 1.32 cm), indicating that UAV-LiDAR can extend monitoring into snow-covered periods. These findings provide a methodological basis for distress detection, screening of hazard-prone sections, and risk-informed operation and maintenance of linear infrastructure in permafrost regions.

1. Introduction

Permafrost constitutes a critical component of terrestrial systems in cold regions, covering approximately one-fifth of the exposed land area in the Northern Hemisphere, and its thermal state is highly sensitive to both climate change and anthropogenic engineering activities [1,2]. In recent decades, sustained global warming has led to rising permafrost temperatures, thickening of the active layer, and degradation of ground ice. These changes have collectively compromised the bearing capacity of permafrost foundations, triggering surface subsidence, thermokarst landforms, and deformation of engineering structures, thereby posing a significant threat to the safety of infrastructure in cold regions [3]. Approximately 30–50% of critical infrastructure in the circum-Arctic region is projected to be at high risk by the mid-21st century [4]. Under the SSP2-4.5 scenario, about 29% of roads, 23% of railways, and 11% of buildings in the Arctic are expected to be impacted by permafrost degradation, with associated economic losses reaching USD 182 billion; these risks escalate under the SSP5-8.5 scenario, with projected losses reaching $276 billion [5]. Consequently, under ongoing permafrost degradation, developing continuous and high-resolution monitoring methods for linear infrastructure has become an urgent requirement for engineering safety in cold regions.
Engineering research on permafrost in China has long focused on the Qinghai–Tibet Plateau (QTP) corridor. Centered on major infrastructure such as the Qinghai–Tibet Railway, Highway, Power Transmission Line, and the Golmud–Lhasa oil pipeline, relatively systematic theories of engineering permafrost, hazard mitigation techniques, and long-term monitoring systems have been developed [6,7,8,9,10,11,12,13,14]. In contrast, research on engineering distress identification and risk assessment remains relatively limited in the permafrost region of Northeast China, which represents the second largest permafrost region in China. This region lies along the southern margin of the Eurasian permafrost and is characterized as “Xing’an–Baikal” permafrost, with high ground temperatures, thin layers, low spatial continuity, strong dependence on local factors, and high environmental sensitivity [15,16,17]. Under the combined effects of climate warming and engineering disturbance, permafrost degradation in this region is more likely to induce local hydrothermal redistribution and differential surface deformation, thereby triggering engineering distresses such as pavement cracking and embankment thaw-settlement, as well as secondary periglacial hazards including thermokarst ponds, thaw-settlement depressions, and icing [18,19,20,21,22]. These distresses and hazards are typically small in scale, spatially discrete, diverse in type, and strongly seasonal, thereby posing challenges for their characterization and comparison using conventional monitoring approaches.
Existing monitoring methods struggle to simultaneously meet the requirements for long-distance engineering corridor coverage and fine-scale distress identification. Conventional manual inspection can directly obtain distress information, but it is inefficient, subjective, and lacks sufficient spatial coverage [23]. GNSS and leveling surveys provide high accuracy, but they rely on discrete observation points and thus fail to characterize the continuous deformation patterns along engineering corridors [24,25]. Satellite remote sensing and InSAR techniques can provide regional-scale observations, but their performance in Northeast China is often constrained by dense forest vegetation, low coherence, and seasonal snow cover, which limits their ability to detect microtopographic changes and small-scale distress features [26,27]. Therefore, fine-scale detection and multidimensional quantification of engineering distresses and secondary periglacial hazards under complex land-cover conditions, strong spatial heterogeneity, and seasonal snow cover remain key challenges for risk assessment of linear infrastructure in this region.
UAV-LiDAR can characterize microtopographic variations, surface deformation, and structural geometry through active laser ranging, high-density point-cloud acquisition, and partial vegetation-penetration capability [28], whereas UAV-based visible-light imagery provides high-resolution texture, spectral, and boundary information [29]. Previous studies have applied UAV photogrammetry and LiDAR to characterize thaw-related terrain deformation, engineering distress, and seasonal snow conditions in permafrost regions [30,31,32,33,34,35,36,37,38,39,40,41,42,43]. However, as summarized in Table 1, most applications remain focused on a single infrastructure type, a specific periglacial process, or one dominant observation requirement. Because different engineering targets exhibit distinct signatures in terms of texture, elevation, three-dimensional morphology, and structural attitude, a target-driven strategy is required to integrate complementary data products and derive comparable engineering parameters. Unlike conventional RGB–LiDAR integration primarily used for mapping or object recognition, this approach emphasizes adaptive information utilization for quantitative assessment of diverse engineering distresses and secondary periglacial hazards.
To address this gap, this study investigates four types of linear infrastructure in the permafrost region of Northeast China, including highways, railways, transmission lines, and buried pipelines. Based on multi-temporal UAV-LiDAR point clouds and synchronous visible-light imagery, we develop and evaluate a target–driven optical–LiDAR framework that integrates complementary observations for multidimensional characterization across different infrastructure types. Optical imagery, LiDAR-derived topography, and 3D structural information are utilized according to the dominant observable characteristics of different targets to quantify planar extent, vertical deformation, volumetric change, structural attitude, and temporal evolution. Snow-covered observations are further used to evaluate the potential and uncertainty of extending UAV-LiDAR monitoring beyond the snow-free season. This study provides an operational and reproducible basis for quantitative distress assessment, screening of hazard-prone sections, and repeated condition monitoring of linear infrastructure in permafrost regions.

2. Study Area and Engineering Background

2.1. Study Area

The study area is located along an engineering corridor in the permafrost region of Northeast China. The investigated objects include the Jagdaqi–Mo’he Highway (JMH), NenLin Railway (NLR), JinXin power transmission (JXPT) line, China–Russia Crude Oil Pipeline (CRCOP), and disturbed areas along this corridor. The corridor traverses isolated, sporadic, and discontinuous permafrost zones (Figure 1), with warm and ice-rich permafrost developed locally along several engineering sections. The representative UAV survey sites exhibit various engineering distresses and secondary periglacial hazards, including pavement cracking, embankment differential settlement, slope slumping, tower tilting, pipeline trench thaw-settlement, ponding, and icing. These sites represent typical permafrost–engineering interactions under different structural types, disturbance modes, and land-cover conditions in the permafrost region of Northeast China, and provide a basis for evaluating the synergistic identification approach using UAV-LiDAR and visible-light imagery.

2.2. Typical Engineering Projects

(1)
The JMH is the permafrost section of the Beijing–Mo’he Highway (G111) and serves as an important corridor for regional transport connectivity, tourism development, and the operation and maintenance of the CRCOP. The Jagdaqi–Walagan section generally trends north–south, whereas the Walagan–Mo’he section runs east–west. Pavement types include asphalt and concrete. Under ongoing permafrost degradation, various road distresses have been observed along this highway [44]. Four representative segments were selected for UAV surveys: K2011 (pavement cracking), K2104 (uneven settlement), K2120 (pavement undulation), and K2304 (pavement subsidence).
(2)
The Jagdaqi–Mo’he section of the NLR is a single-track, non-electrified railway extending from Jagdaqi northward to Gulian. Running generally parallel to the JMH, it constitutes a critical transport corridor in the Daxing’anling Prefecture. Reported engineering distresses along this railway mainly include embankment settlement, frost heave, and bridge/culvert damage [45]. An embankment slump area near the Xintian Station (K295) was selected as a UAV survey site to characterize localized instability of railway embankment slopes under permafrost degradation.
(3)
The JXPT project provides important electricity support for forestry production and energy development in the Daxing’anling Prefecture. Triggered by permafrost degradation, frost heaving, thaw settlement, and slope runoff erosion, tower foundations are prone to differential deformation, tower tilting, and concrete deterioration [46], along with secondary thermokarst ponding around tower foundations. Towers #15 and #117 were selected for UAV survey, representing tower tilting and thermokarst ponding, respectively. Due to the absence of complete line vector data, only the surveyed tower locations are shown in Figure 1.
(4)
The CRCOP starts from the Skovorodino Station in Russia and extends southward to Daqing, China, with a total length of approximately 1030 km, including about 441 km in permafrost regions. The first and second pipelines (CRCOP I and CRCOP II) are buried in parallel, with a designed burial depth of 1.6–2.0 m, and were put into operation in January 2011 and January 2018, respectively. Their combined annual oil-transport capacity reaches 30 million tons. The oil temperature remains above 0 °C throughout the year, with recorded maximum temperatures up to 30.7 °C [19], imposing sustained thermal disturbance on the surrounding permafrost. Trench thaw settlement, ponding, and icing have developed along the pipeline [47]. Typical sites MDS364 and MDS391 were selected for UAV surveys to characterize surface responses induced by thermal disturbance from buried warm-oil pipelines, including trench settlement, ponding, and icing.

3. Methods

3.1. Data Acquisition

A DJI Matrice 300 RTK quadcopter equipped with a Zenmuse L1 laser scanner (DJI, Shenzhen, China) was deployed for multi-temporal UAV surveys between May 2022 and June 2024, acquiring high-density LiDAR point clouds and synchronized visible-light imagery (Table 2). The Zenmuse L1 integrates a LiDAR sensor, an inertial navigation system (INS), and a mapping camera, enabling synchronous acquisition of 3D point clouds and high-resolution imagery. These datasets provide the basis for spatial detection, three-dimensional reconstruction, and parameter extraction of engineering distresses and secondary periglacial hazards.
According to the morphology of different monitoring targets and their interpretation requirements, both nadir surveys with a camera angle of −90° and oblique surveys with a camera angle of −45° were conducted. The main flight altitudes were 50 m and 100 m. For multi-temporal monitoring sites involving surface subsidence and icing development, flight parameters were kept as consistent as possible during repeated surveys to improve the spatial consistency of point clouds from different periods and to enhance the reliability of DEM of Difference (DoD) analysis and surface deformation interpretation.

3.2. Data Processing

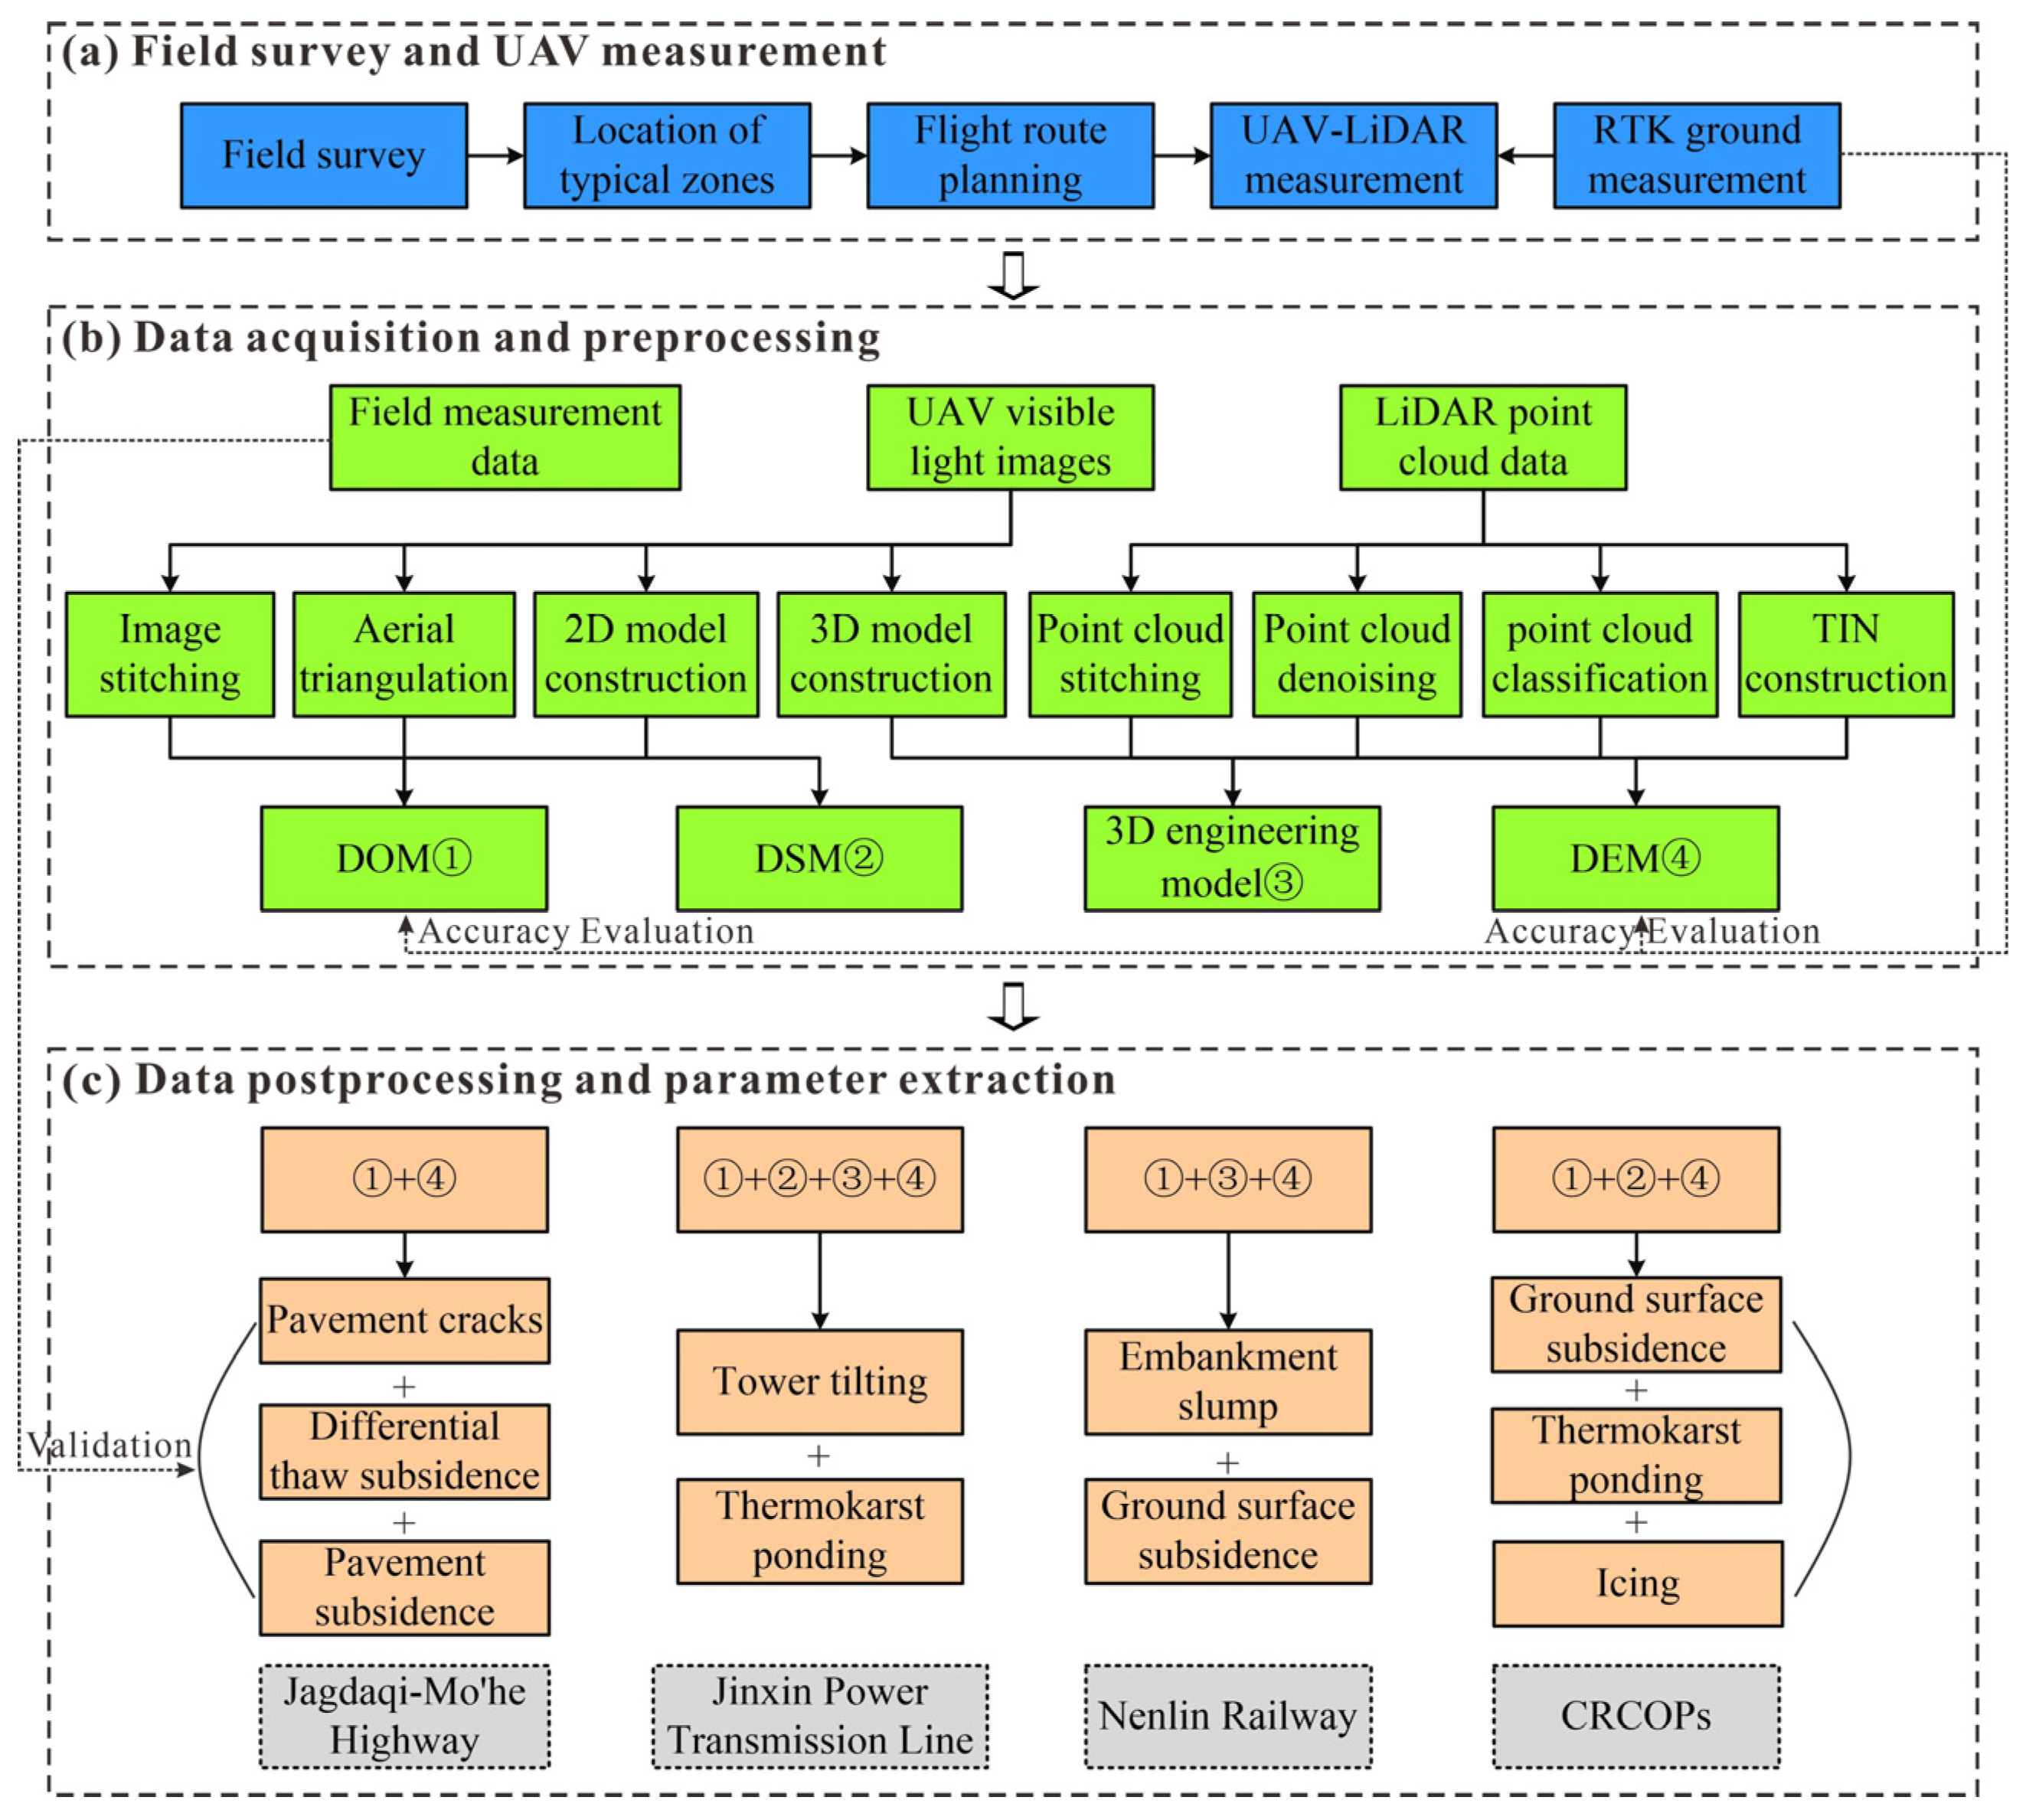
UAV data were processed using DJI Terra (version 4.0.1), Feima LiDAR (version 2.9.2), ENVI (version 5.3), and ArcGIS (version 10.8) platforms. An optical–LiDAR synergistic interpretation and multidimensional parameter extraction workflow was established (Figure 2), including visible-light image processing, LiDAR point-cloud processing, and multi-source parameter extraction.
Visible-light image processing. Raw images were processed in DJI Terra for image mosaicking, aerial triangulation, and two-dimensional/three-dimensional reconstruction, generating Digital Orthophoto Maps (DOMs), Digital Surface Models (DSMs), and 3D models. The reconstruction used the standard scene mode with high feature-point density and high-resolution settings, and all products were exported in the WGS_1984_UTM_51N coordinate system. After geometric correction and enhancement, DOMs were used for target interpretation and classification. For targets with distinct spectral or textural characteristics, support vector machine (SVM) classification was applied, and extracted boundaries were refined using field observations. Training samples were manually selected from representative regions of interest (ROIs), excluding ambiguous boundaries and illumination-affected areas to improve classification reliability.
LiDAR Point Cloud Processing. Raw point clouds were stitched and quality-checked in DJI Terra. A point spacing of 0.20 m was adopted, and initial ground-point classification was performed using the gentle-slope terrain setting. The processed point clouds were then exported as LAS files and subsequently imported into Feima LiDAR for denoising, outlier removal, refinement of point-cloud classification, ground-point extraction, and triangulated irregular network (TIN) construction, yielding DEMs with a 0.10 m spatial resolution. In areas with dense vegetation, ponding, snow and ice cover, or engineering structures, manual editing was used to refine ground-point classification and improve the reliability of microtopographic reconstruction.
Optical–LiDAR Integration and Multidimensional Parameter Extraction. The DOM, DSM, DEM, and 3D models were georeferenced to a unified coordinate system (WGS_1984_UTM_51N) to construct a multidimensional feature space. The DOMs were mainly used for interpreting target texture and boundaries; the DEMs/DSMs were used for elevation analysis, profile extraction, slope morphology characterization, and volume calculation; and the 3D models were used for extracting structural geometry and spatial attitude. According to the observable features of different targets, parameters including pavement cracking density, pavement waving, slump volume, tower inclination, ground surface subsidence, ponding area and water depth, and icing volume were extracted, providing a unified technical workflow for the quantitative characterization of engineering distresses and secondary periglacial hazards in permafrost regions.

3.3. Uncertainty Assessment

To constrain the reliability of volumetric estimates of engineering distresses and secondary periglacial hazards, we quantified the level of detection at the 95% confidence level (LoD95) and propagated elevation uncertainties from DoD products into volumetric uncertainties. This assessment followed the DoD uncertainty framework developed in geomorphological studies [48,49] and the general error-propagation principles. The vertical uncertainty of multi-temporal DEM differencing was estimated by propagating the elevation errors of the two DEMs. The LoD95 was calculated as:
L o D 95 = t σ D o D
where σ D o D represents the propagated vertical uncertainty of the DoD derived from the two DEMs, t is the t-value at the chosen confidence level, and t = 1.96 was used as the threshold [50,51]. Elevation changes smaller than the LoD95 threshold were considered indistinguishable from measurement uncertainty.
The uncertainty of volume estimates was quantified using an error-propagation approach [52]. Assuming spatially uniform and independent pixel-wise elevation uncertainties within each investigated feature, the volumetric uncertainty was calculated as:
σ V = i = 1 N ( A c e l l σ D o D ) 2
where A c e l l represents the DEM cell area and N represents the number of cells within the feature boundary. This approach propagates the uncertainty of elevation changes into the volume calculation. The LoD95 threshold and propagated volumetric uncertainty were applied to pavement subsidence (Section 4.1.1(d)), the railway embankment slump (Section 4.1.3), and icing-associated surface change (Section 4.2.3).

4. Results

4.1. Engineering Distresses

4.1.1. Highway Distresses

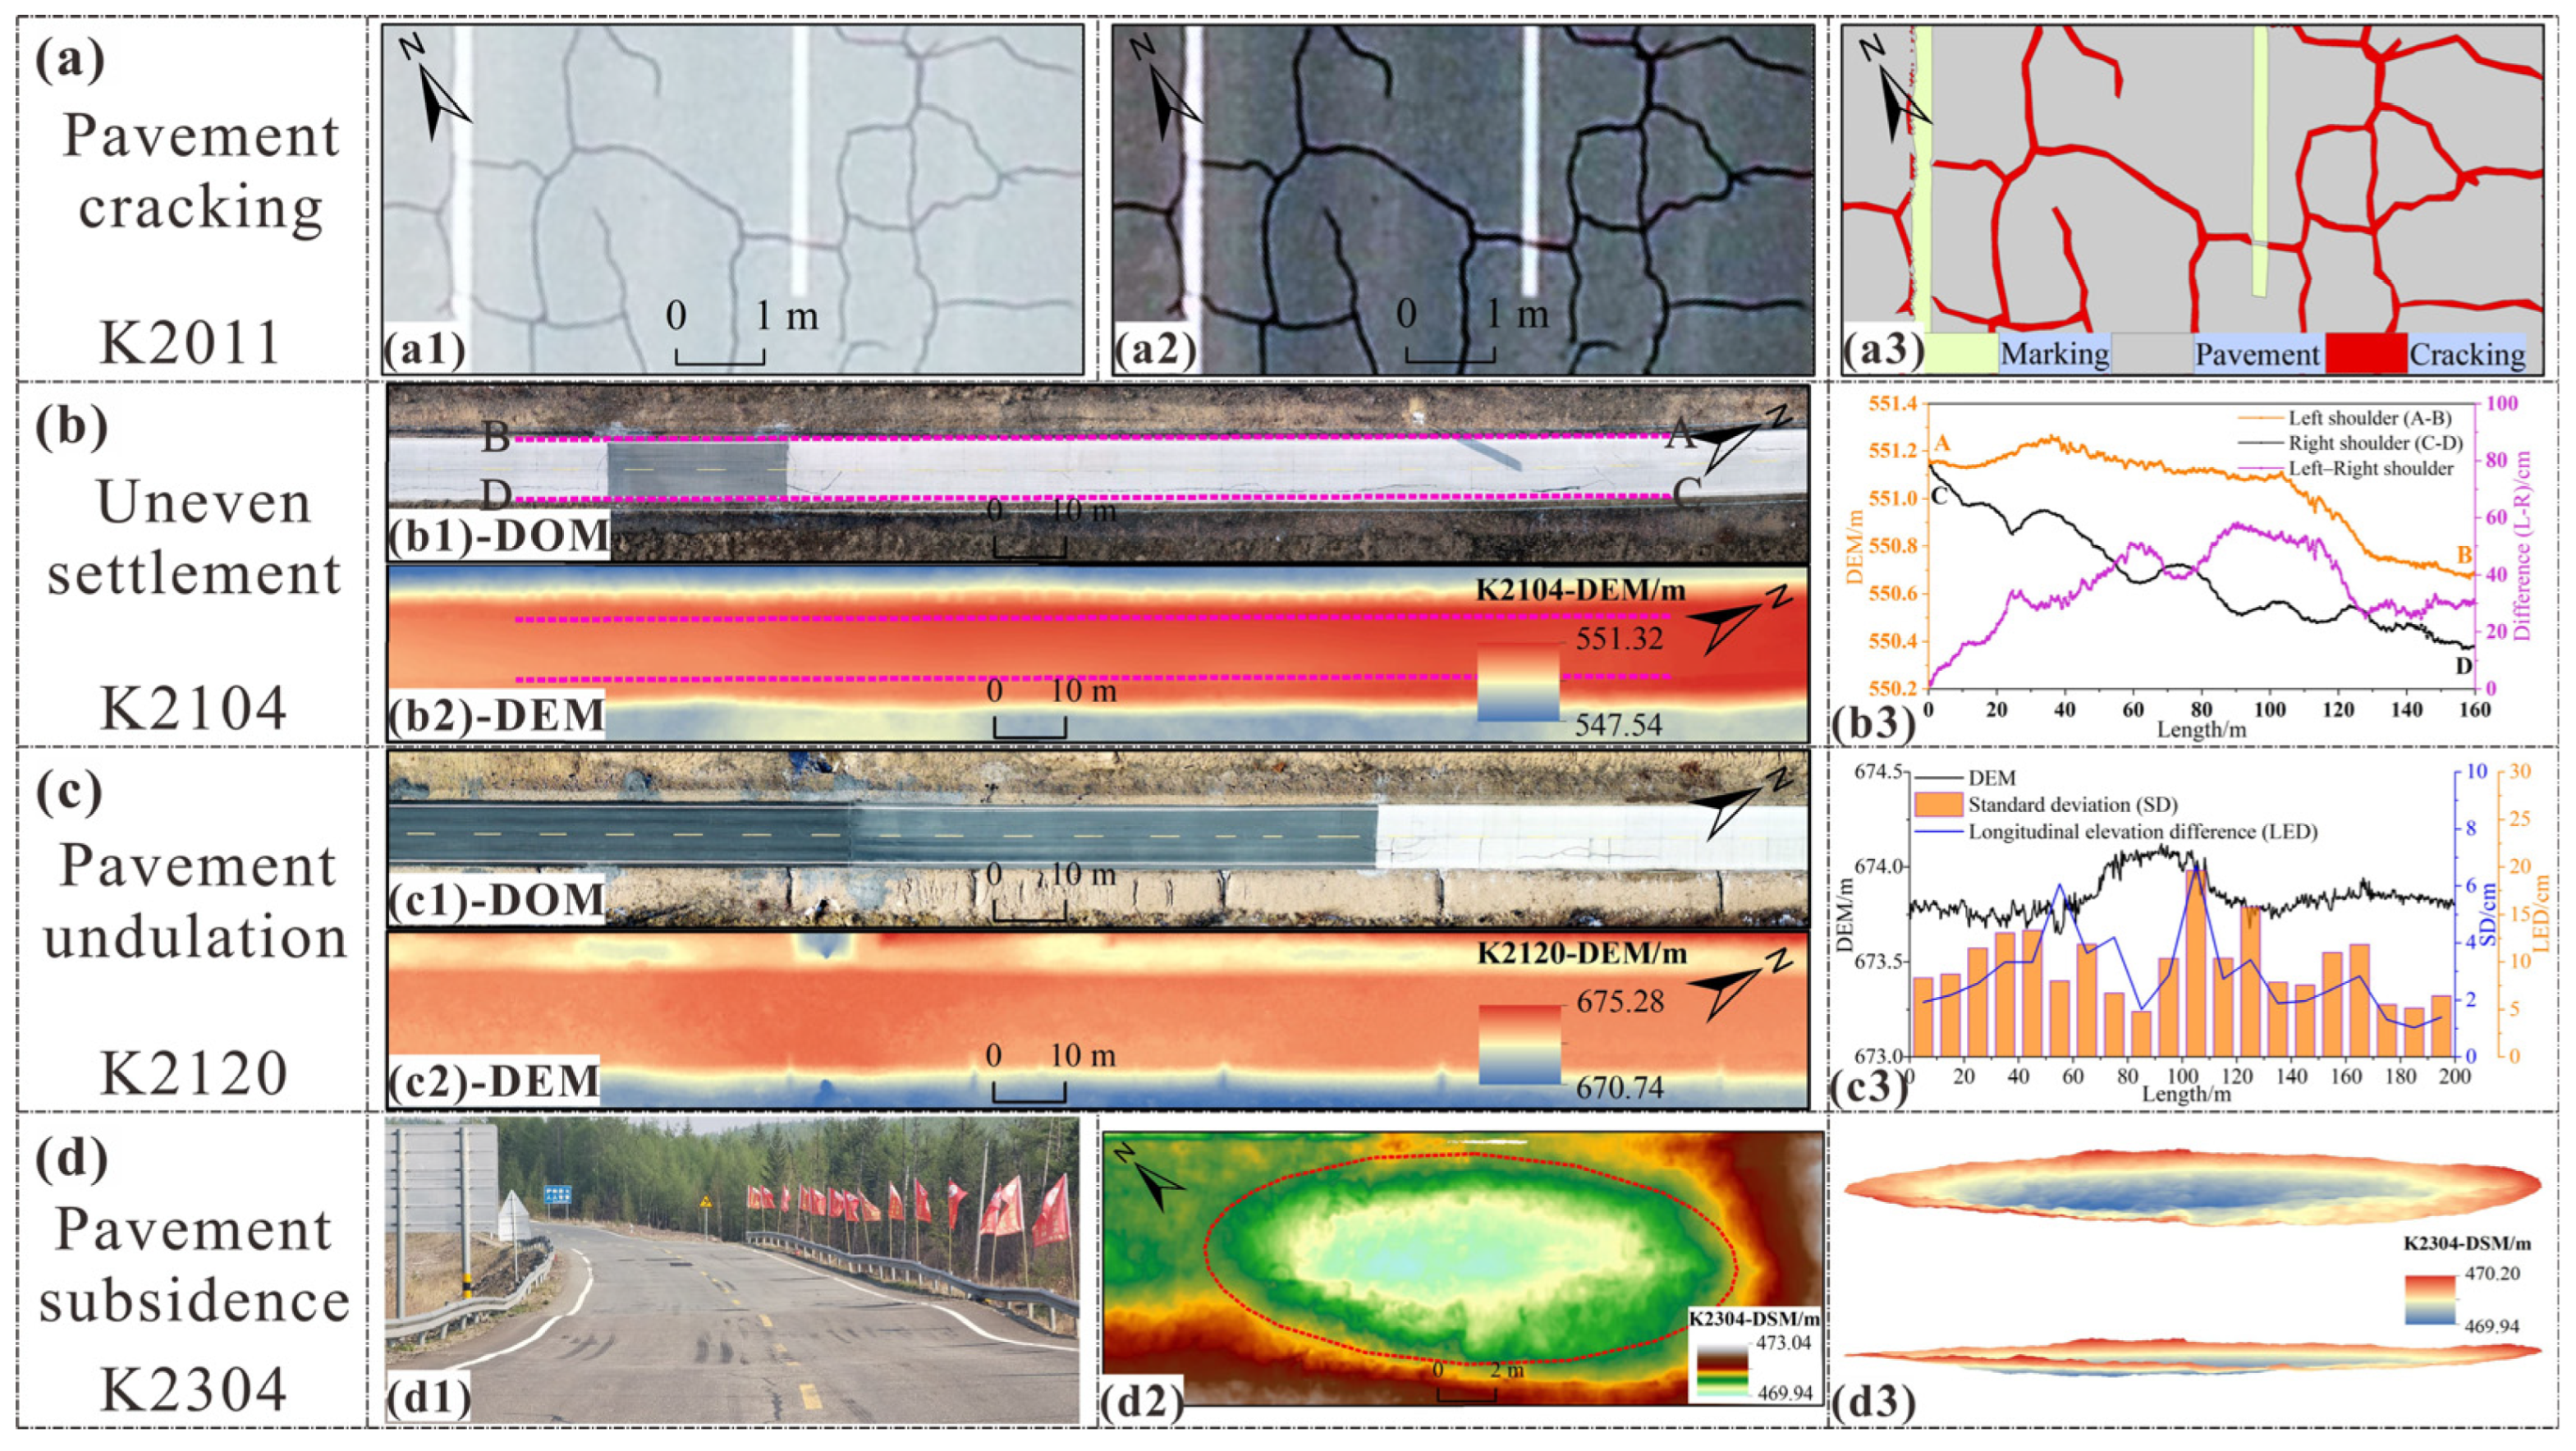
Based on high–resolution DOM, DSM, and DEM data, typical road distresses along the JMH were identified and quantified through synergistic interpretation and parameter extraction (Figure 3). Different distress types exhibited distinct characteristics in image texture, microtopography, and geometric morphology.
(a)
Pavement cracking: supervised classification based on textural information. The K2011 section was dominated by network cracks with small widths and negligible elevation differences; therefore, crack detection mainly relied on DOM texture. Gamma stretching was applied to the original pavement image (Figure 3(a1)) to enhance pixel contrast (Figure 3(a2)). Training samples were then constructed, and an SVM classifier was employed to classify the image into three categories: pavement, cracks, and markings (Figure 3(a3)). The overall classification accuracy was 99.38%, with a Kappa coefficient of 0.9836. Within an 8 m × 4 m pavement area, the total crack length was 35.61 m, the crack density was 1.11 m/m2, and the crack area was 2.77 m2; the pavement marking area was 1.35 m2.
(b)
Differential shoulder settlement: transverse deformation characterized using DEM profiles. Distinct differential settlement occurred between the two shoulders in the K2104 section. The DOM captured only local surface anomalies (Figure 3(b1)), whereas the DEM clearly revealed elevation differences between the shoulders (Figure 3(b2)). To quantify transverse deformation, elevation profiles A–B and C–D were extracted along the left and right shoulders, respectively (Figure 3(b3)). The results showed asynchronous elevation changes on both shoulders, with the elevation difference progressively increasing toward the middle section and reaching a maximum of 58.28 cm and an average of approximately 36.15 cm.
(c)
Pavement undulation: quantitative assessment using undulation-related indicators. The K2120 section exhibited pronounced pavement undulation, characterized by short-wavelength and high-frequency surface-elevation variations. Standard deviation (SD) and longitudinal elevation difference (LED) were used to evaluate pavement undulation and bump severity. The results (Figure 3(c3)) showed that, within the 200 m section, SD ranged from 1.03 to 6.72 cm, and sections with SD > 2.5 cm accounted for approximately 55% of the total length. LED ranged from 4.81 to 19.65 cm, and sections with severe bumping conditions (LED > 8 cm) accounted for approximately 60%, mainly concentrated in the repaired pavement section from 0 to 140 m.
(d)
Pavement subsidence: quantification based on three-dimensional morphology. Localized pavement subsidence was observed in the K2304 section (Figure 3(d1)). The DSM clearly delineated the planar boundary and morphology of the subsidence zone (Figure 3(d2)), which was approximately 17.2 m long along the road direction and 6.4 m wide transversely. The 3D reconstruction indicated a maximum subsidence depth of approximately 26.1 cm (Figure 3(d3)). The original DEM-based volume estimation yielded a subsidence volume of approximately 9.3 m3. After applying the LoD95 threshold defined in Section 3.3 to exclude elevation changes within the uncertainty range, the detectable subsidence volume was estimated as 5.83 m3. The propagated volumetric uncertainty was ±0.018 m3. These results provide a quantitative basis for evaluating distress severity and estimating maintenance requirements.

4.1.2. Transmission Tower Distresses

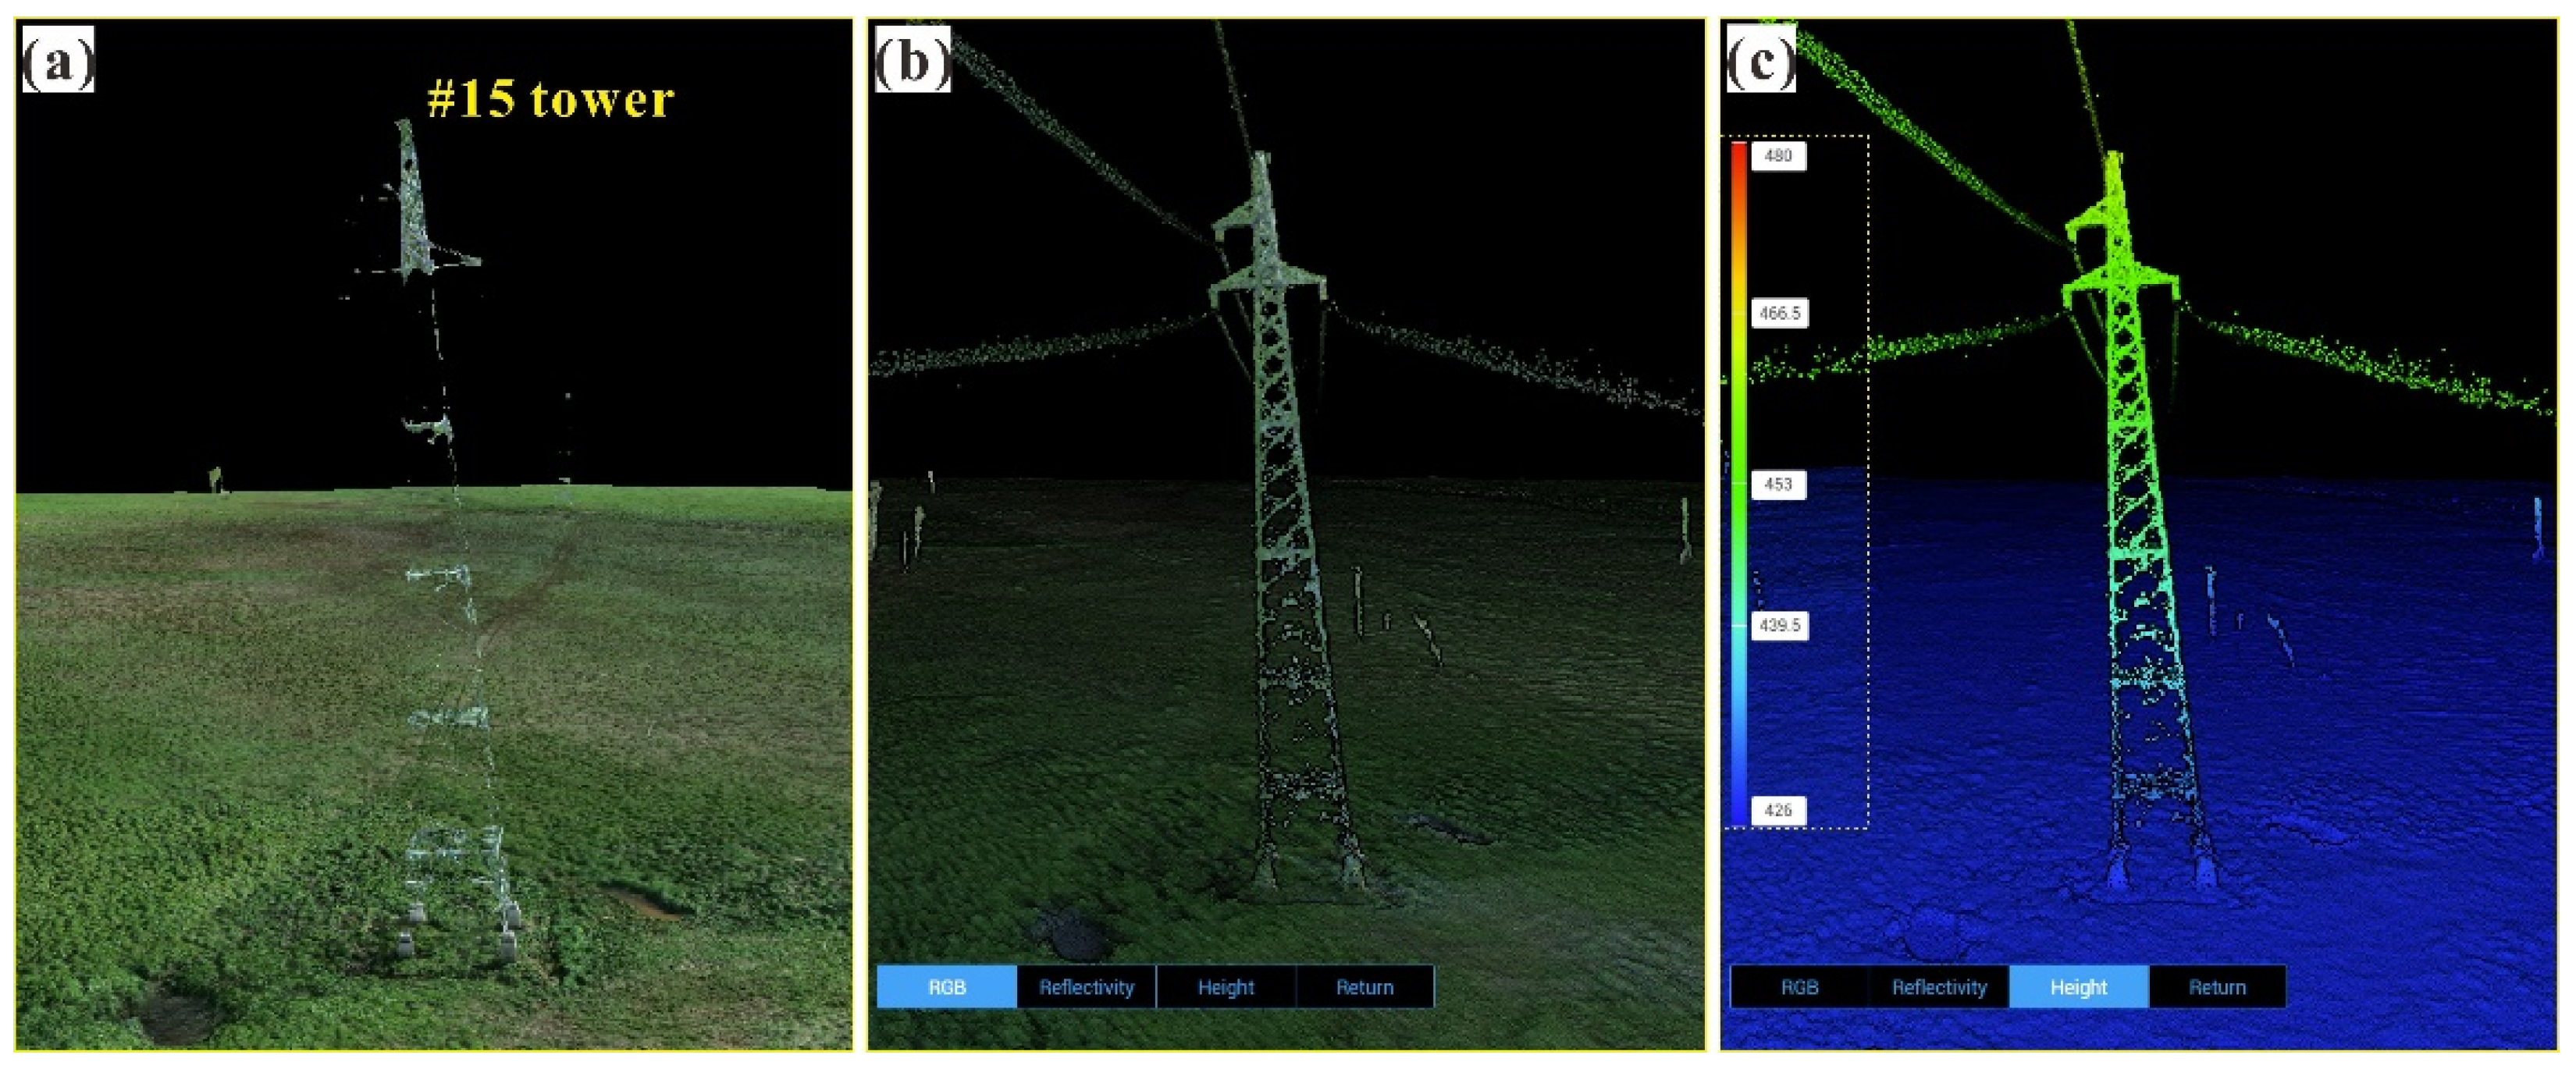
Tower #15 along the JXPT line was selected as a representative case for tower distress identification, 3D reconstruction, and attitude-parameter extraction using visible-light imagery and LiDAR point cloud data. The model reconstructed from visible-light imagery alone was affected by weak textures of tower components, complex truss geometry, and illumination effects, resulting in local geometric gaps and structural discontinuities in multilayer components and detailed connection areas (Figure 4a). In contrast, the optical–LiDAR fusion model reconstructed the detailed tower structure, conductor alignment, and surrounding ground surface more completely (Figure 4b). Based on the elevation information of the fusion model (Figure 4c), the tower structure and ground point clouds could be further separated, providing a three-dimensional data basis for tower-axis extraction, tower-top displacement calculation, and foundation deformation analysis.
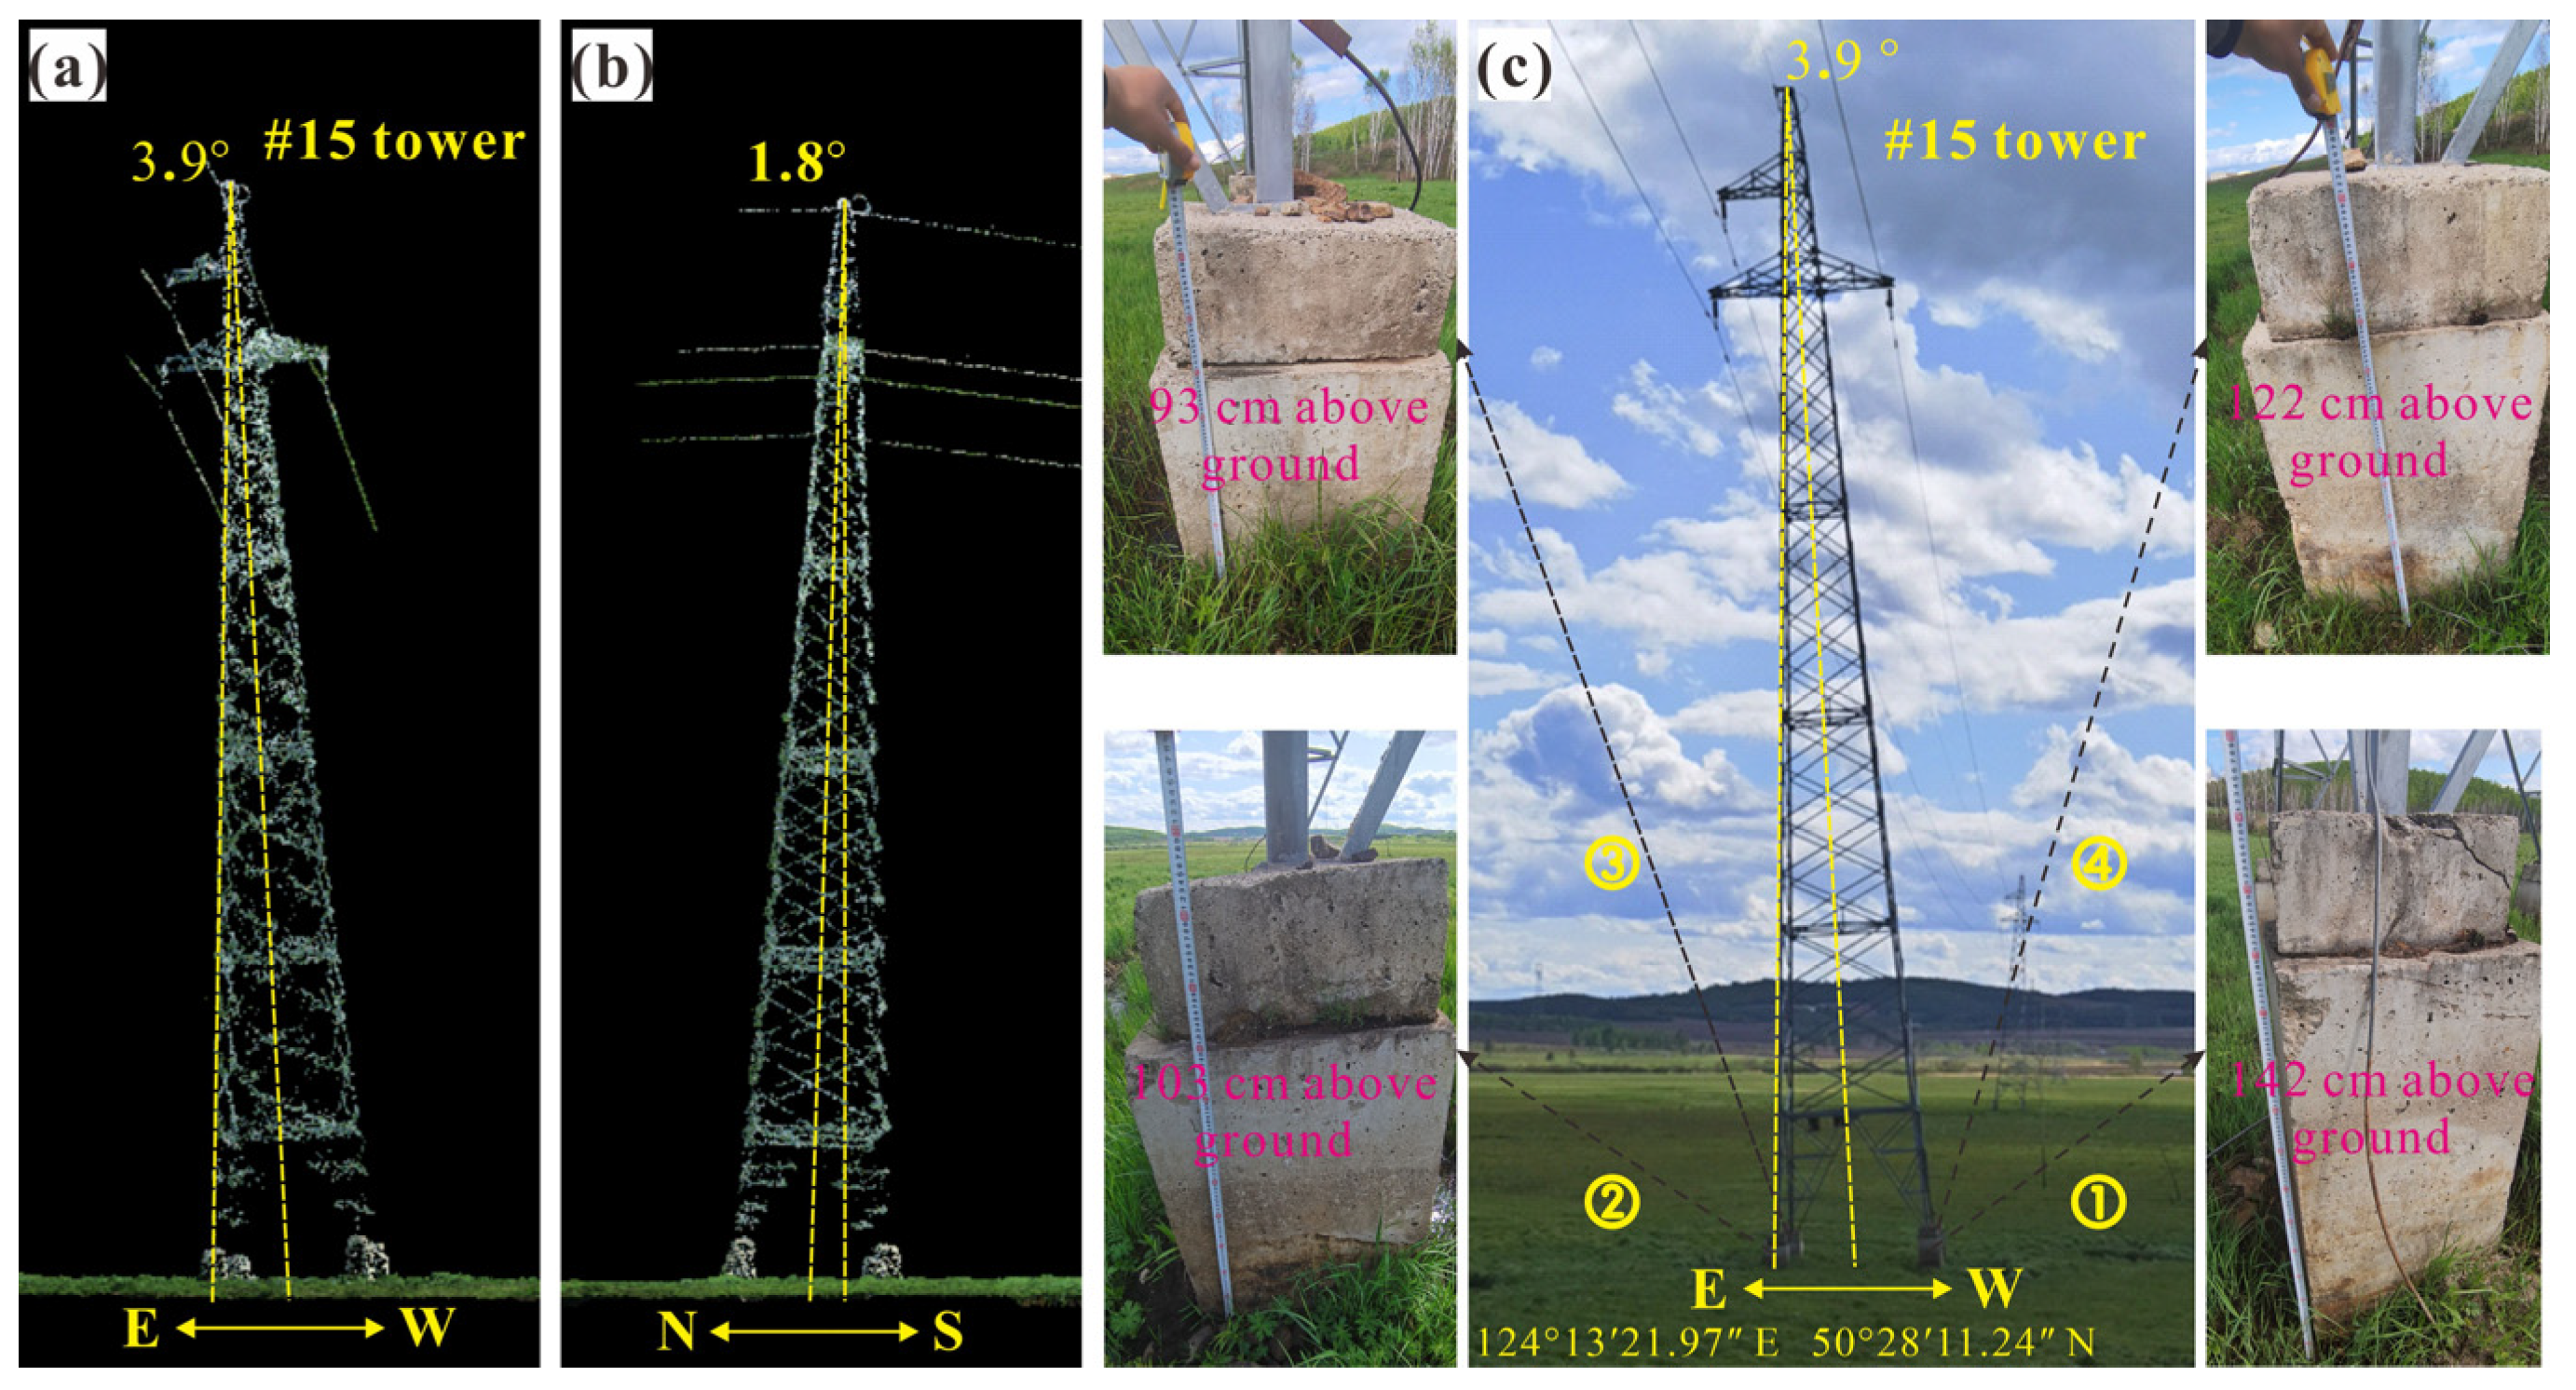
Tower inclination was quantified as the angle between the tower axis and the vertical in the east–west (E–W) and north–south (N–S) directions. Tower #15 tilted eastward by approximately 3.9° in the E–W direction, with a tower-top displacement of about 2.30 m (Figure 5a), and tilted southward by approximately 1.8° in the N–S direction, with a tower-top displacement of about 1.06 m (Figure 5b). Field measurements and 3D model extraction further showed that the exposed heights of the four foundations were 142 cm, 103 cm, 93 cm, and 122 cm, respectively, with a maximum difference of 49 cm, indicating pronounced differential deformation of the tower foundation. The tower is situated in a tussock wetland within an isolated permafrost zone near the southern boundary of permafrost in Northeast China, where permafrost thermal stability is poor. Under the combined effects of climate warming and engineering-induced thermal disturbances, uneven thaw settlement of the permafrost foundation may be an important factor contributing to tower inclination.

4.1.3. Railway Distress

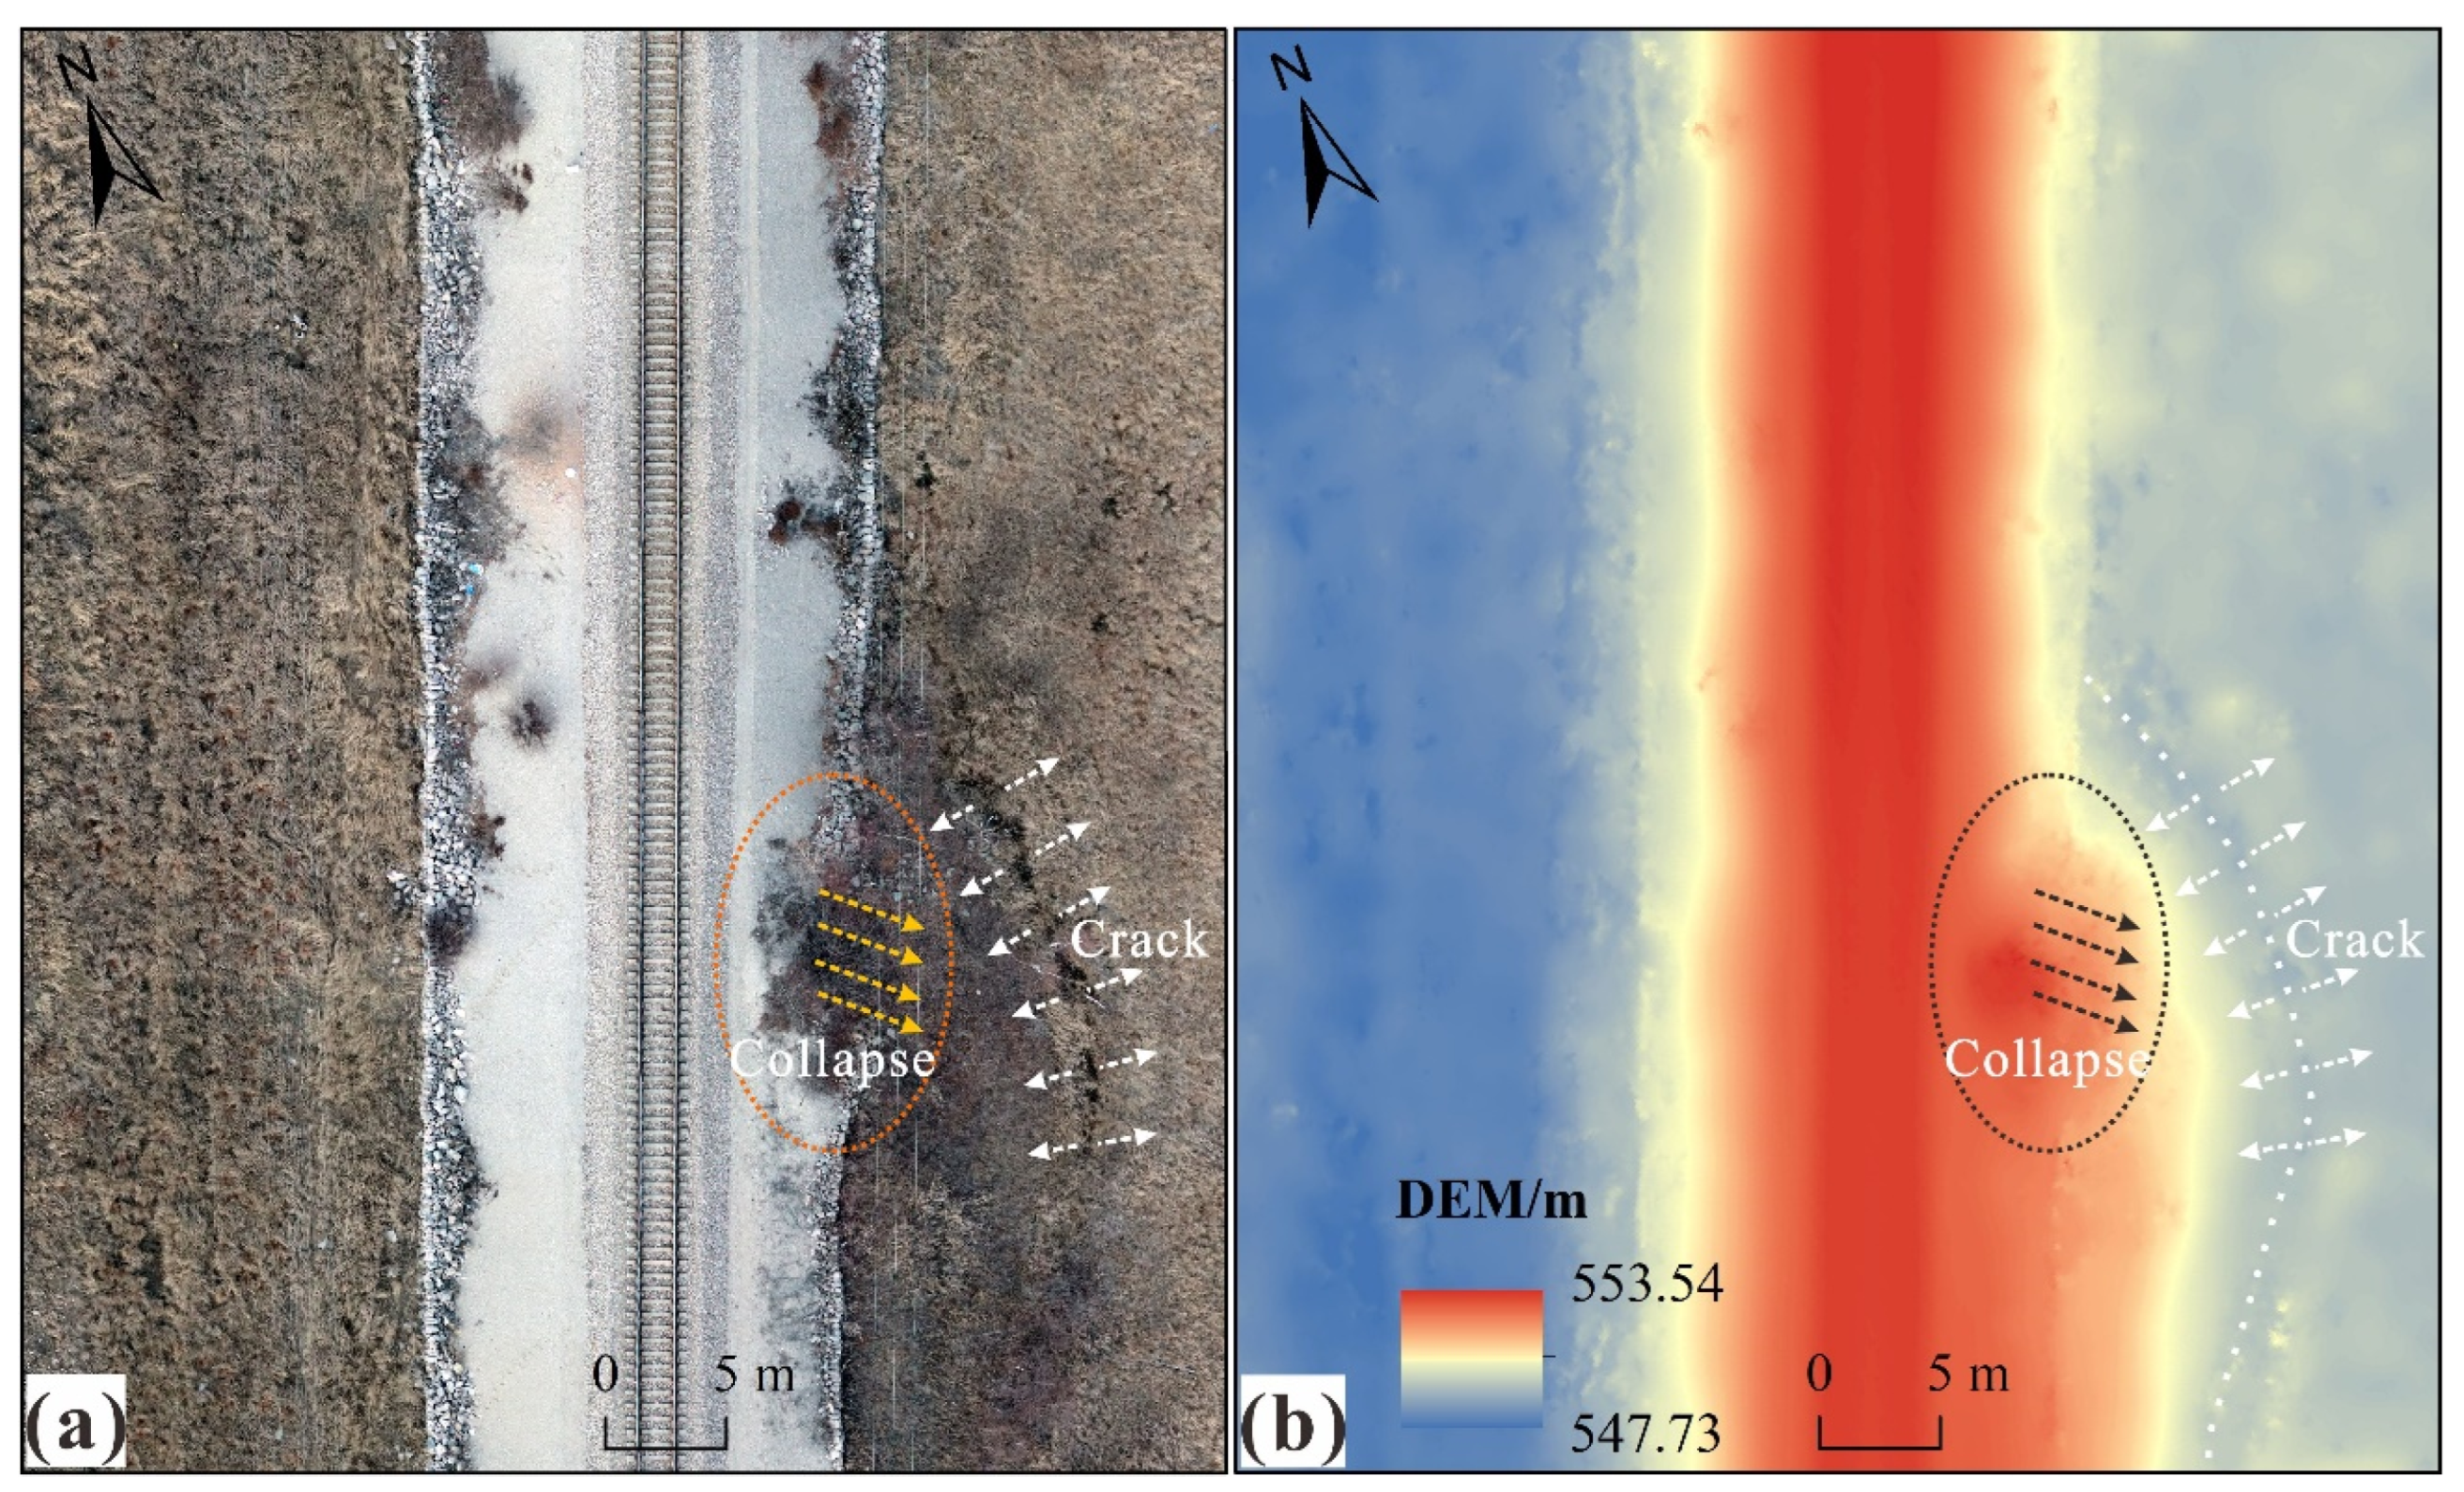
At the K295 section of the NLR, the DOM revealed an approximately elliptical slump area on the right side of the embankment, accompanied by peripheral cracks (Figure 6a). By combining the textural boundaries identified from the DOM with abrupt topographic changes in the DEM, the affected area was delineated as approximately 8.2 m long and 4.7 m wide.
Given the absence of pre-slump topographic data, elevation points from the relatively stable slope surrounding the slump area were used to reconstruct the pre-slump reference surface through natural-neighbor interpolation. The slump volume was estimated by integrating the elevation differences between the reconstructed reference surface and the current DEM (Figure 6b), yielding a volume of approximately 7.22 m3. After applying the LoD95 threshold defined in Section 3.3 to exclude elevation differences within the DEM uncertainty range, the detectable slump volume was estimated as 6.69 m3. The propagated volumetric uncertainty was ±0.022 m3. The surface crack to the right of the slope-failure area may indicate localized deformation associated with differential thaw settlement at the slope toe; the resulting loss of lateral restraint may have contributed to the failure.

4.2. Secondary Periglacial Hazards

4.2.1. Ground Surface Subsidence

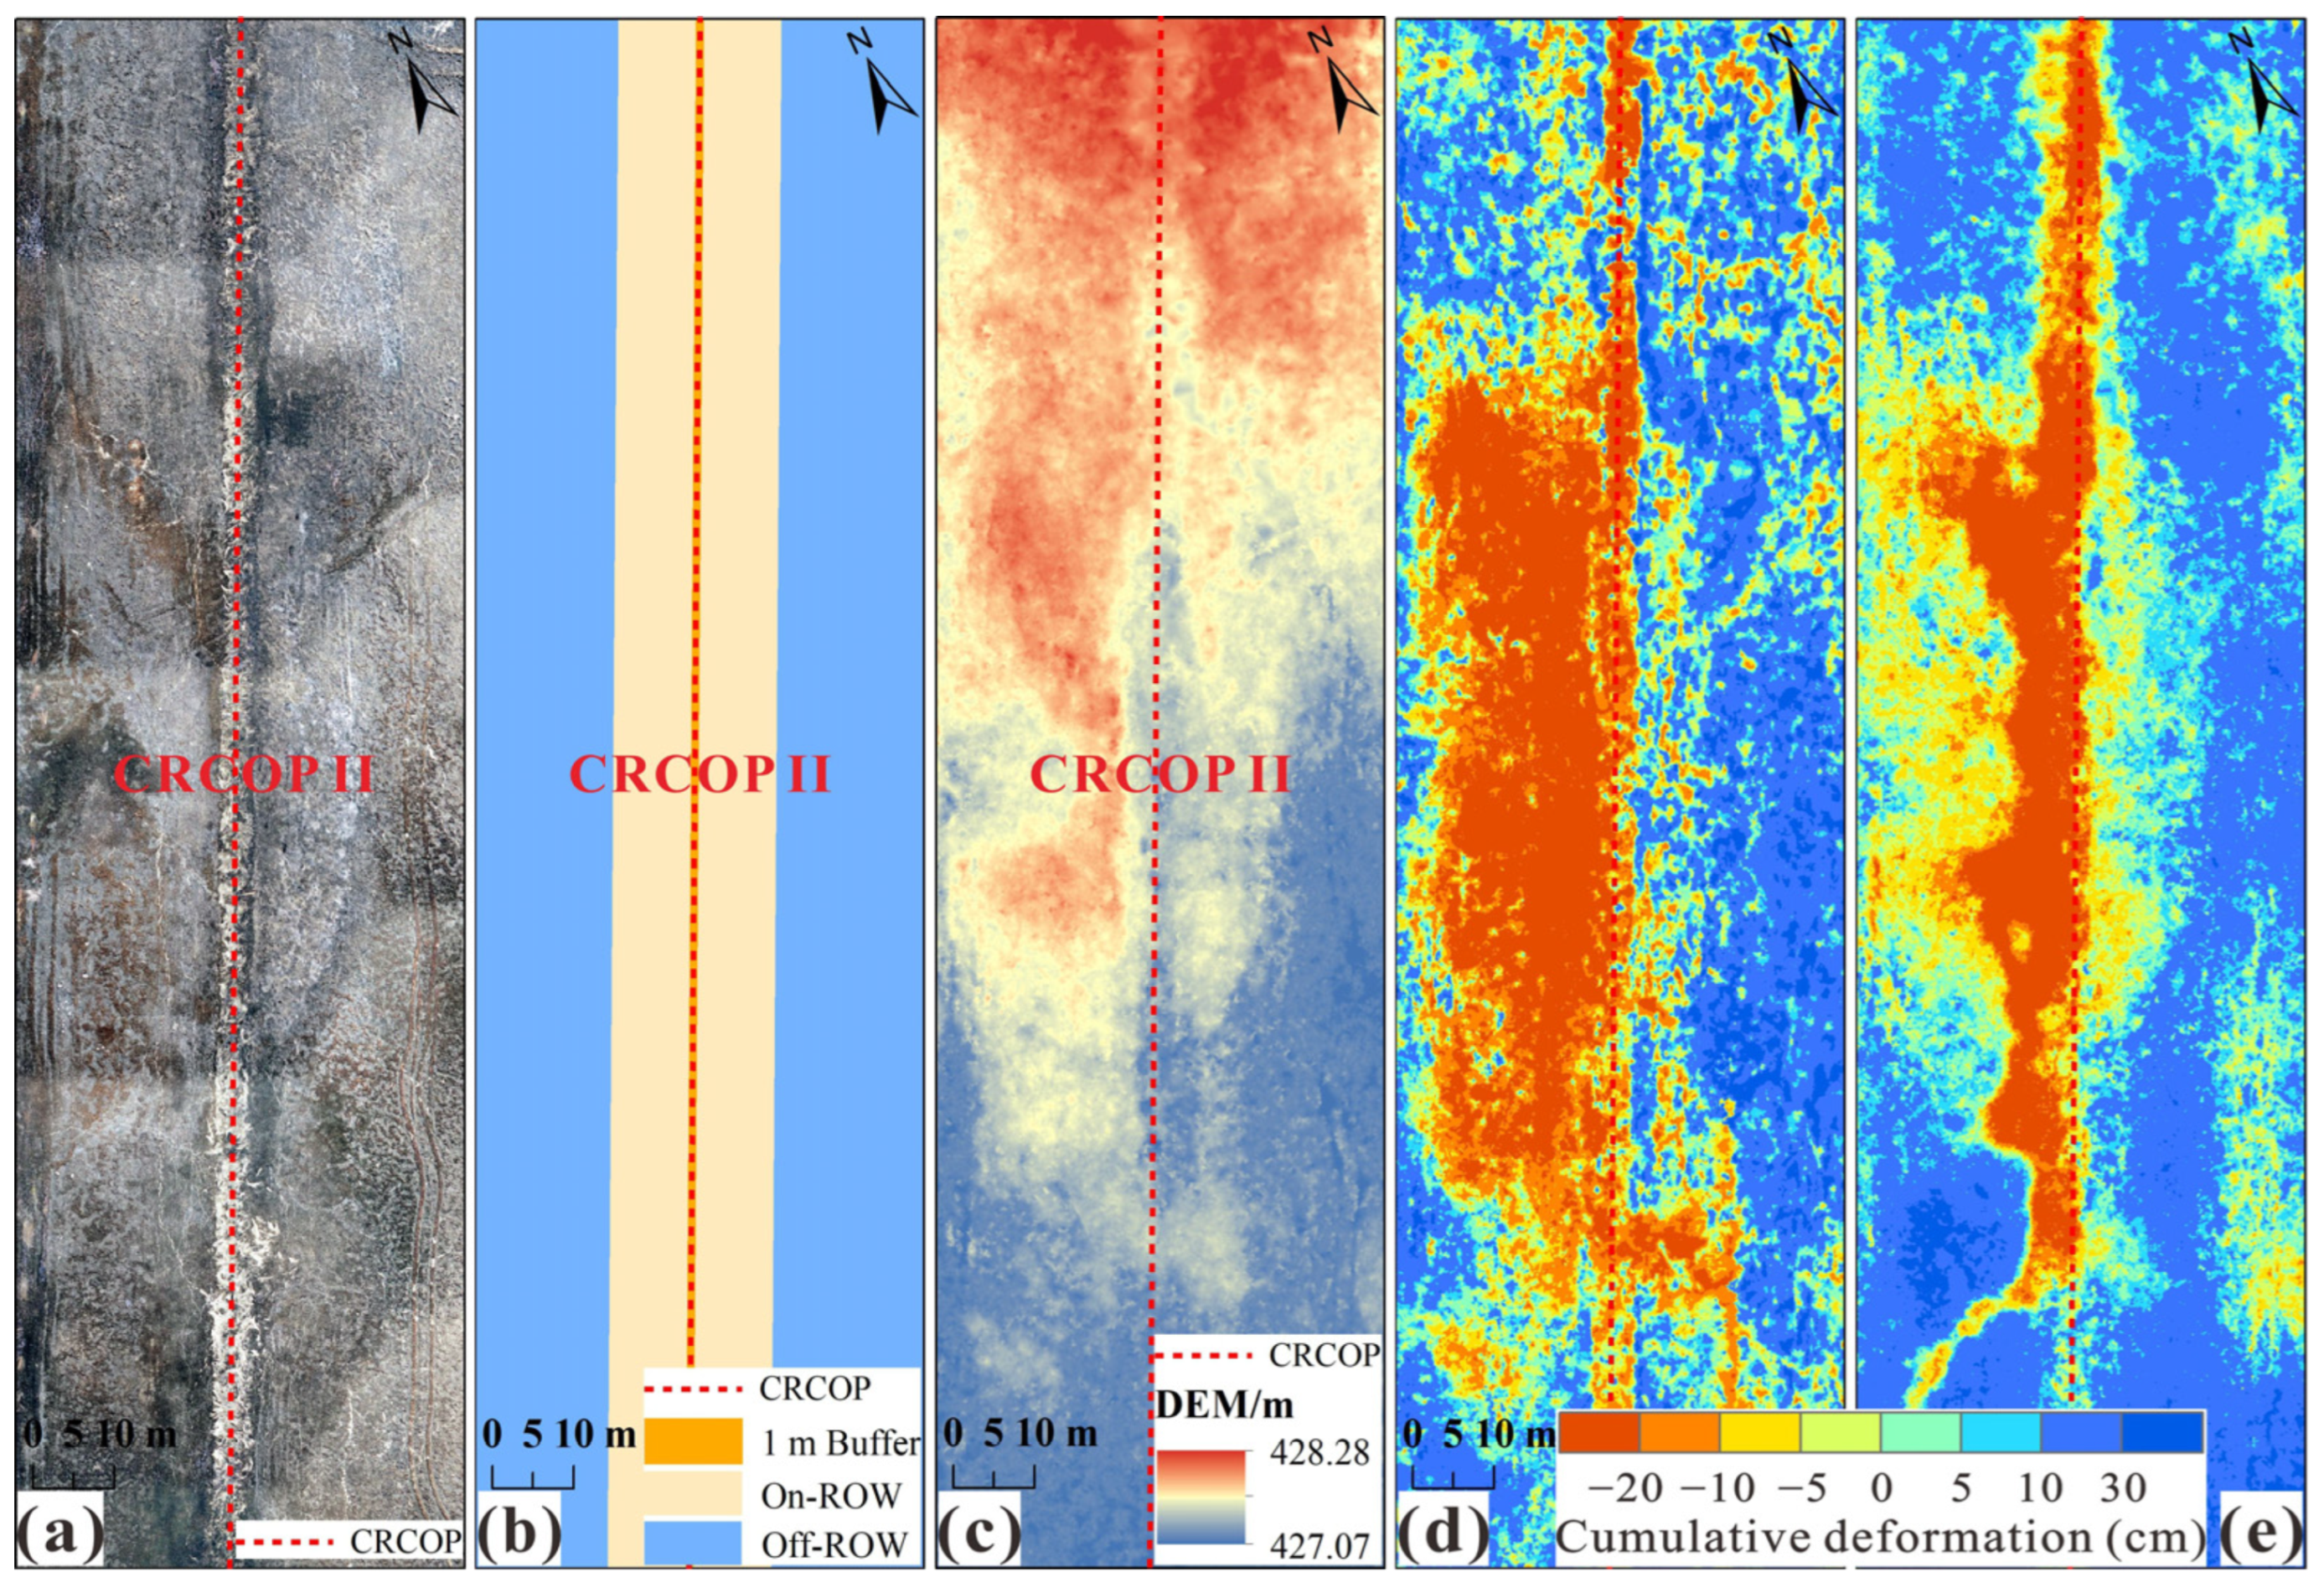
A representative 190 m × 55 m section at the MDS391 site along the CRCOP was selected to analyze the spatiotemporal evolution of surface subsidence above the pipeline using UAV surveys acquired on 8 May 2022, 7 October 2022, and 10 May 2023 (Figure 7). The DOM was used to delineate the pipeline alignment and trench location. Taking the DEM acquired on 8 May 2022 as the reference surface, Figure 7d and Figure 7e show the cumulative deformation by 7 October 2022 and 10 May 2023, respectively; positive values indicate surface uplift, whereas negative values indicate subsidence.
The DoD results revealed a distinct spatial pattern of subsidence directly above the pipeline and uplift on both sides. From May to October 2022, the mean cumulative deformation within the pipeline right-of-way (ROW; 10 m on either side of the pipeline) was −6.1 cm, compared with +4.9 cm outside the ROW. Within 1 m of the pipeline centerline, the mean change reached −15.3 cm, compared to +1.2 cm outside this zone. By 10 May 2023, the corresponding values were −3.8 cm within the ROW and +9.8 cm outside it. Within the 1 m buffer of the pipeline, cumulative deformation averaged −15.1 cm, compared with a mean uplift of +5.2 cm elsewhere. Depressions formed by trench settlement readily accumulate snowmelt and rainfall, potentially intensifying local thermal erosion and hydrothermal disturbance, thereby favoring the development of secondary periglacial hazards along the pipeline corridor.

4.2.2. Thermokarst Ponding

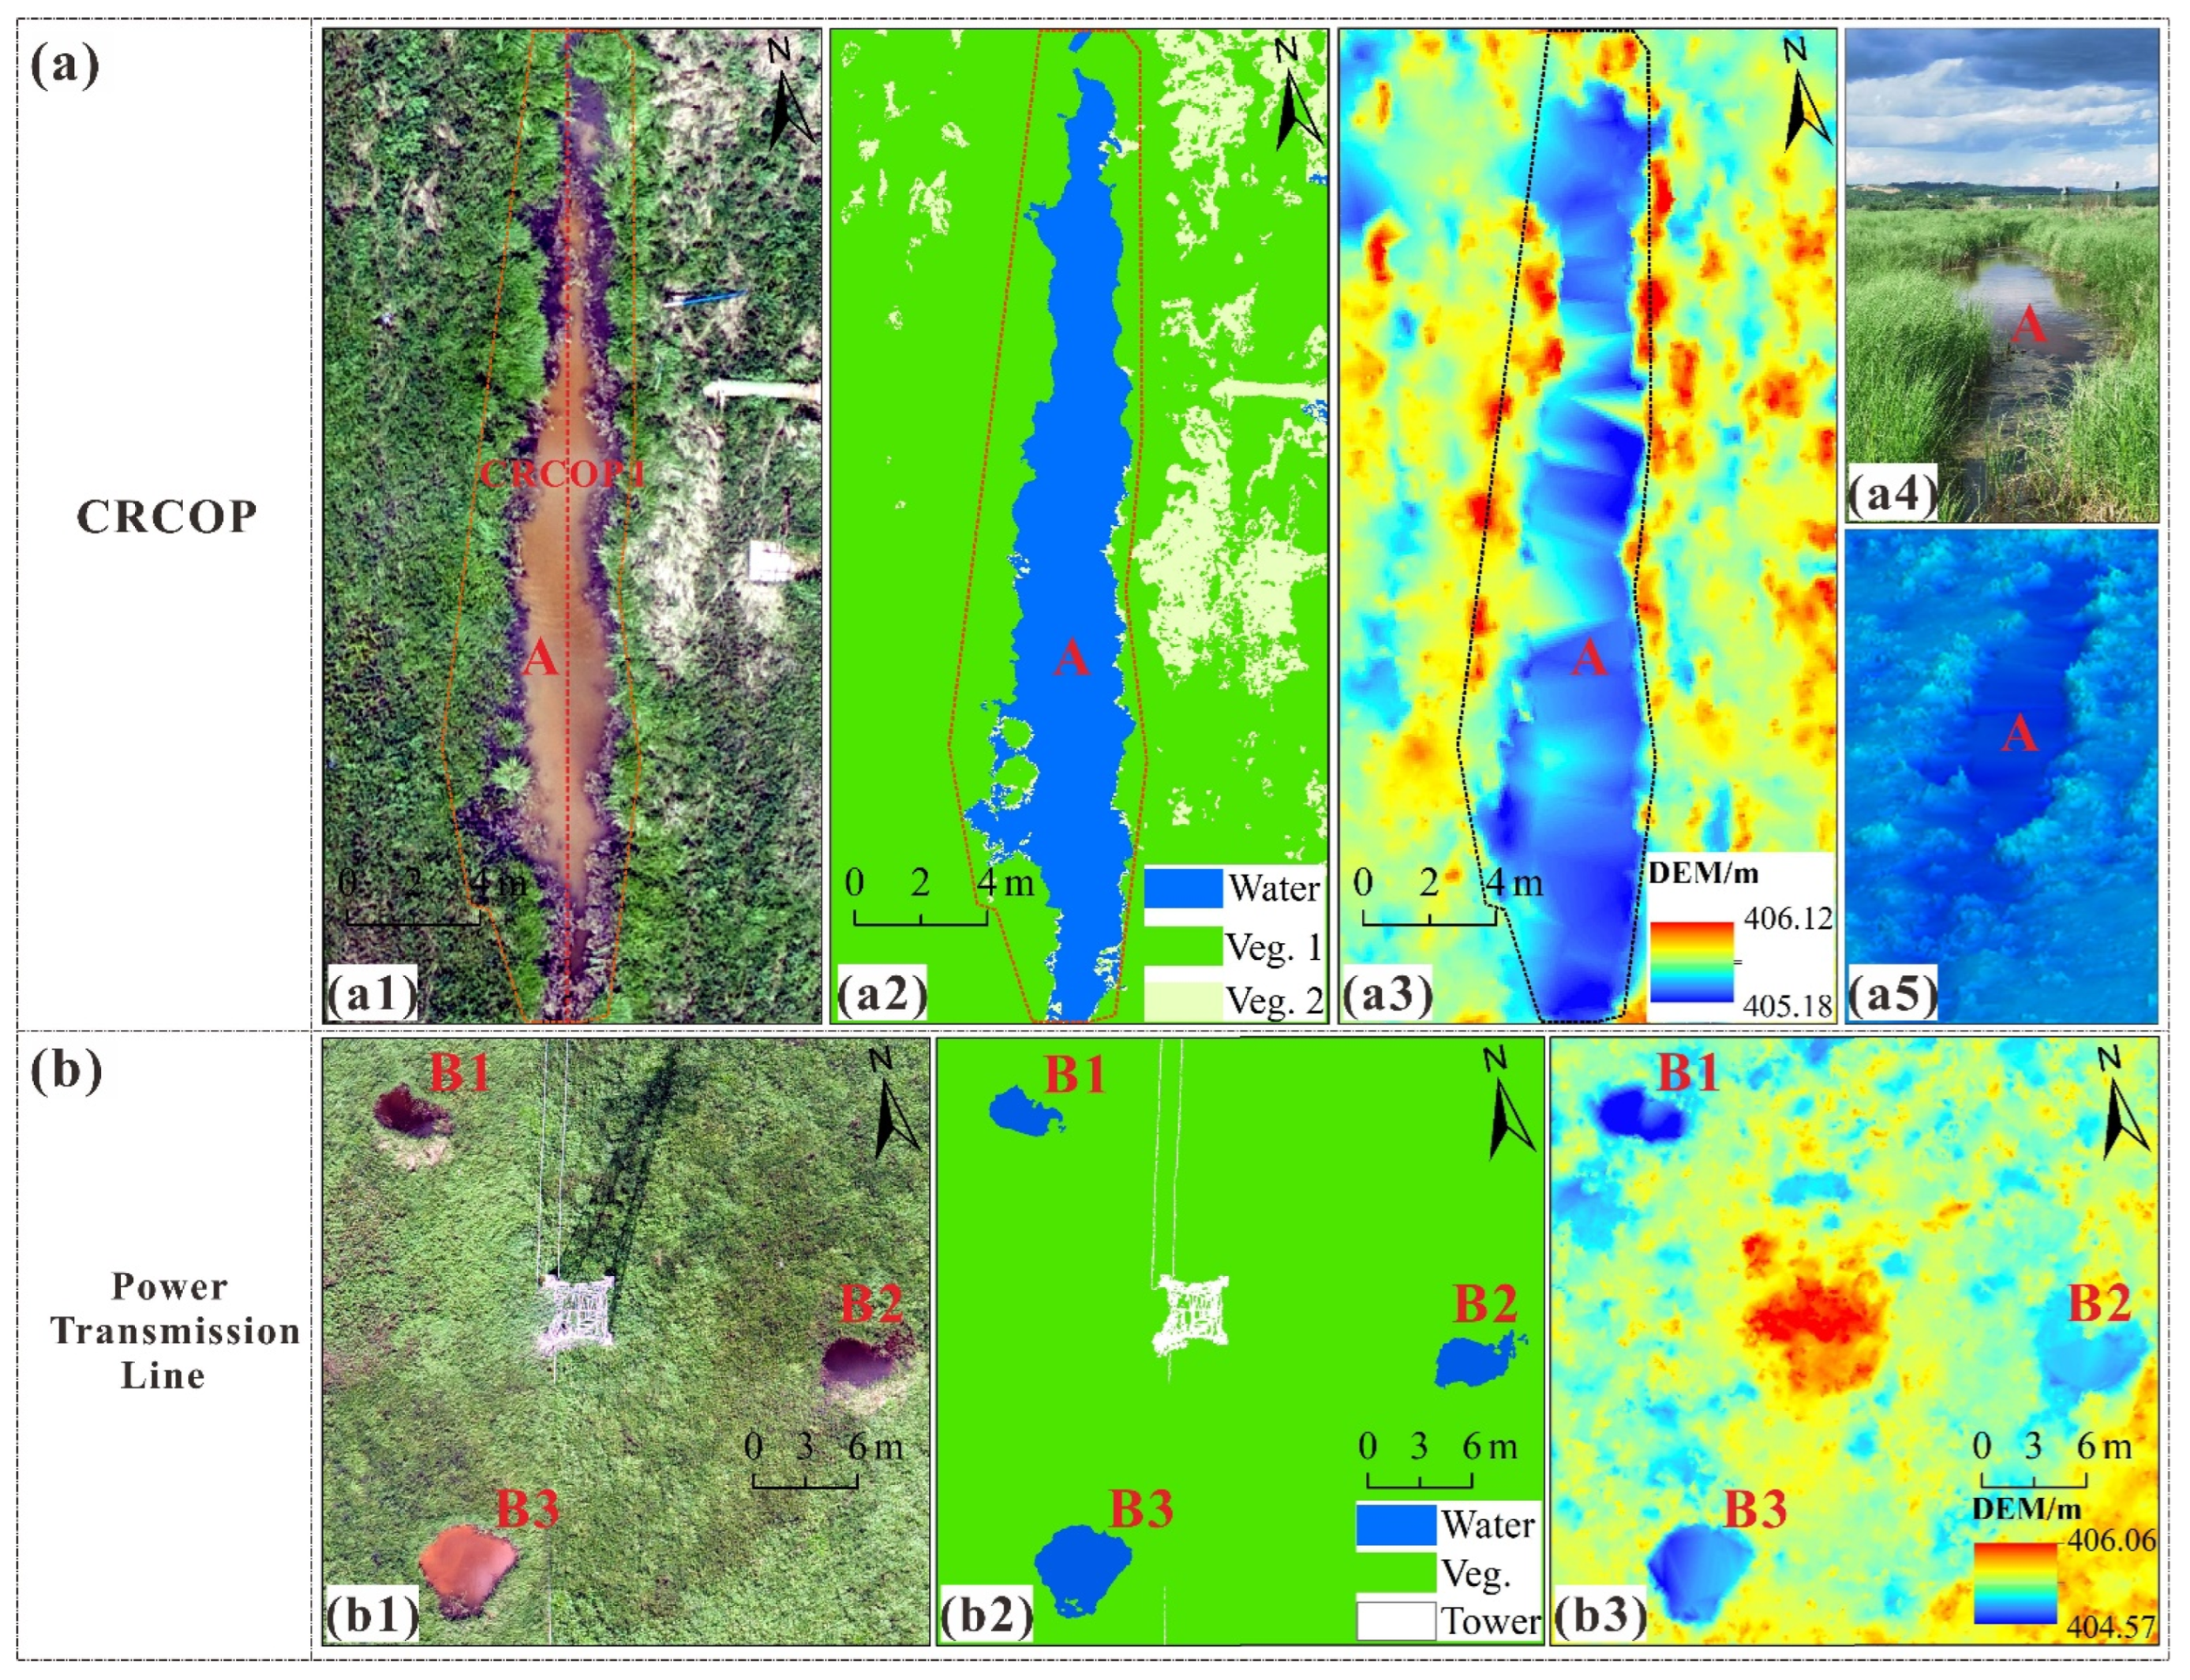
Based on UAV data acquired on 22 June 2022, thermokarst ponding features at the MDS364 site along the CRCOP and near Tower #117 of the JXPT line were identified and extracted (Figure 8). The DOM was used to delineate water boundaries, characterize surrounding land cover, and determine the spatial relationship between ponding and engineering structures, whereas the DEM was used to characterize local depressions and estimate water depth.
At MDS364, a representative 30 m × 15 m area was selected (Figure 8(a1)), and the ponding distribution was extracted using an SVM classifier (Figure 8(a2)). Ponding A was concentrated within approximately 2 m of the pipeline centerline and exhibited an elongated distribution parallel to the pipeline. It was approximately 28.7 m long and 0.3–4.5 m wide, with an area of 70.98 m2. DEM-based analysis (Figure 8(a3)) yielded estimated water depths of 12–46 cm (Figure 8(a5)), lower than the field-measured maximum of 67 cm. This underestimation was likely caused by suspended matter in the turbid water, which attenuated laser penetration and resulted in overestimated bed elevations. Three thermokarst ponds, B1–B3, were identified around Tower #117 (Figure 8b). Their areas were 7.1, 10.0, and 19.3 m2, with estimated water depths of 43, 37, and 64 cm, respectively. Their distances from the center of the tower foundation were 12.8, 14.3, and 13.5 m, respectively. These ponds were irregularly shaped and scattered in low-lying zones southeast of the tower base.

4.2.3. Secondary Icing

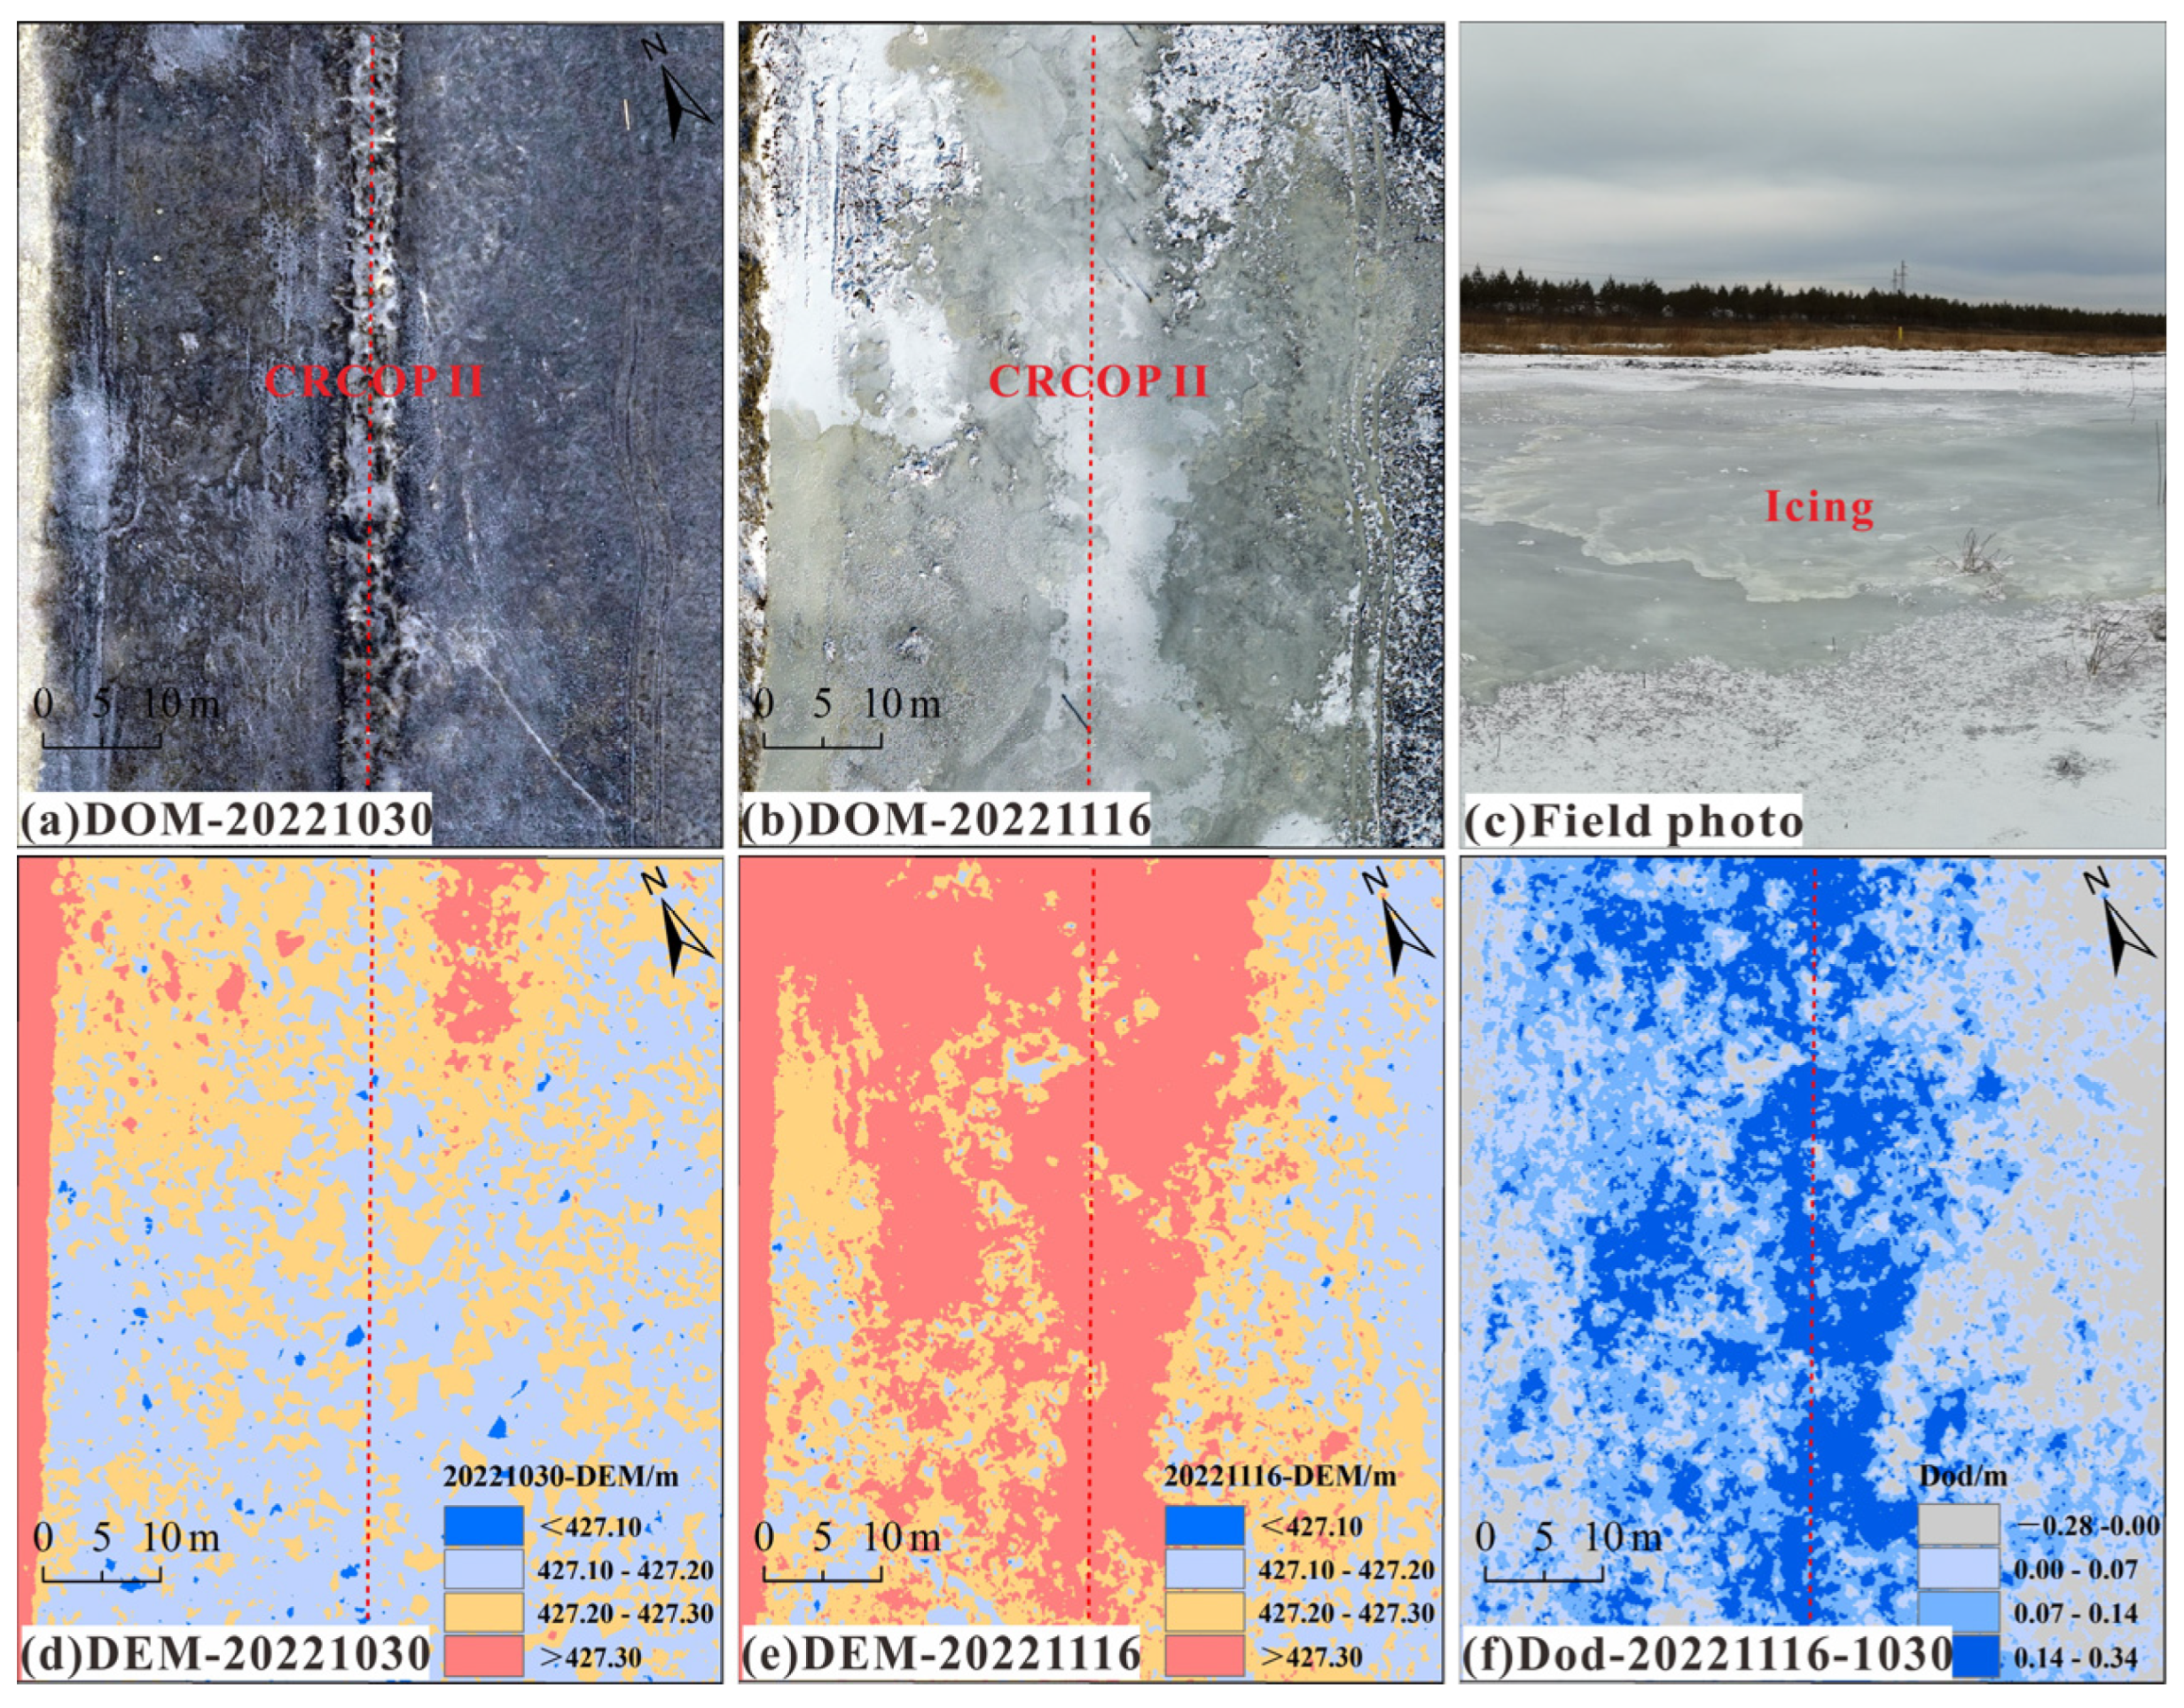
A representative area at the MDS391 site along the CRCOP was selected to monitor icing development directly above the pipeline using UAV data acquired on 30 October and 16 November 2022 (Figure 9).
Comparison of the two DOMs (Figure 9a,b) showed that only a thin ice layer was present on 30 October, with no significant icing features. By 16 November, a well-developed, clearly bounded, belt-shaped icing had formed above the pipeline, reaching a maximum transverse extent of 58.3 m. This rapid change indicates the expansion of icing from localized thin-ice patches into a laterally connected formation. The DEMs further quantified the associated surface-elevation changes (Figure 9d,e). The ground surface above the pipeline was relatively smooth on 30 October, whereas by 16 November a continuous elevated zone had developed along the pipeline centerline, closely corresponding to the icing extent delineated from the DOM. The DoD results (Figure 9f) indicated ground surface uplift of 0.07−0.34 m and a cumulative positive elevation-change volume of approximately 340.36 m3. After applying the LoD95 threshold (Section 3.3) to exclude elevation changes within the DoD uncertainty range, the detectable icing-associated positive elevation-change volume was estimated as 241.15 m3. The propagated volumetric uncertainty was ±0.20 m3. Because partial snow cover was present on 16 November, its potential contribution to the measured elevation increase is evaluated further in the Discussion.

5. Discussion

5.1. Accuracy and Applicability of UAV-LiDAR Measurements

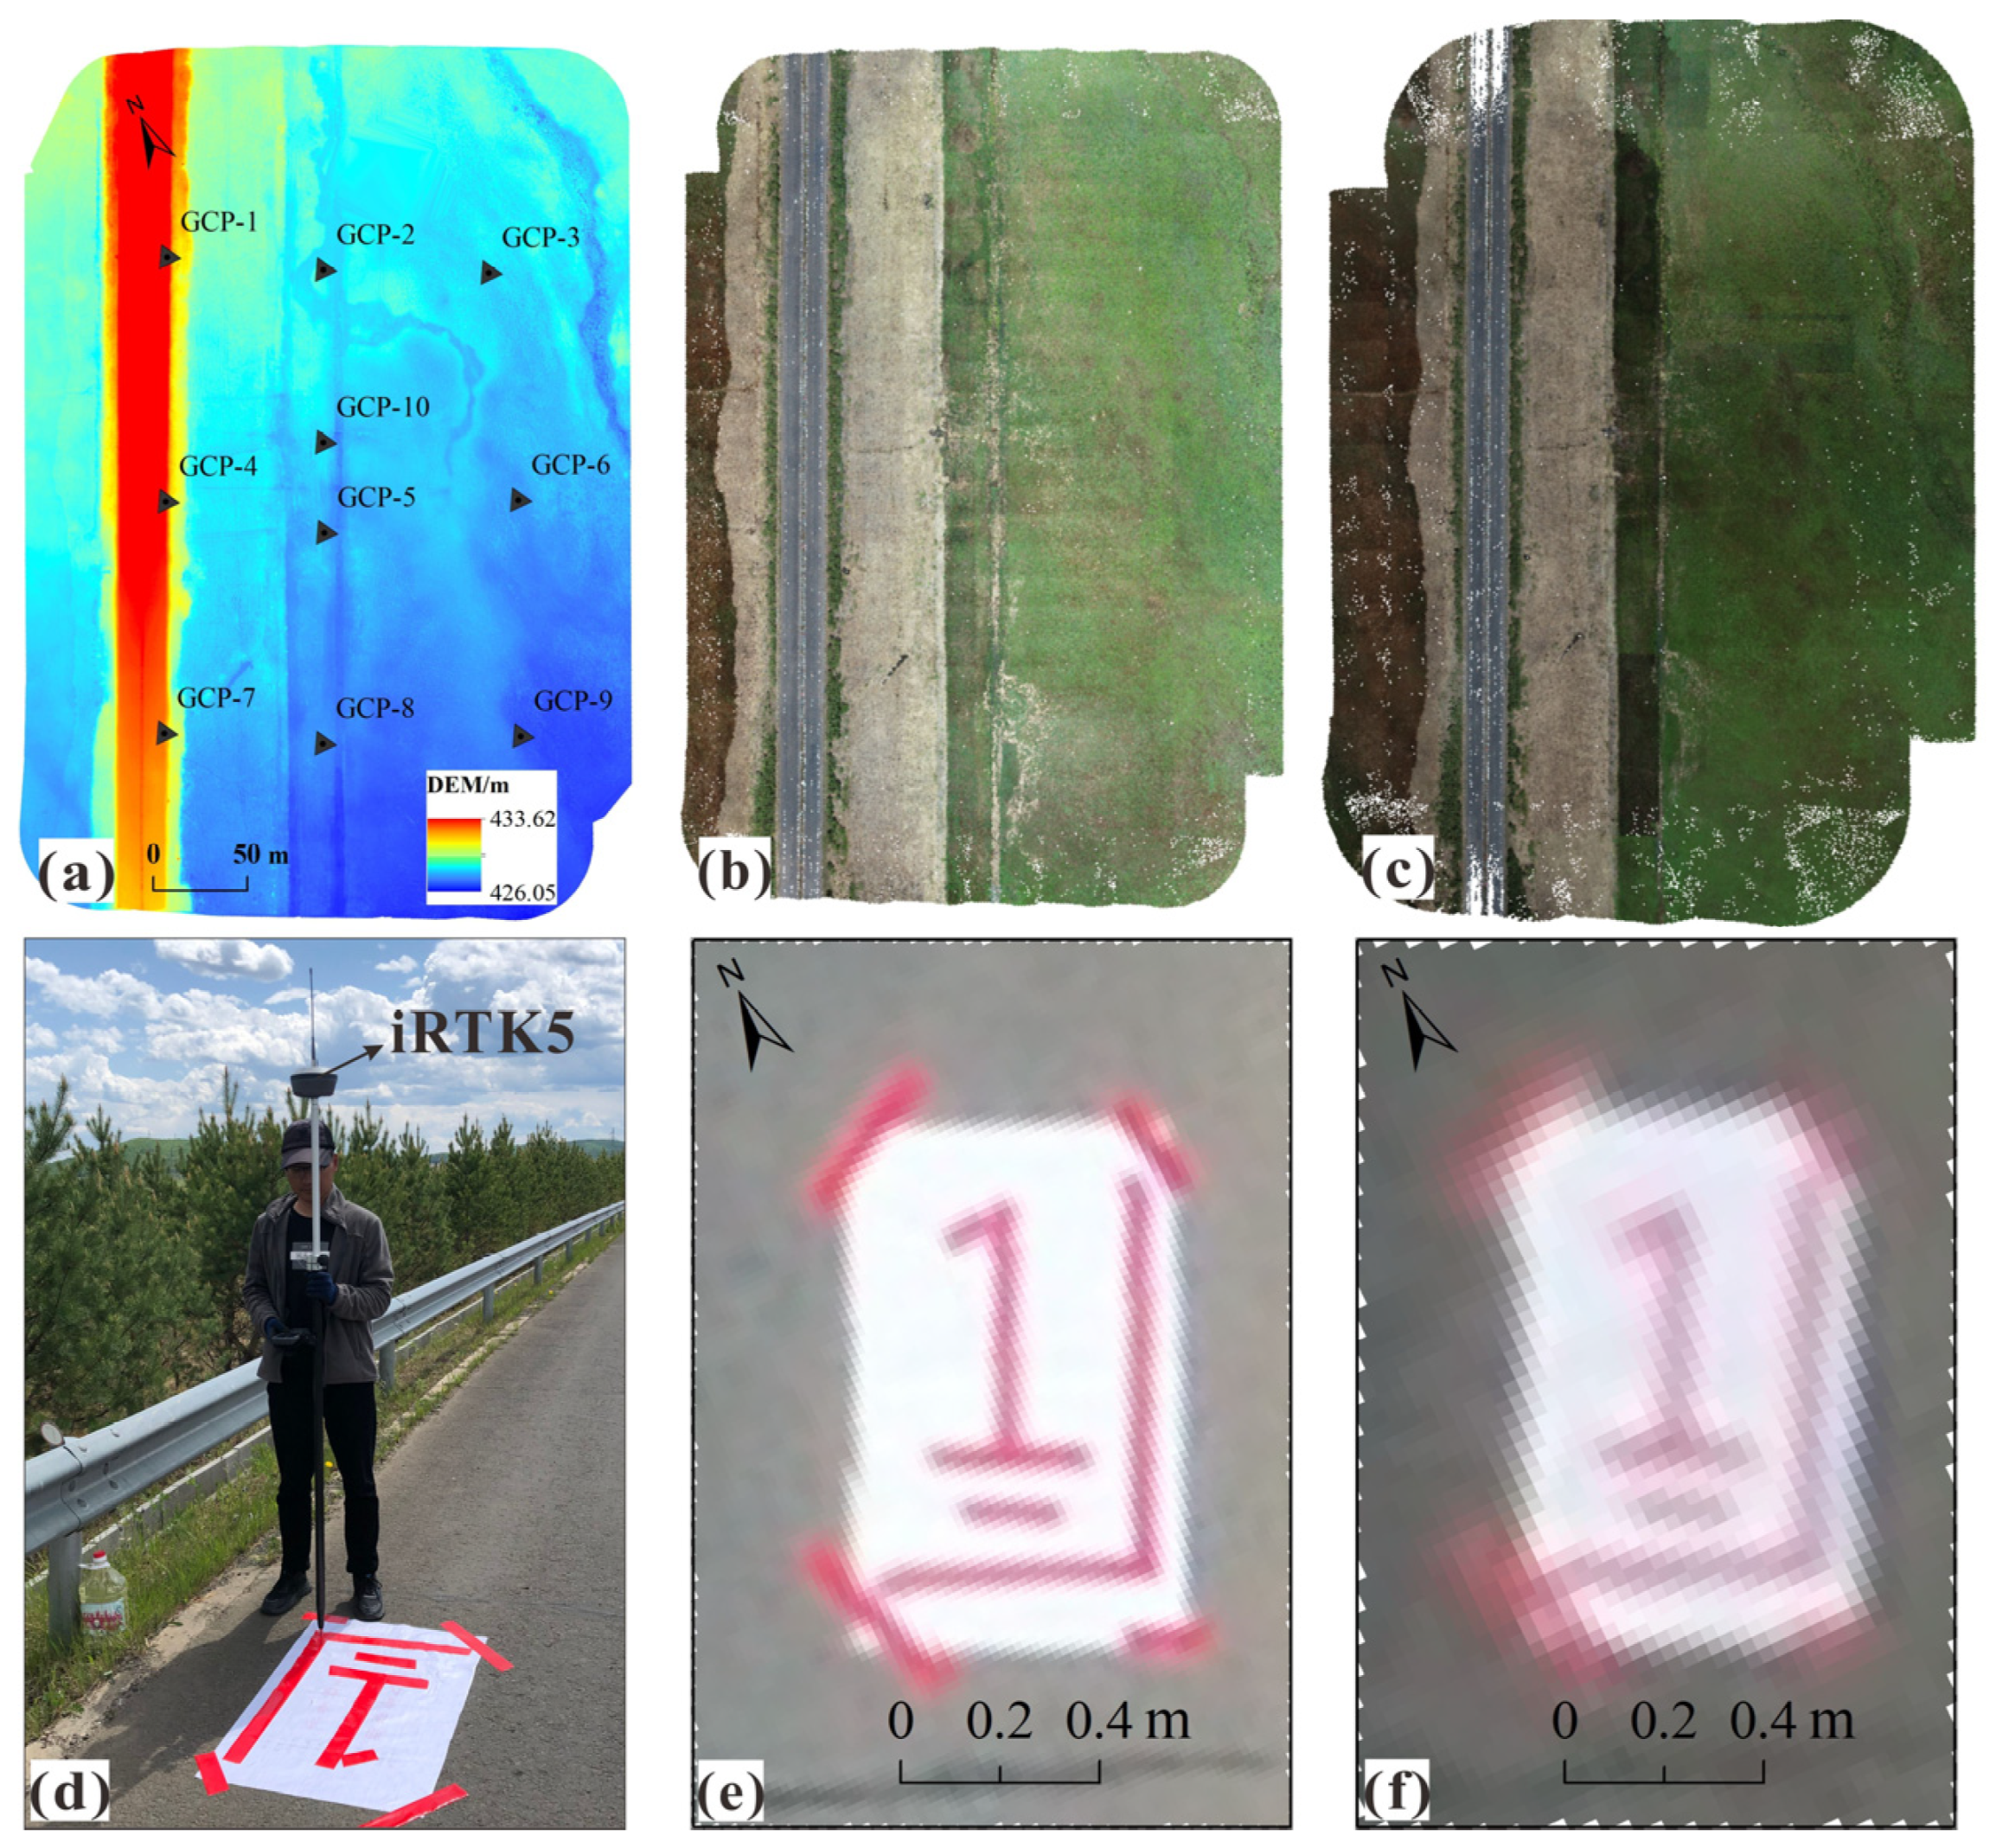
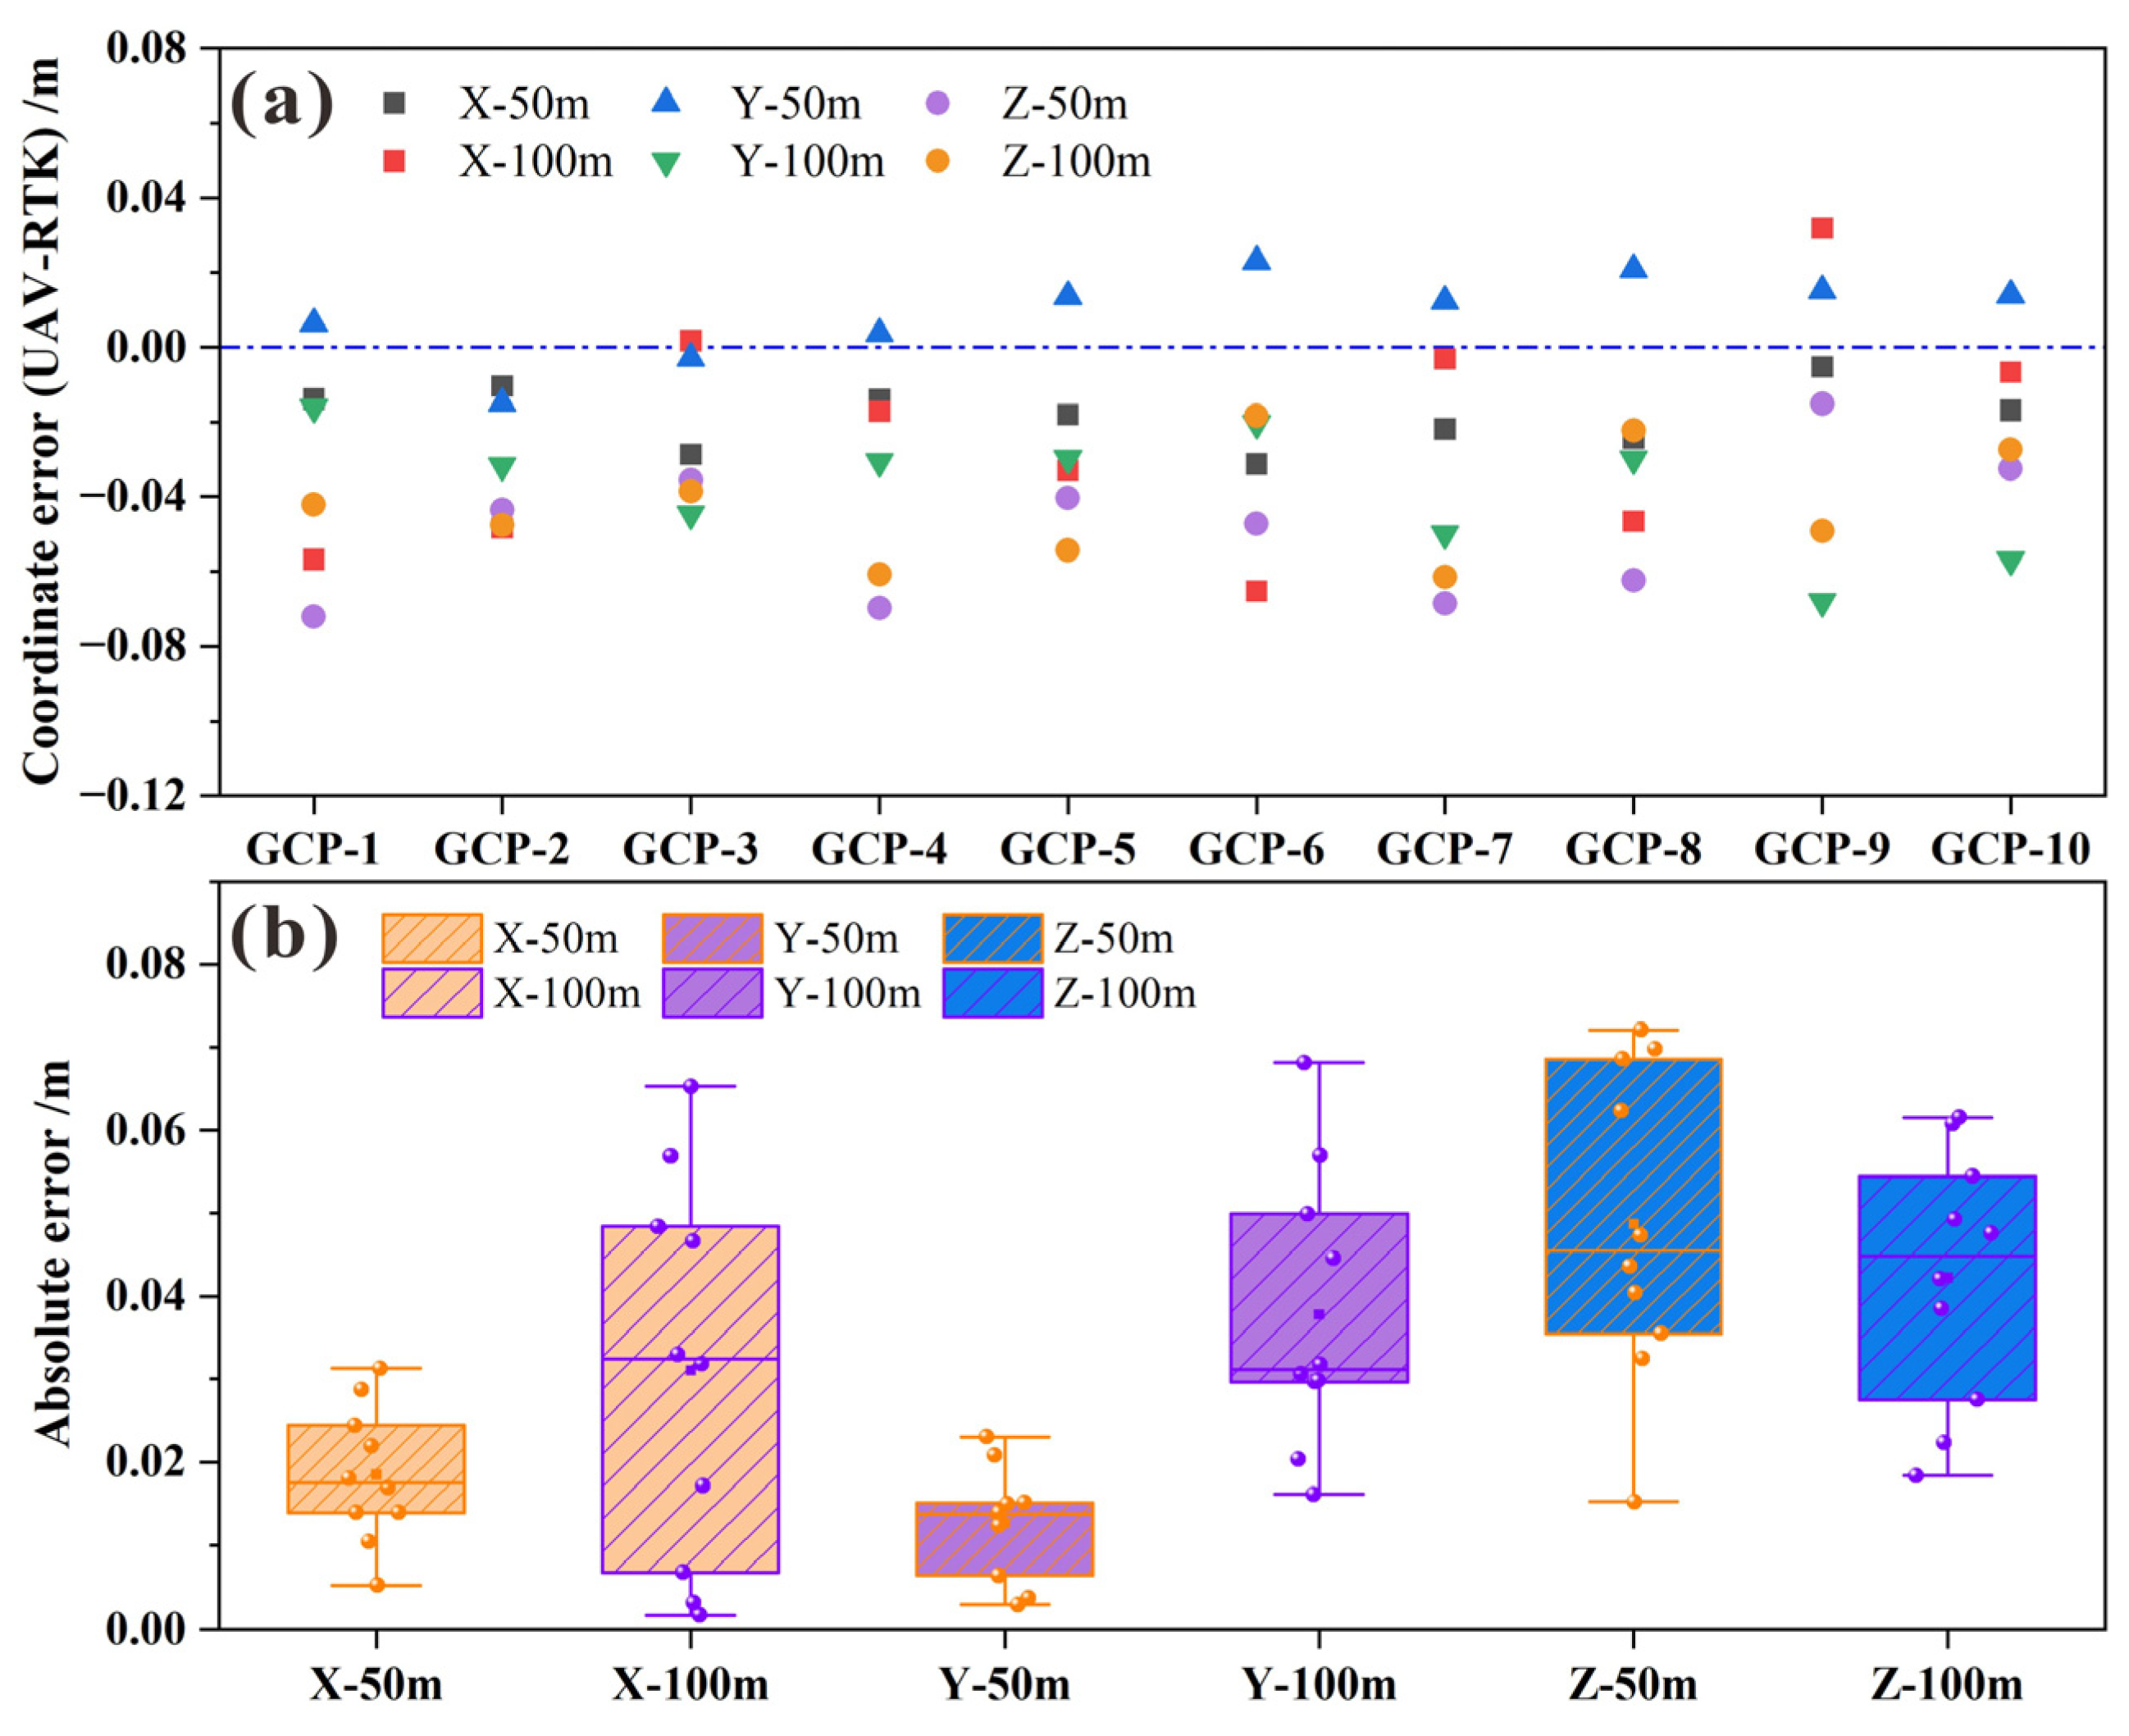
UAV-LiDAR measurement accuracy underpins reliable distress detection and multidimensional parameter extraction. Surveys were conducted at flight altitudes of 50 and 100 m, with consistent flight parameters maintained during repeated acquisitions. Ground measurements at control points were compared with UAV-derived coordinates (Figure 10) to evaluate positional errors at the two flight altitudes (Figure 11).
Except for the Y coordinate at 50 m, UAV-derived coordinates were generally lower than the corresponding RTK measurements (Figure 11a). At 50 m altitude, the root mean square errors (RMSEs) in the X, Y, and Z directions were 1.73, 1.31, and 5.19 cm, respectively, with an overall RMSE of 3.25 cm (Figure 11b). At 100 m altitude, the corresponding RMSEs were 3.80, 4.09, and 4.47 cm, with an overall RMSE of 4.13 cm (Figure 11b). Positional errors at both altitudes remained at the centimeter scale, satisfying the accuracy requirements for identifying typical engineering distresses in permafrost regions. Flight altitude directly affected point-cloud density, ground sampling distance, and target-detection capability. At MDS391, the point-cloud densities were 878 and 217 points/m2 at 50 and 100 m, respectively, while the corresponding ground sampling distances were 1.50 and 2.87 cm/pixel. The denser point cloud acquired at 50 m enhanced the representation of subtle surface morphology and was better suited to the detailed reconstruction of small, low-relief, or poorly defined targets. In contrast, surveys at 100 m provided greater spatial coverage and higher operational efficiency, making them suitable for rapid detection of larger features such as subsidence zones, slope failures, and icing areas.
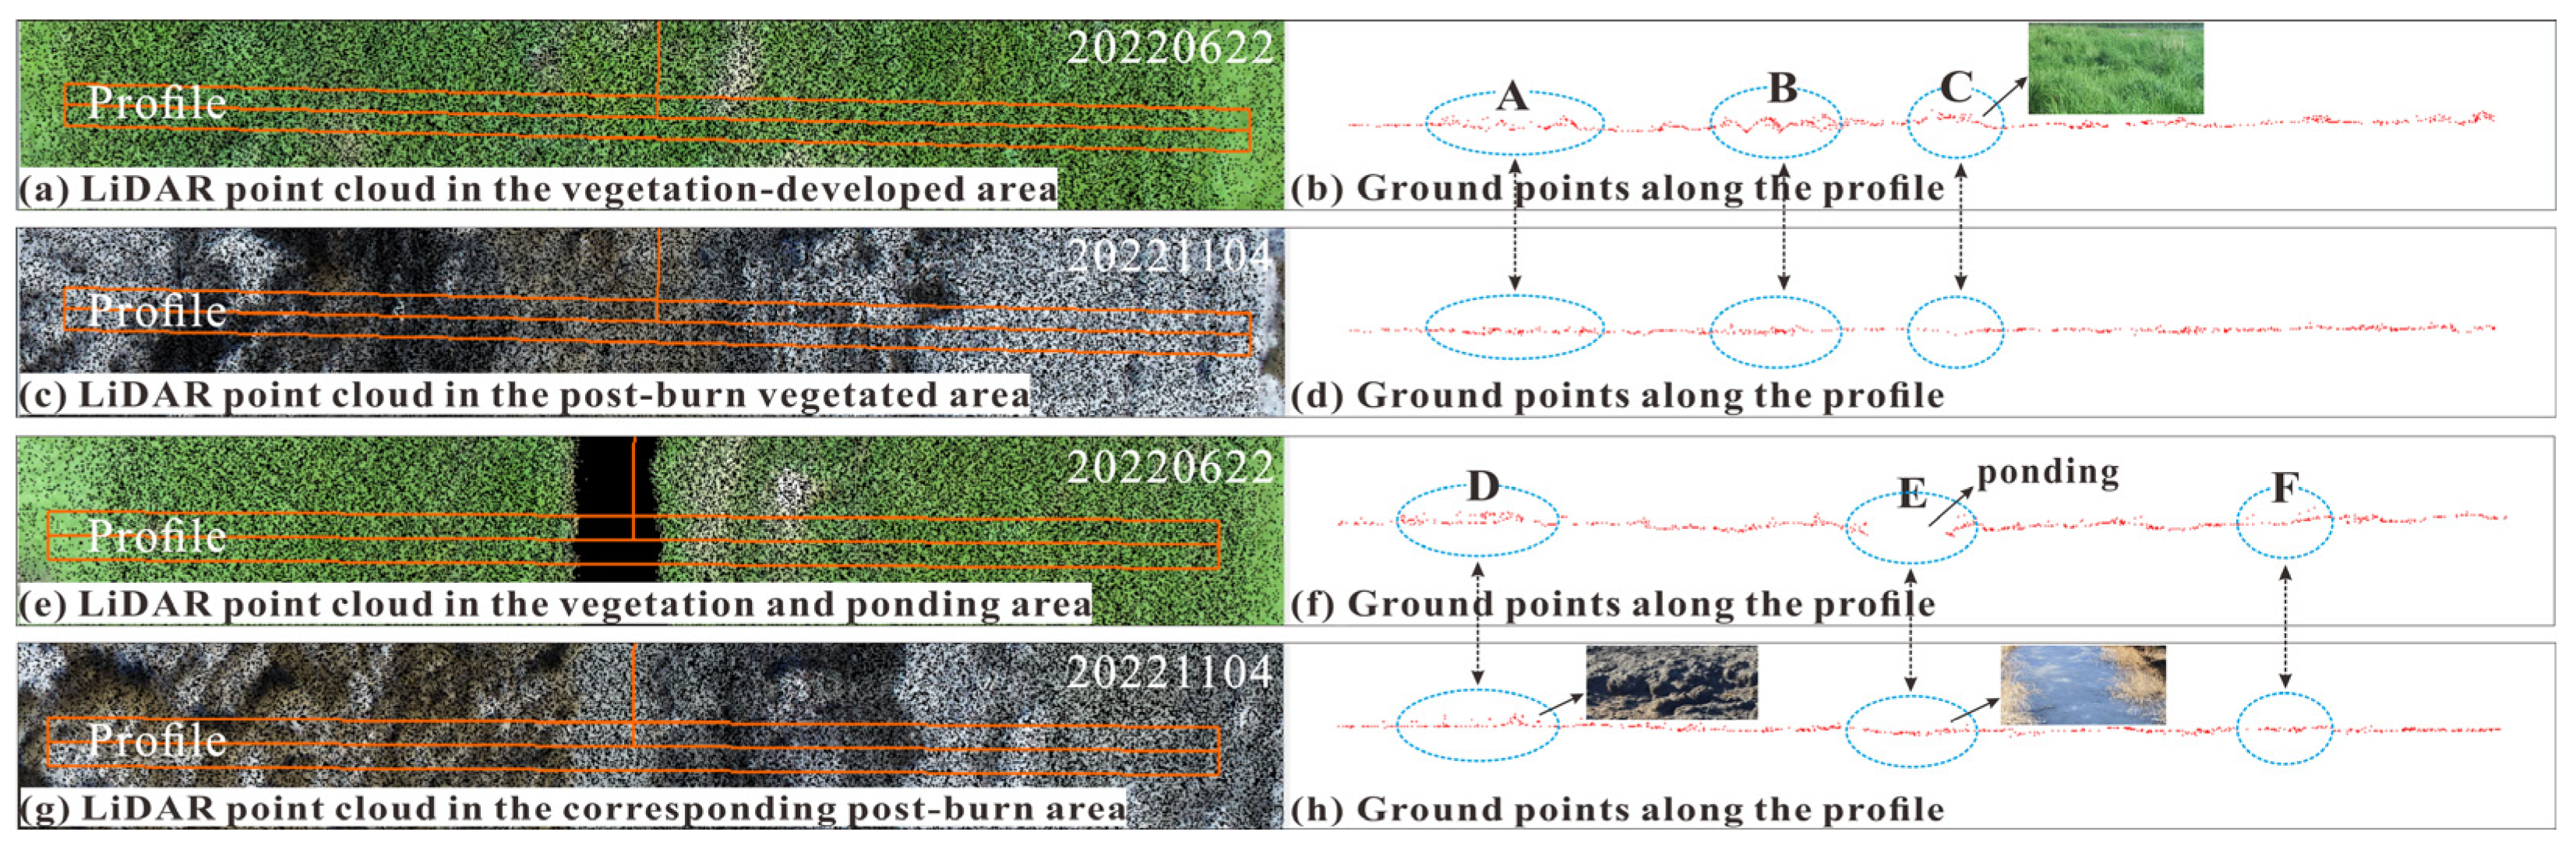
Vegetation and ponding are the principal surface factors affecting ground-point extraction (Figure 12). Before the burn event on 22 June 2022, point clouds in areas A, B, C, and F exhibited localized bulging, scattering, and discontinuities (Figure 12b,f). After the burn event on 4 November 2022, the corresponding point clouds became substantially smoother (Figure 12d,h). This contrast indicates that dense tussock vegetation limits laser penetration to the actual ground surface, causing returns to originate primarily from the vegetation canopy and thereby producing overestimated ground elevations and errors in microtopographic reconstruction. Increasing the number of ground-control points and conducting repeated surveys may help reduce such errors [53]. The residual relief in area D after burning primarily represented the actual morphology of remaining tussock hummocks rather than point-cloud classification errors (Figure 12h). Ponding in area E reduced laser penetration through absorption and scattering, resulting in underestimation of water depth, as discussed in Section 4.2.2. After freezing, the ice surface formed a stable reflecting interface (Figure 12f,h), such that the retrieved elevation represented the ice surface rather than the underlying ground. These effects should be constrained using multi-temporal point clouds, land-cover masking (NDVI/NDWI), RTK measurements, and field-measured water depths [54], thereby reducing elevation overestimation and weak-return data gaps under complex surface-cover conditions.

5.2. Applicability of the Synergistic Optical–LiDAR Framework

Engineering distresses in permafrost regions exhibit heterogeneous remote-sensing signatures, and the optimal data source varies among target types. Therefore, the proposed framework adopts a target-driven strategy by selecting optical imagery, LiDAR-derived products, or their integration according to the dominant observable characteristics of each distress.
Low-relief targets, such as pavement cracks, are primarily identified from DOM texture because their vertical expressions are limited in LiDAR-derived products. For deformation-dominated targets, LiDAR-derived elevation information provides the primary quantitative basis, whereas optical imagery supports anomaly localization and boundary interpretation. For differential shoulder settlement, the DOM enabled spatial localization, while DEM profiles quantified a maximum shoulder elevation difference of 58.28 cm (Section 4.1.1(b)). Features with pronounced three-dimensional morphology, such as slumps and icing, were characterized through the integration of DOM-based boundary delineation and DEM/DSM-based morphometric analysis. Tower inclination was extracted from three-dimensional structural geometry, where LiDAR reduced reconstruction gaps associated with slender components and structural occlusion.
To further demonstrate the contribution of different data sources, a target-oriented comparison among DOM-only, LiDAR-only, and optical–LiDAR processing was conducted using representative cases from this study (Table 3).
The comparison highlights that the benefit of optical–LiDAR integration is target dependent. DOMs provide sufficient information for texture-dominated targets, whereas LiDAR-derived elevation is essential for deformation-related measurements. For targets requiring both boundary delineation and three-dimensional characterization, optical and LiDAR observations provide complementary information.
Tower #15 was further used as a representative structural target to quantitatively evaluate the reliability of the integrated framework. Inclination angles calculated from field measurements were 1.87° and 4.23° in the north–south and east–west directions, respectively, while the optical–LiDAR-derived values were 1.8° and 3.9°. The corresponding absolute errors were 0.07° and 0.33°, with relative errors of 3.74% and 7.80%, respectively. These results confirm the capability of the framework for extracting three-dimensional structural deformation parameters.
Overall, the complementary use of optical imagery and UAV-LiDAR enables heterogeneous distress types to be characterized within a unified workflow while preserving the data source most suitable for each target. Unlike conventional RGB–LiDAR integration mainly used for mapping or object recognition, the proposed framework assigns target-specific roles to complementary data sources, enabling unified quantitative assessment of diverse engineering distresses and secondary periglacial hazards. The framework is most applicable to relatively open engineering corridors where target boundaries are distinguishable and microtopographic changes can be resolved from DEMs or DSMs. In areas affected by dense vegetation, turbid water, complex snow and ice cover, or severe structural occlusion, field surveys, RTK measurements, multi-temporal datasets, and land-cover masks remain necessary to refine target delineation, improve ground-point classification, validate DoD-derived changes, and reduce interpretation uncertainty.

5.3. UAV-LiDAR Monitoring Under Snow Cover: Potential and Uncertainties

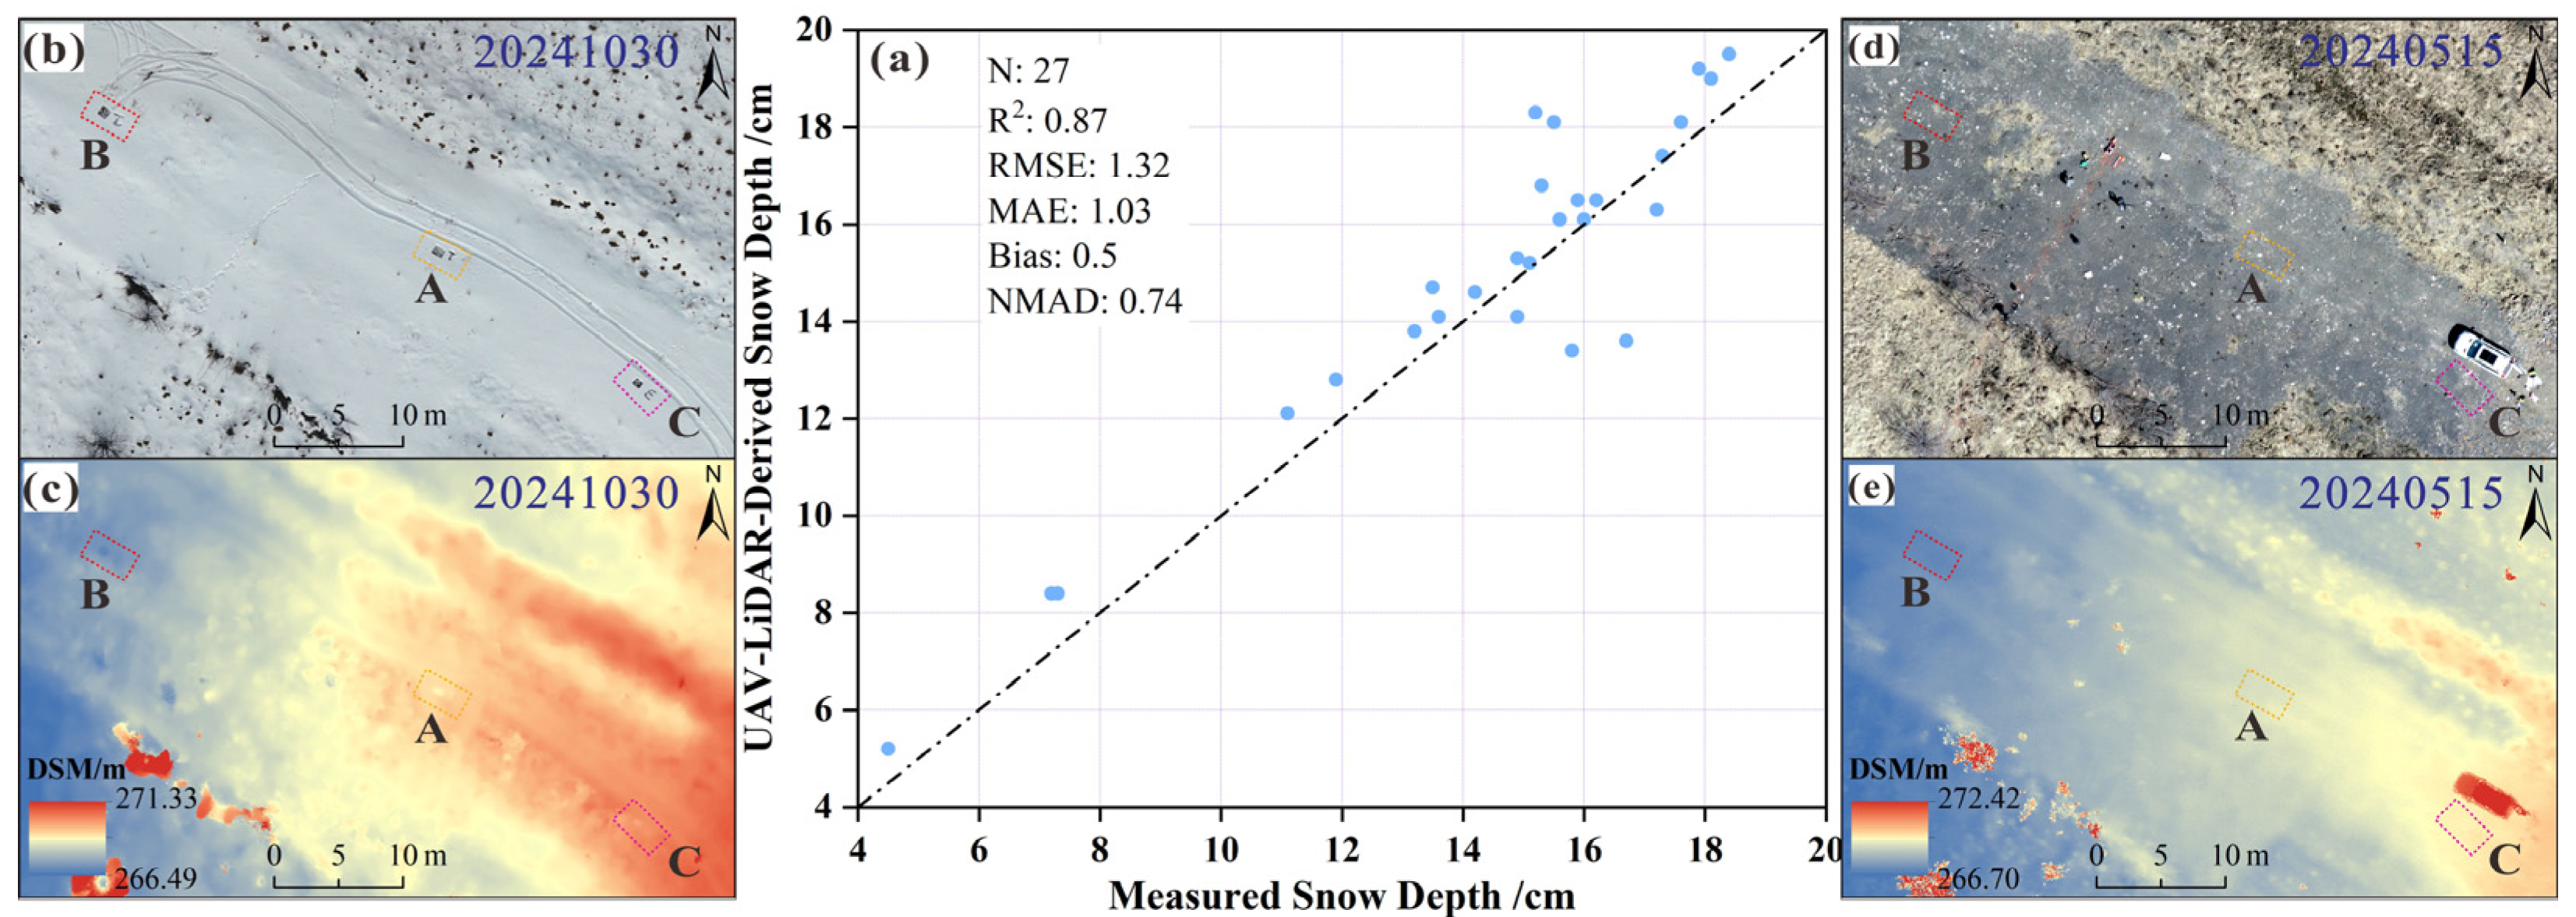
Snow cover substantially reduces the ability of optical imagery to resolve surface details because cracks, ponding boundaries, and microtopographic anomalies may be obscured. This limits the use of DOMs alone for monitoring freeze–thaw hazards. To assess UAV-LiDAR performance under snow-covered conditions, DSMs acquired on 30 October 2024 (snow-covered) and on 15 May 2024 (snow-free) were differenced and validated against in situ snow-depth measurements at 27 locations (Figure 13). The LiDAR-derived snow depths agreed well with field measurements (R2 = 0.87, RMSE = 1.32 cm), confirming the feasibility of UAV-LiDAR-based snow-depth retrieval. However, retrieval accuracy may be affected by the quality of the snow-free reference surface, vegetation occlusion, multi-temporal registration errors, and variations in snow-surface reflectance [33,40,55,56].
Snow-depth estimates also provide an important basis for interpreting DoD-derived elevation changes. In the secondary icing case (Section 4.2.3), localized elevation increases did not necessarily represent actual ground-surface deformation, but may have included contributions from ice accumulation, snow cover, and frost heave. Reliable interpretation therefore requires joint assessment using DOMs, field photographs, measured snow depths, and error estimates from stable reference areas [49,57,58]. These results indicate that UAV-LiDAR can extend the effective monitoring period beyond the snow-free season to the freezing period, enabling continued observation of icing development, frost-heave deformation, and engineering distresses before spring thaw. The approach is most suitable for open, low-vegetation corridors such as highways, railways, and pipelines. In shrub-covered or forested areas, or where wind-driven snow redistribution and surface roughness are pronounced, ground-based snow-depth measurements, meteorological observations, and multi-temporal LiDAR data remain necessary to reduce uncertainty in DoD interpretation.
The uncertainty assessment further provides a quantitative basis for interpreting UAV-LiDAR-derived surface changes under complex cold-region conditions. The LoD95 threshold distinguishes detectable elevation changes from those potentially associated with measurement uncertainty, whereas the propagated volumetric uncertainties constrain the uncertainty bounds of volume-based hazard estimates. In this study, the identified slump, icing-associated surface changes, and pavement settlement exceeded the corresponding detection limits, supporting the reliability of the quantified deformation and volume changes. However, the calculated volumetric uncertainties mainly represent the contribution of DEM vertical errors based on error propagation. Additional uncertainties associated with reference-surface reconstruction, multi-temporal co-registration, and snow/ice effects may influence the final interpretation, particularly for small-scale changes approaching the detection threshold.

5.4. Engineering Applications and Regional Applicability

The synergistic optical–LiDAR framework developed in this study extends conventional point-based inspections toward spatially continuous corridor-scale assessment, enabling multidimensional characterization of engineering distresses and secondary periglacial hazards. By converting heterogeneous surface responses into quantitative indicators, including deformation magnitude, structural inclination, and volume changes, the framework provides a potential basis for infrastructure condition assessment, vulnerable-section screening, and risk-informed infrastructure maintenance in permafrost regions.
Compared with the QTP, where engineering practices have mainly focused on thermal protection and adaptive design for relatively cold and extensive permafrost systems, the Xing’an–Baikal region represents a warmer and more discontinuous permafrost environment with stronger spatial variability. This difference highlights the need for high-resolution monitoring approaches capable of resolving localized engineering responses [59]. Similar remote sensing-based strategies have also been explored for infrastructure assessment in Arctic permafrost regions such as Alaska and Siberia [60,61]. However, application to different regions requires consideration of variations in permafrost thermal regimes, vegetation structures, snow conditions, and engineering environments [4].
From the perspective of structural health monitoring (SHM), UAV-based optical–LiDAR integration provides an intermediate observation scale between regional remote sensing and point-based field measurements. Satellite observations can characterize broad deformation trends, whereas ground-based instruments provide accurate measurements at specific locations but limited spatial coverage. The framework proposed here complements these approaches by providing spatially continuous information on deformation morphology, extent, structural geometry, and volume change. The quantitative indicators extracted in this study, including pavement deformation, structural inclination, slump volume, and icing-associated uplift, may support repeated condition assessment and vulnerability screening of linear infrastructure under changing permafrost conditions.

5.5. Methodological Limitations and Future Perspectives

Despite the advantages of the proposed optical–LiDAR framework, several methodological limitations remain. First, the available UAV surveys do not yet represent complete freeze–thaw cycles, and pre-disturbance topographic information is unavailable for some features, such as the railway slump and localized subsidence. Therefore, the temporal evolution and long-term development mechanisms of these features remain incompletely constrained. Future multi-temporal observations covering different seasons and multiple years are required to better characterize deformation trajectories and hazard evolution.
Second, although the integration of optical imagery and LiDAR data improves the identification and quantification of heterogeneous targets, some processing procedures still involve manual intervention. For example, the current SVM-based classification workflow relies on manually selected training samples, which may affect its transferability under varying illumination conditions, surface materials, and acquisition environments. Many routine processing steps, including image mosaicking, point-cloud processing, and DOM/DSM generation, are largely automated, whereas target delineation, parameter setting, and quality control still require expert involvement. This semi-automated workflow is applicable to site-scale and representative corridor-scale assessments, while further automation is needed for broader applications. Future studies should explore deep-learning-based semantic segmentation and object-detection approaches to improve automation and scalability for corridor-scale applications involving multiple infrastructure types [62,63,64].
Third, the current framework mainly focuses on surface manifestations of engineering degradation. Although UAV-LiDAR provides detailed information on surface morphology and deformation, subsurface thermal–hydrological processes cannot be directly resolved. Integrating UAV-based observations with complementary approaches, such as satellite InSAR, ground-based monitoring, and geophysical investigations, may provide a more comprehensive understanding of the relationships between subsurface permafrost changes and surface engineering responses [65]. Such multi-scale integration could further improve the linkage between regional hazard screening and site-specific engineering diagnosis in permafrost regions.

6. Conclusions

This study developed a synergistic optical–LiDAR framework for the centimeter-level, multidimensional quantification of engineering distresses and secondary periglacial hazards along linear infrastructure in the permafrost region of Northeast China. The framework was evaluated across highways, railways, transmission towers, and buried pipelines using multi-temporal UAV-LiDAR point clouds and synchronous visible-light imagery. The main conclusions are as follows:
(1)
A synergistic optical–LiDAR framework was established. The framework integrates the texture and boundary-delineation capabilities of DOMs, the elevation and volumetric measurement capabilities of DEMs/DSMs, and the structural-attitude information derived from 3D models. This complementary use of multiple data products overcomes limitations associated with individual data sources and enables quantitative, comparable, and repeatable characterization of small-scale, spatially discrete, and multi-type distresses.
(2)
Multiple engineering distresses and secondary periglacial hazards were identified and quantified. Representative results included a pavement crack density of 1.11 m/m2, a maximum differential shoulder settlement of 58.28 cm, a localized pavement subsidence volume of 9.3 m3, a railway embankment slump volume of 7.22 m3, and a tower inclination of 3.9° (E–W). Cumulative surface settlement directly above the pipeline reached approximately 15 cm between May 2022 and May 2023. Trench ponding covered 70.98 m2, with estimated water depths of 12–46 cm, while icing-induced positive elevation-change volume reached 340.36 m3 over a 17-day freeze-up period.
(3)
The applicability of UAV-LiDAR measurements under complex surface and snow-covered conditions was evaluated. The overall RMSEs were 3.25 cm and 4.13 cm at flight altitudes of 50 and 100 m, respectively, confirming centimeter-level accuracy for distress detection and microtopographic measurement. However, dense vegetation and turbid water caused overestimation of ground elevation and underestimation of water depth. Snow-depth retrievals agreed well with field measurements (R2 = 0.87; RMSE = 1.32 cm), indicating that UAV-LiDAR can extend monitoring into snow-covered periods and support continuous monitoring of icing development and frost-heave deformation, as well as distress inspection throughout the freezing season.

Author Contributions

Conceptualization, G.L., K.G. and Y.M.; methodology, G.L., K.G., Q.D. and M.Z.; software, G.L. and J.L.; validation, K.G. and F.W.; formal analysis, D.C. and Y.C.; investigation, G.L., K.G. and J.L.; resources, G.L.; data curation, K.G., F.W. and Y.C.; writing—original draft preparation, G.L. and K.G.; writing—review and editing, G.L. and K.G.; visualization, K.G. and Q.D.; supervision, Y.M.; project administration, G.L. and K.G.; funding acquisition, G.L., K.G. and D.C. All authors have read and agreed to the published version of the manuscript.

Funding

This research is supported by the Natural Science Foundation of Gansu Province (Grant No. 26JRRA154), the National Natural Science Foundation of China (Grant No. 42272339), and the Open Foundation of the National Cryosphere Desert Data Center (No. 2024NCDC006).

Data Availability Statement

The original contributions presented in the study are included in the article; further inquiries can be directed to the corresponding author.

Conflicts of Interest

The authors declare no conflicts of interest.

Abbreviations

CRCOPChina–Russia Crude Oil Pipeline
DEMDigital Elevation Model
DOMDigital Orthophoto Map
DoDDEM of Difference
DSMDigital Surface Model
GNSSGlobal Navigation Satellite System
INSInertial Navigation System
JMHJagdaqi–Mo’he Highway
JXPTJinXin Power Transmission Line
LEDLongitudinal Elevation Difference
LiDARLight Detection and Ranging
LoD95Level of Detection at the 95% confidence level
NLRNenLin Railway
ROIRegion of Interest
RTKReal-Time Kinematic
SDStandard Deviation
SHMStructural Health Monitoring
SVMSupport Vector Machine
TINTriangulated Irregular Network
UAVUnmanned Aerial Vehicle
UTMUniversal Transverse Mercator
WGSWorld Geodetic System

References

  1. Obu, J. How Much of the Earth’s Surface is Underlain by permafrost? J. Geophys. Res. Earth Surf. 2021, 126, e2021JF006123. [Google Scholar] [CrossRef] [Scilit]
  2. Wu, B.; Sheng, Y.; Yu, Q.; Chen, J.; Ma, W. Engineering in the rugged permafrost terrain on the roof of the world under a warming climate. Permafr. Periglac. Process. 2020, 31, 417–428. [Google Scholar] [CrossRef] [Scilit]
  3. Biskaborn, B.K.; Smith, S.L.; Noetzli, J.; Matthes, H.; Vieira, G.; Streletskiy, D.A.; Schoeneich, P.; Romanovsky, V.E.; Lewkowicz, A.G.; Abramov, A.; et al. Permafrost Is Warming at a Global Scale. Nat. Commun. 2019, 10, 264. [Google Scholar] [CrossRef] [Scilit]
  4. Hjort, J.; Streletskiy, D.; Doré, G.; Wu, Q.; Bjella, K.; Luoto, M. Impacts of permafrost degradation on infrastructure. Nat. Rev. Earth Environ. 2022, 3, 24–38. [Google Scholar] [CrossRef] [Scilit]
  5. Streletskiy, D.A.; Clemens, S.; Lanckman, J.P.; Shiklomanov, N.I. The costs of Arctic infrastructure damages due to permafrost degradation. Environ. Res. Lett. 2023, 18, 015006. [Google Scholar] [CrossRef] [Scilit]
  6. Cheng, G. Influences of local factors on permafrost occurrence and their implications for Qinghai-Xizang Railway design. Sci. China Ser. D Earth Sci. 2004, 47, 704–709. [Google Scholar] [CrossRef] [Scilit]
  7. Lai, Y.; Zhang, M.; Liu, Z.; Yu, W. Numerical analysis for cooling effect of open boundary ripped-rock embankment on Qinghai-Tibetan Railway. Sci. China Ser. D Earth Sci. 2006, 49, 764–772. [Google Scholar] [CrossRef] [Scilit]
  8. Ma, W.; Mu, Y.; Wu, Q.; Sun, Z.; Liu, Y. Characteristics and mechanisms of embankment deformation along the Qinghai-Tibet Railway in permafrost regions. Cold Reg. Sci. Technol. 2011, 67, 178–186. [Google Scholar] [CrossRef] [Scilit]
  9. Wang, S.; Chen, J.; Zhang, J.; Li, Z. Development of highway constructing technology in the permafrost region on the Qinghai-Tibet Plateau. Sci. China Ser. E Technol. Sci. 2009, 52, 497–506. [Google Scholar] [CrossRef] [Scilit]
  10. Wu, Q.; Zhang, T.; Liu, Y. Thermal state of the active layer and permafrost along the Qinghai-Xizang (Tibet) Railway from 2006 to 2010. Cryosphere 2012, 6, 607–612. [Google Scholar] [CrossRef] [Scilit]
  11. Li, G.; Yu, Q.; Ma, W.; Chen, Z.; Mu, Y.; Guo, L.; Wang, F. Freeze–thaw properties and long-term thermal stability of the unprotected tower foundation soils in permafrost regions along the Qinghai-Tibet Power Transmission Line. Cold Reg. Sci. Technol. 2016, 121, 258–274. [Google Scholar] [CrossRef] [Scilit]
  12. You, Y.; Yu, Q.; Guo, L.; Wang, X.; Hu, J.; Qian, J.; Zhang, H. In-situ monitoring the thermal regime of foundation backfill of a power transmission line tower in permafrost regions on the Qinghai-Tibet Plateau. Appl. Therm. Eng. 2016, 98, 271–279. [Google Scholar] [CrossRef] [Scilit]
  13. He, R.; Jin, H. Permafrost and cold-region environmental problems of the oil product pipeline from Golmud to Lhasa on the Qinghai-Tibet Plateau and their mitigation. Cold Reg. Sci. Technol. 2010, 64, 279–288. [Google Scholar] [CrossRef] [Scilit]
  14. Fu, Z.; Wu, Q.; Chen, A.; Wang, L.; Jiang, G.; Gao, S.; Yun, H.; Chen, J. Non-temperature environmental drivers modulate warming-induced 21st-century permafrost degradation on the Tibetan Plateau. Nat. Commun. 2025, 16, 7556. [Google Scholar] [CrossRef] [Scilit]
  15. Jin, H.; Yu, Q.; Lü, L.; Guo, D.; He, R.; Yu, S.; Sun, G.; Li, Y. Degradation of permafrost in the Xing’anling Mountains, Northeastern China. Permafr. Periglac. Process. 2007, 18, 245–258. [Google Scholar] [CrossRef] [Scilit]
  16. Chang, X.; Jin, H.; Zhang, Y.; He, R.; Luo, D.; Wang, Y.; Lü, L.; Zhang, Q. Thermal impacts of boreal forest vegetation on active layer and permafrost soils in northern Da Xing’anling (Hinggan) Mountains, Northeast China. Arct. Antarct. Alp. Res. 2015, 47, 267–279. [Google Scholar] [CrossRef] [Scilit]
  17. Zhang, Z.; Li, M.; Wu, Q.; Wang, X.; Jin, H.; Chen, H.; Ma, D.; Zhang, Z. Degradation and local growth of “Xing’an-Baikal” permafrost responding to climate warming and the consequences. Earth-Sci. Rev. 2024, 255, 104865. [Google Scholar] [CrossRef] [Scilit]
  18. Li, G.; Ma, W.; Wang, F.; Jin, H.; Fedorov, A.; Chen, D.; Wu, G.; Cao, Y.; Zhou, Y.; Mu, Y.; et al. A newly integrated ground temperature dataset of permafrost along the China-Russia crude oil pipeline route in Northeast China. Earth Syst. Sci. Data 2022, 14, 5093–5110. [Google Scholar] [CrossRef] [Scilit]
  19. Gao, K.; Li, G.; Cao, Y.; Li, C.; Chen, D.; Wu, G.; Du, Q.; Wang, F.; Fedorov, A.; Che, F.; et al. Permafrost thawing caused by the China-Russia crude oil pipeline based on multi-type data and its impacts on geomorphological reshaping and water erosion. Catena 2024, 242, 108134. [Google Scholar] [CrossRef] [Scilit]
  20. Liang, J.; Huang, S.; Jin, X.; Yang, L.; Wang, W.; Tang, J.; Zhang, Z.; Li, S.; Li, X.; Zhai, J.; et al. Expansion of thermokarst lakes along the Mo’he county section of National Highway G111 in Northeast China during 1989-2020. Adv. Clim. Change Res. 2025, 16, 1044–1057. [Google Scholar] [CrossRef] [Scilit]
  21. Yan, A.; Li, S.; Jin, X.; Huang, S.; Wang, W.; Tang, J.; Li, A.; Zhang, Z.; Zhang, S.; Zhai, J.; et al. Multi-source assessment of permafrost deformation along the Bei’an-Hei’he Highway in Northeast China. Remote Sens. Environ. 2026, 333, 115143. [Google Scholar] [CrossRef] [Scilit]
  22. Lin, J.; Li, G.; Gao, K.; Wang, F.; Zhang, H. Tower foundation-induced through talik characteristics in warm permafrost terrains: The case of power lines in Jagdaqi, Northeast China. Eng. Geol. 2026, 368, 108774. [Google Scholar] [CrossRef] [Scilit]
  23. Spencer, B.F., Jr.; Hoskere, V.; Narazaki, Y. Advances in computer vision-based civil infrastructure inspection and monitoring. Engineering 2019, 5, 199–222. [Google Scholar] [CrossRef] [Scilit]
  24. Luo, L.; Ma, W.; Zhang, Z.; Zhuang, Y.; Zhang, Y.; Yang, J.; Cao, X.; Liang, S.; Mu, Y. Freeze/thaw-induced deformation monitoring and assessment of the slope in permafrost based on terrestrial laser scanner and GNSS. Remote Sens. 2017, 9, 198. [Google Scholar] [CrossRef] [Scilit]
  25. Liu, S.; Zhao, L.; Wang, L.; Zou, D.; Hu, G.; Sun, Z.; Zhou, H.; Qiao, Y. Process and mechanism analysis of typical permafrost area surface deformation at two sites along the Qinghai-Tibet Highway based on long-term leveling observation. Sci. Total Environ. 2024, 956, 177325. [Google Scholar] [CrossRef] [Scilit]
  26. Wang, W.; Jin, X.; Jin, H.; Li, X.; Wang, X.; He, R.; Li, Y.; Li, X.; Wang, L.; Wang, W.; et al. Evaluation of ground surface deformation in discontinuous permafrost regions along the China-Russia crude oil pipelines in Northeast China using InSAR and ground surveys. Eng. Geol. 2023, 323, 107227. [Google Scholar] [CrossRef] [Scilit]
  27. Mi, H.; Li, S.; Yang, X.; Jin, X.; Li, A.; Wang, B.; Yan, A.; Li, X.; He, Z.; Li, Z.; et al. Spatial distribution and multi-factor controls of aufeis in the northern Da Xing’anling Mountains, Northeast China. Permafr. Periglac. Process. 2026, 37, 498–516. [Google Scholar] [CrossRef] [Scilit]
  28. Štroner, M.; Urban, R.; Línková, L. A new method for UAV lidar precision testing used for the evaluation of an affordable DJI Zenmuse L1 scanner. Remote Sens. 2021, 13, 4811. [Google Scholar] [CrossRef] [Scilit]
  29. Colomina, I.; Molina, P. Unmanned aerial systems for photogrammetry and remote sensing: A review. ISPRS J. Photogramm. Remote Sens. 2014, 92, 79–97. [Google Scholar] [CrossRef] [Scilit]
  30. Jones, B.M.; Grosse, G.; Arp, C.D.; Miller, E.; Liu, L.; Hayes, D.J.; Larsen, C.F. Recent Arctic tundra fire initiates widespread thermokarst development. Sci. Rep. 2015, 5, 15865. [Google Scholar] [CrossRef] [Scilit]
  31. Van der Sluijs, J.; Kokelj, S.V.; Fraser, R.H.; Tunnicliffe, J.; Lacelle, D. Permafrost terrain dynamics and infrastructure impacts revealed by UAV photogrammetry and thermal imaging. Remote Sens. 2018, 10, 1734. [Google Scholar] [CrossRef] [Scilit]
  32. Luo, L.; Ma, W.; Zhao, W.; Zhuang, Y.; Zhang, Z.; Zhang, M.; Ma, D.; Zhou, Q. UAV-based spatiotemporal thermal patterns of permafrost slopes along the Qinghai–Tibet Engineering Corridor. Landslides 2018, 15, 2161–2172. [Google Scholar] [CrossRef] [Scilit]
  33. Harder, P.; Pomeroy, J.W.; Helgason, W.D. Improving sub-canopy snow depth mapping with unmanned aerial vehicles: Lidar versus structure-from-motion techniques. Cryosphere 2020, 14, 1919–1935. [Google Scholar] [CrossRef] [Scilit]
  34. Kaiser, S.; Boike, J.; Grosse, G.; Langer, M. The potential of UAV imagery for the detection of rapid permafrost degradation: Assessing the impacts on critical Arctic infrastructure. Remote Sens. 2022, 14, 6107. [Google Scholar] [CrossRef] [Scilit]
  35. Chai, M.; Li, G.; Ma, W.; Chen, D.; Du, Q.; Zhou, Y.; Qi, S.; Tang, L.; Jia, H. Damage characteristics of the Qinghai-Tibet Highway in permafrost regions based on UAV imagery. Int. J. Pavement Eng. 2023, 24, 2038381. [Google Scholar] [CrossRef] [Scilit]
  36. Zaremotekhases, F.; Hunsaker, A.; Dave, E.V.; Sias, J.E. Performance of the UAS-LiDAR sensing approach in detecting and measuring pavement frost heaves. Road Mater. Pavement Des. 2024, 25, 308–325. [Google Scholar] [CrossRef] [Scilit]
  37. Gao, K.; Li, G.; Wang, F.; Cao, Y.; Chen, D.; Du, Q.; Chai, M.; Fedorov, A.; Lin, J.; Shang, Y.; et al. Evolution of secondary periglacial environment induced by thawing permafrost near the China-Russia crude oil pipeline based on airborne LiDAR, geophysics, and field observation. Drones 2024, 8, 360. [Google Scholar] [CrossRef] [Scilit]
  38. Renette, C.; Olvmo, M.; Thorsson, S.; Holmer, B.; Reese, H. Multitemporal UAV lidar detects seasonal heave and subsidence on palsas. Cryosphere 2024, 18, 5465–5480. [Google Scholar] [CrossRef] [Scilit]
  39. Liu, M.; Li, B.; Mu, Y.; Luo, J.; Yin, F.; Yu, F. Spatiotemporal Dynamics of Roadside Water Accumulation and Its Hydrothermal Impacts on Permafrost Stability: Integrating UAV and GPR. Remote Sens. 2025, 17, 3110. [Google Scholar] [CrossRef] [Scilit]
  40. Störmer, A.; Kumpula, T.; Villoslada, M.; Korpelainen, P.; Schumacher, H.; Burkhard, B. Comparing high-resolution snow mapping approaches in palsa mires: UAS lidar vs. modelling. Cryosphere 2025, 19, 3949–3970. [Google Scholar] [CrossRef] [Scilit]
  41. Gao, S.; Liu, Y.; Men, X.; Zhao, H.; Wang, L.; Fu, Z.; Zhang, Z.; Yang, Y.; Jiang, G.; Wu, Q. Centimeter-resolution 4D dynamics of retrogressive thaw slumps from repeat UAV photogrammetry on the Tibetan Plateau. Remote Sens. Environ. 2026, 335, 115262. [Google Scholar] [CrossRef] [Scilit]
  42. Qi, S.; Li, G.; Yang, J.; Du, Q.; Gao, K.; Chen, D.; Chai, M.; Su, A.; Wang, M. Assessment of pavement–subgrade deformation in permafrost highways using UAV photogrammetry and ground-penetrating radar: Case study of Qinghai–Tibet Highway. Transp. Geotech. 2026, 57, 101899. [Google Scholar] [CrossRef] [Scilit]
  43. Li, B.; Liu, M.; Mu, Y.; Luo, J.; Ju, X.; Yin, F.; Yu, F.; Huang, Y. Distribution and evolution of distress in embankment-bridge transition sections of the Gonghe-Yushu Expressway in degrading permafrost regions. Transp. Geotech. 2026, 58, 101945. [Google Scholar] [CrossRef] [Scilit]
  44. Wang, W.; Che, F.; Jin, H.; Li, S.; Tang, J.; Li, X.; Zhai, J.; Zhang, Z.; Huang, S.; Xue, G.; et al. Progress in studies on frost hazards along transport infrastructures in permafrost regions of northern Da Xing’anling Mountains in Northeast China (I): Thaw hazards. J. Glaciol. Geocryol. 2025, 47, 354–371. (In Chinese) [Google Scholar]
  45. Ma, L.; Liu, J.; Li, Q. Measures for roadbed problems of railways in permafrost regions of Northeast China. Chin. J. Geotech. Eng. 2009, 31, 475–479. (In Chinese) [Google Scholar]
  46. Lin, J.; Zhang, H.; Li, G.; Su, A.; Gao, K.; Cao, Y.; Chen, D.; Wang, X.; Wang, M. Distress characteristics and countermeasures of poles and tower foundations in the Da Xing’anling forest region. For. Eng. 2025, 41, 646–656. (In Chinese) [Google Scholar]
  47. Li, G.; Ma, W.; Wang, X.; Jin, H.; Wang, Y.; Zhao, Y.; Cai, Y.; Zhang, P. Frost hazards and mitigative measures following operation of the Mo’he-Daqing line of the China-Russia crude oil pipeline. Rock Soil Mech. 2015, 36, 2963–2973. (In Chinese) [Google Scholar]
  48. Brasington, J.; Langham, J.; Rumsby, B. Methodological sensitivity of morphometric estimates of coarse fluvial sediment transport. Geomorphology 2003, 53, 299–316. [Google Scholar] [CrossRef] [Scilit]
  49. Wheaton, J.M.; Brasington, J.; Darby, S.E.; Sear, D.A. Accounting for uncertainty in DEMs from repeat topographic surveys: Improved sediment budgets. Earth Surf. Processes Landf. 2010, 35, 136–156. [Google Scholar] [CrossRef] [Scilit]
  50. Milan, D.J.; Heritage, G.L.; Large, A.R.; Fuller, I.C. Filtering spatial error from DEMs: Implications for morphological change estimation. Geomorphology 2011, 125, 160–171. [Google Scholar] [CrossRef] [Scilit]
  51. Li, P.; Li, D.; Hu, J.; Fassnacht, F.E.; Latifi, H.; Yao, W.; Gao, J.; Chan, F.; Dang, T.; Tang, F. Improving the application of UAV-LiDAR for erosion monitoring through accounting for uncertainty in DEM of difference. Catena 2024, 234, 107534. [Google Scholar] [CrossRef] [Scilit]
  52. Anderson, S.W. Uncertainty in quantitative analyses of topographic change: Error propagation and the role of thresholding. Earth Surf. Process. Landf. 2019, 44, 1015–1033. [Google Scholar] [CrossRef] [Scilit]
  53. Buffington, K.J.; Dugger, B.D.; Thorne, K.M.; Takekawa, J.Y. Statistical correction of lidar-derived digital elevation models with multispectral airborne imagery in tidal marshes. Remote Sens. Environ. 2016, 186, 616–625. [Google Scholar] [CrossRef] [Scilit]
  54. Hohenthal, J.; Alho, P.; Hyyppä, J.; Hyyppä, H. Laser scanning applications in fluvial studies. Prog. Phys. Geogr. 2011, 35, 782–809. [Google Scholar] [CrossRef] [Scilit]
  55. Deems, J.S.; Painter, T.H.; Finnegan, D.C. Lidar measurement of snow depth: A review. J. Glaciol. 2013, 59, 467–479. [Google Scholar] [CrossRef] [Scilit]
  56. Ylönen, M.; Marttila, H.; Geissler, J.; Kuzmin, A.; Korpelainen, P.; Kumpula, T.; Ala-Aho, P. UAV LiDAR surveys and machine learning improve snow depth and water equivalent estimates in boreal landscapes. Cryosphere 2025, 19, 4585–4610. [Google Scholar] [CrossRef] [Scilit]
  57. Lague, D.; Brodu, N.; Leroux, J. Accurate 3D comparison of complex topography with terrestrial laser scanner: Application to the Rangitikei Canyon (NZ). ISPRS J. Photogramm. Remote Sens. 2013, 82, 10–26. [Google Scholar] [CrossRef] [Scilit]
  58. Bernard, É.; Friedt, J.-M.; Griselin, M. Snowcover survey over an Arctic glacier forefield: Contribution of photogrammetry to identify “icing” variability and processes. Remote Sens. 2021, 13, 1978. [Google Scholar] [CrossRef] [Scilit]
  59. Ran, Y.; Cheng, G.; Dong, Y.; Hjort, J.; Lovecraft, A.L.; Kang, S.; Tan, M.; Li, X. Permafrost degradation increases risk and large future costs of infrastructure on the Third Pole. Commun. Earth Environ. 2022, 3, 238. [Google Scholar] [CrossRef] [Scilit]
  60. Douglas, T.A.; Hiemstra, C.A.; Anderson, J.E.; Barbato, R.A.; Bjella, K.L.; Deeb, E.J.; Gelvin, A.B.; Nelsen, P.E.; Newman, S.D.; Saari, S.P.; et al. Recent degradation of interior Alaska permafrost mapped with ground surveys, geophysics, deep drilling, and repeat airborne lidar. Cryosphere 2021, 15, 3555–3575. [Google Scholar] [CrossRef] [Scilit]
  61. Schneider von Deimling, T.; Lee, H.; Ingeman-Nielsen, T.; Westermann, S.; Romanovsky, V.; Lamoureux, S.; Walker, D.A.; Chadburn, S.; Trochim, E.; Cai, L.; et al. Consequences of permafrost degradation for Arctic infrastructure—Bridging the model gap between regional and engineering scales. Cryosphere 2021, 15, 2451–2471. [Google Scholar] [CrossRef] [Scilit]
  62. Huang, L.; Liu, L.; Jiang, L.; Zhang, T. Automatic mapping of thermokarst landforms from remote sensing images using deep learning: A case study in the northeastern Tibetan Plateau. Remote Sens. 2018, 10, 2067. [Google Scholar] [CrossRef] [Scilit]
  63. Shan, J.; Jiang, W.; Huang, Y.; Yuan, D.; Liu, Y. Unmanned aerial vehicle (UAV)-based pavement image stitching without occlusion, crack semantic segmentation, and quantification. IEEE Trans. Intell. Transp. Syst. 2024, 25, 17038–17053. [Google Scholar] [CrossRef] [Scilit]
  64. Liu, Y.; Yang, S.; Zhang, G.; Wu, M.; Xiong, F.; Yang, P.; Zhou, Z. IceSnow-Net: A deep semantic segmentation network for high-precision snow and ice mapping from UAV imagery. Remote Sens. 2025, 17, 2964. [Google Scholar] [CrossRef] [Scilit]
  65. Wang, Z.; Xiao, M.; Liew, M.; Jensen, A.; Farquharson, L.; Romanovsky, V.; Nicolsky, D.; McComb, C.; Jones, B.M.; Zhang, X.; et al. Arctic geohazard mapping tools for civil infrastructure planning: A systematic review. Cold Reg. Sci. Technol. 2023, 214, 103969. [Google Scholar] [CrossRef] [Scilit]
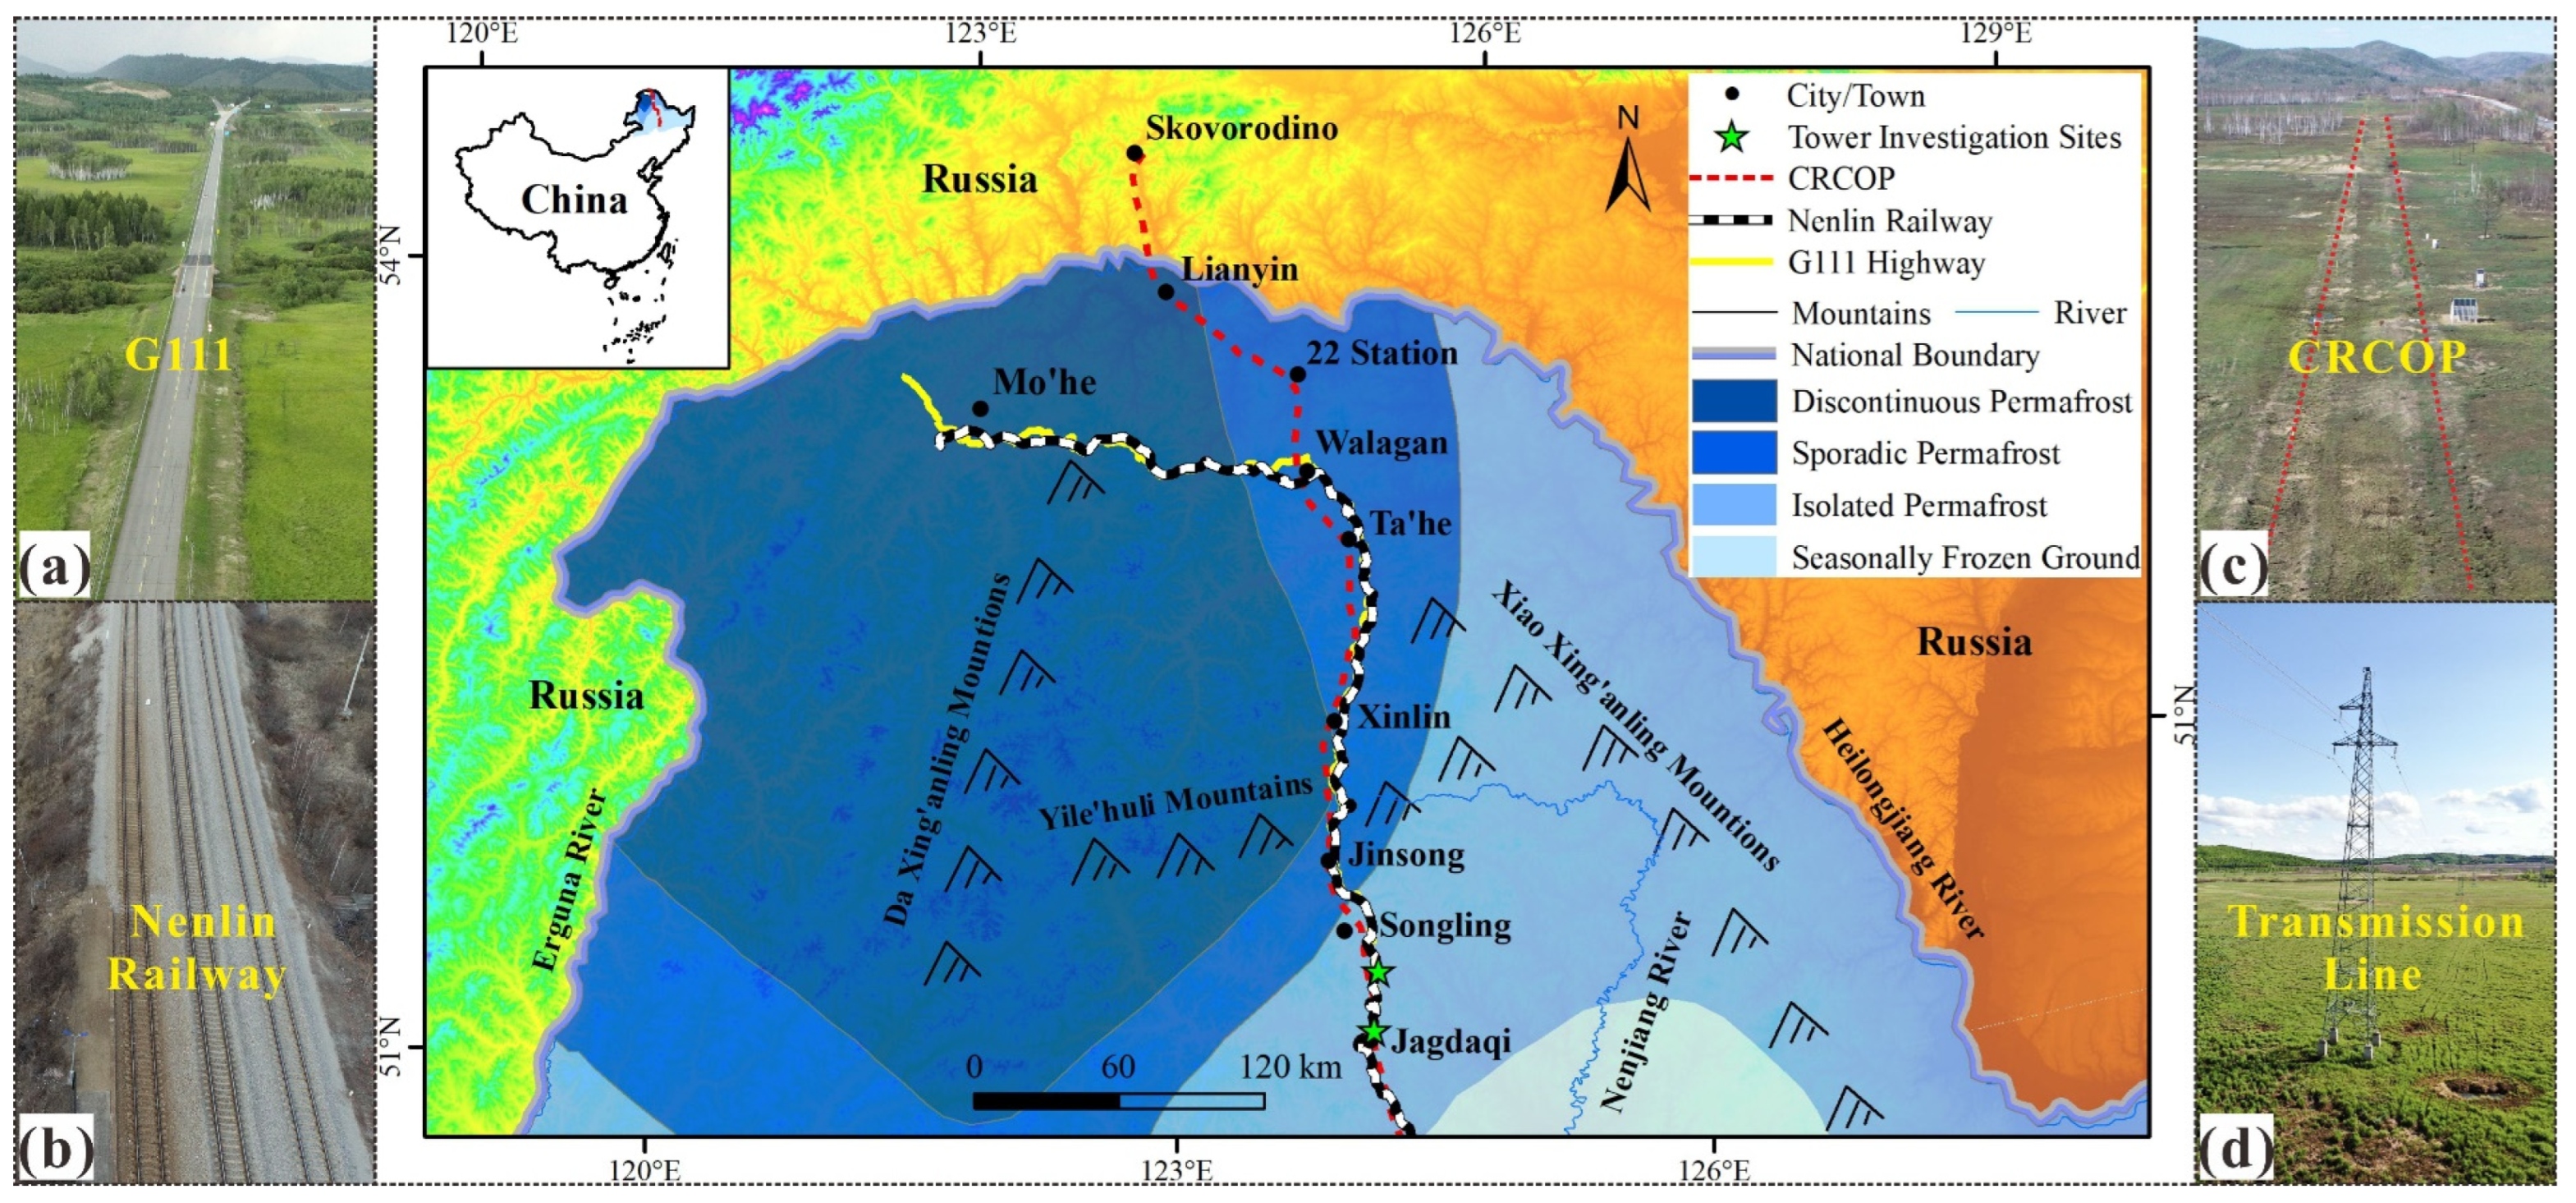
Figure 1. Locations of the engineering projects and permafrost distribution along the corridor. (a) JMH; (b) NLR; (c) CRCOP; (d) JXPT line.
Remotesensing 18 02938 g001
Figure 2. Synergistic optical–LiDAR workflow for multidimensional parameter extraction.
Remotesensing 18 02938 g002
Figure 3. Identification and parameter extraction of highway distresses: (a) pavement cracking, with (a1) original optical image, (a2) Gamma-stretched image, and (a3) SVM classification result; (b) uneven settlement, with (b1) DOM, (b2) DEM, and (b3) left-right shoulder height difference; (c) pavement undulation, with (c1) DOM, (c2) DEM, and (c3) SD and LED variations; (d) pavement subsidence, with (d1) field photo, (d2) DSM, and (d3) 3D visualization.
Remotesensing 18 02938 g003
Figure 4. 3D reconstruction of the transmission tower. (a) Image-based model; (b) optical–LiDAR fusion model; (c) elevation distribution of the fused model.
Remotesensing 18 02938 g004
Figure 5. Inclination measurement of the #15 tower: (a) inclination in the E–W direction; (b) inclination in the N–S direction; and (c) field measurement with circled numbers indicating the four corner foundations: ① NW, ② NE, ③ SE, ④ SW.
Remotesensing 18 02938 g005
Figure 6. Volume estimation of the embankment slump at K295 along the NLR: (a) DOM of the slump and (b) LiDAR-derived DEM of the slump.
Remotesensing 18 02938 g006
Figure 7. Thaw-induced surface subsidence: (a) DOM; (b) Extraction zone; (c) Baseline DEM (8 May 2022); (d) Cumulative deformation (7 October 2022); (e) Cumulative deformation (10 May 2023).
Remotesensing 18 02938 g007
Figure 8. Thermokarst ponding along the pipeline (a) and adjacent to the transmission tower (b): (a1) DOM, (a2) classification result, (a3) DEM, (a4) field photo, (a5) 3D visualization; (b1) DOM, (b2) classification result, (b3) DEM.
Remotesensing 18 02938 g008
Figure 9. Development and quantitative characterization of secondary icing above CRCOP II.
Remotesensing 18 02938 g009
Figure 10. Validation of UAV-LiDAR accuracy: (a) GCPs (black triangles); (b) 50 m point cloud; (c) 100 m point cloud; (d) RTK measurement; (e) GCP-1 in 50 m DOM; (f) GCP-1 in 100 m DOM.
Remotesensing 18 02938 g010
Figure 11. Coordinate and absolute errors at flight altitudes of 50 and 100 m: (a) coordinate error distribution and (b) absolute error distribution.
Remotesensing 18 02938 g011
Figure 12. Effects of tussock vegetation and ponding on LiDAR ground-point extraction.
Remotesensing 18 02938 g012
Figure 13. UAV-LiDAR snow-depth retrieval and accuracy validation: (a) comparison between field-measured and UAV-LiDAR-derived snow depths; (b,c) DOM and LiDAR-derived DSM on 30 October 2024, respectively; and (d,e) DOM and LiDAR-derived DSM on 15 May 2024, respectively. Red rectangles and letters A, B, C mark the measurement areas (each with multiple sampling points).
Remotesensing 18 02938 g013
Table 1. Comparison of representative UAV- and LiDAR-based studies for engineering distress and periglacial-hazard monitoring in permafrost regions.
StudyOptical/UAVUAV-LiDARMulti-InfrastructureSnow SeasonDistress Quantification
Jones et al. [30]NYNNN
Van der Sluijs et al. [31]YNNNY
Luo et al. [32]YNYNN
Harder et al. [33]YYNYN
Kaiser et al. [34]YNNNY
Chai et al. [35]YNNNY
Zaremotekhases et al. [36]NYNNY
Gao et al. [37]YYNNY
Renette et al. [38]NYNYN
Liu et al. [39]YYNNY
Störmer et al. [40]YYNYN
Gao et al. [41]YNNNY
Qi et al. [42]YNNNY
Li et al. [43]YYNNY
This studyYYYYY
Table 2. Specifications of UAV flight missions and surveyed sites.
InfrastructureSiteSurvey ModeDateDistress/Hazard type
JMHK2011 K2104 K2120 K2304Nadir9 May 20222;
18 October 2022;
20 October 2023;
20 May 2024
Pavement cracking, uneven settlement,
pavement undulation,
pavement subsidence
NLRK295Nadir and oblique18 October 2023Embankment slump
JXPTTower #15 and #117Nadir and oblique22 June 2022
3 June 2023
Tower inclination,
thermokarst ponding
CRCOPMDS364 MDS391Nadir and oblique8 May 2022
22 June 2024
Ground surface subsidence, thermokarst ponding, icing
Table 3. Data-source comparison for representative targets.
Representative TargetDOM-OnlyLiDAR-OnlyOptical–LiDAR
Pavement cracking (K2011)length = 35.61 m; area = 2.77 m2Weak vertical expressionTexture-based extraction
Shoulder settlement (K2104)Anomaly localizationMax./mean elevation difference = 58.28/36.15 cmLocalization + elevation quantification
Tower inclination (#15)Local reconstruction gaps3D structural informationInclination = 3.9°/1.8°;
displacement = 2.30/1.06 m
Secondary icing (MDS391)Extent = 58.3 mElevation change = 0.07–0.34 m;
volume ≈ 340.36 m3
Boundary + 3D change
Disclaimer/Publisher’s Note: The statements, opinions and data contained in all publications are solely those of the individual author(s) and contributor(s) and not of MDPI and/or the editor(s). MDPI and/or the editor(s) disclaim responsibility for any injury to people or property resulting from any ideas, methods, instructions or products referred to in the content.