Abstract
Shanghai is a modern metropolis characterized by high urban density and anthropogenic ground motions. Although traditional deformation monitoring methods, such as GPS and spirit leveling, are reliable to millimeter accuracy, the sparse point subsidence information makes understanding large areas difficult. Multiple temporal space-borne synthetic aperture radar interferometry is a powerful high-accuracy (sub-millimeter) remote sensing tool for monitoring slow ground deformation for a large area with a high point density. In this paper, the Interferometric Point Target Time Series Analysis method is used to extract ground subsidence rates in Shanghai based on 31 C-Band and 35 X-Band synthetic aperture radar (SAR) images obtained by Envisat and COSMO SkyMed (CSK) satellites from 2007 to 2010. A significant subsidence funnel that was detected is located in the junction place between the Yangpu and the Hongkou Districts. A t-test is formulated to judge the agreements between the subsidence results obtained by SAR and by spirit leveling. In addition, four profile lines crossing the subsidence funnel area are chosen for a comparison of ground subsidence rates, which were obtained by the two different band SAR images, and show a good agreement.
1. Introduction
Shanghai is one of the largest cities in China, with a population of more than 23,000,000. It is located to the northeast of the Yangtze River Delta in eastern China, which is fairly flat, at an average elevation of less than 4 m. Ground subsidence monitoring in Shanghai began in the 1920s. In the period from the 1920s to the 1960s, a large average accumulated subsidence of up to 1.69 m was detected in the central area of Shanghai, which was mainly caused by excessive groundwater withdrawal [1,2]. By decreasing the groundwater exploitation and increasing the groundwater recharge, the ground subsidence was controlled effectively after the 1970s. Recently, some areas with non-uniform subsidence were detected in Shanghai [3–7]. The non-uniform ground subsidence has the potential to damage city underground infrastructures, such as the metro, the gas pipes, and the sewer system. It also makes the city vulnerable to sea water encroachment and heavy weather flooding. Thus, it is important to monitor ground subsidence in the Shanghai area. Traditional ground motion monitoring methods such as spirit leveling and GPS are reliable and have an accuracy of up to one millimeter [8]. However, the sparse point information makes it difficult to understand the spatial distribution of the ground subsidence, especially concerning the non-uniform subsidence. Differential space-borne synthetic aperture radar interferometry (DInSAR) is a new remote sensing technology and a powerful tool for monitoring slow ground deformation in a large area with a high spatial resolution [9], which may provide an opportunity to detect the non-uniform subsidence in city areas. Theoretically, the accuracy of DInSAR measurements can reach up to the millimeter level with a large spatial coverage and a high spatial density of measurement points [10]. The limitations of DInSAR are mainly caused by the so-called temporal and geometrical decorrelations as well as atmosphere artifacts [11,12]. However, the high precision of DInSAR results depends not only on the quality of SAR images but also on the data processing methods used.
The main approach used to overcome the above-mentioned limitations is the Interferometric synthetic aperture radar (InSAR) time series analysis, i.e., multi-temporal InSAR (MT-InSAR) [13], which simultaneously utilizes all of the available SAR acquisitions, both temporally and spatially. MT-InSAR, which has been thoroughly utilized, mainly includes the Permanent Scatterer Interferometric technique (PSI) [14], the Small Baseline technique (SBAS) [15] and an Interferometric Point Target Analysis (IPTA) [16]. The ground subsidence rates of the central area of Shanghai have been obtained by multi-temporal (MT)-InSAR in recent years. Wang et al.[3], Liu et al.[4] and Luo et al.[5] exploited the ground deformation using the C-band ERS 1/2 SAR images from 1992 to 2002 and detected a significant subsidence area located in the area of the Yangpu and Hongkou Districts within downtown Shanghai. Using the L-band JERS-1 SAR images, Damoah-Afari et al.[6] obtained the ground deformation trend of Shanghai from 1992 to 1998. The ground subsidence along the Shanghai subway tunnels was identified through X-band CSK SAR acquisitions by Wang et al.[7]. However, the agreement of the results obtained by different bands of InSAR has not yet been achieved. In this paper, we compare and analyze the ground subsidence trend based on two differential bands of SAR data, X-band COSMO SkyMed (CSK) and C-band Envisat Advanced Synthetic Aperture Radar (ASAR) in the central area of Shanghai. The IPTA technique is used. Thirty-five CSK and 31 ENVISAT SAR images are used for taking the IPTA to obtain ground subsidence rates at those high coherent point targets (HCP). Moreover, comparisons of both ground subsidence rates by IPTA with sprit leveling measurements and between different band subsidence rates themselves are conducted. This research may help us deeply in understanding the characteristics of differential bands for SAR interferometry.
2. Methodology
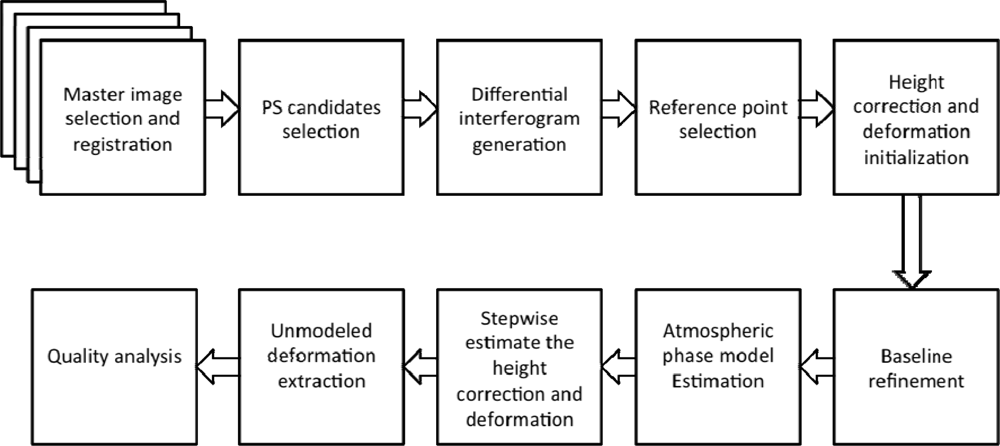
Here, MT-InSAR is performed by IPTA, which is a PSI and/or SBAS technique that has been demonstrated to be able to analyze the differential interferometric phase both spatially and temporally, i.e., the spatial differences between pairs of point targets and the pair differences between different interferograms, only with respect to the HCP [16]. The main procedures of IPTA are shown in Figure 1.
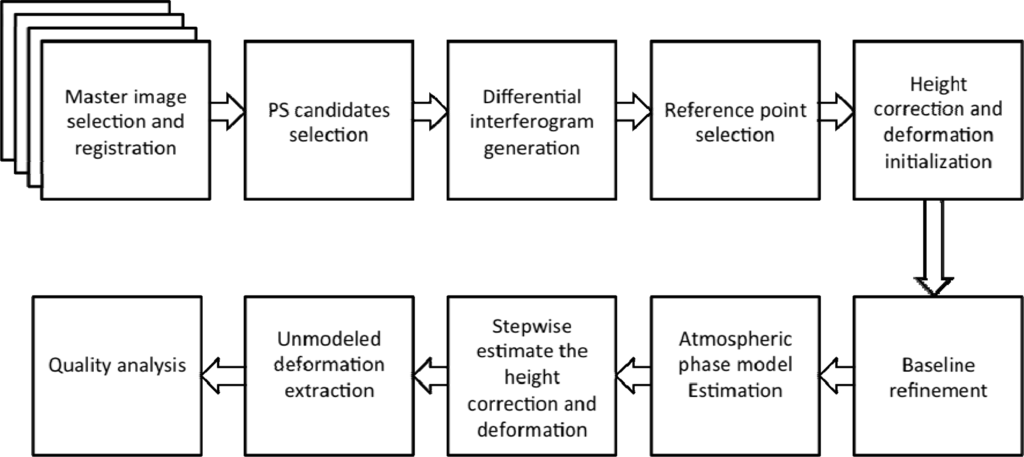
Figure 1.
Flowchart of Interferometric Point Target Analysis (IPTA) main procedures.
The so-called HCP indicates that the resolution cell is dominated by only one scatterer that is smaller than the resolution pixel and discriminates with the distributed target associated with the speckle behavior [17]. Two approaches, the low spectral phase diversity and the low intensity variability [16], are implemented in the IPTA for identifying point target candidates. To select enough point target candidates, the obtained candidates of both approaches are combined to form a union point target candidate.
Given N+1 SAR images obtained at different times over the same area, one of the images is selected as the master, and the others are used as slave images. With the selected point target candidates, N interferograms are generated. To aid the quality assessment, the master image is selected by maximizing the joint correlation of the interferometric stacks [18].
With the assumption that the Line of Sight (LOS) deformation is linear, the two-dimensional linear phase regression model in terms of the k-th differential interferogram is modeled with respect to the pairs of point target x and the reference point as follows:
where W{.} denotes the wrapping phase. λ, R and θm denote radar wavelength, range from the master pixel to the sensor and the local incidence angle, respectively. B⊥ and T are the perpendicular baseline and the temporal baseline, respectively. The height correction of point target x related to the reference point is Δh(x). The linear deformation rate of point target x related to the reference point is v(x), and ϕnoise is the combination of white noise and unmolded errors, which include baseline-related error, the atmospheric phase, and the non-linear deformation phase.
To accurately obtain the relative height correction and the relative linear deformation, the individual phase component included in the phase noise should be separated. The baseline correction is conducted only with the point targets where the deformation rate is stable (smaller than 2 mm/yr), then, a least square method is used to fit with all the point targets. Then, the atmospheric path delay component and the non-linear deformation phase should be separated with the precondition that the phase additive noise is relatively small and without any unwrapping problems. However, as the atmospheric distortion and the non-linear deformation are correlated in space to a certain extent, it is impossible to separate the two components completely. As our experiment area is located in the center of Shanghai, we consider a scale of non-linear deformation larger than 500 m to not be in our interest; that is, when the non-linear deformation’s scale is larger than 500 m, we assign it to the atmospheric phase. The atmospheric distortion is removed by spatial filtering. Then, the two-dimensional phase regression analysis is conducted again for calculating further height corrections and linear deformation rate differences. The above procedures are taken in an iterative way until the improvement on the height corrections and linear deformation rate differences are small enough. More detailed data processing procedures are given in the user guide of the GAMMA software [19].
3. Experimental Result and Analysis
3.1. Data Selection
In this paper, 31 scenes of C-band ascending Envisat ASAR images from February 2007 to May 2010 and 35 scenes of X-band ascending CSK SAR images from December 2008 to November 2010 were used. The baseline distribution of interferograms is displayed in Figure 2. For taking ASAR interferograms, we selected the image of August 2008 as the master (the red circle) and the others as slaves (the blue circles), which is displayed in Figure 2(a). The maximum perpendicular baseline was approximately 500 m and the maximum temporal baseline was approximately 400 days. Meanwhile, for CSK acquisitions, the master image was that of December 2009 (the red circle), which is displayed in Figure 2(b). The counter-baselines were 700 m and 400 days, respectively. In this paper, we select the master image based on the condition of maximizing the joint correlation of the interferometric stacks, which may ensure that the quality of interferometric pairs is as high as possible [18].

Figure 2.
Temporal and perpendicular baseline distribution of interferograms. The red circle denotes the master image while the blue ones denote the slave images. (a) Envisat Advanced Synthetic Aperture Radar (ASAR), (b) COSMO SkyMed (CSK) SAR.
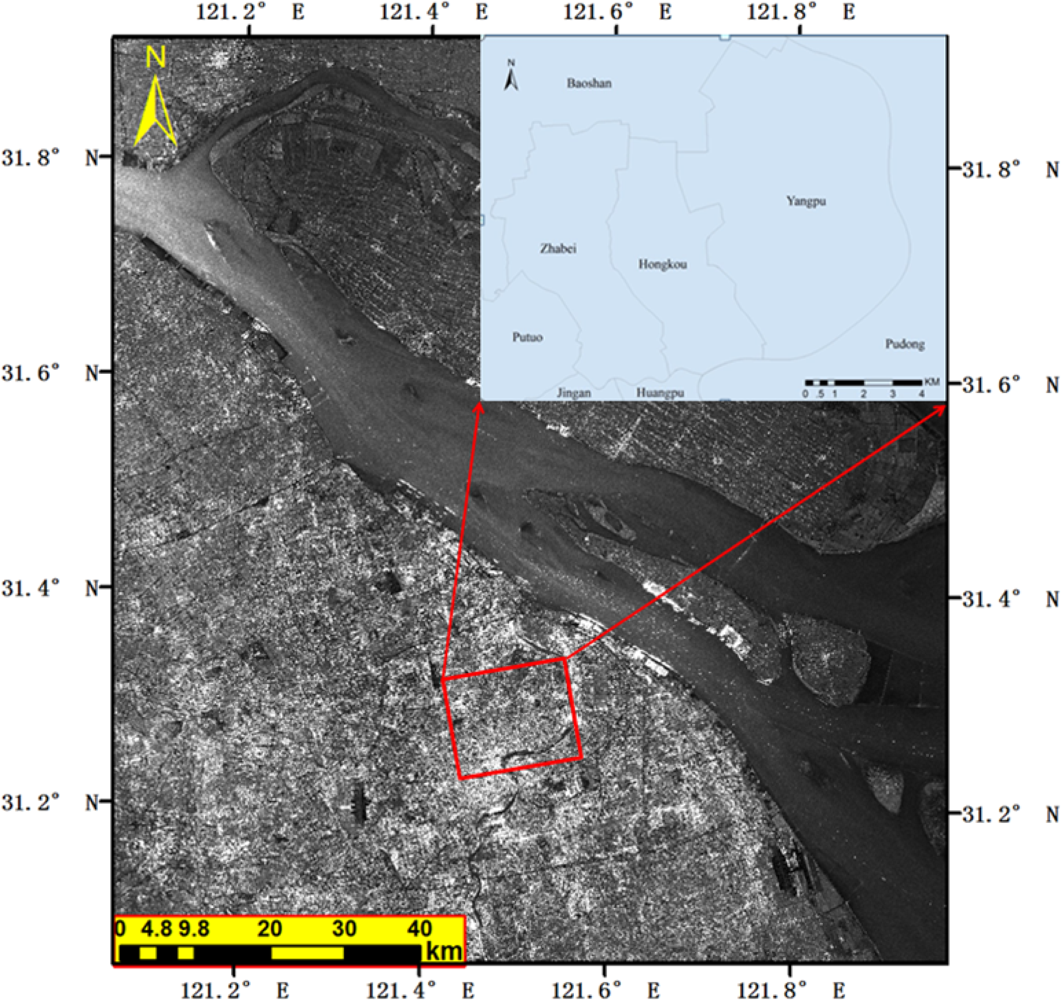
As this paper is aimed to detect the deformation trend within the downtown area of Shanghai and test the agreements, two similar subset images of approximately 11 km × 10 km are selected within both ASAR and CSK SAR acquisitions, the location of which is displayed based on the averaged ASAR intensity image, see Figure 3. The geodetic latitude and longitude of the test area are (31.33°N, 121.55°E), (31.31°N, 121.42°E), (31.24°N, 121.57°E), (31.22°N, 121.44°E), which denote the four corners in counter-clockwise order.
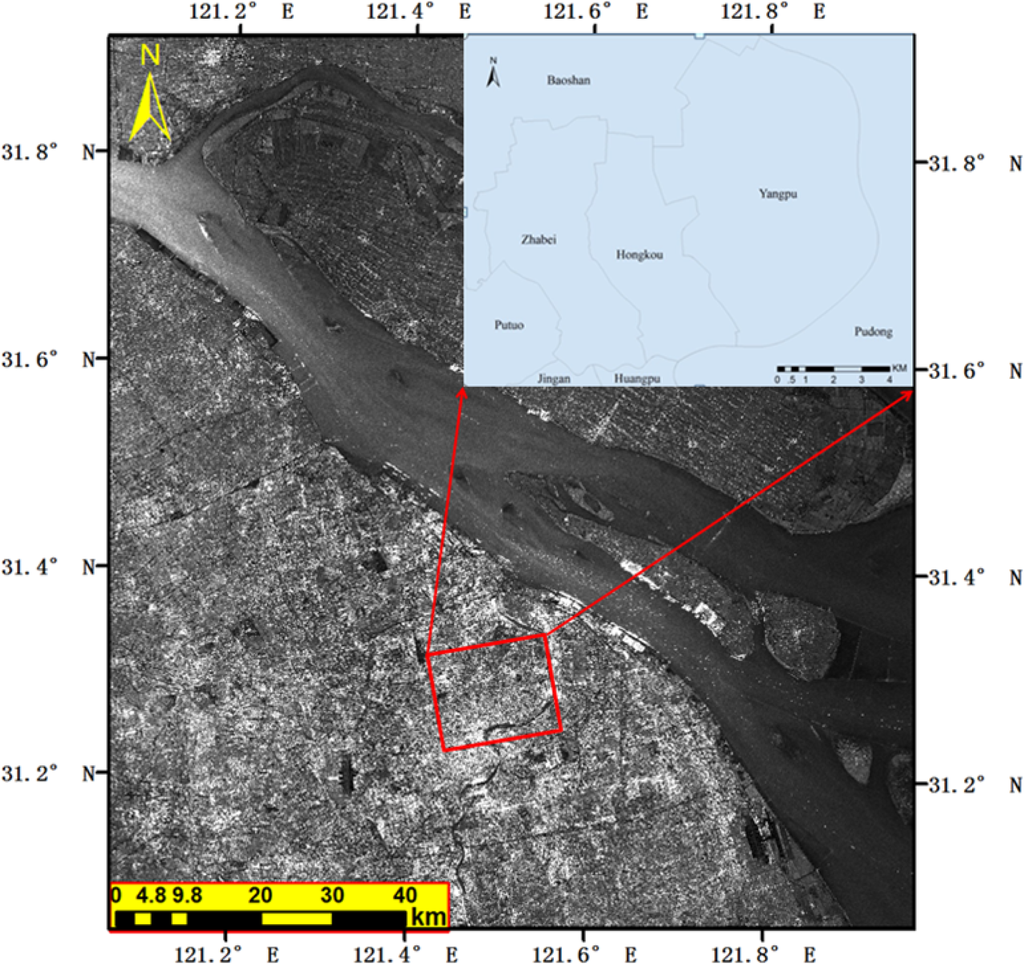
Figure 3.
Location of Shanghai. The study area is specified by the red square, the background is the averaged ASAR intensity image.
3.2. Subsidence Results
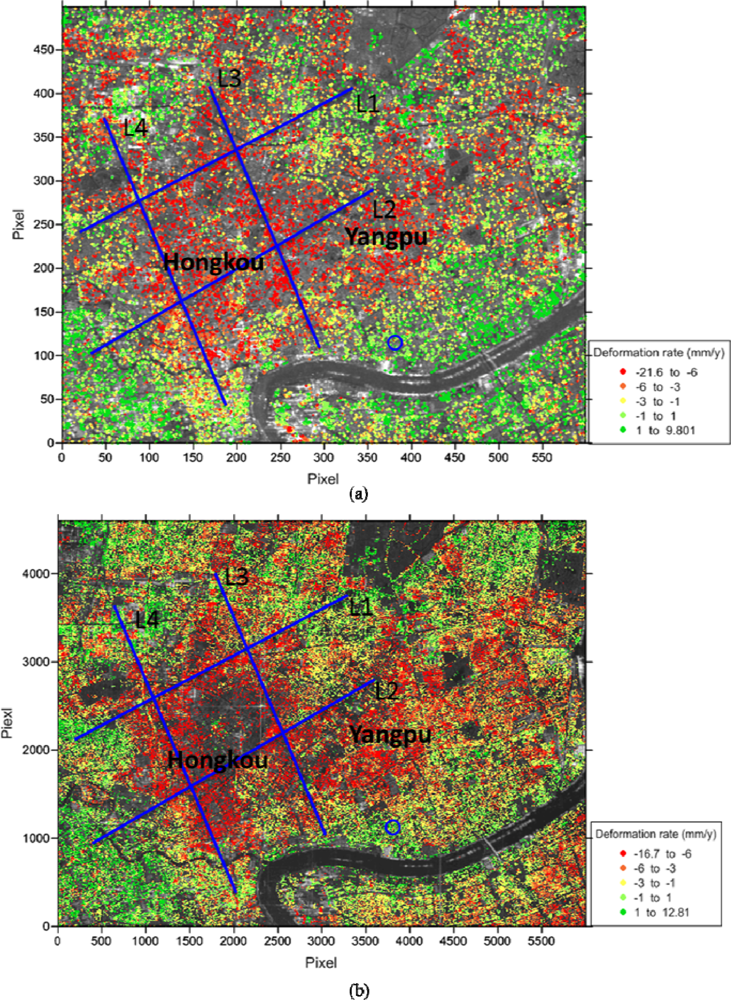
According to the methodology in Section 2, GAMMA software is used to make the IPTA data processing in our experiments. The same IPTA procedures are implemented for both the ASAR and the CSK SAR acquisitions, except for some parameters, which differ in different bands of SAR images. For example, the range and azimuth multiple look values are different (ASAR: 1 × 5; CSK: 1 × 1). As the estimated deformation rate is relative to the reference point, the reference point is selected within the same stable area both in the ASAR and the CSK SAR images, which is displayed in Figure 4 by a blue circle.
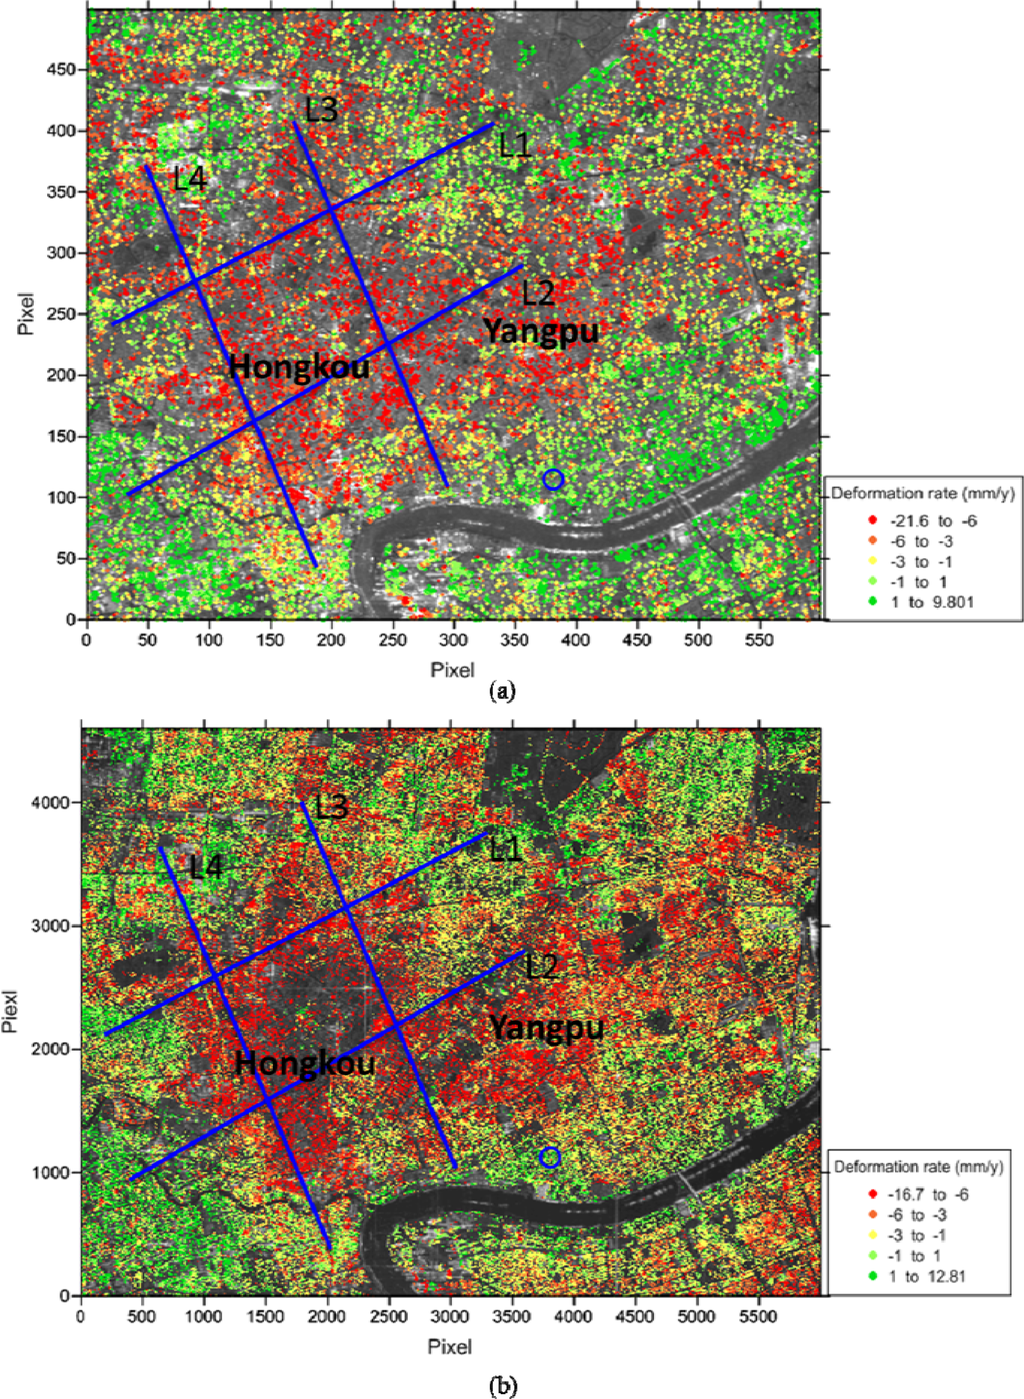
Figure 4.
Linear deformation rates of point targets overlaid on the average amplitude SAR image. (a) Deformation rate distribution obtained by ASAR images, (b) deformation rate distribution obtained by CSK SAR images. The four blue lines denote four chosen profiles across the significant subsidence funnel, labeled as L1, L2, L3 and L4. The blue circles located near the middle bottom are the reference points.
With the data processing of the MT-InSAR, there are 56,934 ASAR coherent point targets reserved from 74,464 candidates, while 502,150 CSK coherent point targets are reserved from 699,461 candidates. With the maintained point targets, the LOS mean deformation velocity is obtained and transformed to the vertical direction (divided by cosθ, where θ denotes the local incidence angle), and the result is displayed in Figure 4. From Figure 4, we can see that the major ground subsidence features are identified both in ASAR and CSK results. There is a significant ground subsidence funnel in the junction place of the Yangpu and the Hongkou Districts. Some other small subsidence places are also identified that have clearly revealed a non-uniform ground subsidence trend in space.
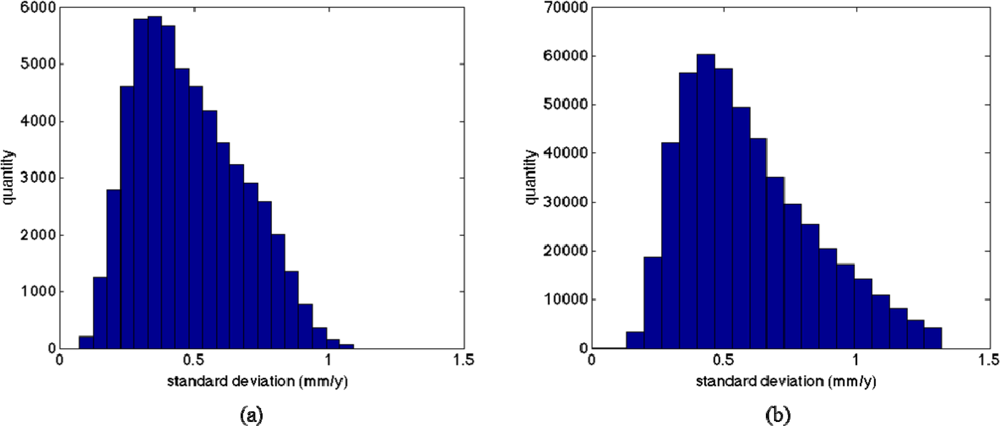
To assess the accuracy of the ground subsidence rates obtained, standard deviations (DSD) of the ground subsidence rates of the point targets are displayed in Figure 5. The DSD is a significant quality measure, permitting us to accept or reject the subsidence results of the point targets. We can find that most of the DSD obtained with ASAR is smaller than 1.1 mm/yr, which denotes that the ground subsidence rate has a good fitness with the two-dimensional phase regression model. However, the DSD obtained with CSK is relatively larger. To ensure the result quality of the point targets, we reject the point targets with a DSD larger than 1.3 mm/yr, which may be caused by a relatively low signal-to-noise ratio (SNR).
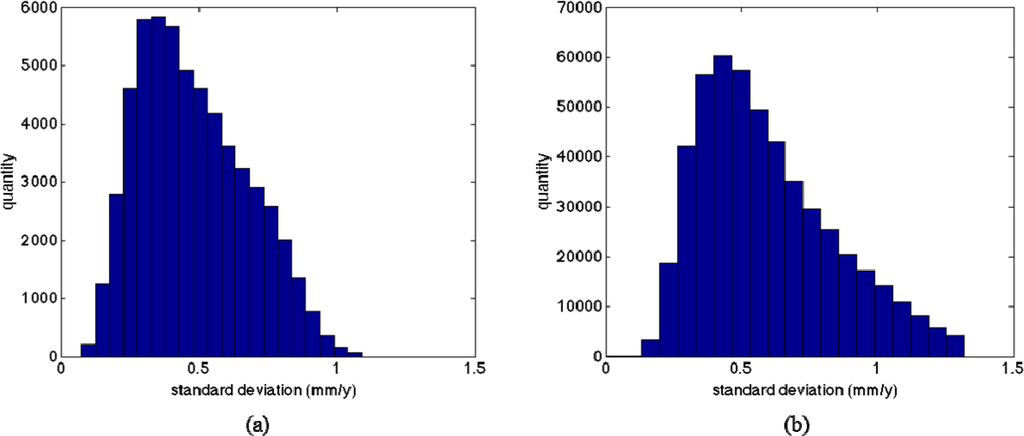
Figure 5.
Histogram of standard deviation of mean subsidence rates estimated. (a) Obtained by ASAR images, (b) obtained by CSK images.
3.3. Validation
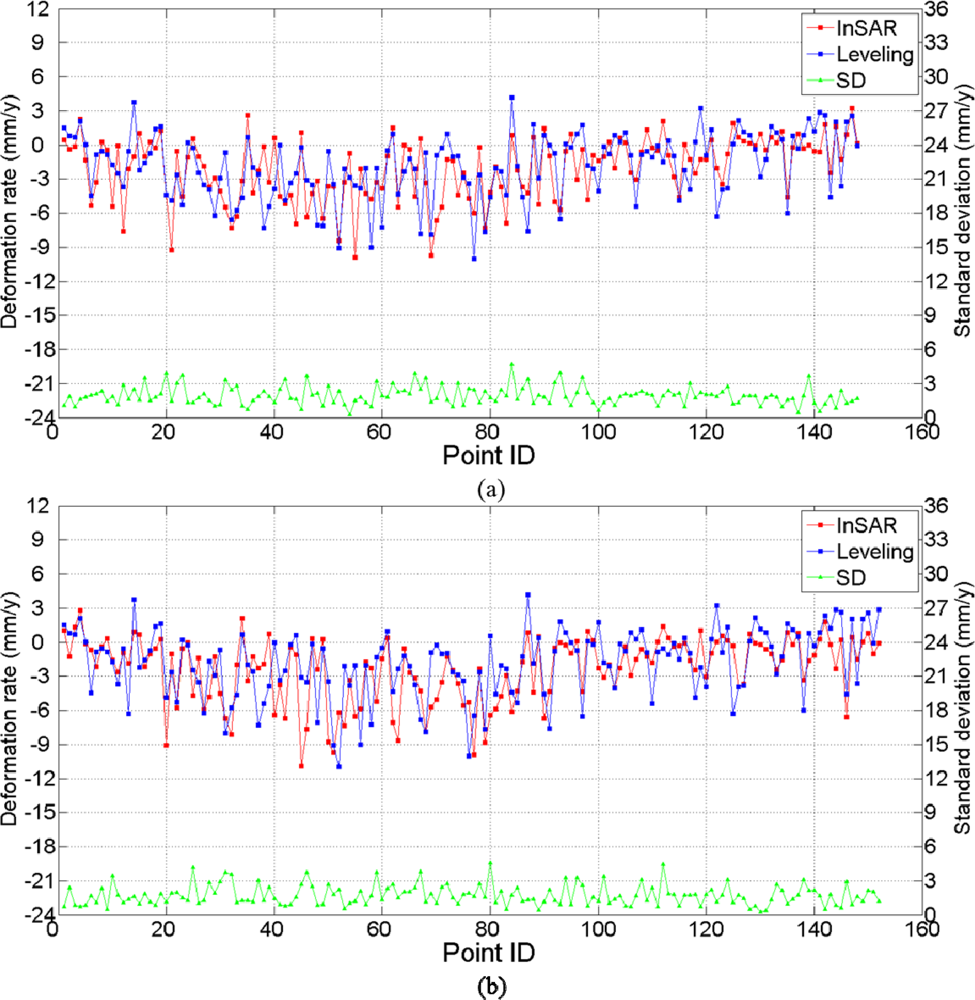
To determine whether the ground subsidence rate estimates are unbiased, a comparison of PSI deformation estimates, from ASAR and CSK, with spirit leveling measurements is implemented. In our chosen experimental area (rectangular box in Figure 3), there are 167 Bench Marks (BM) of spirit leveling. The ground subsidence rate obtained from leveling is an average value from 2006 to 2011. As it is impossible to obtain the point targets position identical to the leveling position, a searching window is defined by setting the BM as its center (For ASAR the window is 160 m × 160 m, CSK is 60 m × 60 m). Then, an average subsidence rate of all the point targets in the search window is calculated and compared with the subsidence rate of the BM. To ensure the reliability of the comparison, the standard deviation (SD) of subsidence rates in each window is calculated and displayed in Figure 6. When the SD is larger than 5 mm, the comparison will be omitted. Figure 6(a,b) shows the subsidence rates at the BMs both by InSAR and spirit leveling. The subsidence rate differences between InSAR and spirit leveling are calculated, and 77% of them for CSK and 85% of them for ASAR are less than 3 mm.
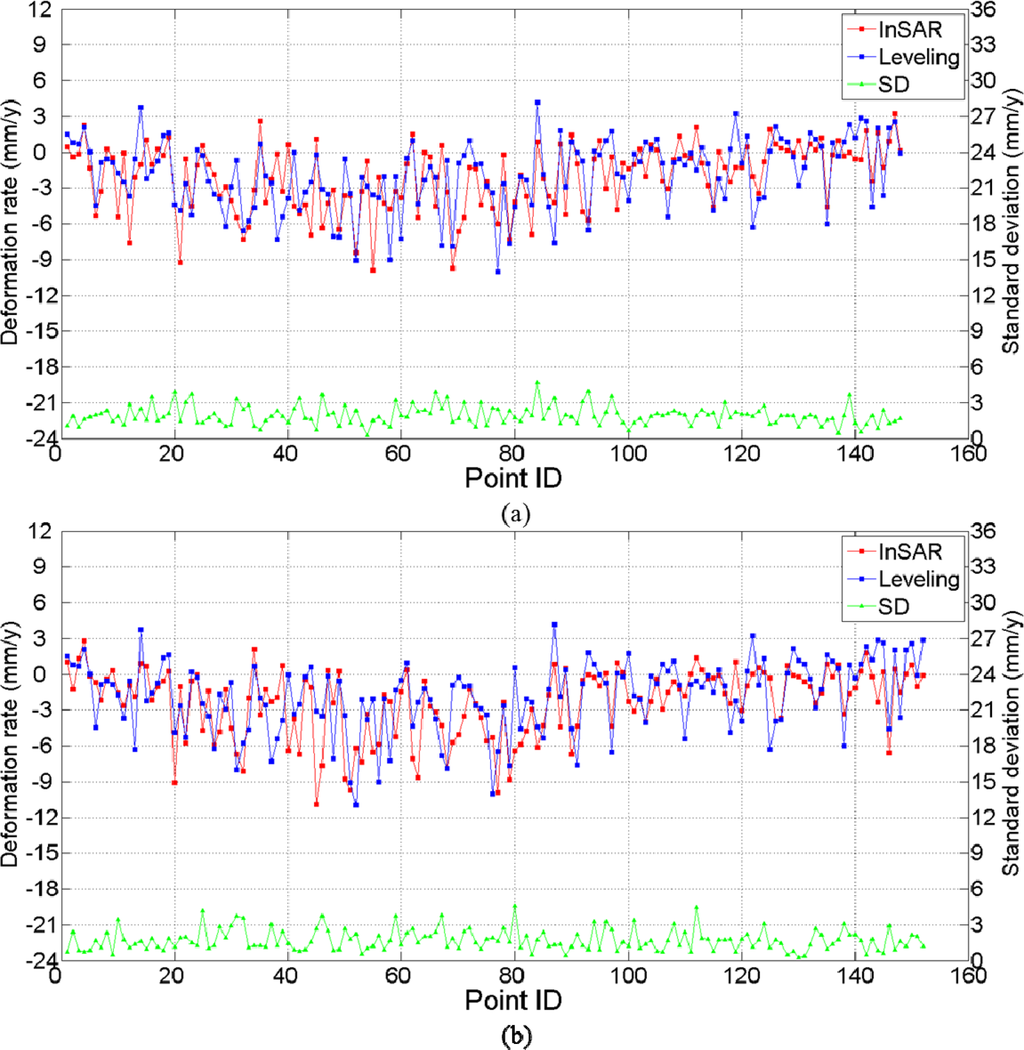
Figure 6.
Comparison of subsidence rates between Interferometric synthetic aperture radar (InSAR) and spirit leveling on bench marks. (a) Is for ASAR results, while (b) is for CSK results. SD denotes the standard deviation of subsidence rates in each searching window.
To further compare the subsidence rates obtained by MT-InSAR and leveling statistically, a t-test is formulated, which is defined as follows:
The null hypothesis is
The alternative hypothesis is
The statistic is
where X̄ and s denote the sample mean and the sample variance, i.e.,
,
, respectively, and n is the total number of observations. di is the difference between the leveling measurements li and the MT-InSAR deformation estimates pi. So,
Assuming li and pi obey a normal distribution, then d also obeys normal distribution, i.e.,
. μdi denotes the mean of di and μdi according to H0, while
and
denotes the variance of the leveling measurements and the MT-InSAR deformation estimates, respectively, which are known. Before calculating the statistic by Equation (4), di should be normalized, i.e.,
.
According to Equation (4), we obtain the statistic related to d′i:
- For ASAR, t = 0.38
- For CSK, t = 0.83
In our experiment, the total numbers of the sampling data are 152 and 148, respectively. Given the significance level α = 0.02 and using the double tail t-test, we obtain tα/2(152) = tα/2(148) = 2.33; thus both t statistics are located within the acceptance interval. Therefore, we accept the null hypothesis, which means there is no significant difference between the MT-InSAR deformation estimates and the leveling measurements. Thus, the subsidence estimates obtained by MT-InSAR are unbiased and reliable.
4. Comparison and Discussion
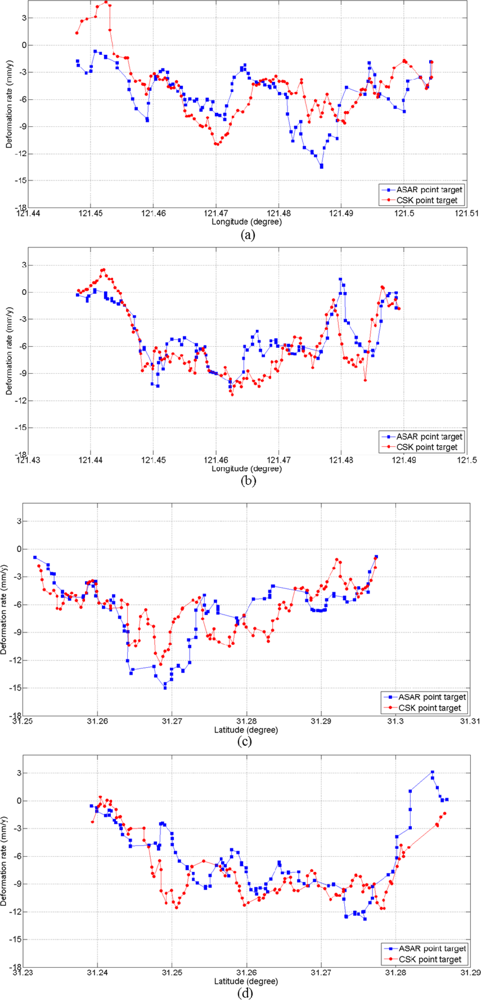
In the above section, the validation comparison of the mean subsidence rates with the spirit leveling measurements shows that both the ASAR and the CSK results are acceptable statistically. From Figure 4, we can see that the significant subsidence area is similar for both sensors. There is a significance subsidence funnel located in the junction place of the Yangpu and the Hongkou Districts. This obtained funnel area is similar to the significant ground subsidence area in [3]. Even they used an early set of SAR images (ERS-1/2 SAR images acquired 1993 through 2000). Thus, this area most likely has a long term ground subsidence trend. The maximum subsidence rates in our test area, approximately 20 mm/yr, are also identical to the results acquired with the same CSK images in [7]. However, they do not show the details. To compare the deformation estimates of the two different bands of radar sensors in more detail, we chose four profile lines across the subsidence funnel; see L1, L2, L3 and L4 in Figure 4. Along the chosen profiles, a searching window with the same size is applied to find the point targets closest to the profile for comparison. While the point targets inside the search window are more than one, their average value is used for comparing. The comparison results are shown in Figure 7. We can see that all four profiles reveal a relatively large subsidence along the lines and show a good agreement between the two sensors.
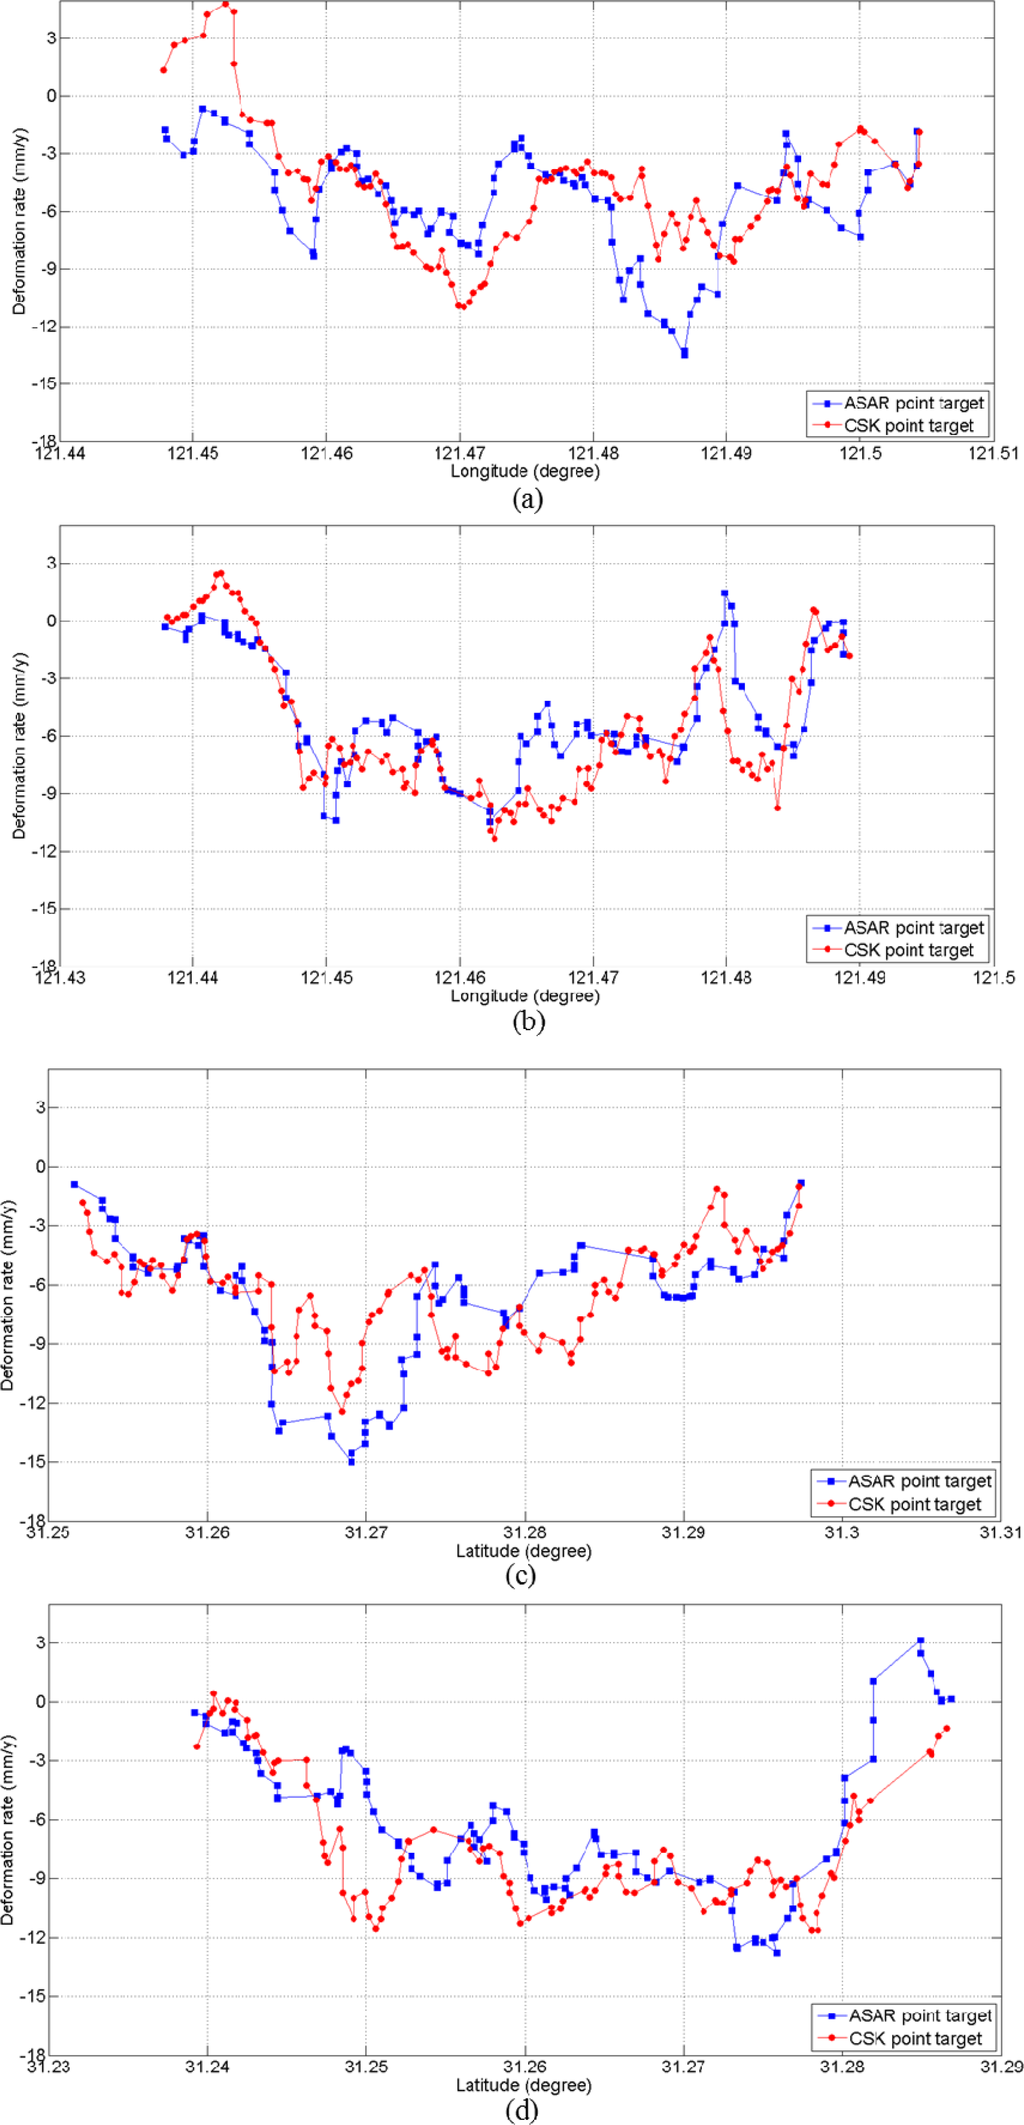
Figure 7.
Comparison of subsidence rates along the four chosen profiles. (a), (b), (c) and (d) corresponding to profile L1, L2, L3, and L4, respectively. The red dots denote subsidence rates of the CSK point targets, while the blue squares denote the ASAR point targets.
The root mean square error (RMSE) of the differences of the subsidence rates between the two sensors along the four chosen profiles is listed in Table 1. Overall the RMSE is approximately 3 mm/yr, which suggests that the vertical deformation rates by ASAR agree well with that by CSK SAR.

Table 1.
Root mean square error (RMSE) of the subsidence differences based on the four chosen profile lines.
As the spatial resolutions of the two sensors are different, ASAR is approximately 20 m × 5 m and CSK is approximately 2.5 m × 1.3 m, the spatial density of point targets is calculated in our MT-InSAR for comparison. For ASAR, this value is 500 point/km2, while for CSK it is 4,500 point/km2. This means that the high-resolution X-band CSK images offer a much higher density of point targets in the urban area. In addition to its short revisiting time period (8 days for CSK), CSK SAR can provide more details about the spatial and temporal distribution of the ground subsidence phenomena.
5. Conclusions
In this paper, the mean ground subsidence rates have been extracted using two different bands of SAR acquisitions, C-band ASAR and X-band CSK SAR. Both of them show a significant subsidence funnel located in the junction place of the Yangpu and the Hongkou Districts.
To ensure that the deformation rates by MT-InSAR are valid, a comparison of the ground subsidence rates of coherent point targets with the leveling measurements is implemented. Most of the differences between them are less than 3 mm/yr. A double tail t-test statistic is formulated, which demonstrates, with the significance level α = 0.02, that the results obtained by MT-InSAR are unbiased and reliable. An inter-comparison of the ground subsidence rates of the point targets using the two different bands of SAR images is also implemented. Along the chosen four profiles across the subsidence funnel, the differences of the point targets between the two sensors are calculated. All four profiles reveal a relatively large subsidence along the lines and show a good agreement between the two sensors. The root mean square error of the differences is also calculated, overall which is approximately 3 mm/yr.
However, the MT-InSAR of X-band CSK has a much higher point target density at the urban area. In addition to its shorter revisit period, X-band CSK SAR has a stronger ability to detect non-uniform ground subsidence both in space and time at the urban area.
Acknowledgments
This research is supported by the China National Science Foundation (No. 41074019). The Envisat ASAR data are supported by the European Space Agency Cat-1 project (CIP. 7351). Thanks goes to the Eastdown Company for providing the COSMO SAR data.
References
- Liu, Y.; Zhang, X.L.; Wan, G.F.; Han, Q.D. The situation of land subsidence within Shanghai in recent years and its countermeasure (in Chinese). Chinese J. Geol. Hazard Control 1998, 9, 13–17. [Google Scholar]
- Liu, Y. Preventive measures for land subsidence in Shanghai and their effects. Volcanol. Miner. Resour 2000, 21, 107–111. [Google Scholar]
- Wang, Y.; Liao, M.S.; Li, D.R.; Wei, Z.X.; Fang, Z. Subsidence velocity retrieval from long-term coherent targets in radar interferometric stacks (in Chinese). Chinese J. Geophys 2007, 50, 598–604. [Google Scholar]
- Liu, G.X.; Luo, X.J.; Chen, Q.; Huang, J.F.; Ding, X.L. Detecting land subsidence in Shanghai by PS-networking SAR interferometry. Sensors 2008, 8, 4725–4741. [Google Scholar]
- Luo, X.J.; Huang, D.F.; Liu, G.X. On urban ground subsidence detection based on PS-DInSAR: A case study for Shanghai (in Chinese). Bull. Surv. Mapp 2009, 4, 4–8. [Google Scholar]
- Damoah-Afari, P.; Ding, X.L.; Lu, Z.; Li, Z.W.; Makoto, O. Magnitude and Extent of Six Years of Land Subsidence in Shanghai Revealed by JERS-1 SAR Data. In Geoscience and Remote Sensing New Achievements; Pasquale, I., Daniele, R., Eds.; InTech: New York, NY, USA, 2010; pp. 477–496. [Google Scholar]
- Wang, Z.Y.; Perissin, D.; Lin, H. Subway Tunnels Identification through Cosmo-SkyMed PSInSAR Analysis in Shanghai. Processing of IEEE Geoscience and Remote Sensing Symposium 2011, Vancouver, BC, Canada, 24–29 July 2011; pp. 1267–1270.
- Leighton, J.M. Methodology and Results. GPS and PSI Integration for Monitoring Urban Land Motion, 2010; pp. 154–155. [Google Scholar]
- Bamler, R.; Hartl, P. Synthetic aperture radar interferometry. Inverse Probl 1998, 14, R1–R54. [Google Scholar]
- Gabriel, A.K.; Goldstein, R.M.; Zebker, H.A. Mapping small elevation changes over large areas: Differential radar interferometry. J. Geophys. Res 1989, 94, 9183–9191. [Google Scholar]
- Zebker, H.A.; Villaseno, J. Decorrelation in interferometric radar echoes. IEEE Trans. Geosci. Remote Sens 1992, 30, 950–959. [Google Scholar]
- Zebker, H.A.; Rosen, P.A.; Hensley, S. Atmospheric effects in interferometric synthetic aperture radar surface deformation and topographic maps. J. Geophys. Res 1997, 102, 7547–7563. [Google Scholar]
- Sanchez, P.; Mallorquí, J.J.; Duque, S.; Monells, D. The coherent pixels technique (CPT): An advanced DInSAR technique for nonlinear deformation monitoring. Pure Appl. Geophys 2008, 165, 1167–1194. [Google Scholar]
- Ferretti, A.; Prati, C.; Rocca, F. Permanent scatterers in SAR interferometry. IEEE Trans. Geosci. Remote Sens 2011, 39, 8–20. [Google Scholar]
- Berardino, P.; Fornaro, G.; Lanari, R. A new algorithm for surface deformation monitoring based on small baseline differential SAR interferograms. IEEE Trans. Geosci. Remote Sens 2002, 40, 2375–2383. [Google Scholar]
- Werner, C.; Wegmuller, U.; Strozzi, T.; Wiesmann, A. Interferometric Point Target Analysis for Deformation Mapping. Processing of IEEE Geoscience and Remote Sensing Symposium 2003, Toulouse, France, 21–25 July 2003; 7, pp. 4362–4364.
- Kampes, B. The STUN Algorithm. In Radar Interferometry: Persistent Scatterer Technique; Springer: Dordrecht, The Netherlands, 2006; pp. 47–48. [Google Scholar]
- Chen, Q.; Ding, X.L.; Liu, G.X. Method for optimum selection of common master acquisition for PS-DInSAR (in Chinese). Bull. Surv. Mapp 2007, 36, 395–399. [Google Scholar]
- Gamma Remote Sensing. GAMMA Interferometric Point Target Analysis: Users Guide. 2003; Gamma Remote Sensing: Gümligen, Switzerland, 2003. [Google Scholar]

