Abstract
Data disaggregation (or downscaling) is becoming a recognized modeling framework to improve the spatial resolution of available surface soil moisture satellite products. However, depending on the quality of the scale change modeling and on the uncertainty in its input data, disaggregation may improve or degrade soil moisture information at high resolution. Hence, defining a relevant metric for evaluating such methodologies is crucial before disaggregated data can be eventually used in fine-scale studies. In this paper, a new metric, named GDOWN, is proposed to assess the potential gain provided by disaggregation relative to the non-disaggregation case. The performance metric is tested during a four-year period by comparing 1-km resolution disaggregation based on physical and theoretical scale change (DISPATCH) data with the soil moisture measurements collected by six stations in central Morocco. DISPATCH data are obtained every 2–3 days from 40-km resolution SMOS (Soil Moisture Ocean Salinity) and 1-km resolution optical MODIS (Moderate Resolution Imaging Spectroradiometer) data. The correlation coefficient between GDOWN and the disaggregation gain in time series correlation, mean bias and bias in the slope of the linear fit ranges from 0.5 to 0.8. The new metric is found to be a good indicator of the overall performance of DISPATCH. Especially, the sign of GDOWN (positive in the case of effective disaggregation and negative in the opposite case) is independent of the uncertainties in SMOS data and of the representativeness of localized in situ measurements at the downscaling (1 km) resolution. In contrast, the traditional root mean square difference between disaggregation output and in situ measurements is poorly correlated (correlation coefficient of about 0.0) with the disaggregation gain in terms of both time series correlation and bias in the slope of the linear fit. The GDOWN approach is generic and thus could help test a range of downscaling methods dedicated to soil moisture and to other geophysical variables.1. Introduction
Since the advent of spaceborne microwave sensors in the late 1970s, various large-scale surface soil moisture products have been derived from C- and/or X-band data collected by the Scanning Multichannel Microwave Radiometer (SMMR) [1], followed by the Special Sensor Microwave/Imager (SSM/I) [2], Advanced Microwave Instrument (AMI) [3], Advanced Microwave Scanning Radiometer (AMSR) [4] and Advanced Scatterometer (ASCAT) [5], among others. More recently, the first space mission dedicated to observing surface soil moisture globally was launched in November, 2009 [6]. Soil Moisture and Ocean Salinity (SMOS) opens the path for L-band radiometers, with an improved sensitivity to soil moisture as compared with previous radiometers operating at higher frequencies, together with a decreased sensitivity to perturbing factors, such as vegetation optical depth and soil roughness. The forthcoming Soil Moisture Active Passive (SMAP) [7] mission is scheduled for launch in early 2015. It will ensure the continuity of L-band microwave data for global soil moisture monitoring.
The accuracy in surface soil moisture products available from space keeps improving. Nevertheless, the current spatial resolution of microwave radiometers and scatterometers is still lower than 40 km, which is very coarse for most hydrological and agricultural applications. In this context, a number of downscaling strategies of the surface soil moisture derived from microwave data have been imagined. They vary with respect to input ancillary data (e.g., optical data [8], radar data [9], topography and soil depth [10]), the nature (physical, semi-empirical, empirical) of scale change modeling and the underlying physical assumptions (i.e., how soil moisture is linked to available fine-scale modeled or observational information). It is worth noting that the principle of SMAP is based on the disaggregation of L-band brightness temperatures using higher resolution radar backscatter data [11].
A major effort has been and is still being undertaken to evaluate the uncertainty in various soil moisture products [12]. Yet, to date, little work has focused on the strategy to assess soil moisture downscaling methods. Table 1 lists some recently published disaggregation methods [11,13–26]. For each method, Table 1 reports the performance metrics that were used to assess the error statistics in downscaled data, whether such results were compared with those obtained at high resolution in the non-disaggregation case and the nature (spatial, temporal and/or spatio-temporal) of the comparison between disaggregated and reference (often in situ) measurements. One observes that most authors use the root mean square difference (RMSD) and correlation coefficient (R) between disaggregated soil moisture and reference measurements. The use of the mean bias (B) and the slope of the linear regression (S) between disaggregated soil moisture and reference measurements is less general. More strikingly, a 40% of the recent publications do not include a comparison of the error statistics obtained at high resolution with and without disaggregation, so that the gain provided at the fine scale by applying the disaggregation is difficult to assess quantitatively.

Evaluating specifically a soil moisture downscaling method is complex because of: (i) the impact (at multiple scales) of uncertainties in (multi-resolution) input data: and (ii) the possible non-representativeness of reference (in situ) measurements at the validation scale. The issue of validating downscaling methods is further compounded by the scarcity of spatialized ground data. Given that spatial disaggregation is primarily a spatial (not temporal) processing of data, the validation exercise should ideally be done at the time of satellite overpass by comparing disaggregated data with simultaneous distributed ground data. Due to the lack of spatial soil moisture data, disaggregation methods are most often evaluated against time series collected by localized permanent or semi-permanent automatic monitoring stations (see Table 1).
An interesting parallel is made with another adjacent research: the disaggregation of kilometric land surface temperature at hectometric resolution. One major discrepancy between surface soil moisture downscaling and land surface temperature downscaling is that the land surface temperature is currently observed at high-resolution by ASTER (Advanced Spaceborne Thermal Emission and Reflection Radiometer) and Landsat at approximately the same time as low-resolution MODIS (Moderate Resolution Imaging Spectroradiometer) temperature. Therefore, temperature downscaling methods can be evaluated in space using high-resolution ASTER/Landsat images [27–32]. Such a spatial validation is in general not feasible with soil moisture downscaling methods, except when using data collected over focused areas during short-term intensive field and/or airborne campaigns [33,34].
Facing the current lack of a consistent strategy to evaluate soil moisture downscaling methods using in situ time series, the objective of this paper is to propose and to assess various performance metrics in a case study. The approach is tested using a disaggregated soil moisture dataset and in situ measurement time series collected during the 2010–2013 period at six locations in the Haouz plain, central Morocco [35–38]. The downscaled dataset is obtained from the disaggregation of 40-km resolution SMOS soil moisture at 1-km resolution using MODIS data and DISPATCH (disaggregation based on physical and theoretical scale change; [17,18]) methodology. The evaluation of DISPATCH at 1-km resolution in central Morocco is especially challenging due to: (i) potentially strong topographic effects on MODIS temperature; and (ii) the presence of crop irrigation at a scale (typically 3–4 ha) much smaller than the target downscaling resolution. These conditions are however particularly suitable for our analysis, since DISPATCH is expected to cover a large range of performances with possible significant biases in the output data relative to in situ measurements. Note that the objective of the paper is not to demonstrate the applicability of DISPATCH in mountainous areas as this would require a robust approach to normalize MODIS land surface temperature for the combined effects of elevation and orientation, e.g., [39–41].
This paper is organized as follows. In Section 2, we provide a description of the study area, ground monitoring sites and DISPATCH data. Section 3 defines the metrics used to assess the performance of DISPATCH in various surface and atmospheric conditions. Section 4 presents the results obtained by conventional and new validation strategies and discusses the weaknesses and strengths of the tested performance metrics.
2. Site and Data Description
Our analysis is based on the comparison between a disaggregation dataset obtained from SMOS Level 3 product and the in situ soil moisture measurements collected in the Haouz plain (region of Marrakech, Central Morocco) during the 2010–2013 period.
2.1. Study Area
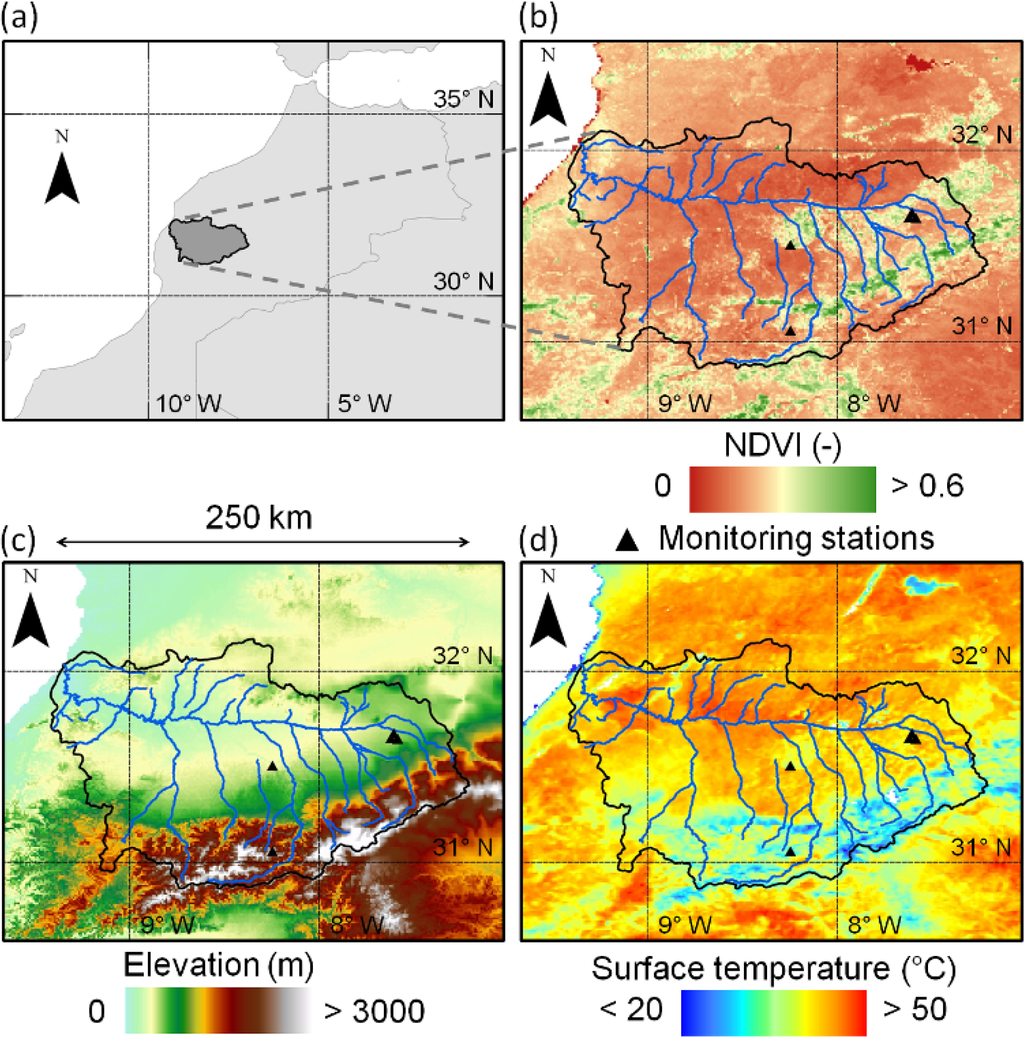
The study region is the Tensift basin located in central Morocco (see Figure 1). The ~20,000 km2 basin originates in the High-Atlas Mountains, and the Haouz River flows west towards the Atlantic Ocean through a semi-arid plain. Annual rainfall ranges from around 150 mm in the driest part of the plain to about 1,000 mm in the mountains, while annual evaporative demand in the plain is about 1,600 mm, according to the reference evapotranspiration calculated for well-watered grass [42]. The precipitation events mainly occur from November to April.
Within the Haouz plain, about 85% of available water is used for agriculture. Major irrigated vegetation types include olive, orange, apricot, beet and wheat. Wheat is generally sown between mid November and mid January, depending on climatic conditions and the start of the rainfall season, and the harvest occurs about 5–6 months after, in May or June. Ground water is used in priority for orchards, but can also be used for cereal in the case of a high shortage of dam water. Annual crops are periodically irrigated by flooding the entire field. The typical field size is about 3–4 ha. The number of irrigation rounds (0–6) and the global amount of water per round (generally more than 60 mm in equivalent-water depth) depend on the dam water levels [35].
The High-Atlas culminates up to 4,000 m above sea level at the Toubkal summit, only 60 km away from Marrakech city. The basin is hence characterized by a significant topographic and vegetation variation and a highly variable climate, making it an ideal test bed to evaluate soil moisture downscaling methods in heterogeneous, but challenging conditions.
2.2. In Situ Measurements
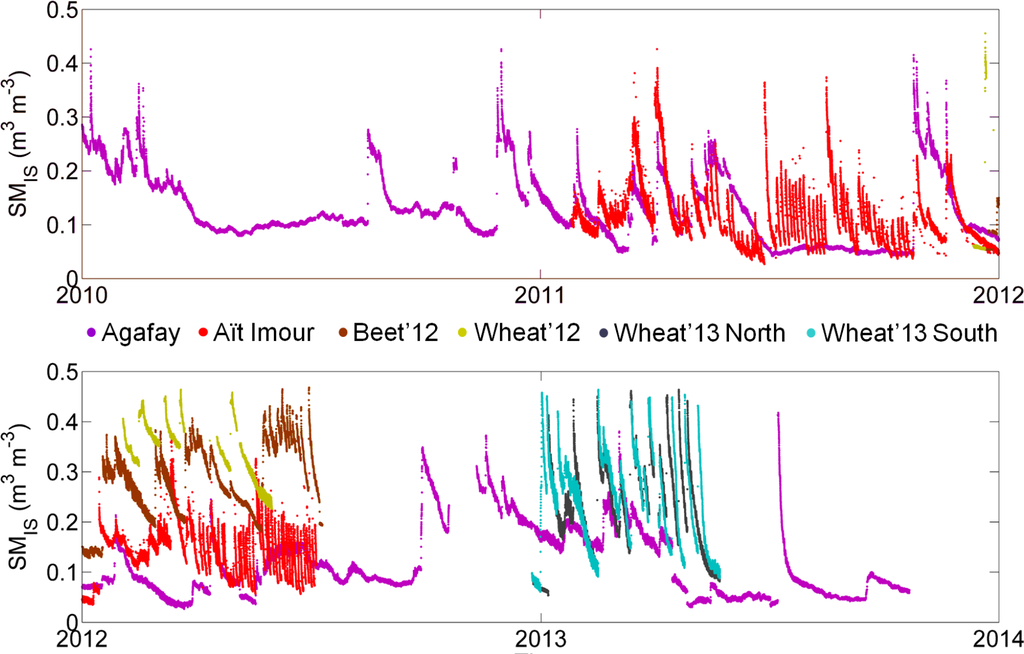
In the framework of the SudMedresearch program [37] and of Télédétection et Ressources en Eau en Méditerranée semi-Aride (TREMA) Joint International Laboratory, several flux and meteorological stations were deployed over the dominant vegetation types (olive, orange, apricot, beet and wheat) and under different irrigation methods (drip and flooding) with the objective to understand the processes that affect the water and energy balances of semi-arid areas at the basin scale. Monitoring stations were set up for several years at orchards sites and for the whole crop cycle (sowing, vegetative growth, full canopy and senescence) at annual crop (mostly wheat and beet) sites [37,38]. Since the SMOS launch in November 2009, six stations have operated with two in orchard fields and four in annual crop fields. The location and crop type of the six monitoring stations used in this paper are listed in Table 2. At each site, time domain reflectometry (TDR) probes (Model CS615; Campbell Scientific, Inc.) were installed in a soil pit near the flux tower to measure soil water content at different soil depths. Only the TDR measurements collected at a 5-cm depth with a time step of 30 min are used.
As gravimetric measurements from soil samples were not available for all studied sites, another calibration approach of TDR measurements was preferred. To transform TDR observations into volumetric soil moisture, the raw measurements were linearly re-scaled by setting the minimum and maximum value to the residual soil moisture and the soil moisture at saturation, respectively. The underlying assumption that both extreme values have been reached is justified by the relatively long monitoring duration (at least one whole agricultural season). For each site, the residual soil moisture and the soil moisture at saturation were estimated from the clay and sand fractions using the pedo-transfer functions in [43] and [44], respectively.
Figure 2 plots the time series of the calibrated near-surface soil moisture for each site separately. The impact of different irrigation practices and timing on soil moisture temporal dynamics is clearly visible, even for the Wheat’13Northand Wheat’13 South fields located only 100 m apart from each other.
2.3. Disaggregation Based on Physical and Theoretical Scale Change Data
2.3.1. Downscaling Method
The current version of the DISPATCH methodology has been fully described in [17] and [18]. In this section, we briefly present the downscaling relationship, which represents the core and theoretical basis of the algorithm:
The main complexity and probably the main source of uncertainty in DISPATCH is the estimation of SEEHR from red, near-infrared and land surface temperature input data. Readers are referred to [17] and [18] for a detailed description of the approach, especially the partitioning approach of land surface temperature into soil and vegetation temperatures and the modeling of SEE as a function of soil temperature. Note that in the last version of DISPATCH [18], the land surface temperature is “corrected” for elevation effects by assuming a constant lapse rate of 6 °C per km.
2.3.2. Input Data
In this study, the input data of DISPATCH are comprised of 0.25° gridded SMOS Level 3 soil moisture, 1-km resolution MODIS NDVI (Normalized Difference Vegetation Index) and land surface temperature and 1-km resolution DEM (digital elevation model) data.
The SMOS Level 3 one-day soil moisture global map (P11p or MIR_CLF31A/D) product is used. It is composed of two data files, one for the ascending (A) orbit at 6 a.m. equator crossing time and the other for the descending (D) orbit at 6 p.m. equator crossing time. These products are presented in NetCDFformat on the EASE (equal area scalable Earth) grid with a ~25-km cylindrical projection. Details on the processing algorithms can be found in the Algorithm Theoretical Baseline Document [45] and in the Level 3 data product description [46].
MODIS products Terra/MOD11A1 (daily land surface temperature at 10:30 a.m. Equator crossing time), Aqua/MYD11A1 (daily land surface temperature at 1:30 p.m. Equator crossing time) and Terra/MOD13A2 (16-day vegetation indices at 10:30 a.m. Equator crossing time) are used. All three MODIS products are presented in HDF format on a sinusoidal projection with a 1-km resolution. Figure 1 presents the 1-km resolution images over the study area of Terra NDVI and Aqua land surface temperature on 5 October 2013.
To correct land surface temperature for elevation effects, the GTOPO30 DEM is used. It has a 30-arc second (approximately 1 km) resolution and is split into 33 tiles stored in the USGS DEM file format. Figure 1 presents the 1-km resolution elevation image over the study area.
The DISPATCH Input Interface (DII) is a processor dedicated to downloading and pre-processing DISPATCH input data. DII downloads the SMOS Level 3 product from the CATDS (Centre Aval de Traitement des Données SMOS) and MODIS data through the USGS LP DAAC (Land Processes Distributed Active Archive Center). Pre-processing consists of: (i) reprojecting the exogenous datasets on a common grid with consistent spatial resolutions; (ii) extracting multi-source data over a given user-defined spatial extent; and (iii) generating an input ensemble for each SMOS overpass time by including the MODIS data acquired on the day before, the same day and the day after the SMOS overpass date [47].
2.3.3. Disaggregation Based on Physical and Theoretical Scale Change Products
In this paper, two different 1-km resolution DISPATCH products are used. One product, named sm1k3d, is obtained by setting SMP to SMLR/SEELR in Equation (3) by assuming a linear relationship (see Equation (2)) between SEE and SM [48]. Another product, named sm50k3, is obtained by setting SMP = 0 in Equation (3) so that 1-km disaggregated soil moisture is simply set to low-resolution observation. sm50k3 represents our “zero-hypothesis”, that is the non-disaggregation scenario.
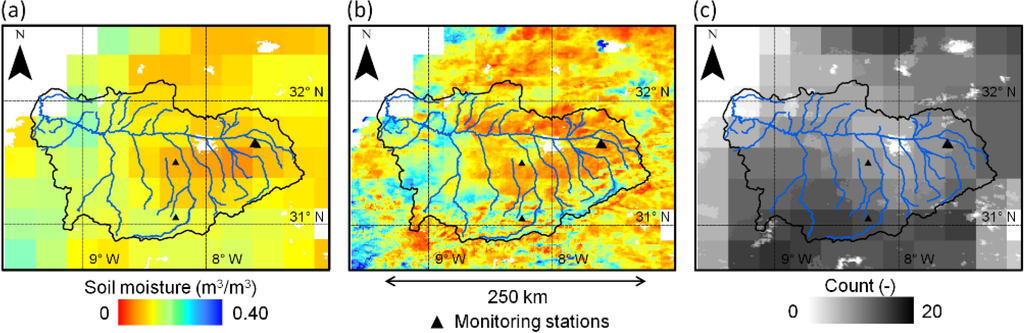
Both products, sm1k3d and sm50k3, are derived from the average of the DISPATCH output ensemble for each SMOS overpass time. An output ensemble is obtained by applying DISPATCH to an input ensemble composed of no more than 24 elements per (A and D) SMOS overpass associated with the combination of four SMOS re-sampling grids (by taking advantage of the Level 3 SMOS data oversampling), three MODIS overpass dates (by taking into account the MODIS data collected within plus or minus one day around the SMOS overpass) and two daily MODIS observations (aboard Terra and Aqua). The number of elements used to compute this average is called DISPATCH count and is stored in the output product. The DISPATCH count is often smaller than 24 due to gaps in MODIS data associated with cloud cover and/or to limited overlap with SMOS swath width. A description of DISPATCH products is available in [47]. Figure 3 presents an example of the 1-km resolution image over the study area of sm50k3, sm1k3d and the DISPATCH count on 6 October 2013 for the SMOS D overpass. Note that the disaggregation image presents a slight boxy artifact at low (SMOS) resolution. Such an artifact is typical of downscaling methods like DISPATCH that apply a conservation law at low resolution (meaning that the average of disaggregated SM at SMOS resolution is set to SMOS observation). In our case, several factors could possibly explain this effect, such as some uncorrected topographic effects and a significant nonlinear behavior of SEE as a function of SM (and an associated misestimate of SMP at low resolution).
Since sm50k3 contains basically the same information as the low-resolution observation, sm50k3 will be referred to as SMLR in the following. Consistently, sm1k3d will be referred to as SMHR.
3. Performance Metrics
3.1. Conventional Metrics
The traditional root mean square difference between satellite and in situ soil moisture is defined as:
To better characterize the quality of disaggregated data, two other performance metrics may be used in addition to RMSD and R: the mean difference (or mean bias) between satellite and in situ soil moisture:
The mean bias defined in Equation (6) is independent of R, as mentioned above, and is also independent of any bias in the variance. The slope of the linear regression defined in Equation (7) is independent of B, but depends on R. However, S and R provide complementary information, since for a given |RHR| value, |SHR| can range from zero to +∞ by varying σHR. Note that this reasoning is valid only when the time series correlation is significant. For R close to zero, S is necessarily bounded by the physical bounds of soil moisture, which ranges from about zero to the soil moisture at saturation.
3.2. On the Downscaling Performance
A downscaling method as a measurement system can be accurate, but not precise, precise, but not accurate, neither, or both. Eliminating a systematic error at LR (i.e., the mean bias) improves accuracy at HR, but does not change precision at HR. The precision of a downscaling algorithm is the degree to which repeated application under unchanged conditions shows the same downscaled value. In this paper, the terms “accuracy” and “precision” thus refer to B and R, respectively. However, one aspect is still missing to describe downscaling performance: a downscaling method can be precise (RHR ~ 1) and accurate (BHR ~ 0), but with varying efficiencies (downscaled values cover different ranges). In this paper, the term “efficiency” refers to S. Note that the σ could be used instead of S. The main problem is that σ is not an indicator of the efficiency of disaggregation. One can imagine a random noise having the same σHR as σIS, but with SHR ~ 0. The use of SHR is hence a better choice than σHR.
A systematic effect when increasing the observation scale is the decrease of spatio-temporal variance in the observed variable. As a result, from the point of view of the spatio-temporal variability in soil moisture and its impact on the validation strategy of satellite retrievals, the S between LR observation and a localized (in situ) measurement should be in any case lower than one. The main purpose of disaggregation methods is then to improve the spatial representativeness of remotely-sensed soil moisture at higher resolution. If the downscaling approach is efficient, then the S between satellite retrievals and in situ soil moisture should increase and be closer to one in the disaggregation case, relative to the non-disaggregation case. Among the four metrics RMSD, R, B and S, the S is probably the most appropriate metric to evaluate a downscaling methodology. Nevertheless, R, B and S are complementary, and thus, R and B potentially provide useful information in addition to S.
3.3. New Metrics Dedicated to Downscaling Methods
The performance metric proposed in this paper to assess soil moisture downscaling methods is termed GDOWN and is defined as:
The first term is the disaggregation (efficiency) gain on the bias in the slope of the linear fit relative to the non-disaggregation case:
The second term in Equation (8) is the disaggregation (precision) gain on time series correlation relative to the non-disaggregation case:
The third term is the disaggregation (accuracy) gain on the mean bias relative to the non-disaggregation case:
Note that Equation (8) could include weighting coefficients to weigh the three partial gains (GEFFI, GPREC and GACCU) differently. However, no a priori information is available to give priority to one particular partial gain. As a first guess, GDOWN is thus defined as the simple arithmetic average of all three partial gains.
Even though all three components (covariance, mean bias and bias in variance) are contained in the RMSD, the advantage of GDOWN over the RMSD is two-fold: (1) GDOWN is computed relatively to the non-disaggregation case, so it is better suited to relative comparisons; and (2) the relative nature of GDOWN makes it a priori much less sensitive than the RMSD to any bias in the mean or in the variance (the sensitivity of GDOWN to a given bias in mean or variance also depends on the respective weight of each partial gain). Moreover, the normalization of SHR, RHR and BHR (by SLR, RLR and BLR) is a way to significantly reduce the impact on the performance metric of: (1) uncertainties in LR data; and (2) the lack of representativeness of localized in situ measurements at the downscaling resolution. The absolute value of GDOWN characterizes both the downscaling performance and the (normalized) difference between the representativeness of in situ measurements at HR and LR. However, the positive (or negative) sign of GDOWN can be considered, statistically speaking, as independent of the representativeness of in situ measurements at both HR and LR.
As a benchmark to evaluate the approach, the last performance metric is also tested:
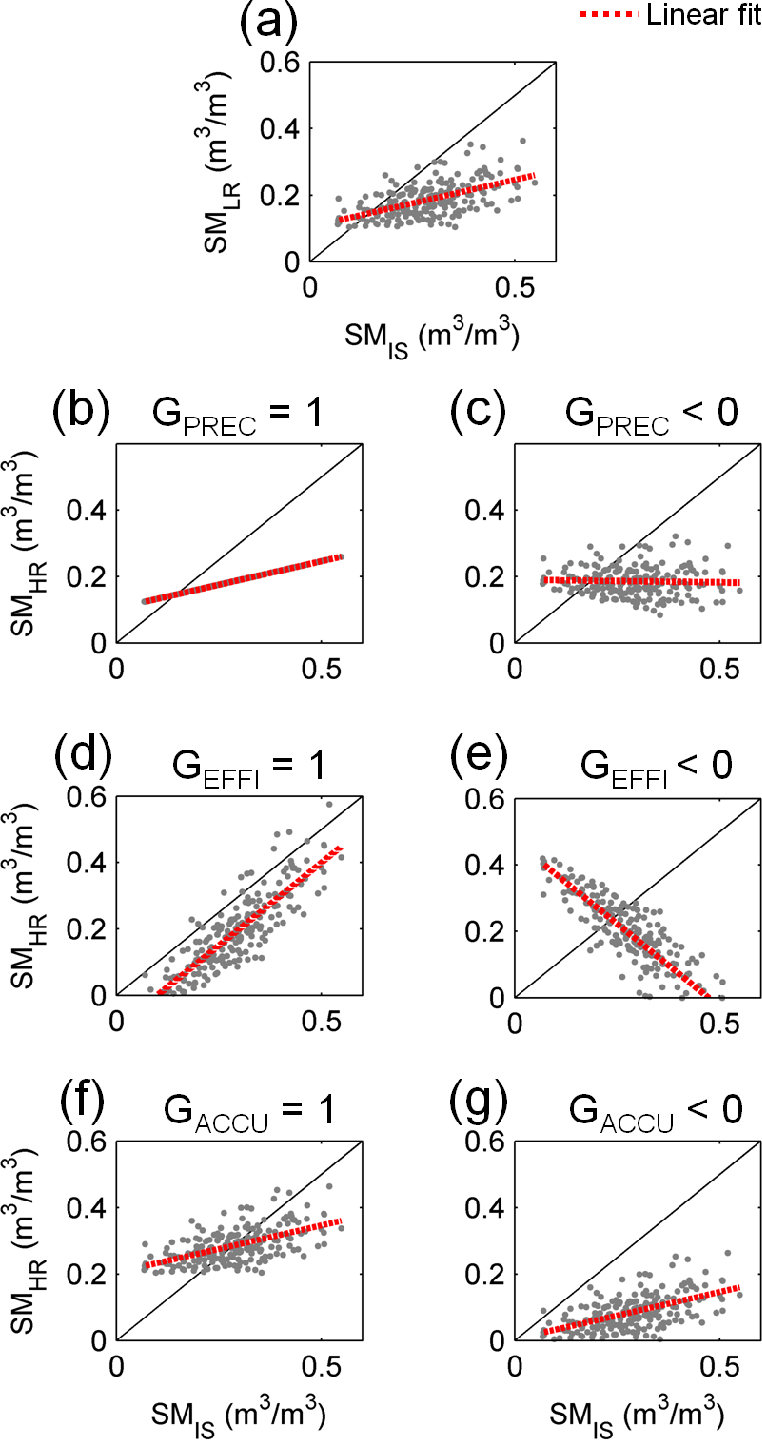
For illustration purposes, Figure 4 presents seven graphs: one graph (a) plotting (synthetic) LR observation vs. (synthetic) localized true soil moisture, and six other graphs (b–g) plotting (synthetic) HR disaggregated vs. (synthetic) localized true soil moisture for six disaggregation scenarios. In Case b, disaggregation improves R, and the S and B are unchanged. In Case c, disaggregation degrades both R and S, and B is unchanged. In Case d, disaggregation improves both S and R, and B is unchanged. In Case e, disaggregation degrades the S, while |R| and B remain the same as in Case d. In Case f, disaggregation improves B, while both S and R remain unchanged. In Case g, disaggregation degrades B, while both S and R remain unchanged. The above examples illustrate the capacity of the three performance metrics GPREC, GEFFI and GACCU to characterize the error structure of downscaled data and to specifically extract information about the positive (or negative) gain provided at HR by disaggregation.
4. Results and Discussion
In this section, the three performance metrics RMSDHR, GRMSD and GDOWN are assessed from an ensemble of DISPATCH and in situ soil moisture datasets. Such an ensemble is generated by comparing DISPATCH soil moisture with the in situ measurements collected by each of the six stations separately, for the two SMOS overpass times separately, for two different DISPATCH count thresholds and for five different time periods (spring, summer, autumn, winter and the whole time series). In total, the ensemble is theoretically composed of 6 × 2 × 2 × 5 = 120 elements. In practice, a lower number is achieved due to gaps in ground measurements, especially for the stations dedicated to intensive field experiments in 2012 and 2013.
Figure 5 compares the scatterplots of LR soil moisture (SMLR) vs. in situ measurements (SMIS) and HR disaggregated soil moisture (SMHR) vs. in situ measurements for each site separately. For orchard sites (Agafay and Aït Imour), disaggregation appears to reduce the mean bias in satellite retrievals, but also to increase the scatter/uncertainty with respect to in situ measurements. For annual crop sites (Beet’12, Wheat’12, Wheat’13 North and Wheat’13 South), a strong negative bias is visible in both non-disaggregated and disaggregated data, indicating that the soil moisture variability occurs at a scale significantly higher than the DISPATCH 1-km resolution. It is to be reminded that the typical size of crops in the area is 3–4 ha, that is 20–30-times smaller than the downscaling resolution of DISPATCH in this application. Nevertheless, DISPATCH data seem to be slightly less biased than non-disaggregated data. When increasing the DISPATCH count threshold from three to 10 (see the results in Figure 6), a similar interpretation can be given for all (orchard and annual crop) sites, with a more noticeable improvement of disaggregation in terms of both mean bias and slope of the linear regression between satellite retrievals and in situ measurements.
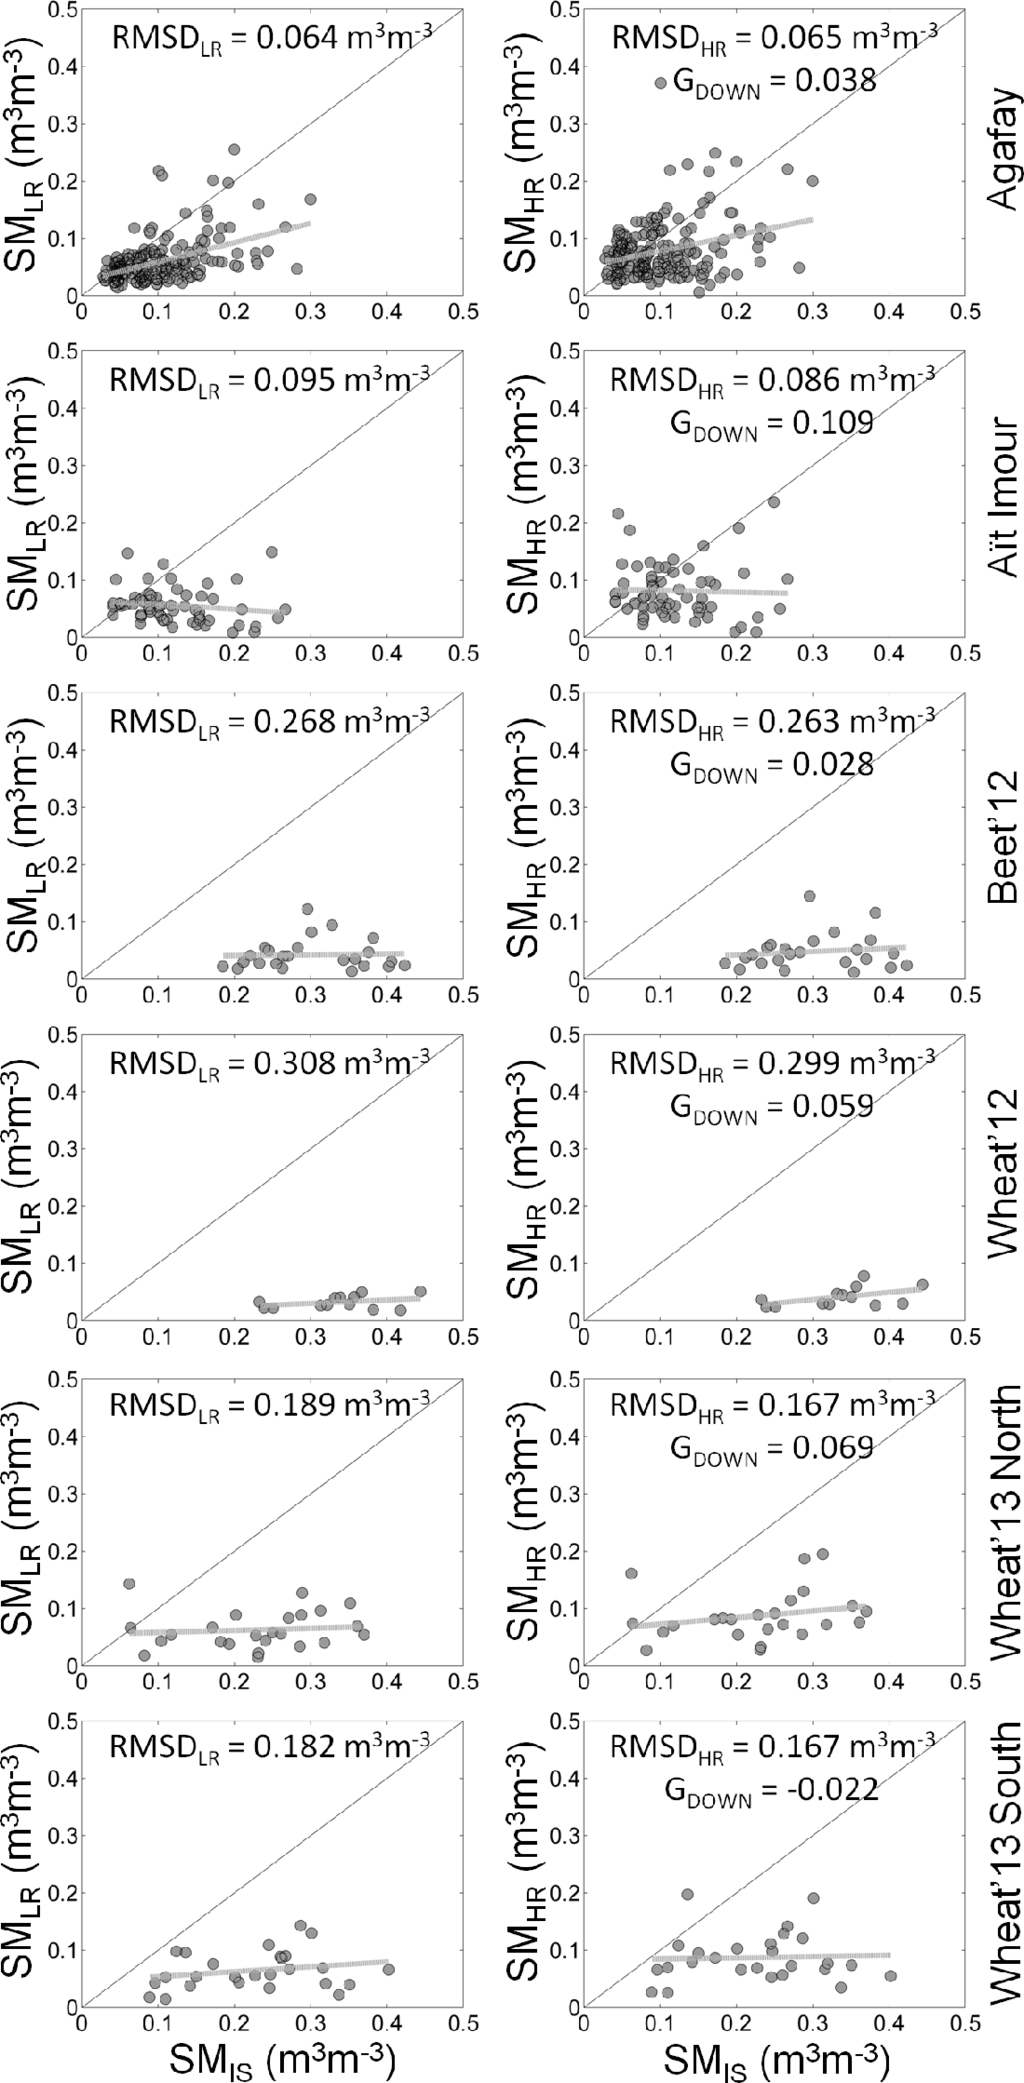
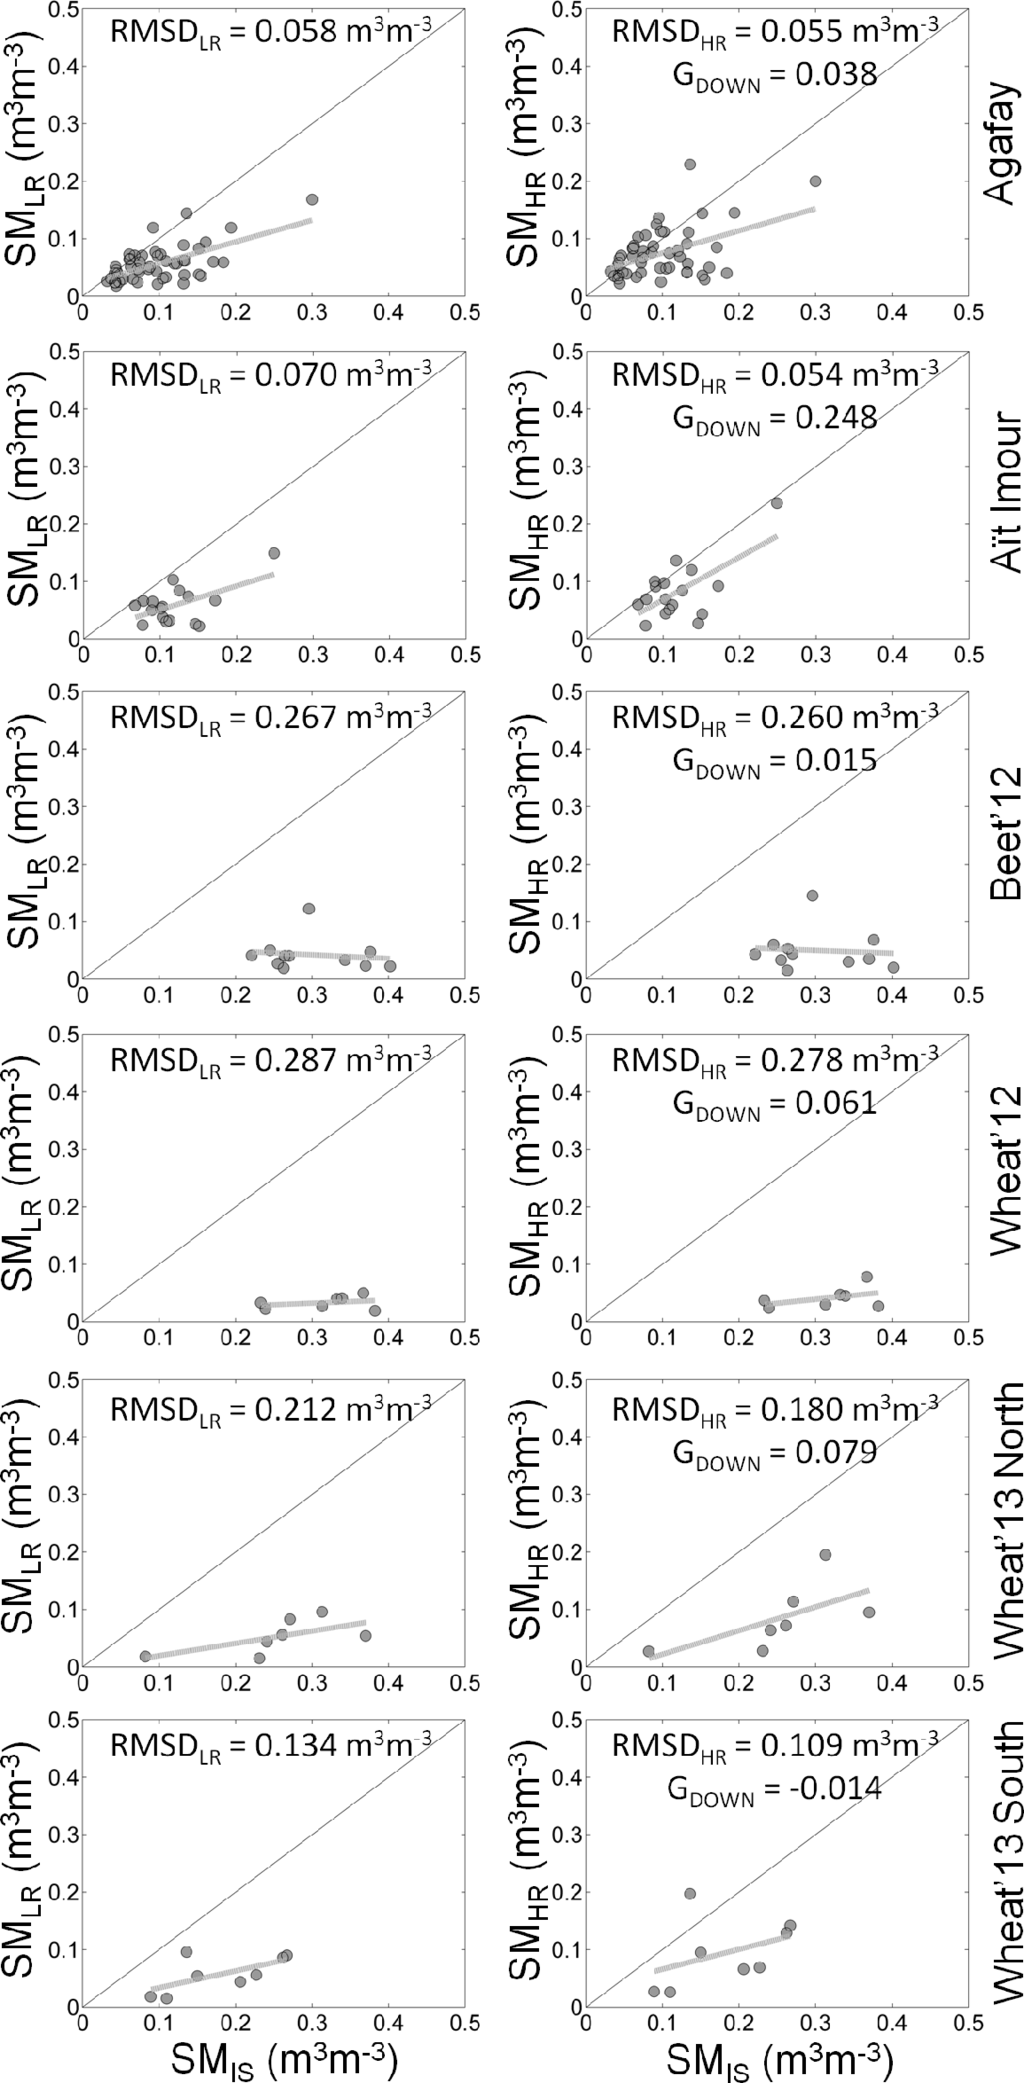
Table 3 reports the error statistics for each site (whole time series), for each SMOS orbit and for each DISPATCH count threshold (three and 10) separately. The count of samples included in the computation of performance metrics is also indicated as an assessment of statistical significance. It can be observed that disaggregation systematically reduces a negative bias in SMOS observations with respect to localized in situ measurements. Since all ground data were collected over irrigated areas surrounded by dry lands, a negative bias in coarse-scale SMOS data was expected. The reduction of the mean bias at 1-km resolution indicates that DISPATCH is able to somehow better represent (but not to fully solve) the sub-pixel variability in soil moisture. Consistent with a decrease of the mean bias, GACCU is positive in all cases. Regarding the time series correlation and the bias in the slope of the linear fit, mixed results are obtained: disaggregation alternatively improves or degrades data quality. Consistently, the disaggregation gain in precision (GPREC) and efficiency (GEFFI) is positive in 52% and 65% of the cases, respectively.
One key advantage of GDOWN over the other performance metrics is to provide an estimate of the overall improvement in soil moisture data with a single value. Within our data ensemble, GDOWN is positive in 74% of the cases, indicating that DISPATCH generally improves the representation of soil moisture at 1-km resolution. From the point of view of the GRMSD metric (defined in Equation (12)), disaggregation improves the root mean square difference between satellite retrievals and in situ soil moisture in 91% of the cases, which is significantly larger than the positive disaggregation cases predicted by GDOWN. This apparent discrepancy is explained by the strong dependency of the RMSD metric to B, thus hiding the potential impact of R and S on disaggregation data quality. Note that a mean bias can be typically attributed to uncertainties in LR observations and to a lack of spatial representativeness of (localized) in situ measurements at the validation scale (1-km resolution in our case). Hence, the use of other metrics than B and RMSD is especially needed when attempting to evaluate a downscaling method with a relative independency of errors in LR observations and of the spatial representativeness of reference validation data. As a summary, GDOWN provides a single quality assessment of disaggregated data while being based on three relevant and complementary performance metrics, which are S, R and B.
As a step further in the assessment of performance metrics, RMSDHR, GRMSD and GDOWN are plotted against GPREC, GEFFI and GACCU in Figures 7–9, respectively. RMSDHR is a poor indicator of the disaggregation gain in terms of both precision (time series correlation) and efficiency (bias in the slope of the linear fit). However, it is more correlated with the disaggregation gain on the mean bias, due to its strong dependency on B. GRMSD is in general positively correlated with all three performance metrics GPREC, GEFFI and GACCU. Nevertheless, it seems to be relatively sensitive to the number of samples within the dataset. When decreasing the minimum sample count (from 10 to three), above which error statistics are computed, the correlation between GRMSD and disaggregation gains varies significantly and even changes sign in Figure 8 for the GEFFI case. In contrast, GDOWN appears to be well correlated with all three disaggregation gains in terms of time series correlation, bias in the slope of the linear fit and mean bias. Moreover, GDOWN displays a remarkable stability with respect to the minimum number of data samples: the regression lines for both datasets (corresponding to a minimum sample count of three and 10) are almost superimposed in all cases.
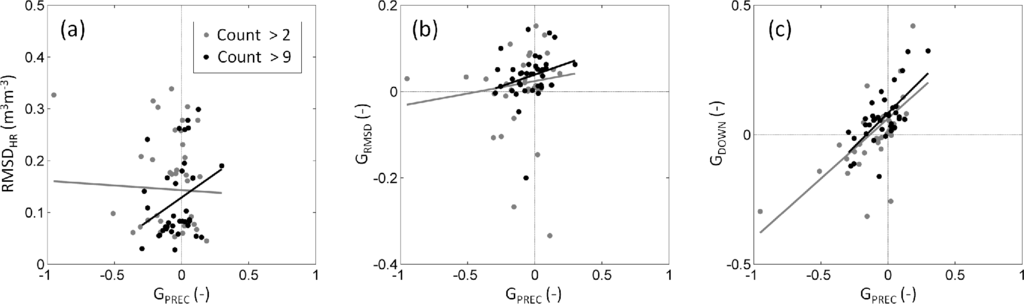
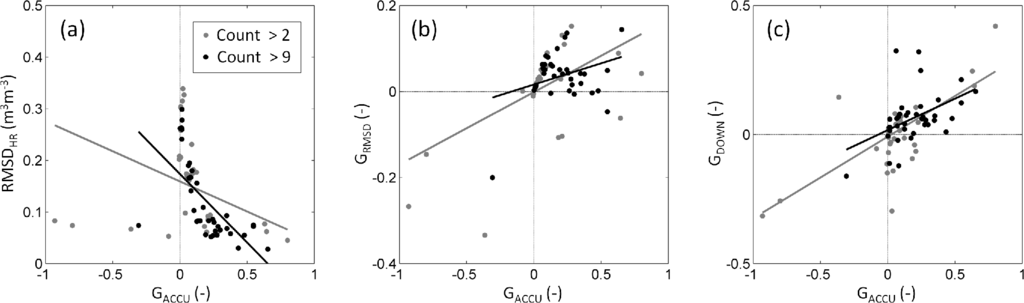
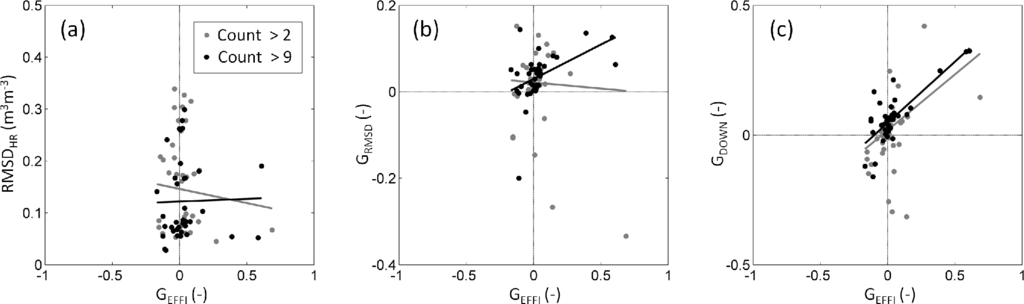
Table 4 summarizes the results for the three performance metrics: the traditional root mean square difference between disaggregated and in situ soil moisture (RMSDHR), the disaggregation gain in RMSD relative to the non-disaggregation case (GRMSD) and the proposed metric that combines the disaggregation gain in S, R and B relative to the non-disaggregation case (GDOWN). The correlation coefficient between performance metric and the disaggregation gain on time series correlation, mean bias and bias in the slope of the linear fit ranges from −0.6 to 0.3, from −0.1 to 0.6 and from 0.5 to 0.8, for RMSDHR, GRMSD and GDOWN, respectively. The results thus indicate that GDOWN is a relevant, relatively complete and robust performance metric to evaluate soil moisture downscaling methods using in situ measurement time series.
5. Summary and Conclusions
A number of disaggregation methods have been recently developed to improve the spatial resolution of available surface soil moisture products with supposedly satisfying uncertainty. Such downscaled soil moisture datasets are generally evaluated against time series of in situ measurements. However, a consistent and robust validation strategy of disaggregation methodologies is currently lacking. To help fill the gap, a new performance metric named GDOWN is proposed to quantitatively assess with a single value the overall gain achieved at high resolution. Especially, the sign of GDOWN (positive in the case of effective disaggregation and negative in the opposite case) is independent of the uncertainties in the low-resolution observation and of the representativeness of localized in situ measurements at the target downscaling resolution. The proposed GDOWN has four advantages over the conventional metrics (RMSD, B, σ, R and S): (1) the new performance metric provides an assessment of error statistics relative to the non-disaggregation case (unlike any of the traditional metrics); (2) it takes into account the three main aspects for describing data error structure, which are: R, B and σ (like the RMSD); (3) the sign of GDOWN (positive in the case of effective disaggregation, and negative in the opposite case) remains reliable in the presence of any bias in mean or variance (unlike the RMSD); and (4) the ability to define weights (arbitrarily set to one herein) allows for tuning the sensitivity of GDOWN to each of the three partial gains.
The approach is tested using 1-km resolution DISPATCH soil moisture data and in situ measurement time series collected during the 2010–2013 period at six locations in the Haouz plain, central Morocco. A statistically meaningful dataset ensemble is built by comparing DISPATCH and in situ data for each station separately, for both SMOS overpass times, for two different DISPATCH count thresholds and for five different time periods (spring, summer, autumn, winter and the whole time series). The traditional root mean square difference between disaggregated and in situ soil moisture (RMSDHR), the disaggregation gain in RMSD relative to the non-disaggregation case (GRMSD) and GDOWN are compared with the disaggregation gain at high resolution in terms of precision (time series correlation), efficiency (bias in the slope of the linear fit) and accuracy (mean bias). The correlation coefficient between performance metric and disaggregation gain ranges from −0.6 to 0.3, from −0.1 to 0.6 and from 0.5 to 0.8, for RMSDHR, GRMSD and GDOWN, respectively. The results indicate that the traditional RMSDHR is a poor indicator of the overall performance of disaggregation. In contrast, GDOWN is a relevant, relatively complete and robust performance metric to evaluate soil moisture downscaling methods using in situ measurement time series.
GDOWN evaluates the downscaling performance by a single value containing information about the relative gain in S, R and B, which may be considered as an asset. Nevertheless, the importance of these three aspects (gain in S, R and B) may be dependent on the application. Some users might need a very precise (i.e., low noise) measurement, whereas others might require, for instance, low mean bias. Therefore, it might be advantageous to keep the different partial gains separated. Note that one assumption of the presented validation strategy is that no bias correction (in either the mean or the variance) is applied to observed or disaggregated soil moisture datasets. If a bias correction is applied before hand [12,49], GDOWN should be expressed as the disaggregation gain in precision (R) only, by discarding the S and B terms, which would be underdetermined in this case. However, a caveat must be issued regarding bias correction. The bias correction of satellite-derived soil moisture products is generally based on soil moisture climatologies, which do not take into account all fine-scale variabilities (crop irrigation for instance) and/or localized in situ measurements, which are not representative at the observation resolution. In such conditions, part of the bias (in both the mean and the variance) between low-resolution observations and reference (climatological or in situ) soil moisture data is systematically attributed to the sub-pixel spatial heterogeneity. Any bias removal technique applied at low resolution therefore artificially compensates for spatial heterogeneity effects, whereas disaggregation precisely aims to represent the real sub-pixel spatial variability.
The GDOWN approach has potential for evaluating the downscaling methods dedicated to satellite-derived soil moisture, such as SMOS and SMAP products, and to other geophysical variables available from remote sensing, such as land surface temperature and precipitation. It can also be meaningful for evaluating the downscaled land surface model output [50–53]. Such a quantitative assessment is an essential pre-requisite before downscaled data can be efficiently used in fine-scale application studies. Note that the use of soil moisture data in hydrology generally requires observations deeper than the surface soil layer (the top few cm) sensed by microwave radiometers. Therefore, solving the mismatch in the vertical representation would imply the (temporal) assimilation of superficial data into land surface models, e.g., [49,54], and its combination with (spatial) downscaling [55,56].
Acknowledgments
This study was supported by TREMA (Télédétection et Ressources en Eau en Méditerranée semi-Aride) international laboratory, IRD (Institut de Recherche pour le Développement), CNRS (Centre National de la Recherche Scientifique), MISTRALS (Mediterranean Integrated Studies at Regional and Local Scales)/SICMEDMETASIMand ANR (Agence Nationale de la Recherche) MIXMOD-EANR-13-JS06-0003-01 funding.
Author Contributions
Olivier Merlin produced the DISPATCH dataset over the Haouz plain and proposed the performance metrics. Yoann Malbéteau helped on the pre- and post-processing of DISPATCH data. Youness Notfi undertook the calibration of ground measurements. Stefan Bacon developed the first version of DISPATCH Input Interface. Salah Er-Raki, Saïd Khabba and Lionel Jarlan supervised the collection and processing of in situ measurements and helped interpret the results.
Conflicts of Interest
The authors declare no conflict of interest.
References
- Owe, M.; de Jeu, R.; Walker, J. A methodology for surface soil moisture and vegetation optical depth retrieval using the microwave polarization difference index. IEEE Trans. Geosci. Remote Sens. 2001, 39, 1643–1654. [Google Scholar]
- Paloscia, S.; Macelloni, G.; Santi, E.; Koike, T. A multifrequency algorithm for the retrieval of soil moisture on a large scale using microwave data from SMMR and SSM/I satellites. IEEE Trans. Geosci Remote Sens. 2001, 39, 1655–1661. [Google Scholar]
- Wagner, W.; Lemoine, G.; Rott, H. A method for estimating soil moisture from ERS scatterometer and soil data. Remote Sens. Environ. 1999, 70, 191–207. [Google Scholar]
- Njoku, E.; Jackson, T.; Lakshmi, V.; Chan, T.; Nghiem, S. Soil moisture retrieval from AMSR-E. IEEE Trans. Geosci. Remote Sens. 2003, 41, 215–229. [Google Scholar]
- Naeimi, V.; Scipal, K.; Bartalis, Z.; Hasenauer, S.; Wagner, W. An improved soil moisture retrieval algorithm for ERS and METOP scatterometer observations. IEEE Trans. Geosci. Remote Sens. 2009, 47, 1999–2013. [Google Scholar]
- Kerr, Y.H.; Waldteufel, P.; Wigneron, J.P.; Delwart, S.; Cabot, F.; Boutin, J.; Escorihuela, M.J.; Font, J.; Reul, N.; Gruhier, C.; et al. The SMOS mission: new tool for monitoring key elements of the global water cycle. Proc. IEEE 2010, 98, 666–687. [Google Scholar]
- Entekhabi, D.; Njoku, E.G.; O’Neill, P.E.; Kellogg, K.H.; Crow, W.T.; Edelstein, W.N.; Entin, J.K.; Goodman, S.D.; Jackson, T.J.; Johnson, J.; et al. The Soil Moisture Active Passive (SMAP) mission. Proc. IEEE 2010, 98, 704–716. [Google Scholar]
- Chauhan, N.S.; Miller, S.; Ardanuy, P. Spaceborne soil moisture estimation at high resolution: A microwave-optical/IR synergistic approach. Int. J. Remote Sens. 2003, 24, 4599–4622. [Google Scholar]
- Bindlish, R.; Barros, A.P. Subpixel variability of remotely sensed soil moisture: An inter-comparison study of SAR and ESTAR. IEEE Trans. Geosci. Remote Sens. 2002, 40, 326–337. [Google Scholar]
- Pellenq, J.; Kalma, J.; Boulet, G.; Saulnier, G.M.; Wooldridge, S.; Kerr, Y.; Chehbouni, A. A disaggregation scheme for soil moisture based on topography and soil depth. J. Hydrol. 2003, 276, 112–127. [Google Scholar]
- Das, N.N.; Entekhabi, D.; Njoku, E.G.; Shi, J.J.C.; Johnson, J.T.; Colliander, A. Tests of the SMAP combined radar and radiometer algorithm using airborne field campaign observations and simulated data. IEEE Trans. Geosci. Remote Sens. 2014, 52, 2018–2028. [Google Scholar]
- Entekhabi, D.; Reichle, R.H.; Koster, R.D.; Crow, W.T. Performance metrics for soil moisture retrievals and application requirements. J. Hydrometeor. 2010, 11, 832–840. [Google Scholar]
- Choi, M.; Hur, Y. A microwave-optical/infrared disaggregation for improving spatial representation of soil moisture using AMSR-E and MODIS products. Remote Sens. Environ. 2012, 124, 259–269. [Google Scholar]
- Fang, B.; Lakshmi, V.; Bindlish, R.; Jackson, T.J.; Cosh, M.; Basara, J. Passive microwave soil moisture downscaling using vegetation index and skin surface temperature. Vadose Zone J 2013, 12. [Google Scholar] [CrossRef]
- Ines, A.V.M.; Mohanty, B.P.; Shin, Y. An unmixing algorithm for remotely sensed soil moisture. Water Resour. Res. 2013, 49, 408–425. [Google Scholar]
- Kim, J.; Hogue, T.S. Improving spatial soil moisture representation through integration of AMSR-E and MODIS products. IEEE Trans. Geosci. Remote Sens. 2012, 50, 446–460. [Google Scholar]
- Merlin, O.; Rüdiger, C.; Al Bitar, A.; Richaume, P.; Walker, J.; Kerr, Y. Disaggregation of SMOS soil moisture in southeastern Australia. IEEE Trans. Geosci. Remote Sens. 2012, 50, 1556–1571. [Google Scholar]
- Merlin, O.; Escorihuela, M.J.; Mayoral, M.A.; Hagolle, O.; Al Bitar, A.; Kerr, Y. Self-calibrated evaporation-based disaggregation of SMOS soil moisture: an evaluation study at 3 km and 100 m resolution in Catalunya, Spain. Remote Sens. Environ. 2013, 130, 25–38. [Google Scholar]
- Parinussa, R.; Yilmaz, M.; Anderson, M.; Hain, C.; de Jeu, R. An intercomparison of remotely sensed soil moisture products at various spatial scales over the Iberian Peninsula. Hydrol. Process. 2013, 130. [Google Scholar] [CrossRef]
- Piles, M.; Camps, A.; Vall-llossera, M.; Corbella, I.; Panciera, R.; Rüdiger, C.; Kerr, Y.H.; Walker, J.P. Downscaling SMOS-derived soil moisture using MODIS visible/infrared data. IEEE Trans. Geosci. Remote Sens. 2011, 49, 3156–3165. [Google Scholar]
- Sánchez-Ruiz, S.; Piles, M.; N. Sánchez, J.M.; Vall-llossera, M.; Camps, A. Combining SMOS with visible and near/shortwave/thermal infrared satellite data for high resolution soil moisture estimates. J. Hydrol. 2014, 516, 273–283. [Google Scholar]
- Shin, Y.; Mohanty, B.P. Development of a deterministic downscaling algorithm for remote sensing soil moisture footprint using soil and vegetation classifications. Water Resour. Res. 2013, 49, 6208–6228. [Google Scholar]
- Song, C.; Jia, L.; Menenti, M. Retrieving righ-resolution surface soil moisture by downscaling AMSR-E brightness temperature using MODIS LST and NDVI data. IEEE J. Select Top. Appl. Earth Obs. Remote Sens. 2014, 7, 935–942. [Google Scholar]
- Srivastava, P.K.; Han, D.; Rico-Ramirez, M.A.; Al-Shrafany, D.; Islam, T. Data fusion techniques for improving soil moisture deficit using SMOS satellite and WRF-NOAH land surface model. Water Resour. Manag. 2013, 27, 5069–5087. [Google Scholar]
- Srivastava, P.K.; Han, D.; Ramirez, M.R.; Islam, T. Machine learning techniques for downscaling SMOS satellite soil moisture using MODIS land surface Temperature for Hydrological Application. Water Resour. Manag. 2013, 27, 3127–3144. [Google Scholar]
- Zhao, W.; Li, A. A downscaling method for improving the spatial resolution of AMSR-E derived soil moisture product based on MSG-SEVIRI data. Remote Sens. 2013, 5, 6790–6811. [Google Scholar]
- Merlin, O.; Jacob, F.; Wigneron, J.P.; Walker, J.; Chehbouni, G. Multi-dimensional disaggregation of land surface temperature using high-resolution red, near-infrared, shortwave-infrared and microwave-L bands. IEEE Trans. Geosci. Remote Sens. 2012, 50, 1864–1880. [Google Scholar]
- Agam, N.; Kustas, W.P.; Anderson, M.C.; Li, F.; Neale, C.M.U. A vegetation index based technique for spatial sharpening of thermal imagery. Remote Sens. Environ. 2007, 107, 545–558. [Google Scholar]
- Bindhu, V.; Narasimhan, B.; Sudheer, K. Development and verification of a non-linear disaggregation method (NL-DisTrad) to downscale MODIS land surface temperature to the spatial scale of Landsat thermal data to estimate evapotranspiration. Remote Sens. Environ. 2013, 135, 118–129. [Google Scholar]
- Mechri, R.; Ottlé, C.; Pannekoucke, O.; Kallel, A. Genetic particle filter application to land surface temperature downscaling. J. Geophys. Res.: Atmos. 2014, 119, 2131–2146. [Google Scholar] [CrossRef]
- Merlin, O.; Duchemin, B.; Hagolle, O.; Jacob, F.; Coudert, B.; Chehbouni, G.; Dedieu, G.; Garatuza, J.; Kerr, Y. Disaggregation of MODIS surface temperature over an agricultural area using a time series of Formosat-2 Images. Remote Sens. Environ. 2010, 114, 2500–2512. [Google Scholar] [CrossRef]
- Zhan, W.; Chen, Y.; Zhou, J.; Wang, J.; Liu, W.; Voogt, J.; Zhu, X.; Quan, J.; Li, J. Disaggregation of remotely sensed land surface temperature: Literature survey, taxonomy, issues, and caveats. Remote Sens. Environ. 2013, 131, 119–139. [Google Scholar] [CrossRef]
- Merlin, O.; Walker, J.P.; Kalma, J.D.; Kim, E.J.; Hacker, J.; Panciera, R.; Young, R.; Summerell, G.; Hornbuckle, J.; Hafeez, M.; Jackson, T.J. The NAFE’06 data set: towards soil moisture retrieval at intermediate resolution. Adv. Water Resour. 2008, 31, 1444–1455. [Google Scholar]
- Peischl, S.; Walker, J.P.; Rüdiger, C.; Ye, N.; Kerr, Y.H.; Kim, E.; Bandara, R.; Allahmoradi, M. The AACES field experiments: SMOS calibration and validation across the Murrumbidgee River catchment. Hydrol. Earth Syst. Sci. 2012, 16, 1697–1708. [Google Scholar]
- Duchemin, B.; Hadria, R.; Er-Raki, S.; Boulet, G.; Maisongrande, P.; Chehbouni, A.; Escadafal, R.; Ezzahar, J.; Hoedjes, J.; Kharrou, M.; et al. Monitoring wheat phenology and irrigation in central Morocco: on the use of relationships between evapotranspiration, crops coefficients, leaf area index and remotely-sensed vegetation indices. Agr. Water Manag. 2006, 79, 1–27. [Google Scholar]
- Er-Raki, S.; Chehbouni, A.; Guemouria, N.; Duchemin, B.; Ezzahar, J.; Hadria, R. Combining FAO-56 model and ground-based remote sensing to estimate water consumptions of wheat crops in a semi-arid region. Agr. Water Manag. 2007, 87, 41–54. [Google Scholar]
- Chehbouni, A.; Escadafal, R.; Duchemin, B.; Boulet, G.; Simonneaux, V.; Dedieu, G.; Mougenot, B.; Khabba, S.; Kharrou, H.; Maisongrande, P.; et al. An integrated modelling and remote sensing approach for hydrological study in arid and semi-arid regions: the SUDMED Programme. Int. J. Remote Sens. 2008, 29, 5161–5181. [Google Scholar]
- Khabba, S.; Jarlan, L.; Er-Raki, S.; Page, M.L.; Ezzahar, J.; Boulet, G.; Simonneaux, V.; Kharrou, M.H.; Hanich, L.; Chehbouni, G. The SudMed program and the Joint International Laboratory TREMA: A decade of water transfer study in the Soil-Plant-Atmosphere system over irrigated crops in semi-arid area. Proced. Environ. Sci. 2013, 19, 524–533. [Google Scholar]
- Hassan, Q.K.; Bourque, C.P.A.; Meng, F.R.; Cox, R.M. A wetness index using terrain-corrected surface temperature and Normalized Difference Vegetation Index derived from standard MODIS products: an evaluation of its use in a humid forest-dominated region of eastern Canada. Sensors 2007, 7, 2028–2048. [Google Scholar]
- Hais, M.; Kucerab, T. The influence of topography on the forest surface temperature retrieved from Landsat TM, ETM + and ASTER thermal channels. ISPRS J. Photogramm. Remote Sens. 2009, 64, 585–591. [Google Scholar]
- Van doninck, J.; Peters, J.; de Baets, B.; de Clercq, E.M.; Ducheyne, E.; Verhoest, N.E.C. Influence of topographic normalization on the vegetation index-surface temperature relationship. J. Appl. Remote Sens. 2012, 6. [Google Scholar] [CrossRef]
- Allen, R.G.; Pereira, L.S.; Raes, D.; Smith, M. Crop Evapotranspiration—Guidelines for Computing Crop Water Requirements; FAO Irrigation and Drainage Paper 56; FAO: Rome, Italy, 1998. [Google Scholar]
- Brisson, N.; Perrier, A. A semiempirical model of bare soil evaporation for crop simulation models. Water Resour. Res. 1991, 7, 719–727. [Google Scholar]
- Cosby, B.J.; Hornberger, G.M.; Clapp, R.B.; Ginn, T.R. A statistical exploration of the relationships of soil moisture characteristics to the physical properties of soils. Water Resour. Res. 1984, 20. [Google Scholar] [CrossRef]
- Kerr, Y.; Jacquette, E.; al Bitar, A.; Cabot, F.; Mialon, A.; Richaume, P.; Quesney, A.; Berthon, L. CATDS SMOS L3 Soil Moisture Retrieval Processor: Algorithm Theoretical Baseline Document (ATBD); CESBIO: Toulouse, France, 2013. [Google Scholar]
- Berthon, L.; Mialon, A.; Cabot, F.; al Bitar, A.; Richaume, P.; Kerr, Y.; Leroux, D.; Bircher, S.; Lawrence, H.; Quesney, A.; et al. CATDS Level 3 Data Product Description—Soil Moisture and Brightness Temperature Part; CESBIO: Toulouse, France, 2012. [Google Scholar]
- Malbéteau, Y.; Merlin, O.; Molero, B.; Rüdiger, C.; Bacon, S. DISPATCH as a tool for improving validation strategies of coarse-scale remotely sensed soil moisture: Application to SMOS and AMSR-E data in Southeastern Australia. Int. J. Appl. Earth Obs. GeoInf. 2015. sudmitted. [Google Scholar]
- Budyko, M.I. Heat Balance of the Earth’s Surface; Gidrometeoizdat: Leningrad, Russia, 1956; p. 255. [Google Scholar]
- Reichle, R.H.; Koster, R.D.; Liu, P.; Mahanama, S.P.P.; Njoku, E.G.; Owe, M. Comparison and assimilation of global soil moisture retrievals from the Advanced Microwave Scanning Radiometer for the Earth Observing System (AMSR-E) and the Scanning Multichannel Microwave Radiometer (SMMR). J. Geophys. Res. 2007, 112. [Google Scholar] [CrossRef]
- Long, D.; Scanlon, B.R.; Longuevergne, L.; Sun, A.Y.; Fernando, D.N.; Himanshu, S. GRACE satellite monitoring of large depletion in water storage in response to the 2011 drought in Texas. Geophys. Res. Lett. 2013, 40, 3395–3401. [Google Scholar]
- Long, D.; Longuevergne, L.; Scanlon, B.R. Uncertainty in evapotranspiration from land surface modeling, remote sensing, and GRACE satellites. Water Resour. Res. 2014, 50, 1131–1151. [Google Scholar] [CrossRef]
- Xia, Y.; Mitchell, K.; Ek, M.; Sheffield, J.; Cosgrove, B.; Wood, E.; Luo, L.; Alonge, C.; Wei, H.; Meng, J.; et al. Continental-scale water and energy flux analysis and validation for the North American Land Data Assimilation System project phase 2 (NLDAS-2): 1. Intercomparison and application of model products. J. Geophys. Res.: Atmos. 2012, 117. [Google Scholar] [CrossRef]
- Xia, Y.; Mitchell, K.; Ek, M.; Cosgrove, B.; Sheffield, J.; Luo, L.; Alonge, C.; Wei, H.; Meng, J.; Livneh, B.; et al. Continental-scale water and energy flux analysis and validation for North American Land Data Assimilation System project phase 2 (NLDAS-2): 2. Validation of model-simulated streamflow. J. Geophys. Res.: Atmos. 2012, 117. [Google Scholar] [CrossRef]
- Sabater, J.M.; Jarlan, L.; Calvet, J.C.; Bouyssel, F.; de Rosnay, P. From near-surface to root-zone soil moisture using different assimilation techniques. J. Hydrometeor. 2007, 8, 194–206. [Google Scholar] [CrossRef]
- Merlin, O.; Chehbouni, G.; Boulet, G.; Kerr, Y. Assimilation of disaggregated microwave soil moisture into a hydrologic model using coarse-scale meterological data. J. Hydrometeor. 2006, 7, 1308–1322. [Google Scholar]
- Bandara, R.; Walker, J.P.; Rüdiger, C.; Merlin, O. Towards soil property retrieval from space: An application with disaggregated satellite observations. J. Hydrol. 2015. [Google Scholar] [CrossRef]
© 2015 by the authors; licensee MDPI, Basel, Switzerland This article is an open access article distributed under the terms and conditions of the Creative Commons Attribution license (http://creativecommons.org/licenses/by/4.0/).