
Taste Sensitivity of Elderly People Is Associated with Quality of Life and Inadequate Dietary Intake


Abstract
1. Introduction
2. Materials and Methods
2.1. Study Participants
2.2. Data Collection
2.2.1. General Characteristics and Health-Related Behaviors Questionnaire
2.2.2. QOL Assessment
2.2.3. Food Intake and Nutrient Intake Questionnaire
2.3. Taste Threshold Test
2.4. Statistical Analysis
3. Results
3.1. Comparison of Characteristics between the Young Adult and Elderly Participants
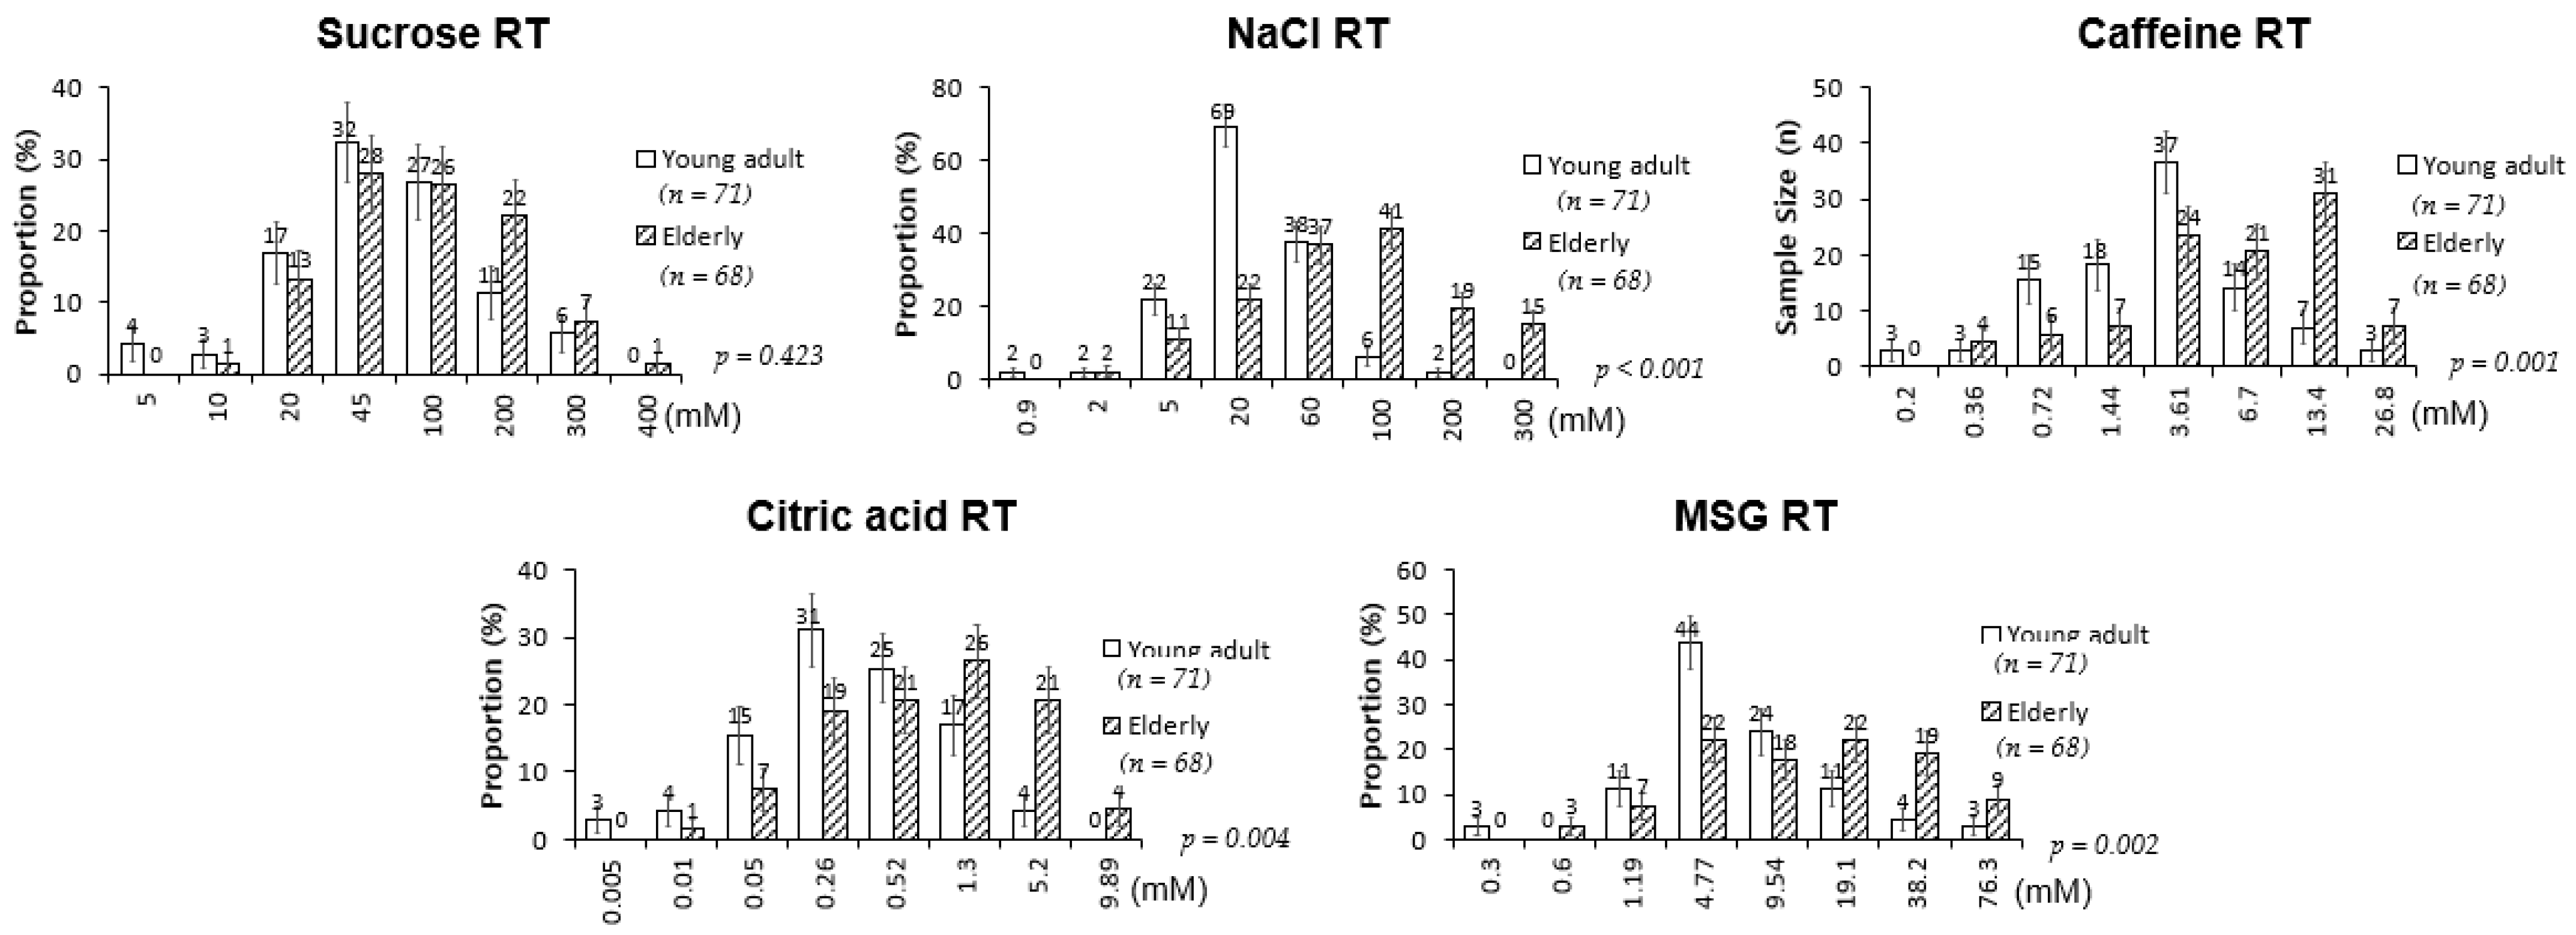
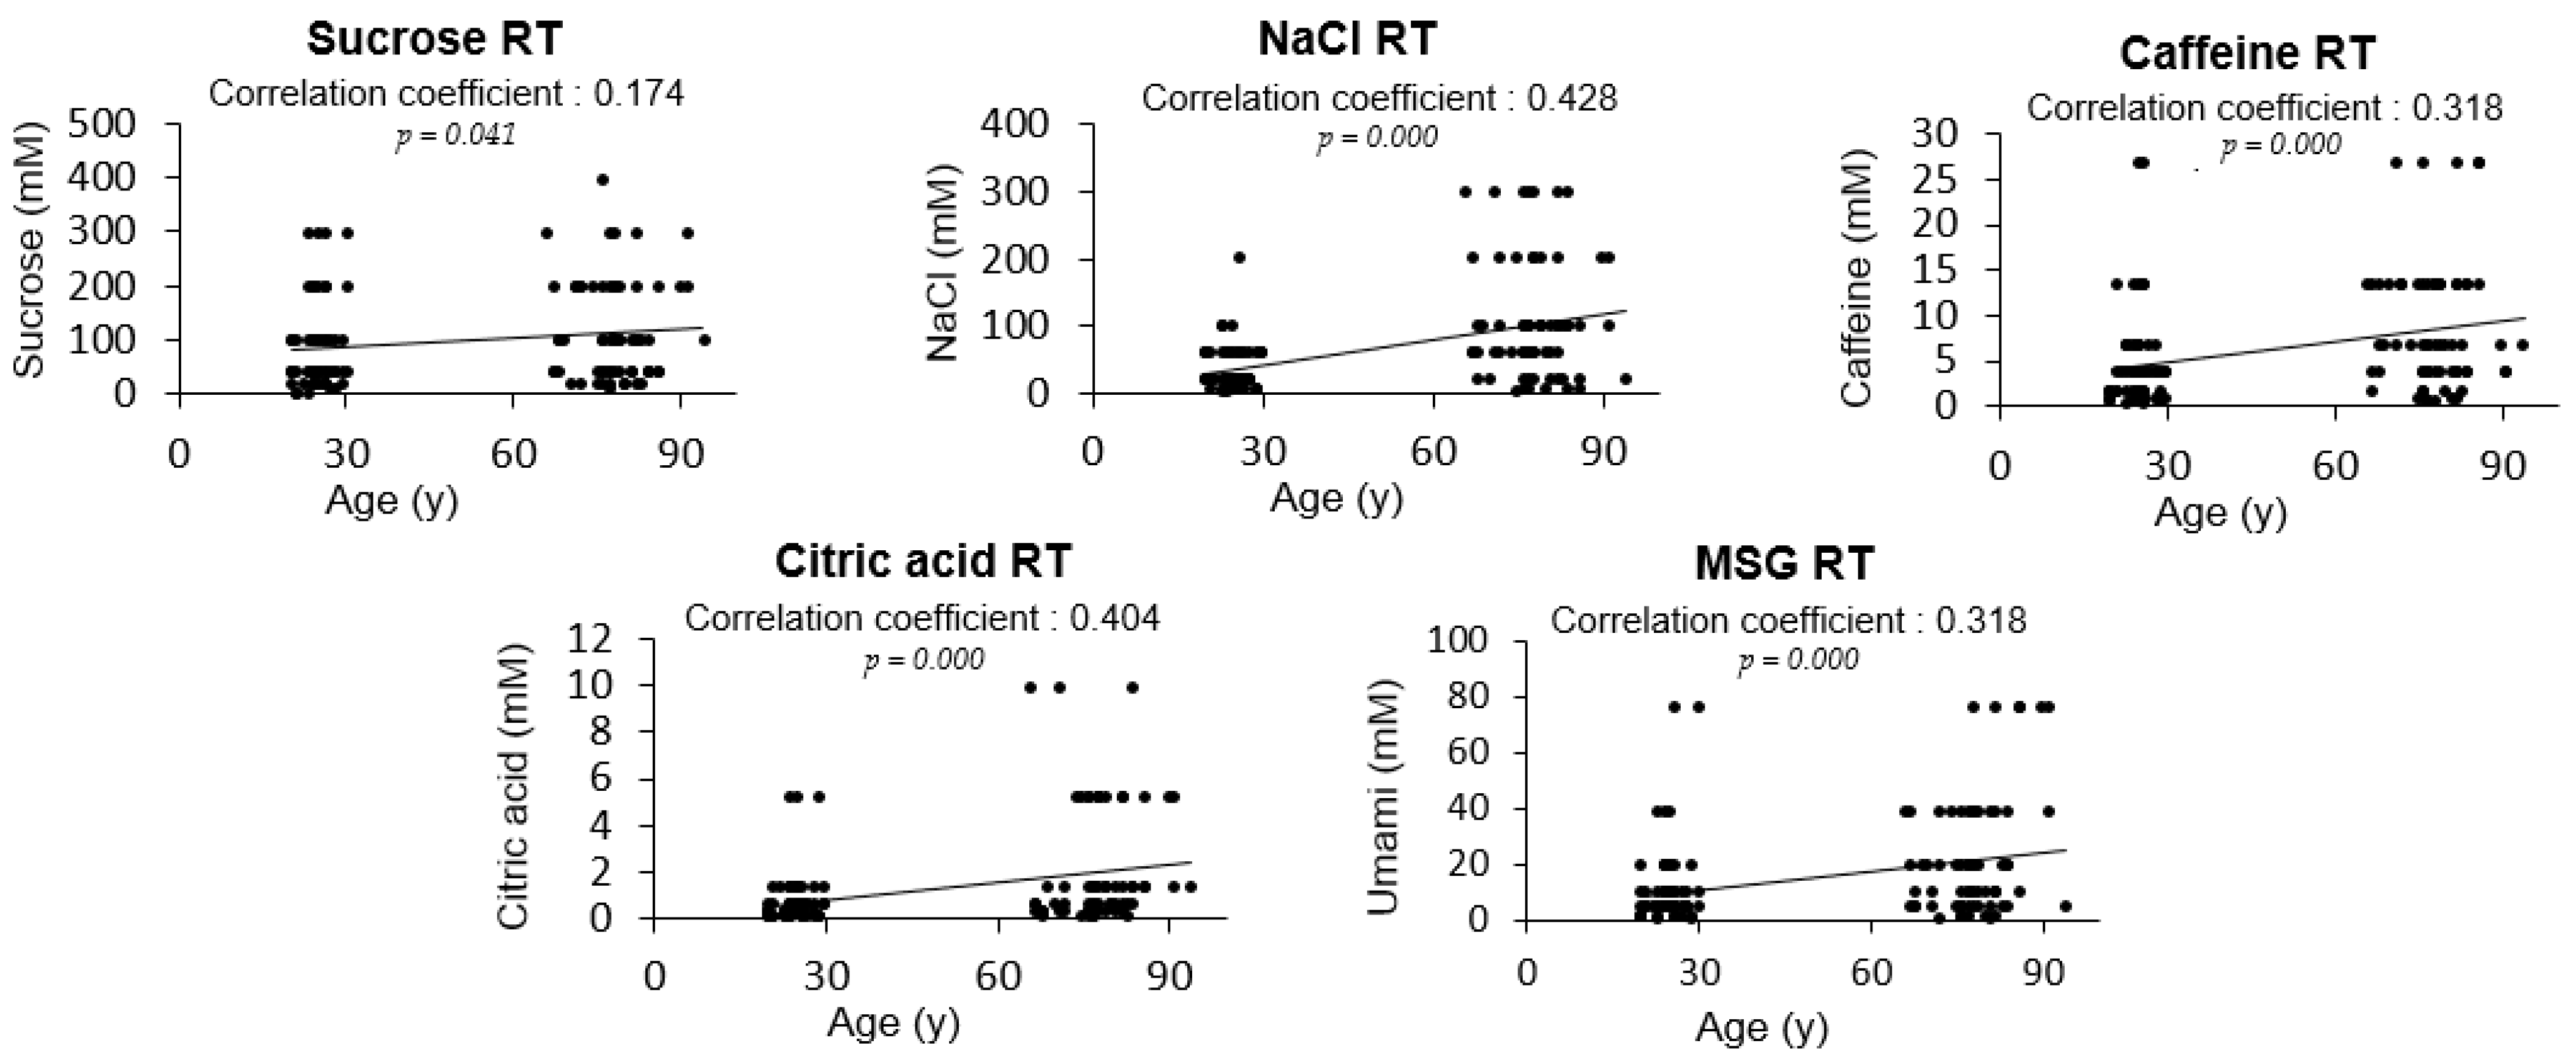
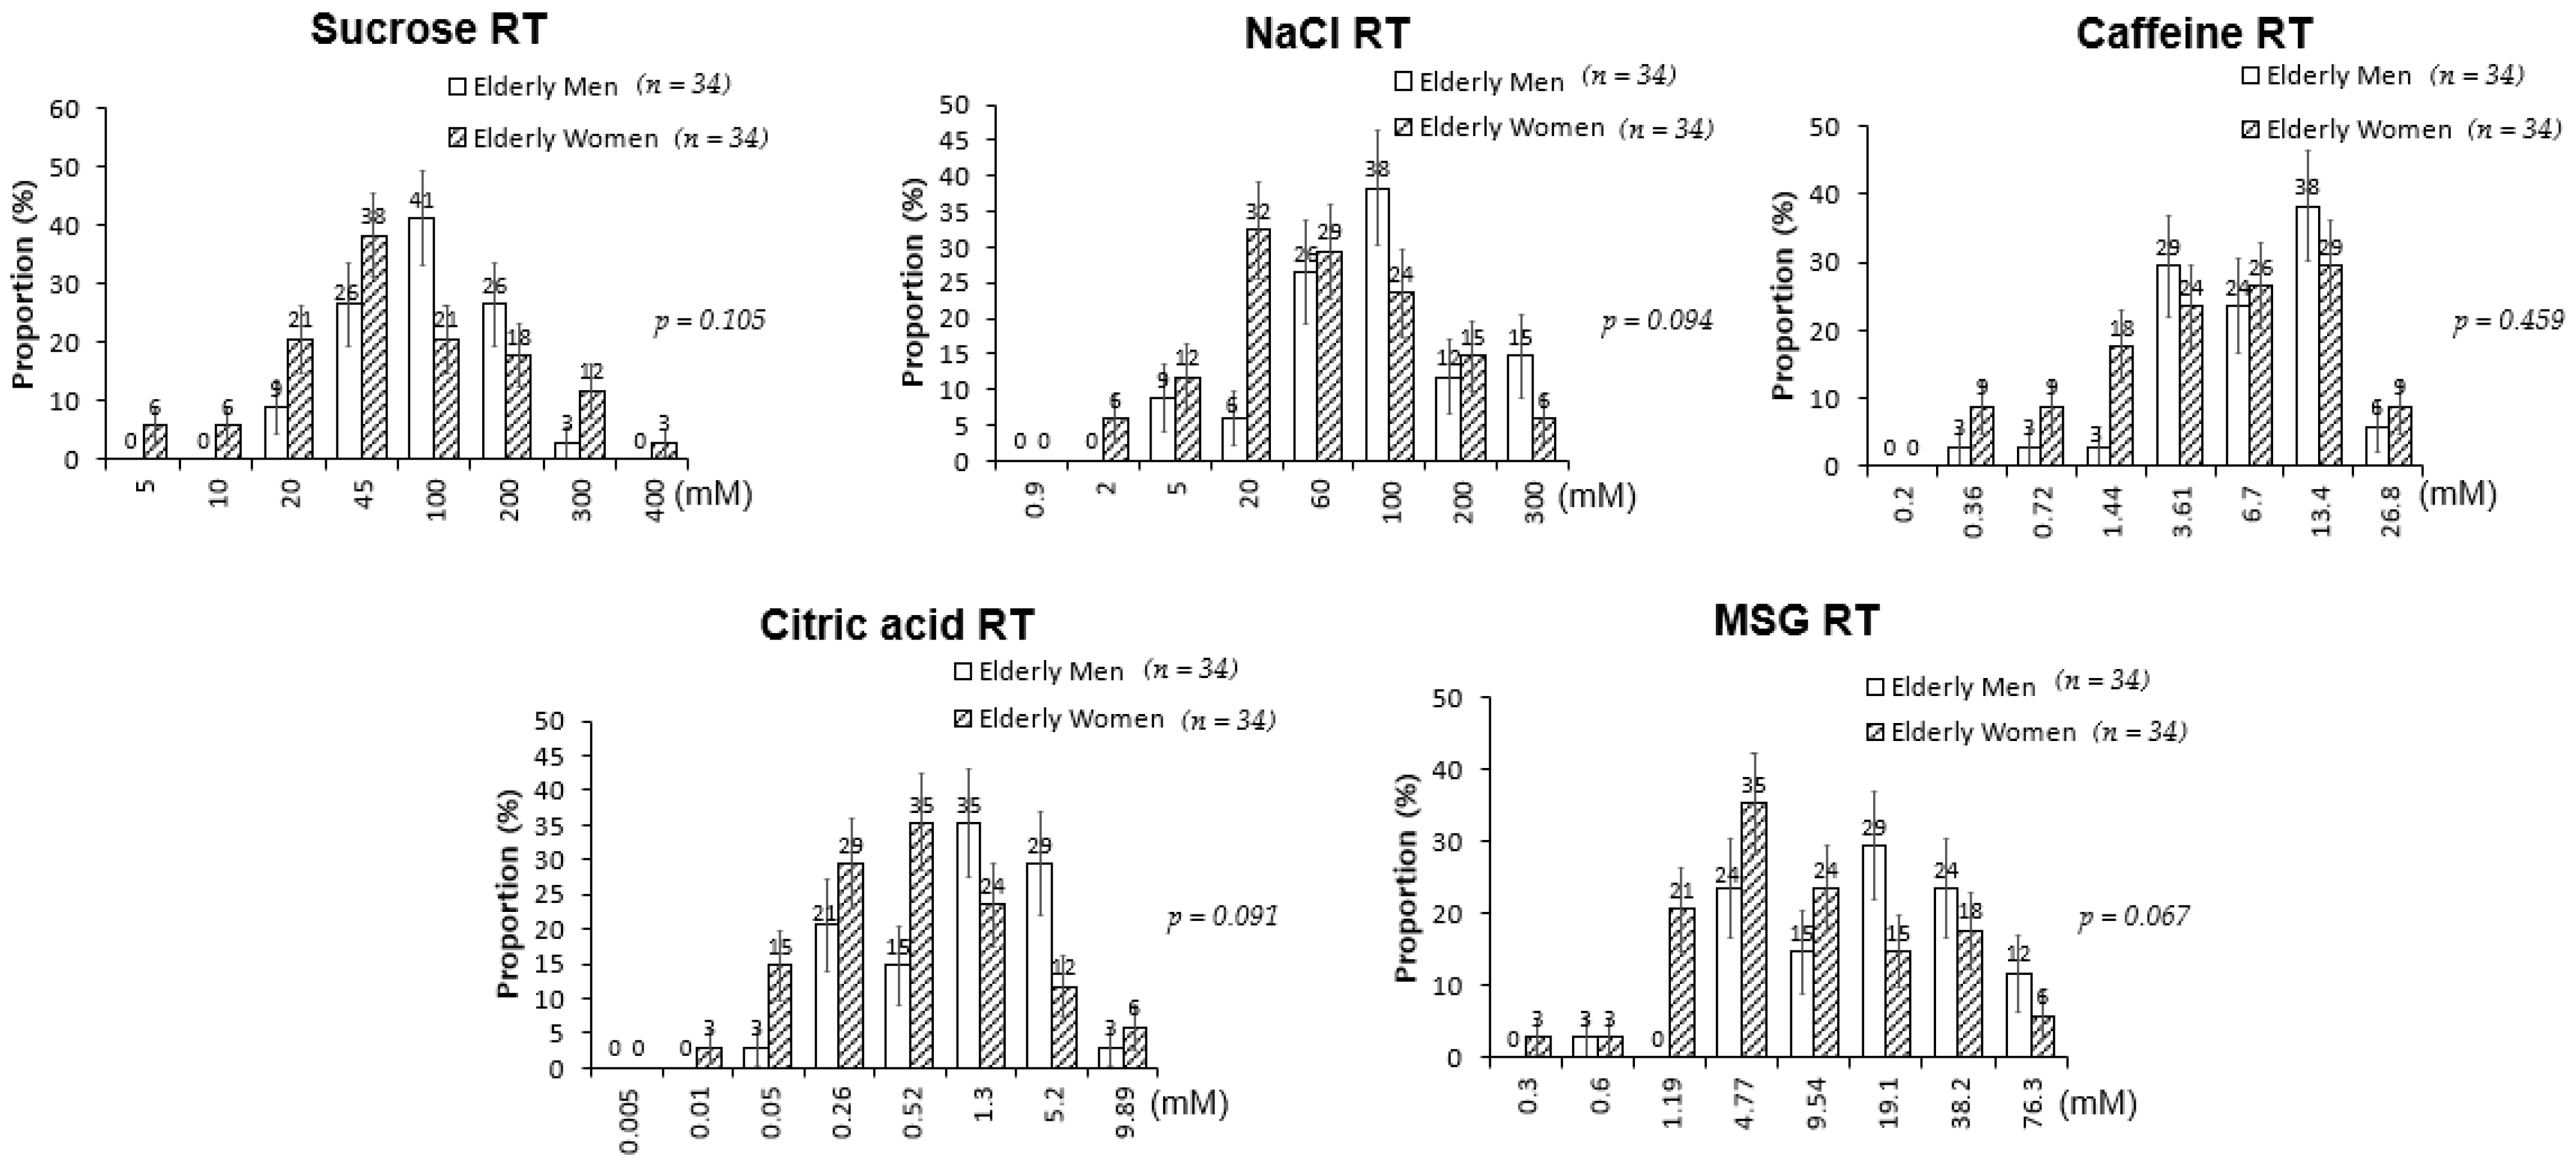
3.2. Comparison of Taste Thresholds between the Young Adults and the Elderly Participants
3.3. Assessment of Dietary Intake in the Elderly Participants
3.4. Correlation between Taste Thresholds and Nutrient Intake in the Elderly Participants
3.5. Investigation through Non-Nutritional Factors Affecting Taste Thresholds in the Elderly Participants
4. Discussion
Supplementary Materials
Author Contributions
Funding
Institutional Review Board Statement
Informed Consent Statement
Acknowledgments
Conflicts of Interest
References
- Ranabhat, C.L.; Atkinson, J.; Park, M.-B.; Kim, C.-B.; Jakovljevic, M. The Influence of Universal Health Coverage on Life Expectancy at Birth (LEAB) and Healthy Life Expectancy (HALE): A Multi-Country Cross-Sectional Study. Front. Pharmacol. 2018, 9. [Google Scholar] [CrossRef]
- Arai, H.; Ouchi, Y.; Toba, K.; Endo, T.; Shimokado, K.; Tsubota, K.; Matsuo, S.; Mori, H.; Yumura, W.; Yokode, M. Japan as the front-runner of super-aged societies: Perspectives from medicine and medical care in Japan. Geriatr. Gerontol. Int. 2015, 15, 673–687. [Google Scholar] [CrossRef] [PubMed]
- Donini, L.M.; Savina, C.; Cannella, C. Eating Habits and Appetite Control in the Elderly: The Anorexia of Aging. Int. Psychogeriatr. 2003, 15, 73–87. [Google Scholar] [CrossRef] [PubMed]
- Mattes, R.D. The chemical senses and nutrition in aging: Challenging old assumptions. J. Acad. Nutr. Diet. 2002, 102, 192. [Google Scholar] [CrossRef]
- Schiffman, S.S.; Graham, B.G. Taste and smell perception affect appetite and immunity in the elderly. Eur. J. Clin. Nutr. 2000, 54, S54. [Google Scholar] [CrossRef]
- Schiffman, S.S. Taste and smell losses in normal aging and disease. JAMA 1997, 278, 1357–1362. [Google Scholar] [CrossRef] [PubMed]
- Shin, Y.-K.; Cong, W.-n.; Cai, H.; Kim, W.; Maudsley, S.; Egan, J.M.; Martin, B. Age-related changes in mouse taste bud morphology, hormone expression, and taste responsivity. J. Gerontol. A Biol. Sci. Med. Sci. 2012, 67, 336–344. [Google Scholar] [CrossRef] [PubMed]
- Ng, K.; Woo, J.; Kwan, M.; Sea, M.; Wang, A.; Lo, R.; Chan, A.; Henry, C.J.K. Effect of age and disease on taste perception. J. Pain Symptom Manag. 2004, 28, 28–34. [Google Scholar] [CrossRef]
- Leal, S.C.; Bittar, J.; Portugal, A.; Falcao, D.P.; Faber, J.; Zanotta, P. Medication in elderly people: Its influence on salivary pattern, signs and symptoms of dry mouth. Gerodontology 2010, 27, 129–133. [Google Scholar] [CrossRef] [PubMed]
- Schiffman, S.S. Effects of aging on the human taste system. Ann. N. Y. Acad. Sci. 2009, 1170, 725–729. [Google Scholar] [CrossRef] [PubMed]
- Loesche, W.; Bromberg, J.; Terpenning, M.; Bretz, W.; Dominguez, B.; Grossman, N.; Langmore, S. Xerostomia, xerogenic medications and food avoidances in selected geriatric groups. J. Am. Geriatr. Soc. 1995, 43, 401–407. [Google Scholar] [CrossRef]
- Silva, C.S.; Dias, V.R.; Almeida, J.A.R.; Brazil, J.M.; Santos, R.A.; Milagres, M.P. Effect of Heavy Consumption of Alcoholic Beverages on the Perception of Sweet and Salty Taste. Alcohol Alcohol. 2015, 51, 302–306. [Google Scholar] [CrossRef] [PubMed]
- Klasser, G.D.; Utsman, R.; Epstein, J.B. Taste change associated with a dental procedure: Case report and review of the literature. J. Can. Dent. Assoc. 2008, 74, 455–461. [Google Scholar]
- Imoscopi, A.; Inelmen, E.M.; Sergi, G.; Miotto, F.; Manzato, E. Taste loss in the elderly: Epidemiology, causes and consequences. Aging Clin. Exp. Res. 2012, 24, 570–579. [Google Scholar] [CrossRef]
- Goto, T.; Komai, M.; Suzuki, H.; Furukawa, Y. Long-term zinc deficiency decreases taste sensitivity in rats. J. Nutr. 2001, 131, 305–310. [Google Scholar] [CrossRef] [PubMed]
- Drewnowski, A.; Evans, W.J. Nutrition, physical activity, and quality of life in older adults: Summary. J. Gerontol. A Biol. Sci. Med. Sci. 2001, 56, 89–94. [Google Scholar] [CrossRef] [PubMed]
- Liljas, A.E.; Jones, A.; Cadar, D.; Steptoe, A.; Lassale, C. Association of Multisensory Impairment with Quality of Life and Depression in English Older Adults. JAMA Otolaryngol. Head Neck Surg. 2020, 146, 278–285. [Google Scholar] [CrossRef]
- Kim, D.; Lim, H. Association between combinations of nutritional status and quality of life and food purchasing motives among the elderly in South Korea. Health Qual. Life Outcomes 2020, 18, 1–9. [Google Scholar] [CrossRef] [PubMed]
- Wang, J.-J.; Liang, K.-L.; Lin, W.-J.; Chen, C.-Y.; Jiang, R.-S. Influence of age and sex on taste function of healthy subjects. PLoS ONE 2020, 15, e0227014. [Google Scholar] [CrossRef]
- Shu-Fen, C.L.; Tey, S.L.; Henry, C.J.; Forde, C.G. Taste sensitivities and diet of Chinese and Indians in Singapore. Asia Pac. J. Clin. Nutr. 2018, 27, 681. [Google Scholar] [CrossRef]
- Yang, L.; Wei, Y.; Yu, D.; Zhang, J.; Liu, Y. Olfactory and gustatory function in healthy adult Chinese subjects. Otolaryngol Head Neck Surg. 2010, 143, 554–560. [Google Scholar] [CrossRef]
- Hagströmer, M.; Oja, P.; Sjöström, M. The International Physical Activity Questionnaire (IPAQ): A study of concurrent and construct validity. Public Health Nutr. 2006, 9, 755–762. [Google Scholar] [CrossRef]
- Trumbo, P.; Schlicker, S.; Yates, A.A.; Poos, M. Dietary reference intakes for energy, carbohdrate, fiber, fat, fatty acids, cholesterol, protein and amino acids. J. Acad. Nutr. Diet. 2002, 102, 1621. [Google Scholar] [CrossRef]
- Priebe, S.; Huxley, P.; Knight, S.; Evans, S. Application and results of the Manchester Short Assessment of Quality of Life (MANSA). Int. J. Soc. Psychiatry 1999, 45, 7–12. [Google Scholar] [CrossRef]
- Min, S.K.; Lee, C.I.; Kim, K.I.; Suh, S.Y.; Kim, D.K. Development of Korean version of WHO quality of life scale abbreviated version (WHOQOL-BREF). J. Korean Neuropsychiatr. Assoc. 2000, 39, 571–579. [Google Scholar]
- Christ-Hazelhof, E.; Heidema, J.; Mojet, J. Taste Perception with Age: Generic or Specific Losses in Threshold Sensitivity to the Five Basic Tastes? Chem. Senses 2001, 26, 845–860. [Google Scholar] [CrossRef]
- Yamaguchi, K.; Harada, S.; Kanemaru, N.; Kasahara, Y. Age-related Alteration of Taste Bud Distribution in the Common Marmoset. Chem. Senses 2001, 26, 1–6. [Google Scholar] [CrossRef] [PubMed]
- Schiffman, S.; Frey, A.; Luboski, J.; Foster, M.; Erickson, R. Taste of glutamate salts in young and elderly subjects: Role of inosine 5′-monophosphate and ions. Physio. Behav. 1991, 49, 843–854. [Google Scholar] [CrossRef]
- Schiffman, S.S.; Sennewald, K.; Gagnon, J. Comparison of taste qualities and thresholds of D-and L-amino acids. Physiol. Behav. 1981, 27, 51–59. [Google Scholar] [CrossRef]
- Methven, L.; Allen, V.J.; Withers, C.A.; Gosney, M.A. Ageing and taste. Proc. Nutr. Soc. 2012, 71, 556–565. [Google Scholar] [CrossRef]
- Nordin, S.; Brämerson, A.; Bringlöv, E.; Kobal, G.; Hummel, T.; Bende, M. Substance and tongue-region specific loss in basic taste-quality identification in elderly adults. Eur. Arch. Otorhinolaryngol. 2007, 264, 285. [Google Scholar] [CrossRef]
- Drewnowski, A.; Henderson, S.A.; Driscoll, A.; Rolls, B.J. Salt taste perceptions and preferences are unrelated to sodium consumption in healthy older adults. J. Am. Diet. Assoc. 1996, 96, 471–474. [Google Scholar] [CrossRef]
- Satoh-Kuriwada, S. Umami-taste sensitivity in the elderly with taste disorder. Jpn. J. Taste Smell Res. 2010, 1, 117–126. [Google Scholar]
- Sergi, G.; Bano, G.; Pizzato, S.; Veronese, N.; Manzato, E. Taste loss in the elderly: Possible implications for dietary habits. Crit. Rev. Food Sci. Nutr. 2017, 57, 3684–3689. [Google Scholar] [CrossRef] [PubMed]
- Pushpass, R.-A.G.; Pellicciotta, N.; Kelly, C.; Proctor, G.; Carpenter, G.H. Reduced salivary mucin binding and glycosylation in older adults influences taste in an in vitro cell model. Nutrients 2019, 11, 2280. [Google Scholar] [CrossRef] [PubMed]
- Barragán, R.; Coltell, O.; Portolés, O.; Asensio, E.M.; Sorlí, J.V.; Ortega-Azorín, C.; González, J.I.; Sáiz, C.; Fernández-Carrión, R.; Ordovas, J.M. Bitter, sweet, salty, sour and umami taste perception decreases with age: Sex-specific analysis, modulation by genetic variants and taste-preference associations in 18 to 80 year-old subjects. Nutrients 2018, 10, 1539. [Google Scholar] [CrossRef] [PubMed]
- MacDonald, R.S. The role of zinc in growth and cell proliferation. J. Nutr. 2000, 130, 1500S–1508S. [Google Scholar] [CrossRef]
- Feng, P.; Huang, L.; Wang, H. Taste bud homeostasis in health, disease, and aging. Chem. Senses 2014, 39, 3–16. [Google Scholar] [CrossRef]
- Barlow, L.A. Progress and renewal in gustation: New insights into taste bud development. Development 2015, 142, 3620–3629. [Google Scholar] [CrossRef]
- Negoro, A.; Umemoto, M.; Nin, T.; Sakagami, M.; Fujii, M. Clinical Experiences of the Medication to Taste Disturbance by Serum Trace Deficiency Especially Serum Iron Deficiency. Nippon Jibiinkoka Gakkai Kaiho 2004, 107, 188–194. [Google Scholar] [CrossRef][Green Version]
- Desai, V.D.; Kumar, M.S.; Bathi, R.J.; Gaurav, I.; Sharma, R. Molecular analysis of trace elements in oral submucous fibrosis and future perspectives. Univers. Res. J. Dent. 2014, 4, 26–35. [Google Scholar] [CrossRef]
- Wu, Y.-C.; Wang, Y.-P.; Chang, J.Y.-F.; Cheng, S.-J.; Chen, H.-M.; Sun, A. Oral manifestations and blood profile in patients with iron deficiency anemia. JFMA 2014, 113, 83–87. [Google Scholar] [CrossRef] [PubMed]
- Ohta, R.; Ryu, Y.; Hattori, S. Association between transient appetite loss and vitamin B1 deficiency in elderly patients with suspected deficiency. J. Gen. Fam. Med. 2021, 22, 128–133. [Google Scholar] [CrossRef]
- Pittman, D.W.; Dong, G.; Brantly, A.M.; He, L.; Nelson, T.S.; Kogan, S.; Powell, J.; McCluskey, L.P. Behavioral and neurophysiological taste responses to sweet and salt are diminished in a model of subclinical intestinal inflammation. Sci. Rep. 2020, 10, 1–13. [Google Scholar] [CrossRef]
- Inaba, H.; Kishimoto, T.; Oishi, S.; Nagata, K.; Hasegawa, S.; Watanabe, T.; Kida, S. Vitamin B1-deficient mice show impairment of hippocampus-dependent memory formation and loss of hippocampal neurons and dendritic spines: Potential microendophenotypes of Wernicke–Korsakoff syndrome. Biosci. Biotechnol. Biochem. 2016, 80, 2425–2436. [Google Scholar] [CrossRef]
- Randall, A.D.; Booth, C.; Brown, J.T. Age-related changes to Na+ channel gating contribute to modified intrinsic neuronal excitability. Neurobiol. Aging 2012, 33, 2715–2720. [Google Scholar] [CrossRef] [PubMed]
- Khadim, M.I. Oral manifestations of malnutrition I. The effect of vitamins. J. Pak. Med. Assoc. 1981, 31, 44–48. [Google Scholar]
- Langan, M.J.; Yearick, E.S. The effects of improved oral hygiene on taste perception and nutrition of the elderly. J. Gerontol. 1976, 31, 413–418. [Google Scholar] [CrossRef] [PubMed]
- Kaczmarek, J.L.; Musaad, S.M.; Holscher, H.D. Time of day and eating behaviors are associated with the composition and function of the human gastrointestinal microbiota. Am. J. Clin. Nutr. 2017, 106, 1220–1231. [Google Scholar] [CrossRef]
- Patak, P.; Willenberg, H.; Bornstein, S. Vitamin C is an important cofactor for both adrenal cortex and adrenal medulla. Endocr. Res. 2004, 30, 871–875. [Google Scholar] [CrossRef]
- Henkin, R.I.; Gill, J.R.; Bartter, F.C. Studies on taste thresholds in normal man and in patients with adrenal cortical insufficiency: The role of adrenal cortical steroids and of serum sodium concentration. J. Clin. Investig. 1963, 42, 727–735. [Google Scholar] [CrossRef] [PubMed]
- Tada, A.; Miura, H. The relationship between vitamin C and periodontal diseases: A systematic review. Int. J. Environ. Res. Public Health 2019, 16, 2472. [Google Scholar] [CrossRef] [PubMed]
- Lindemann, B. Receptors and transduction in taste. Nature 2001, 413, 219–225. [Google Scholar] [CrossRef]
- Matsuo, R. Role of saliva in the maintenance of taste sensitivity. Crit. Rev. Oral. Biol. Med. 2000, 11, 216–229. [Google Scholar] [CrossRef] [PubMed]
- Walliczek-Dworschak, U.; Schöps, F.; Feron, G.; Brignot, H.; Hähner, A.; Hummel, T. Differences in the density of fungiform papillae and composition of saliva in patients with taste disorders compared to healthy controls. Chem. Senses 2017, 42, 699–708. [Google Scholar] [CrossRef]
- Shin, Y.-K.; Martin, B.; Kim, W.; White, C.M.; Ji, S.; Sun, Y.; Smith, R.G.; Sévigny, J.; Tschöp, M.H.; Maudsley, S. Ghrelin is produced in taste cells and ghrelin receptor null mice show reduced taste responsivity to salty (NaCl) and sour (citric acid) tastants. PLoS ONE 2010, 5, e12729. [Google Scholar] [CrossRef]
- Rigamonti, A.; Pincelli, A.; Corra, B.; Viarengo, R.; Bonomo, S.; Galimberti, D.; Scacchi, M.; Scarpini, E.; Cavagnini, F.; Muller, E. RAPID COMMUNICATION: Plasma ghrelin concentrations in elderly subjects: Comparison with anorexic and obese patients. J. Endocrinol. 2002, 175, R1. [Google Scholar] [CrossRef] [PubMed]
- Akarsu, S.; Ustundag, B.; Gurgoze, M.K.; Sen, Y.; Aygun, A.D. Plasma ghrelin levels in various stages of development of iron deficiency anemia. J. Pediatr. Hematol. Oncol. 2007, 29, 384–387. [Google Scholar] [CrossRef]
- Sheetal, A.; Hiremath, V.K.; Patil, A.G.; Sajjansetty, S.; Kumar, S.R. Malnutrition and its oral outcome–a review. J. Clin. Diagn. Res. 2013, 7, 178. [Google Scholar] [CrossRef]
- Tordoff, M.G. Salt intake of rats fed diets deficient in calcium, iron, magnesium, phosphorus, potassium, or all minerals. Appetite 1992, 18, 29–41. [Google Scholar] [CrossRef]
- Schilling, O. Development of life satisfaction in old age: Another view on the “Paradox”. Soc. Indic. Res. 2006, 75, 241–271. [Google Scholar] [CrossRef]
- Schiffman, S.S.; Zervakis, J. Taste and smell perception in the elderly: Effect of medications and disease. Adv. Food Nutr. Res. 2002, 44, 247–346. [Google Scholar] [CrossRef]
- Desoutter, A.; Soudain-Pineau, M.; Munsch, F.; Mauprivez, C.; Dufour, T.; Coeuriot, J.L. Xerostomia and medication: A cross-sectional study in long-term geriatric wards. J. Nutr. Health Aging 2012, 16, 575–579. [Google Scholar] [CrossRef]
- SANDERS, O.G.; AYERS, J.V.; OAKES, S. Taste acuity in the elderly: The impact of threshold, age, gender, medication, health and dental problems. J. Sens. Stud. 2002, 17, 89–104. [Google Scholar] [CrossRef]
- Feeney, E.L.; Leacy, L.; O’Kelly, M.; Leacy, N.; Phelan, A.; Crowley, L.; Stynes, E.; de Casanove, A.; Horner, K. Sweet and umami taste perception differs with habitual exercise in males. Nutrients 2019, 11, 155. [Google Scholar] [CrossRef]
- Horio, T.; Kawamura, Y. Influence of physical exercise on human preferences for various taste solutions. Chem. Senses 1998, 23, 417–421. [Google Scholar] [CrossRef]
- Schiffman, S.S. Intensification of sensory properties of foods for the elderly. J. Nutr. 2000, 130, 927S–930S. [Google Scholar] [CrossRef] [PubMed]
- Kremer, S.; Bult, J.H.; Mojet, J.; Kroeze, J.H. Food perception with age and its relationship to pleasantness. Chem. Senses 2007, 32, 591–602. [Google Scholar] [CrossRef] [PubMed]
- Stewart-Knox, B.J.; Simpson, E.E.; Parr, H.; Rae, G.; Polito, A.; Intorre, F.; Sanchez, M.A.; Meunier, N.; O’Connor, J.M.; Maiani, G. Taste acuity in response to zinc supplementation in older Europeans. Br. J. Nutr. 2008, 99, 129–136. [Google Scholar] [CrossRef] [PubMed]
- Bernard, A.; Ancel, D.; Neyrinck, A.M.; Dastugue, A.; Bindels, L.B.; Delzenne, N.M.; Besnard, P. A preventive prebiotic supplementation improves the sweet taste perception in diet-induced obese mice. Nutrients 2019, 11, 549. [Google Scholar] [CrossRef]


| Characteristics | Young Adults (n = 71) | Elderly (n = 68) | pd |
|---|---|---|---|
| Sex (Male) | 30 (42.3) b | 34 (50.0) | 0.397 e |
| Age (y) | 24.7 ± 2.5 c | 77.9 ± 6.1 | 0.000 |
| Height (cm) | 167.1 ± 7.5 | 159.2 ± 7.6 | 0.000 |
| Weight (kg) | 59.4 ± 9.8 | 58.0 ± 9.0 | 0.000 |
| BMI (kg/m2) a | 21.2 ± 2.2 | 22.8 ± 2.8 | 0.377 |
| Low (<18.5) | 6 (8.50) | 4 (5.90) | 0.000 e |
| Normal (18.5–22.9) | 53 (74.6) | 29 (42.6) | |
| Overweight (23.0–24.9) | 9 (12.7) | 19 (27.9) | |
| Obese (≥25) | 3 (4.20) | 16 (23.5) | |
| Exercise (more than once a week) | 43 (60.6) | 48 (70.6) | 0.214 |
| Drinking (more than once a month) | 66 (93.0) | 31 (45.6) | 0.000 |
| Smoking (more than one time) | 12 (16.9) | 20 (29.4) | 0.080 |
| Number of medicine intake (≥1) | 16 (22.5) | 58 (85.3) | 0.000 |
| Parameters | Sucrose RT (mM) | NaCl RT (mM) | Caffeine RT (mM) | Citric Acid RT (mM) | Umami RT (mM) | |
|---|---|---|---|---|---|---|
| Energy (% EER) | Inadequate (n = 36) | 121.9 ± 96.3 | 110.3 ± 87.4 | 9.0 ± 6.5 | 2.3 ± 3.0 | 22.5 ± 23.1 |
| Adequate (n = 28) | 105.5 ± 90.4 | 101.3 ± 93.4 | 8.2 ± 7.9 | 1.7 ± 1.9 | 19.8 ± 20.1 | |
| Excessive (n = 4) | 100.0 ± 0.0 | 60.0 ± 32.7 | 6.8 ± 5.3 | 1.9 ± 2.2 | 16.7 ± 15.8 | |
| Protein (% RNI) | Inadequate (n = 28) | 132.9 ± 100.6 | 122.1 ± 89.5 | 9.8 ± 6.5 | 3.0 ± 3.2 | 23.3 ± 22.8 |
| Adequate (n = 21) | 105.7 ± 95.6 | 82.4 ± 68.4 | 7.5 ± 8.0 | 1.1 ± 1.5 | 18.9 ± 22.3 | |
| Excessive (n = 19) | 95.0 ± 64.9 | 99.8 ± 101.6 | 7.8 ± 6.6 | 1.6 ± 1.95 | 20.2 ± 18.8 | |
| Fiber (% AI) | Inadequate (n = 31) | 128.5 ± 99.6 | 122.7 ± 87.5 | 9.3 ± 6.6 | 2.0 ± 3.12 | 24.9 ± 24.0 |
| Adequate (n = 31) | 119.5 ± 94.9 | 102.3 ± 100.7 | 7.6 ± 7.7 | 1.1 ± 1.4 | 18.2 ± 22.0 | |
| Excessive (n = 15) | 75.3 ± 49.2 | 66.1 ± 53.2 | 8.2 ± 7.0 | 1.9 ± 2.1 | 17.3 ± 12.7 | |
| Vitamin A (% RNI) | Inadequate (n = 51) | 125.4 ± 97.1 | 108.8 ± 85.6 | 8.9 ± 7.6 | 2.1 ± 2.7 | 21.1 ± 22.4 |
| Adequate (n = 11) | 82.7 ± 65.8 | 95.9 ± 107.9 | 5.8 ± 4.4 | 1.5 ± 1.9 | 20.1 ± 21.3 | |
| Excessive (n = 6) | 73.3 ± 41.3 | 73.7 ± 70.8 | 10.2 ± 5.3 | 2.3 ± 2.3 | 23.1 ± 13.0 | |
| Vitamin C (% RNI) | Inadequate (n = 34) | 124.4 ± 96.2 | 119.6 ± 84.3 | 8.8 ± 6.5 | 2.5 ± 3.0 | 24.3 ± 23.4 |
| Adequate (n = 14) | 118.9 ± 108.5 | 96.1 ± 93.2 | 6.3 ± 7.3 | 1.6 ± 2.0 | 19.1 ± 20.0 | |
| Excessive (n = 20) | 92.5 ± 64.2 | 81.9 ± 88.5 | 9.6 ± 7.6 | 1.4 ± 1.7 | 17.1 ± 18.6 | |
| Thiamin (% RNI) | Inadequate (n = 13) | 155.8 ± 113.5 | 147.7 ± 107.3 | 10.9 ± 6.2 | 4.9 ± 3.4b | 29.8 ± 24.5 |
| Adequate (n = 20) | 109.3 ± 80.3 | 100.3 ± 65.5 | 8.4 ± 6.5 | 1.1 ± 1.5a | 19.9 ± 22.8 | |
| Excessive (n = 35) | 101.0 ± 84.7 | 89.2 ± 87.9 | 7.7 ± 7.5 | 1.4 ± 1.8a | 18.5 ± 18.9 | |
| Riboflavin (% RNI) | Inadequate (n = 32) | 125.3 ± 96.5 | 122.0 ± 85.6 | 9.5 ± 6.4 | 2.7 ± 3.1 | 24.5 ± 23.7 |
| Adequate (n = 18) | 121.4 ± 101.8 | 105.8 ± 95.2 | 7.9 ± 8.3 | 0.9 ± 1.2 | 19.0 ± 23.7 | |
| Excessive (n = 18) | 86.1 ± 62.3 | 68.7 ± 77.1 | 7.3 ± 6.7 | 2.0 ± 2.1 | 17.0 ± 13.0 | |
| Niacin (% RNI) | Inadequate (n = 32) | 122.8 ± 98.2 | 116.4 ± 86.2 | 9.1 ± 6.6 | 2.7 ± 3.1 | 23.4 ± 23.9 |
| Adequate (n = 25) | 113.6 ± 94.7 | 96.4 ± 88.4 | 8.3 ± 8.2 | 1.2 ± 1.6 | 18.2 ± 17.6 | |
| Excessive (n = 11) | 88.6 ± 51.1 | 82.9 ± 92.5 | 7.2 ± 5.5 | 1.9 ± 2.2 | 20.9 ± 22.6 | |
| Vitamin B6 (% RNI) | Inadequate (n = 26) | 140.6 ± 100.2 | 130.0 ± 88.8 | 9.2 ± 5.8 | 3.0 ± 3.2 | 22.0 ± 20.8 |
| Adequate (n = 20) | 88.3 ± 70.2 | 77.3 ± 63.7 | 7.5 ± 8.9 | 1.3 ± 1.8 | 19.6 ± 22.6 | |
| Excessive (n = 22) | 105.7 ± 90.5 | 96.5 ± 99.5 | 8.6 ± 6.7 | 1.5 ± 1.8 | 21.3 ± 21.8 | |
| Folic acid (% RNI) | Inadequate (n = 22) | 154.1 ± 102.4b | 135.4 ± 96.6 | 10.1 ± 5.5 | 3.2 ± 3.4b | 24.3 ± 21.8 |
| Adequate (n = 21) | 85.0 ± 88.9a | 74.8 ± 44.0 | 6.2 ± 8.0 | 1.1 ± 1.8a | 18.7 ± 22.4 | |
| Excessive (n = 25) | 102.8 ± 69.4ab | 99.9 ± 100.1 | 9.0 ± 7.1 | 1.7 ± 1.9ab | 20.3 ± 20.7 | |
| Vitamin B12 (% RNI) | Inadequate (n = 4) | 200.0 ± 81.6 | 225.0 ± 50.0b | 5.2 ± 1.8 | 2.3 ± 2.0 | 42.9 ± 24.0 |
| Adequate (n = 10) | 140.0 ± 121.3 | 146.0 ± 107ab | 10.4 ± 4.0 | 3.9 ± 3.8 | 22.5 ± 21.5 | |
| Excessive (n = 54) | 103.0 ± 81.8 | 86.8 ± 76.5a | 8.4 ± 7.6 | 1.7 ± 2.2 | 19.2 ± 20.7 | |
| Calcium (% RNI) | Inadequate (n = 48) | 124.5 ± 97.7 | 106.9 ± 82.7 | 8.7 ± 7.3 | 2.3 ± 2.8 | 23.1 ± 23.9 |
| Adequate (n = 12) | 92.1 ± 82.9 | 92.7 ± 103.7 | 7.1 ± 7.6 | 1.1 ± 1.4 | 14.5 ± 12.9 | |
| Excessive (n = 8) | 83.1 ± 32.0 | 100.6 ± 102.4 | 9.7 ± 4.1 | 1.9 ± 2.1 | 19.1 ± 13.3 | |
| Phosphorus (% RNI) | Inadequate (n = 20) | 163.5 ± 102.0b | 143.0 ± 98.3 | 10.1 ± 5.7 | 3.5 ± 3.4b | 26.2 ± 21.9 |
| Adequate (n = 14) | 78.9 ± 97.9a | 66.4 ± 32.2 | 6.6 ± 7.6 | 1.1 ± 1.8a | 16.5 ± 25.7 | |
| Excessive (n = 34) | 99.1 ± 68.4ab | 95.8 ± 89.7 | 8.4 ± 7.4 | 1.5 ± 1.8a | 20.0 ± 19.1 | |
| Sodium (% AI) | Inadequate (n = 3) | 181.7 ± 128.5 | 173.3 ± 141.9 | 8.9 ± 3.9 | 5.1 ± 4.8b | 39.8 ± 35.8 |
| Adequate (n = 13) | 165.8 ± 111.5 | 153.8 ± 91.4 | 10.4 ± 6.7 | 3.6 ± 3.5ab | 22.6 ± 20.9 | |
| Excessive (n = 52) | 97.0 ± 77.2 | 87.1 ± 78.3 | 8.0 ± 7.2 | 1.4 ± 1.8a | 19.6 ± 20.6 | |
| Iron (% RNI) | Inadequate (n = 9) | 181.7 ± 111.3b | 180.0 ± 92.7b | 9.7 ± 4.5 | 3.0 ± 3.3b | 37.1 ± 24.5b |
| Adequate (n = 14) | 130.4 ± 92.9ab | 104.3 ± 86.4a | 9.6 ± 6.5 | 3.1 ± 3.4ab | 15.9 ± 13.9a | |
| Excessive (n = 45) | 95.2 ± 79.5a | 88.2 ± 80.6a | 7.9 ± 7.6 | 1.3 ± 1.7a | 19.5 ± 21.6ab | |
| Zinc (% RNI) | Inadequate (n = 17) | 160.3 ± 101.0b | 148.2 ± 90.6b | 9.5 ± 4.4 | 3.0 ± 2.8 | 28.2 ± 22.1 |
| Adequate (n = 18) | 86.1 ± 76.8a | 76.9 ± 62.6a | 9.0 ± 9.2 | 2.1 ± 3.2 | 20.8 ± 27.0 | |
| Excessive (n = 33) | 105.2 ± 85.4ab | 95.2 ± 91.5ab | 7.7 ± 6.9 | 1.5 ± 1.8 | 17.6 ± 16.9 | |
| Dietary Nutrients | Correlation Analysis (r) | Regression Analysis (β) | ||||||||
|---|---|---|---|---|---|---|---|---|---|---|
| Sucrose RT | NaCl RT | Caffeine RT | Citric Acid RT | Umami RT | Sucrose RT | NaCl RT | Caffeine RT | Citric Acid RT | Umami RT | |
| Energy (% EER) | −0.182 | −0.174 | −0.166 | −0.255 * | −0.160 | −0.475 | −0.438 | −0.033 | −0.019 * | −0.099 |
| protein (% RNI) | −0.204 | −0.198 | −0.096 | −0.180 | −0.087 | −0.353 | −0.331 | −0.013 | −0.009 | −0.035 |
| Fiber (% AI) | −0.233 | −0.316 ** | −0.101 | −0.267 * | −0.191 | −0.447 | −0.585 ** | −0.015 | −0.014 * | −0.086 |
| Vitamin A (% RNI) | −0.195 | −0.209 | −0.048 | −0.156 | −0.046 | −0.416 | −0.433 | −0.008 | −0.009 | −0.023 |
| Vitamin C (% RNI) | −0.232 | −0.257 * | −0.009 | −0.241 * | −0.176 | −0.290 | −0.001 * | −0.001 | −0.008 * | −0.052 |
| Thiamin (% RNI) | −0.171 | −0.258 * | −0.113 | −0.266 * | −0.135 | −0.211 | −0.308 * | −0.011 | −0.009 * | −0.039 |
| Riboflavin (% RNI) | −0.192 | −0.240 * | −0.056 | −0.217 | −0.118 | −0.325 | −0.393 * | −0.007 | −0.010 | −0.047 |
| Niacin (% RNI) | −0.203 | −0.230 | −0.094 | −0.182 | −0.085 | −0.394 | −0.432 | −0.014 | −0.010 | −0.039 |
| Vitamin B6 (% RNI) | −0.114 | −0.154 | 0.022 | −0.058 | 0.034 | −0.093 | −0.122 | 0.001 | −0.001 | 0.007 |
| Folic acid (% RNI) | −0.196 | −0.225 | −0.040 | −0.231 | −0.128 | −0.275 | −0.307 | −0.004 | −0.009 | −0.043 |
| Vitamin B12 (% RNI) | −0.222 | −0.162 | −0.007 | −0.140 | −0.021 | −0.063 | −0.045 | 0.000 | −0.001 | −0.001 |
| Calcium (% RNI) | −0.219 | −0.141 | −0.027 | −0.175 | −0.088 | −0.463 | −0.288 | −0.004 | −0.010 | −0.044 |
| Phosphorus (% RNI) | −0.186 | −0.152 | −0.063 | −0.171 | −0.070 | −0.230 | −0.182 | −0.006 | −0.006 | −0.020 |
| Sodium (% RNI) | −0.172 | −0.204 | −0.041 | −0.117 | −0.025 | −0.094 | −0.107 | −0.002 | −0.002 | −0.003 |
| Iron (% RNI) | −0.226 | −0.300 * | −0.124 | −0.259 * | −0.160 | −0.224 | −0.288 * | −0.010 | −0.007 * | −0.037 |
| Zinc (% RNI) | −0.223 | −0.206 | −0.106 | −0.181 | −0.119 | −0.267 | −0.238 | −0.010 | −0.006 | −0.034 |
| Non-Nutritional Factors | Correlation Analysis (r) | Regression Analysis (β) | ||||||||
|---|---|---|---|---|---|---|---|---|---|---|
| Sucrose RT | NaCl RT | Caffeine RT | Citric Acid RT | Umami RT | Sucrose RT | NaCl RT | Caffeine RT | Citric Acid RT | Umami RT | |
| Age a | 0.005 | −0.002 | −0.018 | 0.238 | 0.190 | 0.006 | −0.010 | −0.007 | 0.051 | 0.048 |
| BMI a | −0.097 | 0.084 | 0.323 ** | 0.002 | −0.099 | −0.026 | 0.050 | 0.176 ** | 0.040 | −0.053 |
| Physical activity level b | −0.175 | −0.089 | −0.078 | −0.191 | −0.253 * | −0.499 | −0.287 | −0.138 | −0.486 | −0.788 * |
| Exercise level b | 0.081 | 0.094 | 0.081 | 0.031 | 0.016 | 0.141 | 0.160 | 0.152 | 0.031 | 0.025 |
| Alcohol consumption b | 0.154 | 0.226 | −0.014 | 0.163 | 0.017 | 0.403 | 0.530 | −0.007 | 0.369 | 0.063 |
| Smoking b | −0.076 | −0.060 | −0.108 | −0.095 | −0.171 | −0.307 | −0.139 | −0.300 | −0.167 | −0.506 |
| Living situation | ||||||||||
| Marital status b | −0.107 | −0.117 | −0.112 | 0.055 | −0.211 | −0.258 | −0.228 | −0.231 | 0.204 | −0.471 |
| Cohabitation b | 0.033 | 0.070 | 0.053 | −0.050 | 0.113 | 0.113 | 0.086 | 0.009 | −0.116 | 0.130 |
| Self-rated standard of living b | −0.133 | −0.193 | −0.027 | −0.092 | −0.197 | −0.204 | −0.282 | −0.017 | −0.155 | −0.314 |
| Number of medicine intake b | 0.182 | −0.072 | 0.272 * | 0.087 | −0.079 | 0.283 | −0.144 | 0.498 * | 0.104 | −0.199 |
| Social participation | ||||||||||
| Hobby b | −0.198 | −0.269 * | −0.032 | −0.186 | −0.044 | −0.194 | −0.241 | −0.034 | −0.189 | −0.037 |
| Social gathering b | −0.218 | −0.257 * | −0.452 ** | −0.324 ** | −0.134 | −0.388 * | −0.412 * | −0.688 ** | −0.439 * | −0.198 |
| Voluntary service b | −0.090 | −0.053 | −0.129 | 0.057 | −0.140 | −0.107 | −0.069 | −0.152 | 0.077 | −0.171 |
| Education b | −0.076 | −0.300 * | −0.075 | −0.089 | −0.046 | −0.074 | −0.337 * | −0.076 | −0.098 | −0.055 |
| Religion b | −0.207 | −0.227 | −0.084 | −0.229 | −0.051 | −0.229 | −0.150 | 0.100 | 0.005 | −0.002 |
| QOL score a | −0.415 ** | 0.378 ** | −0.351 ** | −0.354 ** | −0.407 ** | −0.053 ** | −0.057 ** | −0.055 ** | −0.053 ** | −0.058 ** |
Publisher’s Note: MDPI stays neutral with regard to jurisdictional claims in published maps and institutional affiliations. |
© 2021 by the authors. Licensee MDPI, Basel, Switzerland. This article is an open access article distributed under the terms and conditions of the Creative Commons Attribution (CC BY) license (https://creativecommons.org/licenses/by/4.0/).
Share and Cite
Jeon, S.; Kim, Y.; Min, S.; Song, M.; Son, S.; Lee, S. Taste Sensitivity of Elderly People Is Associated with Quality of Life and Inadequate Dietary Intake. Nutrients 2021, 13, 1693. https://doi.org/10.3390/nu13051693
Jeon S, Kim Y, Min S, Song M, Son S, Lee S. Taste Sensitivity of Elderly People Is Associated with Quality of Life and Inadequate Dietary Intake. Nutrients. 2021; 13(5):1693. https://doi.org/10.3390/nu13051693
Chicago/Turabian StyleJeon, Soyeon, Yeonhee Kim, Sohyun Min, Mina Song, Sungtaek Son, and Seungmin Lee. 2021. "Taste Sensitivity of Elderly People Is Associated with Quality of Life and Inadequate Dietary Intake" Nutrients 13, no. 5: 1693. https://doi.org/10.3390/nu13051693
APA StyleJeon, S., Kim, Y., Min, S., Song, M., Son, S., & Lee, S. (2021). Taste Sensitivity of Elderly People Is Associated with Quality of Life and Inadequate Dietary Intake. Nutrients, 13(5), 1693. https://doi.org/10.3390/nu13051693