Abstract
This study aimed to investigate the effects of a hypocaloric balanced diet (HBD) on anthropometric measures and gut microbiota of 43 people with obesity. Fecal samples were collected from the study subjects at weeks 0 and 12, and a detailed analysis of gut microbiota was performed using 16S rRNA gene sequencing. By comparing anthropometric measures and microbiota changes in subjects before and after the HBD intervention, we revealed the potential effects of HBD on weight loss and gut microbiota. Our results indicated that the HBD resulted in a significant decrease in body mass index (BMI), and most of the physiological indicators were decreased to a greater degree in the effective HBD group (EHBD, weight loss ≥ 5%) than in the ineffective HBD group (IHBD, weight loss < 5%). The HBD intervention also modified the gut microbiota of the subjects with obesity. Specifically, Blautia, Lachnoclostridium, Terrisporobacter, Ruminococcus (R. torques, R. gnavus), and Pseudomonas were significantly reduced. In addition, we employed machine learning models, such as XGBRF and GB models, to rank the importance of various features and identified the top 10 key bacterial genera involved. Gut microbiota co-occurrence networks showed the dominance of healthier microbiota following successful weight loss. These results suggested that the HBD intervention enhanced weight loss, which may be related to diet-induced changes in the gut microbiota.
1. Introduction
Obesity is a global health crisis that will continue to worsen in the coming years. The last four decades have witnessed a tenfold increase in childhood and adolescent obesity [1]. The World Health Organization has defined obesity as an excessive and potentially harmful fat accumulation. The primary reason behind obesity is the imbalance between the body’s energy intake and expenditure [2]. Not only are people with obesity depressed due to mood and anxiety disorders, but they are at increased risk for several debilitating diseases and health conditions like type 2 diabetes, hypertension, myocardial infarction, stroke, liver cancer, colon cancer, and breast cancer [3].
The current primary treatment strategy to control obesity is to increase the body’s energy expenditure or reduce energy intake. For example, a switch from a sedentary lifestyle to an active lifestyle with the inclusion, where required, of behavioral therapy. The gut microbiota plays a key role in human health by improving digestion and regulating the immune system, and thus this aspect has attracted growing concerns in recent years [4]. There is increasing evidence that imbalances in the gut microbiota may be a crucial factor in obesity [5,6,7,8]. Several studies have indicated that gut-microbiota-derived metabolites play a crucial role in nutrient uptake and energy metabolism of the body, and any irregularities in this process lead to obesity or being underweight [9,10]. Growing evidence suggests that the composition, diversity, metabolic function, and immune function of the gut microbiota in people with obesity are altered compared to the healthy group [11,12]. It has been observed that the composition of gut microbiota in people with obesity differs significantly from that of healthy people. Specifically, there is a notable reduction in beneficial bacteria like Bifidobacterium and an increase in potentially pathogenic bacteria such as Fusobacterium and Escherichia-Shigella [13]. Therefore, a comprehensive gut microbiota analysis can help determine specific microbial signatures associated with health and disease (for example, obesity).
Although the exact mechanisms causing obesity are still obscure, dietary patterns are associated with the onset of obesity and associated comorbidities. For example, although continuous energy restriction (CER) is one of the most common dietary strategies for weight loss and metabolic improvements, long-term adherence to this becomes problematic as it involves restricting energy intake by 15–30% [14]. Intermittent energy restriction (IER) serves as an alternative to CER for weight loss and has been confirmed to yield comparable effects on weight loss and health promotion [15,16]. Furthermore, the characteristics of the gut microbiota are influenced by several factors, including diet. Different dietary interventions can have an impact on the gut microbiota, which includes the application of probiotics and prebiotics. Probiotic intake has been shown to aid anti-obesity interventions by promoting weight loss and reducing cardiovascular risk factors [17]. However, the efficacy of probiotic interventions can be influenced by gut microbiota composition in obese individuals [18]. In obesity treatment, significant progress has been made in diet therapy, with many studies dedicated to exploring ways of controlling obesity through dietary patterns. Several dietary approaches have been extensively studied, including short-term carbohydrate diets [19], high-protein energy-restricted diets [20], Mediterranean diets [21,22], and ketogenic diets [22,23]. As a recommended nutritional pattern, the Mediterranean diet has been found to influence the composition and function of the gut microbiota, contributing to the development of a healthier microbiota [21,22]. On the other hand, the ketogenic diet, characterized by a high-fat, low-carbohydrate formulated diet, has been used to treat epilepsy, diabetes, and obesity and has been shown in clinical studies to have beneficial effects on body weight, metabolic parameters, and gut microbiota composition [22,23].
Different dietary patterns, however, have a variable effect on host metabolism, which is governed by person-specific gut microbiota and body physiology [24]. Due to the individual specificity of the gut microbiota, there may be differences in the response of people with obesity to different or even the same dietary patterns, and we hypothesized that the gut microbiota composition before the intervention could influence the metabolic and microbial responses produced by the HBD intervention in people with obesity. To verify this hypothesis, we designed a 12-week HBD intervention to assist with weight loss on top of fundamental exercises for people with obesity. A series of analyses were performed on the gut microbiota before and after HBD intervention, including alpha diversity, beta diversity, linear discriminant analysis effect size (LEfSe), and co-occurrence network analyses. Thus, this work indicated the role of the gut microbiota profile of subjects with obesity in determining the efficacy of HBD in regulating obesity and disorders thereof. This knowledge provides a clinical basis for the development of effective dietary intervention strategies based on the obese-affected gut microbiota profile. In addition, to further identify potential biomarkers of people with obesity, machine learning (ML) algorithms were utilized to classify people with obesity before and after receiving balanced diet interventions. Using feature importance information from classifiers to determine which bacteria are most associated with obesity is an effective research approach.
2. Materials and Methods
2.1. Materials and Diet
The trial was conducted in the Affiliated Wuxi People’s Hospital of Nanjing Medical University (Wuxi, China) and ratified by the hospital’s ethics committee (KYLLKS 201806). The recruitment of subjects began after registering at the Chinese Trial Registry (ChiCTR1800015923). The inclusion criteria were as follows: age of 18–65 years, body mass index (BMI) ≥ 28 kg/m2, and stable body weight (BW) during the first three months. Volunteers were excluded if they accorded with any specific criteria in the previous analysis [25].
All subjects underwent a 4-week run-in period to guide diet, aerobic, and resistance exercises, followed by a 12-week intervention phase aiming to lose weight. The nutrient composition of the HBD was 24% protein, 37% fat, and 39% carbohydrate, as determined according to the participant’s basal metabolic rate. The basal metabolic rate measured using the InBody S10 body bioelectrical impedance analyzer was multiplied by 1.2 to calibrate the total calories needed (Table 1).

Table 1.
Nutrient composition of the HBD.
For vegetables, subjects could choose tender stems, leaves, cauliflower, onion and garlic, fungus and algae, eggplant, and aquatic vegetables. For lean meat, subjects could choose lean livestock and poultry meat. Aquatic products could include freshwater and saltwater fish, freshwater and saltwater shrimp, and shellfish. Subjects could also eat fruits (i.e., apple, kiwi, and citrus); nuts such as almonds and cashews; and oil, including olive oil, linseed oil, and tea seed oil.
The exercise scheme designed for the HBD subjects included aerobic and resistance exercises, and the specific plan was described in the previous analysis [25].
Before study initiation, nutritionists informed the subjects of the weight loss plan and exercise regimen. They also closely communicated with the subjects and provided guidance throughout the study. The subjects reported their diet, food weight, body weight, and any physical discomfort through pictures and text in a WeChat group daily. They participated in the appropriate aerobic and resistance exercise regimen while receiving the dietary intervention. During the implementation of the program, the nutritionists followed up with the patients on WeChat daily. In the case of problems, the nutritionists discussed and proposed solutions in addition to maintaining good records and conducting monthly outpatient consultations.
2.2. Anthropometric Evaluation
BW, height, systolic and diastolic blood pressure (SBP and DBP), waist circumference (WC), and hip circumference (HC) were measured at 0 and 12 weeks. All measurements of paraments were obtained in the previous analysis.
2.3. Blood Chemistry Paraments Determination
Concentrations of albumin, fasting blood glucose [FBG], creatinine, triglyceride [TG], total cholesterol [TC], high-density lipoprotein cholesterol [HDL-c], low-density lipoprotein cholesterol [LDL-c], blood urea nitrogen [BUN], uric acid, alanine transaminase [ALT], aspartate transaminase [AST], gamma-glutamyl transpeptidase [GGT], and alkaline phosphatase [ALP] were measured after an 8 h fast at 0 and 12 weeks using the AU5800 clinical chemistry analyzer (Beckman Coulter, Inc., Sykesville, MD, USA). The hemoglobin A1c level [HbA1c] was also measured before and after the HBD using VARIANT II Hemoglobin Testing System (Bio-Rad, Hercules, CA, USA).
2.4. Fecal Samples Collection and Storage
As the target of this study was to investigate the effects of changes in the gut microbiota of subjects with obesity before and after the HBD, fecal samples were collected in collection tubes from the study subjects at 0 and 12 weeks for subsequent bacterial composition determination and amplicon sequencing. Briefly, the subjects were asked to empty their bowels into a clean container to prevent sample contamination. After the fecal sample was collected, the collection date was marked on the collection tube, and the sample was immediately stored at −80 °C to stabilize its microbial composition. In addition, fecal samples were transported on dry ice in the dark.
2.5. DNA Extraction from Fecal Samples
DNA extraction was performed for each fecal sample according to the manufacturer’s instructions, using the FastDNA Spin Kit for Feces (MP Biomedicals, Solon, OH, USA). The 16 S rRNA V3–V4 hypervariable region was amplified using the 16 S V3 314 F for-ward and V4 806 R reverse primers. Subsequent sequencing using specific adapters was performed on the Illumina MiSeq PE300 platform (Illumina, San Diego, CA, USA). The resulting amplification solution was purified with a Gel/PCR Extraction Kit (Biomiga Inc., San Diego, CA, USA). DNA libraries were prepared using the TruSeq DNA LT Sample Preparation Kit (Illumina).
The fecal samples were pretreated before DNA extraction. The fecal samples (500 mg) without glycerin were directly added to the Lysing Matrix E tube. The fecal samples containing glycerol were centrifugated at 13,000 g for 3 min after thawing, then the supernatant was removed, and 500 mg residue was added to the Lysing Matrix E tube.
2.6. Bioinformatics Analysis
2.6.1. Gut Microbiota Analyses
The previous article explained the process for obtaining the OTU table using qiime2-2022.2 software to analyze the gut microbiota data [25]. Subsequently, the OTU table was extracted and normalized to generate the relative abundance tables at both the phylum and genus levels.
In addition, we employed various indices to assess alpha diversity, including the phylogenetic diversity (PD) index, the Shannon index, the Pielou evenness index, and the observed OTU counts. To analyze alpha diversity, we utilized R packages such as ggplot2 [26] and ggsignif [27] for data visualization and significance annotation.
We utilized the vegan package for beta diversity analysis to calculate Bray–Curtis phase dissimilarity and unweighted and weighted UniFrac distances. We then explored the resulting phase dissimilarity matrix using multivariate techniques from R packages such as ade4 [28] and psych [29]. In summary, we utilized R packages ggplot2 [26] and ggsignif [27] to visualize alpha diversity, while R packages vegan [30], ade4 [28], and psych [29] were employed to investigate patterns of beta diversity. These R packages provide crucial tools for analyzing and visualizing the diversity of microbial communities in our study. LEfSe [31] was exploited to recognize the bacterial taxa leading to differences before and after the HBD intervention. To construct the co-occurrence network, the genera with relative abundances of less than 0.1% were removed at first. Secondly, the Spearman correlation coefficients of each genus in a single group were calculated by using the corr. test function in R package psych [29], and the correlation coefficient matrix and p-value matrix were obtained. The Benjamini–Hochberg False Discovery Rate (FDR) method was used to correct the p-value obtained in the above steps [32]. Lastly, the co-occurrence network of gut microbiota of two groups was established based on the Spearman correlation matrix and corrected p-value matrix [33]. The co-occurrence networks were constructed in the condition of correlation coefficients (r > |0.6|) and the false discovery rate (p < 0.05) and were visualized using Gephi 0.9.6 software [34].
2.6.2. Construction of Machine Learning Binary Classifiers
This study employed machine learning models to assess classification accuracy and identify key bacterial genera. To model the relative abundance of bacterial genera before and after the intervention, we employed eight models, namely k-nearest neighbor (kNN), support vector machine (SVM), decision tree (DT), random forest (RF), gradient boosting regression tree (GB), extreme gradient boosting (XGB and XGBRF), and LightGBM (LGB), to predict classification effectiveness. To reduce model overfitting and provide a more accurate performance evaluation, we utilized 10-fold cross-validation with 5 repetitions. The area under the ROC curve (AUC) was chosen as the model performance evaluation index. Furthermore, in descending order, we extracted the top 10 feature importance based on the feature importance of DT, RF, GB, XGB, XGBRF, and LGB. Among these models, KNN, SVM, DT, RF, and GB were constructed using the scikit-learn package [35]. XGB and XGBRF were built using the XGBoost package [36], while LGB was implemented using the Lightgbm package [37].
2.7. Statistical Analyses
Statistical analyses were conducted using the R Statistical Package (version 4.2.0; https://www.r-project.org/ (accessed on 22 April 2022)). Comparisons of anthropometric assessment indicators before and after the HBD were conducted using the Wilcoxon rank-sum test or paired t-test. The data are presented as the mean ± standard deviation. The Shapiro–Wilk test was used to determine whether the data were normally distributed. To compare the data, we used the paired t-test for normally distributed data and the Wilcoxon rank-sum test for non-normally distributed data. We compared the gut microbiota diversity abundance in the phylum and genus taxon between the two groups before and after the HBD using the Wilcoxon rank-sum test in the R statistical package. A p-value < 0.05 was considered statistically significant.
3. Results
3.1. Differential Response to HBD Based on the Anthropometric and Clinical Blood Chemistry Parameters in Subjects with Obesity
Forty-three subjects (72% male and 28% female), with a mean age of 33.60 ± 8.44 years, a mean weight of 88.54 ± 13.33 kg, and a mean height of 168.33 ± 6.64 cm, were included in this study. The subjects were not significantly different (based on the Wilcoxon rank-sum test or paired t-test) in terms of their age, weight, height, and BMI. At week 0, the mean BMI of the subjects was 31.13 ± 3.22 kg/m2. At week 12, there was no statistically significant change in weight loss among the subjects, whereas the mean weight loss was 4.1%. In addition, after the intervention, levels of weight, BMI, WC, HC, uric acid, LDL-c, and TG decreased, but not statistically (Table 2). However, only WC, creatinine, and FBG significantly reduced (p < 0.05; Table 2). These improvements in anthropometric and blood biochemical indicators essentially indicated an improvement in obesity status. The weight loss success rate among the subjects was 44% (weight loss ≥ 5% was regarded as weight loss success). The subjects were then divided into two groups based on successful weight loss: those with weight loss below 5% comprised the ineffective HBD group (IHBD), and those with weight loss not less than 5% comprised the effective HBD group (EHBD).
BW1: BW was measured before the intervention; BW2: was measured after the intervention.
Table 2.
Subjects’ anthropometric and clinical blood chemistry parameters before and after the HBD intervention.
Table 2.
Subjects’ anthropometric and clinical blood chemistry parameters before and after the HBD intervention.
| Index | Pre-HBD | Post-HBD | p | Change | n |
|---|---|---|---|---|---|
| BW [kg] | 88.5 ± 13.3 | 85.0 ± 13.8 | 0.283 | −3.5 ± 3.3 | 43 |
| BMI [kg/m2] | 31.1 ± 3.2 | 29.9 ± 3.5 | 0.087 | −1.3 ± 1.1 | 43 |
| WC [cm] | 100.8 ± 9.3 | 94.4 ± 17.8 | 0.026 | −4.4 ± 3.2 | 43 |
| HC [cm] | 105.2 ± 6.5 | 101.1 ± 17.3 | 0.293 | −1.9 ± 2.3 | 43 |
| SBP [mmHg] | 129.2 ± 11.6 | 126.3 ± 13.3 | 0.082 | −2.9 ± 10.6 | 43 |
| DBP [mmHg] | 74.7 ± 10.3 | 72.7 ± 9.6 | 0.188 | −2.0 ± 9.9 | 43 |
| Albumin [g/L] | 46.1 ± 2.4 | 45.7 ± 2.7 | 0.377 | −0.3 ± 2.4 | 41 |
| ALT [U/L] | 46.0 ± 29.5 | 31.7 ± 18.4 | 0.117 | −14.3 ± 19.9 | 43 |
| AST [U/L] | 28.4 ± 11.4 | 25.1 ± 20.9 | 0.066 | −3.3 ± 22.4 | 43 |
| ALP [U/L] | 89.8 ± 22.3 | 85.6 ± 18.2 | 0.051 | −4.2 ± 13.6 | 43 |
| GGT [U/L] | 37.6 ± 24.4 | 33.3 ± 19.8 | 0.616 | −4.3 ± 13.5 | 43 |
| BUN [mmol/L] | 5.1 ± 1.4 | 5.3 ± 1.5 | 0.952 | 0.3 ± 1.2 | 43 |
| Creatinine [µmol/L] | 76.0 ± 13.3 | 74.2 ± 12.6 | 0.030 | −1.8 ± 5.3 | 43 |
| Uric acid [µmol/L] | 429.2 ± 104.4 | 412.9 ± 99.3 | 0.061 | −16.3 ± 55.5 | 43 |
| TG [mmol/L] | 2.0 ± 1.2 | 1.9 ± 1.1 | 0.378 | −0.1 ± 0.9 | 43 |
| TC [mmol/L] | 4.8 ± 0.9 | 4.9 ± 0.9 | 0.509 | 0.1 ± 0.6 | 43 |
| LDL-c [mmol/L] | 3.0 ± 0.9 | 2.9 ± 0.8 | 0.634 | −0.1 ± 0.5 | 43 |
| HDL-c [mmol/L] | 0.9 ± 0.2 | 1.0 ± 0.2 | 0.102 | 0.1 ± 0.1 | 43 |
| FBG [mmol/L] | 5.2 ± 0.6 | 5.0 ± 0.5 | 0.005 | −0.2 ± 0.5 | 43 |
| HbA1c [%] | 5.1 ± 0.4 | 5.2 ± 0.4 | 0.138 | 0.1 ± 0.4 | 43 |
Abbreviations: BW, body weight; BMI, body mass index; WC, waist circumference; HC, hip circumference; SBP, systolic blood pressure; DBP, diastolic blood pressure; ALT, alanine transferase; AST, aspartate transaminase; ALP, alkaline phosphatase; GGT, gamma-glutamyl transpeptidase; BUN, blood urea nitrogen; TG, triglyceride; TC, total cholesterol; LDL-c, low-density lipoprotein cholesterol; HDL-c, high-density lipoprotein cholesterol; FBG, fasting blood glucose; HbA1c, hemoglobin Alc. The p-value is calculated using the Wilcoxon rank-sum test or paired t-test and represents the difference before and after HBD intervention. The n-number is the number of samples before and after the HBD intervention.
The statistical analysis results of the changes in anthropometric and blood biochemical indicators during the study in the EHBD and IHBD groups are shown in Table 3 and Table 4, respectively. The levels of weight, BMI, WC, SBP, Albumin, ALP, Creatinine, LDL-c, and FBG decreased significantly in the EHBD group after the intervention, while the levels of HDL-c increased significantly (Table 3). Of the anthropometric and blood chemistry parameters, only weight, HDL-c, and AST changed significantly after the intervention in the IHBD group (Table 4). In addition, we noted a downward but not significant trend in HC, DBP, ALT, GGT, uric acid, TG, and TC in the EHBD group (Table 3). Moreover, at the end of the 12-week intervention, consistent changes in weight, BMI, WC, HC, SBP, DBP, ALT, GGT, BUN, creatinine, uric acid, HDL-c, and FBG were observed in both the EHBD and IHBD groups. These results indicated that the HBD intervention improves the anthropometric and blood chemistry parameters of subjects with obesity. In summary, the implementation of HBD, especially in the EHBD group, has shown positive outcomes in influencing the health of individuals with obesity by enhancing various anthropometric and blood chemistry parameters.
Table 3.
Subjects’ anthropometric and clinical blood chemistry parameters before and after the HBD in the EHBD group.
Table 4.
Subjects’ anthropometric and clinical blood chemistry parameters before and after the HBD in the IHBD group.
3.2. HBD Alters the Gut Microbiota in Subjects with Obesity
Differential abundance of OTUs at the phylum, class, order, family, and genus levels of bacterial taxonomic classification revealed differences in the relative abundance of several taxa before and after the HBD intervention (Figure 1a–d and Figure 2a–c). At the phylum level, the predominant phyla before and after the HBD were Firmicutes, Bacteroidetes, Proteobacteria, and Actinobacteria (Figure 1c). At the class level, Erysipelotrichia was significantly reduced (p < 0.05) in the EHBD group after 12 weeks of treatment, whereas no significant changes were observed in the IHBD group (Figure 2a,c). At the order level, a dramatic decrease in Pseudomonadales and Erysipelotrichales was observed after the intervention (p < 0.05) in the EHBD group, and Pseudomonadales also decreased in the IHBD group (Figure 2a–c). At the family level, the EHBD group showed a dramatic decrease in Pseudomonadaceae and Erysipelotrichaceae, while Pseudomonadaceae decreased after the intervention (Figure 2c). At the genus level, the predominant groups before and after HBD included Bacteroides, Faecalibacterium, Prevotella 9, Escherichia-Shigella, Blautia, Alistipes, and Ruminococcus torques (Figure 1d). Meanwhile, LEfSe analysis revealed a significant reduction in some genera after HBD intervention (Figure 2a–c); for example, Blautia, Lachnoclostridium, Ruminococcus (R. torques, R. gnavus), and Terrisporobacter were dramatically reduced in the EHBD group (p < 0.05). The significant reduction in Veillonella (p < 0.05) was unique to the IHBD group. After the HBD intervention, Pseudomonas significantly reduced (p < 0.05) in the gut microbiota of the EHBD and IHBD groups. Comparing the characteristic bacterial genera of the baseline gut microbiota between the EHBD and IHBD groups, we discovered that the EHBD group had more characteristic bacterial genera at baseline (at the beginning of the trial). For example, Parabacteroides, Ruminococcus gnavus, Parasutterella, Intestinibacter, and DTU089 were characteristic genera in the EHBD group, whereas Erysipelotrichaceae UCG 003 and Klebsiella were characteristic genera in the IHBD group (Figure 2d).
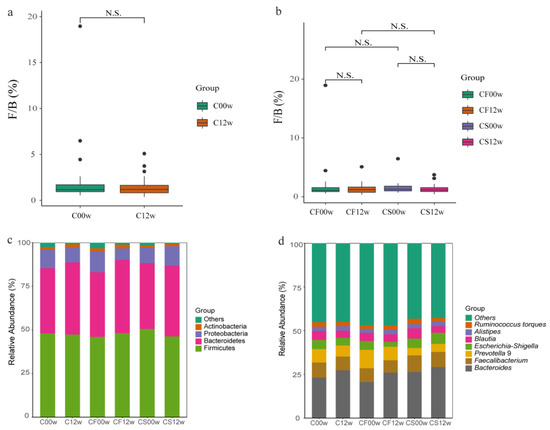
Figure 1.
Differences in the gut microbiota before and after the HBD in the EHBD and IHBD groups. (a) The ratio of Firmicutes to Bacteroidetes at the phylum level (N.S.: p > 0.05). C00w: before the HBD intervention; C12w: after the intervention. Differences in the gut microbiota before and after the intervention in the EHBD and IHBD groups; (b) the ratio of Firmicutes to Bacteroidetes at the genus level (N.S.: p > 0.05); (c) gut microbiota composition at the phylum level; (d) gut microbiota composition at the genus level.
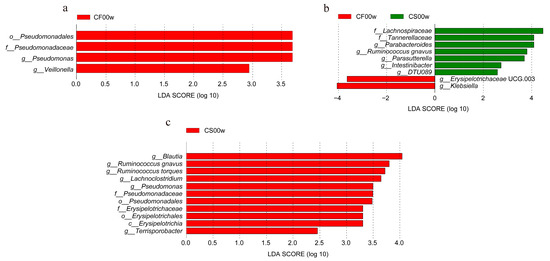
Figure 2.
Differences in the gut microbiota before and after the HBD in the EHBD and IHBD groups. (a–c) LEfSe plot showing the unique genus signatures identified. CF00w: before the intervention, IHBD; CF12w: after the intervention, IHBD; CS00w: before the intervention, EHBD; CS12w: after the intervention, EHBD.
Faith’s phylogenetic diversity (PD) index, the Shannon index, Pielou’s evenness index, and observed OTUs were calculated to gain insights into changes in the gut microbiota before and after the HBD intervention (Figure 1a,b and Supplementary Material Figure S1a–f). These indices showed the richness and diversity of the gut microbiota and the evenness of the distribution of microbial community abundances. There were no striking differences in Faith’s PD index, the Shannon index, Pielou’s evenness index, and observed OTUs in the microbiota before and after the HBD intervention (Figure 3a and Supplementary Material Figure S1a–c). However, there was a slight increase in Pielou’s evenness index in the IHBD group and a slight decrease in the EHBD group (Figure 3b). This indicated that after the HBD intervention, bacterial genera uniformity of the gut microbiota increased in the IHBD group and decreased in the EHBD group. In addition, Faith’s PD index, the observed OTUs, and the Shannon index in the EHBD and IHBD groups were decreased (Supplementary Material Figure S1d–f), indicating that the OTU complexity and community diversity of the gut microbiota decreased in both groups.
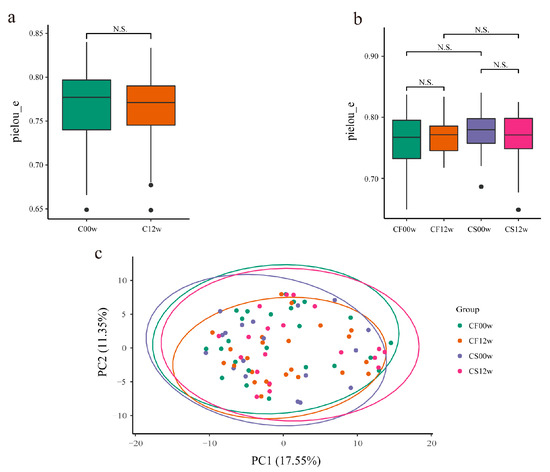
Figure 3.
Differences in the gut microbiota before and after the HBD. (a) Alpha diversity based on the pielou_e index (N.S.: p > 0.05); (b) alpha diversity based on the pielou_e index (N.S: p > 0.05); (c) beta diversity. CF00w: before the intervention, IHBD; CF12w: after the intervention, IHBD; CS00w: before the intervention, EHBD; CS12w: after the intervention, EHBD.
Beta diversity reflects the variation in bacterial genera abundance distribution among samples. The beta diversity in both HBD groups was calculated using the Bray–Curtis dissimilarity, weighted, and unweighted UniFrac analyses (Supplementary Material Figure S2a–f). Beta diversity in the gut microbiota did not differ significantly before and after the intervention in the EHBD and IHBD groups (Figure 3c), which indicated that the structure of the gut microbiota after the intervention was highly similar to that before the intervention. Based on the Wilcoxon rank-sum test, the EHBD and IHBD groups showed significant differences in the Bray–Curtis dissimilarity and unweighted and weighted UniFrac distances (Supplementary Material Figure S2d–f). It is worth noting that there were significant differences between CS00w and CF00w (before the intervention in the EHBD and IHBD groups, respectively) based on the Bray–Curtis dissimilarity and weighted UniFrac distances. In addition, based on the Bray–Curtis dissimilarity, the gut microbiota structure of the CS12w group (after the intervention in the EHBD group) was found to be dramatically different from those in the CF12w group (after the intervention in the IHBD group) after the HBD intervention. Furthermore, the difference in the EHBD group was more dramatic than that in the IHBD group before and after the intervention (Supplementary Material Figure S2d). Based on the weighted UniFrac distance, the gut microbiota structure of the subjects in the CS12w and CF12w groups was more similar to each other after the intervention and significantly different from the gut microbiota structure of the subjects before the intervention (Supplementary Material Figure S2c). This showed that the gut microbiota structure of the subjects changed after the HBD intervention, which was more evident in the EHBD group. More importantly, differences in the gut microbiota at baseline between the EHBD and the IHBD groups may be for the point which resulted in successful weight loss in only one of the groups.
In summary, the significantly altered genera in the EHBD group may serve as key reference indicators for dietary intervention in the gut microbiota of subjects with obesity.
3.3. Machine Learning Models Reveal the Importance of Gut Microbiota Characteristics in Subjects with Obesity
Based on the dataset before and after the HBD intervention, a machine learning binary classifier was developed to classify the samples accurately. According to the model evaluation, the XGBRF model had the best classification performance with an AUC value of 0.73 (Figure 4a). Therefore, the XGBRF model was chosen to determine the feature importance in the subjects with obesity. The results showed that Pseudomonas, Escherichia-Shigella, Romboutsia, Ruminococcus 1, Butyricicoccus, Subdoligranulum, Ruminiclostridium 9, Akkermansia, Fusicatenibacter, and Haemophilus were the top 10 key bacterial genera for the subjects with obesity (Figure 4b). Before and after the EHBD intervention, the model with the best classification performance according to model evaluation was also XGBRF with an AUC value of 0.69 (Figure 4a). The results showed that the top 10 key bacterial genera in terms of feature importance included Eubacterium hallii, Lachnoclostridium, Parasutterella, Eubacterium eligens, Lachnospiraceae NK4A136, Blautia, Sutterella, Parabacteroides, Lachnospiraceae FCS020, and Ruminococcaceae UCG 013 (Figure 4c). Before the EHBD and IHBD intervention, the model with the best classification performance according to model evaluation was GB, with an AUC value was 0.57 (Figure 4a). The top 10 key bacterial genera in order of characteristic importance score were obtained as follows: Collinsella, Escherichia-Shigella, Fusicatenibacter, Paraprevotella, Alistipes, Eubacterium hallii, Butyricimonas, Methanobrevibacter, Pseudomonas, and Coprococcus 3 (Figure 4d).
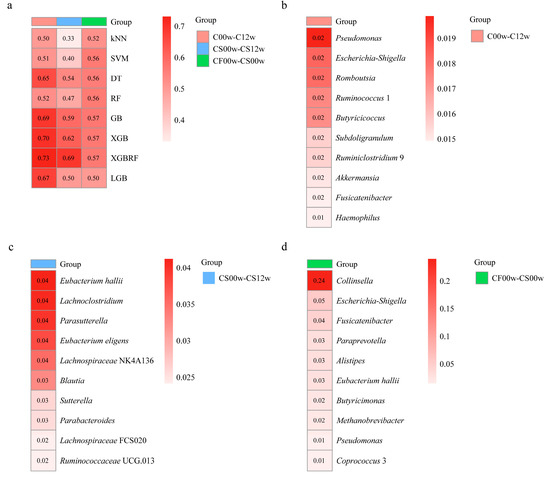
Figure 4.
Performance of a binary classification model based on bacterial genera composition of the gut microbiota. (a) The ability of eight machine algorithms to predict the bacterial genera composition (evaluation metric is AUC); (b) top 10 key bacterial genera for subjects with obesity based on the XGBRF model before and after the HBD intervention; (c) top 10 key bacterial genera for subjects with obesity based on XGBRF model before and after the EHBD intervention; (d) top 10 key bacterial genera for subjects with obesity based on the GB model before the EHBD and IHBD intervention.
Among the above-listed genera, Pseudomonas has the most critical role as a key bacterial genus before and after HBD. Although Pseudomonas was not among the top 10 feature importance of the EHBD group, it still belonged to the key genera when considering the Lefse results (Supplementary Material Figure S3a). In addition, in a previous study, pre-intervention levels of Butyricoccus promoted a response to inulin, leading to a decrease in body mass index in subjects with obesity [18]. Based on our findings, it was found that Butyricoccus was able to distinguish to some extent between subjects who had received the HBD intervention and those who had not. The box plot clearly showed that the abundance of this genus in the gut of subjects with obesity increased after the HBD intervention (Supplementary Material Figure S3b). This finding suggested that Butyricoccus responded positively to a balanced diet as an intervention. Surprisingly, in our study, Blautia showed a decline after the HBD intervention, regardless of whether the subjects had positive responses in their gut microbiota (Supplementary Material Figure S3c). However, many studies have shown that Blautia was negatively correlated with the visceral fat area at the genus level [18,38]. In the EHBD group, in addition to a significant reduction in Blautia after the intervention, there was also a significant reduction in Lachnoclostridium (Supplementary Material Figure S3d).
In summary, machine learning methods provided valuable tools and opportunities for a deeper understanding of the complex issue of obesity. Through model evaluation and feature importance analysis, key features of obesity can be identified, enabling a more profound comprehension of the underlying mechanisms. Furthermore, this knowledge can aid in developing effective strategies to combat obesity.
3.4. HBD Alters the Gut Microbiota Co-Occurrence Networks in Subjects with Obesity
To investigate the differences in the bacterial interaction patterns of gut microbiota before and after HBD, we constructed co-occurrence networks filtered with the following criteria: strong correlation (|r| > 0.6) and p-value < 0.05. A total of 152 positive and 16 negative significant correlations were found between 114 genera in the EHBD group before the HBD (Table 5), compared with 133 positive and 21 negative significant correlations between 111 genera after the HBD intervention (Table 5). In addition, 78 positive and six negative significant correlations were found between 111 genera in the IHBD group before the HBD (Table 6), compared with 77 positive and nine negative significant correlations between 108 genera after the HBD intervention (Table 6).
Table 5.
Topological features of the CS0 network and CS12 network in the EHBD group.
Table 6.
Topological features of the CF0 network and CF12 network in the IHBD group.
After the HBD intervention, the average clustering coefficients increased from 0.258 to 0.484 in the gut microbiota co-occurrence networks in the IHBD group, whereas the clustering coefficients generally decreased in the EHBD group, indicating individual differences in the complexity of co-occurrence networks. We applied a modularity algorithm in Gephi to cluster bacterial nodes into subgroups with a higher connection density between nodes in subgroups than in non-subgroup networks. There were two major subclusters with more than 10 nodes recognized in the CF0 network and one major subcluster with more than 10 nodes identified in the CF12 network (Figure 5a,b), while the number of main subclusters with >10 nodes increased from 2 to 4 in the CS0 and CS12 co-occurrence networks (Figure 5c,d).
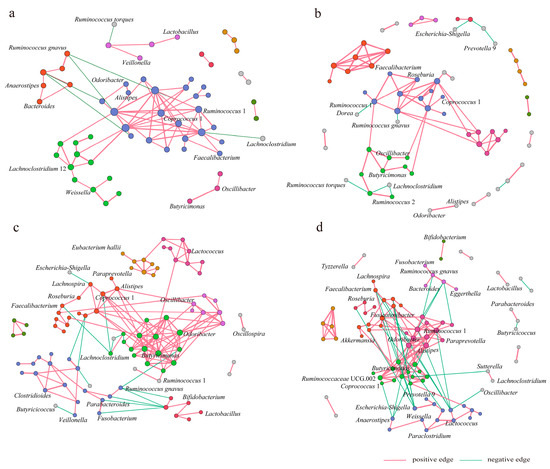
Figure 5.
The HBD alters the gut microbiota co-occurrence network. The main network nodes are labeled by the genus, and the interactions between genera are composed of nodes and edges. (a) CF0 network; (b) CF12 network; (c) CS0 network; (d) CS12 network. CF0: before the intervention, IHBD group; CF12w: after the intervention, IHBD; CS00w: before the intervention, EHBD; CS12w: after the intervention, EHBD.
After the HBD intervention, the nodes and interactions between genera in gut microbiota co-occurrence networks changed in the EHBD and IHBD groups. Ruminococcus 1 and Lachnoclostridium 12 dominated two major modules of the CF0 network, respectively, while Ruminococcus 1 dominated one major module of the CF12 network. Alistipes, Odoribacter, and Butyricimonas dominated two major modules of the CS0 network, while Fusicatenibacter, Ruminococcus 1, Lactococcus, and Ruminococcaceae UCG 002 dominated in the four major modules of the CS12 network. Specifically, HBD altered the interactions of the core genera associated with obesity in the gut microbiota network of EHBD group patients; for example, the interactions of Escherichia-Shigella, Faecalibacterium, and Alistipes with other genera increased. Before the intervention, the pathogenic bacterial genera Escherichia-Shigella had a negative association with Lachnospira. However, this genus showed positive associations with Faecalibacterium, Fusicatenibacter, Lachnospiraceae UCG 001, Ruminococcus gauvreauii, and Lachnospiraceae NK4A136 after the intervention. In addition, HBD altered the interactions of the non-core genera connected with obesity in the gut microbiota network of the EHBD group. The interactions of Ruminococcus 1, Weissella, and Akkermansia with other genera were found to be increased. However, the interactions of Roseburia, Lactobacillus, Bifidobacterium, Lachnospira, Odoribacter, and Butyricicoccus with other genera decreased. In the IHBD group, the interaction between Dorea and Ruminococcus 1 and the interactions between Butyricicoccus and other genera enhanced, but the interactions of Ruminococcus gnavus, Coprococcus 1, and Weissia with other genera became weak.
In summary, after the HBD, subjects in the EHBD group lost weight successfully. Their gut microbiota co-occurrence networks tended to be normal, but the interaction relationships between some conditioned pathogenic bacterial genera and other bacterial genera were enhanced.
4. Discussion
Diet is recognized as a vital factor affecting the diversity and function of the gut microbiota. However, high-calorie diets and food containing high-fat content are not considered healthy. The regular intake of such diets results in the disruption of energy balance, leading to several metabolic disorders, such as obesity. Moreover, high-calorie and high-fat diets alter the gut microbiota diversity, leading to the loss of gut barrier function [39]. However, a recent study confirmed that caloric restriction helps reduce weight loss and improve the gut microbiota profile and associated functions [40,41,42]. Therefore, nutritional intervention with HBD affects the gut microbiota composition of subjects with obesity, making those genera dominant, which regulate human metabolism.
It is equally important to determine the taxonomic changes induced by the HBD intake so that role of the specific gut microbiota in relation to obesity is highlighted. In this study, LEfSe analysis showed some genera that were significantly reduced in the EHBD group, including Blautia, Lachnoclostridium, Ruminococcus (R. torques, R. gnavus), and Terrisporobacter. Among them, Blautia and Lachnoclostridium were also the top 10 key genera of the EHBD group before and after the intervention. Therefore, we speculated that the decrease in abundance of these genera may be responsible for 5% of the weight loss. Previously, the abundance of Blautia was confirmed to be significantly positively associated with BMI [43]. Blautia composition has been reported to be associated with eating patterns and influenced by dietary fat content. A cross-sectional study in human adults confirmed the inverse relationship between Blautia wexlerae and obesity and further confirmed its ameliorative effects on obesity via metabolic remodeling of the gut microbiota [44]. Another cross-sectional study on the compositional changes in the gut microbiota with aging showed a reduction in the overall gut microbiota diversity with age, including a significant reduction in the relative abundance of Blautia [45]. Our results on the inverse association of other bacterial genera with obesity also align with some previous findings. A correlation study between the gut microbiota and obesity-related indicators in human subjects showed a significantly positive association between Lachnoclostridium and BW [46]. Although Ruminococcus gnavus was initially identified in 1974 as a strictly anaerobic bacterium in the healthy human gut [47], some studies have indicated its overrepresentation in certain diseases [48], such as obesity and other metabolic diseases. Moreover, it has been observed to decrease in abundance during weight loss, consistent with earlier studies [49]. In addition, it has been shown that Ruminococcus gnavus is an opportunistic pathogen and is positively associated with obesity [50]. Another study reported the association of Ruminococcus torques and Ruminococcus gnavus with visceral fat accumulation [51]. Therefore, it is speculated that a reduction in visceral fat due to successful weight loss leads to a reduction in these two genera. In the IHBD group in the current study, Veillonella was the only genus that showed a decrease in relative abundance, and that made the two groups (IHBD and EHBD) different. Veillonella can metabolize lactic acid and reduce the insulin resistance induced by lactic acid in subjects with obesity [52], so it can be inferred that although weight loss does not reach 5% in some patients, the gut microbiota may change beneficially. There have been few reports on the association between Pseudomonas and obesity. Our results showed that Pseudomonas decreased with weight loss in both the EHBD and IHBD groups, suggesting that the relationship between Pseudomonas and an HBD is worth further study.
There are multiple microbial communities in the human gut, in which the organisms interact closely with each other. However, our understanding of the role of the gut microbiota in a diet influencing obesity depends mainly on the difference in microbial abundance, whereas little is known about the role of microbial interactions in obesity [53]. In the current study, we utilized co-occurrence network analysis to find associations in bacterial genera based on 16S rRNA sequencing. The key network bacterial genera identified in subjects with obesity highlight their potential roles in modulating the microbial ecosystem in the context of obesity. Our study demonstrated that the co-occurrence networks in the gut microbiota were significantly altered after 12 weeks of the HBD intervention. In the EHBD group, the reduction in network complexity and modularity suggested that the symbiotic network of the gut microbiota appeared to have become simpler after the HBD intervention, but this was not found in the IHBD group. The abundance of Escherichia-Shigella has been found to significantly increase in subjects with obesity [13,54]. Escherichia-Shigella and Klebsiella, as genera of potentially pathogenic bacteria, were found to be positively correlated with each other in the CS12 network, suggesting that there may be synergistic effects between harmful bacteria. Significant differences in dominant genera between the CF0 and CS0 networks suggested that successful weight loss may be related to the gut microbiota composition at baseline. In addition, a study validated our hypothesis that differences in baseline microbiota can predict weight loss on calorie-restricted diets [46].
According to our results, there is some discrepancy between the key features of obesity identified by machine learning models and the genus of features obtained using Lefse analysis. This discrepancy may be due to the different methods and algorithms used and the complexity of the obesity problem. Therefore, we focused our study on those genera identified as key genera by multiple methods to gain insight into their impact on obesity. By combining multiple methods and results, we can more fully understand the characteristics and influencing factors of obesity.
However, an intriguing finding emerged from our results, revealing no significant differences in alpha diversity between the groups at baseline and no observed changes over time after the HBD intervention. This indicated that the diet intervention had little effect on the uniformity and richness of the gut microbiota in people with obesity; however, significant differences in the overall structure of the microbiota were still observed through beta diversity analysis. Additionally, various analytical methods, including LEfSe analysis and machine learning models, allowed us to identify key bacterial genera in the gut microbiota of obese individuals before and after the HBD intervention.
Overall, these results indicated that co-occurrence networks in the gut microbiota of subjects with obesity are reorganized into fitter states after successful weight loss. More importantly, our study identified several crucial genera interactions after the HBD intervention in subjects with obesity that may modulate microbial ecosystems. In brief, microbial interactions can promote the implementation of precise diets in clinical practice based on gut microbiota to control obesity. However, there are some things that could be improved in this research. A longer intervention time is needed to assess the effectiveness of the HBD intervention. There is a need to investigate more deeply the potential causal relationship between the efficacy of HBD interventions in subjects with obesity and in which the changes in specific bacteria were observed for the gut microbiota. It is important to note that our study focused on bacterial identification at the genus level. In the future, more state-of-the-art techniques like metagenomics and metabolomics will be employed to comprehensively understand gut microbiota changes in response to the HBD intervention. The aforementioned approaches will help us to accurately predict potential targets and key bacterial genera that respond towards HBD, which would help to develop strategies to intervene in obesity.
5. Conclusions
To summarize, our study demonstrated that the HBD intervention enhanced weight loss, which has the potential to connect with diet-induced alterations in the gut microbiota. Notably, only the subjects in the EHBD group exhibited a positive response to the intervention, and the significantly altered genera in this group could serve as key indicators for dietary intervention, targeting the gut microbiota in subjects with obesity. Moreover, the gut microbiota dramatically differed from before to after the HBD intervention concerning its co-occurrence networks, which was reflected by the more significant reduction in the degree of network interaction in the EHBD group compared with the IHBD group after the HBD. In summary, the gut microbiota co-occurrence networks of the study subjects were restructured to a healthier state after weight loss. We have emphasized the features and variations at baseline in the gut microbiota between the EHBD and IHBD groups, which can serve as a reference for predicting the likelihood of successful weight loss in individuals with obesity. In addition, we can determine the contribution of machine learning classification binary models to the characteristic bacterial genera of the gut microbiota by the results of the characteristic importance ranking and further identify the most crucial characteristic bacteria, which can help to gain insight into the relationship between gut microbiota composition and obesity and dietary intervention strategies. Therefore, significant changes in the bacterial abundance and interactions of the gut microbiota may be considered key indicators for dietary intervention in subjects with obesity. All in all, our results highlighted the effects of microbiota interaction on diet-induced changes in the gut microbiota to more fully understand the mechanistic association between diet and host pathologies such as obesity.
Supplementary Materials
The following supporting information can be downloaded at: https://www.mdpi.com/article/10.3390/nu15143101/s1, Figure S1: Differences in the gut microbiota before and after the HBD (in the EHBD and IHBD groups); Figure S2: Differences in the gut microbiota before and after the HBD in the EHBD and IHBD groups; Figure S3: Differences in the gut microbiota before and after the HBD (in the EHBD and IHBD groups).
Author Contributions
Conceptualization: W.S., H.W., W.L. and W.W.; data curation: W.Y., W.S., H.W. and W.W.; formal analysis: W.S., H.W., W.L., W.Y. and Q.Z.; investigation: W.L. and Q.Z.; methodology, H.W., W.L., W.W. and Q.Z.; project administration: J.Z.; resources: W.L. and W.W.; supervision: J.Z.; validation, H.W. and W.S.; visualization: W.S. and H.W.; writing—original draft: W.S., H.W. and W.W.; writing—review and editing: F.A.S. All authors have read and agreed to the published version of the manuscript.
Funding
This work was supported by the National Natural Science Foundation of China (No. 32172212, 32172216, and 31972085), the International Science and Technology Cooperation Project of Jiangsu Province (Grant No. BZ2019016), the national first-class discipline program of Food Science and Technology (JUFSTR20180102), the Fundamental Research Funds for the Central Universities (JUSRP52003B), 111project (BP0719028), the collaborative innovation center of food safety and quality control in Jiangsu Province, the Project of Jiangsu Health Commission (LGY2019018), the Top Talent Support Program for young and middle-aged people of Wuxi Health Committee (BJ2020005), and the Wuxi Science and Technology Development Fund (Y20212024).
Institutional Review Board Statement
The study was conducted in the Affiliated Wuxi People’s Hospital of Nanjing Medical University (Wuxi, China) and approved by the hospital’s ethics committee (KYLLKS 201806).
Informed Consent Statement
Informed consent was obtained from all subjects involved in the study.
Data Availability Statement
Raw sequencing data have been submitted to the National Center for Biotechnology Information (NCBI) under study accession number PRJNA868569. The data presented in this study are available on GitHub: https://github.com/hcwang-jn/gut-HBD (accessed on 26 June 2023).
Conflicts of Interest
The authors have no conflict of interest to declare.
References
- Abarca-Gómez, L.; Abdeen, Z.A.; Hamid, Z.A.; Abu-Rmeileh, N.M.; Acosta-Cazares, B.; Acuin, C.; Adams, R.J.; Aekplakorn, W.; Afsana, K.; Aguilar-Salinas, C.A.; et al. Worldwide trends in body-mass index, underweight, overweight, and obesity from 1975 to 2016: A pooled analysis of 2416 population-based measurement studies in 128·9 million children, adolescents, and adults. Lancet 2017, 390, 2627–2642. [Google Scholar] [CrossRef] [PubMed]
- Bluher, M. Obesity: Global epidemiology and pathogenesis. Nat. Rev. Endocrinol. 2019, 15, 288–298. [Google Scholar] [CrossRef] [PubMed]
- Zeng, Q.; Li, N.S.; Pan, X.F.; Chen, L.L.; Pan, A. Clinical management and treatment of obesity in China. Lancet Diabetes Endocrinol. 2021, 9, 393–405. [Google Scholar] [CrossRef]
- Fan, Y.; Pedersen, O. Gut microbiota in human metabolic health and disease. Nat. Rev. Microbiol. 2021, 19, 55–71. [Google Scholar] [CrossRef] [PubMed]
- Lee, C.J.; Sears, C.L.; Maruthur, N. Gut microbiome and its role in obesity and insulin resistance. Ann. N. Y. Acad. Sci. 2020, 1461, 37–52. [Google Scholar] [CrossRef]
- Gomes, A.C.; Hoffmann, C.; Mota, J.F. The human gut microbiota: Metabolism and perspective in obesity. Gut Microbes 2018, 9, 308–325. [Google Scholar] [CrossRef]
- Sonnenburg, J.L.; Backhed, F. Diet-microbiota interactions as moderators of human metabolism. Nature 2016, 535, 56–64. [Google Scholar] [CrossRef]
- Ji, Y.; Mao, K.; Gao, J.; Chitrakar, B.; Sadiq, F.A.; Wang, Z.; Wu, J.; Xu, C.; Sang, Y. Pear pomace soluble dietary fiber ameliorates the negative effects of high-fat diet in mice by regulating the gut microbiota and associated metabolites. Front. Nutr. 2022, 9, 1025511. [Google Scholar] [CrossRef]
- Turnbaugh, P.J.; Ley, R.E.; Mahowald, M.A.; Magrini, V.; Mardis, E.R.; Gordon, J.I. An obesity-associated gut microbiome with increased capacity for energy harvest. Nature 2006, 444, 1027–1031. [Google Scholar] [CrossRef]
- Jumpertz, R.; Le, D.S.; Turnbaugh, P.J.; Trinidad, C.; Bogardus, C.; Gordon, J.I.; Krakoff, J. Energy-balance studies reveal associations between gut microbes, caloric load, and nutrient absorption in humans. Am. J. Clin. Nutr. 2011, 94, 58–65. [Google Scholar] [CrossRef]
- Yun, Y.; Kim, H.N.; Kim, S.E.; Heo, S.G.; Chang, Y.; Ryu, S.; Shin, H.; Kim, H.L. Comparative analysis of gut microbiota associated with body mass index in a large Korean cohort. BMC Microbiol. 2017, 17, 151. [Google Scholar] [CrossRef] [PubMed]
- Sun, L.J.; Ma, L.J.; Ma, Y.B.; Zhang, F.M.; Zhao, C.H.; Nie, Y.Z. Insights into the role of gut microbiota in obesity: Pathogenesis, mechanisms, and therapeutic perspectives. Protein Cell 2018, 9, 397–403. [Google Scholar] [CrossRef] [PubMed]
- Gao, R.; Zhu, C.; Li, H.; Yin, M.; Pan, C.; Huang, L.; Kong, C.; Wang, X.; Zhang, Y.; Qu, S.; et al. Dysbiosis Signatures of Gut Microbiota Along the Sequence from Healthy, Young Patients to Those with Overweight and Obesity. Obesity 2018, 26, 351–361. [Google Scholar] [CrossRef] [PubMed]
- Schwingshackl, L.; Zahringer, J.; Nitschke, K.; Torbahn, G.; Lohner, S.; Kuhn, T.; Fontana, L.; Veronese, N.; Schmucker, C.; Meerpohl, J.J. Impact of intermittent energy restriction on anthropometric outcomes and intermediate disease markers in patients with overweight and obesity: Systematic review and meta-analyses. Crit. Rev. Food Sci. Nutr. 2021, 61, 1293–1304. [Google Scholar] [CrossRef]
- Headland, M.L.; Clifton, P.M.; Keogh, J.B. Correction: Effect of intermittent compared to continuous energy restriction on weight loss and maintenance after 12 months in healthy overweight or obese adults. Int. J. Obes. 2019, 43, 942. [Google Scholar] [CrossRef] [PubMed]
- Pinto, A.M.; Bordoli, C.; Buckner, L.P.; Kim, C.; Kaplan, P.C.; Del Arenal, I.M.; Jeffcock, E.J.; Hall, W.L. Intermittent energy restriction is comparable to continuous energy restriction for cardiometabolic health in adults with central obesity: A randomized controlled trial; the Met-IER study. Clin. Nutr. 2020, 39, 1753–1763. [Google Scholar] [CrossRef]
- Parascinet, O.; Mas, S.; Hang, T.; Llavero, C.; Lorenzo, Ó.; Ruiz-Tovar, J. A Pilot Study: The Reduction in Fecal Acetate in Obese Patients after Probiotic Administration and Percutaneous Electrical Neurostimulation. Nutrients 2023, 15, 1067. [Google Scholar] [CrossRef]
- Rodriguez, J.; Hiel, S.; Neyrinck, A.M.; Le Roy, T.; Potgens, S.A.; Leyrolle, Q.; Pachikian, B.D.; Gianfrancesco, M.A.; Cani, P.D.; Paquot, N.; et al. Discovery of the gut microbial signature driving the efficacy of prebiotic intervention in obese patients. Gut 2020, 69, 1975–1987. [Google Scholar] [CrossRef]
- Zhang, S.; Wu, P.; Tian, Y.; Liu, B.; Huang, L.; Liu, Z.; Lin, N.; Xu, N.; Ruan, Y.; Zhang, Z.; et al. Gut Microbiota Serves a Predictable Outcome of Short-Term Low-Carbohydrate Diet (LCD) Intervention for Patients with Obesity. Microbiol. Spectr. 2021, 9, e0022321. [Google Scholar] [CrossRef]
- Dong, T.S.; Luu, K.; Lagishetty, V.; Sedighian, F.; Woo, S.-L.; Dreskin, B.W.; Katzka, W.; Chang, C.; Zhou, Y.; Arias-Jayo, N.; et al. A High Protein Calorie Restriction Diet Alters the Gut Microbiome in Obesity. Nutrients 2020, 12, 3221. [Google Scholar] [CrossRef]
- Meslier, V.; Laiola, M.; Roager, H.M.; De Filippis, F.; Roume, H.; Quinquis, B.; Giacco, R.; Mennella, I.; Ferracane, R.; Pons, N.; et al. Mediterranean diet intervention in overweight and obese subjects lowers plasma cholesterol and causes changes in the gut microbiome and metabolome independently of energy intake. Gut 2020, 69, 1258–1268. [Google Scholar] [CrossRef] [PubMed]
- Deledda, A.; Palmas, V.; Heidrich, V.; Fosci, M.; Lombardo, M.; Cambarau, G.; Lai, A.; Melis, M.; Loi, E.; Loviselli, A.; et al. Dynamics of Gut Microbiota and Clinical Variables after Ketogenic and Mediterranean Diets in Drug-Naïve Patients with Type 2 Diabetes Mellitus and Obesity. Metabolites 2022, 12, 1092. [Google Scholar] [CrossRef] [PubMed]
- Basciani, S.; Camajani, E.; Contini, S.; Persichetti, A.; Risi, R.; Bertoldi, L.; Strigari, L.; Prossomariti, G.; Watanabe, M.; Mariani, S.; et al. Very-Low-Calorie Ketogenic Diets with Whey, Vegetable, or Animal Protein in Patients with Obesity: A Randomized Pilot Study. J. Clin. Endocrinol. Metab. 2020, 105, 2939–2949. [Google Scholar] [CrossRef] [PubMed]
- Zeevi, D.; Korem, T.; Zmora, N.; Israeli, D.; Rothschild, D.; Weinberger, A.; Ben-Yacov, O.; Lador, D.; Avnit-Sagi, T.; Lotan-Pompan, M.; et al. Personalized Nutrition by Prediction of Glycemic Responses. Cell 2015, 163, 1079–1094. [Google Scholar] [CrossRef] [PubMed]
- Yuan, W.; Lu, W.; Wang, H.; Wu, W.; Zhou, Q.; Chen, Y.; Lee, Y.K.; Zhao, J.; Zhang, H.; Chen, W. A multiphase dietetic protocol incorporating an improved ketogenic diet enhances weight loss and alters the gut microbiome of obese people. Int. J. Food Sci. Nutr. 2021, 73, 238–250. [Google Scholar] [CrossRef] [PubMed]
- Wickham, H. ggplot2: Elegant Graphics for Data Analysis; Springer: New York, NY, USA, 2009. [Google Scholar]
- Ahlmann-Eltze, C.; Patil, I. ggsignif: R Package for Displaying Significance Brackets for ‘ggplot2’. 2021. Available online: https://psyarxiv.com/7awm6/ (accessed on 31 March 2021).
- Dray, S.; Dufour, A.-B. The ade4 Package: Implementing the Duality Diagram for Ecologists. J. Stat. Softw. 2007, 22, 1–20. [Google Scholar] [CrossRef]
- Revelle, W. psych: Procedures for Psychological, Psychometric, and Personality Research. R Package Version 1.0–95. 2013. Available online: https://www.researchgate.net/publication/281345624_psych_Procedures_for_Psychological_Psychometric_and_Personality_Research_R_Package_Version_10-95 (accessed on 1 January 2013).
- Dixon, P. VEGAN, a Package of R Functions for Community Ecology. J. Veg. Sci. 2003, 14, 927–930. Available online: https://www.researchgate.net/publication/216340154_VEGAN_a_package_of_R_functions_for_community_ecology (accessed on 1 December 2003). [CrossRef]
- Segata, N.; Izard, J.; Waldron, L.; Gevers, D.; Miropolsky, L.; Garrett, W.S.; Huttenhower, C. Metagenomic biomarker discovery and explanation. Genome Biol. 2011, 12, R60. [Google Scholar] [CrossRef]
- Benjamini, Y.; Krieger, A.M.; Yekutieli, D. Adaptive linear step-up procedures that control the false discovery rate. Biometrika 2006, 93, 491–507. [Google Scholar] [CrossRef]
- Langfelder, P.; Horvath, S. Fast R Functions for Robust Correlations and Hierarchical Clustering. J. Stat. Softw. 2012, 46, i11. [Google Scholar] [CrossRef]
- Bastian, M.; Heymann, S.; Jacomy, M. Gephi: An Open Source Software for Exploring and Manipulating Networks. In Proceedings of the Third International Conference on Weblogs and Social Media, ICWSM 2009, San Jose, CA, USA, 17–20 May 2009. [Google Scholar]
- Pedregosa, F.; Varoquaux, G.; Gramfort, A.; Michel, V.; Thirion, B.; Grisel, O.; Blondel, M.; Prettenhofer, P.; Weiss, R.; Dubourg, V.; et al. Scikit-learn: Machine Learning in Python. J. Mach. Learn. Res. 2011, 12, 2825–2830. [Google Scholar]
- Chen, T.; Guestrin, C. XGBoost: A Scalable Tree Boosting System. In Proceedings of the KDD ‘16: Proceedings of the 22nd ACM SIGKDD International Conference on Knowledge Discovery and Data Mining, San Francisco, CA, USA, 13–17 August 2016. [Google Scholar]
- Ke, G.; Meng, Q.; Finley, T.; Wang, T.; Chen, W.; Ma, W.; Ye, Q.; Liu, T.-Y. Lightgbm: A highly efficient gradient boosting decision tree. In Proceedings of the 31st International Conference on Neural Information Processing Systems, Long Beach, CA, USA, 4–9 December 2017; pp. 3146–3154. [Google Scholar]
- Ozato, N.; Saito, S.; Yamaguchi, T.; Katashima, M.; Tokuda, I.; Sawada, K.; Katsuragi, Y.; Kakuta, M.; Imoto, S.; Ihara, K.; et al. Blautia genus associated with visceral fat accumulation in adults 20–76 years of age. NPJ Biofilms Microbiomes 2019, 5, 28. [Google Scholar] [CrossRef] [PubMed]
- Okyere, S.K.; Wen, J.; Cui, Y.; Xie, L.; Gao, P.; Zhang, M.; Wang, J.; Wang, S.; Ran, Y.; Ren, Z.; et al. Bacillus toyonensis SAU-19 and SAU-20 Isolated from Ageratina adenophora Alleviates the Intestinal Structure and Integrity Damage Associated with Gut Dysbiosis in Mice Fed High Fat Diet. Front. Microbiol. 2022, 13, 820236. [Google Scholar] [CrossRef] [PubMed]
- Sbierski-Kind, J.; Grenkowitz, S.; Schlickeiser, S.; Sandforth, A.; Friedrich, M.; Kunkel, D.; Glauben, R.; Brachs, S.; Mai, K.; Thürmer, A.; et al. Effects of caloric restriction on the gut microbiome are linked with immune senescence. Microbiome 2022, 10, 57. [Google Scholar] [CrossRef] [PubMed]
- Stanislawski, M.A.; Frank, D.N.; Borengasser, S.J.; Ostendorf, D.M.; Ir, D.; Jambal, P.; Bing, K.; Wayland, L.; Siebert, J.C.; Bessesen, D.H.; et al. The Gut Microbiota during a Behavioral Weight Loss Intervention. Nutrients 2021, 13, 3248. [Google Scholar] [CrossRef] [PubMed]
- Ott, B.; Skurk, T.; Hastreiter, L.; Lagkouvardos, I.; Fischer, S.; Buttner, J.; Kellerer, T.; Clavel, T.; Rychlik, M.; Haller, D.; et al. Effect of caloric restriction on gut permeability, inflammation markers, and fecal microbiota in obese women. Sci. Rep. 2017, 7, 11955. [Google Scholar] [CrossRef]
- Ottosson, F.; Brunkwall, L.; Ericson, U.; Nilsson, P.M.; Almgren, P.; Fernandez, C.; Melander, O.; Orho-Melander, M. Connection Between BMI-Related Plasma Metabolite Profile and Gut Microbiota. J. Clin. Endocrinol. Metab. 2018, 103, 1491–1501. [Google Scholar] [CrossRef]
- Hosomi, K.; Saito, M.; Park, J.; Murakami, H.; Shibata, N.; Ando, M.; Nagatake, T.; Konishi, K.; Ohno, H.; Tanisawa, K.; et al. Oral administration of Blautia wexlerae ameliorates obesity and type 2 diabetes via metabolic remodeling of the gut microbiota. Nat. Commun. 2022, 13, 4477. [Google Scholar] [CrossRef]
- Odamaki, T.; Kato, K.; Sugahara, H.; Hashikura, N.; Takahashi, S.; Xiao, J.Z.; Abe, F.; Osawa, R. Age-related changes in gut microbiota composition from newborn to centenarian: A cross-sectional study. BMC Microbiol. 2016, 16, 90. [Google Scholar] [CrossRef]
- Dong, T.S.; Luu, K.; Lagishetty, V.; Sedighian, F.; Woo, S.L.; Dreskin, B.W.; Katzka, W.; Chang, C.; Zhou, Y.; Arias-Jayo, N.; et al. The Intestinal Microbiome Predicts Weight Loss on a Calorie-Restricted Diet and Is Associated With Improved Hepatic Steatosis. Front. Nutr. 2021, 8, 718661. [Google Scholar] [CrossRef]
- Crost, E.H.; Coletto, E.; Bell, A.; Juge, N. Ruminococcus gnavus: Friend or foe for human health. FEMS Microbiol. Rev. 2023, 47, fuad014. [Google Scholar] [CrossRef] [PubMed]
- Bell, A.; Brunt, J.; Crost, E.; Vaux, L.; Nepravishta, R.; Owen, C.D.; Latousakis, D.; Xiao, A.; Li, W.; Chen, X.; et al. Elucidation of a sialic acid metabolism pathway in mucus-foraging Ruminococcus gnavus unravels mechanisms of bacterial adaptation to the gut. Nat. Microbiol. 2019, 4, 2393–2404. [Google Scholar] [CrossRef] [PubMed]
- Jie, Z.; Yu, X.; Liu, Y.; Sun, L.; Chen, P.; Ding, Q.; Gao, Y.; Zhang, X.; Yu, M.; Liu, Y.; et al. The Baseline Gut Microbiota Directs Dieting-Induced Weight Loss Trajectories. Gastroenterology 2021, 160, 2029–2042.E16. [Google Scholar] [CrossRef] [PubMed]
- Lozano, C.P.; Wilkens, L.R.; Shvetsov, Y.B.; Maskarinec, G.; Park, S.Y.; Shepherd, J.A.; Boushey, C.J.; Hebert, J.R.; Wirth, M.D.; Ernst, T.; et al. Associations of the Dietary Inflammatory Index with total adiposity and ectopic fat through the gut microbiota, LPS, and C-reactive protein in the Multiethnic Cohort-Adiposity Phenotype Study. Am. J. Clin. Nutr. 2022, 115, 1344–1356. [Google Scholar] [CrossRef]
- Yan, H.; Qin, Q.; Chen, J.; Yan, S.; Li, T.; Gao, X.; Yang, Y.; Li, A.; Ding, S. Gut Microbiome Alterations in Patients with Visceral Obesity Based on Quantitative Computed Tomography. Front. Cell. Infect. Microbiol. 2021, 11, 823262. [Google Scholar] [CrossRef]
- Lin, Y.; Bai, M.; Wang, S.; Chen, L.; Li, Z.; Li, C.; Cao, P.; Chen, Y. Lactate Is a Key Mediator That Links Obesity to Insulin Resistance via Modulating Cytokine Production from Adipose Tissue. Diabetes 2022, 71, 637–652. [Google Scholar] [CrossRef]
- Chen, L.M.; Collij, V.; Jaeger, M.; van den Munckhof, I.C.L.; Vila, A.V.; Kurilshikov, A.; Gacesa, R.; Sinha, T.; Oosting, M.; Joosten, L.A.B.; et al. Gut microbial co-abundance networks show specificity in inflammatory bowel disease and obesity. Nat. Commun. 2020, 11, 4018. [Google Scholar] [CrossRef]
- Hall, A.B.; Yassour, M.; Sauk, J.; Garner, A.; Jiang, X.F.; Arthur, T.; Lagoudas, G.K.; Vatanen, T.; Fornelos, N.; Wilson, R.; et al. A novel Ruminococcus gnavus clade enriched in inflammatory bowel disease patients. Genome Med. 2017, 9, 103. [Google Scholar] [CrossRef]


Disclaimer/Publisher’s Note: The statements, opinions and data contained in all publications are solely those of the individual author(s) and contributor(s) and not of MDPI and/or the editor(s). MDPI and/or the editor(s) disclaim responsibility for any injury to people or property resulting from any ideas, methods, instructions or products referred to in the content. |
© 2023 by the authors. Licensee MDPI, Basel, Switzerland. This article is an open access article distributed under the terms and conditions of the Creative Commons Attribution (CC BY) license (https://creativecommons.org/licenses/by/4.0/).