Abstract
Background: Testing and evaluating athletes is necessary and should include performance, body composition, and nutrition. The purpose of this study was to report assessments of dietary intake, O2max, and body composition in D1 collegiate athletes and examine relationships between these assessments. Methods: Dietary intake was assessed with 3-day recalls and compared to recommendations, and body composition was assessed via bioelectrical impedance analysis (BIA) (n = 48). O2max was evaluated using a graded exercise test (GXT) with a verification bout (n = 35). Reliability between “true” O2max and verification was determined. Correlations and regressions were performed. Results: Energy, carbohydrate, and micronutrient intake was lower than recommendations. Mean O2max was 47.3 and 47.4 mL·kg−1·min−1 for GXT and verification, respectively. While correlations were apparent among dietary intake, O2max, and body composition, percent fat-free mass (%FFM) predicted 36% of O2max. Conclusions: Collegiate athletes are not meeting energy and carbohydrate recommendations and exceed fat recommendations. Vitamin D and magnesium were low in all sports, and iron and calcium were low in females. O2max ranged from 35.6 to 63.0 mL·kg−1·min−1, with females below average and males meeting typical values for their designated sport. Assessing D1 athletes can provide guidance for sports dietitians, coaches, and strength and conditioning specialists to track and monitor nutrition in athletes.
1. Introduction
Assessing athletes is a necessary component for improving performance, including preventing injuries and illness. Testing components should include performance, body composition, and nutrition in order to provide guidance for maintaining health and injury prevention in athletes. The testing evaluation allows coaches, strength and conditioning specialists, and dietitians to understand where their athletes are currently at and what steps are needed to improve training and nutrition programs, and, in turn, develop an individual physiological profile for each athlete.
Collegiate athletes are often at risk of not meeting nutritional recommendations optimal for performance, indicating that nutrition is important to monitor in this population [1,2,3]. Adequate nutrition is essential for optimizing performance while decreasing the risk of developing injuries and illness [4]. In addition to energy intake (kcals) deficiencies, common themes observed in athletes include poor carbohydrate and vitamin D intake, as well as low protein, calcium, and iron intake, particularly in female athletes [1,2,3,4,5,6,7]. As these nutrients all play a key role in performance, determining and tracking athlete intakes is essential. Adequate calorie intake (kcals) is the foundation for the diet of athletes, allowing for appropriate energy production for the body to function and perform as needed. Additionally, meeting energy needs also allows for a sufficient intake of macronutrients and micronutrients, since it is difficult to meet those needs if overall calories are low [4]. Energy balance also plays a key role in body composition. Carbohydrates (endogenous and exogenous) are a highly preferred fuel source for training across a large range of exercise intensities that are both aerobic and anaerobic, making it an essential component of an athlete’s diet [8]. Carbohydrate recommendations for athletes are often provided based on the intensity of their activity and can be manipulated based on sex and sport [4,9]. Protein intake is necessary to support training adaptations, repair and rebuild tissue, and support protein turnover [10,11]. Additionally, many micronutrients such as vitamin D, calcium, and iron are all important for musculoskeletal health and performance [12,13,14,15,16]. Iron has a key role in red blood cell production, oxygen delivery, and electron transport during oxidative phosphorylation [17,18,19]. Vitamin D is not only necessary for the regulation of calcium and maintenance of bone health but is also thought to be influential on skeletal muscle, mainly due to the presence of vitamin D receptors (VDR) on skeletal muscle tissue [14,20]. Additionally, calcium has many functions important for athletic performance, including the maintenance of bone health, muscle contraction, and nerve conduction, making adequate intake essential [4]. Multiple nutrients are key components for skeletal muscle to improve athletic performance; thus, there should be an emphasis on dietary intake to ensure D1 athletes are consuming adequate amounts of macronutrients and micronutrients that are essential for sport performance, particularly with the specific needs for intermittent-based team and individual sports [4,21].
Maximal oxygen uptake (O2max) is considered the gold standard measurement for testing cardiorespiratory fitness and is commonly used to test athletes for evaluating training programs [22,23]. Sports such as volleyball, basketball, and wrestling have both aerobic (cardiorespiratory fitness) and anaerobic demands to not only provide energy for rapid and intermittent bouts of high-intensity activity but also sustain long periods of activity, indicating these athletes’ energy systems need to be efficient to maintain this level of performance [24,25,26,27]. Determining athletes’ O2max, particularly with the use of a verification bout, can provide an accurate assessment of aerobic capacity, which is useful for determining fitness levels and the effectiveness of training programs [28].
Body composition is another factor that influences performance and can be highly influenced by nutrition. Typically, in sports relying on power, such as many intermittent sports, a high proportion of skeletal muscle mass is advantageous for performance, so many athletes strive to gain or maintain fat-free mass (FFM) [4]. With the amount of interrelatedness between nutrition, performance, and body composition, it is important to evaluate all three in athletes and to examine relationships among these factors. Therefore, the purpose of this study was to report assessments of dietary intake, O2max, and body composition in D1 collegiate athletes and examine relationships between these assessments.
2. Materials and Methods
2.1. Study Design
This study reports descriptive values for dietary intake (energy, macronutrients, and micronutrients), O2max performance values, and body composition assessments in male and female collegiate athletes of four different team and individual sports (women’s volleyball (WBB), women’s and men’s basketball (MBB), and men’s wrestling). Participants were assessed prior to the start of their respective competition season.
2.2. Participants
A total of 48 collegiate athletes participated in this study, including female volleyball athletes (n = 13), WBB athletes (n = 11), MBB athletes (n = 14), and male wrestlers (n = 10). All participants were student–athletes at the same D1 university. All participants signed an informed consent approved by the university’s Institutional Review Board (IRB# 2308002-EXP) prior to participating in this study.
2.3. Surveys and Dietary Intake
Participants completed demographic, health history, and a Physical Activity Readiness Questionnaire (PARQ+) [29] prior to performing any other assessments. All participants were provided with a 3-day dietary recall approximately 7 days prior to the scheduled testing visit and were instructed to complete the record for days that were considered as typical as possible. A registered dietitian explained how to complete the recall by recording everything consumed over the 3 days. At the test visit, all participants were interviewed by a registered dietitian over their 3-day recall, where food intake was reviewed and follow-up questions were asked to the participants regarding additional intake, portion size (with visuals), brands, and preparation methods. The 3-day recalls were inputted into a nutrient analysis software program (Food Processor®, ESHA Research, Inc., Salem, OR, USA) and analyzed for energy, macronutrient, and micronutrient intake. The mean ± SD of energy intake (kcals·day−1), macronutrient intake (g·d−1), and specific micronutrients were analyzed for each day and averaged among the 3 days.
2.4. Health, Anthropometrics, and Body Composition Measurements
Resting heart rate and blood pressure were measured after the participant remained in a seated position for 5 min. Blood pressure was taken manually with a sphygmomanometer and stethoscope by the same investigator. Heart rate was taken manually for 60 s. Height was measured using a stadiometer (Seca; Hamburg, Germany). Body mass, fat-free mass (FFM), fat mass (FM), and percent body fat (BF%) were assessed via bioelectrical impedance analysis (BIA) (InBody 570, Cerritos, CA, USA) [30]. Waist circumference was measured using a Gulick measurement tape (Baseline® measurement tape with Gulick attachment, Fabrication Enterprises, White Plains, NY, USA) and recorded to the nearest 0.1 cm.
2.5. Maximal Oxygen Uptake (O2max)
We used a customized graded exercise test (GXT) followed by a subsequent exhaustive, square-wave bout to determine our criterion measure of “true” O2max. At the onset of this study, participants self-reported physical activity-rating (PA-R) on a scale from 0 to 15 [31]. The PA-R was utilized in a non-exercise regression equation using the participants’ sex, age, height, and weight to determine predicted maximal oxygen uptake (O2max) [32].
Predicted
Researchers then estimated running speed to evoke O2max (Speak) using the following metabolic equation [33]:
where Speak is expressed in m·min−1, O2max is relative to body mass (mL·kg−1·min−1), and 3.5 is the resting relative O2. The Speak was projected to be achieved in the 10th stage of the protocol and was thus divided by 10 to calculate the change in each stage as well as the starting stage speed. Researchers implemented a safety speed cap of 238.71 m·min−1 on the treadmill (Woodway, PRO XL, Waukesha, WI, USA) and used an additional 1% grade to correspond with the projected metabolic gains associated with an added speed [34].
Participants were fitted with a facemask and expired through a two-way rebreathing valve (7450 V2, Hans Rudolph Inc., Shawnee, KS, USA) connected to a metabolic cart (Parvo Medics Inc., Sandy, UT, USA) to measure indirect calorimetry during the GXT. Telemetry HR (Polar Electro Inc., Lake Success, NY, USA) was recorded simultaneously, and all data were evaluated using 15 s averaging. Metabolic cart filter replacements and calibrations were performed between tests according to the manufacturer’s guidelines.
Termination of the GXT occurred once the participant reached volitional fatigue and stopped the test by straddling the treadmill belt. The participant performed an active recovery for 3 min where the treadmill was set at 50% of the speed attained in the last stage. After recovery, the treadmill was set at a speed and grade, equaling two stages below the end stage of the GXT. Participants resumed running until exhaustion to confirm each participant’s “true” O2max measured during the GXT. “True” O2max was accepted as the highest values between the GXT and the square-wave bout when the agreement between trials was <3% [35].
2.6. Statistical Analysis
Assessments were described using means and standard deviations, and nutrition data were compared to recommendations based on Recommended Dietary Allowances (RDA) and for sport and sex. Initial steps were taken to ensure the normality of data before conducting statistical analysis. The normality of data was confirmed with visual representation from Q-Q plots. To examine mean differences between predicted and “true” O2max, dependent t-tests were performed. Pearson’s product-moment correlations were used to assess the association between energy intake, protein, carbohydrates, total fat, “true” O2max, %fat mass (FM), and %fat-free mass (FFM). A stepwise linear regressions was conducted using “true” O2max as the dependent variable. The stepwise linear regression included energy intake, %FM, and %FFM independent variables. After the reporting of assessment data and relationships, a secondary analysis was performed posteriori including One-Way Between-Subjects ANOVAs conducted to assess sport differences in %FFM, %FM, “true” O2max, energy intake, protein, carbohydrates, and total fats. An alpha level of 0.05 was used to determine statistical significance. All statistical analyses were performed using SPSS 24 software (IMB Corp., Armonk, NY, USA).
3. Results
Table 1 reports means ± SD for demographics, anthropometrics, body composition, and O2max. Of the 48 athletes who completed dietary and body composition assessments, n = 35 completed the O2max test due to injuries (volleyball, n = 8; WBB, n = 7; MBB, n = 13; wrestling, n = 7).

Table 1.
Demographics, anthropometrics, body composition, and O2max performance in D1 collegiate volleyball, women’s basketball, men’s basketball, and wrestling athletes.
3.1. Dietary Intake
Dietary intakes for energy, macronutrients, and micronutrients are displayed in Table 2 and compared to recommendations based on sex and sport (energy and macronutrients) [9,36] and RDAs (micronutrients) [37,38,39]. In general, reported energy and carbohydrate intakes were below recommendations for all sports, while protein intake was sufficient for MBB and wrestling but low for both female sports. Additionally, fat intake, including saturated fat, was high in all sports. Fiber intake was lower than recommendations for all sports and added sugars were high in all sports except wrestling (Table 2). For micronutrients, in general, B vitamins met the RDA for all sports, and male sports met or exceeded RDAs for calcium and iron but female sports did not. Almost every other micronutrient was low in comparison to RDAs for all sports, with particular concern for vitamin D and magnesium (Table 2).
Table 2.
Energy, macronutrient, and micronutrient intake and comparisons to recommendations for D1 collegiate volleyball, women’s basketball, men’s basketball, and wrestling athletes.
3.2. O2max Performance
O2max values from the GXT and square wave verification bout were 47.3 ± 7.2 and 47.4 ± 7.0 mL·kg−1·min−1, respectively (intraclass correlation coefficient (ICC) = 0.97, standard error of the mean = 1.2 mL·kg−1·min−1, coefficient of variation = 2.7%), with the highest value used to identify O2max. On average, the predicted O2max was higher than the “true” O2max, which was statistically significant (p < 0.001) with a medium effect size (d = 0.38) (Figure 1). Refer to Table 3 for correlations.
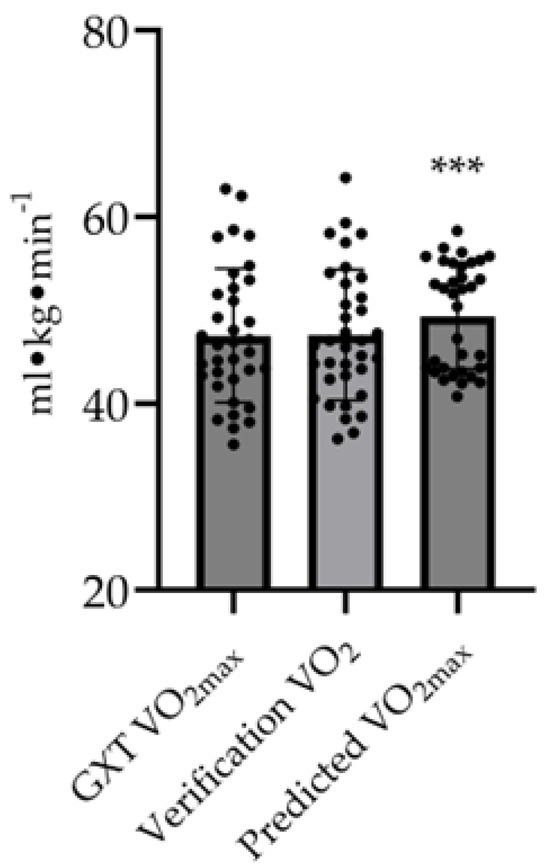
Figure 1.
O2max values from the GXT, square wave verification bout, and predicted value for D1 collegiate athletes. Predicted O2max was significantly higher than “true” O2max (*** p < 0.001), while there was high reliability between “true” O2max and square wave verification bout (ICC = 0.97).
Table 3.
Correlations among dietary intakes, “true” and predicted O2max, and body composition in D1 collegiate athletes.
Table 4 reports the stepwise linear regression with “true” O2max as the dependent variable and energy intake, %FM, and %FFM as independent variables (R2 = 0.36). %FFM was predictive of “true” O2max (F [1,33] = 18.89, R2 = 0.36, p < 0.001). %FFM predicted 36% of the variance in “true” O2max.
Table 4.
Stepwise regression model.
3.3. Sport Differences
A One-Way Between-Subjects ANOVA was conducted to compare %FFM, %FM, “true” O2max, energy intake, protein, carbohydrates, and total fat to account for sport differences. It is important to note that due to Levene’s tests being considered non-significant for %FM, %FFM, and “true” O2max, homogeneity was not violated; however, there was a significant difference for energy intake, protein, carbohydrate, and total fat. The non-homogeneity for those variables are accounted for by the diverse eating behaviors within these athletes. There was a significant difference in %FFM based on sport (F(3,44) = 38.70, p < 0.001), with a partial η2 = 0.73. A post hoc analysis using a Bonferroni adjustment revealed that this was significantly lower in WBB vs. wrestling (p < 0.001), lower in WBB vs. MBB (p < 0.001), lower in volleyball vs. wrestling (p < 0.001), and lower in volleyball vs. MBB (p < 0.001). There was a significant difference in %FM based on sport (F(3,44) = 38.62, p < 0.001), with a partial η2 = 0.73. A post hoc analysis using a Bonferroni adjustment revealed %FM was significantly higher in WBB vs. wrestling (p < 0.001), higher in WBB vs. MBB (p < 0.001), higher in volleyball vs. wrestling (p < 0.001), and higher in volleyball vs. MBB (p < 0.001). There was a significant difference in “true” O2max based on sport (F(3,31) = 18.78, p < 0.001), with a partial η2 = 0.65. A post hoc analysis using a Bonferroni adjustment revealed O2max was significantly lower in WBB vs. wrestling (p < 0.01), lower in WBB vs. MBB (p < 0.001), lower in volleyball vs. wrestling (p < 0.01), lower in volleyball vs. MBB (p < 0.001), and lower in MBB vs. wrestling (p < 0.01). There was a significant difference in energy intake based on sport (F(3,44) = 8.38, p < 0.001), with a partial η2 = 0.36. A post hoc analysis using a Bonferroni adjustment revealed energy intake was significantly higher in MBB vs. WBB (p = 0.02), higher in MBB vs. volleyball (p < 0.001), and higher in MBB vs. wrestling (p = 0.027). There was a significant difference in protein based on sport (F(3,44) = 8.13, p < 0.001), with a partial η2 = 0.36. A post hoc analysis using a Bonferroni adjustment revealed protein intake was significantly lower in WBB vs. MBB (p = 0.013), lower in volleyball vs. MBB (p < 0.001), and lower in volleyball vs. wrestling (p = 0.032). There was a significant difference in carbohydrate based on sport (F(3,44) = 8.00, p < 0.001), with a partial η2 = 0.35. A post hoc analysis using a Bonferroni adjustment revealed carbohydrate intake was significantly higher in MBB vs. WBB (p = 0.002), higher in MBB vs. volleyball (p = 0.002), and higher in MBB vs. wrestling (p = 0.002). There was a significant difference in total fat based on sport (F(3,44) = 9.65, p < 0.001), with a partial η2 = 0.40. A post hoc analysis using a Bonferroni adjustment revealed higher fat intake in MBB vs. WBB (p = 0.001) and MBB vs. volleyball (p < 0.001).
4. Discussion
This study aimed to provide a descriptive assessment of dietary intake, O2max performance, and body composition in D1 collegiate athletes of different sports. Additionally, this study investigated the relationship between nutrition and O2max performance in D1 collegiate athletes and compared athletes’ dietary intake to nutritional recommendations. These assessments are important to provide context for other practitioners of team and individual sport athletes, particularly in settings where resources for nutritional support are limited. For nutrition, in general, collegiate athletes in all four sports are not meeting energy and carbohydrate intake recommendations and exceed fat and saturated fat recommendations. Females in both volleyball and WBB are low in protein intake, while male athletes are meeting protein requirements [4,9]. Additionally, micronutrient intake in general did not meet recommendations, with a particular concern for low vitamin D and magnesium consumption in all athletes and iron and calcium in females. Furthermore, there were differences in intakes based on sport, indicating potential trends that may be targets for team-based nutritional education. O2max ranged from 35.6 to 63.0 mL·kg−1·min−1 across all athletes. The main contributor to O2max performance was %FFM (Table 4), whereas dietary intakes in the current study were inconsequential to predicting O2max, potentially due to inadequate intakes of energy and carbohydrates in all sports. This finding was unexpected since meeting energy requirements is the foundation of an athlete’s diet for energy production, as well as the ability to achieve appropriate macronutrient intake; therefore, adequate intake would typically be an essential component for optimizing performance [4]. Additionally, carbohydrates are the primary fuel for high-intensity exercise, particularly for intermittent sports that have a combination of activity using both aerobic and anaerobic systems. Therefore, having a high aerobic capacity, as well as anaerobic ability, is needed throughout a game or match, which relies heavily on the contribution of aerobic ATP production, primarily fueled by carbohydrates, since it is the only fuel that can be utilized for both aerobic and anaerobic ATP production [8]. Since a O2max test also relies on both aerobic and anaerobic domains, it was expected that energy and carbohydrates would have been influential to O2max performance; however, this was not observed in the current study [8].
Energy intake depends on multiple factors including type of sport, sex, age, body mass, and height; however, unfortunately, many athletes are not meeting recommendations [2,3], which can severely impact the ability to train, perform, and recover optimally [9]. Previous reviews examining energy and macronutrient intakes in team sport athletes found similar patterns as the athletes in this study. Two separate reviews of professional or semi-professional team sport athletes reported that both male and females were also below recommendations for energy and carbohydrate intake and exceed consumption in fat intake [2,3], which was consistent with the findings for both male and female athletes in the present study. Typically, with intermittent-based sports, the aerobic system is greatly taxed, as well as the anaerobic and creatine phosphate system, indicating that carbohydrate intake should be a priority in these sports, being the primary fuel source for these types of activities [9,44]. Additionally, meeting energy intake recommendations to match expenditure is essential for athletes, as low intake can be associated with decreased performance, negative body composition effects such as reduced muscle mass, and an increased risk of injuries, with similar correlations seen in the present study among dietary intakes and body composition (Table 3) [9], making meeting energy and carbohydrate recommendations essential for athletes.
Additionally, approximately 28.6% of the studies reviewed in a systematic review of indoor team sport athletes met recommendations for protein while 50% did not; however, there was no delineation of differences for sex or sport [2]. Low protein intake is common in female athletes [13,45], which was also confirmed in this study (Table 2). While not as important as a fuel source for performance, adequate protein is essential for muscle protein synthesis to tissue adaptations to training, recovery, and body composition changes, such as increased muscle mass [4,45]. Additionally, body composition testing can be influential to performance, depending on the type of athlete. Often, higher muscle mass with a low body fat percentage will help with intermittent and power-based athletes, such as the athletes tested in this study [4]. Additionally, better athletes typically have higher amounts of FFM; therefore, these athletes may also have a higher O2max, theoretically explaining why %FFM would be a large predictor of O2max performance [46,47].
In addition to providing assessments of O2max, energy, and macronutrient intake, multiple micronutrients were also analyzed and reported, indicating a low intake in a majority of key nutrients for performance (Table 2). Several micronutrients have been highlighted as micronutrients of key interest for athletes, including iron, calcium, vitamin D, and antioxidants (including vitamins C, E, and beta-carotene) [4]. In general, all athletes had low intakes for these micronutrients, as well as many other vitamins and minerals analyzed in this study, with a specific concern for very low intakes of vitamin D and magnesium for all athletes, and iron and calcium in female athletes, which is an unfortunate common theme for female athletes [12,13,48,49].
There is growing evidence to support the role of vitamin D on skeletal muscle and performance, indicating that adequate intake is necessary for athletes. However, vitamin D consumption is typically low in most of the population, including athletes [1,50,51]. In addition to the importance of vitamin D for bone health in conjunction with calcium, vitamin D has a role in skeletal muscle function, potentially due to VDR expression on skeletal tissue influencing muscle cell regeneration [52,53]. Additionally, vitamin D concentrations have been reported to be associated with athletic performance [54,55,56]. With these being indoor athletes, as well as full-time students, it is highly likely that vitamin D created from exposure to UV radiation from sunlight is limited, which places a higher reliance on vitamin D intake. While vitamin D concentrations were not measured in this study, the combination of low vitamin D intake and low sun exposure with indoor athletes in addition to the location of the university suggests that concentrations may be low. Magnesium is emerging as a nutrient that could improve athletic performance due to its role in energy metabolism, muscle protein synthesis, and skeletal muscle contraction [57,58,59]. While few human studies have been performed to link magnesium intake with athletic performance, preliminary evidence supports positive associations between magnesium levels and markers of performance such as strength and power [59,60]. Iron is essential for multiple processes within the body that influence performance, including oxygen delivery and utilization, energy metabolism, and red blood cell production [17,18,19], indicating that low concentrations could have an adverse impact on performance. For example, the presence of iron deficiency was related to lower O2max in female rowers compared to those with sufficient iron status [61]. Additionally, iron supplementation has been reported to improve tests of aerobic capacity (4k time trial and O2max performance) in endurance athletes [62,63]. Since low iron intake is common in female athletes and is particularly concerning with the greater requirements for this population, this becomes a micronutrient necessary to monitor in athletes [4]. Similarly, to iron, females typically do not meet RDAs for calcium, which becomes even more important for athletes due to the role calcium has in bone health and skeletal muscle function [4,64]. With the great importance that these micronutrients have for performance, educating athletes on consuming food sources rich in these micronutrients, as well as meeting energy and macronutrient recommendations, is essential for optimizing performance and reducing the risk of injury and illness.
Maximal oxygen consumption is utilized as a test of functional capacity of the cardiovascular and respiratory systems, along with oxygen utilization of skeletal muscle, indicating that this assessment is considered the criterion measurement of cardiorespiratory fitness [33]. Sports such as volleyball, basketball, and wrestling require an interplay of the aerobic (cardiorespiratory fitness) and anaerobic capacity, meaning an efficient energy system is optimal to sustain intermittent and sustained activity [24,25]. Thus, assessing O2max in collegiate teams and individual athletes can provide coaches with a determinant of their athletes’ physical capacity and how it changes based on training protocols throughout the season. The use of a verification bout in lieu of the traditional O2max test criteria has been a promising technique to confirm that an actual O2max has been reached [28]. Few studies have examined the confirmation of attaining O2max with a verification bout in college athletes, making this a novel technique in this population [28]. With the high reliability between the “true” O2max and O2max from the verification bout in the present study (Figure 1), this would be an effective method for testing collegiate athletes to ensure the accuracy of the test.
Intermittent, power-based sports such as basketball and volleyball require a developed aerobic capacity to be able to sustain the frequent bouts of activity and have better tolerance to fatigue caused from multiple high-intensity spurts [25,65,66]. Therefore, a certain level of cardiorespiratory fitness should be maintained in these types of athletes. As expected, the male sports had a higher O2max than females. Previously, O2max ranged from 48 to 51 mL·kg−1·min−1 in male basketball players in national leagues and from 50 to 58 mL·kg−1·min−1 in collegiate male basketball players [27], which was slightly higher than the 48.8 mL·kg−1·min−1 reported in this study (Table 1). Fewer studies examined female basketball players; however, one previous study in female D1 collegiate basketball players reported a mean O2max value of 47.3 mL·kg−1·min−1 [67], which was higher than the reported value of 41.8 mL·kg−1·min−1 in the present study (Table 1). There are very few studies examining O2max in female volleyball players; however, compared to the descriptive data for athletes, the O2max of 40.7 mL·kg−1·min−1 reported for the volleyball athletes would have been considered below average in comparison to other athletes and other previously reported values of female volleyball players [68,69]. While volleyball is a high-intensity, intermittent sport and relies greatly on anaerobic capacity, the ability to maintain a level of intensity throughout a match, as well as the ability to recover and reduce fatigue to perform over the course of five matches, places some reliance on the oxidative system, indicating that a level of cardiorespiratory fitness and aerobic capacity would be important for performance in this sport [70]. High-performing wrestlers were reported to have O2max values between 52 and 63 mL·kg−1·min−1 [26], which aligns with the wrestlers in the present study.
Strengths and Limitations
The strengths of this study emphasize a well-rounded assessment including in-depth nutrition information of multiple different sports within a D1 university setting, including an analysis of dietary intake and O2max testing in athletes. Very few studies provide in-depth dietary analysis of different D1 sports, particularly including in-depth interviews with each athlete, reports of macronutrient and micronutrient intake, and comparisons to recommendations (relative recommendations (g·kg−1) per sport for macronutrients and RDAs for micronutrients). Additionally, this study provides an assessment of O2max with a protocol using a verification bout to ensure that true O2max was reached. This can provide helpful data for other coaches, strength and conditioning specialists, and sports dietitians to compare with. However, there are some limitations to this study. This study aimed to show the assessment data of different sports at the D1 collegiate level with limited resources for nutritional support. All athletes came from the same D1 university, leading to each sport having a small sample size. However, we were able to achieve more than 70% participation for each team’s starting roster, which is fairly difficult in a collegiate athletic setting. With this sample size, there are certain limitations for regression analysis, particularly with the influence of sex on the analysis. With n = 35 completing the O2max assessment (n = 20 males, n = 15 females), having three independent variables within the model meets the rule of 10 participants for every independent variable added into the model; however, there still may be an influence of sex on these results. There is also the potential for error associated with dietary recalls as they rely on self-reporting and portion size estimation. While we tried to limit error as much as possible by providing instructions and interviewing each athlete over their completed recall, along with visuals for portions sizes, this method is still susceptible to error. Additionally, the assessment of body composition was performed via BIA which has limitations, particularly associated with the hydration status of the athletes. All athletes were instructed to hydrate prior to the test and were asked about fluid consumption when they arrived at the laboratory to reduce the risk of athletes arriving dehydrated and adversely affecting the test. However, it is acknowledged that this method has limitations, but it was deemed the most appropriate method due to the time burden to athletes and the cost of equipment.
5. Conclusions
This study aimed to report nutritional intake, O2max performance, and body composition in D1 collegiate athletes in four team and individual sports (volleyball, WBB, MBB, and wrestling), to provide a well-rounded assessment of athletes at a university with little nutritional support and to provide better context for sports dietitians, coaches, and strength and conditioning specialists to focus on within their sports. In general, dietary intake did not meet recommendations, particularly for energy, carbohydrates, and micronutrients, indicating the need for additional support of a registered dietitian within the interdisciplinary team. Athletes should focus on improving their energy and carbohydrate intake, as well as choosing nutrient-dense foods to not only support performance but meet micronutrient needs. O2max performance ranged from 35.6 to 63.0 mL·kg−1·min−1, with female athletes considered below average and male athletes meeting typical values for their designated sport. O2max performance in these athletes was adequate, even with nutritional intake below recommendations. However, by improving dietary intake to meet requirements per sport and sex, performance could be optimized. Additionally, since %FFM was predictive of O2max performance, improving body composition, as well as monitoring nutrition, should be essential components in addition to their training programs for collegiate athletes.
Author Contributions
Conceptualization, M.E.S. and A.M.B.; methodology, M.E.S. and A.M.B.; software, N.D.D. and A.M.B.; validation, M.E.S., N.D.D. and A.M.B.; formal analysis, A.M.B.; investigation, M.E.S., M.J.N., S.W.D., T.N.K. and A.M.B.; resources, M.E.S.; data curation, M.E.S. and A.M.B.; writing—original draft preparation, M.E.S.; writing—review and editing, M.E.S., N.D.D., M.J.N., S.W.D., T.N.K. and A.M.B.; visualization, M.E.S., N.D.D., M.J.N., S.W.D., T.N.K. and A.M.B.; supervision, M.E.S., M.J.N., S.W.D. and A.M.B.; project administration, M.E.S., M.J.N., T.N.K., S.W.D. and A.M.B.; funding acquisition, M.E.S. and A.M.B. All authors have read and agreed to the published version of the manuscript.
Funding
This research was funded by RSCA Challenge Grant, South Dakota State University, and, in part, by the South Dakota State University Agriculture Experimental Station, with funds provided by the Hatch Act (Agency: U.S. Department of Agriculture, National Institute of Food and Agriculture; Accession No: 7004075). The APC was funded by the RSCA Challenge Grant, South Dakota State University.
Institutional Review Board Statement
This study was conducted in accordance with the Declaration of Helsinki and approved by the Institutional Review Board of South Dakota State University (protocol #2308002-EXP, approved 20 July 2023).
Informed Consent Statement
Informed consent was obtained from all subjects involved in this study. Written informed consent has been obtained from the subjects to publish this paper.
Data Availability Statement
The data presented in this study are available on request from the principal investigator.
Acknowledgments
The authors would like to acknowledge the nutrition and dietetics and exercise science students who helped with data collection, and the athletes and strength coaches who participated and helped with scheduling.
Conflicts of Interest
The authors declare no conflicts of interest. The funders had no role in the design of the study; in the collection, analyses, or interpretation of data; in the writing of the manuscript; or in the decision to publish the results.
References
- Coapstick, G.-J.A.; Barry, A.M.; Levesque, C.L.; Shoemaker, M.E. Nutrient Intake, Performance, and Body Composition of Preseason Wrestlers. Int. J. Exerc. Sci. 2024, 17, 517–530. [Google Scholar] [PubMed]
- Castillo, M.; Lozano-Casanova, M.; Sospedra, I.; Norte, A.; Gutiérrez-Hervás, A.; Martínez-Sanz, J.M. Energy and Macronutrients Intake in Indoor Sport Team Athletes: Systematic Review. Nutrients 2022, 14, 4755. [Google Scholar] [CrossRef] [PubMed]
- Jenner, S.L.; Buckley, G.L.; Belski, R.; Devlin, B.L.; Forsyth, A.K. Dietary Intakes of Professional and Semi-Professional Team Sport Athletes Do Not Meet Sport Nutrition Recommendations—A Systematic Literature Review. Nutrients 2019, 11, 1160. [Google Scholar] [CrossRef] [PubMed]
- Thomas, D.T.; Erdman, K.A.; Burke, L.M. American College of Sports Medicine Joint Position Statement. Nutrition and Athletic Performance. Med. Sci. Sports Exerc. 2016, 48, 543–568. [Google Scholar] [CrossRef] [PubMed]
- Riviere, A.J.; Leach, R.; Mann, H.; Robinson, S.; Burnett, D.O.; Babu, J.R.; Frugé, A.D. Nutrition Knowledge of Collegiate Athletes in the United States and the Impact of Sports Dietitians on Related Outcomes: A Narrative Review. Nutrients 2021, 13, 1772. [Google Scholar] [CrossRef] [PubMed]
- Silva, A.M.; Matias, C.N.; Santos, D.A.; Thomas, D.; Bosy-Westphal, A.; Müller, M.J.; Heymsfield, S.B.; Sardinha, L.B. Energy Balance over One Athletic Season. Med. Sci. Sports Exerc. 2017, 49, 1724–1733. [Google Scholar] [CrossRef] [PubMed]
- Leitch, B.A.; Wilson, P.B.; Ufholz, K.E.; Roemmich, J.N.; Orysiak, J.; Walch, T.J.; Short, S.E.; Fitzgerald, J.S. Vitamin D Awareness and Intake in Collegiate Athletes. J. Strength Cond. Res. 2021, 35, 2742–2748. [Google Scholar] [CrossRef] [PubMed]
- Hargreaves, M.; Spriet, L.L. Skeletal Muscle Energy Metabolism during Exercise. Nat. Metab. 2020, 2, 817–828. [Google Scholar] [CrossRef] [PubMed]
- Kerksick, C.M.; Wilborn, C.D.; Roberts, M.D.; Smith-Ryan, A.; Kleiner, S.M.; Jäger, R.; Collins, R.; Cooke, M.; Davis, J.N.; Galvan, E.; et al. ISSN Exercise & Sports Nutrition Review Update: Research & Recommendations. J. Int. Soc. Sports Nutr. 2018, 15, 38. [Google Scholar] [CrossRef]
- Phillips, S.M.; Van Loon, L.J.C. Dietary Protein for Athletes: From Requirements to Optimum Adaptation. J. Sports Sci. 2011, 29 (Suppl. S1), S29–S38. [Google Scholar] [CrossRef]
- Miller, B.F.; Olesen, J.L.; Hansen, M.; Døssing, S.; Crameri, R.M.; Welling, R.J.; Langberg, H.; Flyvbjerg, A.; Kjaer, M.; Babraj, J.A.; et al. Coordinated Collagen and Muscle Protein Synthesis in Human Patella Tendon and Quadriceps Muscle after Exercise. J. Physiol. 2005, 567, 1021–1033. [Google Scholar] [CrossRef]
- Shoemaker, M.E.; Salmon, O.F.; Smith, C.M.; Duarte-Gardea, M.O.; Cramer, J.T. Influences of Vitamin D and Iron Status on Skeletal Muscle Health: A Narrative Review. Nutrients 2022, 14, 2717. [Google Scholar] [CrossRef]
- Shoemaker, M.E.; Gillen, Z.M.; Mckay, B.D.; Bohannon, N.A.; Gibson, S.M.; Koehler, K.; Cramer, J.T. Sex-Specific Relationships among Iron Status Biomarkers, Athletic Performance, Maturity, and Dietary Intakes in Pre-Adolescent and Adolescent Athletes. J. Int. Soc. Sports Nutr. 2019, 16, 42. [Google Scholar] [CrossRef] [PubMed]
- Pojednic, R.M.; Ceglia, L. The Emerging Biomolecular Role of Vitamin D in Skeletal Muscle. Exerc. Sport Sci. Rev. 2014, 42, 76–81. [Google Scholar] [CrossRef] [PubMed]
- Sinha, A.; Hollingsworth, K.G.; Ball, S.; Cheetham, T. Improving the Vitamin D Status of Vitamin D Deficient Adults Is Associated with Improved Mitochondrial Oxidative Function in Skeletal Muscle. J. Clin. Endocrinol. Metab. 2013, 98, E509–E513. [Google Scholar] [CrossRef]
- Lukaski, H.C. Vitamin and Mineral Status: Effects on Physical Performance. Nutrition 2004, 20, 632–644. [Google Scholar] [CrossRef]
- Buratti, P.; Gammella, E.; Rybinska, I.; Cairo, G.; Recalcati, S. Recent Advances in Iron Metabolism: Relevance for Health, Exercise, and Performance. Med. Sci. Sports Exerc. 2015, 47, 1596–1604. [Google Scholar] [CrossRef] [PubMed]
- Ganz, T. Molecular Control of Iron Transport. J. Am. Soc. Nephrol. 2007, 18, 394–400. [Google Scholar] [CrossRef] [PubMed]
- Oexle, H.; Gnaiger, E.; Weiss, G. Iron-Dependent Changes in Cellular Energy Metabolism: Influence on Citric Acid Cycle and Oxidative Phosphorylation. Biochim. Biophys. Acta 1999, 1413, 99–107. [Google Scholar] [CrossRef]
- Dahlquist, D.T.; Dieter, B.P.; Koehle, M.S. Plausible Ergogenic Effects of Vitamin D on Athletic Performance and Recovery. J. Int. Soc. Sports Nutr. 2015, 12, 33. [Google Scholar] [CrossRef]
- Holway, F.E.; Spriet, L.L. Sport-Specific Nutrition: Practical Strategies for Team Sports. J. Sports Sci. 2011, 29 (Suppl. S1), S115–S125. [Google Scholar] [CrossRef] [PubMed]
- Scharhag-Rosenberger, F.; Meyer, T.; Walitzek, S.; Kindermann, W. Time Course of Changes in Endurance Capacity: A 1-Yr Training Study. Med. Sci. Sports Exerc. 2009, 41, 1130–1137. [Google Scholar] [CrossRef] [PubMed]
- Weatherwax, R.; Harris, N.; Kilding, A.E.; Dalleck, L. Time Course Changes in Confirmed “True” VO2 Max After Individualized and Standardized Training. Sports Med. Int. Open 2019, 3, E32–E39. [Google Scholar] [CrossRef]
- Chaabene, H.; Negra, Y.; Bouguezzi, R.; Mkaouer, B.; Franchini, E.; Julio, U.; Hachana, Y. Physical and Physiological Attributes of Wrestlers: An Update. J. Strength Cond. Res. 2017, 31, 1411–1442. [Google Scholar] [CrossRef] [PubMed]
- Morrison, M.; Martin, D.T.; Talpey, S.; Scanlan, A.T.; Delaney, J.; Halson, S.L.; Weakley, J. A Systematic Review on Fitness Testing in Adult Male Basketball Players: Tests Adopted, Characteristics Reported and Recommendations for Practice. Sports Med. 2022, 52, 1491–1532. [Google Scholar] [CrossRef] [PubMed]
- Nikooie, R.; Cheraghi, M.; Mohamadipour, F. Physiological Determinants of Wrestling Success in Elite Iranian Senior and Junior Greco-Roman Wrestlers. J. Sports Med. Phys. Fit. 2017, 57, 219–226. [Google Scholar] [CrossRef] [PubMed]
- Metaxas, T.I.; Koutlianos, N.; Sendelides, T.; Mandroukas, A. Preseason Physiological Profile of Soccer and Basketball Players in Different Divisions. J. Strength Cond. Res. 2009, 23, 1704–1713. [Google Scholar] [CrossRef] [PubMed]
- Costa, V.A.B.; Midgley, A.W.; Carroll, S.; Astorino, T.A.; de Paula, T.; Farinatti, P.; Cunha, F.A. Is a Verification Phase Useful for Confirming Maximal Oxygen Uptake in Apparently Healthy Adults? A Systematic Review and Meta-Analysis. PLoS ONE 2021, 16, e0247057. [Google Scholar] [CrossRef] [PubMed]
- Warburton, D.E.R.; Jamnik, V.K.; Bredin, S.S.D.; Gledhill, N. The Physical Activity Readiness Questionnaire for Everyone (PAR-Q+) and Electronic Physical Activity Readiness Medical Examination (ePARmed-X+): Summary of Consensus Panel Recommendations. Health Fit. J. Can. 2011, 4, 26–37. [Google Scholar]
- Kyle, U.G.; Bosaeus, I.; De Lorenzo, A.D.; Deurenberg, P.; Elia, M.; Gómez, J.M.; Heitmann, B.L.; Kent-Smith, L.; Melchior, J.-C.; Pirlich, M.; et al. Bioelectrical Impedance Analysis—Part I: Review of Principles and Methods. Clin. Nutr. 2004, 23, 1226–1243. [Google Scholar] [CrossRef]
- Dicks, N.D.; Jamnick, N.A.; Murray, S.R.; Pettitt, R.W. Load Determination for the 3-Minute All-Out Exercise Test for Cycle Ergometry. Int. J. Sports Physiol. Perform. 2016, 11, 197–203. [Google Scholar] [CrossRef] [PubMed]
- Jackson, A.S.; Blair, S.N.; Mahar, M.T.; Wier, L.T.; Ross, R.M.; Stuteville, J.E. Prediction of Functional Aerobic Capacity without Exercise Testing. Med. Sci. Sports Exerc. 1990, 22, 863–870. [Google Scholar] [CrossRef] [PubMed]
- American College of Sports Medicine; Liguori, G.; Feito, Y.; Fountaine, C.; Charles, J.; Roy, B. ACSM’s Guidelines for Exercise Testing and Prescription, 11th ed.; Wolters Kluwer: Philadelphia, PA, USA, 2022; ISBN 978-1-975150-18-1. [Google Scholar]
- Pettitt, R.W.; Jamnick, N.; Clark, I.E. 3-Min All-out Exercise Test for Running. Int. J. Sports Med. 2012, 33, 426–431. [Google Scholar] [CrossRef] [PubMed]
- Pettitt, R.W.; Clark, I.E.; Ebner, S.M.; Sedgeman, D.T.; Murray, S.R. Gas Exchange Threshold and VO2max Testing for Athletes: An Update. J. Strength Cond. Res. 2013, 27, 549–555. [Google Scholar] [CrossRef] [PubMed]
- Cunningham, J.J. A Reanalysis of the Factors Influencing Basal Metabolic Rate in Normal Adults. Am. J. Clin. Nutr. 1980, 33, 2372–2374. [Google Scholar] [CrossRef] [PubMed]
- Ross, A.C.; Taylor, C.L.; Yaktine, A.L.; Valle, H.B.D. Dietary Reference Intakes for Calcium and Vitamin D. NCBI Bookshelf. Available online: https://www.ncbi.nlm.nih.gov/books/NBK56068/table/summarytables.t2/ (accessed on 14 May 2024).
- Institute of Medicine. Dietary Reference Intakes for Water, Potassium, Sodium, Chloride, and Sulfate; National Academies Press: Washington, DC, USA, 2005; ISBN 978-0-309-09169-5. [Google Scholar]
- Institute of Medicine. Dietary Reference Intakes: The Essential Guide to Nutrient Requirements; The National Academies Press: Washington, DC, USA, 2006; ISBN 978-0-309-15742-1. [Google Scholar]
- Lichtenstein, A.H.; Appel, L.J.; Vadiveloo, M.; Hu, F.B.; Kris-Etherton, P.M.; Rebholz, C.M.; Sacks, F.M.; Thorndike, A.N.; Van Horn, L.; Wylie-Rosett, J.; et al. Dietary Guidance to Improve Cardiovascular Health: A Scientific Statement from the American Heart Association. Circulation 2021, 144, e472–e487. [Google Scholar] [CrossRef] [PubMed]
- World Health Organization. Trans Fat. Available online: https://www.who.int/news-room/fact-sheets/detail/trans-fat (accessed on 16 April 2024).
- Akbar, A.; Shreenath, A.P. High Fiber Diet. In StatPearls; StatPearls Publishing: Treasure Island, FL, USA, 2024. [Google Scholar]
- Added Sugars. Available online: https://www.heart.org/en/healthy-living/healthy-eating/eat-smart/sugar/added-sugars (accessed on 14 May 2024).
- Burke, L.M.; Loucks, A.B.; Broad, N. Energy and Carbohydrate for Training and Recovery. J. Sports Sci. 2006, 24, 675–685. [Google Scholar] [CrossRef] [PubMed]
- Jagim, A.R.; Zabriskie, H.; Currier, B.; Harty, P.S.; Stecker, R.; Kerksick, C.M. Nutrient Status and Perceptions of Energy and Macronutrient Intake in a Group of Collegiate Female Lacrosse Athletes. J. Int. Soc. Sports Nutr. 2019, 16, 43. [Google Scholar] [CrossRef] [PubMed]
- Barbieri, D.; Zaccagni, L.; Babić, V.; Rakovac, M.; Mišigoj-Duraković, M.; Gualdi-Russo, E. Body Composition and Size in Sprint Athletes. J. Sports Med. Phys. Fit. 2017, 57, 1142–1146. [Google Scholar] [CrossRef]
- Maciejczyk, M.; Wiecek, M.; Szymura, J.; Szygula, Z.; Brown, L.E. Influence of Increased Body Mass and Body Composition on Cycling Anaerobic Power. J. Strength Cond. Res. 2015, 29, 58–65. [Google Scholar] [CrossRef]
- Condo, D.; Lohman, R.; Kelly, M.; Carr, A. Nutritional Intake, Sports Nutrition Knowledge and Energy Availability in Female Australian Rules Football Players. Nutrients 2019, 11, 971. [Google Scholar] [CrossRef]
- Malczewska-Lenczowska, J.; Sitkowski, D.; Surała, O.; Orysiak, J.; Szczepańska, B.; Witek, K. The Association between Iron and Vitamin D Status in Female Elite Athletes. Nutrients 2018, 10, 167. [Google Scholar] [CrossRef]
- Bailey, R.L.; Dodd, K.W.; Goldman, J.A.; Gahche, J.J.; Dwyer, J.T.; Moshfegh, A.J.; Sempos, C.T.; Picciano, M.F. Estimation of Total Usual Calcium and Vitamin D Intakes in the United States. J. Nutr. 2010, 140, 817–822. [Google Scholar] [CrossRef]
- Villacis, D.; Yi, A.; Jahn, R.; Kephart, C.J.; Charlton, T.; Gamradt, S.C.; Romano, R.; Tibone, J.E.; Hatch, G.F.R. Prevalence of Abnormal Vitamin D Levels among Division I NCAA Athletes. Sports Health 2014, 6, 340–347. [Google Scholar] [CrossRef]
- Srikuea, R.; Zhang, X.; Park-Sarge, O.-K.; Esser, K.A. VDR and CYP27B1 Are Expressed in C2C12 Cells and Regenerating Skeletal Muscle: Potential Role in Suppression of Myoblast Proliferation. Am. J. Physiol. Cell Physiol. 2012, 303, C396–C405. [Google Scholar] [CrossRef] [PubMed]
- Suzuki, T.; Kwon, J.; Kim, H.; Shimada, H.; Yoshida, Y.; Iwasa, H.; Yoshida, H. Low Serum 25-Hydroxyvitamin D Levels Associated with Falls among Japanese Community-Dwelling Elderly. J. Bone Miner. Res. 2008, 23, 1309–1317. [Google Scholar] [CrossRef] [PubMed]
- Koundourakis, N.E.; Androulakis, N.E.; Malliaraki, N.; Margioris, A.N. Vitamin D and Exercise Performance in Professional Soccer Players. PLoS ONE 2014, 9, e101659. [Google Scholar] [CrossRef] [PubMed]
- Hamilton, B.; Whiteley, R.; Farooq, A.; Chalabi, H. Vitamin D Concentration in 342 Professional Football Players and Association with Lower Limb Isokinetic Function. J. Sci. Med. Sport 2014, 17, 139–143. [Google Scholar] [CrossRef] [PubMed]
- Książek, A.; Zagrodna, A.; Dziubek, W.; Pietraszewski, B.; Ochmann, B.; Słowińska-Lisowska, M. 25(OH)D3 Levels Relative to Muscle Strength and Maximum Oxygen Uptake in Athletes. J. Hum. Kinet. 2016, 50, 71–77. [Google Scholar] [CrossRef]
- George, G.A.; Heaton, F.W. Effect of Magnesium Deficiency on Energy Metabolism and Protein Synthesis by Liver. Int. J. Biochem. 1978, 9, 421–425. [Google Scholar] [CrossRef]
- Dørup, I.; Clausen, T. Effects of Magnesium and Zinc Deficiencies on Growth and Protein Synthesis in Skeletal Muscle and the Heart. Br. J. Nutr. 1991, 66, 493–504. [Google Scholar] [CrossRef] [PubMed]
- Dominguez, L.J.; Barbagallo, M.; Lauretani, F.; Bandinelli, S.; Bos, A.; Corsi, A.M.; Simonsick, E.M.; Ferrucci, L. Magnesium and Muscle Performance in Older Persons: The InCHIANTI Study. Am. J. Clin. Nutr. 2006, 84, 419–426. [Google Scholar] [CrossRef] [PubMed]
- Santos, D.A.; Matias, C.N.; Monteiro, C.P.; Silva, A.M.; Rocha, P.M.; Minderico, C.S.; Bettencourt Sardinha, L.; Laires, M.J. Magnesium Intake Is Associated with Strength Performance in Elite Basketball, Handball and Volleyball Players. Magnes. Res. 2011, 24, 215–219. [Google Scholar] [CrossRef]
- Dellavalle, D.M.; Haas, J.D. Iron Status Is Associated with Endurance Performance and Training in Female Rowers. Med. Sci. Sports Exerc. 2012, 44, 1552–1559. [Google Scholar] [CrossRef]
- DellaValle, D.M.; Haas, J.D. Iron Supplementation Improves Energetic Efficiency in Iron-Depleted Female Rowers. Med. Sci. Sports Exerc. 2014, 46, 1204–1215. [Google Scholar] [CrossRef]
- Garvican, L.A.; Saunders, P.U.; Cardoso, T.; Macdougall, I.C.; Lobigs, L.M.; Fazakerley, R.; Fallon, K.E.; Anderson, B.; Anson, J.M.; Thompson, K.G.; et al. Intravenous Iron Supplementation in Distance Runners with Low or Suboptimal Ferritin. Med. Sci. Sports Exerc. 2014, 46, 376–385. [Google Scholar] [CrossRef]
- U.S. Department of Agriculture and U.S. Department of Health and Human Services Dietary Guidelines for Americans, 2020–2025, 9th ed. 2020. Available online: https://www.dietaryguidelines.gov/ (accessed on 15 February 2022).
- Mirzaei, B.; Curby, D.G.; Rahmani-Nia, F.; Moghadasi, M. Physiological Profile of Elite Iranian Junior Freestyle Wrestlers. J. Strength Cond. Res. 2009, 23, 2339–2344. [Google Scholar] [CrossRef]
- Yoon, J. Physiological Profiles of Elite Senior Wrestlers. Sports Med. 2002, 32, 225–233. [Google Scholar] [CrossRef] [PubMed]
- Sanders, G.J.; Boos, B.; Rhodes, J.; Kollock, R.O.; Peacock, C.A.; Scheadler, C.M. Factors Associated with Minimal Changes in Countermovement Jump Performance throughout a Competitive Division I Collegiate Basketball Season. J. Sports Sci. 2019, 37, 2236–2242. [Google Scholar] [CrossRef]
- McGuigan, M. Administration, Scoring, and Interpretation of Selected Tests. In Essentials of Strength Training and Conditioning, National Strength and Conditioning Association; Human Kinetics: Champaign, IL, USA, 2016; pp. 259–316. [Google Scholar]
- Fleck, S.J.; Case, S.; Puhl, J.; Van Handle, P. Physical and Physiological Characteristics of Elite Women Volleyball Players. Can. J. Appl. Sport Sci. 1985, 10, 122–126. [Google Scholar]
- Lidor, R.; Ziv, G. Physical and Physiological Attributes of Female Volleyball Players—A Review. J. Strength Cond. Res. 2010, 24, 1963–1973. [Google Scholar] [CrossRef] [PubMed]

Disclaimer/Publisher’s Note: The statements, opinions and data contained in all publications are solely those of the individual author(s) and contributor(s) and not of MDPI and/or the editor(s). MDPI and/or the editor(s) disclaim responsibility for any injury to people or property resulting from any ideas, methods, instructions or products referred to in the content. |
© 2024 by the authors. Licensee MDPI, Basel, Switzerland. This article is an open access article distributed under the terms and conditions of the Creative Commons Attribution (CC BY) license (https://creativecommons.org/licenses/by/4.0/).