Article

In Vitro and In Silico Analysis of PTP1B Inhibitors from Cleistocalyx operculatus Leaves and Their Effect on Glucose Uptake

1
Research Institute of Pharmaceutical Sciences, College of Pharmacy, Seoul National University, Seoul 08826, Republic of Korea
2
Natural Product Informatics Research Center, Korea Institute of Science and Technology, Gangneung 25451, Republic of Korea
*
Author to whom correspondence should be addressed.
These authors contributed equally to this work.
Nutrients 2024, 16(17), 2839; https://doi.org/10.3390/nu16172839
Submission received: 1 August 2024 / Revised: 20 August 2024 / Accepted: 21 August 2024 / Published: 24 August 2024
(This article belongs to the Special Issue Phytonutrients in Inflammation and Metabolic Health)

Abstract

:
As part of our ongoing research on new anti-diabetic compounds from ethnopharmacologically consumed plants, two previously undescribed lupane-type triterpenoids (1 and 2) with dicarboxylic groups, an undescribed nor-taraxastane-type triterpenoid (3), and 14 known compounds (417) were isolated from the leaves of Cleistocalyx operculatus. Extensive spectroscopic analysis (IR, HRESIMS, 1D, and 2D NMR) was used for structure elucidation, while the known compounds were compared to reference data reported in the scientific literature. All the isolates (117) were evaluated for their inhibitory effects on the protein tyrosine phosphatase 1B (PTP1B) enzyme. Compounds 6, 9, and 17 showed strong PTP1B inhibitory activities. The mechanism of PTP1B inhibition was studied through enzyme kinetic experiments. A non-competitive mechanism of inhibition was determined using Lineweaver–Burk plots for compounds 6, 9, and 17. Additionally, Dixon plots were employed to determine the inhibition constant. Further insights were gained through a structure–activity relationship study and molecular docking analysis of isolated compounds with the PTP1B crystal structure. Moreover, all isolates (117) were tested for their stimulatory effects on the uptake of 2-deoxy-2-[(7-nitro-2,1,3-benzoxadiazol-4-yl) amino]-D-glucose (2-NBDG) in differentiated 3T3-L1 adipocyte cells. Compounds 6, 13, and 17 exhibited strong glucose absorption stimulation activity in a dose-dependent manner.

1. Introduction

The prevalence of diabetes has been steadily increasing globally in recent decades, with an estimated 10.5% of individuals aged between 20 and 79 diagnosed with the disease in 2021 [1]. Within this age range, diabetes is a risk factor in one out of every nine deaths resulting from complications associated with the condition, underscoring its significance as a major public health concern worldwide [2,3]. Despite the development of numerous non-insulin glucose-lowering agents for managing diabetes, controlling target blood glucose levels remains challenging and often results in undesirable side effects [4,5]. Hence, there is an ongoing need to investigate new substances to prevent or treat diabetes more effectively. Insulin resistance is a central factor in the pathogenesis of type 2 diabetes [6]. In the manifestation of insulin resistance, protein tyrosine phosphatase 1B (PTP1B) plays a significant role as a negative regulator of insulin signaling [7,8,9,10,11]. Thus, PTP1B has been identified as a promising target for developing improved glucose-regulating agents [12].
Medicinal plants have been used empirically and reported to be helpful in diabetes treatment [13,14]. The mechanisms of action attributed to reported anti-diabetic plants include insulin mimetics, increased insulin secretion, β-cells regeneration in the pancreas, reduced glucose absorption, reduced glucosidase and amylase activity, and radical scavenging activity [13,15]. Additionally, it has been observed that some plant extracts and their constituents exhibit PTP1B inhibitory action [16]. However, despite many research efforts, no approved medication currently targets PTP1B inhibition. Cleistocalyx operculatus (Roxb. Merry. Et Perry) is an evergreen plant that has been historically utilized in Vietnam and China as traditional herbal tea and medicine to treat various ailments such as colds, fever, dysentery, vomiting, indigestion, gastrointestinal disorders, and inflammation [17,18,19,20]. Interestingly, an aqueous extract from flower buds of C. operculatus was reported to decrease glucose levels in individuals who were administered the extract for 12 weeks [21]. Chalcone-meroterpene derivatives isolated from the buds of C. operculatus have shown PTP1B inhibition activity [22]. Other chemical constituents identified in the plant include flavanones, flavones, and oleanane- and ursane-type triterpenoids [23,24,25].
Compared to the extensive research conducted on the flower buds of C. operculatus, there have been relatively fewer studies on its leaves. Thus, our research aimed to identify potential compounds with anti-diabetic properties in the more readily available leaves of C. operculatus. This led to the isolation of 17 compounds belonging to different classes of triterpenoids, including lupane, taraxastane, ursane, and oleanane type. Among these, two undescribed lupane-type triterpenoids (1 and 2) with dicarboxylic groups and one undescribed nor-taraxastane-type triterpenoid (3), were isolated. All the isolates (117) were evaluated for their inhibitory effects on PTP1B and also their stimulatory effects on 2-NBDG uptake in 3T3-L1 adipocyte cells. We elucidated the inhibition mechanisms on PTP1B and analyzed the structure–activity relationships. Furthermore, we investigated whether the PTP1B inhibitory activity correlated with glucose uptake stimulation in differentiated 3T3-L1 adipocyte cells.

2. Materials and Methods

2.1. General Experimental Procedures

A JASCO P-2000 polarimeter (JASCO International Co., Ltd., Tokyo, Japan) with a 1 cm microcell was employed to measure optical rotations. UV spectra were recorded on a SpectraMax M5 (Molecular Devices, Sunnyvale, CA, USA), and IR spectra were obtained in a JASCO FT/IR-4200 spectrometer (JASCO International Co., Ltd., Tokyo, Japan). Waters Xevo G2 QTOF mass spectrometer (Waters MS Technologies, Manchester, UK) equipped with an electrospray interface (ESI) was used to obtain high-resolution mass spectrometry data. NMR spectra were acquired on a JEOL 600 MHz NMR spectrometer (Jeol Ltd., Tokyo, Japan). Column chromatography resins employed in isolation included reversed-phase silica gel (ODS-A 12 nm S-150 μm, YMC Co, Ltd., Kyoto, Japan), Diaion HP-20 (Mitsubishi Chemical Corp., Tokyo, Japan), and Sephadex LH-20 (GE Healthcare, Little Chalfont, UK). Medium-pressure chromatographic separations employed the MPLC-Reveleris system (Grace, Columbia, MD, USA) with a Reveleris flash cartridge column (C18, 120 g, Grace, Columbia, MD, USA). Semi-preparative HPLC system included a Gilson 321 pump (Gilson Inc., Middleton, WI, USA) and a Gilson UV/VIS-151 detector (Gilson Inc., Middleton, WI, USA), and a YMC-Triart C18 column (250 × 10 mm ID, 5 μm, YMC Co., Ltd., Kyoto, Japan). Solvents were purchased from Daejung Chemicals & Metals Co. Ltd., Siheung, Republic of Korea.

2.2. Plant Material

The leaves of Cleistocalyx operculatus were purchased from a market in My Duc district, Hanoi, Vietnam, in February 2019. The botanical identification of the specimen was performed by Prof. Won Keun Oh. A voucher specimen (SNU2019-02) was deposited at the Laboratory of Pharmacognosy, College of Pharmacy, Seoul National University, Seoul, Republic of Korea.

2.3. Extraction and Isolation

Air dried leaves of C. operculatus (2.5 kg) were powdered and extracted three times with 50% aqueous EtOH at 60 ℃ for 8 h each. The crude extract obtained (427.8 g) was suspended in water and applied to a Diaion HP-20 column, then eluted sequentially with 50%, 70%, and 100% EtOH, followed by acetone to yield four fractions (A–D). Fraction C was further fractionated in a silica gel column chromatography (silica gel, 60–200 mesh; Zeochem, Louisville, KY, USA), where n-hexane/EtOAc [1:0, 1:1, 1:9, MeOH; v/v] were used as solvent system, yielding subfractions C1–C9. Subfraction C4 was subjected HPLC [Optima Pak C18 column (10 × 250 mm, 5 μm particle size, R.S. Tech, Cheongju-si, Republic of Korea); mobile phase CH3CN in H2O containing 0.1% formic acid (0−43 min: 85−95% CH3CN, 43−50 min: 100% CH3CN); flow rate 2 mL/min] to yield compounds 1 (3.4 mg), 5 (5.0 mg), 9 (13.0 mg), and 12 (14.9 mg). Subfraction C7 was likewise fractionated using an open column RP-C18 (4 × 40 cm; 75 μm particle size) and eluted with a stepwise gradient of CH3CN/H2O (1:1 to 1:0) to afford nine subfractions (C7-1−C7-9). One of these subfractions, C7-4, was applied to Sephadex LH-20 with H2O/MeOH (1:1 to 0:1) to obtain three subfractions (C7-4-1–C7-4-3). Subfraction C7-4-2 was subjected to RP-C18 column chromatography with (4 × 40 cm; 75 μm particle size) to yield five fractions (C7-4-2-1–C7-4-2-5). Subfraction C-7-4-2-2 was directly purified by HPLC [Optima Pak C18 Column; 10 × 250 mm, 5 μm particle size, R.S. Tech, Cheongju-si, Republic of Korea; mobile phase CH3CN in H2O containing 0.1% formic acid (0−30 min: 52% CH3CN, 43−52 min: 100% CH3CN); flow rate 2 mL/min], producing 7 (5.5 mg). Subfraction C7-4-2-4 was further separated by HPLC [Optima Pak C18 column (10 × 250 mm, 5 μm particle size, R.S. Tech, Cheongju-si, Republic of Korea); mobile phase CH3CN in H2O containing 0.1% formic acid (0−43 min: 52% CH3CN, 43−52 min: 100% CH3CN); flow rate 2 mL/min], yielding compounds 3 (6.4 mg) and 14 (20.0 mg). Subfraction C7-7 was applied to Sephadex LH-20 with H2O/MeOH (1:1 to 0:1) to afford seven subfractions (C7-7-1–C7-7-7). Among them, subfraction C7-7-4 was subjected to RP-C18 (4 × 40 cm; 75 μm particle size) column chromatography to yield eight subfractions using a gradient from 50% to 100% CH3CN. Subfraction C7-7-4-1 was directly purified by HPLC [Optima Pak C18 column (4.6 × 250 mm, 5 μm particle size, R.S. Tech, Cheongju-si, Republic of Korea); mobile phase CH3CN in H2O containing 0.1% formic acid (0−30 min: 36–51% CH3CN, 33–40 min: 100% CH3CN); flow rate 1 mL/min], resulting in compound 10 (4.4 mg). Subfraction C8 was applied to Sephadex LH-20 with CH2Cl2/MeOH (1:1 to 0:1) to afford six fractions (C8-1–C8-6). Subfraction C8-4 was subjected to RP-C18 column chromatography (4 × 40 cm; 75 μm particle size) and eluted with a stepwise gradient of CH3CN/H2O (1:1 to 1:0) to afford seven subfractions (C8-4-1–C8-4-7). Subfraction C8-4-6 was then applied to RP-C18, yielding seven fractions (C8-4-6-1–C8-4-6-7). Subfraction C8-4-6-5 was directly purified by HPLC [Optima Pak C18 Column; 10 × 250 mm, 5 μm particle size, R.S. Tech, Cheongju-si, Republic of Korea; mobile phase CH3CN in H2O containing 0.1% formic acid (0−40 min: 50–75% CH3CN, 41–50 min: 100% CH3CN); flow rate 2 mL/min], producing compounds 2 (7.9 mg), 11 (4.5 mg), 13 (11.6 mg), and 17 (3.4 mg). Subfraction C8-4-6-6 was purified using the same system [Optima Pak C18 Column; 10 × 250 mm, 5 μm particle size, R.S. Tech, Cheongju-si, Republic of Korea; mobile phase CH3CN in H2O containing 0.1% HCO2H (0−40 min: 46% CH3CN, 41–50 min: 100% CH3CN); flow rate 2 mL/min], resulting in compound 16 (4.1 mg).

2.4. Spectroscopic and Physical Characteristic of Compounds

Cleistocalyxic acid L (1): brownish gum; [ α ] D 25 : −21 (c 0.3, MeOH); UV λmax (MeOH) (log ɛ) (nm) 224 (1.96); IR (KBr) νmax 3364, 2946, 2871, 1706, 1697, 1451, 1389, 1219, and 1032 cm−1; HR-ESI-MS m/z 515.3382 [M − H] (calcd for C31H47O6, 515.3373); 1H and 13C NMR data (pyridine-d5, 600 and 150 MHz); see Table 1. The original IR, (−)-HR-ESI-MS, 1H NMR, 13C NMR, HSQC, HMBC, and NOESY spectra are shown in Figures S1–S7.
Cleistocalyxic acid M (2): white amorphous powder; [ α ] D 25 : +4 (c 0.3, MeOH); UV λmax (MeOH) (log ɛ) (nm) 226 (2.28). IR (KBr) νmax 3245, 2934, 2889, 2359, 2342, 1718, 1680, 1641, 1452, 1212, 1167, and 1033 cm−1; HRESIMS m/z 515.3372 [M − H] (calcd for C31H47O6, 515.3373); 1H and 13C NMR data (pyridine-d5, 600 and 150 MHz); see Table 1. The original IR, (−)-HR-ESI-MS, 1H NMR, 13C NMR, HSQC, HMBC, and NOESY spectra are shown in Figures S8–S14.
Cleistocalyxolide C (3): white amorphous powder; [ α ] D 25 : +82 (c 0.3, MeOH). UV λmax (MeOH) (log ɛ) (nm) 200 (3.16); IR (KBr) νmax 3365, 2924, 1775, 1647, 1356, 1218, 1149, 1057 and 1033 cm−1; HRESIMS m/z 513.2851 [M + HCOO] (calcd for C30H41O7, 513.2852); 1H and 13C NMR data (pyridine-d5, 600, and 150 MHz); see Table 1. The original IR, (−)-HR-ESI-MS, 1H NMR, 13C NMR, HSQC, HMBC, and NOESY spectra are shown in Figures S15–S21.

2.5. In Vitro PTP1B Inhibition Assay

PTP1B enzyme inhibition activity was assessed following a previously described protocol [26]. Briefly, 50 μL of 4 mM p-NPP was added to a buffer solution containing 1 mM dithiothreitol (DTT), 0.1 M NaCl, 1 mM EDTA, 50 mM citrate (pH 6.0), and 16 nM PTP1B (Enzo Life Sciences Inc., Farmingdale, NY, USA), along with either the test compounds or dimethyl sulfoxide (DMSO), bringing the final volume to 100 μL in a 96-well half-volume plate. It was followed by incubation at 37 °C for 30 min. After that, 10 μL of 10 M NaOH was added to quench the reaction. The enzymatic reaction product was measured by measuring the absorbance in a UV plate reader () at 405 nm. Ursolic acid was utilized as a positive control. The non-enzymatic reaction of the substrate was considered and accounted for by comparing data to a control experiment without the PTP1B enzyme. IC50 values were calculated using non-linear regression in GraphPad Prism 10 (GraphPad Software, Inc., San Diego, CA, USA), based on triplicate experiments.

2.6. Kinetic Analysis with PTP1B

Reaction velocity was measured at different concentrations of tested compounds for kinetic analysis. The tested compounds or DMSO were preincubated with the enzyme and buffer solution at 37 °C for 2 min, followed by adding 50 μL of substrate (p-NPP) at different concentrations. The initial reaction velocities were monitored at 37 °C at 405 nm for 15 min. The kinetic reaction slopes were calculated based on the absorbance increments observed between 2 and 10 min (within the linear range). GraphPad Prism 10 (GraphPad Software, Inc., San Diego, CA, USA) was used to graph the double reciprocal Lineweaver–Burk and Dixon plots.

2.7. Cell Culture and Differentiation of 3T3-L1 Adipocytes

3T3-L1 fibroblasts were cultured in DMEM (HyClone, Logan, UT, USA) supplemented with 10% calf serum, 100 U/mL penicillin, and 100 μg/mL streptomycin from Gibco (Grand Island, NY, USA). The cells were incubated at 37 °C with 5% CO2. Cells were differentiated after treatment with DMEM enriched with 10% fetal bovine serum (FBS) (HyClone, Logan, UT, USA), 1 μM dexamethasone (Sigma, St. Louis, MO, USA), 520 μM 3-isobutyl-1-methylxanthine (Sigma, St. Louis, MO, USA), and 1 μg/mL insulin (Roche, Mannheim, Germany). After 48 h, the media were changed with fresh DMEM containing 10% FBS, 1 μg/mL insulin, 100 U/mL penicillin, and 100 μg/mL streptomycin. Every 48 ours, the media were replaced until the induction of adipogenesis. Intracellular lipid droplets appeared after 4 to 6 days of incubation.

2.8. Measurement of Glucose Uptake Using the 2-NBDG Probe

In vitro experiments measured glucose uptake in 3T3-L1 adipocytes using 2-NBDG, a fluorescent glucose derivative (Invitrogen, Eugene, OR, USA). Cells were cultured on 96-well plates in a glucose-free medium supplemented with 10% FBS. After incubation, cells were treated with either insulin (as a positive control) or the test compounds in the presence or absence of 2-NBDG and were further incubated for an additional hour. Cells were washed with cold phosphate-buffered saline (PBS). The 2-NBDG fluorescence was quantified by measuring the signal intensity at excitation/emission wavelengths of 450/535 nm using a SpectraMax Gemini XPS fluorescence microplate reader (Molecular Devices, San Jose, CA, USA). For cellular transport studies involving 2-NBDG, 3T3-L1 adipocytes were grown on sterilized glass coverslips in a glucose-free medium containing 10% FBS for 24 h. After treatment with 2-NBDG, cells were washed with cold PBS. Fluorescent images were obtained with an Olympus IX 70 fluorescence microscope (Olympus Corporation, Tokyo, Japan) to quantify the cellular transport of 2-NBDG.

2.9. Molecular Docking Studies on the PTP1B Enzyme

The chemical structures of compounds 117 intended for docking simulations were minimized using Chem3D (Perkin Elmer, Shelton, CT, USA) and saved in .mol format. These files were then imported into Discovery Studio (Dassault Systèmes Biovia Corp., Vélizy-Villacoublay, France), where various conformers were generated, and ionization states were produced using the ‘Prepare Ligands’ tool. Energy minimization was performed by applying CHARMm force field and the Momany–Rone method. The structural data of the PTP1B protein were acquired from the RCSB Protein Data Bank, referencing PDB:1T49 [27]. For the preparation of the protein structure, parameters were set to CHARMm minimization, with protonation adjusted to pH 7.4, an ionic strength of 0.145, and the removal of water molecules. The docking procedure was conducted employing the Libdock protocol [28]. The coordinates set for identifying the sphere of protein–ligand interactions within the allosteric binding site of PTP1B were as follows: 53.8545, 30.4053, 24.5127, and 8.9. Default parameters were selected for docking preferences, setting the quality to high, choosing the FAST method for conformation, and applying the Steepest Descent for the Minimization Algorithm. Finally, the Discovery Studio Visualizer (Dassault Systèmes Biovia Corp., Vélizy-Villacoublay, France) was used to display the binding poses, protein surfaces, and interactions between proteins and ligands.

2.10. Statistical Analysis

Data were processed through variance analysis (ANOVA) to determine the significance of differences between groups, followed by Tukey’s or Duncan’s post hoc test. A p-value < 0.05 was considered indicative of a significant difference, with levels of significance denoted as follows: * p < 0.05, ** p < 0.01, and *** p < 0.001.

3. Results

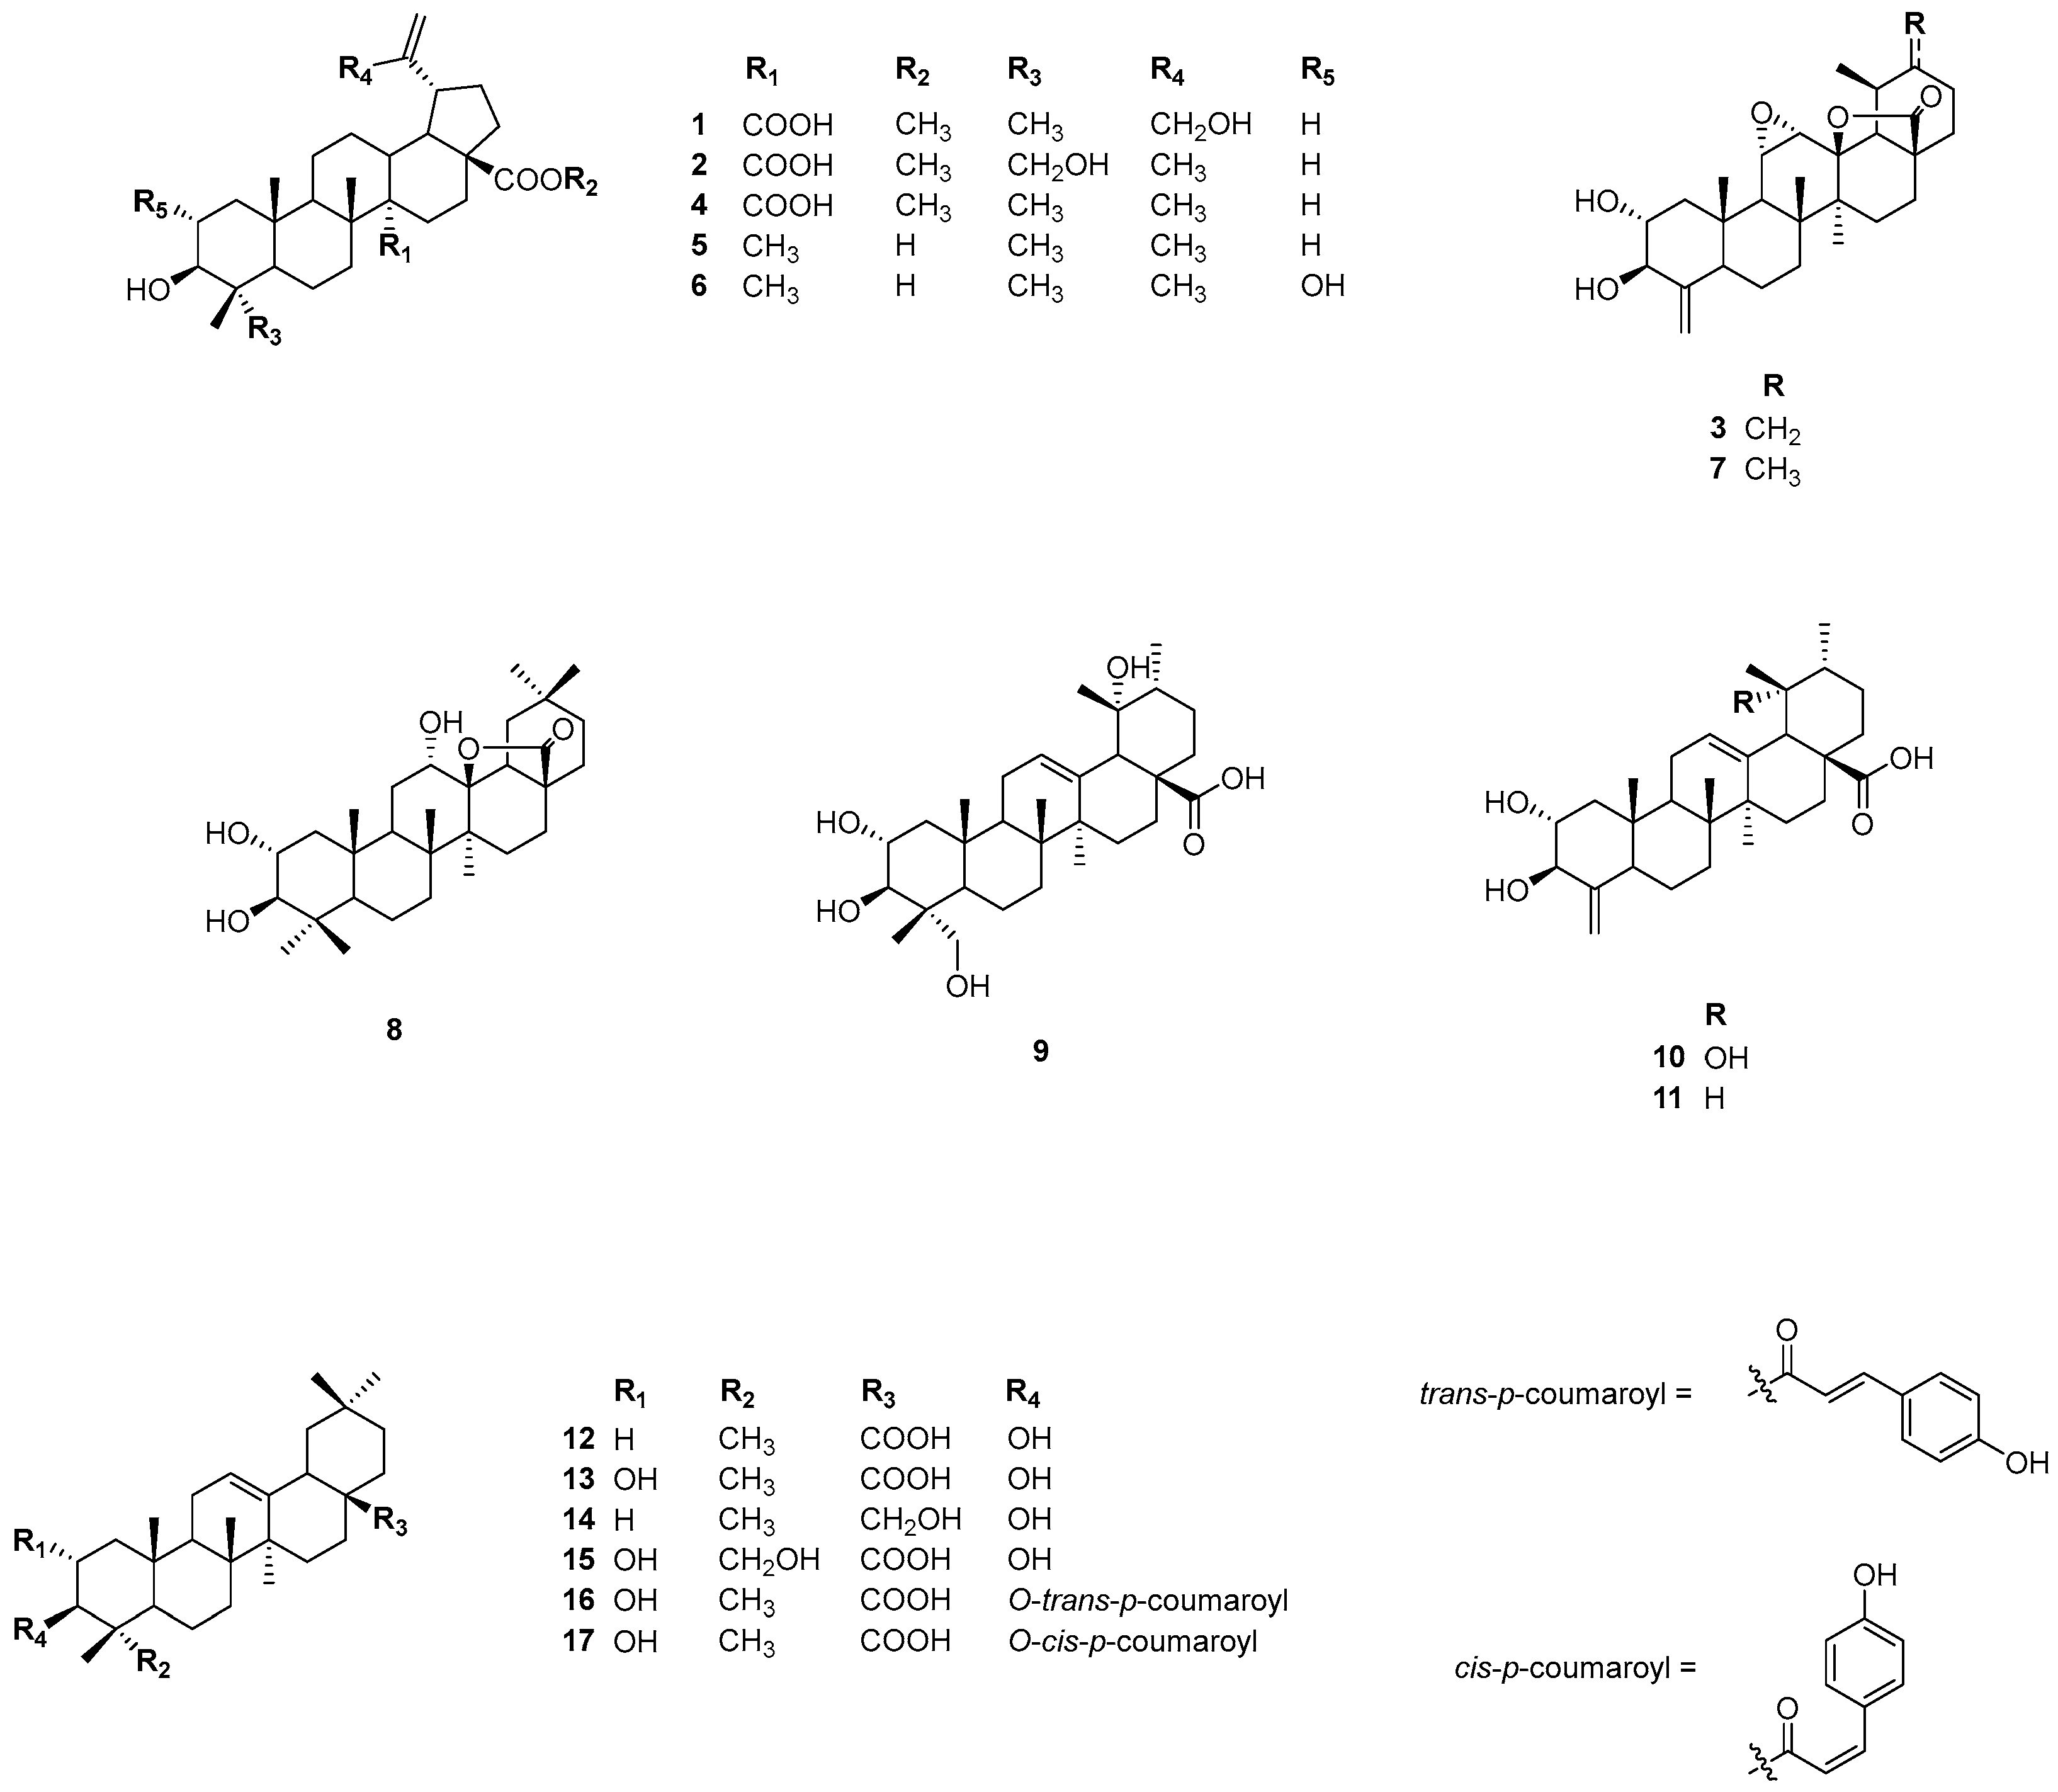
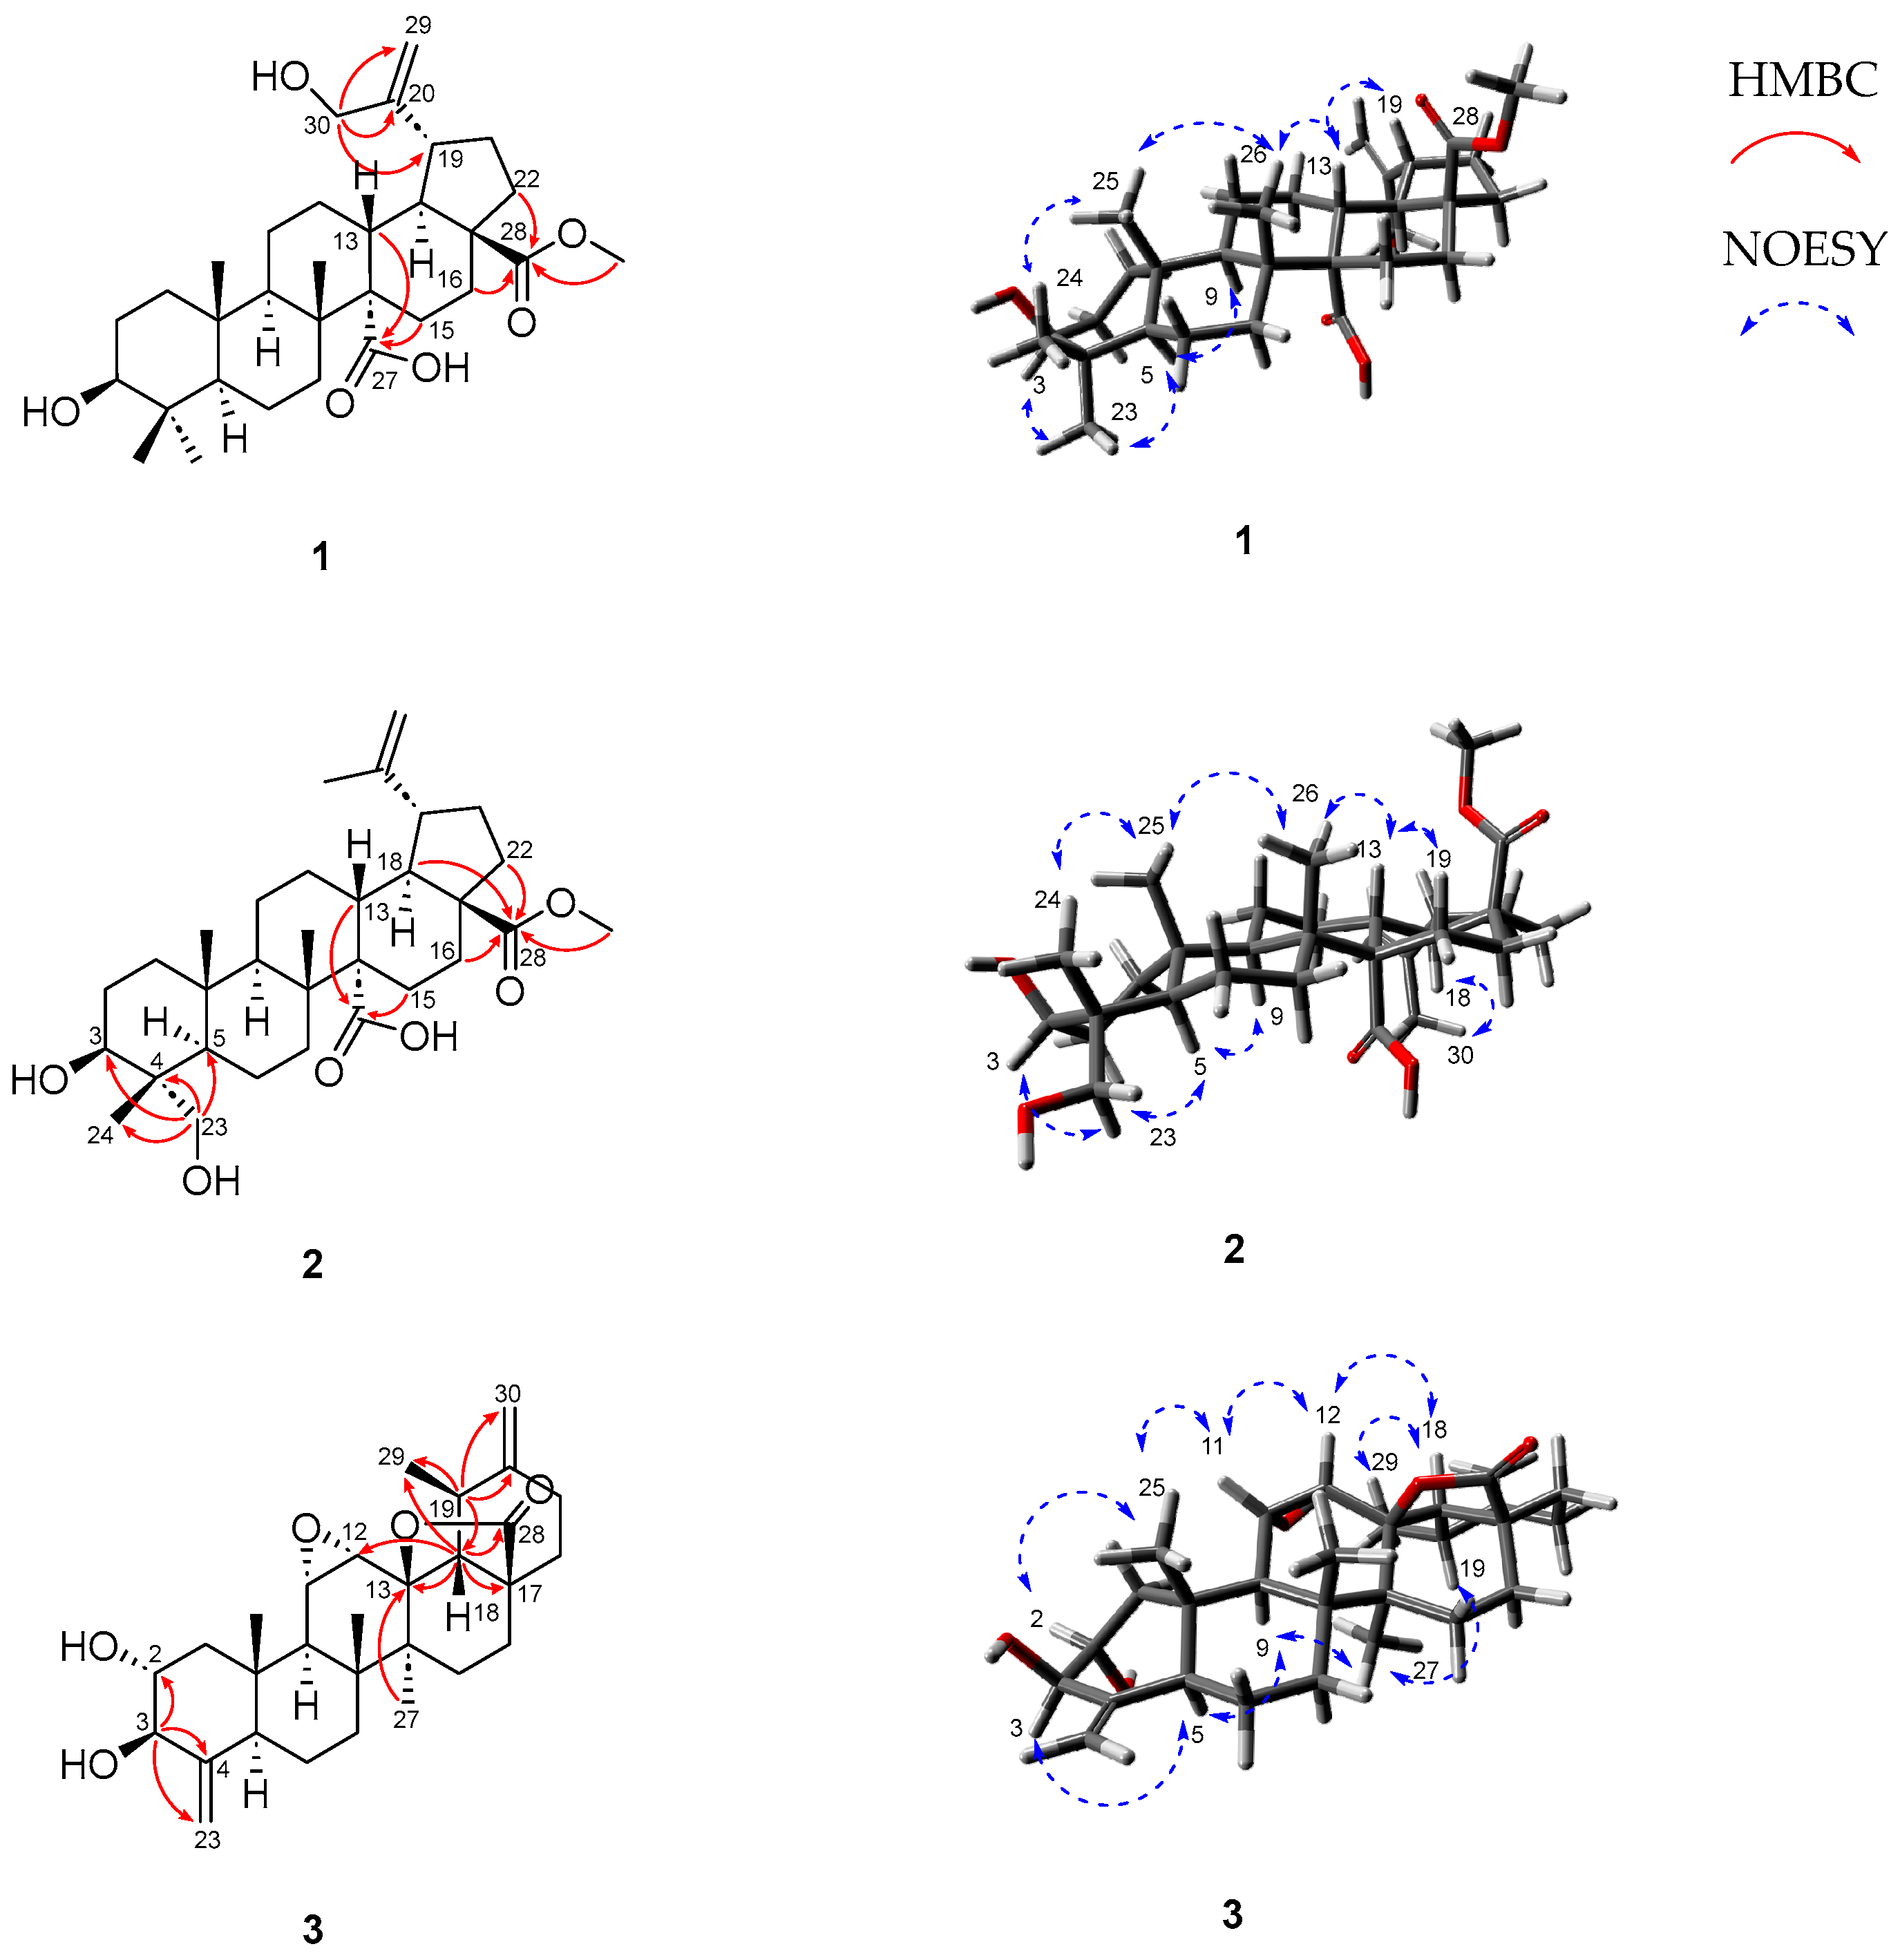
3.1. Structure Elucidation of Compounds 13 from Cleistocalyx Operculatus

A 50% EtOH extract of the dried leaves of C. operculatus was separated using a Diaion® HP-20 column with EtOH/H2O gradients, yielding four fractions (50%, 70%, 100%, and acetone). From the 100% EtOH fraction, three previously undescribed triterpenes (13) and 14 known compounds (417) were isolated by RP-18 and preparative high-performance liquid chromatography (HPLC) (Figure 1).
Compound 1 was obtained as a white amorphous powder with an optical rotation of [ α ] D 20 −21 (c 0.3, MeOH). High-resolution electrospray ionization mass spectrometry (HRESIMS) exhibited an ion peak at m/z 515.3382 [M − H] (calcd for C31H47O6, 515.3373), suggesting a molecular formula of C31H48O6. The 1H NMR spectrum of compound 1 (Table 1) showed four tertiary methyl groups (δH 2.28, 1.29, 1.20, and 1.20, each 3H, s), a methoxy group (δH 3.77, 3H, s), a hydroxyl methylene group (δH 4.73 and 4.56, each 1H, d, J = 15.0 Hz), an oxygenated methine proton (δH 3.27, 1H, dd, J = 11.4, 4.8 Hz), and two olefin protons (δH 5.61 and 5.38, each 1H, br s). The 13C NMR spectrum (Table 1) exhibited 31 carbon resonances, including two carboxylic groups at δC 178.8 and 177.3, an exocyclic methylene group at δC 107.3 and 156.5, an oxygenated carbon at δC 78.3, a methoxy group at δC 51.9, a hydroxyl methylene carbon at δC 64.7, and four methyl groups (δC 29.0, 17.9, 17.5, and 17.0). The 1H and 13C NMR spectroscopic data of compound 1 were found to be similar to those of melaleucic 28-O-methyl ester [29], except for a difference at C-30. In compound 1, the C-30 methyl present in melaleucic 28-O-methyl ester was replaced by a hydroxyl methylene group at δC 64.7. A detailed analysis involving HSQC and HMBC spectra was performed to confirm these results. The HMBC correlations from the hydroxyl methylene protons (δH 4.73 and 4.56, H-30) to C-20 (δC 156.5), C-29 (δC 107.3), and C-19 (δC 44.2) established the presence of a hydroxyl methylene group attached to the exocyclic double bond located at the pentacyclic E ring (Figure 2). Furthermore, the HMBC correlations from H-22 (δH 2.01 and 1.57)/H-16 (δH 1.93) to C-28 (δC 177.3), and from the methoxy group (δH 3.77) to C-28 (δC 177.3), indicated the position of the methyl ester carboxylic acid. The position of an additional carboxylic acid group in compound 1 was further determined by HMBC correlation from H-13 (δH 2.79)/H-15 (δH 1.57) to C-27 (δC 178.8). The relative configurations were determined by NOESY analysis. The NOESY correlations of H-3/H-23, H-3/H-9, and H-18α/H-19α, along with Me-24/Me-25, Me-25/Me-26, and Me-26/H-13β, were observed. Based on the well-established stereochemistry of lupane-type triterpenoids and their biosynthetic rules [30], the absolute configuration can be deduced. Therefore, the chemical structure of compound 1 was fully elucidated using 1H and 13C NMR, HSQC, HMBC, and NOESY spectroscopic techniques, and it was named cleistocalyxic acid L.
Compound 2 was obtained as a white amorphous powder, with its molecular formula determined as C31H48O6, based on HRESIMS data (m/z 515.3372 [M − H], calcd for 515.3373). The IR spectrum revealed absorption bands indicative of hydroxyl (3245 cm–1), ester (1718 and 1212 cm–1), and carboxyl (2934 and 1680 cm–1) groups. The 1H and 13C NMR spectra of compound 2 (Table 1) were similar to those of 1, with the only difference being the change in the position of a hydroxyl group. The chemical shifts from δH 4.73 and 4.56 at C-30 in compound 1 had disappeared, and new chemical shifts at δH 4.10 and 3.59 at the C-23 in compound 2 appeared. Based on HSQC, two correlations from δH 4.10 and 3.59 (H-23) to C-23 (δC 68.5) suggested the presence of a hydroxyl group at C-23. HMBC correlations from H-23 to C-3 (δC 74.0), C-4 (δC 43.3), C-5 (δC 49.6), and C-24 (δC 13.5) clearly indicated the position of the hydroxyl group at C-23. Additionally, HMBC correlations from H-22 (δH 2.02 and 1.45)/H-18 (δH 2.13)/H-16 (δH 1.88) and the methoxy group (δH 3.77) to C-28 (δC 177.3) determined the position of methyl ester carboxylic acid. The HMBC correlations from H-13 (δH 2.71) and H-15 (δH 1.56) to C-27 (δC 178.8) established the position of carboxylic acid. In the NOESY spectrum, H-3/Me-23, H-3/H-5, H-5/H-9, Me-24/Me-25, Me-25/Me-26, Me-26/H-13, and H-13/H-19 were observed to determine the configuration of compound 2. It was found to be consistent with that of compound 1 based on NOESY analysis. Similarly to compound 1, the absolute configuration can be deduced based on biosynthetic rules. Therefore, the structure of compound 2 was determined and named cleistocalyxic acid M.
Compound 3, a white amorphous powder, was determined to have a molecular formula of C29H40O5 by HRESIMS (m/z 513.2851 [M + HCOO], calcd for 513.2852). The IR spectrum indicated the presence of hydroxyl (3365 cm−1) and ester (1775 and 1149 cm–1) groups. The 1H NMR spectrum of compound 3 (Table 1) revealed two pairs of exomethylene protons [δH 5.89 and 4.99 (each 1H, br s, H-23), and δH 4.87 and 4.81 (each 1H, br s, H-30)], and four oxygenated protons [δH 4.38 (1H, d, J = 8.8 Hz, H-3), 4.13 (1H, m, H-2), 3.32 (1H, dd, J = 3.1, 2.4 Hz, H-11), and 3.07 (1H, d, J = 3.7 Hz, H-12)]. Three singlet methyl groups appeared at δH 1.18, 1.17, and 0.91, and a doublet methyl group was detected at δH 1.45 (3H, d, J = 6.3 Hz, H-29) in 1H NMR spectrum. The 13C NMR spectrum of compound 3 revealed 29 signals, indicating a nor-type triterpenoid. The 13C signals of compound 3 included a carboxylic group at δC 178.6, two exocyclic methylene groups at δC 152.4 (C-20) and 108.7 (C-30), δC 151.9 (C-4) and 105.7 (C-23), five oxygenated carbons at δC 89.7, 79.9, 73.7, 56.8, and 55.3, and four methyl groups at δC 20.7, 16.9, 16.7, and 16.3. The 1D NMR data of compound 3 were similar to those of ulmoidol isolated from Ilex kudincha [31]. The major difference between compound 3 and ulmoidol was the replacement of a methyl group at C-30 (δC 19.5) with a double bond [δC 151.9 (C-4) and 108.7 (C-30)]. The HMBC correlations from H-19 (δH 2.71) to C-29 (δC 16.9), C-30 (δC 108.7), C-18 (δC 61.6), and C-20 (δC 152.4) supported the presence of an ulmoidol moiety in structure. A proton signal at δH 1.88 (H-18) was extensively correlated with carbons in the HMBC spectrum, such as C-28 (δC 178.6), C-29 (δC 16.9), C-17 (δC 45.7), C-13 (δC 89.7), and C-12 (δC 56.8), indicating the presence of a lactone ring. Also, the HMBC correlation from Me-27 (δH 1.18) to C-13 (δC 89.7) supported the presence of a lactone moiety consisting of C-13, C-17, and C-28. In addition, the correlations from H-3 (δH 4.38) to C-2 (δC 73.7), C-4 (δC 151.9), and C-23 (δC 105.7) determined the position of the 23-nor-triterpenoid. Subsequent NOESY analysis confirmed the stereochemistry of the structure from the following correlations between H-3/H-5, H-5/H-9, H-9/Me-27, Me-27/H-19, H-2/Me-25, Me-25/Me-26, Me-25/H-11, H-11/H-12, Me-26/H-12, H-12/H-18, and H-18β/Me-29. Therefore, the structure of the new compound 3 was established and named cleistocalyxolide C.
The structures of 14 known compounds were determined by comparing their 1D and 2D NMR spectroscopic data with those reported in the literature. These compounds were identified as melaleucic acid 28-O-methyl ester (4) [29], betulinic acid (5), alphitolic acid (6) [32], ulmoidol (7) [31], (2a, 3b, 12a)-trihydorxy-olean-28-oic acid 28,13-lactone (8), 12-hydroxyasiatic acid (9), 2α,3β,19α-trihydroxy-24-norurs-4(23),12-dien-28-oic acid (10) [33], ilekudinol B (11) [31], oleanolic acid (12) [34], maslinic acid (13) [35], erythrodiol (14) [36], arjunolic acid (15) [37], 3-O-(E)-p-coumaroyl maslinic acid (16), and 3-O-(Z)-p-coumaroyl maslinic acid (17) [38] (Figure 1).

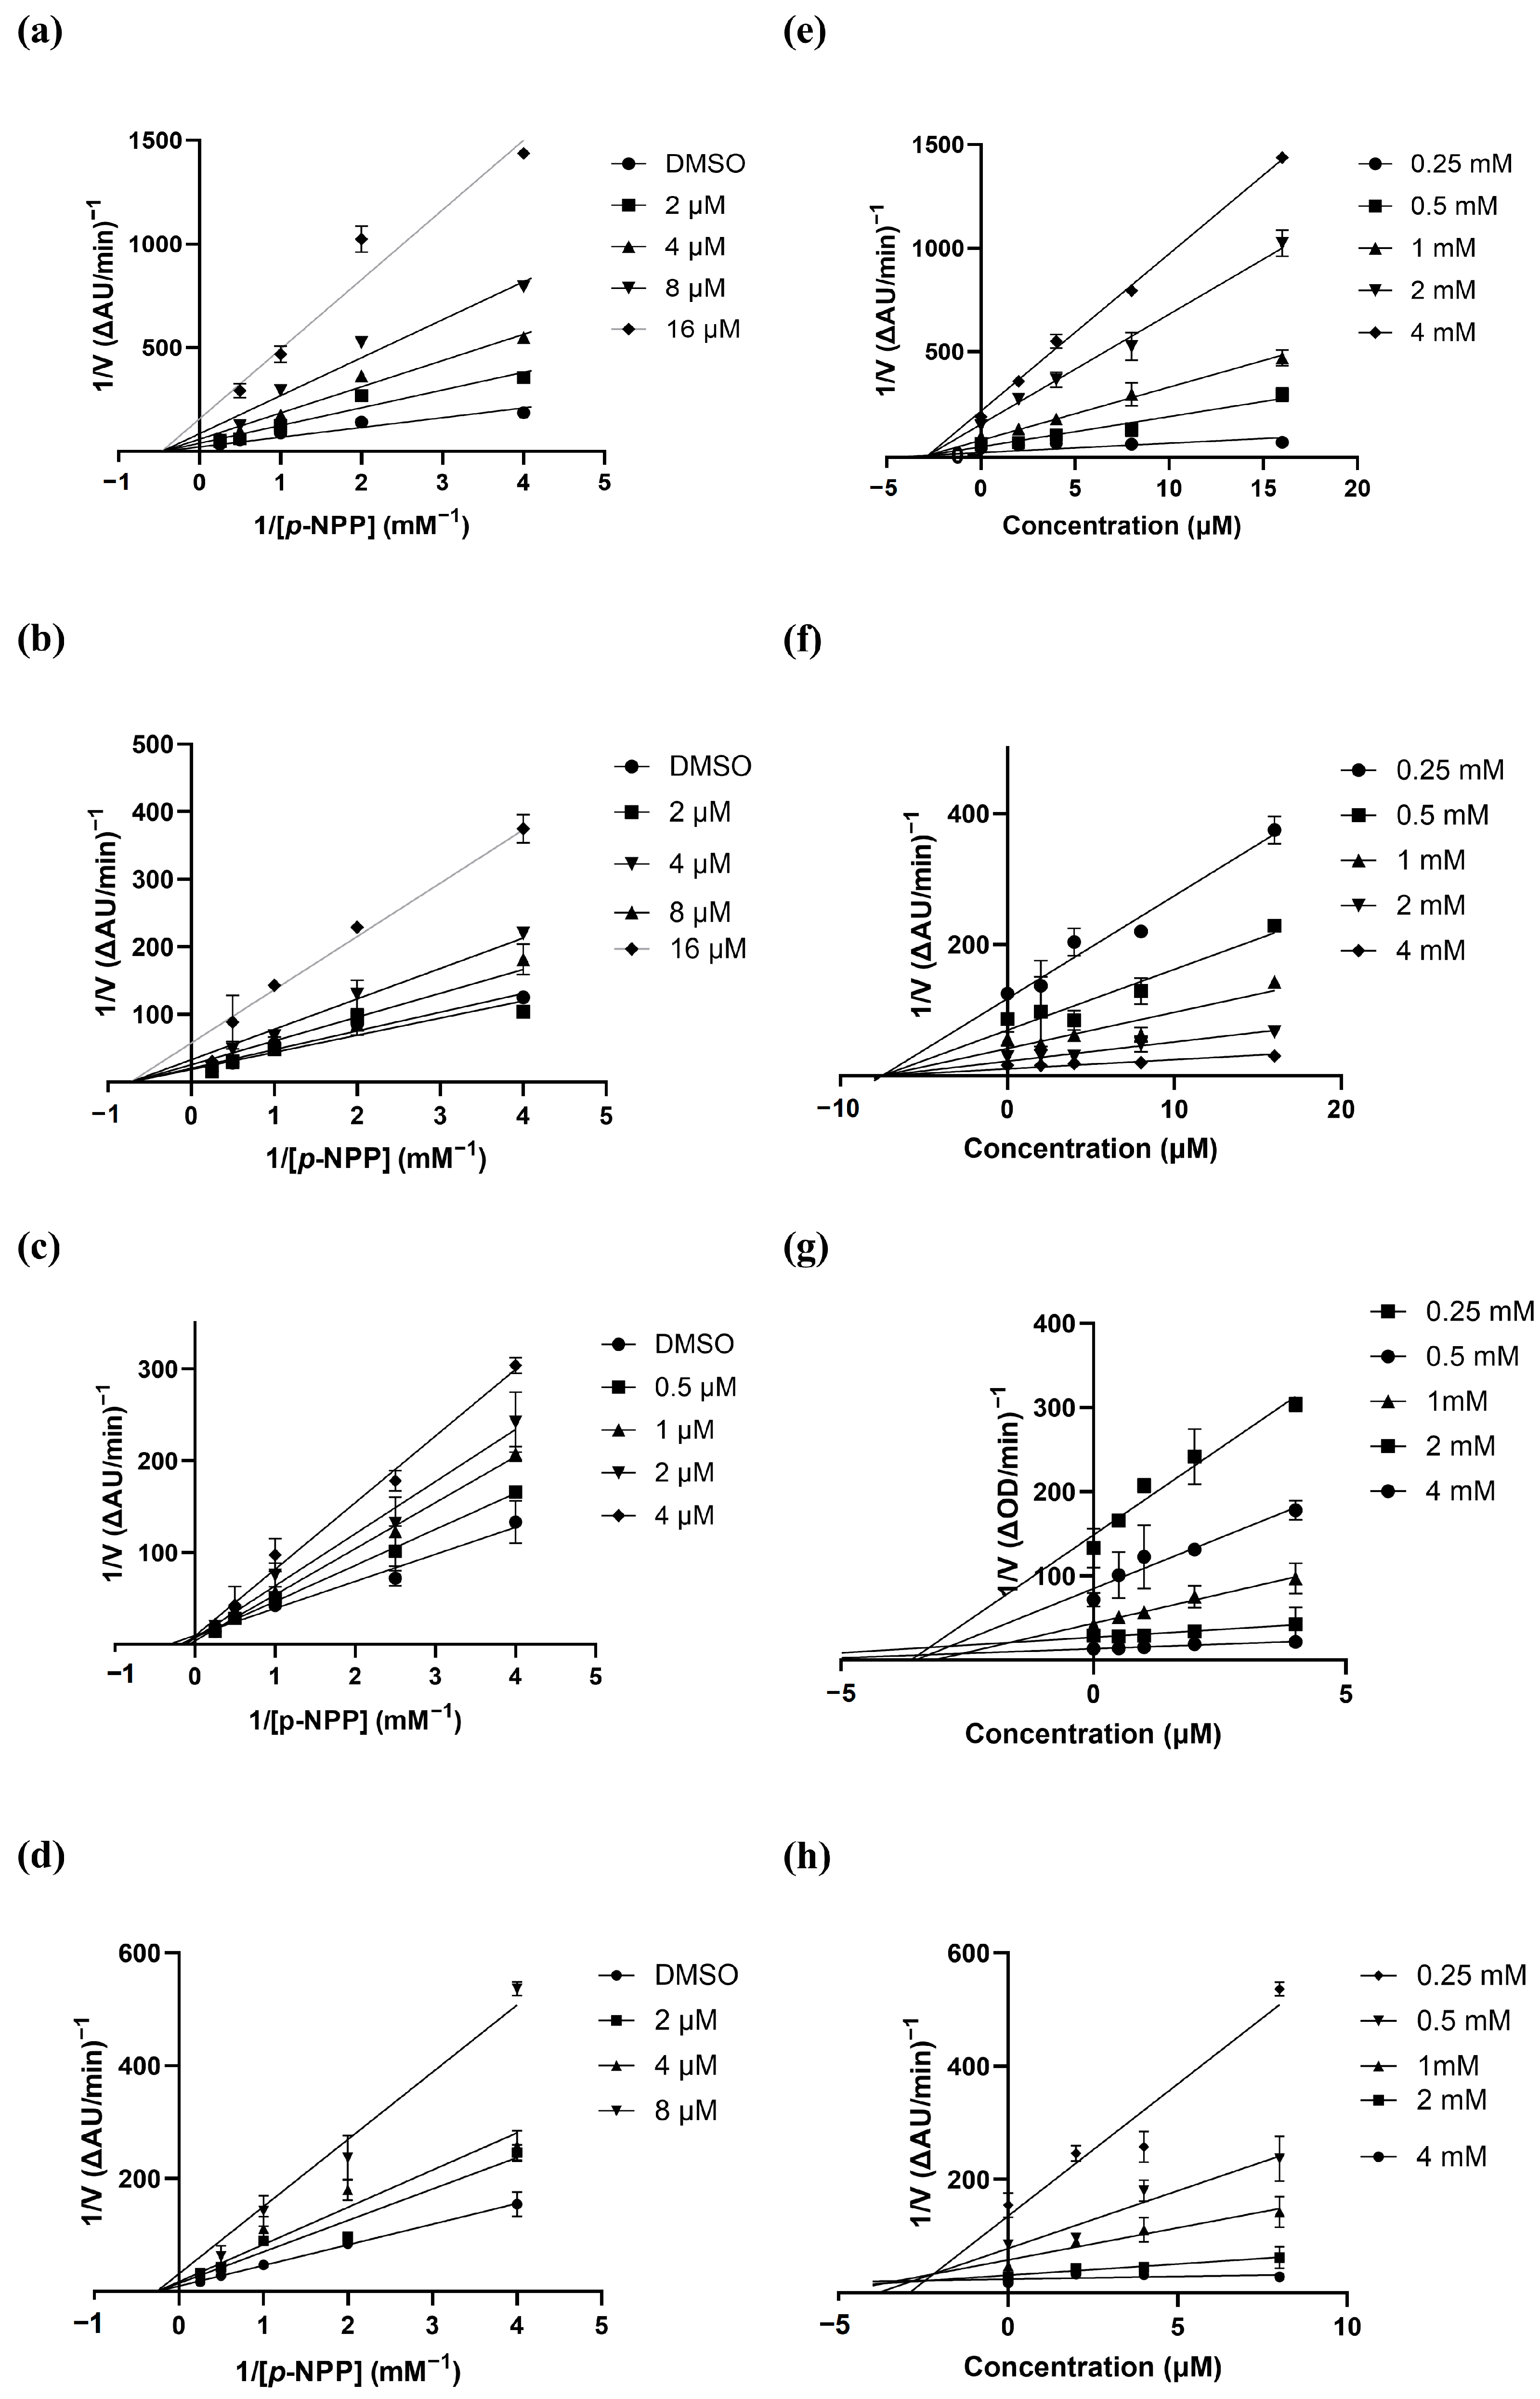
3.2. PTP1B Inhibitory Activity of Compounds 117 and Enzyme Kinetics

PTP1B has been established as an attractive drug target for treating diabetes [39,40,41]. To explore possible therapeutic potentials, we measured the inhibitory effects of compounds 117 on the PTP1B enzyme, with ursolic acid as a positive control (Figure S22). Firstly, we screened all isolated compounds at a concentration of 20 µM. Most isolates exhibited inhibitory activity against PTP1B except for cleistocalyxic acid L (1), cleistocalyxolide C (3), ulmoidol (7), and (2a,3b,12a)-trihydorxy-olean-28-oic acid 28,13-lactone (8). From this result, it can be inferred that the presence of a lactone ring in 3, 7, and 8 is associated with reduced PTP1B inhibitory activity. Following the initial screening, the half-maximal response of PTP1B activity (IC50) was determined for the compounds that showed less than 50% enzyme activity at a concentration of 20 μM. To determine the IC50 values, we employed six different concentrations for each compound to establish their inhibitory potency profiles. The results revealed that betulinic acid (5), oleanolic acid (12), maslinic acid (13), and 3-O-(Z)-p-coumaroyl maslinic acid (17) exhibited significant inhibitory activity on the PTP1B enzyme, similar to the positive control (Table 2 and Figures S23–S26). The PTP1B inhibitory effects of betulinic acid, oleanolic acid, and maslinic acid have been previously reported, and our results support these previous reports.
We selected one compound each from different triterpenoid backbones, including lupane, ursane, and oleanane types, for further study. The enzymatic inhibition mechanism of the selected compounds 6, 9,13, and 17 was deduced from experimental kinetic data, where different concentrations of the p-NPP substrate and inhibitors were tested to measure the velocities of the PTP1B enzymatic reaction. The inverse of the velocity and the inverse of the substrate concentration values were used to create Lineweaver–Burk plots. These plots showed straight lines intersecting on the 1/[S] axis for compounds 6, 9, 13, and 17 (Figure 3), indicating that these compounds act as non-competitive inhibitor of PTP1B. As a lupane-type triterpenoid, compound 6 shares the same skeletal structure with compounds 1, 2, 4, and 5. Compound 9 shows structural similarities with compounds 10 and 11, while compounds 1217 are oleanane-type triterpenoids. It is reasonable to assume that all the isolated compounds possess a non-competitive mechanism of action in inhibiting PTP1B since compounds 6, 9, 13, and 17, which are representative compounds of each type, showed non-competitive inhibition of PTP1B. We further examined Dixon plots, which depict the plot of 1/enzyme velocity (1/V) against inhibitor concentration (I), to determine the dissociation or inhibition constant (Ki) for the enzyme–inhibitor complex. The value at which the x-axis intersects corresponds to—Ki. The Ki values for compounds 6, 9, 13, and 17 were calculated to be 2.8 ± 0.4, 7.6 ± 1.2, 3.2 ± 0.6, and 2.7 ± 0.4 μM, respectively (Figure 3, Table 2). The Ki value serves as an important indicator of the binding affinity between an enzyme and an inhibitor. For non-competitive inhibitors, the IC50 is expected to equal the Ki. Our experimental data show that the values obtained for both parameters are consistent (Table 2).

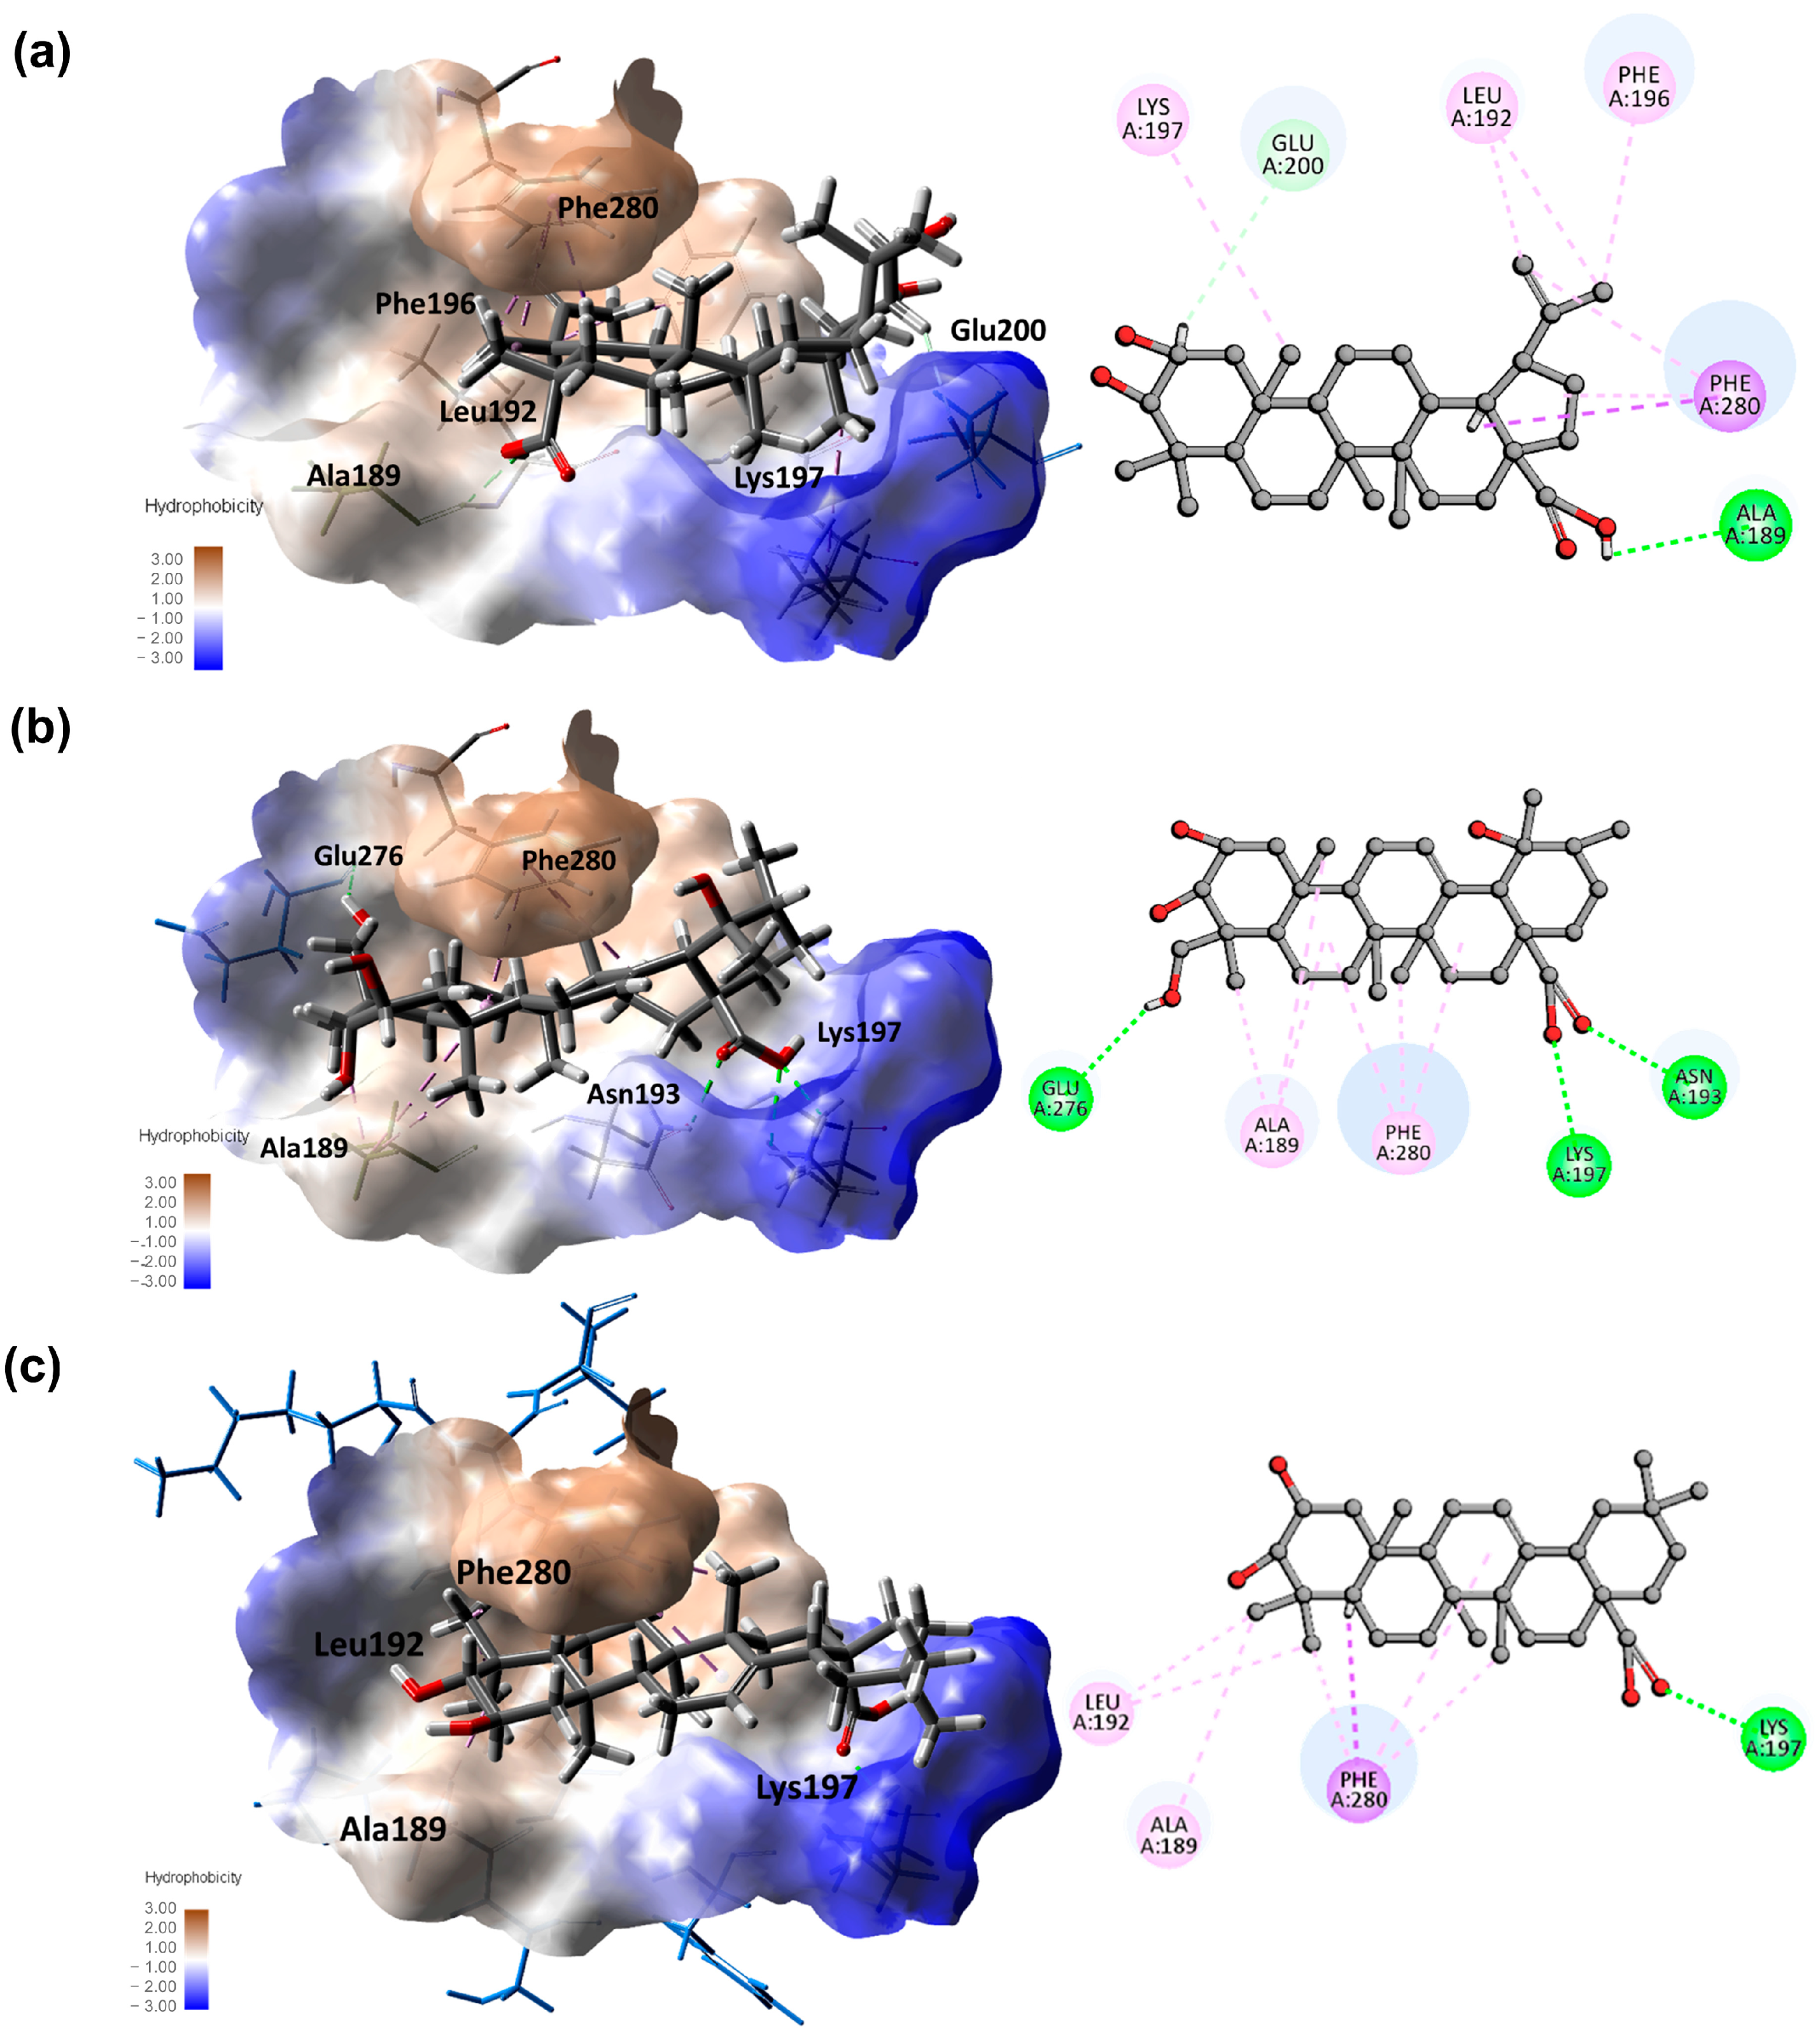
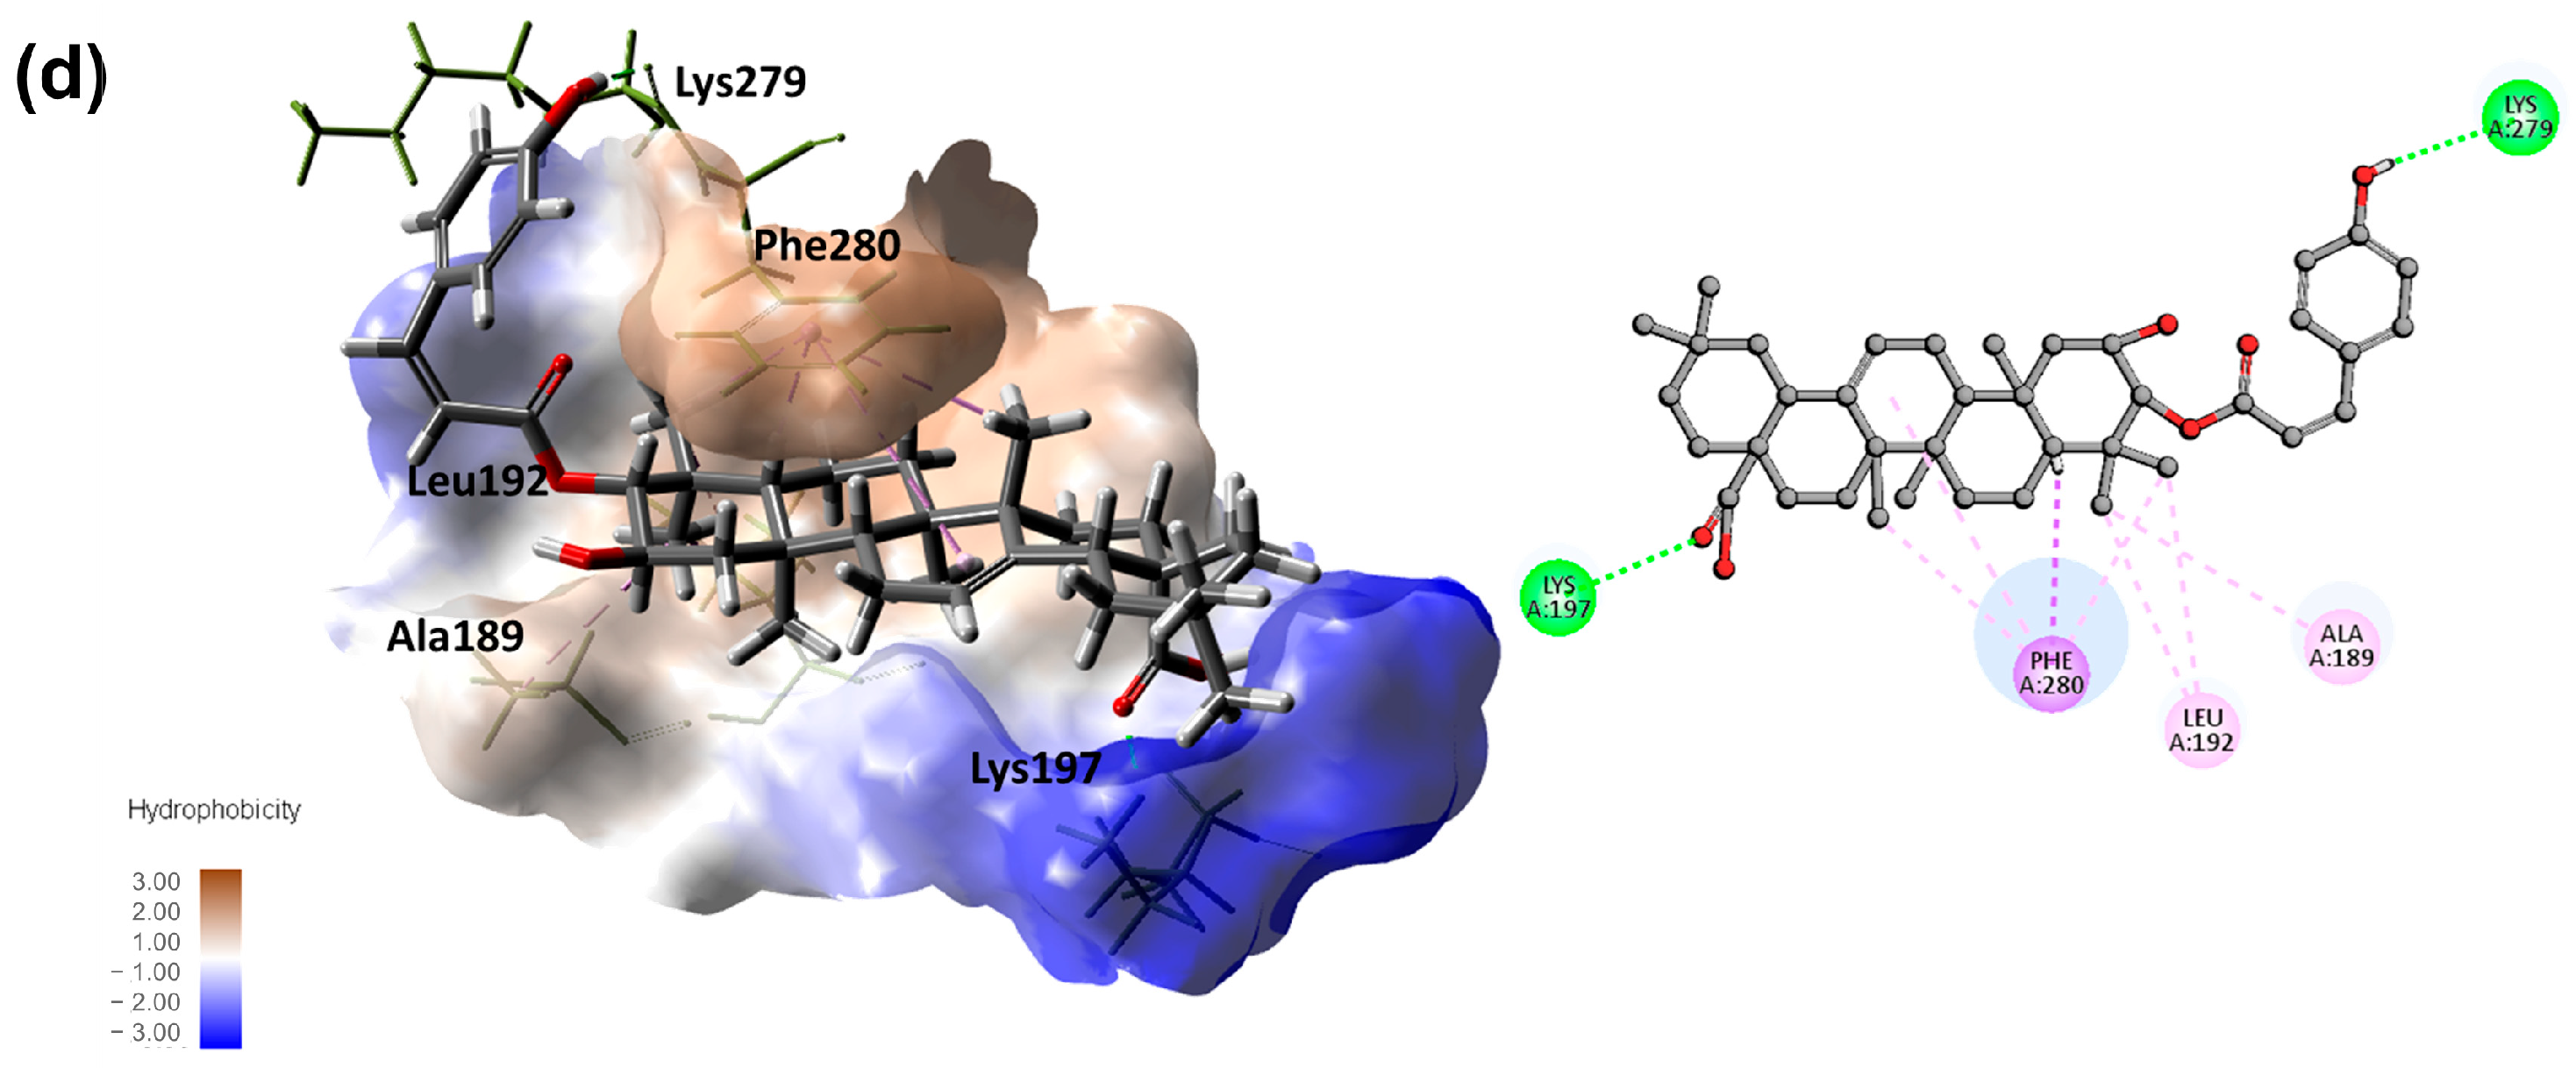
3.3. Structure Activity Relationship (SAR) Analysis and Molecular Docking Experiments

The isolated compounds predominantly feature a pentacyclic triterpenoid ring, enabling us to discern the impact of various functional groups within this structural framework on PTP1B inhibition. Compounds 3, 7, and 8 exhibit reduced inhibitory effects, likely due to the presence of a lactone ring connecting C-13 and C-18. Similarly, hydroxylation of methyl groups at Me-24 and Me-30 leads to diminished activity among lupane-type triterpenes, including compounds 1, 2, and 46. Adding functional groups to the ursolic acid skeleton, such as the C-3 and C-19 hydroxyl groups in compounds 9 and 10, results in a slight reduction in PTP1B inhibition. Additionally, a decrease in activity is observed with methyl modifications at C-24 and C-25 in compounds 10 and 11, leading to a more noticeable decline in bioactivity compared to compound 9 and ursolic acid. The inhibition efficacy of oleanolic acid (12) is slightly improved by incorporating hydroxyl groups at position C-2. Furthermore, substituting the carboxylic acid at C-28 with a hydroxyl group diminishes its activity. Adding a p-coumaroyl moiety to maslinic acid (13) results in a slight decrease in activity for compounds 16 and 17.
Molecular docking simulations were employed to better understand the chemical interactions between the isolated compounds and the PTP1B protein. The selection of the 1T49 crystal structure for molecular docking studies was based on prior published research and the presence of a crystallized ligand at the allosteric site [27,42,43]. The docking results yielded various binding poses for the isolated molecules (Table 3). A detailed evaluation was performed, and the pose with the most favorable score was chosen for further examination. Most molecules exhibited binding poses that fit well into the hydrophobic pocket of the allosteric site (Figure S27). In the case of lupane derivatives, key interactions were observed between the olefinic carbons and the amino acids leucine-192 and phenylalanine-196, resulting in a π-alkyl interaction. Hydroxylation at C-30 may hinder this interaction, as seen in compound 1. Alkyl interactions were also noted between Me-25 and the backbone of lysine-197. Moreover, conventional hydrogen bond interactions were confirmed between the carboxylic acid and alanine-193 and lysine-197. Substituting it with a methyl ester carboxylic acid appears to eliminate this interaction. The additional hydroxyl group at position Me-24 in ursane-type triterpenoids may facilitate other interactions, such as conventional hydrogen bonds, as evidenced by the interaction between this hydroxyl group and glutamate-276 (Figure 4). Additional hydrogen bond interactions between the carboxylic acid and alanine-193 and lysine-197 were observed for ursane- and oleanane-type triterpenoids. Similarly, compound 13 showed hydrophobic interactions with Phe280 and Ala 189. Also, there were hydrogen bond interactions between the carboxylic acid group and Lys197. The inclusion of a coumaroyl substituent at position C-3, as seen in compound 16 and 17, resulted in binding poses with additional π-π interactions between the aromatic ring in the coumaroyl moiety and phenylalanine-280. These poses showed better docking scores than compounds 13. However, this did not translate into better performance in the observed experimental enzymatic inhibitory activity.
In conclusion, preserving an unmodified hydrophobic core is crucial for maintaining inhibitory activity in PTP1B. The incorporation of polar groups at the core, particularly in the C and D rings, results in a reduction in binding affinity. A carboxylic acid moiety at C-28 is also pivotal in facilitating hydrogen bonding with polar protein residues. Substituents at C-3, as demonstrated by compounds 16 and 17, did not significantly affect enzymatic activity and can contribute to enhanced binding affinity. These insights into the structural determinants of PTP1B inhibition provide valuable information for developing future derivatives based on isolated triterpene scaffolds.

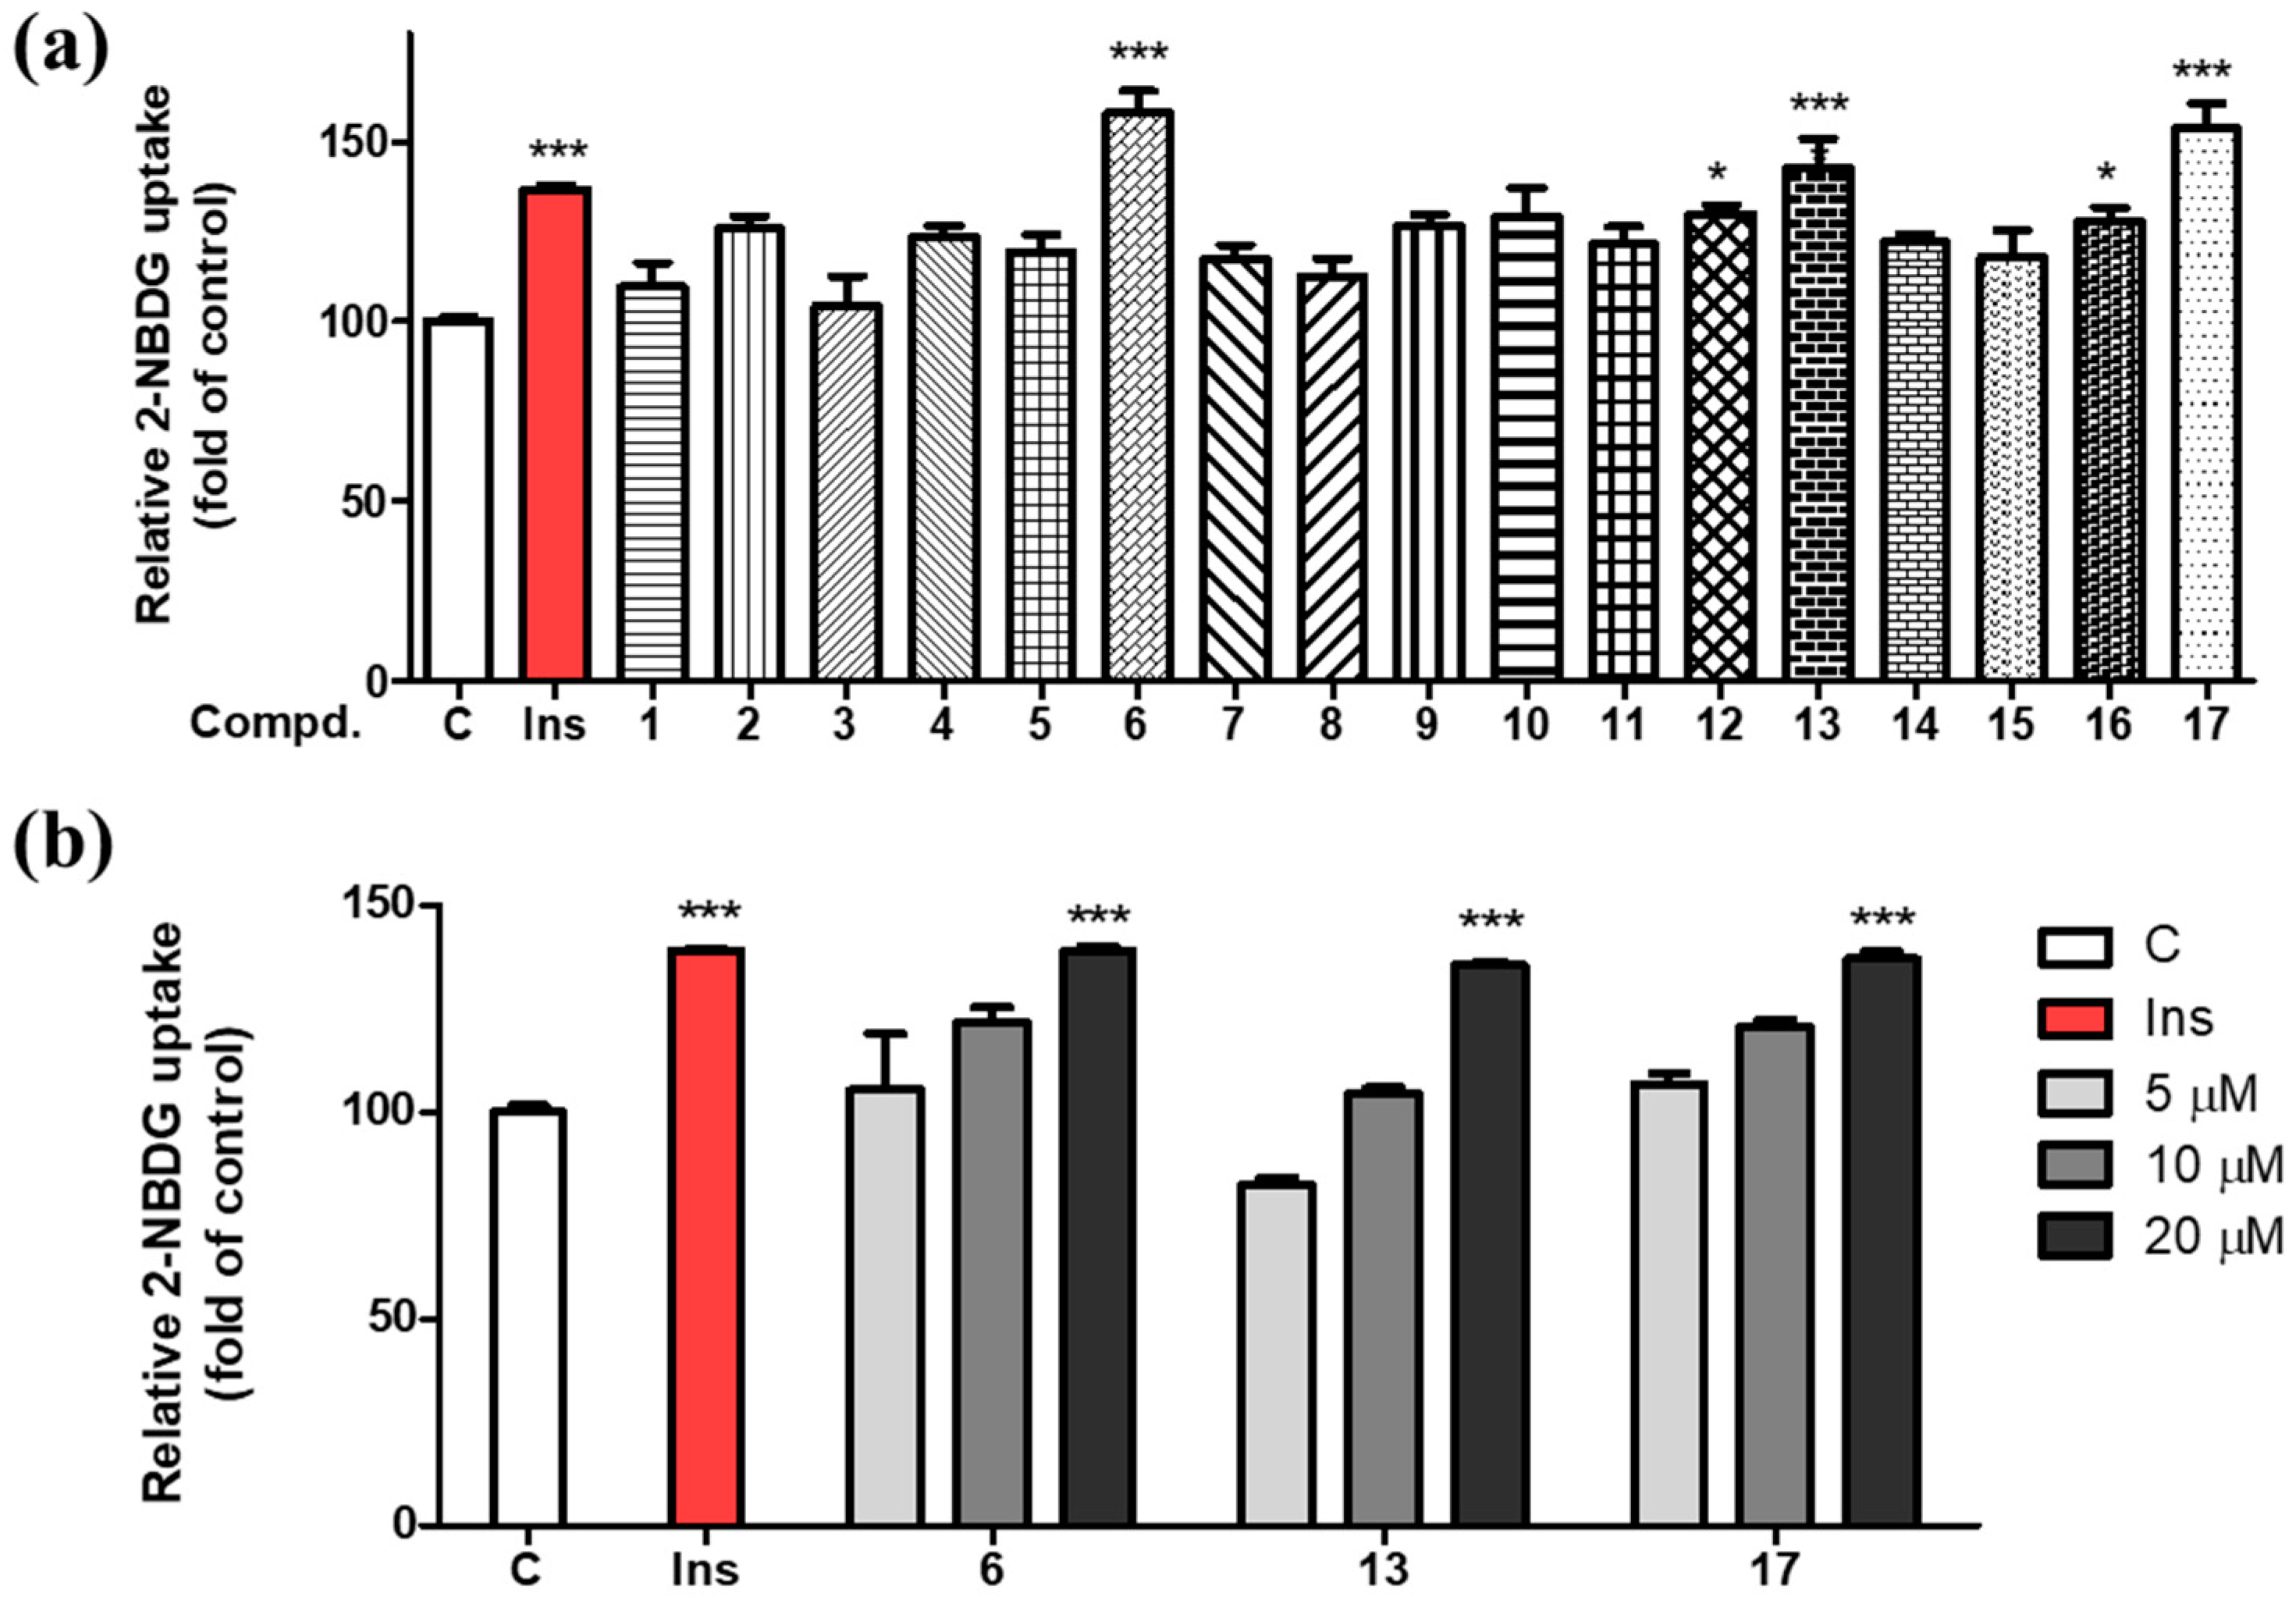
3.4. Effect of Stimulating Glucose Uptake in Adipocytes

To determine if the PTP1B inhibition activity of compounds 117 affects the glucose uptake process, we also further evaluated their effects in vitro using 2-NBDG in 3T3-L1 adipocyte cells. 2-NBDG is a known fluorescent-tagged glucose probe used for identifying insulin-mimetic compounds [44,45]. The 3T3-L1 adipocytes, insulin-sensitive cells that are fully differentiated, were utilized for this experiment. To determine the transportation efficacy of 2-NBDG into the cells, we assessed the fluorescent signal in the differentiated adipocytes after treating them with each isolate at a concentration of 20 μM using fluorescence microscopy, with insulin serving as a positive control (Figure 5). As a result, compounds 6, 12, 13, 16, and 17, which also exhibited PTP1B inhibitory activities, showed glucose uptake stimulatory effects. Among them, compounds 6, 13 and 17 displayed particularly potent glucose uptake stimulatory effects, prompting further investigation for these compounds at various concentrations (5, 10, and 20 μM). The activities of compounds 6, 13, and 17 on glucose uptake were found to be dose dependent (Figure 5).

4. Discussion

PTP1B is a promising target for diabetes control due to its role in the development of insulin resistance, where it plays a key role in regulating insulin signaling. Triterpenes have been proven to possess anti-diabetic potential and have inhibitory effects on PTP1B [16,46,47]. Several studies have highlighted the ability of triterpenoids to improve glucose uptake [44,45]. Oleanolic acid (12) has been shown to improve glucose homeostasis and prevent the progression of type 2 diabetes in pre-diabetic male Sprague Dawley rats [44]. Furthermore, maslinic acid (13), a triterpenoid isolated in this study, increased glucose uptake, reduced lipid droplet and triglyceride levels, and raised intracellular Ca2+ concentration, suggesting its potential as a candidate for obesity and diabetes treatment [48]. Among the triterpenes in C. operculatus leaves, maslinic acid, corosolic acid, asiatic acid, and arjulonic acid are the most abundant [24]. The content of total terpenoids in hot-water infusion from C. operculatus leaves has been reported as 13.12 mg/g of dried leaves [49]. Thus, it is natural to assume that C. operculatus leaves may exert anti-diabetic properties, but no prior research has reported it.
In this study, the isolation of 17 triterpenes with various substitution patterns facilitated the elucidation of their structure–activity relationships concerning glucose uptake efficacy and PTP1B inhibition. Interestingly, we found that compounds inhibiting PTP1B also stimulated glucose uptake. A moderate positive correlation was observed between glucose uptake activity and PTP1B inhibition (Spearman correlation, R = 0.51, p = 0.03; see Figure S28). This suggests that changes affecting PTP1B inhibitory activity will likely influence glucose uptake stimulation. Therefore, the stimulatory effect on glucose uptake appears to be mediated through PTP1B. It is well established that the dephosphorylation of insulin receptor substrates (IRS) by PTP1B affects the translocation of glucose transporter type 4 (GLUT4), significantly reducing glucose uptake in adipose and skeletal muscle cells [50,51,52,53,54,55]. This known mechanism supports the correlation observed in our experimental results.
Betulinic acid (5) showed slightly better activity than alphitolic acid (6) in inhibiting PTP1B. However, the additional hydroxyl group at C-2 significantly improved glucose uptake activity of 6, likely due to enhanced solubility or transport through cell membranes (Table S1). Similarly, the hydroxyl group at C-2 improved the activity of maslinic acid (13) compared to oleanolic acid (12). Hydroxylation at other positions compromises PTP1B inhibition and glucose uptake stimulation. On the other hand, adding a p-coumaroyl moiety to maslinic acid (13) did not significantly impact either PTP1B inhibitory activity or glucose uptake. Modifications of ursolic acid skeleton reduced PTP1B inhibition for compounds 911. Compounds 3, 7, and 8 exhibited low glucose uptake stimulation and PTP1B inhibition activity, likely due to a lactone ring connecting C-13 and C-18. Despite the known bioactivities of betulinic acid (5), oleanolic acid (12), maslinic acid (13), and ursolic acid on PTP1B, we further confirmed their effects on glucose uptake stimulation. In addition, we observed that, in general, compounds retained the same levels of bioactivity. However, alphitolic acid (6), maslinic acid (13), and 3-O-(Z)-p-coumaroyl maslinic acid (17) outperformed the others in the glucose uptake assay in 3T3-L1 adipocytes, possibly due to better solubility and the ability to absorb through cell membranes.
Overall, we anticipate that the findings of this study will contribute significantly to the development of standardized extracts of C. operculatus as a promising option for complementary diabetes treatment.

5. Conclusions

During our investigation of Cleistocalyx operculatus leaves, we isolated three new triterpenoids (13) and 14 known compounds (417). All these compounds were tested in PTP1B inhibition assays, and their IC50 values were determined. The most active compounds were betulinic acid (5), oleanolic acid (12), and maslinic acid (13). Enzyme kinetic experiments revealed that compounds possess a non-competitive inhibition mechanism, which molecular docking models supported. In vitro glucose uptake assays in differentiated 3T3-L1 adipocytes showed that alphitolic acid (6), maslinic acid (13), and 3-O-(Z)-p-coumaroyl maslinic acid (17) exhibited the most potent anti-diabetic effects. In addition, we infer that the glucose uptake stimulation effect by the isolated compounds is mediated through PTP1B, as indicated by the moderate positive correlation. Overall, this work provides experimental evidence supporting the potential of C. operculatus leaf extract as a plant-based alternative for diabetes management.

Supplementary Materials

The following are available online at https://www.mdpi.com/article/10.3390/nu16172839/s1, Figure S1. HR-ESI-MS spectrum of compound 1. Figure S2. IR spectrum of compound 1. Figure S3. 1H NMR spectrum of compound 1 in pyridine-d5. Figure S4. 13C NMR spectrum of compound 1 in pyridine-d5. Figure S5. HSQC spectrum of compound 1 in pyridine-d5. Figure S6. HMBC spectrum of compound 1 in pyridine-d5. Figure S7. NOESY spectrum of compound 1 in pyridine-d5. Figure S8. HR-ESI-MS spectrum of compound 1. Figure S9. IR spectrum of compound 2. Figure S10. 1H NMR spectrum of compound 2 in pyridine-d5. Figure S11. 13C NMR spectrum of compound 2 in pyridine-d5. Figure S12. HSQC spectrum of compound 2 in pyridine-d5. Figure S13. HMBC spectrum of compound 2 in pyridine-d5. Figure S14. NOESY spectrum of compound 2 in pyridine-d5. Figure S15. HR-ESI-MS spectrum of compound 3. Figure S16. IR spectrum of compound 3. Figure S17. 1H NMR spectrum of compound 3 in pyridine-d5. Figure S18. 13C NMR spectrum of compound 3 in pyridine-d5. Figure S19. HSQC spectrum of compound 3 in pyridine-d5. Figure S20. HMBC spectrum of compound 3 in pyridine-d5. Figure S21. NOESY spectrum of compound 3 in pyridine-d5. Figure S22. PTP1B inhibition activity screening of compounds 117. Figure S23. PTP1B inhibition activity of compound 4, 5 and 6. Figure S24. PTP1B inhibition activity of compound 9, 10 and 11. Figure S25. PTP1B inhibition activity of compound 13, 14 and 15. Figure S26. PTP1B inhibition activity of compounds 16 and 17. Figure S27. Molecular docked structures in PTP1B allosteric site. Figure S28. Correlation between PTP1B inhibition activities and Glucose uptake stimulation among isolated compounds. Figure S29. LC-MS data of C. operculatus leaves hot water extract and 50%EtOH extract. Table S1. ADMET profile of isolated compounds predicted by QSAR regression models.

Author Contributions

J.-E.P.-Z.: writing—original draft, data curation, project administration; B.R.: writing—original draft, data curation; J.-Y.L.: data curation; E.-J.P.: data curation; V.-H.M.: investigation; T.-P.D.: data curation; H.-J.L.: resources; W.-K.O.: supervision, writing—review and editing, funding acquisition, project administration. All authors have read and agreed to the published version of the manuscript.

Funding

This research was supported by grants from the Basic Science Research Program (NRF-2022R1A2C200506113) and (2022M3H9A108298421) through the National Research Foundation of Korea (N.R.F.) funded by the Ministry of Science and I.C.T. in Republic of Korea.

Institutional Review Board Statement

Not applicable.

Informed Consent Statement

Not applicable.

Data Availability Statement

The data in this study are available by contacting the corresponding author.

Conflicts of Interest

The authors declare no conflicts of interest.

References

  1. Sun, H.; Saeedi, P.; Karuranga, S.; Pinkepank, M.; Ogurtsova, K.; Duncan, B.; Stein, C.; Basit, A.; Chan, J.; Mbanya, J.; et al. IDF Diabetes Atlas: Global, regional and country-level diabetes prevalence estimates for 2021 and projections for 2045. Diabetes Res. Clin. Pract. 2022, 183, 109119. [Google Scholar] [CrossRef]
  2. Lin, X.; Xu, Y.; Pan, X.; Xu, J.; Ding, Y.; Sun, X.; Song, X.; Ren, Y.; Shan, P.-F. Global, regional, and national burden and trend of diabetes in 195 countries and territories: An analysis from 1990 to 2025. Sci. Rep. 2020, 10, 14790. [Google Scholar] [CrossRef]
  3. Saeedi, P.; Salpea, P.; Karuranga, S.; Petersohn, I.; Malanda, B.; Gregg, E.; Unwin, N.; Wild, S.; Williams, R. Mortality attributable to diabetes in 20–79 years old adults, 2019 estimates: Results from the International Diabetes Federation Diabetes Atlas, 9th edition. Diabetes Res. Clin. Pract. 2020, 162, 108086. [Google Scholar] [CrossRef]
  4. Bailey, C.J.; Krentz, A.J. Oral Glucose-Lowering Agents. In Text book of Diabetes, 5th ed.; Holt, R.I.G., Cockram, C.S., Flyvbjerg, A., Goldstein, B.J., Eds.; John Wiley & Sons, Ltd.: Hoboken, NJ, USA, 2017; pp. 426–454. [Google Scholar] [CrossRef]
  5. Tarry-Adkins, J.L.; Grant, I.D.; Ozanne, S.E.; Reynolds, R.M.; Aiken, C.E. Efficacy and side effect profile of different formulations of metformin: A systematic review and meta-analysis. Diabetes Ther. 2021, 12, 1901–1914. [Google Scholar] [CrossRef]
  6. Morino, K.; Petersen, K.F.; Shulman, G.I. Molecular mechanisms of insulin resistance in humans and their potential links with mitochondrial dysfunction. Diabetes 2006, 55, S9–S15. [Google Scholar] [CrossRef]
  7. Chen, H.; Cong, L.N.; Li, Y.; Yao, Z.J.; Wu, L.; Zhang, Z.Y.; Burke, T.R., Jr.; Quon, M.J. A phosphotyrosyl mimetic peptide reverses impairment of insulin-stimulated translocation of GLUT4 caused by overexpression of PTP1B in rat adipose cells. Biochemistry 1999, 38, 384–389. [Google Scholar] [CrossRef]
  8. Ramachandran, C.; Kennedy, B.P. Protein tyrosine phosphatase 1B: A novel target for type 2 diabetes and obesity. Curr. Top. Med. Chem. 2003, 3, 749–757. [Google Scholar] [CrossRef]
  9. Tao, J.; Malbon, C.C.; Wang, H.Y. Insulin stimulates tyrosine phosphorylation and inactivation of protein-tyrosine phosphatase 1B in vivo. J. Biol. Chem. 2001, 276, 29520–29525. [Google Scholar] [CrossRef]
  10. Gu, F.; Nguyen, D.T.; Stuible, M.; Dube, N.; Tremblay, M.L.; Chevet, E. Protein-tyrosine phosphatase 1B potentiates IRE1 signaling during endoplasmic reticulum stress. J. Biol. Chem. 2004, 279, 49689–49693. [Google Scholar] [CrossRef]
  11. Xie, L.; Lee, S.Y.; Andersen, J.N.; Waters, S.; Shen, K.; Guo, X.L.; Moller, N.P.; Olefsky, J.M.; Lawrence, D.S.; Zhang, Z.Y. Cellular effects of small molecule PTP1B inhibitors on insulin signaling. Biochemistry 2003, 42, 12792–12804. [Google Scholar] [CrossRef]
  12. Rines, A.K.; Sharabi, K.; Tavares, C.D.; Puigserver, P. Targeting hepatic glucose metabolism in the treatment of type 2 diabetes. Nat. Rev. Drug Discov. 2016, 15, 786–804. [Google Scholar] [CrossRef] [PubMed]
  13. Chinsembu, K.C. Diabetes mellitus and nature’s pharmacy of putative antidiabetic plants. J. Herb. Med. 2019, 15, 100230. [Google Scholar] [CrossRef]
  14. Akdad, M.; Eddouks, M. Glucose uptake: A promising target of medicinal plants. In Antidiabetic Medicinal Plants; Elsevier: Amsterdam, The Netherlands, 2024; pp. 409–440. [Google Scholar]
  15. Tran, N.; Pham, B.; Le, L. Bioactive compounds in anti-diabetic plants: From herbal medicine to modern drug discovery. Biology 2020, 9, 252. [Google Scholar] [CrossRef]
  16. Jiang, C.-S.; Liang, L.-F.; Guo, Y.-W. Natural products possessing protein tyrosine phosphatase 1B (PTP1B) inhibitory activity found in the last decades. Acta Pharmacol. Sin. 2012, 33, 1217–1245. [Google Scholar] [CrossRef]
  17. Dao, T.T.; Tung, B.T.; Nguyen, P.H.; Thuong, P.T.; Yoo, S.S.; Kim, E.H.; Kim, S.K.; Oh, W.K. C-methylated flavonoids from Cleistocalyx operculatus and their inhibitory effects on novel influenza A (H1N1) neuraminidase. J. Nat. Prod. 2010, 73, 1636–1642. [Google Scholar] [CrossRef]
  18. Mai, T.T.; Chuyen, N.V. Anti-hyperglycemic activity of an aqueous extract from flower buds of Cleistocalyx operculatus (Roxb.) Merr and Perry. Biosci. Biotechnol. Biochem. 2007, 71, 69–76. [Google Scholar] [CrossRef] [PubMed]
  19. Min, B.S.; Cuong, T.D.; Lee, J.S.; Shin, B.S.; Woo, M.H.; Hung, T.M. Cholinesterase inhibitors from Cleistocalyx operculatus buds. Arch. Pharm. Res. 2010, 33, 1665–1670. [Google Scholar] [CrossRef] [PubMed]
  20. Min, B.S.; Thu, C.V.; Dat, N.T.; Dang, N.H.; Jang, H.S.; Hung, T.M. Antioxidative flavonoids from Cleistocalyx operculatus buds. Chem. Pharm. Bull. 2008, 56, 1725–1728. [Google Scholar] [CrossRef] [PubMed]
  21. Truong, T.M.; Ishiwaki, A.; Nomi, Y.; Le, T.H.; Nguyen, T.L.; Nguyen, T.P.T.; Vuong, T.H.N.; Yamaguchi, K.; Otsuka, Y. Efficacy of an aqueous extract from flower buds of Cleistocalyx operculatus on type 2 diabetic patients in Vietnam. J. Home Econ. Jpn. 2013, 64, 3–9. [Google Scholar] [CrossRef]
  22. Mai, V.-H.; Ponce-Zea, J.E.; Doan, T.-P.; Vu, Q.H.; Ryu, B.; Lee, C.-H.; Oh, W.-K. Chalcone-Monoterpene Derivatives from the Buds of Cleistocalyx operculatus and Their Potential as Protein Tyrosine Phosphatase 1B Inhibitors. J. Nat. Prod. 2024. online ahead of print. [Google Scholar] [CrossRef] [PubMed]
  23. Pham, G.N.; Nguyen, T.T.T.; Nguyen-Ngoc, H. Ethnopharmacology, phytochemistry, and pharmacology of Syzygium nervosum. Evid.-Based Complement. Altern. Med. 2020, 2020, 8263670. [Google Scholar] [CrossRef] [PubMed]
  24. Wang, C.; Wu, P.; Tian, S.; Xue, J.H.; Xu, L.X.; Li, H.X.; Wei, X.Y. Bioactive pentacyclic triterpenoids from the leaves of Cleistocalyx operculatus. J. Nat. Prod. 2016, 79, 2912–2923. [Google Scholar] [CrossRef]
  25. Su, J.C.; Wang, S.; Cheng, W.; Huang, X.J.; Li, M.M.; Jiang, R.W.; Li, Y.L.; Wang, L.; Ye, W.C.; Wang, Y. Phloroglucinol derivatives with unusual skeletons from Cleistocalyx operculatus and their in vitro antiviral activity. J. Org. Chem. 2018, 83, 8522–8532. [Google Scholar] [CrossRef]
  26. Yang, J.L.; Ha, T.K.Q.; Lee, B.W.; Kim, J.; Oh, W.K. PTP1B inhibitors from the seeds of Iris sanguinea and their insulin mimetic activities via AMPK and ACC phosphorylation. Bioorg. Med. Chem. Lett. 2017, 27, 5076–5081. [Google Scholar] [CrossRef]
  27. Wiesmann, C.; Barr, K.J.; Kung, J.; Zhu, J.; Erlanson, D.A.; Shen, W.; Fahr, B.J.; Zhong, M.; Taylor, L.; Randal, M.; et al. Allosteric inhibition of protein tyrosine phosphatase 1B. Nat. Struct. Mol. Biol. 2004, 11, 730–737. [Google Scholar] [CrossRef] [PubMed]
  28. Diller, D.; Merz, K. High throughput docking for library design and library prioritization. Proteins 2001, 43, 113–124. [Google Scholar] [CrossRef] [PubMed]
  29. Kaneta, Y.; Arai, M.A.; Ishikawa, N.; Toume, K.; Koyano, T.; Kowithayakorn, T.; Chiba, T.; Iwama, A.; Ishibashi, M. Identification of BMI1 promoter inhibitors from Beaumontia murtonii and Eugenia operculata. J. Nat. Prod. 2017, 80, 1853–1859. [Google Scholar] [CrossRef]
  30. Ghosh, S. Triterpenoids: Structural diversity, biosynthetic pathway, and bioactivity. Stud. Nat. Prod. Chem. 2020, 67, 411–461. [Google Scholar]
  31. Nishimura, K.; Fukuda, T.; Miyase, T.; Noguchi, H.; Chen, X.M. Activity-guided isolation of triterpenoid acyl CoA cholesteryl acyl transferase (ACAT) inhibitors from Ilex kudincha. J. Nat. Prod. 1999, 62, 1061–1064. [Google Scholar] [CrossRef]
  32. Kang, K.B.; Kim, J.W.; Oh, W.K.; Kim, J.; Sung, S.H. Cytotoxic ceanothane- and lupane-type triterpenoids from the roots of Ziziphus jujuba. J. Nat. Prod. 2016, 79, 2364–2375. [Google Scholar] [CrossRef]
  33. Siewert, B.; Wiemann, J.; Kowitsch, A.; Csuk, R. The chemical and biological potential of C ring modified triterpenoids. Eur. J. Med. Chem. 2014, 72, 84–101. [Google Scholar] [CrossRef]
  34. Srivedavyasasri, R.; Hayes, T.; Ross, S.A. Phytochemical and biological evaluation of Salvia apiana. Nat. Prod. Res. 2017, 31, 2058–2061. [Google Scholar] [CrossRef] [PubMed]
  35. Taniguchi, S.; Imayoshi, Y.; Kobayashi, E.; Takamatsu, Y.; Ito, H.; Hatano, T.; Sakagami, H.; Tokuda, H.; Nishino, H.; Sugita, D.; et al. Production of bioactive triterpenes by Eriobotrya japonica calli. Phytochemistry 2002, 59, 315–323. [Google Scholar] [CrossRef] [PubMed]
  36. Jin, Q.; Jin, H.G.; Kim, A.R.; Woo, E.R. A new megastigmane palmitate and a new oleanane triterpenoid from Aster yomena Makino. Helv. Chim. Acta 2012, 95, 1455–1460. [Google Scholar] [CrossRef]
  37. Li, E.N.; Zhou, G.D.; Kong, L.Y. Chemical constituents from the leaves of Eriobotrya japonica. Chin. J. Nat. Med. 2009, 7, 190–192. [Google Scholar] [CrossRef]
  38. Liao, C.R.; Kuo, Y.H.; Ho, Y.L.; Wang, C.Y.; Yang, C.S.; Lin, C.W.; Chang, Y.S. Studies on cytotoxic constituents from the leaves of Elaeagnus oldhamii Maxim. in non-small cell lung cancer A549 cells. Molecules 2014, 19, 9515–9534. [Google Scholar] [CrossRef]
  39. Lee, K.H.; Lin, Y.M.; Wu, T.S.; Zhang, D.C.; Yamagishi, T.; Hayashi, T.; Hall, I.H.; Chang, J.J.; Wu, R.Y.; Yang, T.H. The cytotoxic principles of Prunella vulgaris, Psychotria serpens, and Hyptis capitata: Ursolic acid and related derivatives. Planta Med. 1988, 54, 308–311. [Google Scholar] [CrossRef]
  40. Tiganis, T. PTP1B and TCPTP--nonredundant phosphatases in insulin signaling and glucose homeostasis. FEBS J. 2013, 280, 445–458. [Google Scholar] [CrossRef] [PubMed]
  41. Zhang, S.; Zhang, Z.Y. PTP1B as a drug target: Recent developments in PTP1B inhibitor discovery. Drug Discov. Today 2007, 12, 373–381. [Google Scholar] [CrossRef]
  42. Ha, M.T.; Lee, T.H.; Kim, C.S.; Prajapati, R.; Kim, J.A.; Choi, S.; Min, B.S. PTP1B and α-glucosidase inhibitory activities of the chemical constituents from Hedera rhombea fruits: Kinetic analysis and molecular docking simulation. Phytochemistry 2022, 197, 113100. [Google Scholar] [CrossRef]
  43. Jiang, W.; Tang, Y.; Tong, Y.P.; Zhao, Z.Y.; Jin, Z.X.; Li, J.; Zang, Y.; Xiong, J.; Hu, J.F. Structurally diverse mono-/dimeric triterpenoids from the vulnerable conifer Pseudotsuga gaussenii and their PTP1B inhibitory effects. The role of protecting species diversity in support of chemical diversity. Bioorg. Chem. 2022, 124, 105825. [Google Scholar] [CrossRef]
  44. Gamede, M.; Mabuza, L.; Ngubane, P.; Khathi, A. The effects of plant-derived oleanolic acid on selected parameters of glucose homeostasis in a diet-induced pre-diabetic rat model. Molecules 2018, 23, 794. [Google Scholar] [CrossRef]
  45. Zhang, Y.N.; Zhang, W.; Hong, D.; Shi, L.; Shen, Q.; Li, J.Y.; Li, J.; Hu, L.H. Oleanolic acid and its derivatives: New inhibitor of protein tyrosine phosphatase 1B with cellular activities. Bioorganic Med. Chem. 2008, 16, 8697–8705. [Google Scholar] [CrossRef]
  46. Castellano, J.M.; Guinda, A.; Delgado, T.; Rada, M.; Cayuela, J.A. Biochemical basis of the antidiabetic activity of oleanolic acid and related pentacyclic triterpenes. Diabetes 2013, 62, 1791–1799. [Google Scholar] [CrossRef]
  47. Oboh, M.; Govender, L.; Siwela, M.; Mkhwanazi, B.N. Anti-diabetic potential of plant-based pentacyclic triterpene derivatives: Progress made to improve efficacy and bioavailability. Molecules 2021, 26, 7243. [Google Scholar] [CrossRef]
  48. Perez-Jimenez, A.; Rufino-Palomares, E.E.; Fernandez-Gallego, N.; Ortuno-Costela, M.C.; Reyes-Zurita, F.J.; Peragon, J.; Garcia-Salguero, L.; Mokhtari, K.; Medina, P.P.; Lupianez, J.A. Target molecules in 3T3-L1 adipocytes differentiation are regulated by maslinic acid, a natural triterpene from Olea europaea. Phytomedicine 2016, 23, 1301–1311. [Google Scholar] [CrossRef]
  49. Minh, T.T.L.; Kieu, L.T.B.; Mai, S.T.T.; Ngoc, D.L.B.; Thuy, L.B.; Quyen, N.T.; Anh, T.T.; Huy, L.; Phong, N.V.; Duyen, C.T.M.; et al. Addition of Mentha arvensis in infusions of Cleistocalyx operculatus improves the hedonic score and retains the high antioxidant and anti lipid-peroxidation effects. Appl. Sci. 2023, 13, 2873. [Google Scholar] [CrossRef]
  50. Suzuki, T.; Hiroki, A.; Watanabe, T.; Yamashita, T.; Takei, I.; Umezawa, K. Potentiation of insulin-related signal transduction by a novel protein-tyrosine phosphatase inhibitor, Et-3,4-dephostatin, on cultured 3T3-L1 adipocytes. J. Biol. Chem. 2001, 276, 27511–27518. [Google Scholar] [CrossRef]
  51. Xie, X.; Gong, Z.; Mansuy-Aubert, V.; Zhou, Q.L.; Tatulian, S.A.; Sehrt, D.; Gnad, F.; Brill, L.M.; Motamedchaboki, K.; Chen, Y.; et al. C2 domain-containing phosphoprotein CDP138 regulates GLUT4 insertion into the plasma membrane. Cell Metab. 2011, 14, 378–389. [Google Scholar] [CrossRef]
  52. Ishiki, M.; Klip, A. Minireview: Recent developments in the regulation of glucose transporter-4 traffic: New signals, locations, and partners. Endocrinology 2005, 146, 5071–5078. [Google Scholar] [CrossRef] [PubMed]
  53. Abel, E.D.; Peroni, O.; Kim, J.K.; Kim, Y.B.; Boss, O.; Hadro, E.; Minnemann, T.; Shulman, G.I.; Kahn, B.B. Adipose-selective targeting of the GLUT4 gene impairs insulin action in muscle and liver. Nature 2001, 409, 729–733. [Google Scholar] [CrossRef]
  54. Funaki, M.; Randhawa, P.; Janmey, P.A. Separation of insulin signaling into distinct GLUT4 translocation and activation steps. Mol. Cell. Biol. 2004, 24, 7567–7577. [Google Scholar] [CrossRef]
  55. Kampmann, U.; Christensen, B.; Nielsen, T.S.; Pedersen, S.B.; Orskov, L.; Lund, S.; Moller, N.; Jessen, N. GLUT4 and UBC9 protein expression is reduced in muscle from type 2 diabetic patients with severe insulin resistance. PLoS ONE 2011, 6, e27854. [Google Scholar] [CrossRef]
Figure 1. Chemical structures of isolated compounds 117 from the leaves of C. operculatus.
Nutrients 16 02839 g001
Figure 2. Key HMBC correlations (red) and NOESY correlations (blue) of 13.
Nutrients 16 02839 g002
Figure 3. Lineweaver–Burk plots for the inhibition of PTP1B enzyme by 6, 9, 13, and 17; (a), (b), (c), and (d), respectively. Dixon plots for 6, 9, 13, and 17; (e), (f), (g), and (h), respectively.
Nutrients 16 02839 g003
Figure 4. Molecular docking models for PTP1B (PDB:14T9) inhibition at allosteric site for compounds 6 ((a), 96.83 Libdock score), 9 ((b), 81.57 Libdock score), 13 ((c), 81.57 Libdock score), and 17 ((d), 104.44, 106.92 Libdock score). Only hydrogens involved in interactions are shown in the 2D diagram.
Nutrients 16 02839 g004aNutrients 16 02839 g004b
Figure 5. Stimulation effects of compounds 117 on glucose uptake in 3T3-L1 adipocytes using a fluorescent analogue of glucose, 2-NBDG. (a) 3T3-L1 adipocytes were incubated with insulin (100 nM) and compounds 117 (20 μM) for 1 h. The results are presented as the means ± S.D. (n = 3); each experiment was performed in triplicate; * p < 0.05, and *** p < 0.001, compared to the negative control. (b) Concentration−response relationships of the effects of compounds 6, 13, and 17 on glucose uptake in 3T3-L1 adipocytes. The cells were treated with these compounds at 5, 10, and 20 μM or 100 nM insulin concentrations. After 1 h of incubation, fluorescence intensities were measured using fluorescence microscopy.
Nutrients 16 02839 g005
Table 1. 1H (600 MHz) and 13C NMR (150 MHz) spectroscopic data for compounds 13.
Position123
δH (J in Hz)δCδH (J in Hz)δCδH (J in Hz)δC
11.73 d (13.1)
0.99 m
39.81.75 m
1.08 m
39.62.62 dd (12.7, 5.0)
1.72 m
48.2
21.86 m
1.80 m
28.81.92 m
1.86 m
28.34.13 m73.7
33.27 dd, (11.3, 4.7)78.34.05 dd (11.3, 4.0)74.04.38 d (8.8)79.9
4 39.9 43.3 151.9
50.88 m56.51.54 m49.65.04 br d (12.2)50.4
61.62 m
1.42 m
19.31.68 m
1.45 m
19.21.64 m
1.50 m
21.1
73.01 m
1.93 m
38.82.15 m
1.87 m
38.61.28 m
1.06 m
30.5
8 41.3 41.3 42.3
91.93 m52.22.03 m52.21.90 br s50.1
10 38.3 38.2 38.7
111.57 m
1.31 m
21.71.60 m
1.35 m
21.73.32 dd (3.1, 2.4)55.3
122.79 m
1.89 m
28.12.70 m
2.01 m
27.43.07 d (3.7)56.8
132.79 m40.72.71 m40.7 89.7
14 60.3 60.4 42.2
152.50 d (13.4)
1.57 m
29.12.47 d (13.4)
1.56 m
29.01.73 m
1.03 m
27.5
162.68 m
1.93 m
35.32.65 m
1.88 m
35.42.31 m
1.42 m
23.5
17 57.3 57.3 45.7
182.33 t (11.1)53.02.13 m52.91.88 m61.6
193.53 td
(11.3, 4.7)
44.23.51 td
(10.9, 4.2)
48.22.71 m36.6
20 156.5 151.2 152.4
212.20 m
1.63 m
33.02.03 m
1.46 m
31.32.23 m
2.29 m
32.4
222.01 m
1.57 m
37.52.02 m
1.45 m
37.71.96 dt (12.9, 3.1)
1.62 m
33.8
231.08 s29.04.10 d (10.3)
3.59 d (10.3)
68.55.89 br s
4.99 br s
105.7
241.01 s17.01.06 s13.5
250.91 s17.50.99 s17.80.91 s16.3
261.18 s17.91.20 s17.91.17 s20.7
27 178.8 178.81.18 s16.7
28 177.3 177.4 178.6
295.61 br s
5.38 br s
107.35.04 br s
4.81 br s
111.01.45 d (6.3)16.9
304.73 d (15.0)
4.56 d (15.0)
64.71.89 s19.74.87 br s
4.81 br s
108.7
OCH33.77 s51.93.77 s52.0
Table 2. Inhibitory activity of isolated compounds against PTP1B enzyme a.
CompoundsIC50 (μM)Inhibition Type bKi (μM) c
1>20--
2>20--
3>20--
48.7 ± 0.6--
52.2 ± 0.1--
64.1 ± 0.2Non-competitive2.8 ± 0.4
7>20--
8>20--
94.4 ± 0.5Non-competitive7.6 ± 1.2
1012.2 ± 0.3--
1114.1 ± 0.3--
121.7 ± 0.8--
131.28 ± 0.1Non-competitive3.2 ± 0.6
143.6 ± 0.2--
156.6 ± 0.6--
163.6 ± 0.4--
172.6 ± 0.3Non-competitive2.7 ± 0.4
Ursolic acid d2.9 ± 0.2 µM--
(-) No test. a The values (μM) indicate 50% PTP1B inhibitory effects. These data are expressed as the mean ± S.E.M. of triplicate experiments. b Determined by Lineweaver–Burk plots. c Determined by Dixon plot interpretation. d Positive control.
Table 3. Interacting residues and docking scores of 6, 9, 13, and 17 in PTP1B obtained using Libdock Protocol in Discovery Studio.
Libdock ScoreHydrogen BondHydrophobicOther Interactions
π-π Stackedπ-σπ-Alkylπ Anion/Cationπ-Sulfur
696.83Ala189
Glu200
Phe280Lys197
Leu192
Phe196
981.57Asn193
Lys197
Glu276
Ala189
Phe280
13104.44Lys197 Phe 280Ala189
Leu192
17106.92Lys197
Lys279
Phe280Ala189
Leu192
Docking control
(PDB:1T4J ligand)
148.67Asn193
Lys197
Phe280
Phe280 Ala189 Leu192 Phe196Phe280Met182
Disclaimer/Publisher’s Note: The statements, opinions and data contained in all publications are solely those of the individual author(s) and contributor(s) and not of MDPI and/or the editor(s). MDPI and/or the editor(s) disclaim responsibility for any injury to people or property resulting from any ideas, methods, instructions or products referred to in the content.

