Abstract
Background: Edible plants have been linked to the mitigation of metabolic disturbances in liver and adipose tissue, including the decrease of lipogenesis and the enhancement of lipolysis and adipocyte browning. In this context, plant microRNAs could be key bioactive molecules underlying the cross-kingdom beneficial effects of plants. This study sought to explore the impact of plant-derived microRNAs on the modulation of adipocyte and hepatocyte genes involved in metabolism and thermogenesis. Methods: Plant miR6262 was selected as a candidate from miRBase for the predicted effect on the regulation of human metabolic genes. Functional validation was conducted after transfection with plant miRNA mimics in HepG2 hepatocytes exposed to free fatty acids to mimic liver steatosis and hMADs cells differentiated into brown-like adipocytes. Results: miR6262 decreases the expression of the predicted target RXRA in the fatty acids-treated hepatocytes and in brown-like adipocytes and affects the expression profile of critical genes involved in metabolism and thermogenesis, including PPARA, G6PC, SREBF1 (hepatocytes) and CIDEA, CPT1M and PLIN1 (adipocytes). Nevertheless, plant miR6262 mimic transfections did not decrease hepatocyte lipid accumulation or stimulate adipocyte browning. Conclusions: these findings suggest that plant miR6262 could have a cross-kingdom regulation relevance through the modulation of human genes involved in lipid and glucose metabolism and thermogenesis in adipocytes and hepatocytes.
Keywords:
adipose tissue; browning; cross-kingdom regulation; diet; fatty liver; metabolism; NAFLD; plant microRNA; RXRA; steatosis 1. Introduction
Plant-based diets could contribute to energy homeostasis and exert beneficial properties towards the counteraction of white adipocyte tissue (WAT) and liver dysfunction, and brown adipose tissue (BAT) stimulation, emerging as a promising therapeutic approach to mitigate metabolic disturbances during metabolic disorders like non-alcoholic fatty liver disease (NAFLD), diabetes, and obesity [1,2,3,4]. A broad spectrum of foods from plants (including coffee, fruits, grains, herbal plants, legumes, olive oil, species, tea, and vegetables) have demonstrated therapeutic potential against liver homeostasis dysregulation, steatosis, and NAFLD development by decreasing lipid accumulation, inflammation, oxidative stress and apoptosis, and by modulating gut microbiota [2,5,6]. Additionally, plant-derived foods along with their bioactive components could alleviate adipose tissue dysfunction and promote browning [4,7,8]. These effects could be mediated through the inhibition of adipogenesis, lipid accumulation, cell proliferation, and pro-inflammatory adipokine release, as well as the promotion of mitochondrial biogenesis and activity, and thermogenesis [4,7,8].
The term plant-based diet encompasses any dietary pattern based on the consumption of plant foods while minimizing animal-based products [9]. Healthful plant-based diets consist of unprocessed plant products, such as vegetables, fruits, legumes, whole grains, nuts, and vegetable oils, minimizing or excluding processed foods and animal products [9]. Voluntary adherence to plant-based diets can be traced back to Egypt’s ancient civilizations, India, and Greece. Recognized figures such as Pythagoras, Gandhi, Albert Einstein, and Leonardo Da Vinci, popularized plant-based diets [10,11,12]. Throughout history, the promotion of ethical principles advocating non-violence towards animals fueled the switch from meat to plant-based products [10,11]. In recent years, interest in plant-based diets has continued to rise, driven not only by animal well-being concerns or spiritual beliefs but also by a broad range of factors, including human environmental footprint reduction and health improvement [11,12]. In this context, the expansion of scientific knowledge has played a key role in the widespread adoption of plant-based diets, as evidence has revealed an association between plant-based nutrition and reduced risk of several diseases such as diabetes, obesity, cardiovascular diseases, and cancer [10,12,13].The examination of plant-based diets effects on human health is an area of active research. Specifically, the discovery of plant-derived bioactive compounds and the elucidation of their mechanism of action is crucial to determining the therapeutic potential of plants in the alleviation of metabolic disturbances [14]. The benefits of plant consumption in the prevention and management of liver dysfunction and NAFLD have been largely linked to bioactive molecules such as terpenoids, polyphenols, polysaccharides, phytosterols, carotenoids, and omega-3 fatty acids [2,5,6]. The effects of plants on counteracting adipose tissue dysfunction and activating brown BAT could be mediated by bioactive compounds such as polyphenols, carotenoids, triterpenoids, and micronutrients [4,7,8,15]. Remarkably, it has been recently pointed out that microRNAs (miRNAs) may emerge as a new group of plant bioactive compounds with pivotal biological roles in animals [16,17].
Edible plant-based foods contain a wide variety of miRNAs that can withstand cooking procedures [18,19]. MiRNAs are short RNA species that do not encode proteins but are essential for the control of gene expression post-transcriptionally [20,21]. MiRNAs are pivotal within the plant kingdom, participating in a plethora of vital functions, including metabolism [22], stress responses [23], and growth [24]. A major area of interest is the significant involvement of plant miRNAs. Of particular interest is the role of plant miRNAs in cross-kingdom communication, since they can interact with mammalian genes to modulate processes such as cell death and proliferation [25,26,27], immune system responses, viral infections [28,29,30,31,32,33], and metabolism [34,35,36,37,38,39]. Although the bioavailability of plant miRNAs in animals is still a topic of debate due to contradictory findings [18,40,41], extensive evidence has highlighted their therapeutic potential against several diseases, including cancer, pulmonary fibrosis, viral infections such as COVID-19 and influenza, and metabolic disorders [29,30,36,38,42,43]. Therefore, miRNAs from diet might be an underlying factor in diet-induced epigenetic changes that influence the expression of genes involved in maintaining host homeostasis.
Despite the recognized therapeutic potential of plant-based diets in preventing and/or alleviating metabolic disturbances (such as restoring hepatocyte and adipocyte metabolism, inhibiting liver steatosis, and activating BAT [4,6,44]), it remains unclear whether plant miRNAs could contribute to these beneficial effects by interacting with metabolic genes in human hepatocytes and adipocytes. Unravelling the specific mechanism underlying the cross-kingdom activities of miRNAs derived from plants would be key to elucidating their potential therapeutic efficacy against human diseases. Thus, the focus of this study was to investigate the impact of plant miRNAs on the modulation of metabolic and thermogenic-related genes in an in vitro model of liver steatosis and in brown-like adipocytes.
2. Materials and Methods
2.1. In Silico Identification of Potential Interactions between Plant miRNAs and Human Genes
Bioinformatic identification of candidate human target genes of plant miRNAs was carried out as previously detailed [39]. Briefly, Prunus persica miRNA sequences from miRBase (https://www.mirbase.org/; accessed on 12 April 2022) were selected to predict human targets using psRNATarget (https://www.zhaolab.org/psRNATarget/; accessed on 13 April 2022) [45] and TAPIR (http://bioinformatics.psb.ugent.be/webtools/tapir/; accessed on 13 April 2022), with default parameters applied [46]. Gene ontology (GO) enrichment analyses of predicted human targets were performed using GeneCodis (https://GeneCodis.genyo.es/; accessed on 15 April 2022) [47]. Additionally, a bibliographic review was performed in PubMed database (https://pubmed.ncbi.nlm.nih.gov/; accessed on 15–28 April 2022), focusing exclusively on the predicted target genes that were consistently identified across the three abovementioned prediction algorithms. For subsequent in vitro studies, only miRNAs with predicted targets linked to liver/adipose tissue metabolism, adipocyte browning, and/or NAFLD were chosen.
2.2. Cell Culture and Transfections with Plan miRNA Mimics
The establishment of the human multipotent adipose-derived stem cells hMADS has been previously described [48,49]. hMADS cells were cultured in a 37 °C incubator with 5% CO2, using DMEM low glucose (1 g/L) L-GlutaMAX (Gibco. Thermo Fisher Scientific Inc., Waltham, MA, USA), 10% fetal bovine serum (FBS; Eurobio, Les Ulis, France), 1% penicillin-streptomycin solution (P/S; Gibco. Thermo Fisher Scientific Inc.) and 15 mM HEPES (4-(2-hydroxyethyl)-1-piperazineethanesulfonic acid; Gibco. Thermo Fisher Scientific Inc.). In addition, human fibroblast growth factor 2 (hFGF2; Peprotech. Thermo Fisher Scientific Inc.), which is a key mitogenic factor to promote hMADS proliferation [50], was freshly added at 2.5 ng/mL to the medium before each use.
For the experiments, undifferentiated hMADS cells were plated at a density of 25,000 cells per well in 12 well-plates for gene expression assays and in 6 well-plates (50,000 cells/well) for western blot and mitochondrial DNA quantification assays, in DMEM low glucose (1 g/L) L-GlutaMAX supplemented with 10% FBS, 1% P/S, 15 mM HEPES and 2.5 ng/mL hFGF2 freshly added prior each use. Once cells reached confluence (defined as day −2 of differentiation), hFGF2 was removed to arrest cell cycle. After 2-day post-confluence, cells underwent differentiation into adipocytes for 18 days and were maintained using DMEM low glucose (1 g/L) L-GlutaMAX mixed 1:1 with Ham’s F12 with L-glutamine (Gibco. Thermo Fisher Scientific Inc.) and supplemented with 15 mM HEPES, 1% P/S, 10 nM insulin (Invitrogen. Thermo Fisher Scientific Inc.), 10 µg/mL transferrin (Tf; Sigma-Aldrich, San Luis, MO, USA) and 0.2 nM triiodothyronine (T3; Sigma-Aldrich). From day 0 to day 4 of differentiation, cells were also exposed to 1 µM dexamethasone (Dex; Sigma-Aldrich) and 500 µM isobutyl-methylxanthine (IBMX; Sigma-Aldrich). The PPARγ agonist rosiglitazone (Rosi; Cayman Chemical Company, Ann Arbor, MI, USA) was incorporated at 100 nM from day 2 to 9 to promote white adipocyte differentiation [51,52]. Additionally, the browning process was induced by treating cells with 100 nM Rosi between days 14 and 18, thus stimulating the conversion of white adipocytes into thermogenic brite adipocytes [51,52]. Media was changed every other day and insulin, Tf, T3, Dex, IBMX and Rosi were added immediately before each use.
Transfections of hMADS cells were performed between day 10–12 of differentiation using Lipofectamine RNAiMAX Reagent and 25 nM of mirVana™ miRNA mimics (Thermo Fisher Scientific Inc.), including a scramble sequence as negative control (mirVana™ miRNA Mimic, Negative Control #1) and miR6262 (5′-UCUUUAGAAAGUUAGAAUUGU-3′; assay ID MC29621). Cell medium was changed to DMEM low glucose (1g/l) L-GlutaMAX/Ham’s F12 with L-glutamine supplemented with 15 mM HEPES, 1% P/S, 10 nM insulin, 10 µg/mL Tf and 0.2 nM T3 (900 µL/well in 6 well/plates, 450 µL/well in 12 well/plates). In Opti-MEM I Reduced Serum Medium (Gibco. Thermo Fisher Scientific Inc.), lipofectamine and miRNA mimics were diluted in a 1:1 ratio and incubated at room temperature (RT) for 10 min. The resulting lipofectamine-miRNA mimic complexes were then added to the wells at 300 µL per well for 6-well plates and 150 µL per well of 12-well plates. Of note, lipofectamine volumes were the following: 9 µL per well for 6-well plates (in a volume of 1200 µL) and 4.5 µL per well for 12-well plates (in a volume of 600 µL). Cells medium was changed after 24 h of transfections and cells continued the differentiation process until day 18 for gene expression, Western Blot, and mitochondrial DNA quantification assays.
Cell culture, miRNA mimic transfection and lipid accumulation induction in the human hepatoma HepG2 cell line (American Type Culture Collection, ATCC® HB-8065™; Manassas, VA, USA) were conducted as previously detailed [39]. HepG2 cells were transfected using the reverse method with 50 nM of the same mirVana™ miRNA mimics (Thermo Fisher Scientific Inc.) used for hMADS transfections.
2.3. RNA Purification and Gene Expression Assays
mRNA expression was evaluated in hMADS differentiated into white and brite adipocytes that were transfected at day 10–12 of differentiation and collected at day 18. Cells were detached mechanically with a scraper in TRI-Reagent (Molecular Research Center Inc., Cincinnati, OH, USA) and RNA isolation was performed according to the manufacturer’s instructions. The purity (260/280 ratio) and concentration of RNA were assessed using a NanoDrop 2000 (Thermo Fisher Scientific Inc.). In addition, quality control of RNA was tested by agarose gel electrophoresis analysis: RNA was stained with GelRed Nucleic Acid Gel Stain (Biotium Inc., Fremont, CA, USA) diluted in BlueJuice Gel Loading Buffer (Invitrogen. Thermo Fisher Scientific Inc.), electrophoresis was performed in 1% agarose gel immersed in 0.5 X Tris-acetate-EDTA (TAE) using a Mupid-exU system (Takara; Tokyo, Japan) at 100 V for 30 min, and visualised in a Gene Flash UV imager (Syngene Bio imaging, Cambridge, UK).
Reverse-transcription of hMADS RNA was conducted according to the manufacturer’s guidelines as follows: RNA (1 µg) was mixed with RQ1 RNase-Free DNAse (Promega, Madison, WI, USA), RNAsin (Promega) and Reaction Buffer from M-MLV-RT kit (Promega), was incubated for 15 min at 37 °C, 5 min at 75 °C, and 3 min at 4 °C. Samples were incubated with Primer “random” (Roche, Basel, Switzerland) for 5 min at 70 °C. dNTP Mix (Set of dATP, dCTP, dGTP, dTTP; Promega), M-MLV-RT and Reaction Buffer from M-MLV-RT kit (Promega) were added to the samples and incubated for 60 min at 37 °C. The reactions were carried out in a Bioer GeneExplorer Thermal Cycler (Bioer Technology, Hangzhou, China). Quantitative PCR (qPCR) was performed with hMADS cDNA diluted 1/5, ONEGreen FAST qPCR Premix (Ozyme, Saint-Cyr-l’École, France) and Integrated DNA Technologies predesigned assays (IDT; Coralville, IA, USA) (Table 1), and oligonucleotide sequences generated with Primer Express Software (Perkin Elmer and Analytical Sciences, Boston, MA, USA; http://www.perkinelmer.com) (Table 2). Reactions were performed on a StepOnePlus Real-Time PCR System (Applied Biosystems. Thermo Fisher Scientific Inc.), applying the following cycling conditions: 95 °C for 30 s; 40 cycles at 95 °C for 5 s and 60 °C for 34 s; a melt curve stage of 95 °C for 15 s, 60 °C 1 min, 95 °C 15 s. Normalization of gene expression levels (∆Cq) was performed using as housekeeping control the gene expression of 36B4 (also termed as Ribosomal Protein Lateral Stalk Subunit P0, RPLP0) [53]. Relative gene expression was determined by stabilizing comparisons with the scramble-sequence-transfected cells differentiated to brite adipocytes (brite negative control) using the 2−∆∆Cq method [54,55].

Table 1.
Predesigned qPCR from Taqman (Thermo Fisher Scientific Inc.) (1) and Integrated DNA Technologies (2) primers used for gene expression analyses.
Table 2.
Primers designed for qPCR mRNA gene expression analysis.
The procedures for RNA purification and gene expression evaluation in HepG2 cells were carried out according to previously described methods [39]. Additionally, transfection efficiency was evaluated in HepG2 cells using the miRCURY LNA miRNA PCR Assay (Qiagen, Hilden, Germany) miR6262 (5′-UCUUUAGAAAGUUAGAAUUGU-3′; GeneGlobe ID: YP02112521) as previously detailed [39].
2.4. Cytotoxicity Assays and Intracellular Triglyceride Quantification in HepG2 Cells
Cell viability and intracellular triglyceride quantification were evaluated in HepG2 transfected for two days, both untreated and treated with free fatty acids (FFA) for 3 h as previously described [39].
2.5. Western Blot and Mitochondrial DNA Quantification Analysis in hMADS Cells
Protein expression of the key marker of the browning process UCP-1 [52], was evaluated in hMDAS cells differentiated into white and brite adipocytes that were transfected at 10–12 of differentiation and collected at day 18. Protein extraction and quantification were conducted as indicated: cells were first washed with PBS at 4 °C, detached mechanically with a scraper in protein lysis buffer, and sonicated 3 times (5–10 sec each) at 4 °C using a Sonifier ultrasonic homogenizer (Branson, Brookfield, CT, USA). Lysis buffer consisted of 25 mM Tris-Cl (pH 7.4), 100 mM NaCl, 1 mM EDTA, 0.5% Triton X-100, 0.5% Nonidet P40, 1X protease inhibitor cocktail (Roche Life Sciences, Indianapolis, IN, USA). Samples were subjected to centrifugation at 14,000× g for 10 min at 4 °C and supernatant was collected. Protein concentration was measured using the Pierce BCA Protein Assay kit (Thermo Fisher Scientific Inc.), with absorbance recorded at 560 nm in an iMark™ Microplate Absorbance Reader (Bio-Rad, Hercules, CA, USA). Immediately before electrophoresis, protein samples were diluted at a final concentration of 40 µg per sample in lysis buffer with 1% loading buffer Laemmli (250 mM Tris-HCl pH 6.8, 8% Sodium dodecyl-sulphate, 10% glycerol, 0.01% bromophenol blue) and 0.1 M DTT (dithiothreitol; Thermo Fisher Scientific Inc.) and heated at 95 °C for 5 min. Sodium dodecyl-sulphate polyacrylamide gel electrophoresis (SDS-PAGE) was conducted with 40 µg of protein per sample using gradients gels (11%), in a power supply Hoefer EPS 2A200 (Hoefer Inc., Holliston, MA, USA) at 70 V for 30 min and 120 V for 2 h. Proteins were transferred from gels into polyvinylidene fluoride (PVDF) membranes using a liquid transfer system Mini Trans-Blot® Cell (Bio-Rad) at 110 V, 200 mA for 1.5 h at 4 °C. Membranes were blocked with 5% skimmed milk in 1X tris Buffered Saline with 0.05% tween (TBST) at RT for 1 h and washed with TBST. Membranes were subsequently incubated at 4 °C overnight (ON) with primary antibodies from rabbit: anti-UCP1 (#Ab10983, Abcam, Waltham, MA, USA) and anti-TBP (anti-TATA-box binding protein; #44059, Cell Signaling Technology, Danvers, MA, USA) diluted 1:1000. Membranes were washed with TBST and Horseradish peroxidase (HRP)-conjugated anti-rabbit antibody (Promega) diluted 1:10000 was incubated at RT for 1 h to detect primary antibodies. After washing membranes with TBST, HRP-signal detection was revealed with Clarity Western enhanced chemiluminescence (ECL) Substrate (Bio-Rad) in a luminescent imager analyzer (Amersham Imager 600; GE Healthcare, Chicago, IL, USA). Signal intensity of the protein bands was quantified with ImageJ software (Version 1.52a). UCP-1 signal intensity was normalized to that of TBP protein and results were expressed as the % relative protein concentration by establishing comparison with brite negative control.
White and brite adipocyte hMDAS cells (transfected at 10–12 of differentiation and collected at day 18) were used to evaluate the impact of plant miR6262 on mitochondriogenesis, which is associated with the browning process [56,57]. Since mitochondria biogenesis is characterized by DNA mitochondrial content increase, the levels of the mitochondrial gene NADH dehydrogenase Subunit 1 (NADHdS1) were quantified by qPCR and normalized with those of the nuclear gene Lipoprotein Lipase (LPL) [57,58]. DNA was isolated with PureLink Genomic DNA Mini Kit (Invitrogen. Thermo Fisher Scientific Inc.) following the manufacturer’s protocol, and quantity and quality of DNA was tested in a NanoDrop 2000 (Thermo Fisher Scientific Inc.). qPCR was performed with 2 ng DNA, ONEGreen FAST qPCR Premix (Ozyme) and assays designed with Primer Express Software (Perkin Elmer and Analytical Sciences) to measure NADHdS1 and LPL gene expression levels (Table 3). qPCR reactions were conducted in a StepOnePlus Real-Time PCR System (Applied Biosystems. Thermo Fisher Scientific Inc.): 95 °C 5 min; 40 cycles at 95 °C 10 s and 60 °C 20 s; a melt curve stage of 95 °C 15 s, 60 °C 1 min, 95 °C 15 s. NADHdS1 expression levels were normalized to that of LPL and relative gene expression was determined with the 2−∆∆Cq method by stabilizing comparison with brite negative control [54,55].
Table 3.
Primers designed for qPCR mitochondrial DNA quantification.
2.6. Statistical Analysis
GraphPad Prism 6.0 for Windows (GraphPad Software Inc., La Jolla, CA, USA) was used for statistical analysis. The two-tailed Student’s t-test was applied to compare the experimental group (plant miR6262 transfected cells) with the negative control (scramble- sequence-transfected cells). Statistical significance was determined at a p-value < 0.05.
3. Results
3.1. Selection of Plant miRNAs with Putative Human Target Genes Related to Metabolism
The selection of plant miRNAs that could potentially target metabolic human genes were conducted applying the following criteria: (1) A reference genome was chosen for the in-silico analyses, which is a common strategy for plant miRNA identification due to their widespread conservation across different plant species [59,60]. In particular, Prunus persica was chosen for plant miRNA selection because of the following points: its high-quality genome assembly and characterization; its comprehensively well-annotated miRNA profile; and its status as a globally consumed edible fruit (https://mirbase.org/results/?query=prunus+persica) (https://plants.ensembl.org/Prunus_persica/Info/Index) (accessed on 12 April 2022) [61]. Thus, a dataset of 214 different miRNA sequences from Prunus persica were retrieved from miRBase. (2) Prediction of potential human targets for plant miRNAs was conducted using the prediction tools TAPIR and psRNATarget. The criteria for selecting miRNA-mRNA pairs for further analysis required choosing only miRNA sequences that showed consistent target prediction across both TAPIR and psRNATarget (V1 and V2 scoring schemas) to enhance prediction accuracy [62]. This selection resulted in 163 miRNA-mRNA pairs, which included 91 distinct miRNAs, and 112 different transcripts derived from 100 distinct genes. (3) Lastly, the criteria for selecting candidate miRNA-mRNA pairs for in vitro studies involved identifying genes from the set of 100 that were associated with liver/adipocyte metabolism, NAFLD and/or adipocyte browning, conducing GO analysis and a literature review. As a result of the bioinformatic analysis, miR6262 (from Prunus persica), which had RXRA (Retinoid X Receptor Alpha) as a potential target gene, was selected for subsequent in vitro studies since it displayed all the selection criteria: (1) its putative targets were predicted by psRNATarget (scoring schemas V1 and V2) and TAPIR, and (2) its potential target was involved in metabolism.
Upon detailed examination of the bioinformatic results for miR6262, miRNA-human target gene predictions revealed 16 (psRNATarget scoring schema V1), 24 (psRNATarget scoring schema V2), and 7 (TAPIR) predicted targets of plant miR6262 (Table 4). Overall, 25 different transcripts (24 different genes) were identified as putative targets of plant miR6262. Then, GO analysis to search enriched pathways was conducted with the 24 predicted target genes (OSBPL8, PAN3, ATP6V1C1, RXRA, GPR137B, PRDM15, EPT1, CLEC12B, NCOA7, ATG12, PPARGC1B, GPR4, CNEP1R1, PALM2-AKAP2, ZNF8, ST8SIA1, BBS10, RAP2C, GOLT1B, IL6R, WNT5A, ABCB10, GLRA3, AK4), all of which were reported as annotated inputs by GeneCodis4. A wide range of enrichment pathways were identified, including regulation of vascular permeability (GPR4), hepatic immune response (IL6R), and negative regulation of cellular response to oxidative stress (NCOA7) (Table S1). Nevertheless, only six transcripts were common targets to all prediction algorithms used, which correspond to the genes OSBPL8 (Oxysterol Binding Protein Like 8; transcript NM_020841), ATP6V1C1 (ATPase H+ Transporting V1 Subunit C1; transcript NM_001695), RXRA (transcript NM_002957), GPR137B (G Protein-Coupled Receptor 137B; transcript NM_003272), CLEC12B (C-Type Lectin Domain Family 12 Member B; transcript NM_205852), and PALM2-AKAP2 (PALM2 And AKAP2 Fusion; transcript NM_007203) (Table 4, Figure S1). Thus, to choose the most robust miRNA-mRNA interaction predictions, these were the only putative target genes of miR6262 used for bibliographic research to identify functions related to metabolism. Notably, RXR receptors play a crucial role in hepatic lipid metabolism regulation, adipogenesis, and adipocyte lipogenesis, and their inhibition has been linked to a reduced risk of diet-induced obesity and related comorbidities such as diabetes [63,64,65,66]. Thus, miR6262 and its predicted target RXRA were selected as candidates for in vitro validation. We addressed the potential inhibitory effect of miR6262 on RXRA gene expression and evaluated the impact of miR6262 on key metabolic genes in hepatocytes (HepG2) untreated and exposed to free fatty acids (FFA) to mimic hepatic steatosis, and in brite adipocytes (hMADS cells).
Table 4.
Predicted human target transcripts of plant miR6262 identified with the psRNATarget (scoring schemas V1 and V2) and TAPIR bioinformatic tools.
3.2. Plant miR6262 Was Detected in Transfected Hepatocytes and Did Not Induce Cytotoxicity Effects
The efficiency of the transfection procedure was determined 6 h after transfection of HepG2 cells with 50 nM of plant miR6262 mimic and the negative control (Figure S2). Positive expression of plant miR6262 mimic were reported (Cq values between 20–23), confirming the efficiency of the transfections. Negative expression of plant miR6262 was reported in control cells, suggesting the absence of a homologous human sequence of plant miR6262 in human hepatocytes.
Cytotoxicity assays were conducted 48 h after transfection of HepG2 with plant miR6262 mimic and the negative control, untreated and treated with FFA (3 h) (Figure S3). Transfection with plant miR6262 did not induce cytotoxic effects in untreated (Figure S3a) and FFA-treated (Figure S3b) hepatocytes since no decrease in cellular viability was reported.
3.3. Plant miR6262 Regulated the Expression of the Predicted Target RXRA and Metabolic-Related Genes in Hepatocytes
The impact of plant miR6262 on the expression of the predicted target RXRA, as well as transcription factors (PPARA, FOXO1, SREBF1) and functional protein-coding genes (MAPKAPK2, QKI, FASN, ACOX1, G6PC, GSK3B) involved in lipid and glucose metabolism, was evaluated after 48 h of transfection in HepG2 untreated and treated with FFA for 3 h. The effect of plant miR6262 on the mRNA expression of the putative target (RXRA), along with crucial genes involved in glucose and lipid metabolism (the transcription factors FOXO1, PPARA, and SREBF1; and the functional protein-coding genes ACOX1, FASN, G6PC, GSK3B, QKI, MAPKAPK2) was assessed 48 h post-transfection in hepatocytes (HepG2 cells) both untreated and exposed to FFA for 3 h.
In the in vitro model of liver steatosis (HepG2 cells exposed to FFA), the plant miRNA-human target gene bioinformatic prediction was validated, reporting a marked downregulation of the putative target RXRA (−38.05% ± 3.91; p < 0.001) as compared to control cells (Figure 1a). FFA-exposed HepG2 also showed a reduction in the mRNA levels of PPARA (−61.25% ± 2.86; p < 0.001), SREBF1 (−18.10% ± 6.49; p < 0.05), MAPKAPK2 (−10.60% ± 3.99; p < 0.05), QKI (−16.65% ± 5.38; p < 0.05), ACOX1 (−31.65% ± 5.92; p < 0.01), G6PC (−73.35% ± 6.49; p < 0.001), and GSK3B (−24.80% ± 2.65; p < 0.001), whereas any significant differences were found in FOXO1 mRNA expression (Figure 1b).
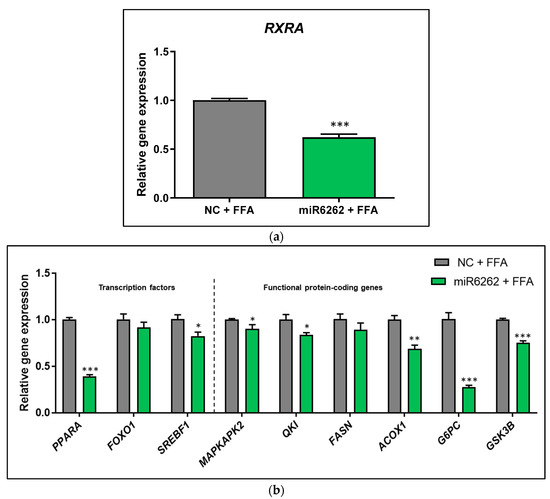
Figure 1.
Evaluation of gene expression in hepatocytes after transfection with plant miR6262 mimic and treatment with free fatty acids to mimic in vitro liver steatosis. (a) mRNA expression of the predicted target RXRA. (b) mRNA expression of transcription factors (PPARA, FOXO1, and SREBF1) and functional protein-coding genes (MAPKAPK2, QKI, FASN, ACOX1, G6PC, and GSK3B) associated with lipid and glucose metabolism. Reverse-transfection of HepG2 cells was conducted with the plant miR6262 mirVana mimic (5′-UCUUUAGAAAGUUAGAAUUGU-3′) and a negative control (a scramble sequence) at 50 nM. At 48 h post-transfection, cells were exposed to free fatty acids (a mixture of oleic and palmitic acids at 0.5 M and a 2:1 ratio) for 3 h. Quantification of mRNA expression levels was evaluated by qPCR. TBP was selected as housekeeping gene to normalize Cq values, which were expressed relative to the free FFA-treated negative control, applying the 2−ΔΔCt method. Results are shown as relative gene expression mean relative gene expression mean ± standard error of the mean (SEM) (n = 4–5). p-value: * p < 0.05, ** p < 0.01, *** p < 0.001. Abbreviations: NC (negative control), FFA (free fatty acids).
Basal (non-FFA-treated HepG2) transfected with plant miR6262 mimic also exhibited a decrease in the mRNA levels of the predicted target RXRA (−31.14% ± 3.62; p < 0.001), (Figure S4a), which was accompanied by an mRNA downregulation of PPARA (−39.67% ± 7.54; p < 0.05), SREBF1 (−26.86% ± 5.82; p < 0.001), FASN (−21.57% ± 7.86; p < 0.05), and G6PC (−66.86% ± 5.23; p < 0.001), and an increase of FOXO1 (29.71% ± 11.97; p < 0.05), mRNA levels relative to the negative control (Figure S4b). No significant changes were detected in MAPKAK2, QKI, ACOX1, and GSK3B mRNA of untreated HepG2 cells (Figure S4b).
3.4. Plant miR6262 Did Not Attenuate Lipid Accumulation in an In Vitro Hepatocyte Human Cell Model of Liver Steatosis
Lipid content within HepG2 cells was quantified 48 h post-miRNA mimic transfection with miRNA mimics, comparing untreated cells with those exposed to FFA for 3 h. The in vitro model of liver steatosis was validated by two independent methods: an increase of the lipid content in HepG2 cells exposed to FFA relative to untreated cells was detected with both Nile Red staining (54.15% ± 6.28; p < 0.001) (Figure 2a) and Triglyceride-GloTM Assay (27.63% ± 3.48; p < 0.01) (Figure 2b). However, the plant miR6262 mimic did not affect lipid accumulation in FFA-treated hepatocytes when compared to negative control exposed to FFA (Figure 2b).
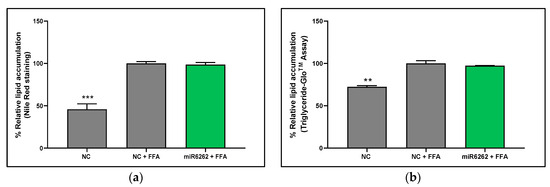
Figure 2.
Quantification of intracellular lipid levels in hepatocytes after transfection with plant miR6262 mimic. (a) Intracellular triglycerides levels measured by Nile Red staining. (b) Intracellular triglycerides levels measured by Triglyceride-GloTM Assay. Reverse-transfection of HepG2 cells was conducted with the plant miR6262 mirVana mimic (5′-UCUUUAGAAAGUUAGAAUUGU-3′) and a negative control (a scramble sequence) at 50 nM. At 48 h post-transfection, cells were exposed to free fatty acids (a mixture of oleic and palmitic acids at 0.5 M and a 2:1 ratio) for 3 h. Scramble-sequence-transfected cells, untreated with FFA, served as positive control. Results are expressed as the percentage of lipid accumulation, reflecting the mean ± standard error of the mean (SEM) of the lipid content versus to FFA-treated negative control (Nile red staining: n = 6–7; Triglyceride-GloTM assay: n = 3). Statistical significance was assessed by comparing miR6262 transfected cells and untreated negative control to the FFA-treated negative control. p-value ** p < 0.01, *** p < 0.001. Abbreviations: NC (negative control), FFA (free fatty acids).
3.5. Plant miR6262 Regulated the Expression of the Predicted Target RXRA and Metabolic-Related Genes in hMADS Cells Differentiated into Brite Adipocytes
The impact of plant miR6262 on the miRNA expression levels of the predicted target gene as well as genes associated with metabolism, adipogenesis, and adipocyte thermogenesis and browning, was evaluated in hMADS differentiated into brite adipocytes. In particular, we analyzed the mRNA expression levels of the predicted target gene RXRA, along with the following genes: UCP1, FABP4, CIDEA, PPARG, HSL, ATGL, PLIN1, ACOX1, ADRB3, COL1A1, MAPKAPK2, and CPT1M.
Firstly, the efficiency of adipocyte browning stimulation was evaluated in adipocytes transfected with a scramble sequence by establishing comparisons with scramble-sequence-transfected white adipocytes (Figure 3). In brite control cells, it was detected a marked up-regulation of the thermogenic markers UCP1 (fold change 145.8 ± 45.73; p < 0.01) and CPT1M (fold change 3.30 ± 0.50; p < 0.001) (Figure 3a). Furthermore, the mRNA levels of the mature adipocyte marker FABP4 increased (fold change 2.62 ± 0.95; p < 0.05) in brite adipocytes relative to white adipocytes (Figure 3a). Stimulation of the browning process decreased the mRNA expression of PPARG2 (fold change −0.50 ± 0.07; p < 0.001), and a tendency was reported towards the enhancement of CIDEA (fold change 12.50 ± 6.45; t = 0.0813) and the decrease of MAPKAPK2 (fold change −0.20 ± 0.09; t = 0.0551) mRNA expression (Figure 3a). No changes at the mRNA levels of PLIN1, ATGL, HSL, RXRA, PPARG 1+2; ACOX1, COL1A and ADRB3 were reported in brite adipocytes (Figure 3b).
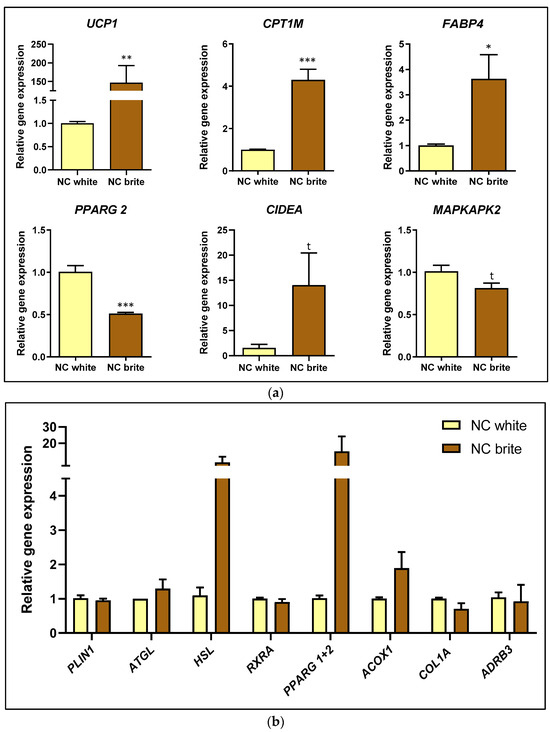
Figure 3.
Evaluation of gene expression in hMADS cells differentiated into white and brite adipocytes. (a) mRNA levels of UCP1, CPT1M, FABP4, PARG2, CIDEA, and MAPKAPK2. (b) mRNA levels of PLIN1, ATGL, HSL, RXRA, PPARG 1+2, ACOX1, COL1A, and ADRB3. Transfection of hMADS cells was conducted with 25 nM of the negative control (a scramble sequence) at day 10–12 of differentiation. Stimulation of the conversion of white adipocytes into brite adipocytes (browning process) was conducted from day 14 to day 18 of differentiation. Quantification of mRNA expression levels was conducted by qPCR in white and brite adipocytes. 36B4 was selected as housekeeping gene to normalize Cq values, which were expressed relative to the white negative control, applying the 2-ΔΔCt method. Results are depicted as the relative gene expression mean ± standard error of the mean (SEM) (n = 4–6). p-value: * p < 0.05, ** p < 0.01, *** p < 0.001, t (CIDEA) = 0.0813; t (MAPKAPK2) = 0.0551. Abbreviations: NC (negative control).
On the other hand, plant miR6262 mimic transfection decreased the mRNA expression of the predicted target RXRA (−25.50% ± 9.74; p < 0.05) in brite adipocytes as compared to brite control cells (Figure 4a), which was accompanied by an increase of CIDEA (88.50% ± 24.85; p < 0.01) and CPT1M (57.67% ± 8.86; p < 0.001), and a decrease of PLIN1 (−14.50% ± 6.04; p < 0.05) mRNA levels (Figure 4b). Plant miR6262 mimic did not modify the mRNA levels of UCP1, FABP4, ATLG, HSL, MAPKAPK2, PPARG 1+2, PPARG 2, ACOX1, COL1A, and ADRB3 when compared to brite control cells (Figure 4c).
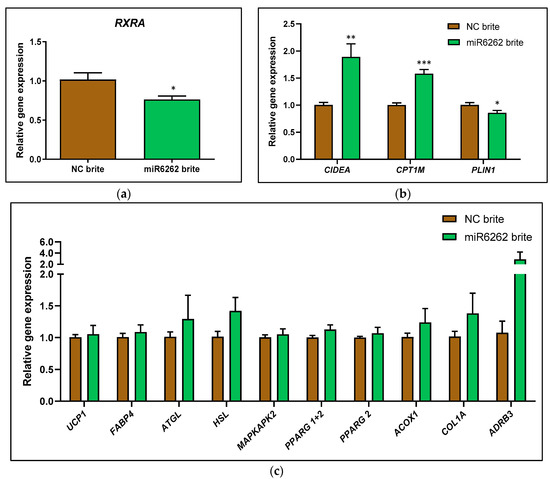
Figure 4.
Evaluation of gene expression in hMADS cells after transfection with plant miR6262 mimic and differentiation into brite adipocytes. (a) mRNA expression of the predicted target RXRA. (b) mRNA expression of CIDEA, CPT1M, and PLIN1. (c) mRNA levels of UCP1, FABP4, ATGL, HSL, MAPKAPK2, PPARG 1+2, PPARG2, ACOX1, COL1A, and ADRB3. Transfection of hMADS cells was performed with 25 nM of the plant miR6262 mirVana mimic (5′-UCUUUAGAAAGUUAGAAUUGU-3′) and a negative control (a scramble sequence) at day 10–12 of differentiation. Stimulation of the conversion of white adipocytes into brite adipocytes (browning process) was conducted between day 14 to day 18 of differentiation. Quantification of mRNA expression levels was evaluated by qPCR in white and brite adipocytes. 36B4 was selected as housekeeping gene to normalize Cq values, which were expressed relative to the brite negative control, applying the 2−ΔΔCt method. Results are shown as the relative gene expression mean ± standard error of the mean (SEM) (n = 4–6). p-value: * p < 0.05, ** p < 0.01, *** p < 0.001. Abbreviations: NC (negative control).
3.6. Plant miR6262 Did Not Have an Impact on UCP-1 Protein Expression and the Mitochondrial DNA Content in hMADS Cells Differentiated into Brite Adipocytes
UCP-1 protein expression levels and quantification of mitochondrial DNA, which correlated with mitochondriogenesis, were selected as markers of adipocyte browning to investigate the functional impact of plant miR6262 on this process.
Consistent with gene expression data and supporting the efficacy of the browning process induction, UCP-1 protein levels were increased in brite adipocytes when compared to white adipocytes, where UCP-1 protein expression was undetectable (Figure 5). A tendency towards the decrease of UCP-1 expression was reported in brite adipocytes transfected with plant miR6262 mimic in comparison to brite adipocyte control (−50.33% ± 16.03; t = 0.0883) (Figure 5).
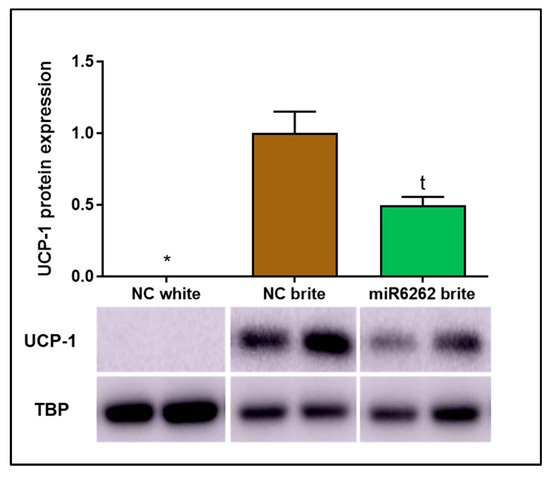
Figure 5.
UCP-1 protein expression in hMADS cells differentiated into brite and white adipocytes and plant miR6262 mimic transfected brite adipocytes. Transfection of hMADS cells were conducted with 25 nM of the mirVana mimic plant miR6262 (5′-UCUUUAGAAAGUUAGAAUUGU-3′) and a negative control (scramble sequence) at day 10–12 of differentiation. Stimulation of the conversion of white adipocytes in brite adipocytes (browning process) was conducted between days 14 and 18 of differentiation. UCP-1 protein levels were quantified by western blot and the signal intensity of the protein bands was measured with ImageJ software (version 1.52a). UCP-1 signal intensity was normalized to that of TBP and results are presented as UCP-1 protein expression levels relative to brite negative control ± standard error of the mean (SEM) (n = 2). p-value: * p < 0.05; t = 0.0883. Abbreviations: NC (negative control).
Mitochondrial DNA quantity decreased in white adipocyte control as compared to brite adipocyte control (−40.28% ± 4.17; p < 0.05), suggesting increased mitochondrial biogenesis in brite adipocytes and confirming effective adipocyte browning stimulation (Figure 6). Nevertheless, no statistically significant variation of mitochondrial DNA content was detected in brite adipocytes transfected with plant miR6262 mimic in comparison to brite control cells (Figure 6).
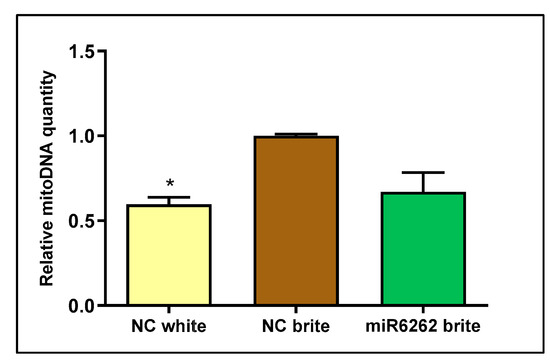
Figure 6.
Mitochondrial DNA quantification in hMADS cells differentiated into brite and white adipocytes and plant miR6262 mimic transfected brite adipocytes. Transfection of hMADS cells was performed with 25 nM of the plant miR6262 mirVana mimic (5′-UCUUUAGAAAGUUAGAAUUGU-3′) and a negative control (a scramble sequence) at day 10–12 of differentiation. Stimulation of the conversion of white adipocytes in brite adipocytes (browning process) was conducted between days 14 and 18 of differentiation. DNA expression levels were analyzed in white and brite adipocytes by qPCR. Cq values of the mitochondrial gene NADHdS1 were normalized to the nuclear gene LPL and expressed as relative mitochondrial DNA levels calculated by the 2−ΔΔCt method. Results are expressed as mitochondrial DNA levels relative to brite negative control ± standard error of the mean (SEM) (n = 2). p-value: * p < 0.05. Abbreviations: NC (negative control), mitoDNA (mitochondrial DNA).
4. Discussion
Extensive evidence has reported the beneficial effects of plants on the restoration of energy balance and the counteraction of metabolic disturbances, including the stimulation of adipose tissue browning and the alleviation of steatosis and NAFLD [2,4,6]. Based on this evidence and the emergence of plant miRNAs as cross-kingdom regulators with bioactive effects in animals [17], the present article ought (1) to identify plant miRNAs that may influence the expression of crucial genes of hepatocytes and adipocytes involved in metabolism and thermogenesis, (2) to evaluate their relevance on lipid accumulation and the browning process.
The in silico approach revealed that miR6262, which was first identified in peach [67], could potentially regulate the expression of the human RXR gene. This gene encodes for a protein that is part of the retinoid X receptor family, which is located at the nucleus and has a key role in the regulation of cell proliferation, death and differentiation, and glucose, fatty acid and cholesterol metabolism [65,68,69]. We hypothesized that plant miR6262 might improve the metabolic gene expression profile of hepatocytes and adipocytes and could promote the expression of adipocyte thermogenic markers, through the eventual interaction with RXRA, which could presumably be directed at inhibiting their expression [20]. The basis of this hypothesis relies on the evidence supporting (1) the therapeutic potential of plants to promote energy expenditure and counteract metabolic disturbances through the alleviation of liver and WAT dysfunction and the activation of BAT [4,6,8]; (2) the key role of RXR receptors in liver and adipocyte physiology [65,69]; (3) the association between the activation of RXR or signaling pathways in which RXR function is involved and the inhibition of adipocyte browning, development of dysfunctional WAT, and exacerbation of hepatic steatosis [64,70]. In addition, reported evidence has shown an association between RXR inhibition and the protection against obesity, and associated comorbidities such as diabetes, by improving metabolic homeostasis and enhancing energy expenditure [65,66].
This work provides the first insight into the impact of plant miR6262 on the downregulation of the expression of the predicted human target RXRA in both human adipocytes and hepatocytes. Notably, the impact of plant miR6262 on gene expression metabolic profile on both cell types was different.
On the one hand, in human hepatocytes, plant miR6262 influenced the mRNA levels of transcription factors and protein-coding genes linked to lipid and glucose metabolism. miR6262 promoted an extensive inhibition of RXRA and PPARA mRNA levels in basal (untreated with FFA) cells and HepG2 cells exposed to FFA to mimic hepatic steatosis. RXRα heterodimerizes with PPARα [70,71], which might explain why the downregulation of RXRA expression by miR6262 could affect negatively PPARA mRNA levels. RXRA and PPARA inhibition was accompanied by a downregulation in SREBF1 mRNA expression, which could correlate with the evidence confirming that RXRα and PPARα heterodimers stimulate the expression of the key inductor of lipogenesis SREBF1 [70,72,73]. However, miR6262 did not downregulate FASN mRNA expression in HepG2 cells exposed to FFA, an effect that was observed in non-FFA-treated HepG2. This observation might be associated with the higher inhibition of SREBF1 in the baseline situation as compared to the FFA-overloading state. A remarkable effect promoted by miR6262 was a great decrease of G6PC mRNA levels, which encodes for a glucose 6-phosphatase, a crucial enzyme involved in the production of liver endogenous glucose [74,75]. G6PC (also termed G6Pase) is directly regulated by PPARα and, in agreement with our results, downregulation of PPARA and/or RXRA could be accompanied by a decrease in G6PC expression [66,76]. Nevertheless, the exact mechanism underlying interaction and temporal dynamics between the potential genes modulated by miR6262 should be confirmed and further evaluated in future studies. Overall, these results suggest that miR6262 could be a bioactive molecule from plant origin that, as well as plant miR8126, could influence the expression profile of crucial human hepatic genes associated with glucose and lipid metabolism [39]. However, gene expression changes in the metabolic profile promoted by plant miR6262 did not translate into the attenuation of triglyceride accumulation in the in vitro model of liver steatosis. Despite using two independent techniques (Nile Red staining and Triglyceride-GloTM Assay), no variation in the lipid content was detected in miR6262-transfected hepatocytes that were treated with FFA.
On the other hand, in brown-like adipocytes, plant miR6262 decreased PLIN1 gene expression, which encodes for perilipin-1, a key regulator of lipolysis [77,78]. Also, miR6262 upregulated CIDEA and CPT1M (also termed CPT1B), which are key markers of the browning process, involved in thermogenesis and energy expenditure [51,52,79]. In agreement with our results, other studies have found an association between RXR inhibition and the increase of CIDEA expression [64]. Nevertheless, the upregulation of CIDEA expression by miR6262 did not correlate with an increase of UCP1 mRNA levels, despite the extensive evidence showing that CIDEA stimulates UCP1 expression, the main driver of the browning process [79,80,81]. These results correlated with the evaluation of UCP-1 protein levels, which revealed that miR6262 did not affect UCP-1 expression; even a trend towards the downregulation was observed. In addition, miR6262 did not exert a functional impact on mitochondriogenesis, which is linked to the browning process [56,57]. These might suggest that plant miR6262 might specifically affect key players in adipocytes browning process although it seems unlikely that this might translate to a functionally relevant biological impact in this cell type.
The cross-kingdom xenomiRs hypothesis is still a matter of debate. In agreement with our results concerning plant miR6262 functional effects, other authors have reported that certain dietary xenomiRs, despite being efficiently uptaken by mammalian cells, might not be functional in mammals [82,83]. By contrast, some studies have reported that plant miRNAs could exert a biological impact on adipocytes, influencing adipogenesis [37], and improving the inflammatory and metabolic profile in obese mice [36]. Although we could not determine a cross-kingdom biological activity for plant miR6262 on counteracting lipid accumulation in hepatocytes and stimulating the browning process in adipocytes, in the conditions of our study, we cannot confirm that plant miR6262 could not be functional in these cell types. In this context, it might entail special relevance to analyze the effect of miR6262 on hepatocyte gluconeogenesis, based on (1) the remarkable downregulation of G6PC mRNA promoted by miR6262 reported in the present study, and (2) the fact that liver gluconeogenesis could be suppressed by targeting G6PC which improves liver and adipose tissue metabolic profile, insulin sensitivity and diet-induced obesity [74,75]. It would be also important to evaluate the functional impact of miR6262 on adipocyte lipolysis, given that it modulated PLIN1 gene expression and Perilipin proteins prevent lipase activity thus acting as master regulators of this metabolic process [84]. In addition, while the effect of plant miRNAs should first be evaluated individually to validate miRNA-target gene predictions and elucidate mechanisms of action, it could be important to consider that plants may contain a wide range of miRNAs with potential cross-kingdom regulatory activities [18]. Therefore, evaluating the physiological impact of a cocktail of plant miRNAs with similar potential phenotypic effects, such as miR6262 and miR8126 isoforms, could be relevant and represent a more physiological setting as compared to human plant miRNAs ingestion from food [39]. This fact is important because additive and/or synergistic effects between plant miRNAs may occur, potentially leading to metabolic phenotypic changes that might not be observed, or not to the same extent, when miRNAs are administered individually [85].
Certain limitations should be acknowledged in this study: (1) Several reports suggest that many plant miRNAs are evolutionarily conserved across species [86,87]. In this study, the Prunus persica genome was selected as the reference for identifying plant miRNAs with potential human targets related to metabolism, leading to the selection of miR6262 as a candidate. However, it would be especially relevant to analyze miR6262 expression across a broader range of plant-based products to determine whether this plant microRNA might be specific to peaches or conserved throughout the plant kingdom (and to what extent). (2) Further research is needed to determine whether the miR6262 effects on metabolic and thermogenic gene expression profile might eventually translate into phenotypic changes beyond hepatocyte lipid accumulation or adipocyte browning. In this context, RNA-sequencing analysis could contribute to underpinning the miR6262 mechanism of action and target gene interactions. (3) The bioavailability of plant miRNAs in animal circulatory systems still remains controversial due to inconsistent results [41]. Thus, it will be necessary to evaluate whether plant miR6262 could be absorbed to eventually reach specific tissues and organs, and eventually modulate cell function. (4) In this regard, in vivo experiments will be crucial to elucidate the physiological impact and therapeutic potential of miR6262. However, genomic differences between species may arise, so careful consideration would be required when selecting an appropriate animal model. Despite these caveats, the results of this study pave the way for further investigation into the cross-kingdom biological impact of plant miR6262, suggesting a promising role of this microRNA in the regulation of metabolism and thermogenesis.
5. Conclusions
The present study reveals that plant miR6262 could be a bioactive molecule capable of modulating the expression of human genes associated with energy expenditure and glucose and lipid metabolism in hepatocytes and adipocytes. Nevertheless, we did not find evidence that plant miR6262 could exert a biological function in hepatocytes and adipocytes related to the counteraction of lipid accumulation or adipocyte browning stimulation, at least in our experimental conditions. Thus, the functional impact of plant miR6262 remains elusive, and further experiments will be necessary to determine whether the gene expression changes promoted by this miRNA could entail biological relevance in humans. Notwithstanding, these findings provide a new avenue for further research into the role of plant miR6262 as a cross-kingdom gene expression regulator in the context of metabolism.
Supplementary Materials
The following supporting information can be downloaded at: https://www.mdpi.com/article/10.3390/nu16183146/s1, Table S1: Gene ontology (GO) enrichment analyses of putative human target genes of plant miR6262; Figure S1: In silico prediction alignments between plant miR6262 and putative target transcripts; Figure S2: Expression levels of plant miR6262 in HepG2 cells after mimic transfection; Figure S3: Evaluation of the effect of plant miRNA mimic miR6262 on the viability of HepG2 cells; Figure S4: Gene expression analyses of HepG2 cells transfected with plant miR6262 mimic.
Author Contributions
Conceptualization, E.D.-S., F.I.M. and S.L.-C.; Funding acquisition, F.I.M., J.I.R.-B. and S.L.-C.; Methodology, E.D.-S. and P.A.; Project administration, F.I.M., J.I.R.-B. and S.L.-C.; Supervision, F.I.M. and S.L.-C.; Writing—original draft, E.D.-S.; Writing—review and editing, E.D.-S., F.I.M., P.A., J.I.R.-B. and S.L.-C. All authors have read and agreed to the published version of the manuscript.
Funding
This research was funded by the CIBERobn (grant number CB12/03/30002), the Ministerio de Economía y Competitividad of Spain (grant numbers RTI2018-102205-B-I00, PID2022-141766OBI00, PID2022-141313OB-I00 and BFU2015-65937-R), and a Center for Nutrition Research (University of Navarra) pre-doctoral fellowship and an EMBO Scientific Exchange Grant awarded to Ester Díez-Sainz.
Institutional Review Board Statement
Not applicable.
Informed Consent Statement
Not applicable.
Data Availability Statement
The original contributions presented in the study are included in the article/Supplementary Materials; further inquiries can be directed to the corresponding author.
Acknowledgments
The authors acknowledge Ez-Zoubir Amri, Isabelle Mothe-Satney, Pierre-Louis Batrow, Nadine Gautier and Laura Contu from the Université Côte d’Azur (CNRS, Inserm, iBV) for their contribution to the hMADS experiments. Graphical Abstract was created with BioRender.com (https://www.biorender.com/; accessed on 12 October 2023).
Conflicts of Interest
The authors declare no conflicts of interest.
References
- Ahmad, S.R. Plant-based diet for obesity treatment. Front. Nutr. 2022, 9, 952553. [Google Scholar] [CrossRef] [PubMed]
- Bagherniya, M.; Nobili, V.; Blesso, C.N.; Sahebkar, A. Medicinal plants and bioactive natural compounds in the treatment of non-alcoholic fatty liver disease: A clinical review. Pharmacol. Res. 2018, 130, 213–240. [Google Scholar] [CrossRef] [PubMed]
- Garima, S.; Ajit Kumar, P.; Marcy, D.M.; Sakthivel, R.; Bhim Pratap, S.; Nachimuthu Senthil, K. Ethnobotanical survey of medicinal plants used in the management of cancer and diabetes. J. Tradit. Chinese Med. Chung i Tsa Chih Ying Wen Pan 2020, 40, 1007–1017. [Google Scholar] [CrossRef]
- Lee, M.-K.; Lee, B.; Kim, C.Y. Natural Extracts That Stimulate Adipocyte Browning and Their Underlying Mechanisms. Antioxidants 2021, 10, 308. [Google Scholar] [CrossRef]
- Sun, Q.; Xin, X.; An, Z.; Hu, Y.; Feng, Q. Therapeutic Potential of Natural Plants Against Non-Alcoholic Fatty Liver Disease: Targeting the Interplay Between Gut Microbiota and Bile Acids. Front. Cell. Infect. Microbiol. 2022, 12, 854879. [Google Scholar] [CrossRef]
- Li, H.-Y.; Gan, R.-Y.; Shang, A.; Mao, Q.-Q.; Sun, Q.-C.; Wu, D.-T.; Geng, F.; He, X.-Q.; Li, H.-B. Plant-Based Foods and Their Bioactive Compounds on Fatty Liver Disease: Effects, Mechanisms, and Clinical Application. Oxid. Med. Cell. Longev. 2021, 2021, 6621644. [Google Scholar] [CrossRef]
- Pacifici, F.; Malatesta, G.; Mammi, C.; Pastore, D.; Marzolla, V.; Ricordi, C.; Chiereghin, F.; Infante, M.; Donadel, G.; Curcio, F.; et al. A Novel Mix of Polyphenols and Micronutrients Reduces Adipogenesis and Promotes White Adipose Tissue Browning via UCP1 Expression and AMPK Activation. Cells 2023, 12, 714. [Google Scholar] [CrossRef]
- Saad, B. A Review of the Anti-Obesity Effects of Wild Edible Plants in the Mediterranean Diet and Their Active Compounds: From Traditional Uses to Action Mechanisms and Therapeutic Targets. Int. J. Mol. Sci. 2023, 24, 12641. [Google Scholar] [CrossRef]
- Gibbs, J.; Cappuccio, F.P. Plant-Based Dietary Patterns for Human and Planetary Health. Nutrients 2022, 14, 1614. [Google Scholar] [CrossRef]
- Clem, J.; Barthel, B. A Look at Plant-Based Diets. Mo. Med. 2021, 118, 233–238. [Google Scholar]
- Hargreaves, S.M.; Raposo, A.; Saraiva, A.; Zandonadi, R.P. Vegetarian Diet: An Overview through the Perspective of Quality of Life Domains. Int. J. Environ. Res. Public Health 2021, 18, 4067. [Google Scholar] [CrossRef] [PubMed]
- Fehér, A.; Gazdecki, M.; Véha, M.; Szakály, M.; Szakály, Z. A Comprehensive Review of the Benefits of and the Barriers to the Switch to a Plant-Based Diet. Sustainability 2020, 12, 4136. [Google Scholar] [CrossRef]
- Hemler, E.C.; Hu, F.B. Plant-Based Diets for Personal, Population, and Planetary Health. Adv. Nutr. 2019, 10, S275–S283. [Google Scholar] [CrossRef] [PubMed]
- Karri, S.; Sharma, S.; Hatware, K.; Patil, K. Natural anti-obesity agents and their therapeutic role in management of obesity: A future trend perspective. Biomed. Pharmacother. 2019, 110, 224–238. [Google Scholar] [CrossRef] [PubMed]
- Zhang, X.; Li, X.; Fang, H.; Guo, F.; Li, F.; Chen, A.; Huang, S. Flavonoids as inducers of white adipose tissue browning and thermogenesis: Signalling pathways and molecular triggers. Nutr. Metab. 2019, 16, 47. [Google Scholar] [CrossRef]
- Xie, W.; Weng, A.; Melzig, M.F. MicroRNAs as New Bioactive Components in Medicinal Plants. Planta Med. 2016, 82, 1153–1162. [Google Scholar] [CrossRef]
- Li, D.; Yang, J.; Yang, Y.; Liu, J.; Li, H.; Li, R.; Cao, C.; Shi, L.; Wu, W.; He, K. A Timely Review of Cross-Kingdom Regulation of Plant-Derived MicroRNAs. Front. Genet. 2021, 12, 613197. [Google Scholar] [CrossRef]
- Díez-Sainz, E.; Milagro, F.I.; Aranaz, P.; Riezu-Boj, J.I.; Lorente-Cebrián, S. MicroRNAs from edible plants reach the human gastrointestinal tract and may act as potential regulators of gene expression. J. Physiol. Biochem. 2024. [Google Scholar] [CrossRef] [PubMed]
- Philip, A.; Ferro, V.A.; Tate, R.J. Determination of the potential bioavailability of plant microRNAs using a simulated human digestion process. Mol. Nutr. Food Res. 2015, 59, 1962–1972. [Google Scholar] [CrossRef]
- Bartel, D.P. Metazoan MicroRNAs. Cell 2018, 173, 20–51. [Google Scholar] [CrossRef]
- Layton, E.; Fairhurst, A.M.; Griffiths-Jones, S.; Grencis, R.K.; Roberts, I.S. Regulatory RNAs: A universal language for inter-domain communication. Int. J. Mol. Sci. 2020, 21, 8919. [Google Scholar] [CrossRef] [PubMed]
- Owusu Adjei, M.; Zhou, X.; Mao, M.; Rafique, F.; Ma, J. MicroRNAs Roles in Plants Secondary Metabolism. Plant Signal. Behav. 2021, 16, 1915590. [Google Scholar] [CrossRef] [PubMed]
- Zhang, F.; Yang, J.; Zhang, N.; Wu, J.; Si, H. Roles of microRNAs in abiotic stress response and characteristics regulation of plant. Front. Plant Sci. 2022, 13, 919243. [Google Scholar] [CrossRef]
- Dong, Q.; Hu, B.; Zhang, C. microRNAs and Their Roles in Plant Development. Front. Plant Sci. 2022, 13, 824240. [Google Scholar] [CrossRef] [PubMed]
- Minutolo, A.; Potestà, M.; Gismondi, A.; Pirrò, S.; Cirilli, M.; Gattabria, F.; Galgani, A.; Sessa, L.; Mattei, M.; Canini, A.; et al. Olea europaea small RNA with functional homology to human miR34a in cross-kingdom interaction of anti-tumoral response. Sci. Rep. 2018, 8, 12413. [Google Scholar] [CrossRef] [PubMed]
- Li, M.; Chen, T.; Wang, R.; Luo, J.-Y.; He, J.-J.; Ye, R.-S.; Xie, M.-Y.; Xi, Q.-Y.; Jiang, Q.-Y.; Sun, J.-J.; et al. Plant MIR156 regulates intestinal growth in mammals by targeting the Wnt/β-catenin pathway. Am. J. Physiol. Cell Physiol. 2019, 317, C434–C448. [Google Scholar] [CrossRef] [PubMed]
- Li, M.; Chen, T.; He, J.-J.; Wu, J.-H.; Luo, J.-Y.; Ye, R.-S.; Xie, M.-Y.; Zhang, H.-J.; Zeng, B.; Liu, J.; et al. Plant MIR167e-5p Inhibits Enterocyte Proliferation by Targeting β-Catenin. Cells 2019, 8, 1385. [Google Scholar] [CrossRef] [PubMed]
- Minutolo, A.; Potestà, M.; Roglia, V.; Cirilli, M.; Iacovelli, F.; Cerva, C.; Fokam, J.; Desideri, A.; Andreoni, M.; Grelli, S.; et al. Plant microRNAs from Moringa oleifera Regulate Immune Response and HIV Infection. Front. Pharmacol. 2020, 11, 620038. [Google Scholar] [CrossRef]
- Teng, Y.; Xu, F.; Zhang, X.; Mu, J.; Sayed, M.; Hu, X.; Lei, C.; Sriwastva, M.; Kumar, A.; Sundaram, K.; et al. Plant-derived exosomal microRNAs inhibit lung inflammation induced by exosomes SARS-CoV-2 Nsp12. Mol. Ther. 2021, 29, 2424–2440. [Google Scholar] [CrossRef]
- Zhou, Z.; Li, X.; Liu, J.; Dong, L.; Chen, Q.; Liu, J.; Kong, H.; Zhang, Q.; Qi, X.; Hou, D.; et al. Honeysuckle-encoded atypical microRNA2911 directly targets influenza A viruses. Cell Res. 2015, 25, 39–49. [Google Scholar] [CrossRef]
- Cavalieri, D.; Rizzetto, L.; Tocci, N.; Rivero, D.; Asquini, E.; Si-Ammour, A.; Bonechi, E.; Ballerini, C.; Viola, R. Plant microRNAs as novel immunomodulatory agents. Sci. Rep. 2016, 6, 25761. [Google Scholar] [CrossRef] [PubMed]
- Qiu, F.-S.; Wang, J.-F.; Guo, M.-Y.; Li, X.-J.; Shi, C.-Y.; Wu, F.; Zhang, H.-H.; Ying, H.-Z.; Yu, C.-H. Rgl-exomiR-7972, a novel plant exosomal microRNA derived from fresh Rehmanniae Radix, ameliorated lipopolysaccharide-induced acute lung injury and gut dysbiosis. Biomed. Pharmacother. 2023, 165, 115007. [Google Scholar] [CrossRef] [PubMed]
- Díez-Sainz, E.; Lorente-Cebrián, S.; Aranaz, P.; Amri, E.-Z.; Riezu-Boj, J.I.; Milagro, F.I. miR482f and miR482c-5p from edible plant-derived foods inhibit the expression of pro-inflammatory genes in human THP-1 macrophages. Front. Nutr. 2023, 10, 1287312. [Google Scholar] [CrossRef]
- Akao, Y.; Kuranaga, Y.; Heishima, K.; Sugito, N.; Morikawa, K.; Ito, Y.; Soga, T.; Ito, T. Plant hvu-MIR168-3p enhances expression of glucose transporter 1 (SLC2A1) in human cells by silencing genes related to mitochondrial electron transport chain complex I. J. Nutr. Biochem. 2022, 101, 108922. [Google Scholar] [CrossRef] [PubMed]
- Zhang, L.; Hou, D.; Chen, X.; Li, D.; Zhu, L.; Zhang, Y.; Li, J.; Bian, Z.; Liang, X.; Cai, X.; et al. Exogenous plant MIR168a specifically targets mammalian LDLRAP1: Evidence of cross-kingdom regulation by microRNA. Cell Res. 2012, 22, 107–126. [Google Scholar] [CrossRef]
- Aquilano, K.; Ceci, V.; Gismondi, A.; De Stefano, S.; Iacovelli, F.; Faraonio, R.; Di Marco, G.; Poerio, N.; Minutolo, A.; Minopoli, G.; et al. Adipocyte metabolism is improved by TNF receptor-targeting small RNAs identified from dried nuts. Commun. Biol. 2019, 2, 317. [Google Scholar] [CrossRef]
- Chen, T.; Ma, F.; Peng, Y.; Sun, R.; Xi, Q.; Sun, J.; Zhang, J.; Zhang, Y.; Li, M. Plant miR167e-5p promotes 3T3-L1 adipocyte adipogenesis by targeting β-catenin. Vitr. Cell Dev. Biol. Anim. 2022, 58, 471–479. [Google Scholar] [CrossRef]
- Roglia, V.; Potestà, M.; Minchella, A.; Bruno, S.P.; Bernardini, R.; Lettieri-Barbato, D.; Iacovelli, F.; Gismondi, A.; Aquilano, K.; Canini, A.; et al. Exogenous miRNAs from Moringa oleifera Lam. recover a dysregulated lipid metabolism. Front. Mol. Biosci. 2022, 9, 1012359. [Google Scholar] [CrossRef]
- Díez-Sainz, E.; Aranaz, P.; Amri, E.-Z.; Riezu-Boj, J.I.; Lorente-Cebrián, S.; Milagro, F.I. Plant miR8126-3p and miR8126-5p Decrease Lipid Accumulation through Modulation of Metabolic Genes in a Human Hepatocyte Model That Mimics Steatosis. Int. J. Mol. Sci. 2024, 25, 1721. [Google Scholar] [CrossRef] [PubMed]
- Chen, X.; Liu, L.; Chu, Q.; Sun, S.; Wu, Y.; Tong, Z.; Fang, W.; Timko, M.P.; Fan, L. Large-scale identification of extracellular plant miRNAs in mammals implicates their dietary intake. PLoS ONE 2021, 16, e0257878. [Google Scholar] [CrossRef]
- Díez-Sainz, E.; Lorente-Cebrián, S.; Aranaz, P.; Riezu-Boj, J.I.; Martínez, J.A.; Milagro, F.I. Potential Mechanisms Linking Food-Derived MicroRNAs, Gut Microbiota and Intestinal Barrier Functions in the Context of Nutrition and Human Health. Front. Nutr. 2021, 8, 586564. [Google Scholar] [CrossRef] [PubMed]
- Mlotshwa, S.; Pruss, G.J.; MacArthur, J.L.; Endres, M.W.; Davis, C.; Hofseth, L.J.; Peña, M.M.; Vance, V. A novel chemopreventive strategy based on therapeutic microRNAs produced in plants. Cell Res. 2015, 25, 521–524. [Google Scholar] [CrossRef] [PubMed]
- Kumazoe, M.; Ogawa, F.; Hikida, A.; Shimada, Y.; Yoshitomi, R.; Watanabe, R.; Onda, H.; Fujimura, Y.; Tachibana, H. Plant miRNA osa-miR172d-5p suppressed lung fibrosis by targeting Tab1. Sci. Rep. 2023, 13, 2128. [Google Scholar] [CrossRef] [PubMed]
- Eichelmann, F.; Schwingshackl, L.; Fedirko, V.; Aleksandrova, K. Effect of plant-based diets on obesity-related inflammatory profiles: A systematic review and meta-analysis of intervention trials. Obes. Rev. 2016, 17, 1067–1079. [Google Scholar] [CrossRef]
- Dai, X.; Zhao, P.X. psRNATarget: A plant small RNA target analysis server. Nucleic Acids Res. 2011, 39, W155–W159. [Google Scholar] [CrossRef]
- Bonnet, E.; He, Y.; Billiau, K.; Van de Peer, Y. TAPIR, a web server for the prediction of plant microRNA targets, including target mimics. Bioinformatics 2010, 26, 1566–1568. [Google Scholar] [CrossRef]
- Carmona-Saez, P.; Chagoyen, M.; Tirado, F.; Carazo, J.M.; Pascual-Montano, A. GENECODIS: A web-based tool for finding significant concurrent annotations in gene lists. Genome Biol. 2007, 8, R3. [Google Scholar] [CrossRef]
- Rodriguez, A.-M.; Elabd, C.; Delteil, F.; Astier, J.; Vernochet, C.; Saint-Marc, P.; Guesnet, J.; Guezennec, A.; Amri, E.-Z.; Dani, C.; et al. Adipocyte differentiation of multipotent cells established from human adipose tissue. Biochem. Biophys. Res. Commun. 2004, 315, 255–263. [Google Scholar] [CrossRef]
- Rodriguez, A.-M.; Pisani, D.; Dechesne, C.A.; Turc-Carel, C.; Kurzenne, J.-Y.; Wdziekonski, B.; Villageois, A.; Bagnis, C.; Breittmayer, J.-P.; Groux, H.; et al. Transplantation of a multipotent cell population from human adipose tissue induces dystrophin expression in the immunocompetent mdx mouse. J. Exp. Med. 2005, 201, 1397–1405. [Google Scholar] [CrossRef]
- Zaragosi, L.-E.; Ailhaud, G.; Dani, C. Autocrine fibroblast growth factor 2 signaling is critical for self-renewal of human multipotent adipose-derived stem cells. Stem Cells 2006, 24, 2412–2419. [Google Scholar] [CrossRef]
- Elabd, C.; Chiellini, C.; Carmona, M.; Galitzky, J.; Cochet, O.; Petersen, R.; Pénicaud, L.; Kristiansen, K.; Bouloumié, A.; Casteilla, L.; et al. Human multipotent adipose-derived stem cells differentiate into functional brown adipocytes. Stem Cells 2009, 27, 2753–2760. [Google Scholar] [CrossRef] [PubMed]
- Pisani, D.F.; Djedaini, M.; Beranger, G.E.; Elabd, C.; Scheideler, M.; Ailhaud, G.; Amri, E.-Z. Differentiation of Human Adipose-Derived Stem Cells into “Brite” (Brown-in-White) Adipocytes. Front. Endocrinol. 2011, 2, 87. [Google Scholar] [CrossRef] [PubMed]
- Zhang, W.-X.; Fan, J.; Ma, J.; Rao, Y.-S.; Zhang, L.; Yan, Y.-E. Selection of Suitable Reference Genes for Quantitative Real-Time PCR Normalization in Three Types of Rat Adipose Tissue. Int. J. Mol. Sci. 2016, 17, 968. [Google Scholar] [CrossRef] [PubMed]
- Livak, K.J.; Schmittgen, T.D. Analysis of relative gene expression data using real-time quantitative PCR and the 2(-Delta Delta C(T)) Method. Methods 2001, 25, 402–408. [Google Scholar] [CrossRef]
- Rao, X.; Huang, X.; Zhou, Z.; Lin, X. An improvement of the 2−ΔΔCT method for quantitative real-time polymerase chain reaction data analysis. Biostat. Bioinforma. Biomath. 2013, 3, 71–85. [Google Scholar]
- Barquissau, V.; Beuzelin, D.; Pisani, D.F.; Beranger, G.E.; Mairal, A.; Montagner, A.; Roussel, B.; Tavernier, G.; Marques, M.-A.; Moro, C.; et al. White-to-brite conversion in human adipocytes promotes metabolic reprogramming towards fatty acid anabolic and catabolic pathways. Mol. Metab. 2016, 5, 352–365. [Google Scholar] [CrossRef]
- Pisani, D.F.; Barquissau, V.; Chambard, J.-C.; Beuzelin, D.; Ghandour, R.A.; Giroud, M.; Mairal, A.; Pagnotta, S.; Cinti, S.; Langin, D.; et al. Mitochondrial fission is associated with UCP1 activity in human brite/beige adipocytes. Mol. Metab. 2018, 7, 35–44. [Google Scholar] [CrossRef]
- Bordicchia, M.; Liu, D.; Amri, E.-Z.; Ailhaud, G.; Dessì-Fulgheri, P.; Zhang, C.; Takahashi, N.; Sarzani, R.; Collins, S. Cardiac natriuretic peptides act via p38 MAPK to induce the brown fat thermogenic program in mouse and human adipocytes. J. Clin. Investig. 2012, 122, 1022–1036. [Google Scholar] [CrossRef]
- Alptekin, B.; Akpinar, B.A.; Budak, H. A Comprehensive Prescription for Plant miRNA Identification. Front. Plant Sci. 2016, 7, 2058. [Google Scholar] [CrossRef]
- Zhang, B.; Pan, X.; Cannon, C.H.; Cobb, G.P.; Anderson, T.A. Conservation and divergence of plant microRNA genes. Plant J. 2006, 46, 243–259. [Google Scholar] [CrossRef]
- Verde, I.; Abbott, A.G.; Scalabrin, S.; Jung, S.; Shu, S.; Marroni, F.; Zhebentyayeva, T.; Dettori, M.T.; Grimwood, J.; Cattonaro, F.; et al. The high-quality draft genome of peach (Prunus persica) identifies unique patterns of genetic diversity, domestication and genome evolution. Nat. Genet. 2013, 45, 487–494. [Google Scholar] [CrossRef] [PubMed]
- Srivastava, P.K.; Moturu, T.R.; Pandey, P.; Baldwin, I.T.; Pandey, S.P. A comparison of performance of plant miRNA target prediction tools and the characterization of features for genome-wide target prediction. BMC Genom. 2014, 15, 348. [Google Scholar] [CrossRef] [PubMed]
- He, Y.; Gong, L.; Fang, Y.; Zhan, Q.; Liu, H.-X.; Lu, Y.; Guo, G.L.; Lehman-McKeeman, L.; Fang, J.; Wan, Y.-J.Y. The role of retinoic acid in hepatic lipid homeostasis defined by genomic binding and transcriptome profiling. BMC Genom. 2013, 14, 575. [Google Scholar] [CrossRef]
- Shoucri, B.M.; Hung, V.T.; Chamorro-García, R.; Shioda, T.; Blumberg, B. Retinoid X Receptor Activation During Adipogenesis of Female Mesenchymal Stem Cells Programs a Dysfunctional Adipocyte. Endocrinology 2018, 159, 2863–2883. [Google Scholar] [CrossRef] [PubMed]
- Metzger, D.; Imai, T.; Jiang, M.; Takukawa, R.; Desvergne, B.; Wahli, W.; Chambon, P. Functional role of RXRs and PPARgamma in mature adipocytes. Prostaglandins. Leukot. Essent. Fatty Acids 2005, 73, 51–58. [Google Scholar] [CrossRef]
- Yamauchi, T.; Waki, H.; Kamon, J.; Murakami, K.; Motojima, K.; Komeda, K.; Miki, H.; Kubota, N.; Terauchi, Y.; Tsuchida, A.; et al. Inhibition of RXR and PPARgamma ameliorates diet-induced obesity and type 2 diabetes. J. Clin. Investig. 2001, 108, 1001–1013. [Google Scholar] [CrossRef]
- Gao, Z.; Shi, T.; Luo, X.; Zhang, Z.; Zhuang, W.; Wang, L. High-throughput sequencing of small RNAs and analysis of differentially expressed microRNAs associated with pistil development in Japanese apricot. BMC Genom. 2012, 13, 371. [Google Scholar] [CrossRef]
- Ahuja, H.S.; Szanto, A.; Nagy, L.; Davies, P.J.A. The retinoid X receptor and its ligands: Versatile regulators of metabolic function, cell differentiation and cell death. J. Biol. Regul. Homeost. Agents 2003, 17, 29–45. [Google Scholar]
- Li, B.; Cai, S.-Y.; Boyer, J.L. The role of the retinoid receptor, RAR/RXR heterodimer, in liver physiology. Biochim. Biophys. Acta Mol. Basis Dis. 2021, 1867, 166085. [Google Scholar] [CrossRef]
- Gao, M.; Bu, L.; Ma, Y.; Liu, D. Concurrent activation of liver X receptor and peroxisome proliferator-activated receptor alpha exacerbates hepatic steatosis in high fat diet-induced obese mice. PLoS ONE 2013, 8, e65641. [Google Scholar] [CrossRef]
- Ide, T.; Shimano, H.; Yoshikawa, T.; Yahagi, N.; Amemiya-Kudo, M.; Matsuzaka, T.; Nakakuki, M.; Yatoh, S.; Iizuka, Y.; Tomita, S.; et al. Cross-Talk between Peroxisome Proliferator-Activated Receptor (PPAR) α and Liver X Receptor (LXR) in Nutritional Regulation of Fatty Acid Metabolism. II. LXRs Suppress Lipid Degradation Gene Promoters through Inhibition of PPAR Signaling. Mol. Endocrinol. 2003, 17, 1255–1267. [Google Scholar] [CrossRef] [PubMed]
- Gao, W.-Y.; Chen, P.-Y.; Hsu, H.-J.; Lin, C.-Y.; Wu, M.-J.; Yen, J.-H. Tanshinone IIA Downregulates Lipogenic Gene Expression and Attenuates Lipid Accumulation through the Modulation of LXRα/SREBP1 Pathway in HepG2 Cells. Biomedicines 2021, 9, 326. [Google Scholar] [CrossRef] [PubMed]
- Yoshikawa, T.; Shimano, H.; Amemiya-Kudo, M.; Yahagi, N.; Hasty, A.H.; Matsuzaka, T.; Okazaki, H.; Tamura, Y.; Iizuka, Y.; Ohashi, K.; et al. Identification of liver X receptor-retinoid X receptor as an activator of the sterol regulatory element-binding protein 1c gene promoter. Mol. Cell. Biol. 2001, 21, 2991–3000. [Google Scholar] [CrossRef]
- Gan, M.; Chen, X.; Chen, Z.; Chen, L.; Zhang, S.; Zhao, Y.; Niu, L.; Li, X.; Shen, L.; Zhu, L. Genistein Alleviates High-Fat Diet-Induced Obesity by Inhibiting the Process of Gluconeogenesis in Mice. Nutrients 2022, 14, 1551. [Google Scholar] [CrossRef]
- Casteras, S.; Abdul-Wahed, A.; Soty, M.; Vulin, F.; Guillou, H.; Campana, M.; Le Stunff, H.; Pirola, L.; Rajas, F.; Mithieux, G.; et al. The suppression of hepatic glucose production improves metabolism and insulin sensitivity in subcutaneous adipose tissue in mice. Diabetologia 2016, 59, 2645–2653. [Google Scholar] [CrossRef] [PubMed]
- Im, S.-S.; Kim, M.-Y.; Kwon, S.-K.; Kim, T.-H.; Bae, J.-S.; Kim, H.; Kim, K.-S.; Oh, G.-T.; Ahn, Y.-H. Peroxisome proliferator-activated receptor {alpha} is responsible for the up-regulation of hepatic glucose-6-phosphatase gene expression in fasting and db/db Mice. J. Biol. Chem. 2011, 286, 1157–1164. [Google Scholar] [CrossRef]
- Grabner, G.F.; Xie, H.; Schweiger, M.; Zechner, R. Lipolysis: Cellular mechanisms for lipid mobilization from fat stores. Nat. Metab. 2021, 3, 1445–1465. [Google Scholar] [CrossRef]
- Kern, P.A.; Di Gregorio, G.; Lu, T.; Rassouli, N.; Ranganathan, G. Perilipin Expression in Human Adipose Tissue Is Elevated with Obesity. J. Clin. Endocrinol. Metab. 2004, 89, 1352–1358. [Google Scholar] [CrossRef]
- Jash, S.; Banerjee, S.; Lee, M.-J.; Farmer, S.R.; Puri, V. CIDEA Transcriptionally Regulates UCP1 for Britening and Thermogenesis in Human Fat Cells. iScience 2019, 20, 73–89. [Google Scholar] [CrossRef]
- Machado, S.A.; Pasquarelli-do-Nascimento, G.; da Silva, D.S.; Farias, G.R.; de Oliveira Santos, I.; Baptista, L.B.; Magalhães, K.G. Browning of the white adipose tissue regulation: New insights into nutritional and metabolic relevance in health and diseases. Nutr. Metab. 2022, 19, 61. [Google Scholar] [CrossRef]
- Bartelt, A.; Heeren, J. Adipose tissue browning and metabolic health. Nat. Rev. Endocrinol. 2014, 10, 24–36. [Google Scholar] [CrossRef] [PubMed]
- Pieri, M.; Theori, E.; Dweep, H.; Flourentzou, M.; Kalampalika, F.; Maniori, M.-A.; Papagregoriou, G.; Papaneophytou, C.; Felekkis, K. A bovine miRNA, bta-miR-154c, withstands in vitro human digestion but does not affect cell viability of colorectal human cell lines after transfection. FEBS Open Bio 2022, 12, 925–936. [Google Scholar] [CrossRef] [PubMed]
- Xiao, X.; Sticht, C.; Yin, L.; Liu, L.; Karakhanova, S.; Yin, Y.; Georgikou, C.; Gladkich, J.; Gross, W.; Gretz, N.; et al. Novel plant microRNAs from broccoletti sprouts do not show cross-kingdom regulation of pancreatic cancer. Oncotarget 2020, 11, 1203–1217. [Google Scholar] [CrossRef] [PubMed][Green Version]
- Wang, S.; Soni, K.G.; Semache, M.; Casavant, S.; Fortier, M.; Pan, L.; Mitchell, G.A. Lipolysis and the integrated physiology of lipid energy metabolism. Mol. Genet. Metab. 2008, 95, 117–126. [Google Scholar] [CrossRef]
- Chen, X.; Zhao, W.; Yuan, Y.; Bai, Y.; Sun, Y.; Zhu, W.; Du, Z. MicroRNAs tend to synergistically control expression of genes encoding extensively-expressed proteins in humans. PeerJ 2017, 5, e3682. [Google Scholar] [CrossRef]
- Zhang, B.; Pan, X.; Cobb, G.P.; Anderson, T.A. Plant microRNA: A small regulatory molecule with big impact. Dev. Biol. 2006, 289, 3–16. [Google Scholar] [CrossRef]
- Ha, M.; Pang, M.; Agarwal, V.; Chen, Z.J. Interspecies regulation of microRNAs and their targets. Biochim. Biophys. Acta 2008, 1779, 735–742. [Google Scholar] [CrossRef]


Disclaimer/Publisher’s Note: The statements, opinions and data contained in all publications are solely those of the individual author(s) and contributor(s) and not of MDPI and/or the editor(s). MDPI and/or the editor(s) disclaim responsibility for any injury to people or property resulting from any ideas, methods, instructions or products referred to in the content. |
© 2024 by the authors. Licensee MDPI, Basel, Switzerland. This article is an open access article distributed under the terms and conditions of the Creative Commons Attribution (CC BY) license (https://creativecommons.org/licenses/by/4.0/).