

Potential Association Between Atherogenic Coefficient, Prognostic Nutritional Index, and Various Obesity Indices in Diabetic Nephropathy

 ,
,  , ,
, ,  , , ,
, , ,  ,
, Highlights
- This study is the first to concurrently evaluate the atherogenic coefficient (AC) and prognostic nutritional index (PNI) as integrated markers for assessing diabetic nephropathy (DN) in patients with newly diagnosed type 2 diabetes mellitus (T2DM) and prediabetes (PreDM).
- Elevated AC in T2DM patients was significantly associated with adverse lipid profiles, including increased total cholesterol, LDL-C, and triglycerides, and it was correlated with heightened systemic inflammatory markers.
- T2DM patients demonstrated significantly reduced PNI values, indicative of mild malnutrition, with notable decreases in serum albumin and lymphocyte counts despite the presence of elevated obesity indices.
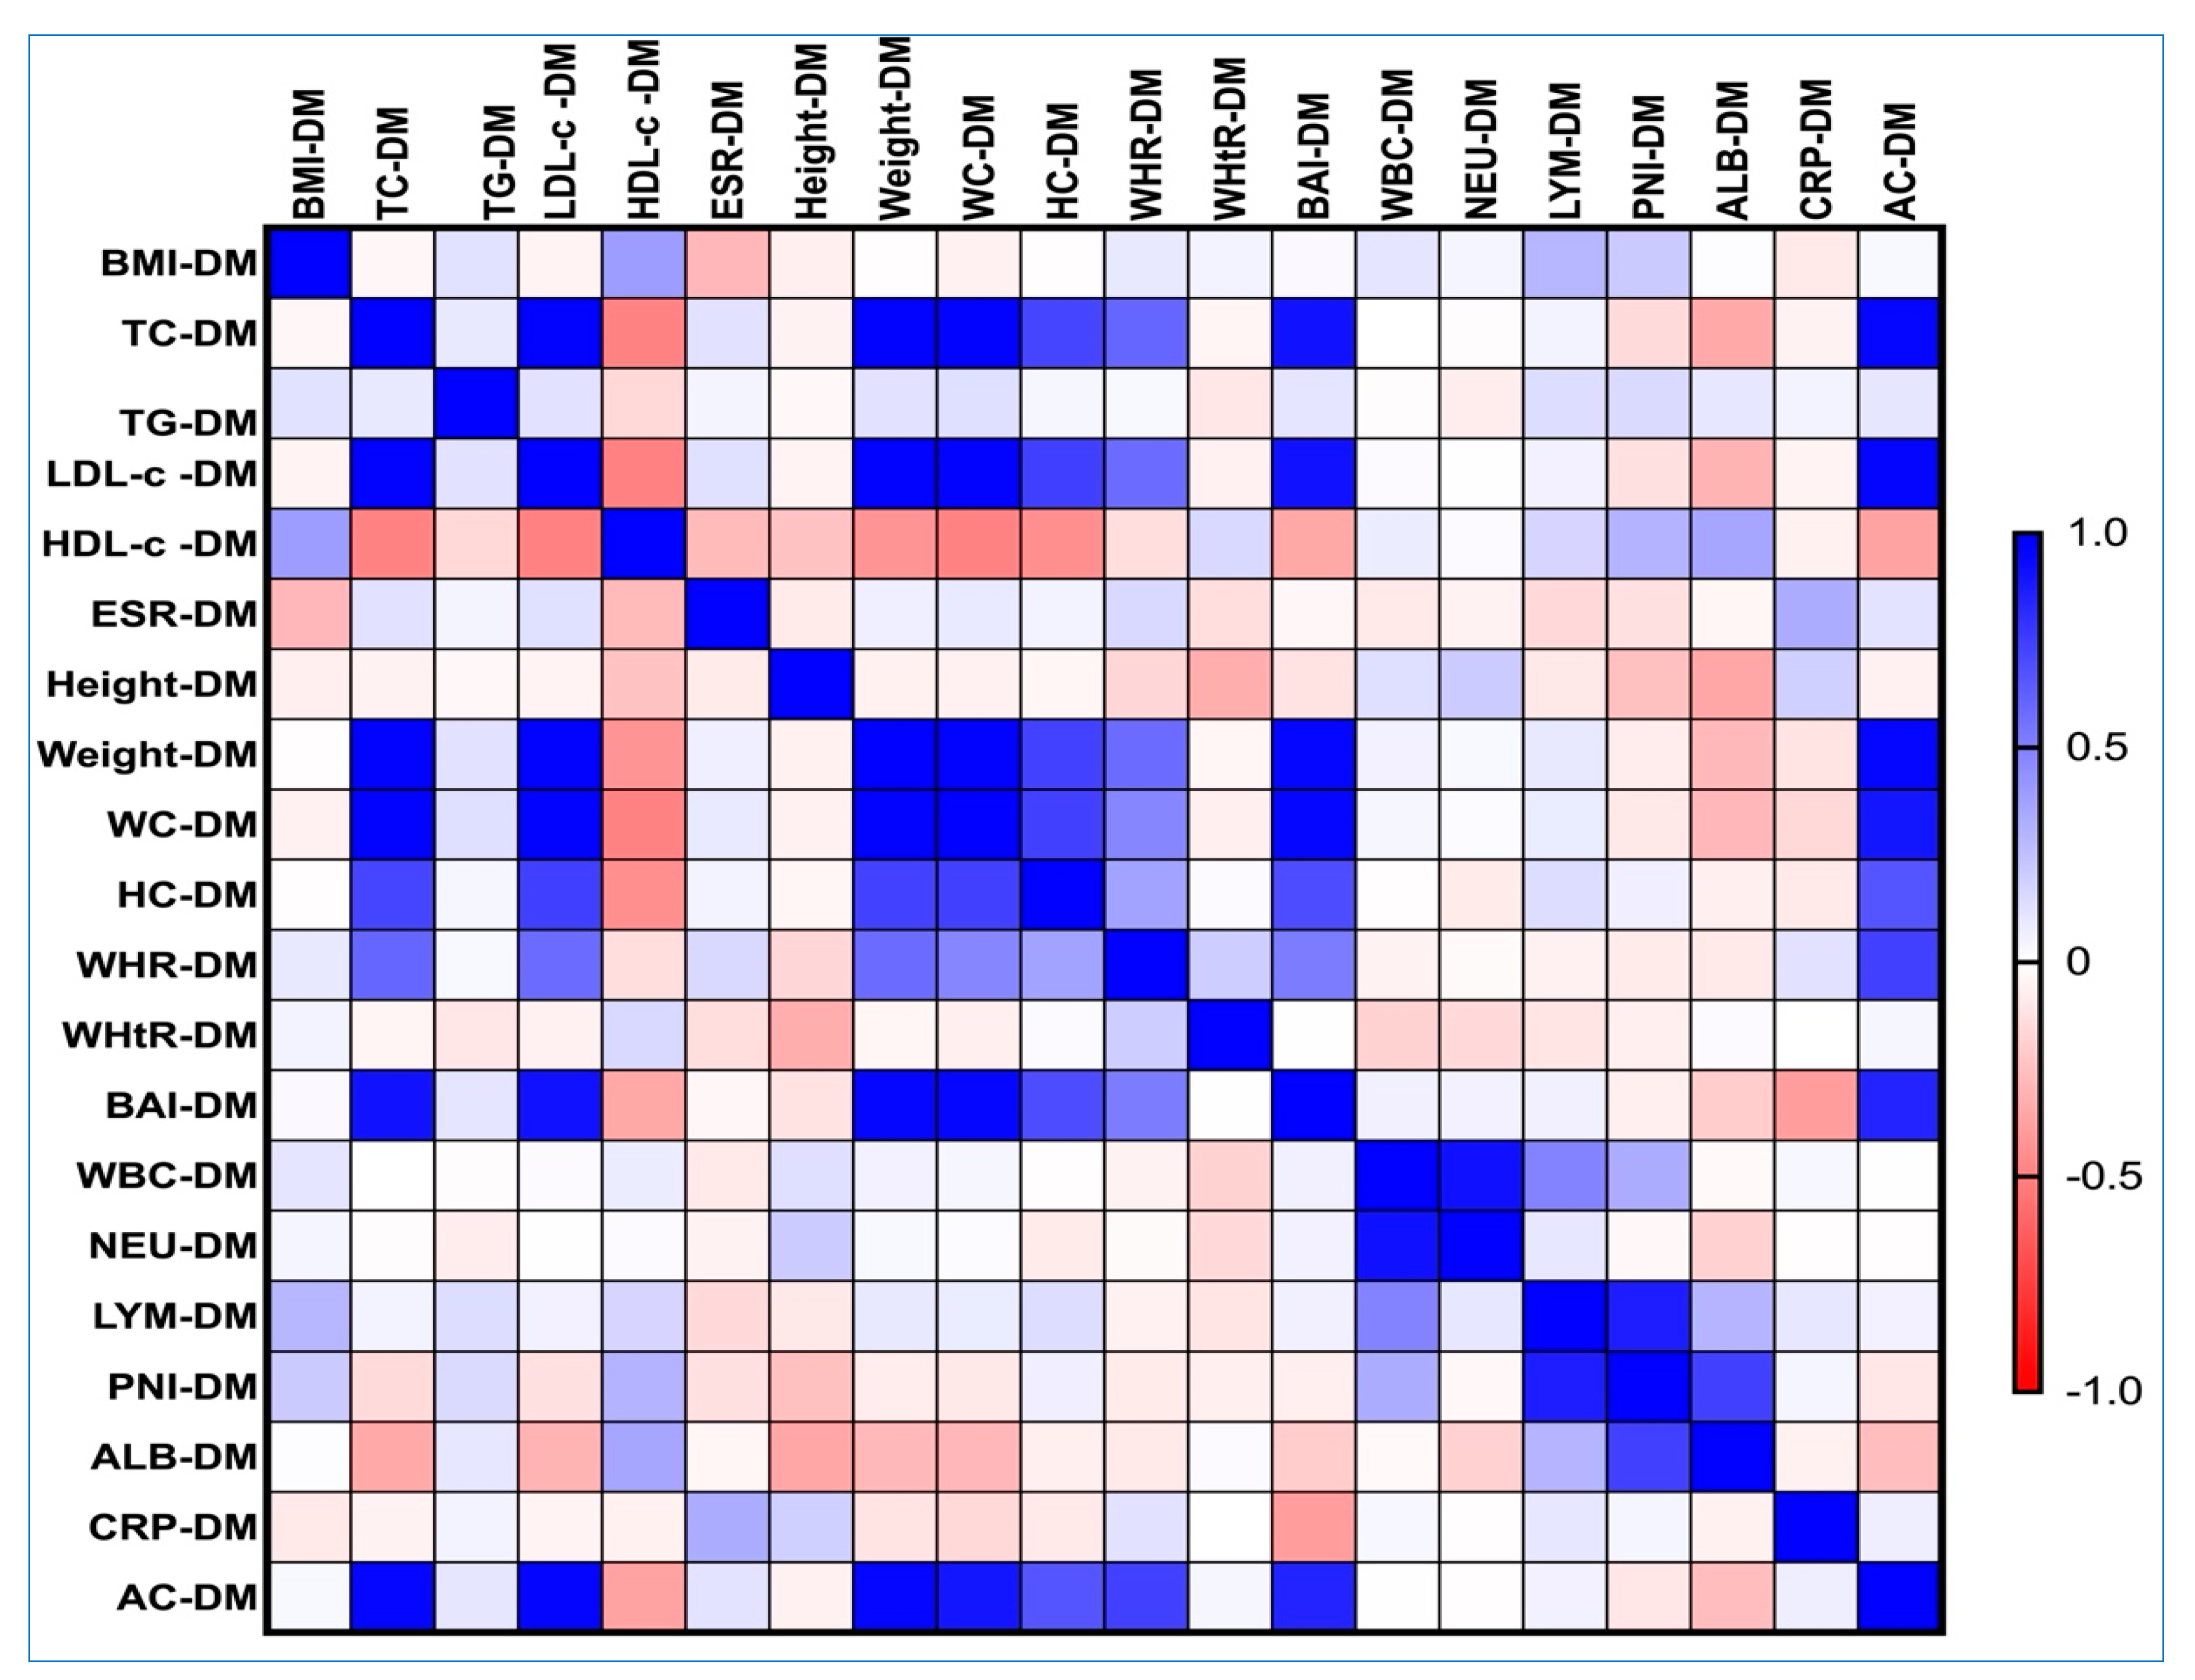
- Strong correlations were identified between obesity-related indices—including the visceral adiposity index (VAI), body adiposity index (BAI), waist-to-hip ratio (WHR), and waist-to-height ratio (WHtR)—and AC, underscoring their utility in evaluating atherogenic and metabolic burden in diabetic populations.
- Findings support the clinical relevance of AC and PNI as biomarkers for cardiometabolic risk stratification, providing a multidimensional perspective on nutritional, immunological, and lipemic alterations in early-stage diabetic nephropathy.
Abstract
:
1. Introduction
2. Materials and Methods
2.1. Selection of Patients, Evaluation of Medical History, Assessment of Biometric Parameters, and Collection of Demographic Data
2.2. Evaluation of Diabetes and Prediabetes
2.3. Assessment of Different Indices Related to Obesity (BMI, WHR, WHtR, BAI, and VAI)
2.4. Laboratory Investigations
2.5. Calculations of the Prognostic Nutritional Index and Atherogenic Coefficient Score
2.6. Statistical Analysis
3. Results
3.1. An In-Depth Exploration of the Clinical and Demographic Profiles of Individuals Diagnosed with Prediabetes and Diabetes
3.2. Comparative Analysis of Clinical Characteristics Among the Atherogenic Coefficient AC in People with Pre-Diabetes and Type 2 Diabetes Mellitus
3.3. Comparative Analysis of Clinical Characteristics Among the Prognostic Nutritional Index PNI in Individuals with Pre-Diabetes and Type 2 Diabetes Mellitus
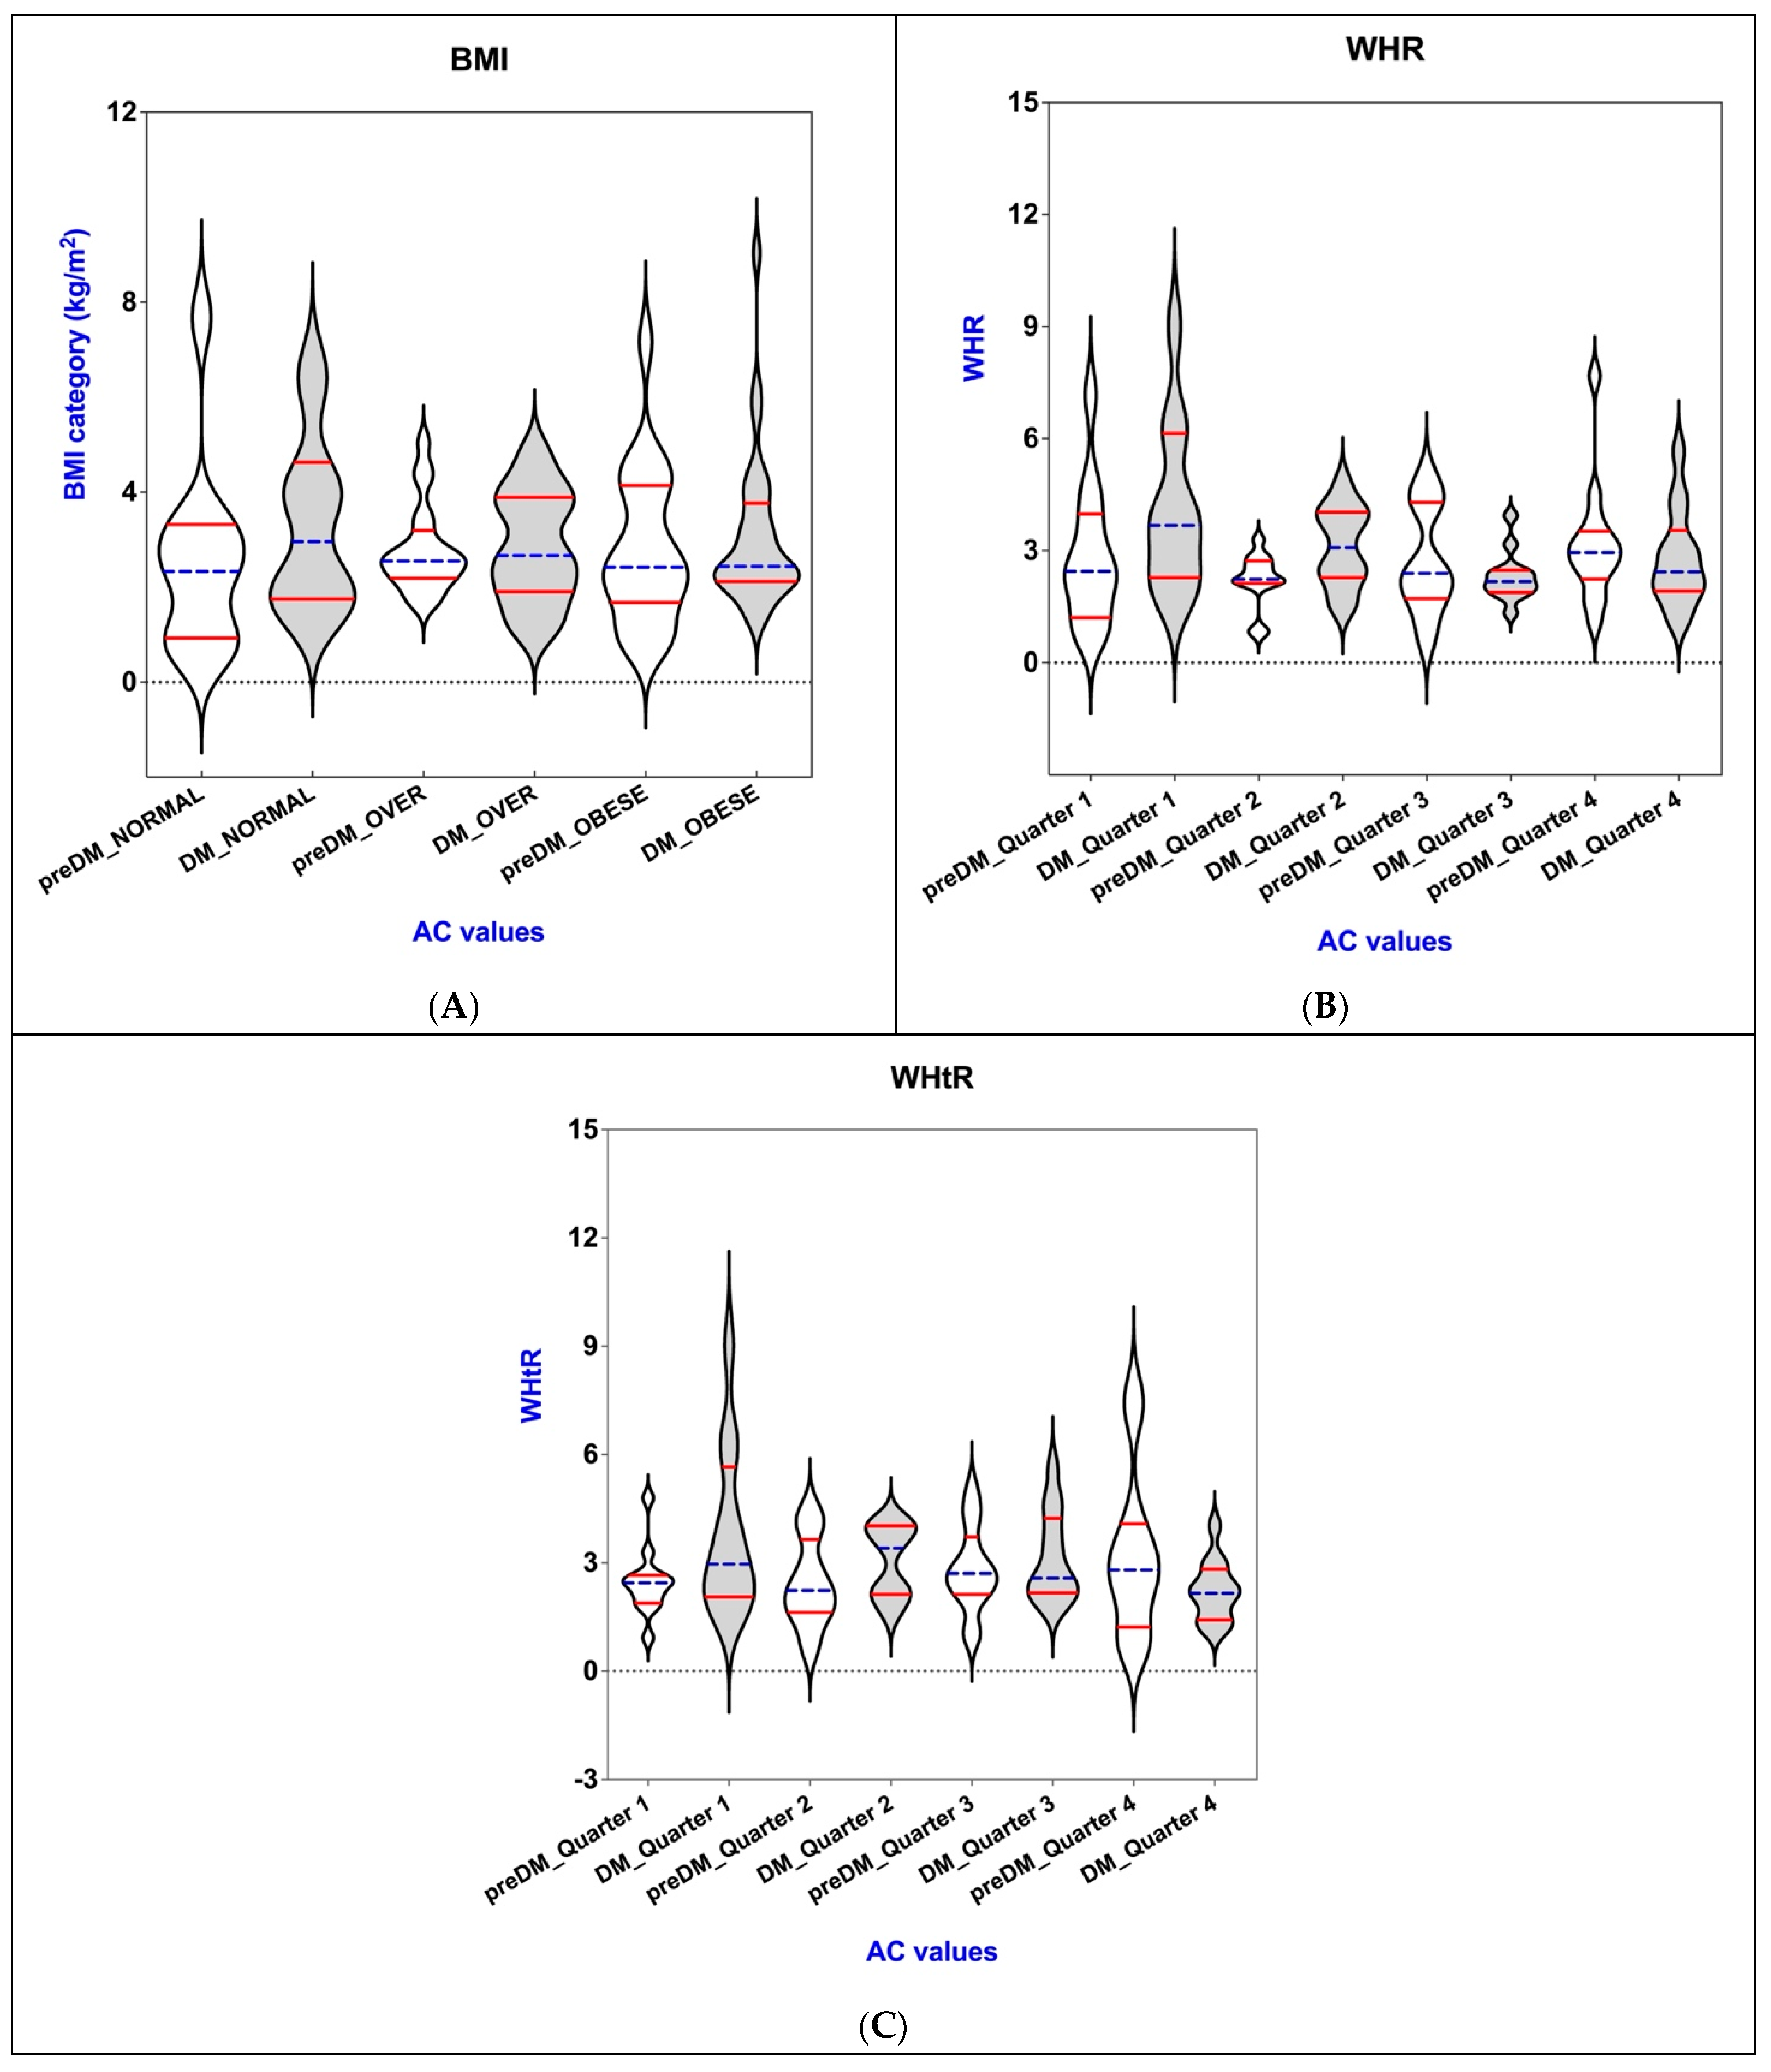
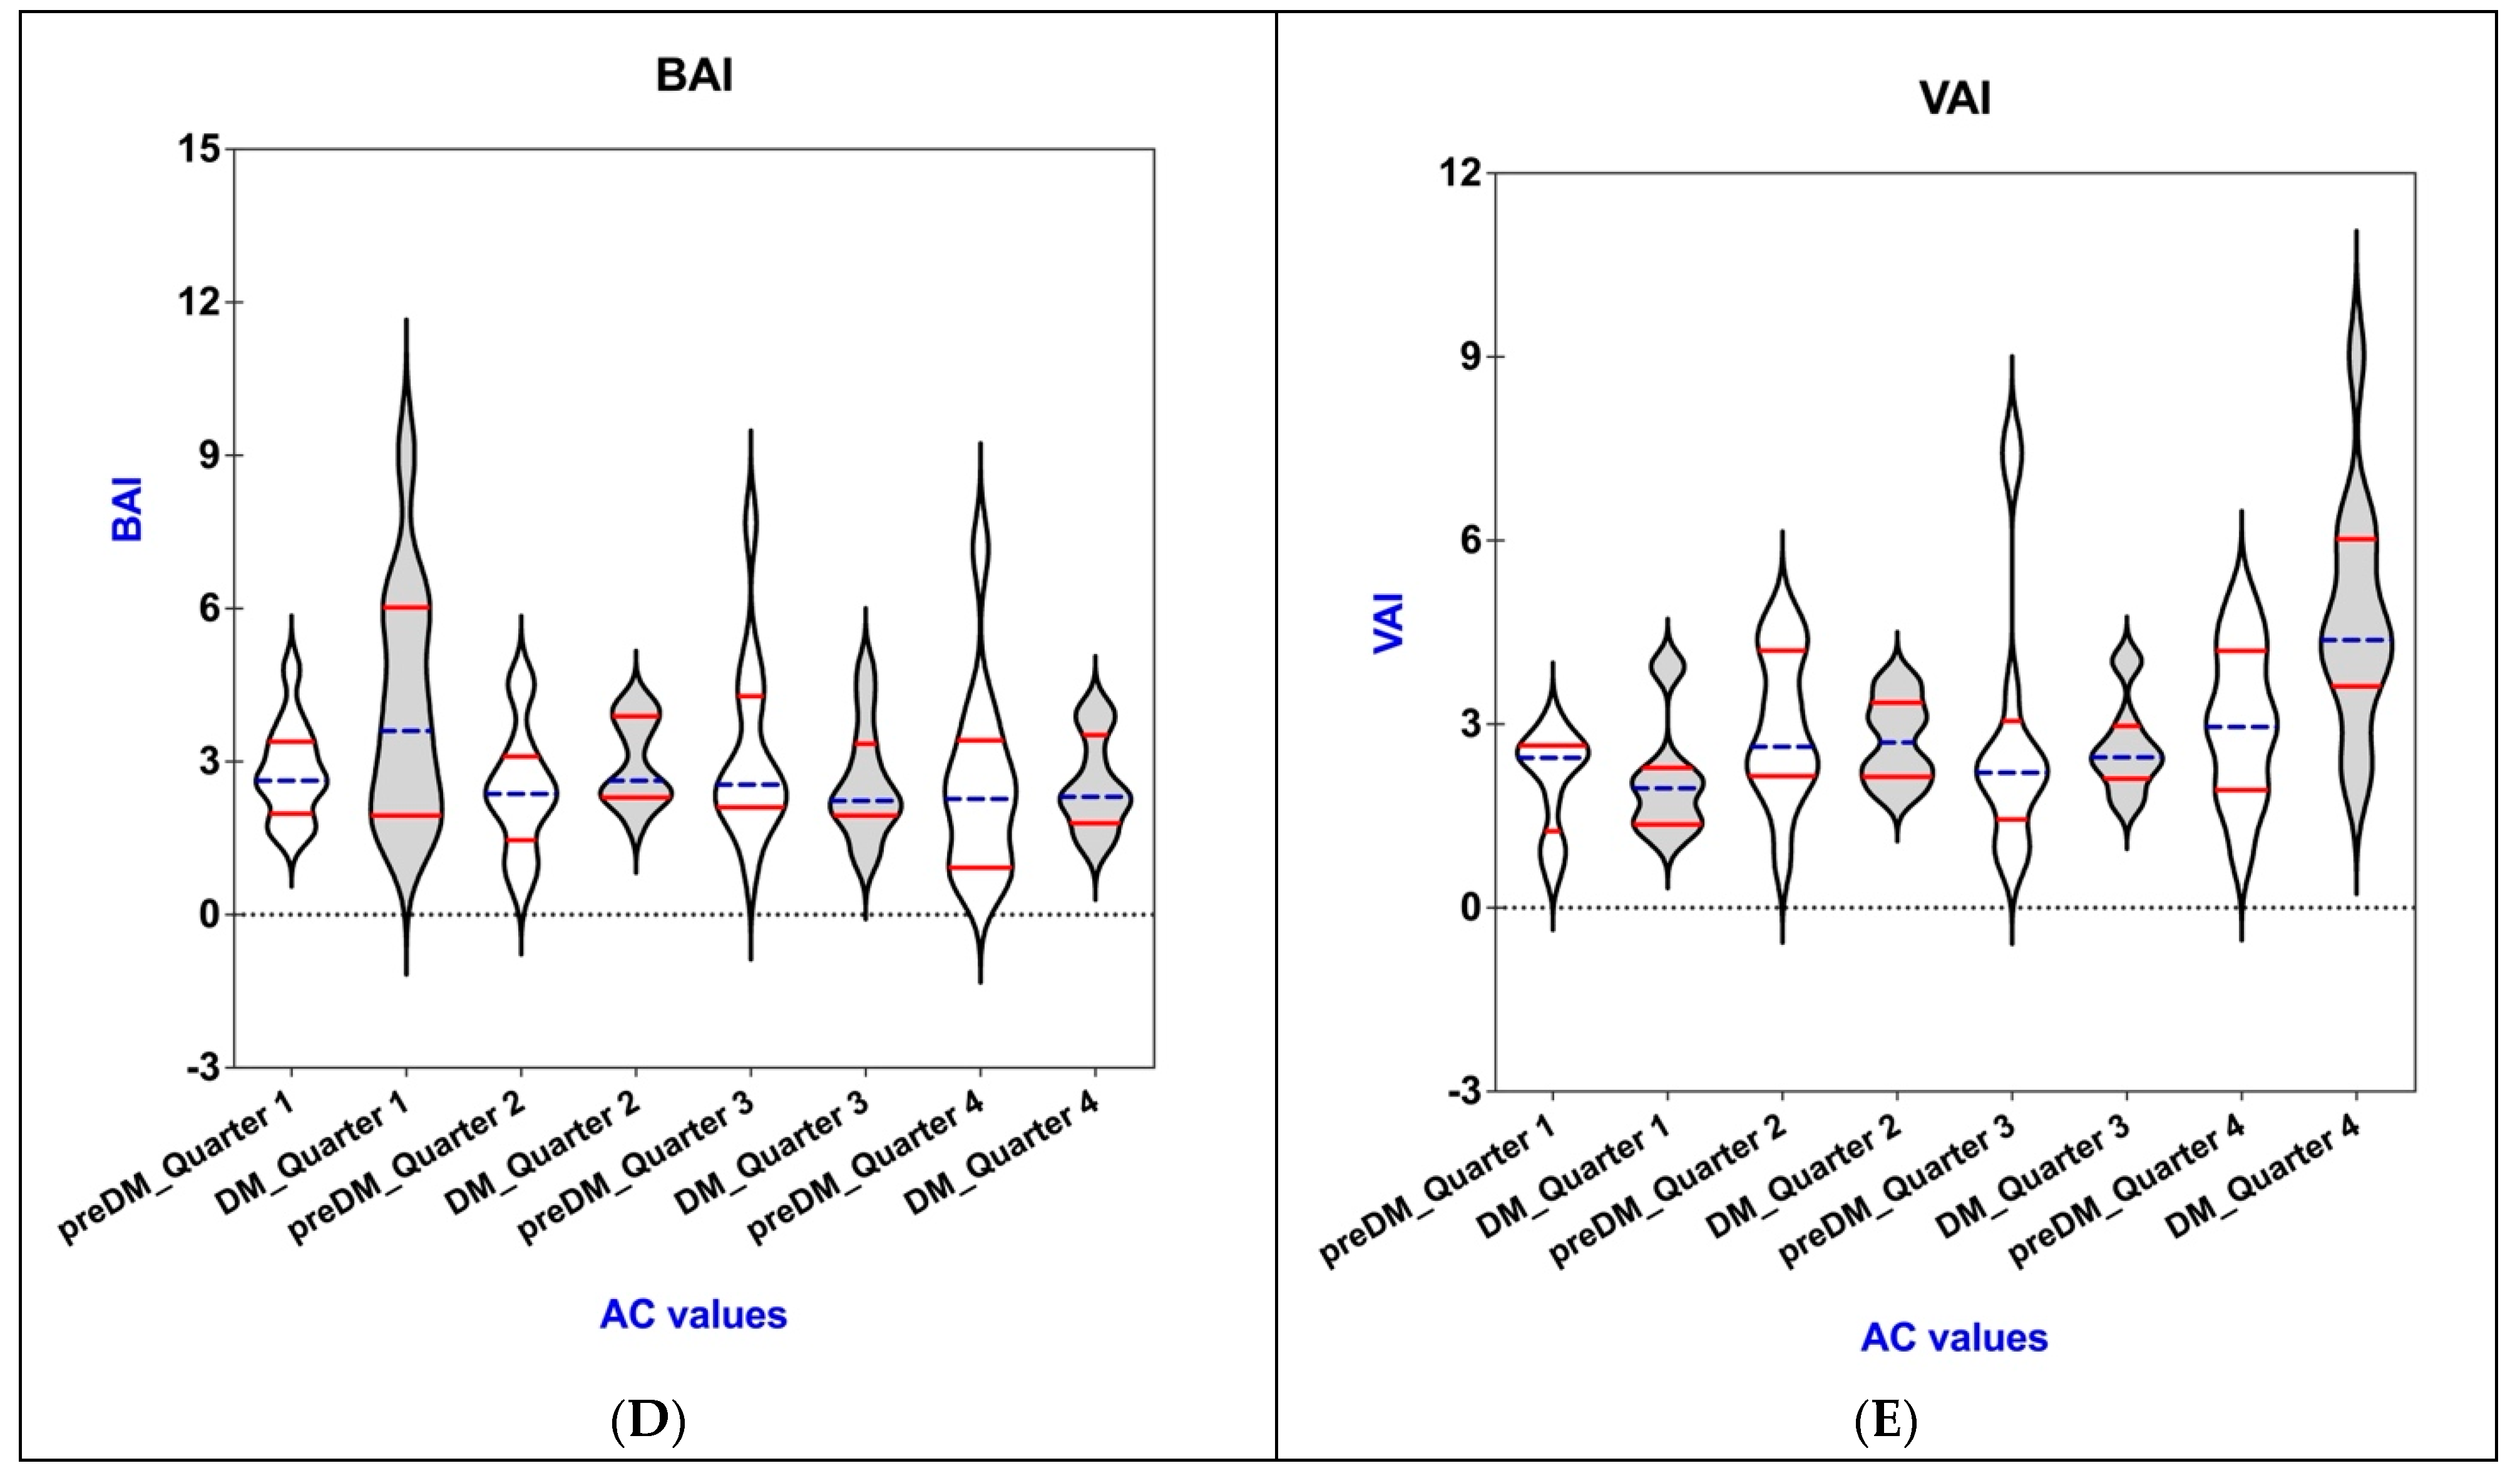
3.4. Connections of AC with BAI, VAI, WHR, WHtR, and BMI in the PreDM and T2DM Groups
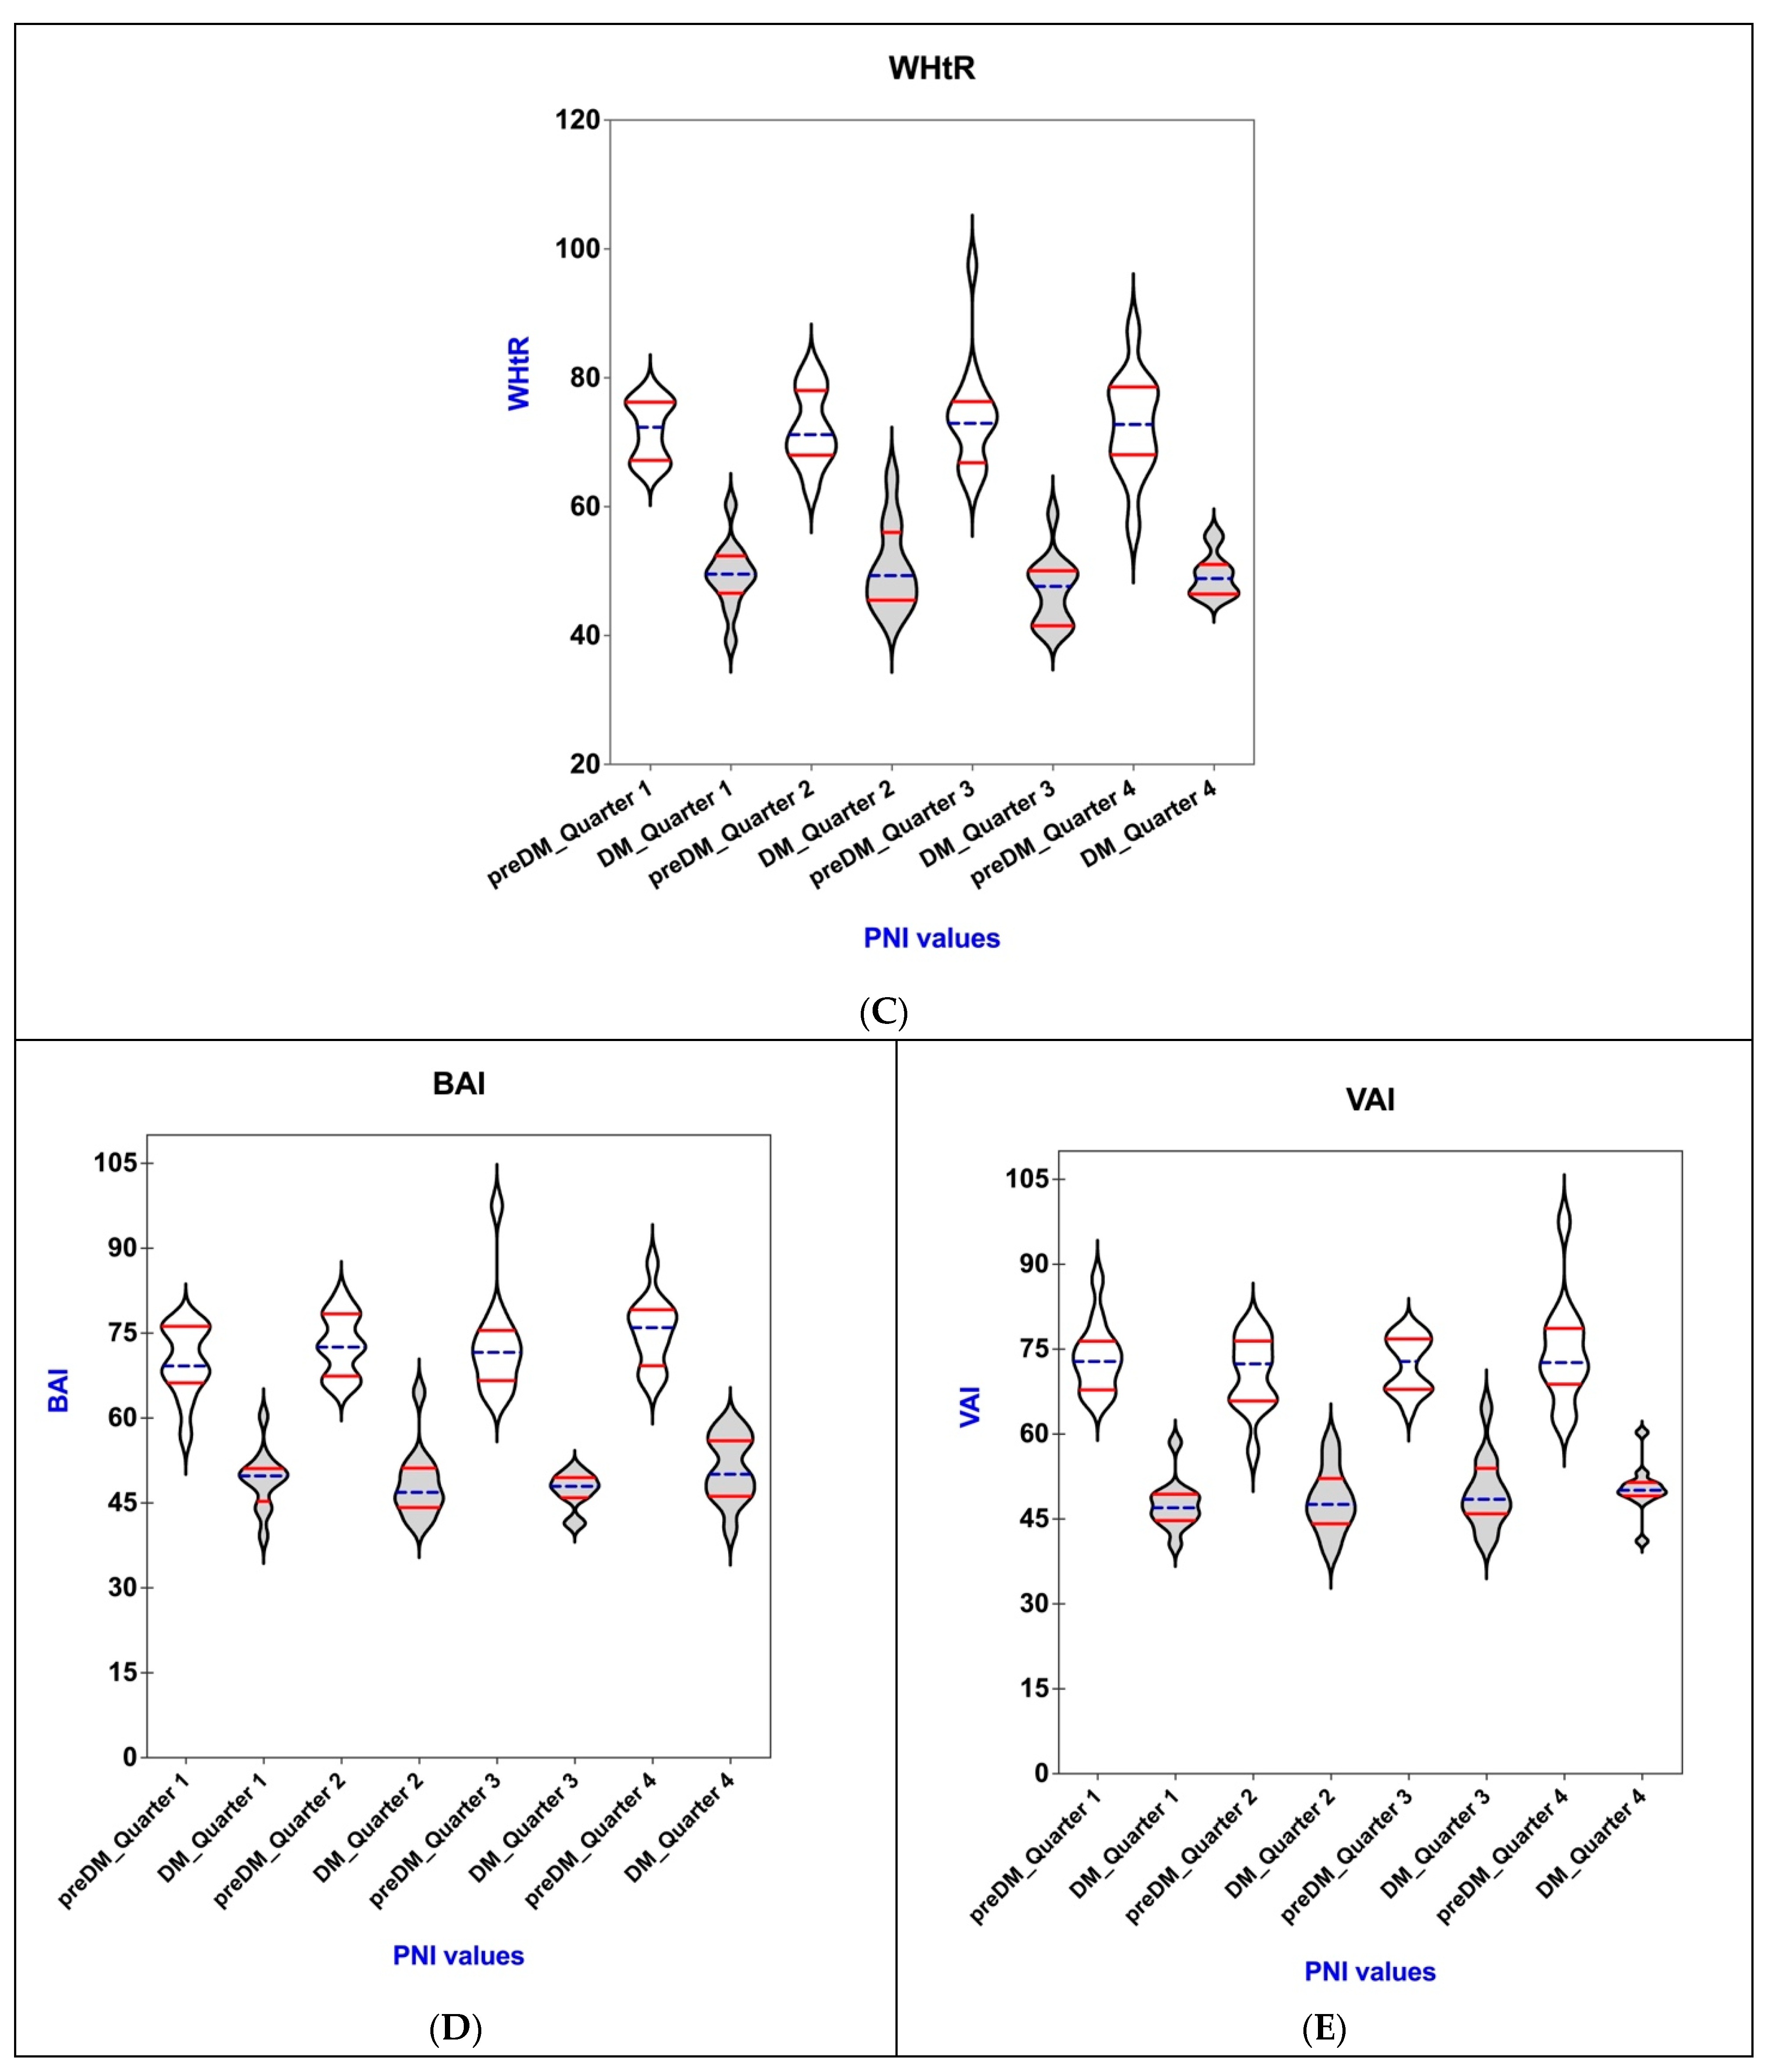
3.5. Connections of PNI with BAI, VAI, WHR, WHtR, and BMI in the PreDM and T2DM Groups
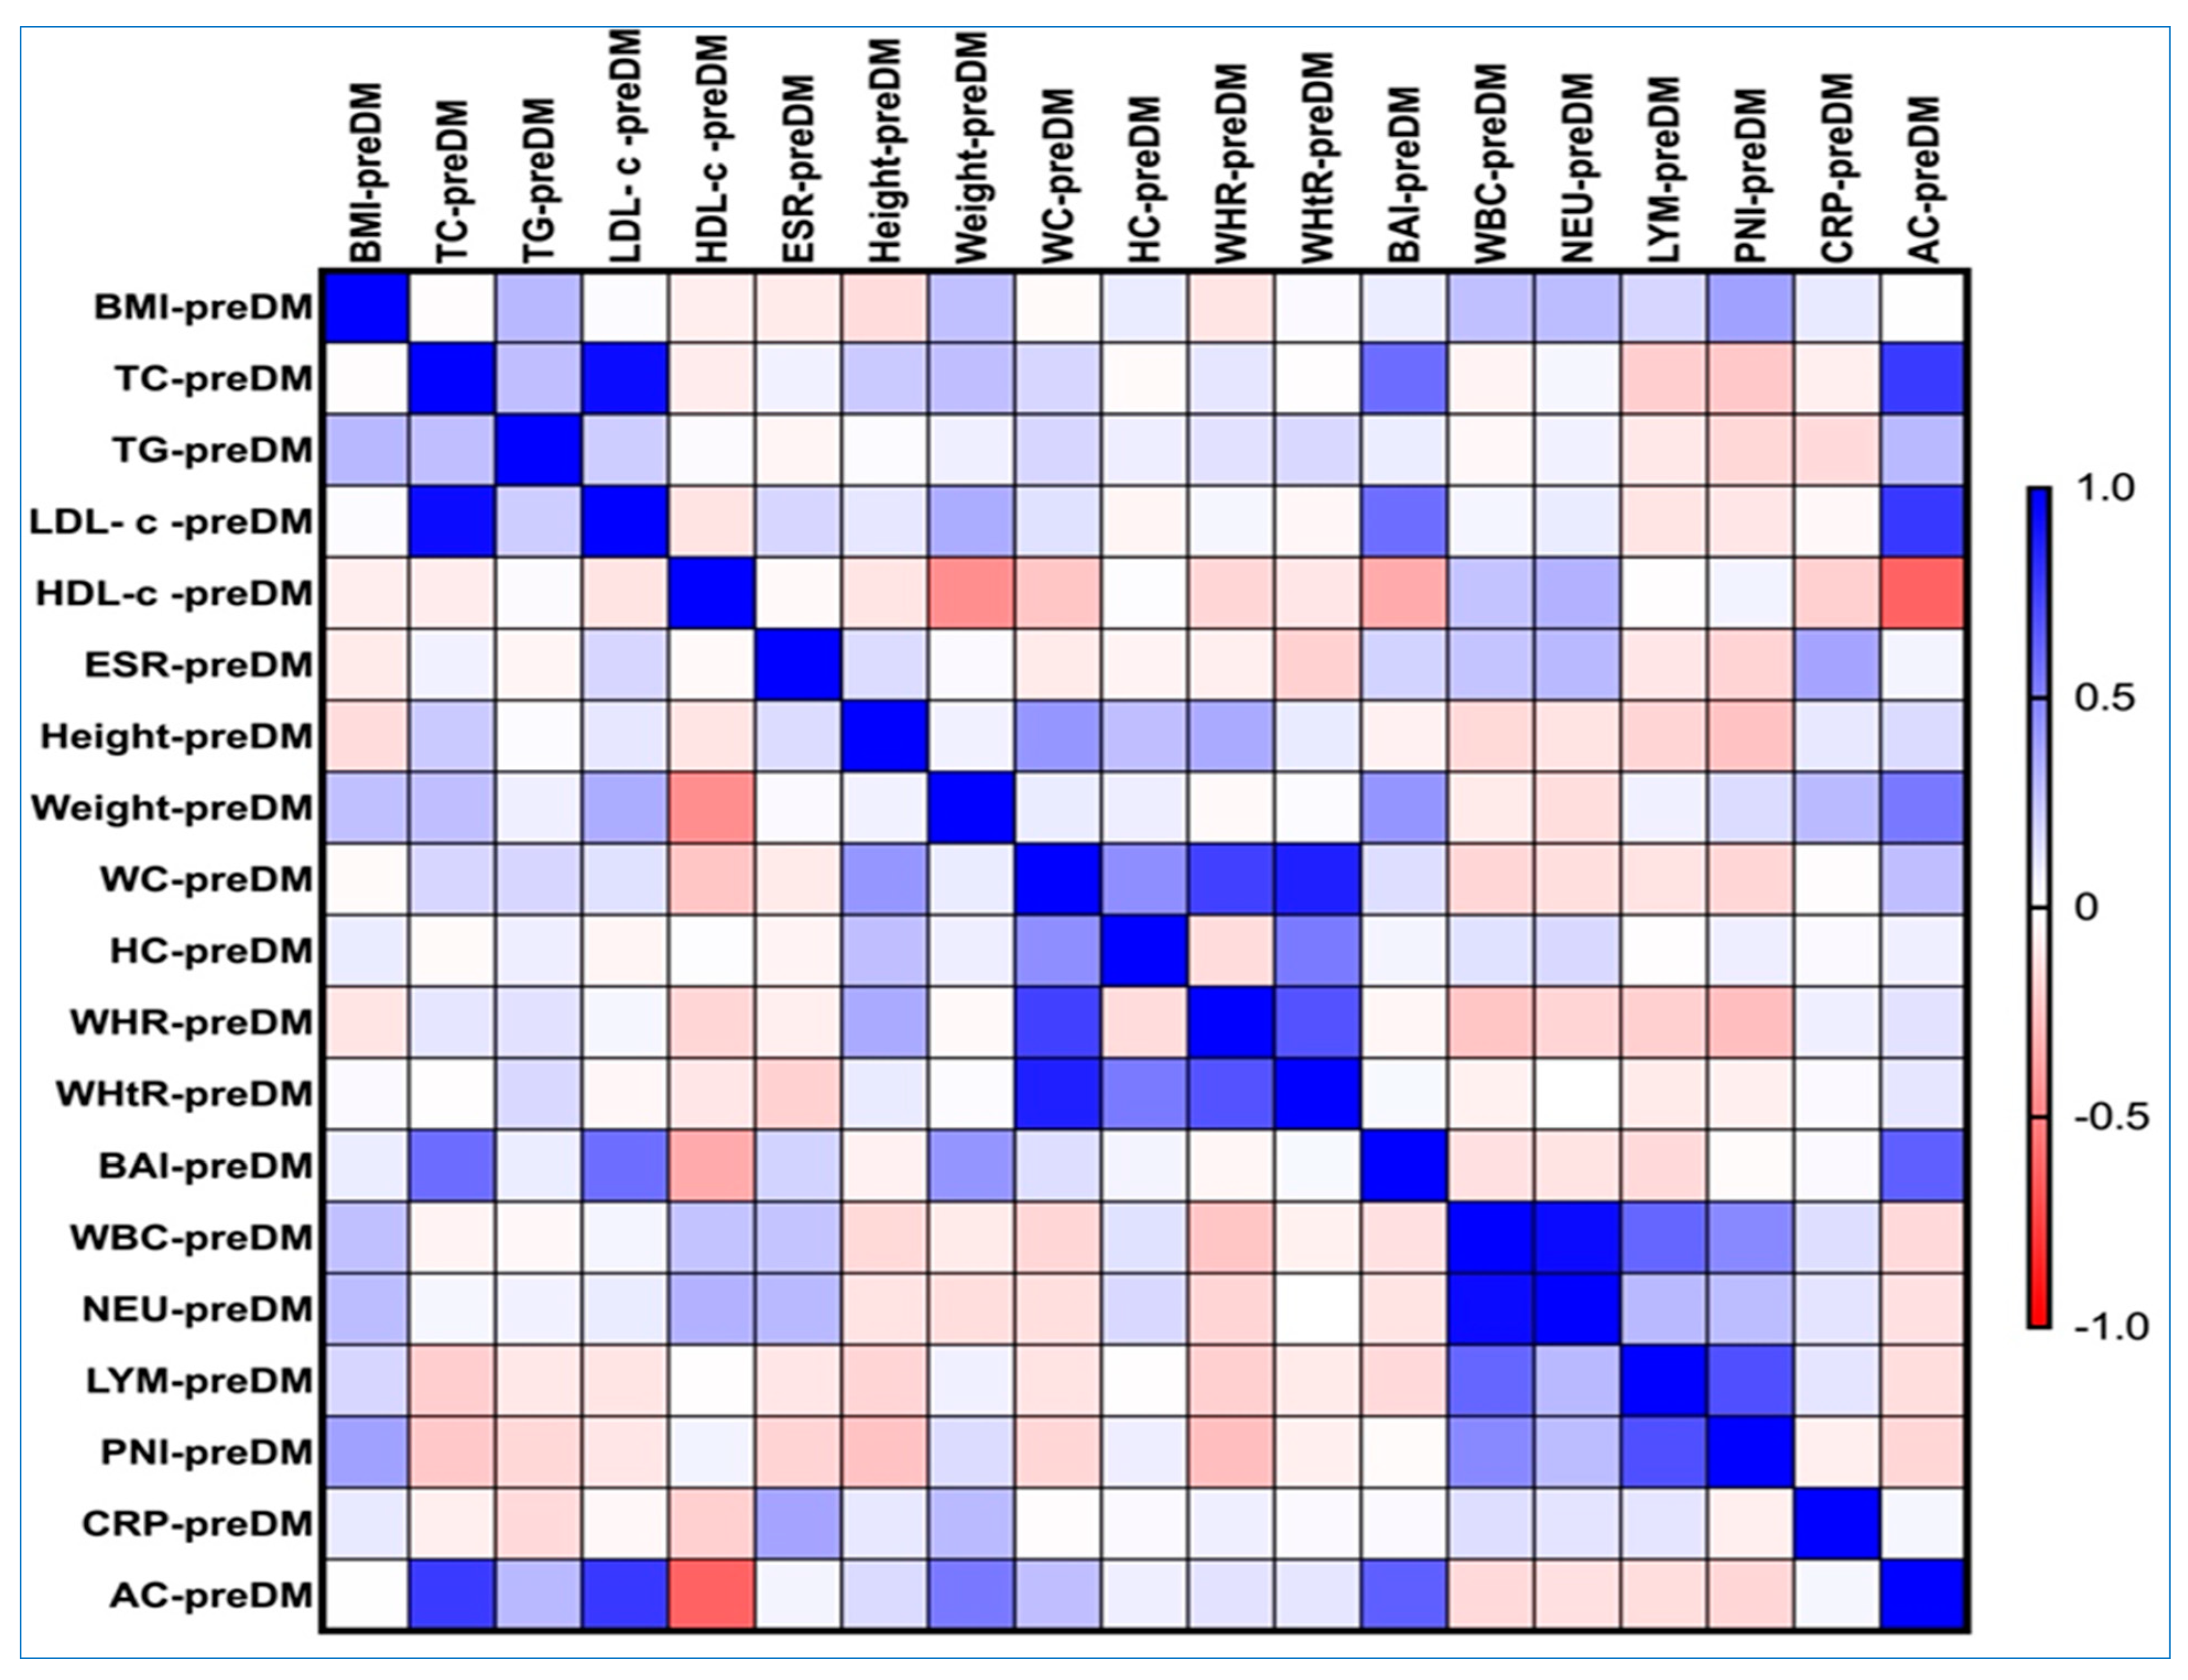
3.6. Correlations Between AC, Obesity-Related Indices, and Lipemic Profile in the PreDM and T2DM Groups
3.7. Comparative Analysis of Clinical Features Between Subgroups of Females and Males in Pre-Diabetes and Type 2 Diabetes Mellitus Groups
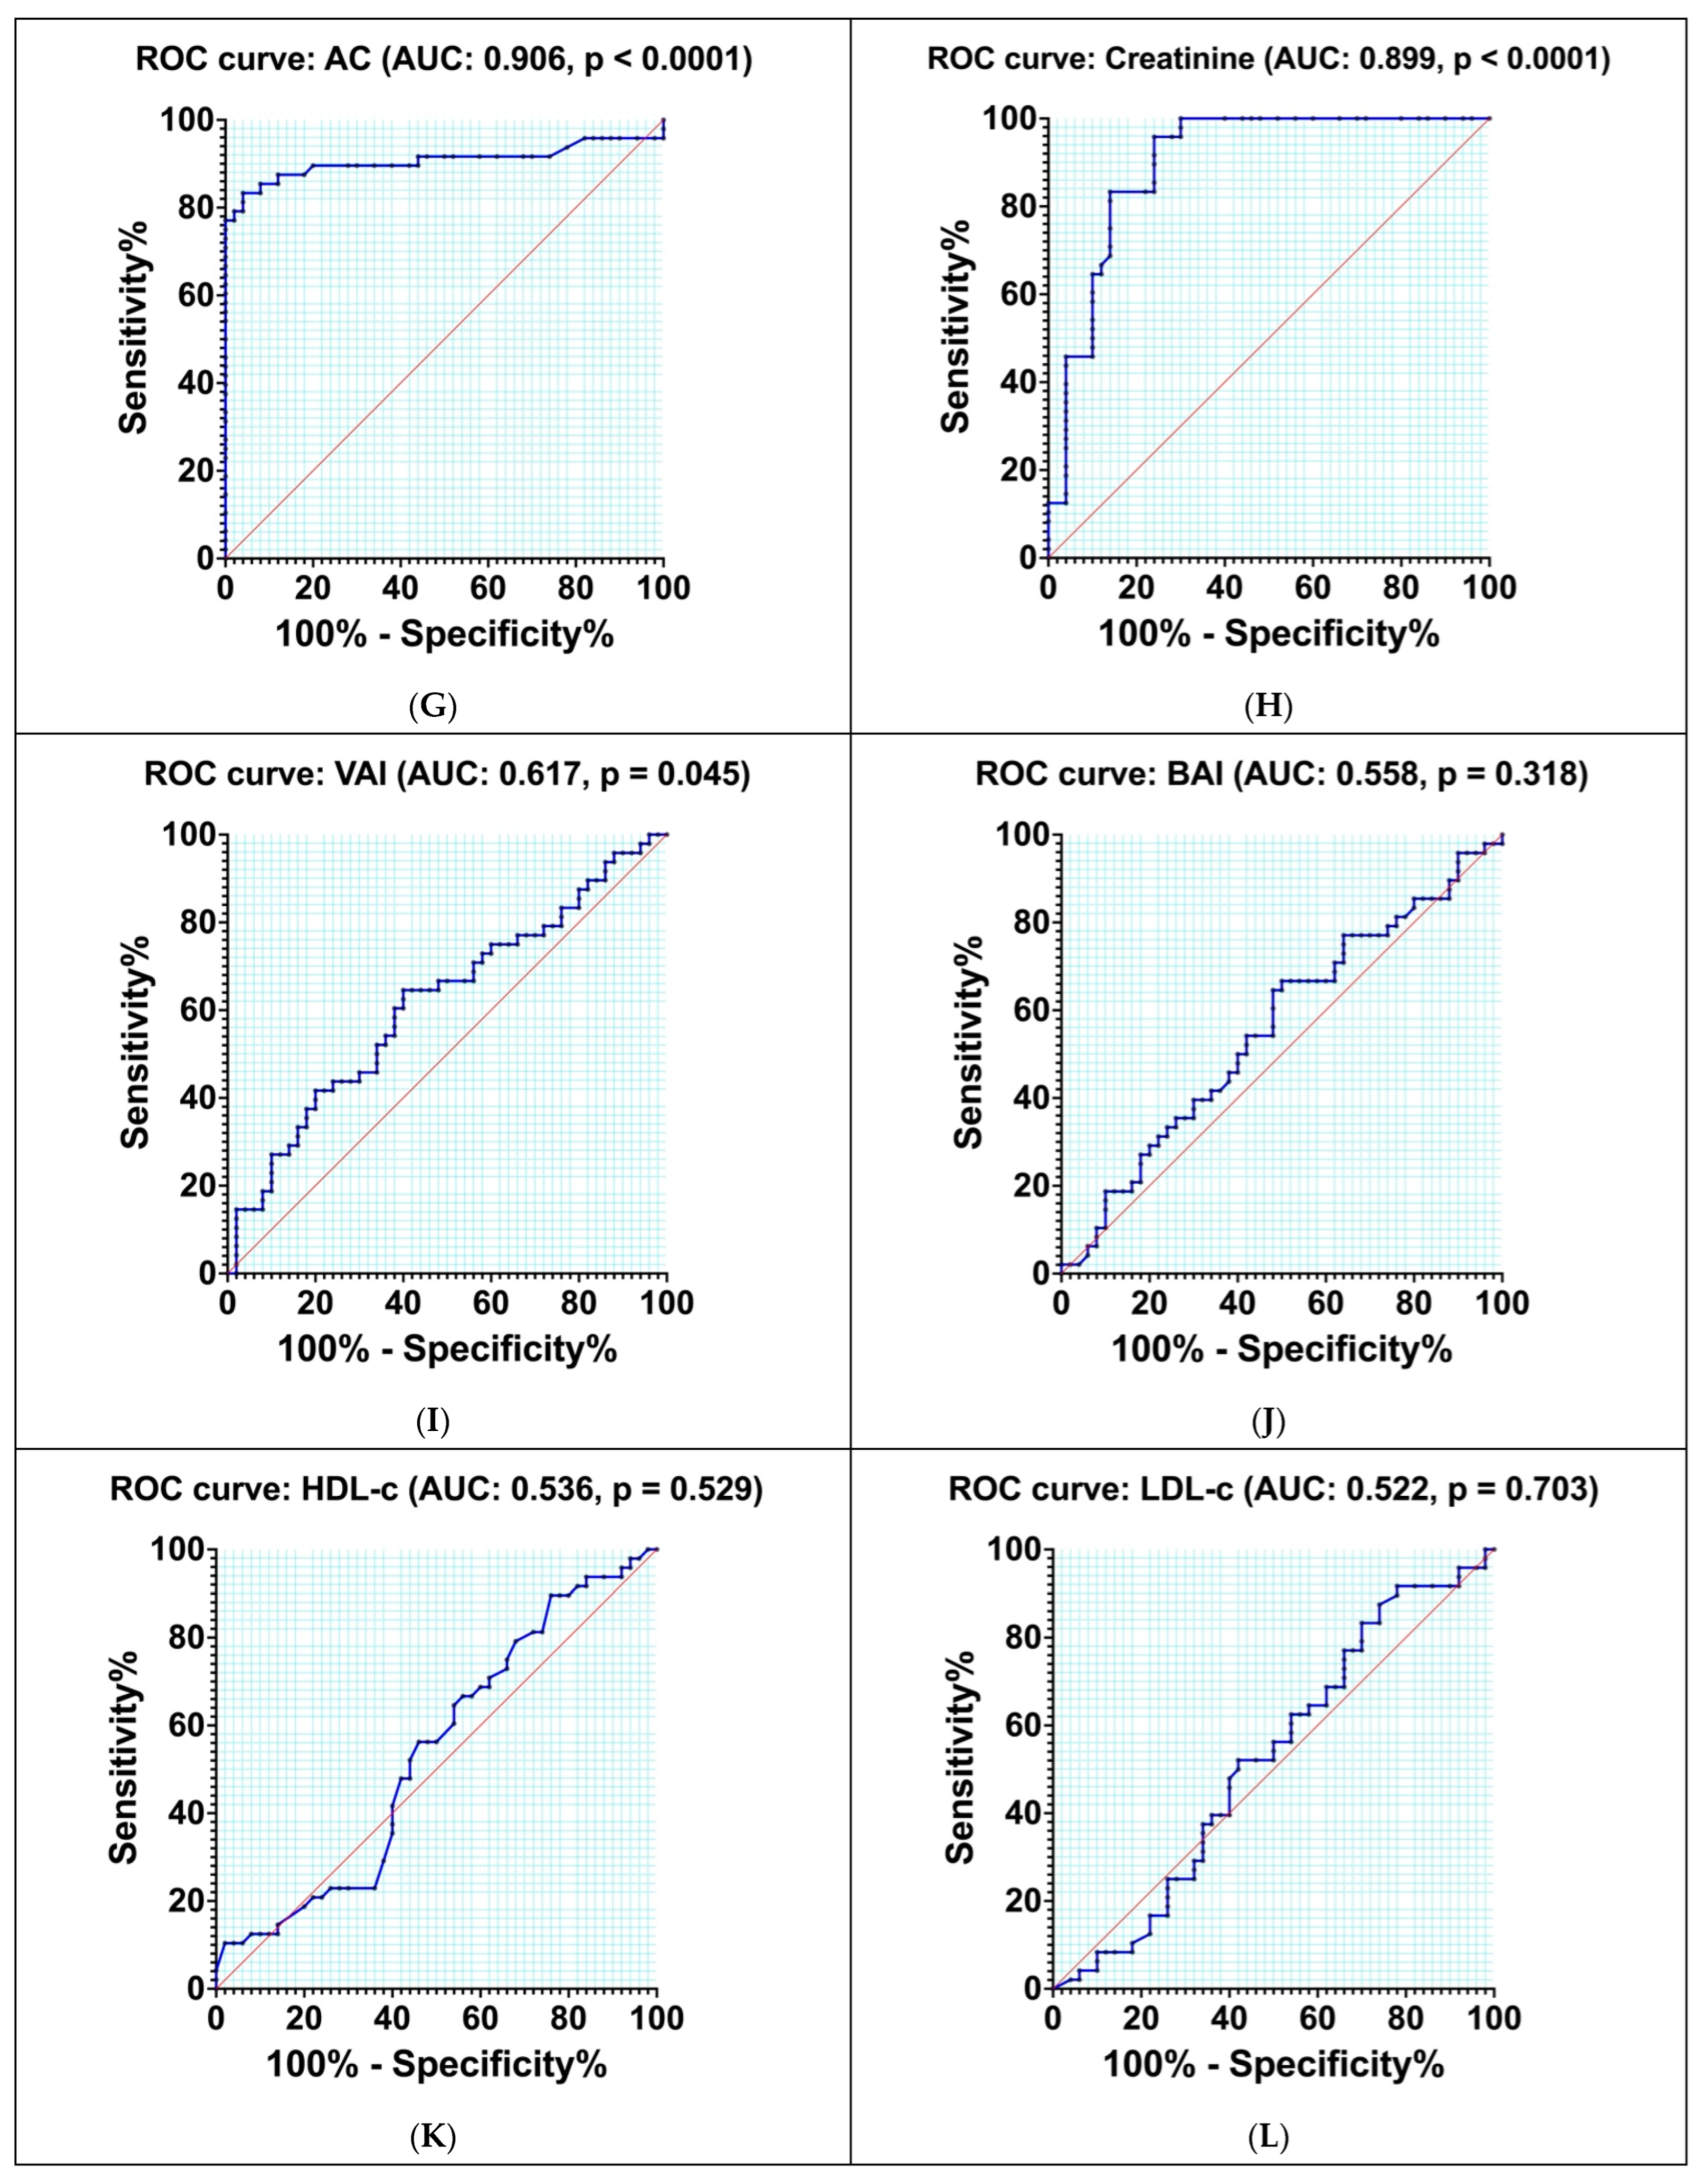
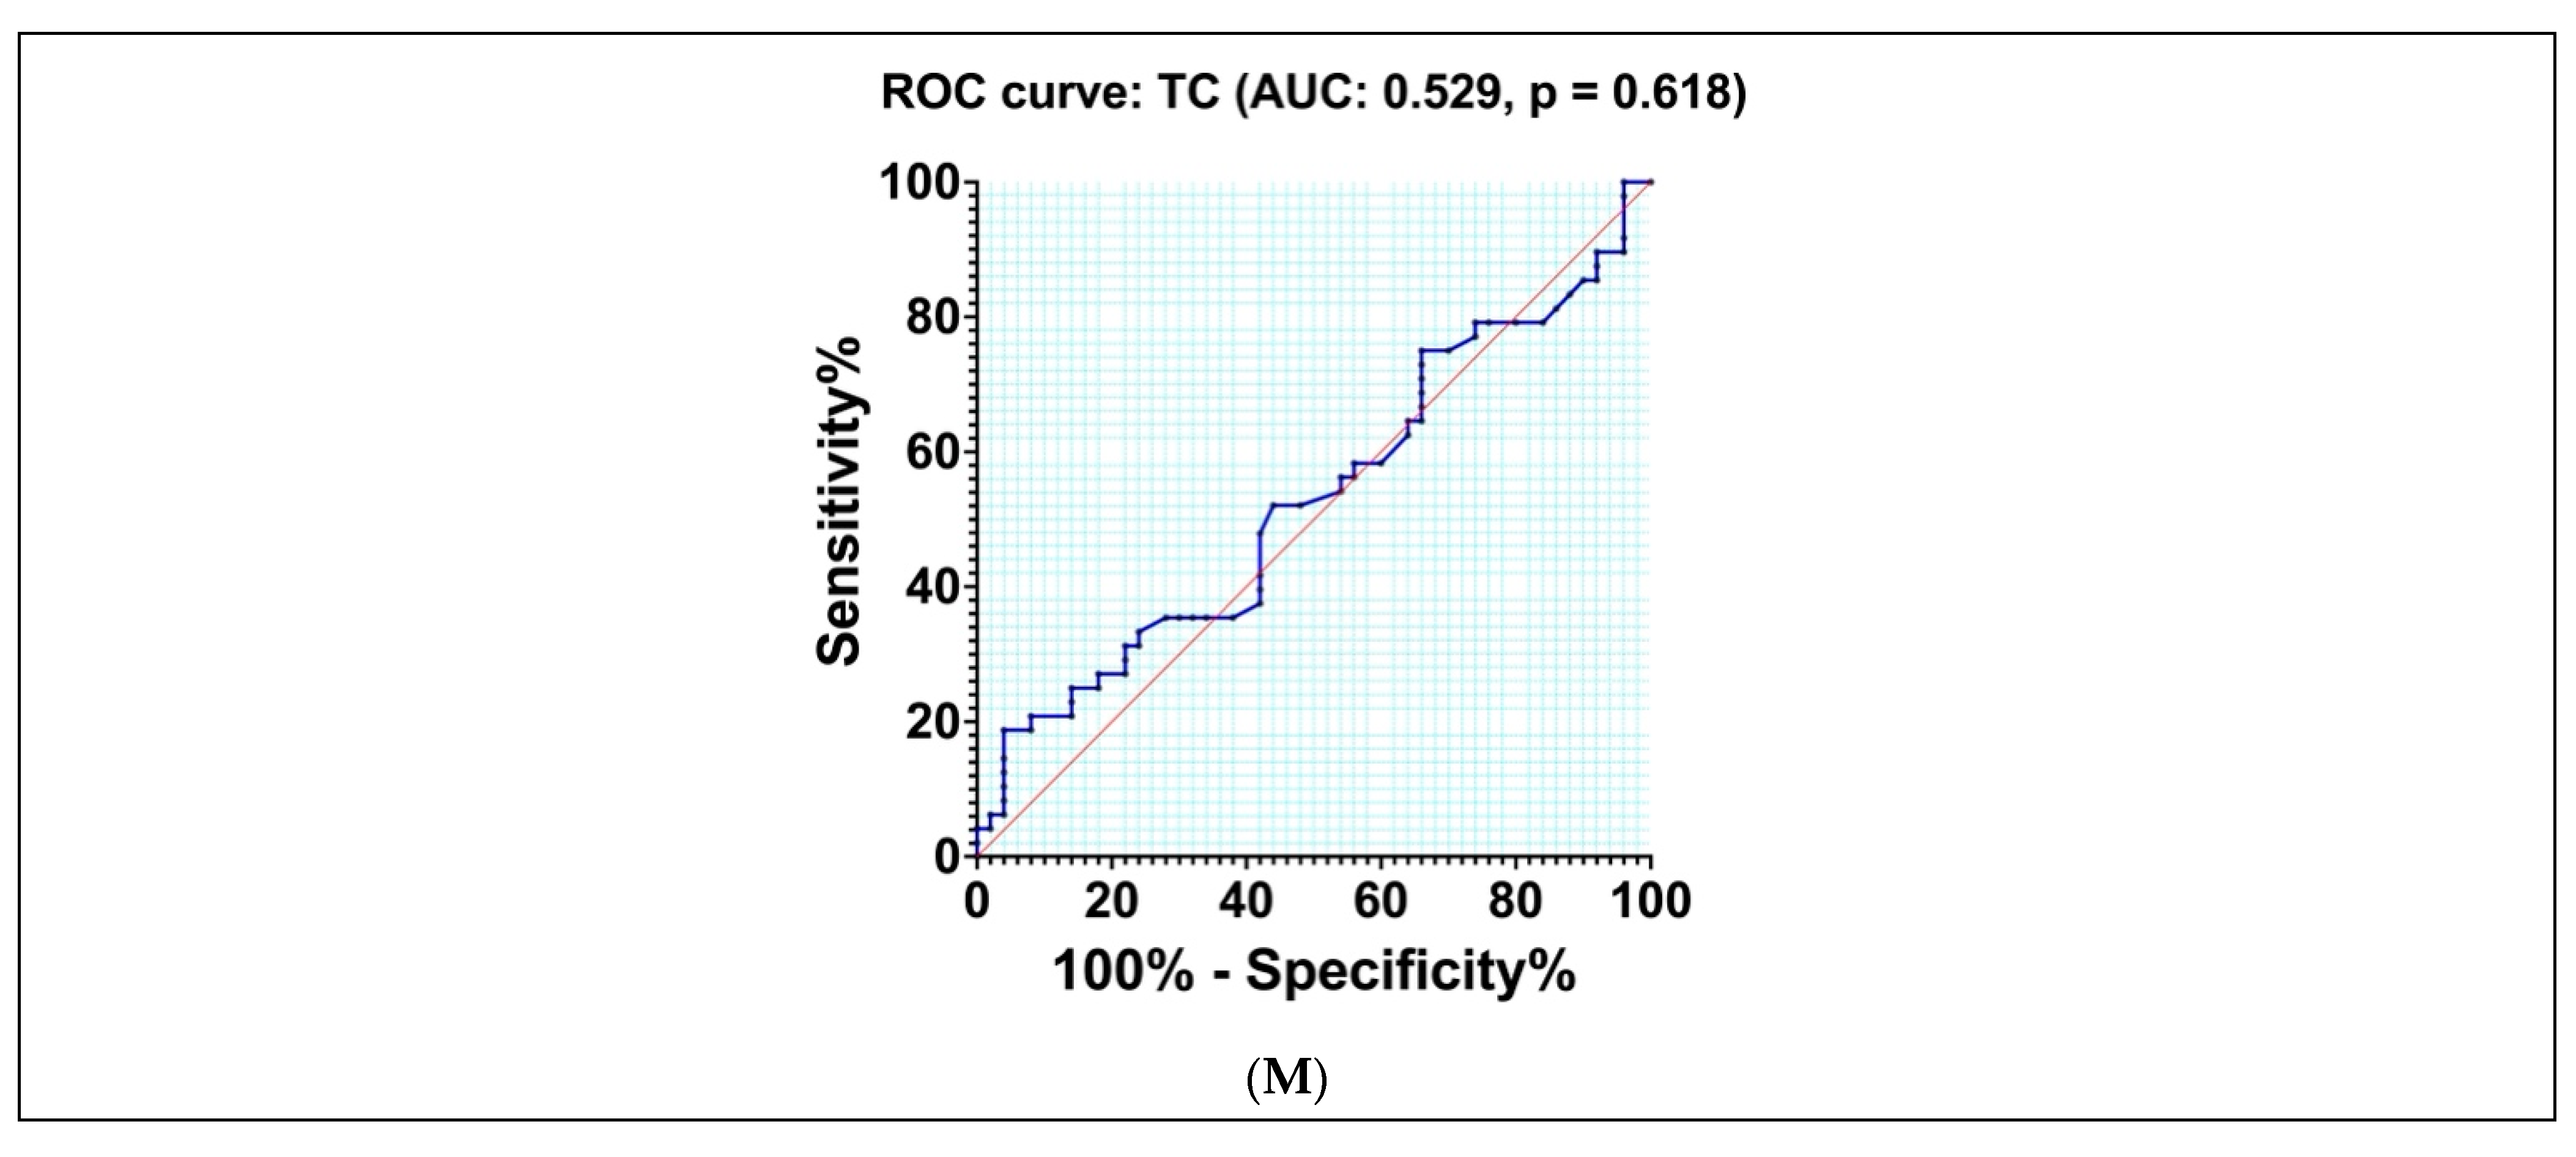
3.8. Diagnostic Accuracy of Different Indexes and Biomarkers
4. Discussion
5. Conclusions
Author Contributions
Funding
Institutional Review Board Statement
Informed Consent Statement
Data Availability Statement
Acknowledgments
Conflicts of Interest
References
- International Diabetes Federation Diabetes Atlas 10th Edition. 2021. Available online: https://diabetesatlas.org/resources/idf-diabetes-atlas-2025/ (accessed on 10 March 2025).
- Hu, R.; Zhao, Z.; Xie, L.; Ma, Z.; Wu, W.; Li, S. Global, regional, and national burden of chronic kidney disease due to diabetes mellitus type 2 from 1990 to 2021, with projections to 2036: A systematic analysis for the Global Burden of Disease Study 2021. Front. Med. 2025, 12, 1531811. [Google Scholar] [CrossRef] [PubMed]
- Bansal, N. Prediabetes diagnosis and treatment: A review. World J. Diabetes 2015, 6, 296–303. [Google Scholar] [CrossRef] [PubMed]
- American Diabetes Association Professional Practice Committee. 2. Diagnosis and Classification of Diabetes: Standards of Care in Diabetes-2024. Diabetes Care 2024, 47 (Suppl. S1), S20–S42. [CrossRef]
- Kim, B.; Kim, G.M.; Oh, S. Use of the Visceral Adiposity Index as an Indicator of Chronic Kidney Disease in Older Adults: Comparison with Body Mass Index. J. Clin. Med. 2022, 11, 6297. [Google Scholar] [CrossRef]
- WOorld Obesity Atlas. 2024. Available online: https://www.worldobesity.org/news/world-obesity-atlas-2024 (accessed on 10 March 2025).
- Kholmatova, K.; Krettek, A.; Dvoryashina, I.V.; Malyutina, S.; Kudryavtsev, A.V. Assessing the prevalence of obesity in a Russian adult population by six indices and their associations with hypertension, diabetes mellitus and hypercholesterolaemia. Int. J. Circumpolar Health 2024, 83, 2386783. [Google Scholar] [CrossRef]
- Marx, N.; Federici, M.; Schütt, K.; Müller-Wieland, D.; Ajjan, R.A.; Antunes, M.J.; Christodorescu, R.M.; Crawford, C.; Di Angelantonio, E.; Eliasson, B.; et al. 2023 ESC Guidelines for the management of cardiovascular disease in patients with diabetes. Eur. Heart J. 2023, 44, 4043–4140. [Google Scholar] [CrossRef] [PubMed]
- Zhang, J.; Xiao, X.; Wu, Y.; Yang, J.; Zou, Y.; Zhao, Y.; Yang, Q.; Liu, F. Prognostic Nutritional Index as a Predictor of Diabetic Nephropathy Progression. Nutrients 2022, 14, 3634. [Google Scholar] [CrossRef]
- International Diabetes Federation Diabetes Atlas Reports Diabetes and Kidney Disease. 2024. Available online: https://idf.org/about-diabetes/diabetes-complications/diabetes-and-the-kidneys/ (accessed on 10 March 2025).
- Kitada, M.; Ogura, Y.; Monno, I.; Koya, D. A Low-Protein Diet for Diabetic Kidney Disease: Its Effect and Molecular Mechanism, an Approach from Animal Studies. Nutrients 2018, 10, 544. [Google Scholar] [CrossRef]
- Tauchi, E.; Hanai, K.; Babazono, T. Effects of dietary protein intake on renal outcome and mortality in patients with advanced diabetic nephropathy. Clin. Exp. Nephrol. 2020, 24, 119–125. [Google Scholar] [CrossRef]
- Hickey, F.B.; Martin, F. Diabetic kidney disease and immune modulation. Curr. Opin. Pharmacol. 2013, 13, 602–612. [Google Scholar] [CrossRef]
- Flyvbjerg, A. The role of the complement system in diabetic nephropathy. Nat. Rev. Nephrol. 2017, 13, 311–318. [Google Scholar] [CrossRef]
- Mota, M.; Popa, S.G.; Mota, E.; Mitrea, A.; Catrinoiu, D.; Cheta, D.M.; Guja, C.; Hancu, N.; Ionescu-Tirgoviste, C.; Lichiardopol, R.; et al. Prevalence of diabetes mellitus and prediabetes in the adult Romanian population: PREDATORR study. J. Diabetes 2016, 8, 336–344. [Google Scholar] [CrossRef] [PubMed]
- Abbasi, B.; Ghanbarzadeh, E.; Panahizadeh, B. Association Between Atherogenic, Thrombogenic, and Lipophilic Indices and the Odds of Diabetic Nephropathy in Type 2 Diabetic Patients: A Case-Control Study. Food Sci. Nutr. 2025, 13, e4686. [Google Scholar] [CrossRef]
- Uysal, E.; Tammo, O.; Soylemez, E.; Incebıyık, M.; Filiz, D.; Alci, M. Significance of measuring anthropometric and atherogenic indices in patients with polycystic ovary syndrome. BMC Endocr. Disord. 2024, 24, 160. [Google Scholar] [CrossRef] [PubMed]
- Ahrițculesei, R.V.; Boldeanu, L.; Vladu, I.M.; Clenciu, D.; Mitrea, A.; Cîmpeanu, R.C.; Mustață, M.L.; Siloși, I.; Boldeanu, M.V.; Vere, C.C. Correlation Between Prognostic Nutritional Index, Glasgow Prognostic Score, and Different Obesity-Related Indices in People with Diabetes or Prediabetes. Diagnostics 2024, 14, 2661. [Google Scholar] [CrossRef] [PubMed]
- Onodera, T.; Goseki, N.; Kosaki, G. Prognostic nutritional index in gastrointestinal surgery of malnourished cancer patients. Nihon Geka Gakkai Zasshi 1984, 85, 1001–1005. [Google Scholar]
- Yang, Y.; Gao, P.; Chen, X.; Song, Y.; Shi, J.; Zhao, J.; Sun, J.; Xu, Y.; Wang, Z. Prognostic significance of preoperative prognostic nutritional index in colorectal cancer: Results from a retrospective cohort study and a meta-analysis. Oncotarget 2016, 7, 58543–58552. [Google Scholar] [CrossRef]
- Soh, J.; Suzawa, K.; Shien, K.; Otani, S.; Yamamoto, H.; Okazaki, M.; Sugimoto, S.; Katsui, K.; Yamane, M.; Kiura, K.; et al. Prognostic nutrition index affects the prognosis of patients undergoing trimodality therapy for locally advanced non-small cell lung cancer. Surg. Today 2020, 50, 1610–1618. [Google Scholar] [CrossRef]
- Cîmpeanu, R.C.; Boldeanu, M.V.; Ahrițculesei, R.V.; Ciobanu, A.E.; Cristescu, A.M.; Forțofoiu, D.; Siloși, I.; Pirici, D.N.; Cazacu, S.M.; Boldeanu, L.; et al. Correlation between Neurotransmitters (Dopamine, Epinephrine, Norepinephrine, Serotonin), Prognostic Nutritional Index, Glasgow Prognostic Score, Systemic Inflammatory Response Markers, and TNM Staging in a Cohort of Colorectal Neuroendocrine Tumor Patients. Int. J. Mol. Sci. 2024, 25, 6977. [Google Scholar] [CrossRef]
- Barutcu Atas, D.; Tugcu, M.; Asicioglu, E.; Velioglu, A.; Arikan, H.; Koc, M.; Tuglular, S. Prognostic nutritional index is a predictor of mortality in elderly patients with chronic kidney disease. Int. Urol. Nephrol. 2022, 54, 1155–1162. [Google Scholar] [CrossRef]
- American Diabetes Association Professional Practice Committee. 12. Retinopa-thy, n., and foot care: Standards of Care in Diabetes—2024. Diabetes Care 2024, 47 (Suppl. S1), S231–S243. [Google Scholar] [CrossRef] [PubMed]
- Kidney Disease: Improving Global Outcomes (KDIGO) CKD Work Group. KDIGO 2024 Clinical Practice Guideline for the Evaluation and Management of Chronic Kidney Disease. Kidney Int. 2024, 105 (Suppl. S4), S117–S314. [Google Scholar] [CrossRef] [PubMed]
- CKD-EPI Equations for Glomerular Filtration Rate (GFR) Calculator. Available online: https://www.mdcalc.com/calc/3939/ckd-epi-equations-glomerular-filtration-rate-gfr (accessed on 10 March 2025).
- American Diabetes Association Professional Practice Committee 1. Improving Care and Promoting Health in Populations: Standards of Care in Diabetes—2024. Diabetes Care 2023, 47 (Suppl. S1), S11–S19. [Google Scholar]
- Nuttall, F.Q. Body Mass Index: Obesity, BMI, and Health: A Critical Review. Nutr. Today 2015, 50, 117–128. [Google Scholar] [CrossRef]
- Li, W.; Gong, X.; Wang, W.; Xiong, K.; Meng, J.; Li, Y.; Wang, L.; Liang, X.; Jin, L.; Huang, W. Association of different kinds of obesity with diabetic retinopathy in patients with type 2 diabetes. BMJ Open 2022, 12, e056332. [Google Scholar] [CrossRef] [PubMed]
- Ahn, N.; Baumeister, S.E.; Amann, U.; Rathmann, W.; Peters, A.; Huth, C.; Thorand, B.; Meisinger, C. Visceral adiposity index (VAI), lipid accumulation product (LAP), and product of triglycerides and glucose (TyG) to discriminate prediabetes and diabetes. Sci. Rep. 2019, 9, 9693. [Google Scholar] [CrossRef]
- Prognostic Nutritional Index Calculator. Available online: https://radiologyreviewarticles.com/radiology-calculators/prognostic-nutritional-index/ (accessed on 10 March 2025).
- Agu, P.; Egbugara, M.; Ogboi, J.; Ajah, L.; Nwagha, U.; Ugwu, E.; Ezugwu, E. Atherogenic Index, Cardiovascular Risk Ratio, and Atherogenic Coefficient as Risk Factors for Cardiovascular Disease in Pre-eclampsia in Southeast Nigeria: A Cross-Sectional Study. Niger. J. Clin. Pract. 2024, 27, 221–227. [Google Scholar] [CrossRef]
- Lin, X.; Xu, Y.; Pan, X.; Xu, J.; Ding, Y.; Sun, X.; Song, X.; Ren, Y.; Shan, P.F. Global, regional, and national burden and trend of diabetes in 195 countries and territories: An analysis from 1990 to 2025. Sci. Rep. 2020, 10, 14790. [Google Scholar] [CrossRef]
- Mathers, C.D.; Loncar, D. Projections of global mortality and burden of disease from 2002 to 2030. PLoS Med. 2006, 3, e442. [Google Scholar] [CrossRef]
- Chen, X.; Zhang, X.; Gong, Z.; Yang, Y.; Zhang, X.; Wang, Q.; Wang, Y.; Xie, R. The link between diabetic retinal and renal microvasculopathy is associated with dyslipidemia and upregulated circulating level of cytokines. Front. Public Health 2022, 10, 1040319. [Google Scholar] [CrossRef]
- Tabák, A.G.; Herder, C.; Rathmann, W.; Brunner, E.J.; Kivimäki, M. Prediabetes: A high-risk state for diabetes development. Lancet 2012, 379, 2279–2290. [Google Scholar] [CrossRef] [PubMed]
- Sánchez, E.; Betriu, À.; López-Cano, C.; Hernández, M.; Fernández, E.; Purroy, F.; Bermúdez-López, M.; Farràs-Sallés, C.; Barril, S.; Pamplona, R.; et al. Characteristics of atheromatosis in the prediabetes stage: A cross-sectional investigation of the ILERVAS project. Cardiovasc. Diabetol. 2019, 18, 154. [Google Scholar] [CrossRef]
- Huang, Y.; Cai, X.; Mai, W.; Li, M.; Hu, Y. Association between prediabetes and risk of cardiovascular disease and all cause mortality: Systematic review and meta-analysis. Bmj 2016, 355, i5953. [Google Scholar] [CrossRef]
- Malone, J.I.; Hansen, B.C. Does obesity cause type 2 diabetes mellitus (T2DM)? Or is it the opposite? Pediatr. Diabetes 2019, 20, 5–9. [Google Scholar] [CrossRef]
- Amzolini, A.M.; Forţofoiu, M.C.; Barău Abu-Alhija, A.; Vladu, I.M.; Clenciu, D.; Mitrea, A.; Forţofoiu, M.; Matei, D.; Enăchescu, V.; Predescu, O.I.; et al. Triglyceride and glucose index: A useful tool for non-alcoholic liver disease assessed by liver biopsy in patients with metabolic syndrome? Rom. J. Morphol. Embryol. 2021, 62, 475–480. [Google Scholar] [CrossRef]
- Ştefan, A.G.; Clenciu, D.; Mitrea, A.; Vladu, I.M.; Protasiewicz-Timofticiuc, D.C.; Roşu, M.M.; Maria, D.T.; Dinu, I.R.; Gheonea, T.C.; Vladu, B.E.; et al. Metabolic Syndrome and Insulin Resistance in Romania. Int. J. Mol. Sci. 2025, 26, 2389. [Google Scholar] [CrossRef] [PubMed]
- Rohm, T.V.; Meier, D.T.; Olefsky, J.M.; Donath, M.Y. Inflammation in obesity, diabetes, and related disorders. Immunity 2022, 55, 31–55. [Google Scholar] [CrossRef]
- Istrate-Ofiţeru, A.M.; Mogoantă, C.A.; Zorilă, G.L.; Roşu, G.C.; Drăguşin, R.C.; Berbecaru, E.I.; Zorilă, M.V.; Comănescu, C.M.; Mogoantă, S.; Vaduva, C.C.; et al. Clinical Characteristics and Local Histopathological Modulators of Endometriosis and Its Progression. Int. J. Mol. Sci. 2024, 25, 1789. [Google Scholar] [CrossRef] [PubMed]
- Cosentino, F.; Grant, P.J.; Aboyans, V.; Bailey, C.J.; Ceriello, A.; Delgado, V.; Federici, M.; Filippatos, G.; Grobbee, D.E.; Hansen, T.B.; et al. 2019 ESC Guidelines on diabetes, pre-diabetes, and cardiovascular diseases developed in collaboration with the EASD. Eur. Heart J. 2020, 41, 255–323. [Google Scholar] [CrossRef]
- Klein, S.; Gastaldelli, A.; Yki-Järvinen, H.; Scherer, P.E. Why does obesity cause diabetes? Cell Metab. 2022, 34, 11–20. [Google Scholar] [CrossRef]
- Socea, B.; Radu, L.; Clenciu, D.; Tenea Cojan, T.S.; Baleanu, V.; Ene, C.G.; Girgavu, S.R.; Vladu, I.M. The utility of visceral adiposity index in prediction of metabolic syndrome and hypercholesterolemia. Rev. Chim. 2018, 69, 3112–3114. [Google Scholar] [CrossRef]
- De Lorenzo, A.; Soldati, L.; Sarlo, F.; Calvani, M.; Di Lorenzo, N.; Di Renzo, L. New obesity classification criteria as a tool for bariatric surgery indication. World J. Gastroenterol. 2016, 22, 681–703. [Google Scholar] [CrossRef] [PubMed]
- Hales, C.M.; Carroll, M.D.; Fryar, C.D.; Ogden, C.L. Prevalence of Obesity and Severe Obesity Among Adults: United States, 2017–2018. NCHS Data Brief 2020, 360, 1–8. [Google Scholar]
- Man, R.E.; Sabanayagam, C.; Chiang, P.P.; Li, L.J.; Noonan, J.E.; Wang, J.J.; Wong, T.Y.; Cheung, G.C.; Tan, G.S.; Lamoureux, E.L. Differential Association of Generalized and Abdominal Obesity With Diabetic Retinopathy in Asian Patients With Type 2 Diabetes. JAMA Ophthalmol. 2016, 134, 251–257. [Google Scholar] [CrossRef]
- Bergman, R.N.; Stefanovski, D.; Buchanan, T.A.; Sumner, A.E.; Reynolds, J.C.; Sebring, N.G.; Xiang, A.H.; Watanabe, R.M. A better index of body adiposity. Obesity 2011, 19, 1083–1089. [Google Scholar] [CrossRef]
- Aktas, G. Association between the Prognostic Nutritional Index and Chronic Microvascular Complications in Patients with Type 2 Diabetes Mellitus. J. Clin. Med. 2023, 12, 5952. [Google Scholar] [CrossRef]
- Zhang, J.; Chen, Y.; Zou, L.; Gong, R. Prognostic nutritional index as a risk factor for diabetic kidney disease and mortality in patients with type 2 diabetes mellitus. Acta Diabetol. 2023, 60, 235–245. [Google Scholar] [CrossRef] [PubMed]
- Kurtul, B.E.; Koca, S.; Yilmaz, M.O. Prognostic nutritional index as a novel marker for diabetic retinopathy in individuals with type 2 diabetes mellitus. Saudi J. Ophthalmol. 2022, 36, 322–326. [Google Scholar] [CrossRef]
- Yang, L.; Yu, W.; Pan, W.; Chen, S.; Ye, X.; Gu, X.; Hu, X. A Clinical Epidemiological Analysis of Prognostic Nutritional Index Associated with Diabetic Retinopathy. Diabetes Metab. Syndr. Obes. 2021, 14, 839–846. [Google Scholar] [CrossRef]
- Wei, W.; Lin, R.; Li, S.; Chen, Z.; Kang, Q.; Lv, F.; Zhong, W.; Chen, H.; Tu, M. Malnutrition Is Associated with Diabetic Retinopathy in Patients with Type 2 Diabetes. J. Diabetes Res. 2023, 2023, 1613727. [Google Scholar] [CrossRef]
- Opazo-Ríos, L.; Mas, S.; Marín-Royo, G.; Mezzano, S.; Gómez-Guerrero, C.; Moreno, J.A.; Egido, J. Lipotoxicity and Diabetic Nephropathy: Novel Mechanistic Insights and Therapeutic Opportunities. Int. J. Mol. Sci. 2020, 21, 2632. [Google Scholar] [CrossRef]
- Kawanami, D.; Matoba, K.; Utsunomiya, K. Dyslipidemia in diabetic nephropathy. Ren. Replace. Ther. 2016, 2, 16. [Google Scholar] [CrossRef]
- Adiels, M.; Olofsson, S.O.; Taskinen, M.R.; Borén, J. Overproduction of very low-density lipoproteins is the hallmark of the dyslipidemia in the metabolic syndrome. Arter. Thromb. Vasc. Biol. 2008, 28, 1225–1236. [Google Scholar] [CrossRef]
- Yang, Y.; Xu, P.; Liu, Y.; Chen, X.; He, Y.; Feng, J. Vascular inflammation, atherosclerosis, and lipid metabolism and the occurrence of non-high albuminuria diabetic kidney disease: A cross-sectional study. Diabetes Vasc. Dis. Res. 2021, 18, 1479164121992524. [Google Scholar] [CrossRef] [PubMed]
- Sahani, J.K.; Aggarwal, R.; Ghotekar, L.H.; Prakash, A.; Singh, K.; Gupta, P. Correlation of Anthropometry With Plasma Atherogenicity Indices in Subjects With Type 2 Diabetes Mellitus. Cureus 2024, 16, e72414. [Google Scholar] [CrossRef] [PubMed]
- Zoccali, C.; Mark, P.B.; Sarafidis, P.; Agarwal, R.; Adamczak, M.; Bueno de Oliveira, R.; Massy, Z.A.; Kotanko, P.; Ferro, C.J.; Wanner, C.; et al. Diagnosis of cardiovascular disease in patients with chronic kidney disease. Nat. Rev. Nephrol. 2023, 19, 733–746. [Google Scholar] [CrossRef]
- Drwila, D.; Rostoff, P.; Nessler, J.; Konduracka, E. Prognostic significance of atherogenic index of plasma, atherogenic coefficient and lipoprotein combined index among elderly patients with non-ST-segment elevation myocardial infarction in 1-year follow-up. Bratisl. Lek. Listy 2022, 123, 872–877. [Google Scholar] [CrossRef]
- Çelik, E.; Çora, A.R.; Karadem, K.B. The Effect of Untraditional Lipid Parameters in the Development of Coronary Artery Disease: Atherogenic Index of Plasma, Atherogenic Coefficient and Lipoprotein Combined Index. J. Saudi Heart Assoc. 2021, 33, 244–250. [Google Scholar] [CrossRef]
- Adedokun, K.; Olisekodiaka, J.; Adeyeye, A.; Muhibi, M.; Ojokuku, H.; Adepeju, A.; Abdufatah, O.; Adetoro, T.; Kabiru Adewale, A.; Shehu, M. Castelli Risk Index, Atherogenic Index of Plasma, and Atherogenic Coefficient: Emerging Risk Predictors of Cardiovascular Disease in HIV-Treated Patients. Saudi Pharm. J. 2017, 4929, 1101–1110. [Google Scholar]
- Wan, H.; Wang, Y.; Xiang, Q.; Fang, S.; Chen, Y.; Chen, C.; Zhang, W.; Zhang, H.; Xia, F.; Wang, N.; et al. Associations between abdominal obesity indices and diabetic complications: Chinese visceral adiposity index and neck circumference. Cardiovasc. Diabetol. 2020, 19, 118. [Google Scholar] [CrossRef]
- Zhang, Y.Y.; Yang, X.Y.; Wan, Q. Association between atherogenic index of plasma and type 2 diabetic complications: A cross-sectional study. Front. Endocrinol. 2025, 16, 1537303. [Google Scholar] [CrossRef] [PubMed]
- He, J.; Chen, L. Perspective from NHANES data: Synergistic effects of visceral adiposity index and lipid accumulation products on diabetes risk. Sci. Rep. 2025, 15, 258. [Google Scholar] [CrossRef]
- Shen, F.; Guo, C.; Zhang, D.; Liu, Y.; Zhang, P. Visceral adiposity index as a predictor of type 2 diabetes mellitus risk: A systematic review and dose–response meta-analysis. Nutr. Metab. Cardiovasc. Dis. 2024, 34, 811–822. [Google Scholar] [CrossRef] [PubMed]
- Sun, J.; Meng, X.; Huang, H.; Jing, J.; Pan, Y.; Mei, L.; Jin, A.; Wang, Y.; Wei, T.; Cai, X. Higher visceral adiposity index and lipid accumulation product in relation to increased risk of atherosclerotic burden in community-dwelling older adults. Exp. Gerontol. 2023, 174, 112115. [Google Scholar] [CrossRef]
- Bullen, A.L.; Katz, R.; Kumar, U.; Gutierrez, O.M.; Sarnak, M.J.; Kramer, H.J.; Shlipak, M.G.; Ix, J.H.; Judd, S.E.; Cushman, M.; et al. Lipid accumulation product, visceral adiposity index and risk of chronic kidney disease. BMC Nephrol. 2022, 23, 401. [Google Scholar] [CrossRef] [PubMed]
- Li, C.; Wang, G.; Zhang, J.; Jiang, W.; Wei, S.; Wang, W.; Pang, S.; Pan, C.; Sun, W. Association between visceral adiposity index and incidence of diabetic kidney disease in adults with diabetes in the United States. Sci. Rep. 2024, 14, 17957. [Google Scholar] [CrossRef]
- Dai, D.; Chang, Y.; Chen, Y.; Chen, S.; Yu, S.; Guo, X.; Sun, Y. Visceral Adiposity Index and Lipid Accumulation Product Index: Two Alternate Body Indices to Identify Chronic Kidney Disease among the Rural Population in Northeast China. Int. J. Environ. Res. Public Health 2016, 13, 1231. [Google Scholar] [CrossRef]
- Pang, J.H.; Safer, J.D. An Opportunity to Better Assess Breast Development in Transgender Women. J. Clin. Endocrinol. Metab. 2020, 106, e1453–e1454. [Google Scholar] [CrossRef]
- Qin, Y.; Qiao, Y.; Wang, D.; Li, M.; Yang, Z.; Li, L.; Yan, G.; Tang, C. Visceral adiposity index is positively associated with fasting plasma glucose: A cross-sectional study from National Health and Nutrition Examination Survey 2017–2020. BMC Public Health 2023, 23, 313. [Google Scholar] [CrossRef]
- Al-Daghri, N.M.; Al-Attas, O.S.; Alokail, M.S.; Alkharfy, K.M.; Charalampidis, P.; Livadas, S.; Kollias, A.; Sabico, S.L.; Chrousos, G.P. Visceral adiposity index is highly associated with adiponectin values and glycaemic disturbances. Eur. J. Clin. Investig. 2013, 43, 183–189. [Google Scholar] [CrossRef]


| Features | PreDM Cohort (n = 50) | T2DM Cohort (n = 48) | p-Value from Pearson’s Chi-Squared/ Student’s t-Test |
|---|---|---|---|
| Demographic features | |||
| Age (years) (mean ± SD) | 48.60 ± 7.68 | 64.25 ± 11.95 | <0.0001 * |
| Gender, female/male (n) | 30/20 | 24/24 | 0.319 |
| Residence, rural/urban (n) | 16/34 | 21/27 | 0.230 |
| Medical history and clinical condition | |||
| Smoking history, no/yes (n) | 18/32 | 23/25 | 0.231 |
| Drinking history, no/yes (n) | 14/36 | 20/28 | 0.155 |
| Education, no/yes (n) | 12/38 | 19/29 | 0.097 |
| Hypertension, n (%) | 40 (80%) | 44 (91%) | 0.098 |
| Dyslipidemia, n (%) | 43 (86%) | 41 (85%) | 0.934 |
| Hepatosteatosis, n (%) | 35 (70%) | 33 (68%) | 0.893 |
| SBP (mmHg) (mean ± SD) | 132.60 ± 16.10 | 136.1 ± 19.48 | 0.327 |
| DBP (mmHg) (mean ± SD) | 79.04 ± 13.30 | 79.36 ± 14.02 | 0.908 |
| Height (cm) (mean ± SD) | 167 ± 11 | 167 ± 10 | 0.761 |
| Weight (kg) (mean ± SD) | 82.40 ± 20.56 | 87.68 ± 17.34 | 0.047 * |
| WC (cm) (mean ± SD) | 101.9 ± 17.51 | 105.80 ± 12.73 | 0.204 |
| HC (cm) (mean ± SD) | 107.80 ± 13.10 | 110.40 ± 15.09 | 0.365 |
| WHR [median (range)] | 0.94 (0.59–1.64) | 0.94 (0.78–3.33) | 0.623 |
| WHtR (mean ± SD) | 0.60 ± 0.09 | 0.63 ± 0.08 | 0.179 |
| BMI (kg/m2) (mean ± SD) | 30.42 ± 6.50 | 31.18 ± 5.13 | 0.518 |
| BMI category (n) | |||
| Normal (18.5–24.9 kg/m2) | 11 | 6 | 0.443 |
| Overweight (25–29.9 kg/m2) | 20 | 12 | 0.735 |
| Obese (≥30 kg/m2) | 19 | 30 | 0.01 * |
| BAI (mean ± SD) | 32.17 ± 6.87 | 33.23 ± 8.56 | 0.501 |
| VAI [median (range)] | 3.74 (1.05–35.13) | 4.85 (1.21–28.59) | 0.04 * |
| Laboratory examination | |||
| FPG (mg/dL) (mean ± SD) | 107.30 ± 5.68 | 159 ± 24.43 | <0.0001 * |
| 2hPG (mg/dL) (mean ± SD) | 169.10 ± 15.12 | 245.1 ± 60.72 | <0.0001 * |
| HbA1c (%) (mean ± SD) | 5.79 ± 0.47 | 9.80 ± 1.80 | <0.0001 * |
| TC (mg/dL) (mean ± SD) | 182.90 ± 48.92 | 192.4 ± 60.99 | 0.395 |
| TG (mg/dL) (mean ± SD) | 125.70 ± 73.08 | 151.5 ± 93.14 | 0.130 |
| LDL-c (mg/dL) (mean ± SD) | 107.90 ± 43.97 | 105.8 ± 38.45 | 0.797 |
| HDL-c (mg/dL) (mean ± SD) | 52.18 ± 13.84 | 49.38 ± 12.19 | 0.290 |
| eGFR (mL/min/1.73 m2) | |||
| CKD-EPI (mL/min/1.73 m2) (mean ± SD) | 90.18 ± 26.70 | 43.92 ± 12.67 | <0.0001 * |
| BUN (mg/dL) (mean ± SD) | 50.63 ± 14.98 | 27.71 ± 13.45 | <0.0001 * |
| Creatinine (mg/dL) (mean ± SD) | 0.91 ± 0.38 | 1.59 ± 0.27 | <0.0001 * |
| UA (mg/dL) (mean ± SD) | 4.91 ± 1.51 | 4.84 ± 1.77 | 0.831 |
| Hb (g/dL) (mean ± SD) | 13.61 ± 2.05 | 13.73 ± 2.13 | 0.778 |
| WBC (×103/μL) (mean ± SD) | 7.57 ± 2.04 | 7.72 ± 1.86 | 0.695 |
| NEU (×103/μL) (mean ± SD) | 4.69 ± 1.55 | 4.83 ± 1.52 | 0.672 |
| LYM (×103/μL) (mean ± SD) | 2.14 ± 0.71 | 2.13 ± 0.74 | 0.950 |
| MON (×103/μL) [median (range)] | 0.46 (0.25–0.95) | 0.49 (0.32–1.19) | 0.631 |
| PLT (×103/μL) (mean ± SD) | 256.3 ± 78.63 | 257.9 ± 69.17 | 0.911 |
| Malnourishment | |||
| ALB (g/dL) (mean ± SD) | 6.19 ± 0.51 | 3.82 ± 0.27 | <0.0001 * |
| CRP (mg/dL) [median (range)] | 0.49 (0.05–162.1) | 20.70 (3.20–76) | <0.0001 * |
| ESR (mm/1st h) [median (range)] | 30 (8–115) | 29 (4–110) | 0.902 |
| PNI (mean ± SD) | 72.69 ± 6.81 | 48.94 ± 5.25 | <0.0001 * |
| AC (mean ± SD) | 2.74 ± 1.46 | 3.05 ± 1.52 | 0.001 * |
| Features | PreDM Cohort (n = 50) | ||||||
|---|---|---|---|---|---|---|---|
| PNI | AC | ||||||
| All Patients | PNI ≥ 72.69 | PNI < 72.69 | p-Value | AC < 2.74 | AC ≥ 2.74 | p-Value | |
| Patients (n) | 50 | 26 | 24 | 31 | 19 | ||
| Demographic features | |||||||
| Age (years) (mean ± SD) | 48.60 ± 7.68 | 48.31 ± 8.38 | 48.92 ± 7.02 | 0.782 | 48.84 ± 7.79 | 48.21 ± 7.70 | 0.782 |
| Gender, female/male (n) | 30/20 | 14/12 | 16/8 | 0.355 | 21/10 | 9/10 | 0.153 |
| Residence, rural/urban (n) | 16/34 | 11/15 | 9/15 | 0.728 | 7/24 | 9/10 | 0.068 |
| Medical history and clinical condition | |||||||
| Smoking history, no/yes (n) | 18/32 | 10/16 | 8/16 | 0.705 | 12/19 | 6/13 | 0.610 |
| Drinking history, no/yes (n) | 14/36 | 12/14 | 2/22 | 0.002 * | 13/18 | 1/18 | 0.005 * |
| Education, no/yes (n) | 12/38 | 10/16 | 8/16 | 0.705 | 5/26 | 7/12 | 0.095 |
| Hypertension, n (%) | 40 (80%) | 18 (69%) | 22 (91%) | 0.047 * | 22 (71%) | 18 (94%) | 0.041 * |
| Dyslipidemia, n (%) | 43 (86%) | 20 (77%) | 23 (95%) | 0.054 ** | 26 (83%) | 17 (89%) | 0.579 |
| Hepatosteatosis, n (%) | 35 (70%) | 17 (65%) | 16 (66%) | 0.923 | 21 (67%) | 14 (73%) | 0.656 |
| SBP (mmHg) (mean ± SD) | 132.60 ± 16.10 | 130.2 ± 13.17 | 135.2 ± 18.72 | 0.275 | 133.9 ± 16.63 | 130.5 ± 15.40 | 0.470 |
| DBP (mmHg) (mean ± SD) | 79.36 ± 14.02 | 76.85 ± 11.74 | 82.08 ± 15.95 | 0.190 | 78.68 ± 13.91 | 80.47 ± 14.53 | 0.664 |
| Height (cm) (mean ± SD) | 167 ± 11 | 168 ± 10 | 165 ± 11 | 0.423 | 166 ± 10 | 168 ± 11 | 0.486 |
| Weight (kg) (mean ± SD) | 82.40 ± 20.56 | 76.32 ± 13.96 | 90.67 ± 21.70 | 0.007 * | 81.67 ± 21.65 | 85.72 ± 14.94 | 0.477 |
| WC (cm) (mean ± SD) | 101.9 ± 17.51 | 101.3 ± 13.93 | 102.3 ± 20.54 | 0.840 | 98.39 ± 15.06 | 107.5 ± 20.05 | 0.042 * |
| HC (cm) (mean ± SD) | 107.80 ± 13.10 | 105.2 ± 11.56 | 110.5 ± 14.32 | 0.048 * | 107.4 ± 14.71 | 108.3 ± 10.30 | 0.817 |
| WHR [median (range)] | 0.94 (0.59–1.64) | 0.92 (0.78–1.17) | 0.96 (0.59–1.64) | 0.064 | 0.92 (0.59–1.17) | 0.97 (0.84–1.64) | 0.115 |
| WHtR (mean ± SD) | 0.60 ± 0.09 | 0.60 ± 0.10 | 0.61 ± 0.07 | 0.870 | 0.59 ± 0.08 | 0.63 ± 0.09 | 0.056 ** |
| BMI (kg/m2) (mean ± SD) | 30.42 ± 6.50 | 28.26 ± 5.97 | 32.75 ± 6.35 | 0.013 * | 30.57 ± 7.17 | 30.16 ± 5.38 | 0.829 |
| BMI category (n) | |||||||
| Normal (18.5–24.9 kg/m2) | 11 | 8 | 3 | 0.026 * | 7 | 4 | 0.930 |
| Overweight (25–29.9 kg/m2) | 20 | 13 | 7 | 0.306 | 13 | 7 | 0.525 |
| Obese (≥30 kg/m2) | 19 | 5 | 14 | 0.473 | 11 | 8 | 0.153 |
| BAI (mean ± SD) | 32.17 ± 6.87 | 30.48 ± 6.22 | 34.01 ± 7.20 | 0.068 | 32.38 ± 7.47 | 31.84 ± 5.96 | 0.788 |
| VAI [median (range)] | 3.74 (1.05–35.13) | 3.74 (1.05–35.13) | 3.80 (1.24–9.74) | 0.890 | 3.54 (1.05–9.29) | 3.94 (1.24–35.13) | 0.036 * |
| Laboratory examination | |||||||
| FPG (mg/dL) (mean ± SD) | 107.30 ± 5.68 | 106.8 ± 5.44 | 107.8 ± 6.02 | 0.579 | 107.2 ± 5.91 | 107.4 ± 5.46 | 0.892 |
| 2hPG (mg/dL) (mean ± SD) | 169.10 ± 15.12 | 168.5 ± 15.15 | 169.7 ± 15.39 | 0.795 | 171 ± 14.98 | 165.9 ± 15.22 | 0.255 |
| HbA1c (%) (mean ± SD) | 5.79 ± 0.47 | 5.74 ± 0.52 | 5.84 ± 0.42 | 0.453 | 5.85 ± 0.47 | 5.70 ± 0.46 | 0.309 |
| TC (mg/dL) (mean ± SD) | 182.90 ± 48.92 | 183.1 ± 52.09 | 182.7 ± 46.35 | 0.979 | 167.1 ± 44.62 | 208.6 ± 45.48 | 0.002 * |
| TG (mg/dL) (mean ± SD) | 125.70 ± 73.08 | 120.5 ± 88.36 | 131.4 ± 53.18 | 0.602 | 120.3 ± 53.95 | 134.6 ± 97.75 | 0.506 |
| LDL-c (mg/dL) (mean ± SD) | 107.90 ± 43.97 | 107.5 ± 41.68 | 108.3 ± 46.80 | 0.954 | 93.30 ± 38.31 | 131.7 ± 43.02 | 0.001 * |
| HDL-c (mg/dL) (mean ± SD) | 52.18 ± 13.84 | 55.52 ± 12.68 | 49.10 ± 14.37 | 0.048 * | 58.79 ± 12.83 | 41.40 ± 6.98 | <0.0001 * |
| CKD-EPI (mL/min/1.73 m2) (mean ± SD) | 90.18 ± 26.70 | 90.92 ± 19.40 | 89.51 ± 32.41 | 0.854 | 89.99 ± 27.78 | 90.51 ± 25.59 | 0.947 |
| BUN (mg/dL) (mean ± SD) | 50.63 ± 14.98 | 50.10 ± 16.49 | 51.20 ± 13.48 | 0.798 | 53.38 ± 13.58 | 46.14 ± 16.39 | 0.057 ** |
| Creatinine (mg/dL) (mean ± SD) | 0.91 ± 0.38 | 0.86 ± 0.25 | 0.96 ± 0.48 | 0.382 | 0.92 ± 0.40 | 0.91 ± 0.36 | 0.971 |
| UA (mg/dL) (mean ± SD) | 4.91 ± 1.51 | 4.81 ± 1.59 | 5.03 ± 1.44 | 0.609 | 4.76 ± 1.30 | 5.16 ± 1.80 | 0.373 |
| Hb (g/dL) (mean ± SD) | 13.61 ± 2.05 | 14.54 ± 1.34 | 12.76 ± 2.24 | 0.001 * | 13.56 ± 1.61 | 13.69 ± 2.68 | 0.830 |
| WBC (×103/μL) (mean ± SD) | 7.57 ± 2.04 | 6.71 ± 1.66 | 8.49 ± 2.03 | 0.001 * | 8.04 ± 2.05 | 6.79 ± 1.81 | 0.033 * |
| NEU (×103/μL) (mean ± SD) | 4.69 ± 1.55 | 4.23 ± 1.25 | 5.20 ± 1.70 | 0.025 * | 5.08 ± 1.64 | 4.07 ± 1.16 | 0.023 * |
| LYM (×103/μL) (mean ± SD) | 2.14 ± 0.71 | 1.81 ± 0.46 | 2.50 ± 0.77 | 0.0004 * | 2.19 ± 0.70 | 2.05 ± 0.73 | <0.0001 * |
| MON (×103/μL) [median (range)] | 0.46 (0.25–0.95) | 0.43 (0.25–0.95) | 0.52 (0.25–0.82) | 0.025 * | 0.50 (0.25–0.83) | 0.42 (0.25–0.95) | 0.154 |
| PLT (×103/μL) (mean ± SD) | 256.3 ± 78.63 | 261 ± 83.81 | 251.1 ± 74.06 | 0.660 | 256.7 ± 76.12 | 255.5 ± 84.70 | 0.958 |
| Malnourishment | |||||||
| ALB (g/dL) (mean ± SD) | 6.19 ± 0.51 | 6.55 ± 0.43 | 5.86 ± 0.31 | <0.0001 * | 6.18 ± 0.39 | 6.22 ± 0.66 | 0.762 |
| CRP (mg/dL) [median (range)] | 20.70 (3.20–76) | 20.45 (6–76) | 21.50 (3.2–54) | 0.606 | 26 (6–58) | 17 (3.2–76) | 0.052 ** |
| ESR (mm/1st h) [median (range)] | 30 (8–115) | 29.50 (8–96) | 35 (10–115) | 0.250 | 30 (10–115) | 30 (8–105) | 0.830 |
| PNI (mean ± SD) | 72.69 ± 6.81 | 78.03 ± 5.23 | 67.76 ± 3.64 | <0.0001 * | 72.78 ± 4.93 | 72.55 ± 9.27 | 0.908 |
| AC (mean ± SD) | 2.74 ± 1.46 | 2.41 ± 1.04 | 3.04 ± 1.73 | 0.055 ** | 1.88 ± 0.66 | 4.13 ± 1.35 | <0.0001 * |
| Features | T2DM Cohort (n = 48) | ||||||
|---|---|---|---|---|---|---|---|
| PNI | AC | ||||||
| All Patients | PNI ≥ 48.94 | PNI < 48.94 | p-Value | AC < 3.05 | AC ≥ 3.05 | p-Value | |
| Patients (n) | 48 | 23 | 25 | 29 | 19 | ||
| Demographic features | |||||||
| Age (years) (mean ± SD) | 64.25 ± 11.95 | 67.43 ± 11.28 | 61.32 ± 12.02 | 0.076 | 66.62 ± 11.08 | 60.63 ± 12.62 | 0.089 |
| Gender, female/male (n) | 24/24 | 11/12 | 13/12 | 0.772 | 18/11 | 6/13 | 0.038 * |
| Residence, rural/urban (n) | 21/27 | 13/10 | 8/17 | 0.087 | 14/15 | 7/12 | 0.434 |
| Medical history and clinical condition | |||||||
| Smoking history, no/yes (n) | 23/25 | 9/14 | 7/18 | 0.413 | 13/16 | 6/13 | 0.358 |
| Drinking history, no/yes (n) | 20/28 | 14/9 | 10/15 | 0.148 | 12/17 | 8/11 | 0.960 |
| Education, no/yes (n) | 19/29 | 10/13 | 11/14 | 0.970 | 12/17 | 5/14 | 0.285 |
| Hypertension, n (%) | 44 (91%) | 22 (95%) | 22 (88%) | 0.337 | 26 (89%) | 18 (94%) | 0.533 |
| Dyslipidemia, n (%) | 41 (85%) | 19 (82%) | 22 (88%) | 0.597 | 24 (82%) | 17 (89%) | 0.519 |
| Hepatosteatosis, n (%) | 33 (68%) | 16 (69%) | 17 (68%) | 0.906 | 17 (58%) | 16 (84%) | 0.061 |
| SBP (mmHg) (mean ± SD) | 136.1 ± 19.48 | 134.2 ± 19.32 | 138 ± 19.84 | 0.507 | 132.6 ± 20.02 | 141.6 ± 17.74 | 0.115 |
| DBP (mmHg) (mean ± SD) | 79.04 ± 13.30 | 77.09 ± 14.14 | 80.84 ± 12.50 | 0.334 | 76.31 ± 14.44 | 83.21 ± 10.37 | 0.078 |
| Height (cm) (mean ± SD) | 167 ± 10 | 168 ± 8 | 167 ± 11 | 0.636 | 165 ± 8 | 170 ± 11 | 0.104 |
| Weight (kg) (mean ± SD) | 87.68 ± 17.34 | 85.71 ± 16.58 | 89.48 ± 18.15 | 0.045 | 85.22 ± 13.30 | 91.43 ± 22.02 | 0.229 |
| WC (cm) (mean ± SD) | 105.80 ± 12.73 | 104.3 ± 13.33 | 107.5 ± 12.12 | 0.381 | 107.9 ± 12.87 | 102.7 ± 12.18 | 0.169 |
| HC (cm) (mean ± SD) | 110.40 ± 15.09 | 108.8 ± 18.42 | 112 ± 10.50 | 0.046 * | 112.8 ± 11.03 | 106.7 ± 19.53 | 0.174 |
| WHR [median (range)] | 0.94 (0.78–3.33) | 0.92 (0.78–1.11) | 0.96 (0.85–3.33) | 0.133 | 0.92 (0.80–1.11) | 0.96 (0.78–3.33) | 0.047 * |
| WHtR (mean ± SD) | 0.63 ± 0.08 | 0.62 ± 8.55 | 0.63 ± 0.07 | 0.581 | 0.60 ± 0.07 | 0.65 ± 0.07 | 0.040 * |
| BMI (kg/m2) (mean ± SD) | 31.18 ± 5.13 | 30.27 ± 4.42 | 32.03 ± 5.66 | 0.238 | 31.13 ± 4.71 | 31.22 ± 5.85 | 0.949 |
| BMI category (n) | |||||||
| Normal (18.5–24.9 kg/m2) | 6 | 3 | 3 | 0.070 | 3 | 3 | 0.468 |
| Overweight (25–29.9 kg/m2) | 12 | 7 | 5 | 0.017 * | 7 | 5 | 0.866 |
| Obese (≥30 kg/m2) | 30 | 13 | 17 | 0.047 * | 19 | 11 | 0.399 |
| BAI (mean ± SD) | 33.23 ± 8.56 | 33.06 ± 10.82 | 33.42 ± 5.38 | 0.884 | 30.49 ± 11.08 | 35.03 ± 5.99 | 0.039 * |
| VAI [median(range)] | 4.85 (1.21–28.59) | 3.98 (1.21–10.31) | 6.31 (1.38–28.59) | 0.008 * | 4.31 (1.21–7.83) | 7.62 (2.43–28.59) | 0.002 * |
| Laboratory examination | |||||||
| FPG (mg/dL) (mean ± SD) | 159 ± 24.43 | 154.5 ± 20.72 | 163.9 ± 27.55 | 0.188 | 157 ± 29.11 | 162.1 ± 14.94 | 0.481 |
| 2hPG (mg/dL) (mean ± SD) | 245.1 ± 60.72 | 228.7 ± 45.71 | 262.9 ± 70.44 | 0.049 * | 244.7 ± 69.88 | 245.7 ± 45.06 | 0.956 |
| HbA1c (%) (mean ± SD) | 9.80 ± 1.80 | 9.48 ± 1.66 | 10.13 ± 1.92 | 0.021 * | 9.68 ± 1.97 | 9.96 ± 1.54 | 0.048 * |
| TC (mg/dL) (mean ± SD) | 192.4 ± 60.99 | 169.1 ± 52.18 | 213.9 ± 61.54 | 0.009 * | 161.9 ± 42.29 | 239 ± 56.04 | <0.0001 * |
| TG (mg/dL) (mean ± SD) | 151.5 ± 93.14 | 111.4 ± 49.40 | 188.3 ± 108.6 | 0.003 * | 119.6 ± 52.18 | 200.1 ± 119.5 | 0.002 * |
| LDL-c (mg/dL) (mean ± SD) | 105.8 ± 38.45 | 95.42 ± 34.55 | 115.3 ± 40.05 | 0.035 * | 85.78 ± 28.13 | 136.3 ± 31.70 | <0.0001 * |
| HDL-c (mg/dL) (mean ± SD) | 49.38 ± 12.19 | 47.31 ± 11.30 | 51.28 ± 12.89 | 0.064 | 52.52 ± 12.87 | 44.59 ± 9.49 | 0.025 * |
| CKD-EPI (mL/min/1.73 m2) (mean ± SD) | 43.92 ± 12.67 | 44.56 ± 12.42 | 43.23 ± 13.19 | 0.720 | 45.87 ± 11.68 | 40.65 ± 13.33 | 0.039 * |
| BUN (mg/dL) (mean ± SD) | 27.71 ± 13.45 | 27.42 ± 12.57 | 28.01 ± 14.61 | 0.880 | 29.09 ± 13.31 | 25.59 ± 13.74 | 0.382 |
| Creatinine (mg/dL) (mean ± SD) | 1.59 ± 0.27 | 1.58 ± 0.23 | 1.61 ± 0.32 | 0.702 | 1.58 ± 0.30 | 1.62 ± 0.24 | 0.651 |
| UA (mg/dL) (mean ± SD) | 4.84 ± 1.77 | 4.83 ± 2.02 | 4.86 ± 1.54 | 0.951 | 4.38 ± 1.87 | 5.55 ± 1.34 | 0.023 * |
| Hb (g/dL) (mean ± SD) | 13.73 ± 2.13 | 14.46 ± 1.58 | 12.94 ± 2.38 | 0.011 * | 13.26 ± 1.50 | 14.45 ± 2.72 | 0.057 ** |
| WBC (×103/μL) (mean ± SD) | 7.72 ± 1.86 | 8.30 ± 1.67 | 7.09 ± 1.89 | 0.023 * | 7.26 ± 1.67 | 8.42 ± 1.97 | 0.035 * |
| NEU (×103/μL) (mean ± SD) | 4.83 ± 1.52 | 4.86 ± 1.37 | 4.79 ± 1.70 | 0.878 | 4.52 ± 1.14 | 5.30 ± 1.91 | 0.047 * |
| LYM (×103/μL) (mean ± SD) | 2.13 ± 0.74 | 2.61 ± 0.63 | 1.60 ± 0.43 | <0.0001 * | 2.03 ± 0.77 | 2.27 ± 0.69 | 0.279 |
| MON (×103/μL) [median (range)] | 0.49 (0.32–1.19) | 0.48 (0.32–1.19) | 0.50 (0.34–1.06) | 0.598 | 0.50 (0.32–0.68) | 0.49 (0.35–1.19) | 0.142 |
| PLT (×103/μL) (mean ± SD) | 257.9 ± 69.17 | 272.8 ± 50.25 | 241.8 ± 83.33 | 0.122 | 252.1 ± 71.58 | 266.9 ± 66.20 | 0.473 |
| Malnourishment | |||||||
| ALB (g/dL) (mean ± SD) | 3.82 ± 0.27 | 3.95 ± 0.28 | 3.68 ± 0.19 | 0.0004 * | 3.84 ± 0.29 | 3.80 ± 0.25 | 0.691 |
| CRP (mg/dL) [median (range)] | 0.49 (0.05–162.1) | 0.48 (0.09–162.1) | 0.51 (0.05–35) | 0.439 | 0.31 (0.05–36) | 0.81 (0.09–162.1) | 0.023 * |
| ESR (mm/1st h) [median (range)] | 29 (4–110) | 29 (4–105) | 29 (5–110) | 0.433 | 25 (4–110) | 35 (5–105) | 0.059 ** |
| PNI (mean ± SD) | 48.94 ± 5.25 | 52.64 ± 4.16 | 44.91 ± 2.72 | <0.0001 * | 48.59 ± 5.50 | 49.47 ± 4.94 | 0.578 |
| AC (mean ± SD) | 3.05 ± 1.52 | 2.63 ± 0.96 | 3.44 ± 1.84 | 0.064 | 2.10 ± 0.47 | 4.50 ± 1.43 | <0.0001 * |
| Variables (Mean ± SD) | PreDM Group (n = 50) | T2DM Group (n = 48) | |||
|---|---|---|---|---|---|
| AC | p-Value from Kruskal–Wallis/ One-Way ANOVA | AC | p-Value from Kruskal–Wallis/ One-Way ANOVA | ||
| BMI category (kg/m2) | |||||
| Normal weight (18.5–24.9 kg/m2) | 2.53 ± 1.99 | 0.874 | 3.30 ± 1.86 | 0.826 | |
| Overweight (25–29.9 kg/m2) | 2.78 ± 0.92 | 2.84 ± 1.19 | |||
| Obese (≥30 kg/m2) | 2.81 ± 1.64 | 3.08 ± 1.61 | |||
| WHR | |||||
| Q 1 | 2.82 ± 1.85 | 0.039 * | 2.31 ± 0.68 | 0.042 * | |
| PreDM Value | (0.59–0.86) | ||||
| T2DM Value | (0.78–0.89) | ||||
| Q 2 | 2.21 ± 0.73 | 2.79 ± 1.30 | |||
| PreDM Value | (0.87–0.93) | ||||
| T2DM Value | (0.90–0.93) | ||||
| Q 3 | 2.72 ± 1.46 | 3.11 ± 1.07 | |||
| PreDM Value | (0.94–0.97) | ||||
| T2DM Value | (0.94–0.99) | ||||
| Q 4 | 3.13 ± 1.58 | 4.11 ± 2.26 | |||
| PreDM Value | (0.98–1.64) | ||||
| T2DM Value | (1.00–3.33) | ||||
| WHtR | |||||
| Q 1 | 2.46 ± 0.93 | 0.054 ** | 2.22 ± 0.83 | 0.049 * | |
| PreDM Value | (0.33–0.55) | ||||
| T2DM Value | (0.41–0.57) | ||||
| Q 2 | 2.44 ± 1.22 | 3.05 ± 0.99 | |||
| PreDM Value | (0.56–0.59) | ||||
| T2DM Value | (0.58–0.61) | ||||
| Q 3 | 2.83 ± 1.18 | 3.14 ± 1.24 | |||
| PreDM Value | (0.60–0.64) | ||||
| T2DM Value | (0.62–0.67) | ||||
| Q 4 | 3.20 ± 2.26 | 3.78 ± 2.30 | |||
| PreDM Value | (0.65–0.95) | ||||
| T2DM Value | (0.68–0.79) | ||||
| BAI | |||||
| Q 1 | 2.81 ± 0.93 | 0.619 | 2.55 ± 0.91 | 0.033 * | |
| PreDM Value | (15.84–26.84) | ||||
| T2DM Value | (2.84–28.93) | ||||
| Q 2 | 2.43 ± 1.20 | 2.58 ± 1.11 | |||
| PreDM Value | (26.85–30.64) | ||||
| T2DM Value | (28.94–32.70) | ||||
| Q 3 | 3.15 ± 1.77 | 2.97 ± 0.84 | |||
| PreDM Value | (30.65–37.00) | ||||
| T2DM Value | (32.71–39.73) | ||||
| Q 4 | 2.55 ± 1.83 | 4.10 ± 2.33 | |||
| PreDM Value | (37.01–48.93) | ||||
| T2DM Value | (39.74–52.86) | ||||
| VAI | |||||
| Q 1 | 2.09 ± 0.81 | 0.037 * | 2.09 ± 0.94 | <0.0001 * | |
| PreDM Value | (1.05–2.73) | ||||
| T2DM Value | (1.21–3.27) | ||||
| Q 2 | 2.83 ± 2.16 | 2.74 ± 0.67 | |||
| PreDM Value | (2.74–3.73) | ||||
| T2DM Value | (3.28–4.84) | ||||
| Q 3 | 2.95 ± 1.21 | 2.62 ± 0.75 | |||
| PreDM Value | (3.74–5.46) | ||||
| T2DM Value | (4.85–7.57) | ||||
| Q 4 | 3.04 ± 1.25 | 4.75 ± 1.88 | |||
| PreDM Value | (5.47–35.13) | ||||
| T2DM Value | (7.58–28.59) | ||||
| Variables (Mean ± SD) | PreDM Group (n = 50) | T2DM Group (n = 48) | |||
|---|---|---|---|---|---|
| PNI | p-Value from Kruskal–Wallis/ One-Way ANOVA | PNI | p-Value from Kruskal–Wallis/ One-Way ANOVA | ||
| BMI category (kg/m2) | |||||
| Normal weight (18.5–24.9 kg/m2) | 69.92 ± 7.07 | 0.002 * | 48.27 ± 5.09 | 0.860 | |
| Overweight (25–29.9 kg/m2) | 70.37 ± 4.47 | 47.35 ± 4.03 | |||
| Obese (≥30 kg/m2) | 76.74 ± 7.03 | 48.19 ± 6.87 | |||
| WHR | |||||
| Q 1 | 73.15 ± 5.16 | 0.555 | 51.02 ± 5.99 | 0.355 | |
| PreDM Value | (0.59–0.86) | ||||
| T2DM Value | (0.78–0.89) | ||||
| Q 2 | 75.03 ± 8.18 | 49.03 ± 4.08 | |||
| PreDM Value | (0.87–0.93) | ||||
| T2DM Value | (0.90–0.93) | ||||
| Q 3 | 72.04 ± 5.17 | 47.12 ± 5.49 | |||
| PreDM Value | (0.94–0.97) | ||||
| T2DM Value | (0.94–0.99) | ||||
| Q 4 | 70.85 ± 8 | 48.77 ± 5.26 | |||
| PreDM Value | (0.98–1.64) | ||||
| T2DM Value | (1.00–3.33) | ||||
| WHtR | |||||
| Q 1 | 71.89 ± 4.67 | 0.221 | 49.29 ± 5.2 | 0.419 | |
| PreDM Value | (0.33–0.55) | ||||
| T2DM Value | (0.41–0.57) | ||||
| Q 2 | 72.17 ± 5.86 | 50.45 ± 6.77 | |||
| PreDM Value | (0.56–0.59) | ||||
| T2DM Value | (0.58–0.61) | ||||
| Q 3 | 73.92 ± 8.4 | 46.95 ± 5.29 | |||
| PreDM Value | (0.60–0.64) | ||||
| T2DM Value | (0.62–0.67) | ||||
| Q 4 | 72.58 ± 8.02 | 49.35 ± 3.48 | |||
| PreDM Value | (0.65–0.95) | ||||
| T2DM Value | (0.68–0.79) | ||||
| BAI | |||||
| Q 1 | 69.87 ± 6.20 | 0.296 | 49.12 ± 5.23 | 0.034 * | |
| PreDM Value | (15.84–26.84) | ||||
| T2DM Value | (2.84–28.93) | ||||
| Q 2 | 72.97 ± 5.35 | 48.36 ± 6.23 | |||
| PreDM Value | (26.85–30.64) | ||||
| T2DM Value | (28.94–32.70) | ||||
| Q 3 | 72.67 ± 8.77 | 47.22 ± 3.12 | |||
| PreDM Value | (30.65–37.00) | ||||
| T2DM Value | (32.71–39.73) | ||||
| Q 4 | 75.23 ± 6.11 | 51.06 ± 5.77 | |||
| PreDM Value | (37.01–48.93) | ||||
| T2DM Value | (39.74–52.86) | ||||
| VAI | |||||
| Q 1 | 73.53 ± 6.14 | 0.052 ** | 47.48 ± 4.42 | 0.053 ** | |
| PreDM Value | (1.05–2.73) | ||||
| T2DM Value | (1.21–3.27) | ||||
| Q 2 | 70.62 ± 6.48 | 48.24 ± 5.71 | |||
| PreDM Value | (2.74–3.73) | ||||
| T2DM Value | (3.28–4.84) | ||||
| Q 3 | 72.28 ± 4.92 | 49.66 ± 6.44 | |||
| PreDM Value | (3.74–5.46) | ||||
| T2DM Value | (4.85–7.57) | ||||
| Q 4 | 74.54 ± 9.34 | 50.37 ± 4.29 | |||
| PreDM Value | (5.47–35.13) | ||||
| T2DM Value | (7.58–28.59) | ||||
| Variables (Mean ± SD) [Median (Range)] | PreDM Cohort (n = 50) | T2DM Cohort (n = 48) | ||||
|---|---|---|---|---|---|---|
| Female | Male | p-Value from Pearson’s Chi-Squared/ Student’s t-Test | Female | Male | p-Value from Pearson’s Chi-Squared/ Student’s t-Test | |
| Age (years) (mean ± SD) | 47.90 ± 8.02 | 49.65 ± 7.21 | 0.435 | 70.17 ± 11.44 | 58.33 ± 9.37 | 0.0003 * |
| BMI category (kg/m2) (mean ± SD) | 31.47 ± 6.27 | 28.84 ± 6.67 | 0.163 | 31.86 ± 5.89 | 30.51 ± 4.26 | 0.369 |
| Normal weight (18.5–24.9 kg/m2) | 24.50 ± 0.42 | 23.36 ± 0.75 | 0.021 * | 23.26 ± 1.25 | 23.57 ± 0.93 | 0.746 |
| Overweight (25–29.9 kg/m2) | 27.13 ± 1.19 | 27.84 ± 1.65 | 0.273 | 26.08 ± 0.88 | 27.81 ± 1.56 | 0.071 |
| Obese (≥30 kg/m2) | 37.18 ± 4.37 | 38.11 ± 6.62 | 0.724 | 34.74 ± 4.31 | 33.78 ± 2.17 | 0.471 |
| Weight (kg) (mean ± SD) | 78.85 ± 16.33 | 89.74 ± 21.91 | 0.049 * | 81.90 ± 16.11 | 93.46 ± 16.88 | 0.019 * |
| Height (cm) (mean ± SD) | 168.9 ± 10.91 | 164.2 ± 10.78 | 0.140 | 160.3 ± 6.76 | 175 ± 6.80 | <0.0001 * |
| WC (cm) (mean ± SD) | 101.2 ± 15.1 | 102.8 ± 21.01 | 0.760 | 102.7 ± 11.49 | 108.9 ± 13.38 | 0.090 |
| HC (cm) (mean ± SD) | 109.6 ± 14.75 | 105 ± 9.86 | 0.227 | 109.8 ± 9.24 | 110.9 ± 19.47 | 0.814 |
| WHR (mean ± SD) | 0.92 ± 0.09 | 0.98 ± 0.18 | 0.171 | 0.93 ± 0.07 | 1.05 ± 0.49 | 0.257 |
| WHtR (mean ± SD) | 0.59 ± 0.08 | 0.62 ± 0.10 | 0.351 | 0.64 ± 0.07 | 0.62 ± 0.08 | 0.420 |
| BAI (mean ± SD) | 32.20 ± 7.76 | 32.13 ± 5.47 | 0.972 | 36.38 ± 6.56 | 30.08 ± 9.28 | 0.009 * |
| VAI [median (range)] | 4.96 (1.17–35.13) | 3.10 (1.05–5.57) | <0.0001 * | 5.39 (2.26–28.59) | 4.01 (1.21–22.26) | 0.039* |
| AC (mean ± SD) | 2.63 ± 1.42 | 2.90 ± 1.54 | 0.531 | 2.87 ± 1.53 | 3.23 ± 1.53 | 0.413 |
| PNI (mean ± SD) | 72.87 ± 6.97 | 72.42 ± 6.74 | 0.822 | 49.56 ± 6.20 | 48.31 ± 4.12 | 0.415 |
| TC (mean ± SD) | 177.5 ± 45.74 | 191 ± 53.51 | 0.347 | 194.3 ± 61.31 | 190.5 ± 61.93 | 0.834 |
| TG (mg/dL) [median (range)] | 111.5 (45–515) | 99.5 (51–155) | 0.050 * | 149.5 (57–358) | 125.5 (45–580) | 0.483 |
| LDL-c (mg/dL) (mean ± SD) | 99.85 ± 38.82 | 120 ± 49.29 | 0.113 | 110 ± 43.51 | 101.6 ± 33.04 | 0.045 * |
| HDL-c (mg/dL) (mean ± SD) | 52.16 ± 13.88 | 52.22 ± 14.13 | 0.987 | 51.67 ± 12.70 | 47.09 ± 11.47 | 0.196 |
| HbA1C (%) (mean ± SD) | 5.77 ± 0.50 | 5.82 ± 0.43 | 0.733 | 10.07 ± 2.08 | 9.52 ± 1.46 | 0.306 |
| CKD-EPI (mL/min/1.73 m2) (mean ± SD) | 85.96 ± 28.99 | 93.00 ± 25.17 | 0.039 * | 35.89 ± 9.15 | 51.96 ± 10.48 | <0.0001 * |
| Parameter | AUC | Std. Error | Cut-Off Values | Sensitivity % | Specificity % | Youden Index | p-Value |
|---|---|---|---|---|---|---|---|
| HbA1c | 1.000 | 0.000 | 6.90 | 100.00 | 100.00 | 1.000 | <0.0001 |
| ALB | 1.000 | 0.000 | 5.00 | 100.00 | 100.00 | 1.000 | <0.0001 |
| FPG | 0.999 | 0.001 | 122.50 | 97.92 | 100.00 | 0.980 | <0.0001 |
| PNI | 0.997 | 0.002 | 61.45 | 97.92 | 98.00 | 0.960 | <0.0001 |
| CKD-EPI | 0.920 | 0.026 | 61.41 | 91.67 | 80.00 | 0.720 | <0.0001 |
| 2hPG | 0.911 | 0.032 | 197.50 | 81.25 | 100.00 | 0.810 | <0.0001 |
| AC | 0.906 | 0.036 | 3.90 | 79.17 | 98.00 | 0.770 | <0.0001 |
| Creatinine | 0.899 | 0.032 | 1.34 | 83.33 | 86.00 | 0.690 | <0.0001 |
| VAI | 0.617 | 0.056 | 3.96 | 64.58 | 60.00 | 0.250 | 0.045 |
| BAI | 0.558 | 0.058 | 30.45 | 66.67 | 50.00 | 0.170 | 0.318 |
| HDL-c | 0.536 | 0.058 | 49.11 | 56.25 | 54.00 | 0.100 | 0.529 |
| LDL-c | 0.522 | 0.059 | 105.40 | 52.08 | 58 | 0.100 | 0.703 |
| TC | 0.529 | 0.059 | 196.50 | 52.08 | 56.00 | 0.080 | 0.618 |
Disclaimer/Publisher’s Note: The statements, opinions and data contained in all publications are solely those of the individual author(s) and contributor(s) and not of MDPI and/or the editor(s). MDPI and/or the editor(s) disclaim responsibility for any injury to people or property resulting from any ideas, methods, instructions or products referred to in the content. |
© 2025 by the authors. Licensee MDPI, Basel, Switzerland. This article is an open access article distributed under the terms and conditions of the Creative Commons Attribution (CC BY) license (https://creativecommons.org/licenses/by/4.0/).
Share and Cite
Assani, M.-Z.; Novac, M.B.; Dijmărescu, A.L.; Văduva, C.-C.; Vladu, I.M.; Clenciu, D.; Mitrea, A.; Ahrițculesei, R.-V.; Stroe-Ionescu, A.-Ș.; Assani, A.-D.; et al. Potential Association Between Atherogenic Coefficient, Prognostic Nutritional Index, and Various Obesity Indices in Diabetic Nephropathy. Nutrients 2025, 17, 1339. https://doi.org/10.3390/nu17081339
Assani M-Z, Novac MB, Dijmărescu AL, Văduva C-C, Vladu IM, Clenciu D, Mitrea A, Ahrițculesei R-V, Stroe-Ionescu A-Ș, Assani A-D, et al. Potential Association Between Atherogenic Coefficient, Prognostic Nutritional Index, and Various Obesity Indices in Diabetic Nephropathy. Nutrients. 2025; 17(8):1339. https://doi.org/10.3390/nu17081339
Chicago/Turabian StyleAssani, Mohamed-Zakaria, Marius Bogdan Novac, Anda Lorena Dijmărescu, Constantin-Cristian Văduva, Ionela Mihaela Vladu, Diana Clenciu, Adina Mitrea, Roxana-Viorela Ahrițculesei, Alexandra-Ștefania Stroe-Ionescu, Alexandru-Dan Assani, and et al. 2025. "Potential Association Between Atherogenic Coefficient, Prognostic Nutritional Index, and Various Obesity Indices in Diabetic Nephropathy" Nutrients 17, no. 8: 1339. https://doi.org/10.3390/nu17081339
APA StyleAssani, M.-Z., Novac, M. B., Dijmărescu, A. L., Văduva, C.-C., Vladu, I. M., Clenciu, D., Mitrea, A., Ahrițculesei, R.-V., Stroe-Ionescu, A.-Ș., Assani, A.-D., Caragea, D. C., Boldeanu, M. V., Siloși, I., & Boldeanu, L. (2025). Potential Association Between Atherogenic Coefficient, Prognostic Nutritional Index, and Various Obesity Indices in Diabetic Nephropathy. Nutrients, 17(8), 1339. https://doi.org/10.3390/nu17081339