
From Mother–Fetus Dyad to Mother–Milk–Infant Triad: Sex Differences in Macronutrient Composition of Breast Milk

 , , and
Abstract
:1. Introduction
2. Materials and Methods
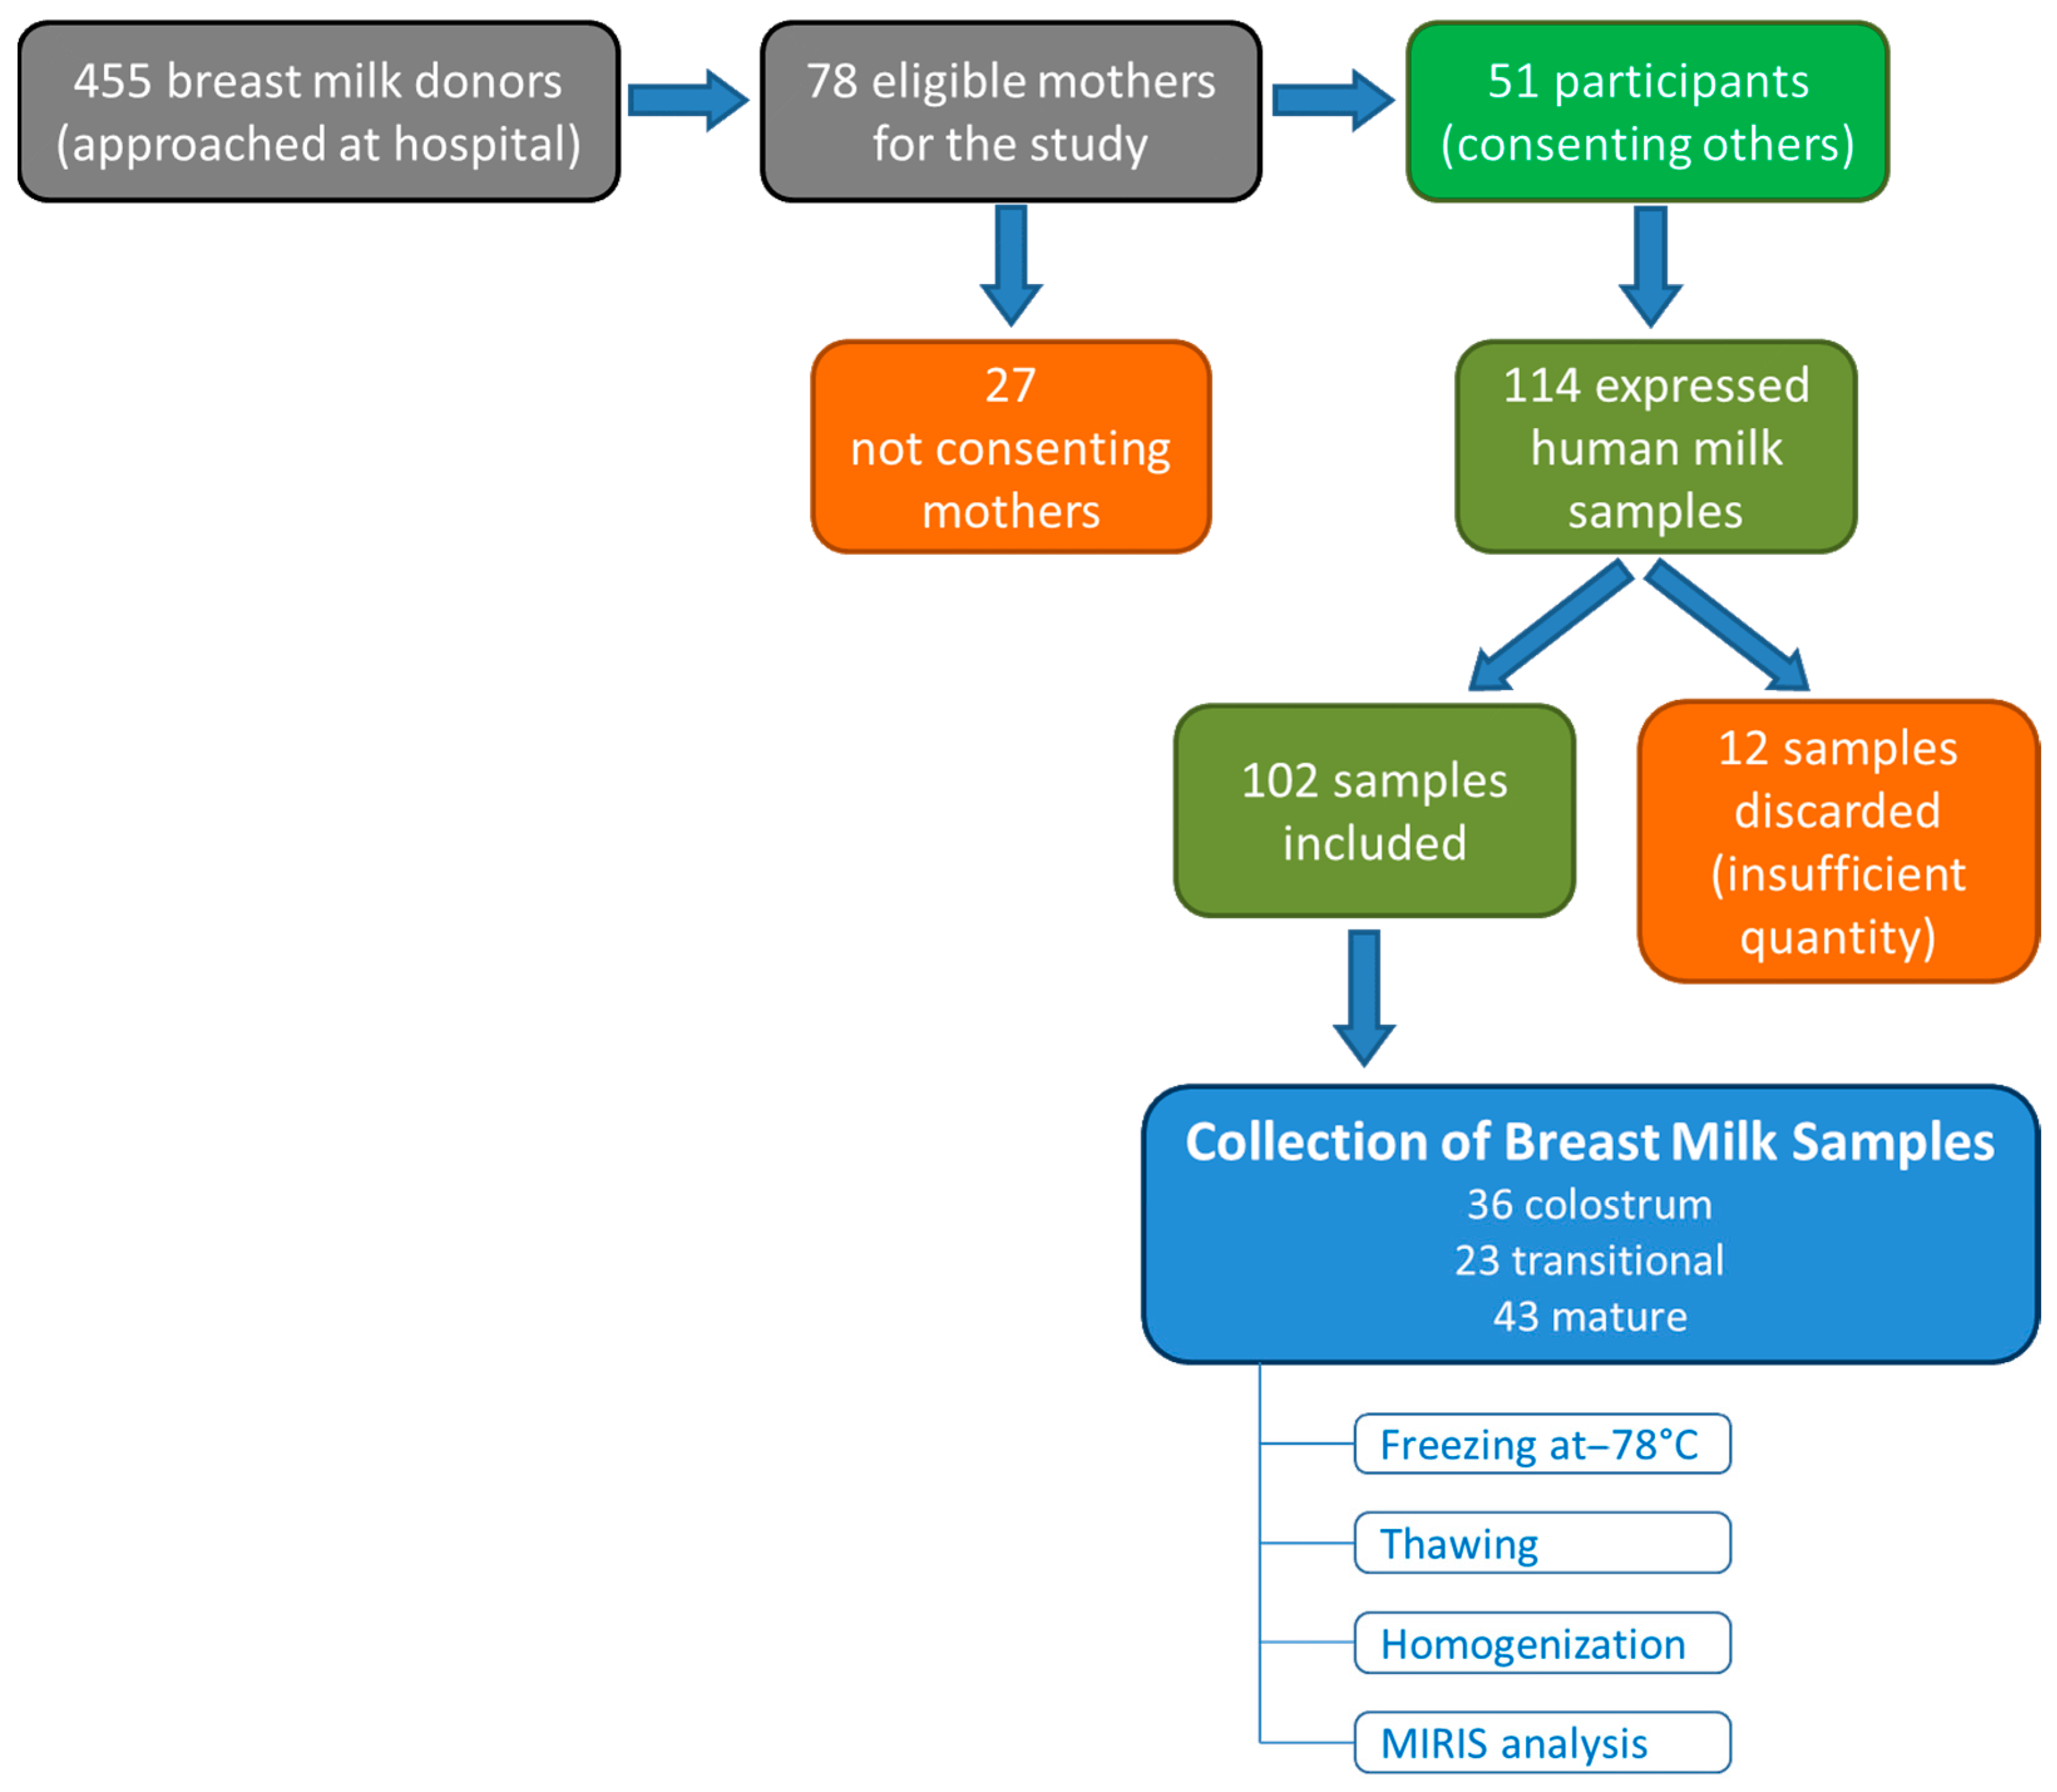
2.1. Study Design and Population
2.2. Breast Milk Collection and Analysis
2.3. Analysis
2.4. Statistical Analysis
3. Results
4. Discussion
5. Conclusions
Supplementary Materials
Author Contributions
Funding
Institutional Review Board Statement
Informed Consent Statement
Data Availability Statement
Conflicts of Interest
Abbreviations
| BM | Breast milk |
| CH | Carbohydrate |
| HMOs | Human milk oligosaccharides |
| IQR | Interquartile range |
| NPN | Non-protein nitrogen |
| SD | Standard deviation |
| TS | Total solids |
References
- Hermansson, H.; Kumar, H.; Collado, M.C.; Salminen, S.; Isolauri, E.; Rautava, S. Breast milk microbiota is shaped by mode of delivery and intrapartum antibiotic exposure. Front. Nutr. 2019, 6, 4. [Google Scholar] [CrossRef]
- Dror, D.K.; Allen, L.H. Overview of nutrients in humanmilk. Adv. Nutr. 2018, 9, 278S–294S. [Google Scholar] [CrossRef]
- Lönnerdal, B.; Erdmann, P.; Thakkar, S.K.; Sauser, J.; Destaillats, F. Longitudinal evolution of true protein, amino acids and bioactive proteins in breast milk: A developmental perspective. J. Nutr. Biochem. 2017, 41, 1–11. [Google Scholar] [CrossRef]
- Hendricks, G.M.; Guo, M. Bioactive components in human milk. In Human Milk Biochemistry and Infant Formula Manufacturing Technology; Elsevier Ltd.: Amsterdam, The Netherlands, 2014; pp. 33–54. [Google Scholar]
- Ballard, O.; Morrow, A.L. Human Milk Composition. Nutrients and Bioactive Factors. Pediatr. Clin. N. Am. 2013, 60, 49–74. [Google Scholar] [CrossRef]
- Kim, S.Y.; Yi, D.Y. Components of human breast milk: From macronutrient to microbiome and microRNA. Clin. Exp. Pediatrics. Korean Pediatr. Soc. 2020, 63, 301–309. [Google Scholar] [CrossRef]
- Vassilopoulou, E.; Agostoni, C.; Feketea, G.; Alberti, I.; Gianni, M.L.; Milani, G.P. The Role of Breastfeeding in Acute Respiratory Infections in Infancy. Pediatr. Infect. Dis. J. 2024, 43, 1090–1099. [Google Scholar] [CrossRef]
- Petersohn, I.; Hellinga, A.H.; van Lee, L.; Keukens, N.; Bont, L.; Hettinga, K.A.; Feskens, E.J.M.; Brouwer-Brolsma, E.M. Maternal diet and human milk composition: An updated systematic review. Front. Nutr. 2023, 10, 1320560. [Google Scholar] [CrossRef]
- Samuel, T.M.; Zhou, Q.; Giuffrida, F.; Munblit, D.; Verhasselt, V.; Thakkar, S.K. Nutritional and Non-nutritional Composition of Human Milk Is Modulated by Maternal, Infant, and Methodological Factors. Front. Nutr. 2020, 7, 576133. [Google Scholar] [CrossRef]
- Saarela, T.; Kokkonen, J.; Koivisto, M. Macronutrient and energy contents of human milk fractions during the first six months of lactation. Acta Paediatr. Int. J. Paediatr. 2005, 94, 1176–1181. [Google Scholar] [CrossRef]
- Khelouf, N.; Haoud, K.; Meziani, S.; Fizir, M.; Ghomari, F.N.; Boumediene, K.M.; Kadi, N. Effect of infant’s gender and lactation period on biochemical and energy breast milk composition of lactating mothers from Algeria. J. Food Compos. Anal. 2023, 115, 104889. [Google Scholar] [CrossRef]
- Hosseini, M.; Valizadeh, E.; Hosseini, N.; Khatibshahidi, S.; Raeisi, S. The Role of Infant Sex on Human Milk Composition. Breastfeed. Med. 2020, 15, 341–346. [Google Scholar] [CrossRef]
- Bernardes-Loch, R.M.; Ribeiro, A.C.; Ramírez-López, C.J.; Loch Gomes, R.A.; Barros, E.; Filomeno Fontes, E.A.; Baracat-Pereira, M.C. Human milk proteins differentiate over the sex of newborns and across stages of lactation. Clin. Nutr. ESPEN 2024, 62, 144–156. [Google Scholar] [CrossRef]
- Mangel, L.; Morag, S.; Mandel, D.; Marom, R.; Moran-Lev, H.; Lubetzky, R. The Effect of Infant’s Sex on Human Milk Macronutrients Content: An Observational Study. Breastfeed. Med. 2020, 15, 568–571. [Google Scholar] [CrossRef]
- Da Costa, T.H.M.; Haisma, H.; Wells, J.C.K.; Mander, A.P.; Whitehead, R.G.; Bluck, L.J.C. How much human milk do infants consume? Data from 12 countries using a standardized stable isotope methodology. J. Nutr. 2010, 140, 2227–2232. [Google Scholar] [CrossRef]
- Galante, L.; Milan, A.M.; Reynolds, C.M.; Cameron-Smith, D.; Vickers, M.H.; Pundir, S. Sex-specific human milk composition: The role of infant sex in determining early life nutrition. Nutrients 2018, 10, 1194. [Google Scholar] [CrossRef]
- Alur, P.; Ramarao, S. Sex differences in preterm nutrition and growth: The evidence from human milk associated studies. J. Perinatol. 2022, 42, 987–992. [Google Scholar] [CrossRef]
- Larson-Meyer, D.E.; Schueler, J.; Kyle, E.; Austin, K.J.; Hart, A.M.; Alexander, B.M. Appetite-Regulating Hormones in Human Milk: A Plausible Biological Factor for Obesity Risk Reduction? J. Hum. Lact. 2020, 37, 603–614. [Google Scholar] [CrossRef]
- Badillo-Suárez, P.A.; Rodríguez-Cruz, M.; Bernabe-García, M.; Villa-Morales, J.; Iglesias-Rodríguez, R.; Canizales-Quinteros, S.; Carmona-Sierra, F.V. Influence of Maternal Body Fat on Levels of Insulin, Insulin-Like Growth Factor-1, and Obestatin. J. Hum. Lact. 2022, 38, 619–632. [Google Scholar] [CrossRef]
- Hassiotou, F.; Geddes, D.T. Programming of appetite control during breastfeeding as a preventative strategy against the obesity epidemic. J. Hum. Lact. 2014, 30, 136–142. [Google Scholar] [CrossRef]
- Eckart, E.K.; Peck, J.D.; Kharbanda, E.O.; Nagel, E.M.; Fields, D.A.; Demerath, E.W. Infant sex differences in human milk intake and composition from 1- to 3-month post-delivery in a healthy United States cohort. Ann. Hum. Biol. 2021, 48, 455–465. [Google Scholar] [CrossRef]
- Chan, D.; Becker, A.B.; Moraes, T.J.; Mandhane, P.J.; Sears, M.R.; Turvey, S.E.; Subbarao, P.; Field, C.J.; Azad, M.B. Sex-specific association of human milk hormones and asthma in the CHILD cohort. Pediatr. Allergy Immunol. 2020, 31, 570–573. [Google Scholar] [CrossRef]
- Lemas, D.J.; Yee, S.; Cacho, N.; Miller, D.; Cardel, M.; Gurka, M.; Janicke, D.; Shenkman, E. Exploring the contribution of maternal antibiotics and breastfeeding to development of the infant microbiome and pediatric obesity. Semin. Fetal Neonatal Med. 2016, 21, 406–409. [Google Scholar] [CrossRef]
- Galante, L.; Reynolds, C.M.; Milan, A.M.; Alexander, T.; Bloomfield, F.H.; Jiang, Y.; Asadi, S.; Muelbert, M.; Cameron-Smith, D.; Pundir, S.; et al. Metabolic Hormone Profiles in Breast Milk from Mothers of Moderate-Late Preterm Infants Are Associated with Growth from Birth to 4 Months in a Sex-Specific Manner. Front. Nutr. 2021, 8, 641227. [Google Scholar] [CrossRef]
- Garofoli, F.; Civardi, E.; Pisoni, C.; Angelini, M.; Ghirardello, S. Anti-Inflammatory and Anti-Allergic Properties of Colostrum from Mothers of Full-Term and Preterm Babies: The Importance of Maternal Lactation in the First Days. Nutrients 2023, 15, 4249. [Google Scholar] [CrossRef]
- Rio-Aige, K.; Fernández-Bargalló, A.; Vegas-Lozano, E.; Miñarro-Alonso, A.; Castell, M.; Selma-Royo, M.; Martínez-Costa, C.; Rodríguez-Lagunas, M.J.; Collado, M.C.; Pérez-Cano, F.J. Breast milk immune composition varies during the transition stage of lactation: Characterization of immunotypes in the MAMI cohort. Front. Nutr. 2023, 10, 1252815. [Google Scholar] [CrossRef]
- Italianer, M.F.; Naninck, E.F.G.; Roelants, J.A.; van der Horst, G.T.J.; Reiss, I.K.M.; van Goudoever, J.B.; Joosten, K.F.M.; Chaves, I.; Vermeulen, M.J. Circadian variation in human milk composition, a systematic review. Nutrients 2020, 12, 2328. [Google Scholar] [CrossRef]
- Han, S.M.; Derraik, J.G.B.; Binia, A.; Sprenger, N.; Vickers, M.H.; Cutfield, W.S. Maternal and Infant Factors Influencing Human Milk Oligosaccharide Composition: Beyond Maternal Genetics. J. Nutr. 2021, 151, 1383–1393. [Google Scholar] [CrossRef]
- Ramiro-Cortijo, D.; Gila-Diaz, A.; Herranz Carrillo, G.; Cañas, S.; Gil-Ramírez, A.; Ruvira, S.; Martin-Cabrejas, M.A.; Arribas, S.M. Influence of Neonatal Sex on Breast Milk Protein and Antioxidant Content in Spanish Women in the First Month of Lactation. Antioxidants 2022, 11, 1472. [Google Scholar] [CrossRef]
- Alhindi, M.; Musallam, H.; Elhefian, E. Characteristics of Human Breast Milk Based on Infant’s Gender. J. Basic. Appl. Res. Biomed. 2019, 5, 8–10. [Google Scholar] [CrossRef]
- Fujita, M.; Roth, E.; Lo, Y.J.; Hurst, C.; Vollner, J.; Kendell, A. In poor families, mothers’ milk is richer for daughters than sons: A test of Trivers-Willard hypothesis in agropastoral settlements in Northern Kenya. Am. J. Phys. Anthropol. 2012, 149, 52–59. [Google Scholar] [CrossRef]
- Hochman, V.G.A.; de Abreu Nascimento, R.C.F.; da Silva, C.B.M.; Quinderé, P.N.A.; Melo, R.X.; Velarde, L.G.C.; Bueno, A.C.; Vieira, A.A. Relationship between Maternal Age and Macronutrient Content of Colostrum. J. Hum. Lact. 2024, 40, 286–295. [Google Scholar] [CrossRef] [PubMed]
- Okman, E.; Beser, E.; Kucukoglu Keser, M.; Sari, F.N.; Alyamac Dizdar, E. The Relationship of Adolescent Motherhood to the Macronutrient Content of Breast Milk. Breastfeed. Med. 2022, 17, 764–767. [Google Scholar] [CrossRef]
- Powe, C.E.; Knott, C.D.; Conklin-Brittain, N. Infant sex predicts breast milk energy content. Am. J. Hum. Biol. 2010, 22, 50–54. [Google Scholar] [CrossRef]
- Hahn, W.H.; Song, J.H.; Song, S.; Kang, N. Do gender and birth height of infant affect calorie of human milk? An association study between human milk macronutrient and various birth factors. J. Matern. Fetal Neonatal Med. 2017, 30, 1608–1612. [Google Scholar] [CrossRef]
- Wang, C.; Jiang, S.; Cheng, J.; Wang, C.; Guo, M. Deciphering the difference of casein fraction in human milk associated with infant gender using quantitative proteomics. Int. J. Biol. Macromol. 2023, 247, 125796. [Google Scholar] [CrossRef]
- Suwaydi, M.A.; Lai, C.T.; Warden, A.H.; Perrella, S.L.; McEachran, J.L.; Wlodek, M.E.; Geddes, D.T.; Gridneva, Z. Investigation of Relationships between Intakes of Human Milk Total Lipids and Metabolic Hormones and Infant Sex and Body Composition. Nutrients 2024, 16, 2739. [Google Scholar] [CrossRef]
- Tonon, K.M.; de Morais, M.B.; Abrão, A.C.F.V.; Miranda, A.; Morais, T.B. Maternal and Infant Factors Associated with Human Milk Oligosaccharides Concentrations According to Secretor and Lewis Phenotypes. Nutrients 2019, 11, 1358. [Google Scholar] [CrossRef]
- Wang, M.; Zhao, Z.; Zhao, A.; Zhang, J.; Wu, W.; Ren, Z.; Wang, P.; Zhang, Y. Neutral human milk oligosaccharides are associated with multiple fixed and modifiable maternal and infant characteristics. Nutrients 2020, 12, 826. [Google Scholar] [CrossRef]
- Borewicz, K.; Gu, F.; Saccenti, E.; Hechler, C.; Beijers, R.; de Weerth, C.; van Leeuwen, S.S.; Schols, H.A.; Smidt, H. The association between breastmilk oligosaccharides and faecal microbiota in healthy breastfed infants at two, six, and twelve weeks of age. Sci. Rep. 2020, 10, 4270. [Google Scholar] [CrossRef]
- Caffé, B.; Blackwell, A.; Fehrenkamp, B.D.; Williams, J.E.; Pace, R.M.; Lackey, K.A.; Ruiz, L.; Rodríguez, J.M.; McGuire, M.A.; Foster, J.A.; et al. Human milk immune factors, maternal nutritional status, and infant sex: The INSPIRE study. Am. J. Hum. Biol. 2023, 35, e23943. [Google Scholar] [CrossRef]
- Dritsakou, K.; Liosis, G.; Valsami, G.; Polychronopoulos, E.; Skouroliakou, M. The impact of maternal-and neonatal-associated factors on human milk’s macronutrients and energy. J. Matern. Fetal Neonatal Med. 2017, 30, 1302–1308. [Google Scholar] [CrossRef] [PubMed]
- Andreas, N.J.; Kampmann, B.; Mehring Le-Doare, K. Human breast milk: A review on its composition and bioactivity. Early Hum. Dev. 2015, 91, 629–635. [Google Scholar] [CrossRef] [PubMed]
- Enninga, E.A.L.; Nevala, W.K.; Creedon, D.J.; Markovic, S.N.; Holtan, S.G. Fetal Sex-Based Differences in Maternal Hormones, Angiogenic Factors, and Immune Mediators during Pregnancy and the Postpartum Period. Am. J. Reprod. Immunol. 2015, 73, 251–262. [Google Scholar] [CrossRef] [PubMed]
- Quinn, E.A. Centering human milk composition as normal human biological variation. Am. J. Hum. Biol. 2021, 33, e23564. [Google Scholar] [CrossRef]
- Norris, S.A.; Nyati, L.H.; Murphy-Alford, A.; Lucas, N.; Santos, I.S.; Costa, C.S.; Kuriyan, R.; Wickranasinghe, V.P.; Ariff, S.; Jayasinghe, S.; et al. Infant growth and body composition from birth to 24 months: Are infants developing the same? Eur. J. Clin. Nutr. 2024, 78, 952–962. [Google Scholar] [CrossRef]
- Moore, S.E. Sex differences in growth and neurocognitive development in infancy and early childhood. Proc. Nutr. Soc. 2024, 83, 221–228. [Google Scholar] [CrossRef]
- Tarabeih, M.; Sabbah, M.; Yahya, O.; Bisharat, S.; Awawdi, K. Factors Contributing to Breastfeeding Cessation among Arab Women in Israel. Nutrients 2025, 17, 735. [Google Scholar] [CrossRef]


| p-Value | Method of Comparison | |||||||
|---|---|---|---|---|---|---|---|---|
| Colostrum | Transitional ΒΜ | Mature ΒΜ | Colostrum | Transitional ΒΜ | Mature ΒΜ | Lactation Stage | ||
| Fat | Male | 0.022 | 0.003 | 0.265 | M-W | M-W | t-test | K-W/D-B |
| Female | 0.087 | 0.150 | 0.401 | K-W/D-B | ||||
| CH | Male | 0.002 | 0.564 | 0.001 | M-W | t-test | M-W | K-W/D-B |
| Female | 0.027 | 0.194 | 0.216 | K-W/D-B | ||||
| Crude Protein | Male | 0.019 | 0.049 | 0.382 | M-W | M-W | M-W | K-W/D-B |
| Female | <0.001 | 0.613 | 0.021 | K-W/D-B | ||||
| True Protein | Male | 0.029 | 0.026 | 0.507 | M-W | M-W | M-W | K-W/D-B |
| Female | <0.001 | 0.379 | 0.016 | K-W/D-B | ||||
| NPN | Male | 0.149 | 0.098 | 0.022 | M-W | M-W | M-W | K-W/D-B |
| Female | 0.002 | <0.001 | <0.001 | K-W/D-B | ||||
| TS | Male | 0.002 | 0.005 | 0.011 | M-W | M-W | M-W | K-W/D-B |
| Female | 0.165 | 0.581 | 0.677 | W-ANOVA/BPh | ||||
| Energy | Male | 0.137 | 0.011 | 0.252 | t-test | M-W | t-test | K-W/D-B |
| Female | 0.108 | 0.165 | 0.375 | W-ANOVA/BPh | ||||
| n | Mean | Minimum | Maximum | Std, Deviation | SD Ratio | Inter- Quartile Range | U | z | Asymptotic p | Exact p | r | |||
|---|---|---|---|---|---|---|---|---|---|---|---|---|---|---|
| Colostrum | Fat | Male | 19 | 1.82 | 0.8 | 3.3 | 0.78 | 1.2 | 1.2 | 134.5 | −0.86 | 0.391 | 0.397 | 0.14 |
| Female | 18 | 1.97 | 1.1 | 3.0 | 0.65 | 1.1 | ||||||||
| CH | Male | 19 | 7.28 | 4.3 | 8.6 | 1.41 | 1.8 | 1.5 | 103.5 | −1.84 | 0.066 | 0.066 | 0.31 | |
| Female | 18 | 8.14 | 6.9 | 9.3 | 0.78 | 1.3 | ||||||||
| Crude Protein | Male | 19 | 2.96 | 1.4 | 5.5 | 1.12 | 1.8 | 1.5 | 50 | −3.55 | <0.001 | <0.001 | 0.59 | |
| Female | 18 | 1.97 | 1.5 | 4.3 | 0.63 | 0.2 | ||||||||
| True Protein | Male | 19 | 2.40 | 1.1 | 4.4 | 0.93 | 1.8 | 1.3 | 56.5 | −3.98 | <0.001 | <0.001 | 0.62 | |
| Female | 18 | 1.59 | 1.2 | 3.5 | 0.51 | 0.3 | ||||||||
| NPN | Male | 19 | 0.56 | 0.2 | 1.1 | 0.25 | 1.9 | 0.4 | 86.5 | −2.43 | 0.015 | 0.016 | 0.40 | |
| Female | 18 | 0.38 | 0.2 | 0.8 | 0.13 | 0.1 | ||||||||
| TS | Male | 19 | 12.37 | 9.4 | 15 | 1.93 | 3.3 | 3.6 | 125 | −1.16 | 0.247 | 0.257 | 0.19 | |
| Female | 18 | 12.16 | 11.4 | 13.6 | 0.58 | 0.8 | ||||||||
| Transitional BM | Fat | Male | 12 | 2.69 | 1.6 | 6.3 | 1.5 | 3.3 | 1.25 | 23 | −2.65 | 0.008 | 0.007 | 0.55 |
| Female | 11 | 4.3 | 3.7 | 4.9 | 0.45 | 0.85 | ||||||||
| Crude Protein | Male | 12 | 1.99 | 1.6 | 2.7 | 0.37 | 1.4 | 0.43 | 61.5 | −0.28 | 0.78 | 0.786 | 0.06 | |
| Female | 11 | 1.91 | 1.5 | 2.3 | 0.27 | 0.45 | ||||||||
| True Protein | Male | 12 | 1.66 | 1.4 | 2.2 | 0.28 | 1.0 | 0.3 | 55 | −0.68 | 0.496 | 0.525 | 0.14 | |
| Female | 11 | 1.54 | 1.1 | 1.9 | 0.27 | 0.45 | ||||||||
| NPN | Male | 12 | 0.33 | 0.1 | 0.5 | 0.13 | 1.3 | 0.11 | 51.5 | −0.94 | 0.346 | 0.379 | 0.2 | |
| Female | 11 | 0.37 | 0.1 | 0.5 | 0.1 | 0 | ||||||||
| TS | Male | 12 | 13.29 | 12.1 | 17.2 | 1.5 | 2.5 | 1.83 | 19 | −2.9 | 0.004 | 0.003 | 0.6 | |
| Female | 11 | 15.13 | 14 | 15.9 | 0.61 | 0.95 | ||||||||
| Energy | Male | 12 | 66.98 | 55 | 102 | 14.08 | 2.9 | 14.68 | 14 | −3.2 | 0.001 | 0.001 | 0.67 | |
| Female | 11 | 83.18 | 76 | 89 | 4.85 | 9.0 | ||||||||
| Mature BM | CH | Male | 21 | 8.47 | 6 | 9.4 | 0.82 | 2.1 | 0.65 | 196 | −0.85 | 0.393 | 0.404 | 0.13 |
| Female | 22 | 8.74 | 7.7 | 9.4 | 0.40 | 0.38 | ||||||||
| Crude Protein | Male | 21 | 1.22 | 0.9 | 1.6 | 0.19 | 0.9 | 0.2 | 227 | −0.09 | 0.932 | 0.942 | 0.01 | |
| Female | 22 | 1.24 | 1 | 1.6 | 0.21 | 0.35 | ||||||||
| True Protein | Male | 21 | 0.98 | 0.7 | 1.3 | 0.14 | 0.8 | 0.20 | 227.5 | −0.09 | 0.931 | 0.942 | 0.01 | |
| Female | 22 | 1.00 | 0.8 | 1.3 | 0.18 | 0.35 | ||||||||
| NPN | Male | 21 | 0.24 | 0.1 | 0.4 | 0.09 | 1.5 | 0.1 | 225 | −0.16 | 0.876 | 0.894 | 0.02 | |
| Female | 22 | 0.24 | 0.2 | 0.3 | 0.06 | 0.1 | ||||||||
| TS | Male | 21 | 13.51 | 12.1 | 16.7 | 1.34 | 0.8 | 2.0 | 226 | −0.12 | 0.903 | 0.913 | 0.02 | |
| Female | 22 | 13.63 | 10.8 | 17.7 | 1.72 | 2.7 |
| Colostrum | Transitional BM | Mature BM | |||||||
|---|---|---|---|---|---|---|---|---|---|
| Energy | CH | Fat | Energy | ||||||
| Male | Female | Male | Female | Male | Female | Male | Female | ||
| Descriptive Statistics | n | 19 | 17 | 12 | 11 | 21 | 22 | 21 | 22 |
| Mean | 59.21 | 59.00 | 8.37 | 8.84 | 3.61 | 3.46 | 73.25 | 72.36 | |
| Minimum | 42 | 51 | 7.4 | 8.5 | 2 | 1 | 59 | 48 | |
| Maximum | 72 | 67 | 9.0 | 9.5 | 5.7 | 6.5 | 97 | 105 | |
| SD | 9.44 | 4.92 | 0.41 | 0.29 | 1.07 | 1.48 | 10.27 | 14.89 | |
| SD ratio | 1.9 | 1.4 | 0.7 | 0.7 | |||||
| Inter-quartile Range | 14 | 8 | 0.45 | 0.35 | 1.8 | 2.9 | 13.0 | 24.5 | |
| t-test | Mean Difference | 0.21 | −0.47 | 0.14 | 0.89 | ||||
| Standard Error of Difference | 2.5 | 0.15 | 0.39 | 3.92 | |||||
| Lower limit | −4.86 | −0.78 | −0.66 | −7.03 | |||||
| Upper limit | 5.28 | −0.15 | 0.94 | 8.8 | |||||
| t | 0.09 | −3.1 | 0.36 | 0.23 | |||||
| df | 27.42 | 21 | 41 | 41 | |||||
| p | 0.932 | 0.010 | 0.722 | 0.822 | |||||
| SD Ratio | p-Value | F | |||
|---|---|---|---|---|---|
| F-test | Colostrum | Energy | 1.9 | 0.010 | 3.68 |
| Transitional BM | CH | 1.4 | <0.001 | 0.054 | |
| Mature BM | Fat | 0.7 | <0.001 | 0.028 | |
| Energy | 0.7 | 0.870 | 0.930 | ||
| Levene’s test | Colostrum | Fat | 1.2 | 0.404 | 0.71 |
| CH | 1.8 | 0.058 | 3.84 | ||
| Crude Protein | 1.8 | 0.003 | 10.34 | ||
| True Protein | 1.8 | 0.001 | 12.56 | ||
| NPN | 1.9 | 0.008 | 7.87 | ||
| TS | 3.3 | <0.001 | 51.25 | ||
| Transitional BM | Fat | 3.3 | 0.012 | 7.59 | |
| Crude Protein | 1.4 | 0.419 | 0.68 | ||
| True Protein | 1.0 | 0.887 | 0.02 | ||
| NPN | 1.3 | 0.298 | 1.14 | ||
| TS | 2.5 | 0.032 | 5.25 | ||
| Energy | 2.9 | 0.025 | 5.79 | ||
| Mature BM | CH | 2.1 | 0.072 | 3.4 | |
| Crude Protein | 0.9 | 0.440 | 0.61 | ||
| True Protein | 0.8 | 0.108 | 2.69 | ||
| NPN | 1.5 | 0.033 | 4.88 | ||
| TS | 0.8 | 0.059 | 3.76 | ||
| Overall p-Value | Descriptive Statistics | Inferential Statistics | ||||||||||||
|---|---|---|---|---|---|---|---|---|---|---|---|---|---|---|
| Colostrum | Transitional | Mature | Colostrum–Transitional | Colostrum–Mature | Transitional–Mature | |||||||||
| n | Mean | n | Mean | n | Mean | p- Value | Std. Test Statistic | p- Value | Std. Test Statistic | p- Value | Std. Test Statistic | |||
| Male | Fat | <0.001 | 19 | 1.82 | 12 | 2.69 | 22 | 3.61 | 0.532 | −1.35 | <0.001 | −4.5 | 0.031 | −2.56 |
| CH | <0.001 | 19 | 7.28 | 12 | 8.37 | 22 | 8.47 | 0.052 | −2.38 | <0.001 | −3.94 | 0.917 | −1.02 | |
| Crude Protein | <0.001 | 19 | 2.96 | 12 | 1.99 | 22 | 1.22 | 0.288 | 1.66 | <0.001 | 6.1 | 0.001 | 3.64 | |
| True Protein | <0.001 | 19 | 2.40 | 12 | 1.66 | 22 | 0.98 | 0.411 | 1.49 | <0.001 | 6.04 | <0.001 | 3.77 | |
| NPN | <0.001 | 19 | 0.56 | 12 | 0.33 | 22 | 0.24 | 0.060 | 2.33 | <0.001 | 4.79 | 0.206 | 1.82 | |
| TS | 0.445 | 19 | 12.37 | 12 | 13.29 | 22 | 13.51 | n.a. | n.a. | n.a. | n.a. | n.a. | n.a. | |
| Energy | 0.001 | 19 | 59.21 | 12 | 66.98 | 22 | 73.25 | 0.779 | −1.13 | 0.001 | −3.6 | 0.137 | −2.00 | |
| Female | Fat | <0.001 | 18 | 1.97 | 11 | 4.3 | 21 | 3.46 | <0.001 | −4.33 | 0.002 | −3.4 | 0.358 | 1.56 |
| CH | 0.081 | 18 | 8.14 | 11 | 8.84 | 21 | 8.74 | n.a. | n.a. | n.a. | n.a. | n.a. | n.a. | |
| Crude Protein | <0.001 | 18 | 1.97 | 11 | 1.91 | 21 | 1.24 | 1 | −0.29 | <0.001 | 5.1 | <0.001 | 1 | |
| True Protein | <0.001 | 18 | 1.59 | 11 | 1.54 | 21 | 1.00 | 1 | −0.15 | <0.001 | 4.97 | <0.001 | 1 | |
| NPN | <0.001 | 18 | 0.38 | 11 | 0.37 | 21 | 0.24 | 1 | −0.37 | <0.001 | 4.04 | <0.001 | 1 | |
| TS | <0.001 | 18 | 12.16 | 11 | 15.13 | 21 | 13.63 | <0.001 | −6.35 * | 0.001 | −3.78 * | 0.005 | 3.33 * | |
| Energy | <0.001 | 18 | 59.00 | 11 | 83.18 | 21 | 72.36 | <0.001 | −6.01 * | 0.001 | −4 * | 0.023 | 2.79 * | |
| Male | Female | ||||
|---|---|---|---|---|---|
| r | p-Value | r | p-Value | ||
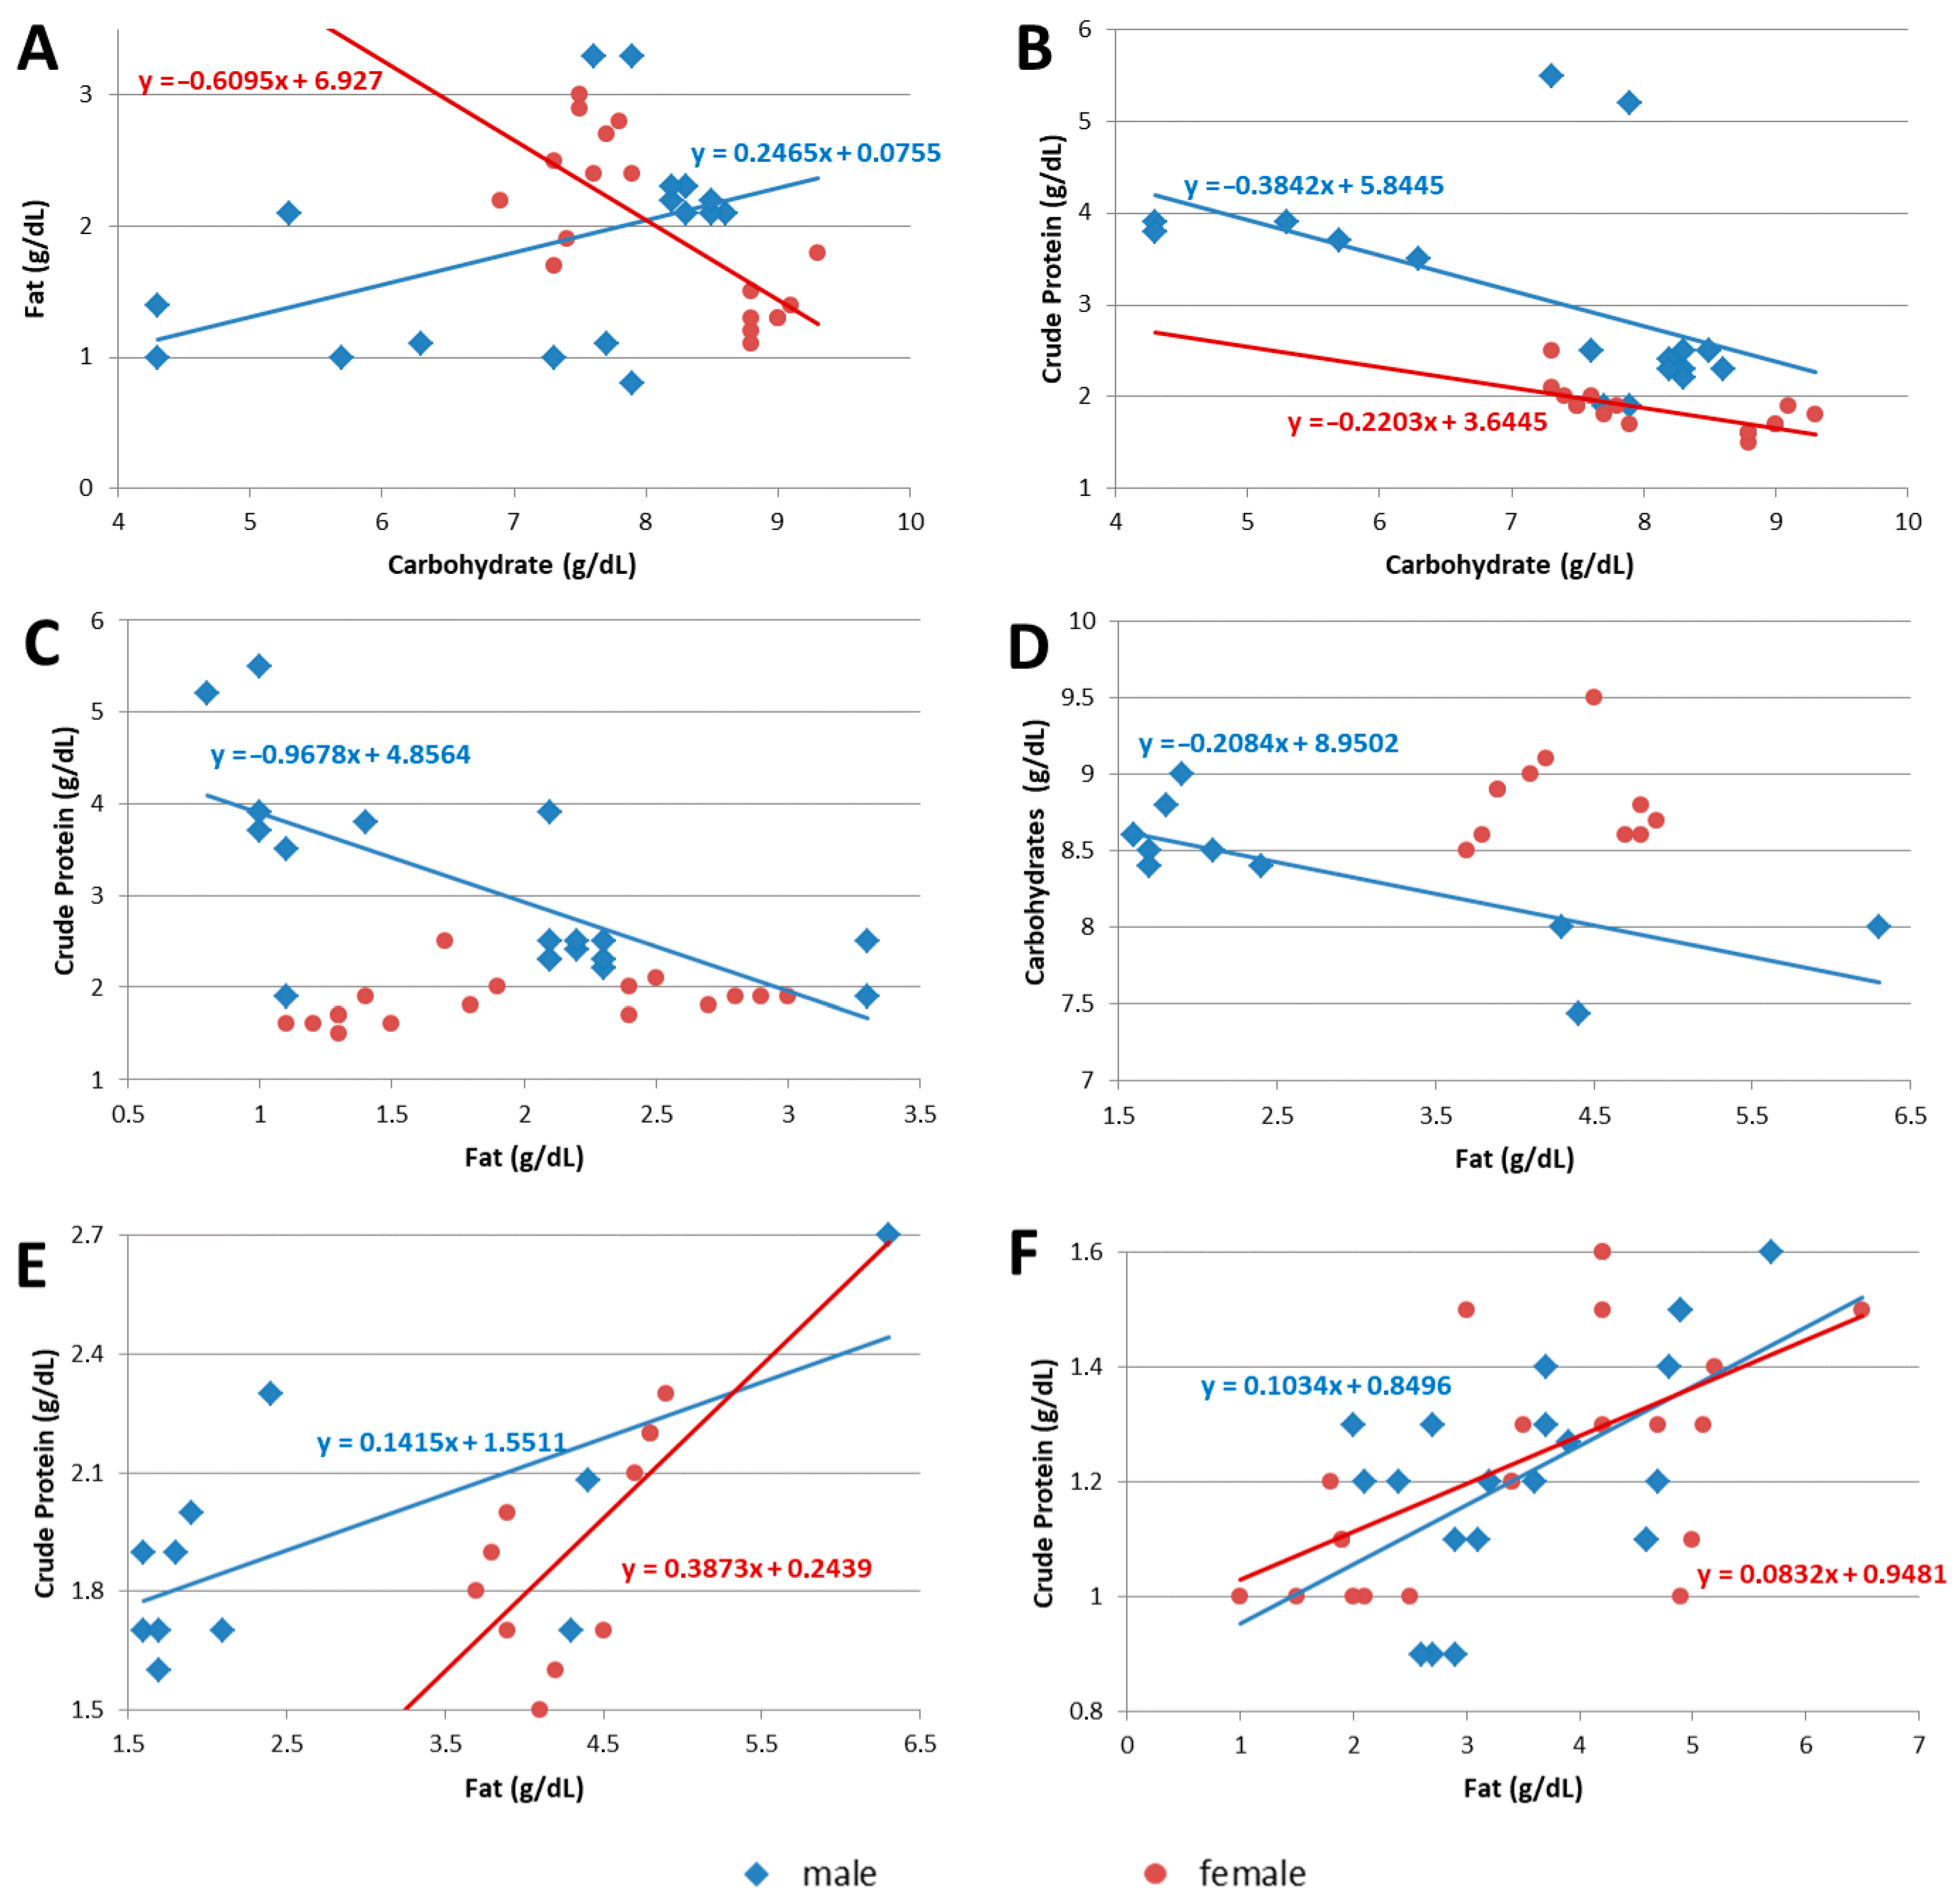
| Colostrum | CH and CPr | −0.51 | 0.029 | −0.68 | 0.002 |
| FAT and CH | 0.47 | 0.050 | −0.73 | 0.001 | |
| FAT and CPr | −0.68 | 0.002 | 0.23 | 0.368 | |
| Transitional breast milk | CH and CPr | −0.33 | 0.297 | −0.55 | 0.078 |
| FAT and CH | −0.76 | 0.007 | 0.02 | 0.947 | |
| FAT and CPr | 0.68 | 0.022 | 0.65 | 0.031 | |
| Mature breast milk | CH and CPr | 0.24 | 0.289 | 0.06 | 0.788 |
| FAT and CH | −0.15 | 0.514 | 0.22 | 0.327 | |
| FAT and CPr | 0.57 | 0.007 | 0.59 | 0.004 | |
Disclaimer/Publisher’s Note: The statements, opinions and data contained in all publications are solely those of the individual author(s) and contributor(s) and not of MDPI and/or the editor(s). MDPI and/or the editor(s) disclaim responsibility for any injury to people or property resulting from any ideas, methods, instructions or products referred to in the content. |
© 2025 by the authors. Licensee MDPI, Basel, Switzerland. This article is an open access article distributed under the terms and conditions of the Creative Commons Attribution (CC BY) license (https://creativecommons.org/licenses/by/4.0/).
Share and Cite
Lithoxopoulou, M.; Karastogiannidou, C.; Karagkiozi, A.; Zafeiriadou, I.E.; Pilati, E.; Diamanti, E.; Kalogiannis, S.; Vassilopoulou, E. From Mother–Fetus Dyad to Mother–Milk–Infant Triad: Sex Differences in Macronutrient Composition of Breast Milk. Nutrients 2025, 17, 1422. https://doi.org/10.3390/nu17091422
Lithoxopoulou M, Karastogiannidou C, Karagkiozi A, Zafeiriadou IE, Pilati E, Diamanti E, Kalogiannis S, Vassilopoulou E. From Mother–Fetus Dyad to Mother–Milk–Infant Triad: Sex Differences in Macronutrient Composition of Breast Milk. Nutrients. 2025; 17(9):1422. https://doi.org/10.3390/nu17091422
Chicago/Turabian StyleLithoxopoulou, Maria, Calliope Karastogiannidou, Anastasia Karagkiozi, Iliani Eleni Zafeiriadou, Ekaterini Pilati, Elisavet Diamanti, Stavros Kalogiannis, and Emilia Vassilopoulou. 2025. "From Mother–Fetus Dyad to Mother–Milk–Infant Triad: Sex Differences in Macronutrient Composition of Breast Milk" Nutrients 17, no. 9: 1422. https://doi.org/10.3390/nu17091422
APA StyleLithoxopoulou, M., Karastogiannidou, C., Karagkiozi, A., Zafeiriadou, I. E., Pilati, E., Diamanti, E., Kalogiannis, S., & Vassilopoulou, E. (2025). From Mother–Fetus Dyad to Mother–Milk–Infant Triad: Sex Differences in Macronutrient Composition of Breast Milk. Nutrients, 17(9), 1422. https://doi.org/10.3390/nu17091422